Swedish vs Guatemalan Disability
COMPARE
Swedish
Guatemalan
Disability
Disability Comparison
Swedes
Guatemalans
12.2%
DISABILITY
1.8/ 100
METRIC RATING
239th/ 347
METRIC RANK
11.6%
DISABILITY
65.1/ 100
METRIC RATING
159th/ 347
METRIC RANK
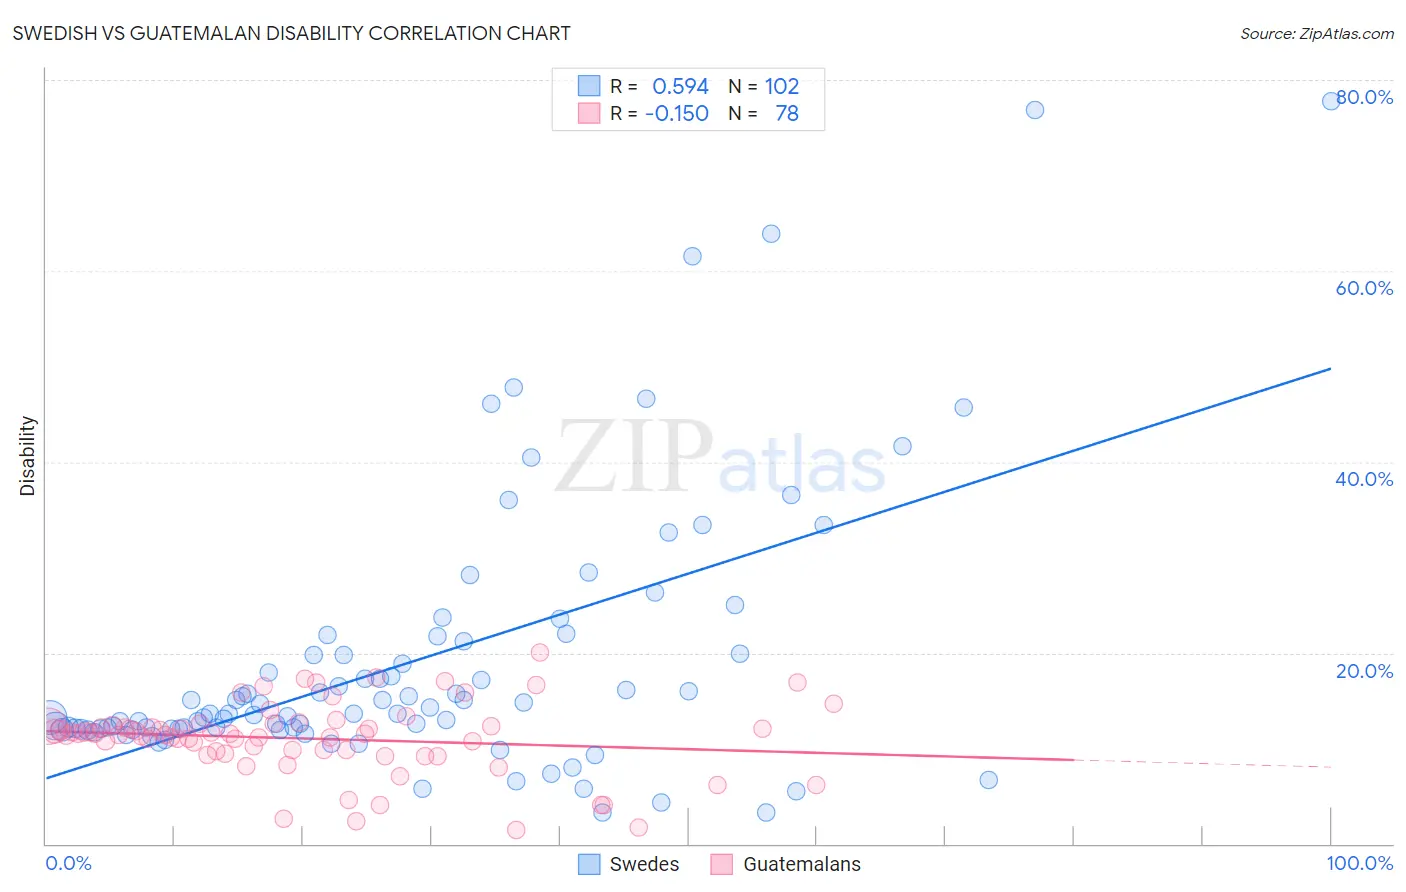
Swedish vs Guatemalan Disability Correlation Chart
The statistical analysis conducted on geographies consisting of 539,139,641 people shows a substantial positive correlation between the proportion of Swedes and percentage of population with a disability in the United States with a correlation coefficient (R) of 0.594 and weighted average of 12.2%. Similarly, the statistical analysis conducted on geographies consisting of 409,499,513 people shows a poor negative correlation between the proportion of Guatemalans and percentage of population with a disability in the United States with a correlation coefficient (R) of -0.150 and weighted average of 11.6%, a difference of 5.2%.
Disability Correlation Summary
| Measurement | Swedish | Guatemalan |
| Minimum | 3.3% | 1.4% |
| Maximum | 77.8% | 20.0% |
| Range | 74.5% | 18.6% |
| Mean | 19.0% | 11.0% |
| Median | 13.6% | 11.5% |
| Interquartile 25% (IQ1) | 12.0% | 9.6% |
| Interquartile 75% (IQ3) | 19.9% | 12.4% |
| Interquartile Range (IQR) | 8.0% | 2.7% |
| Standard Deviation (Sample) | 14.2% | 3.7% |
| Standard Deviation (Population) | 14.1% | 3.7% |
Similar Demographics by Disability
Demographics Similar to Swedes by Disability
In terms of disability, the demographic groups most similar to Swedes are Norwegian (12.2%, a difference of 0.040%), Hungarian (12.2%, a difference of 0.050%), Yugoslavian (12.2%, a difference of 0.050%), Immigrants from Congo (12.2%, a difference of 0.080%), and Polish (12.2%, a difference of 0.080%).
| Demographics | Rating | Rank | Disability |
| Italians | 2.5 /100 | #232 | Tragic 12.2% |
| Bahamians | 2.3 /100 | #233 | Tragic 12.2% |
| Japanese | 2.3 /100 | #234 | Tragic 12.2% |
| Yup'ik | 2.2 /100 | #235 | Tragic 12.2% |
| Chinese | 2.0 /100 | #236 | Tragic 12.2% |
| Immigrants | Congo | 1.9 /100 | #237 | Tragic 12.2% |
| Norwegians | 1.9 /100 | #238 | Tragic 12.2% |
| Swedes | 1.8 /100 | #239 | Tragic 12.2% |
| Hungarians | 1.7 /100 | #240 | Tragic 12.2% |
| Yugoslavians | 1.7 /100 | #241 | Tragic 12.2% |
| Poles | 1.7 /100 | #242 | Tragic 12.2% |
| British | 1.5 /100 | #243 | Tragic 12.2% |
| Basques | 1.5 /100 | #244 | Tragic 12.2% |
| Liberians | 1.5 /100 | #245 | Tragic 12.2% |
| Swiss | 1.5 /100 | #246 | Tragic 12.2% |
Demographics Similar to Guatemalans by Disability
In terms of disability, the demographic groups most similar to Guatemalans are Armenian (11.6%, a difference of 0.040%), Immigrants from Barbados (11.6%, a difference of 0.040%), Immigrants from Cuba (11.6%, a difference of 0.11%), Immigrants from Middle Africa (11.6%, a difference of 0.22%), and Immigrants from Fiji (11.6%, a difference of 0.23%).
| Demographics | Rating | Rank | Disability |
| Immigrants | Moldova | 72.0 /100 | #152 | Good 11.6% |
| Immigrants | Ghana | 71.2 /100 | #153 | Good 11.6% |
| Immigrants | Guatemala | 71.1 /100 | #154 | Good 11.6% |
| Immigrants | Netherlands | 69.8 /100 | #155 | Good 11.6% |
| Immigrants | Fiji | 69.5 /100 | #156 | Good 11.6% |
| Immigrants | Middle Africa | 69.5 /100 | #157 | Good 11.6% |
| Armenians | 65.9 /100 | #158 | Good 11.6% |
| Guatemalans | 65.1 /100 | #159 | Good 11.6% |
| Immigrants | Barbados | 64.2 /100 | #160 | Good 11.6% |
| Immigrants | Cuba | 62.8 /100 | #161 | Good 11.6% |
| Immigrants | Haiti | 59.2 /100 | #162 | Average 11.7% |
| Immigrants | Trinidad and Tobago | 58.9 /100 | #163 | Average 11.7% |
| Syrians | 58.5 /100 | #164 | Average 11.7% |
| Cubans | 56.7 /100 | #165 | Average 11.7% |
| Pakistanis | 54.7 /100 | #166 | Average 11.7% |