Immigrants from Central America vs Immigrants from South America Disability Age Under 5

COMPARE

Immigrants from Central America
Race
Ancestry
AfghanAfricanAlaska NativeAlaskan AthabascanAlbanianAleutAlsatianAmericanApacheArabArapahoArgentineanArmenianAssyrian/Chaldean/SyriacAustralianAustrianBahamianBangladeshiBarbadianBasqueBelgianBelizeanBermudanBhutaneseBlackfeetBolivianBrazilianBritishBritish West IndianBulgarianBurmeseCajunCambodianCanadianCape VerdeanCarpatho RusynCelticCentral AmericanCentral American IndianCherokeeCheyenneChickasawChileanChineseChippewaChoctawColombianColvilleComancheCosta RicanCreeCreekCroatianCrowCubanCypriotCzechCzechoslovakianDanishDelawareDominicanDutchDutch West IndianEastern EuropeanEcuadorianEgyptianEnglishEstonianEthiopianEuropeanFijianFilipinoFinnishFrenchFrench American IndianFrench CanadianGermanGerman RussianGhanaianGreekGuamanian/ChamorroGuatemalanGuyaneseHaitianHmongHonduranHopiHoumaHungarianIcelanderIndian (Asian)IndonesianInupiatIranianIraqiIrishIroquoisIsraeliItalianJamaicanJapaneseJordanianKenyanKiowaKoreanLaotianLatvianLebaneseLiberianLithuanianLumbeeLuxembourgerMacedonianMalaysianMalteseMarshalleseMenomineeMexicanMexican American IndianMongolianMoroccanNative HawaiianNavajoNepaleseNew ZealanderNicaraguanNigerianNorthern EuropeanNorwegianOkinawanOsageOttawaPaiutePakistaniPalestinianPanamanianParaguayanPennsylvania GermanPeruvianPimaPolishPortuguesePotawatomiPuebloPuerto RicanPuget Sound SalishRomanianRussianSalvadoranSamoanScandinavianScotch-IrishScottishSeminoleSenegaleseSerbianShoshoneSierra LeoneanSiouxSlavicSlovakSloveneSomaliSouth AfricanSouth AmericanSouth American IndianSoviet UnionSpaniardSpanishSpanish AmericanSpanish American IndianSri LankanSubsaharan AfricanSudaneseSwedishSwissSyrianTaiwaneseThaiTlingit-HaidaTohono O'OdhamTonganTrinidadian and TobagonianTsimshianTurkishU.S. Virgin IslanderUgandanUkrainianUruguayanUteVenezuelanVietnameseWelshWest IndianYakamaYaquiYugoslavianYumanYup'ikZimbabwean
Immigration
NonimmigrantsImmigrantsAfghanistanAfricaAlbaniaArgentinaArmeniaAsiaAustraliaAustriaBahamasBangladeshBarbadosBelarusBelgiumBelizeBoliviaBosnia and HerzegovinaBrazilBulgariaBurma/MyanmarCabo VerdeCambodiaCameroonCanadaCaribbeanCentral AmericaChileChinaColombiaCongoCosta RicaCroatiaCubaCzechoslovakiaDenmarkDominicaDominican RepublicEastern AfricaEastern AsiaEastern EuropeEcuadorEgyptEl SalvadorEnglandEritreaEthiopiaEuropeFijiFranceGermanyGhanaGreeceGrenadaGuatemalaGuyanaHaitiHondurasHong KongHungaryIndiaIndonesiaIranIraqIrelandIsraelItalyJamaicaJapanJordanKazakhstanKenyaKoreaKuwaitLaosLatin AmericaLatviaLebanonLiberiaLithuaniaMalaysiaMexicoMicronesiaMiddle AfricaMoldovaMoroccoNepalNetherlandsNicaraguaNigeriaNorth AmericaNorth MacedoniaNorthern AfricaNorthern EuropeNorwayOceaniaPakistanPanamaPeruPhilippinesPolandPortugalRomaniaRussiaSaudi ArabiaScotlandSenegalSerbiaSierra LeoneSingaporeSomaliaSouth AfricaSouth Central AsiaSouth Eastern AsiaSouthern EuropeSpainSri LankaSt. Vincent and the GrenadinesSudanSwedenSwitzerlandSyriaTaiwanThailandTrinidad and TobagoTurkeyUgandaUkraineUruguayUzbekistanVenezuelaVietnamWest IndiesWestern AfricaWestern AsiaWestern EuropeYemenZaireZimbabweAzores
Immigrants from South America
Race
Ancestry
AfghanAfricanAlaska NativeAlaskan AthabascanAlbanianAleutAlsatianAmericanApacheArabArapahoArgentineanArmenianAssyrian/Chaldean/SyriacAustralianAustrianBahamianBangladeshiBarbadianBasqueBelgianBelizeanBermudanBhutaneseBlackfeetBolivianBrazilianBritishBritish West IndianBulgarianBurmeseCajunCambodianCanadianCape VerdeanCarpatho RusynCelticCentral AmericanCentral American IndianCherokeeCheyenneChickasawChileanChineseChippewaChoctawColombianColvilleComancheCosta RicanCreeCreekCroatianCrowCubanCypriotCzechCzechoslovakianDanishDelawareDominicanDutchDutch West IndianEastern EuropeanEcuadorianEgyptianEnglishEstonianEthiopianEuropeanFijianFilipinoFinnishFrenchFrench American IndianFrench CanadianGermanGerman RussianGhanaianGreekGuamanian/ChamorroGuatemalanGuyaneseHaitianHmongHonduranHopiHoumaHungarianIcelanderIndian (Asian)IndonesianInupiatIranianIraqiIrishIroquoisIsraeliItalianJamaicanJapaneseJordanianKenyanKiowaKoreanLaotianLatvianLebaneseLiberianLithuanianLumbeeLuxembourgerMacedonianMalaysianMalteseMarshalleseMenomineeMexicanMexican American IndianMongolianMoroccanNative HawaiianNavajoNepaleseNew ZealanderNicaraguanNigerianNorthern EuropeanNorwegianOkinawanOsageOttawaPaiutePakistaniPalestinianPanamanianParaguayanPennsylvania GermanPeruvianPimaPolishPortuguesePotawatomiPuebloPuerto RicanPuget Sound SalishRomanianRussianSalvadoranSamoanScandinavianScotch-IrishScottishSeminoleSenegaleseSerbianShoshoneSierra LeoneanSiouxSlavicSlovakSloveneSomaliSouth AfricanSouth AmericanSouth American IndianSoviet UnionSpaniardSpanishSpanish AmericanSpanish American IndianSri LankanSubsaharan AfricanSudaneseSwedishSwissSyrianTaiwaneseThaiTlingit-HaidaTohono O'OdhamTonganTrinidadian and TobagonianTsimshianTurkishU.S. Virgin IslanderUgandanUkrainianUruguayanUteVenezuelanVietnameseWelshWest IndianYakamaYaquiYugoslavianYumanYup'ikZimbabwean
Immigration
NonimmigrantsImmigrantsAfghanistanAfricaAlbaniaArgentinaArmeniaAsiaAustraliaAustriaBahamasBangladeshBarbadosBelarusBelgiumBelizeBoliviaBosnia and HerzegovinaBrazilBulgariaBurma/MyanmarCabo VerdeCambodiaCameroonCanadaCaribbeanChileChinaColombiaCongoCosta RicaCroatiaCubaCzechoslovakiaDenmarkDominicaDominican RepublicEastern AfricaEastern AsiaEastern EuropeEcuadorEgyptEl SalvadorEnglandEritreaEthiopiaEuropeFijiFranceGermanyGhanaGreeceGrenadaGuatemalaGuyanaHaitiHondurasHong KongHungaryIndiaIndonesiaIranIraqIrelandIsraelItalyJamaicaJapanJordanKazakhstanKenyaKoreaKuwaitLaosLatin AmericaLatviaLebanonLiberiaLithuaniaMalaysiaMexicoMicronesiaMiddle AfricaMoldovaMoroccoNepalNetherlandsNicaraguaNigeriaNorth AmericaNorth MacedoniaNorthern AfricaNorthern EuropeNorwayOceaniaPakistanPanamaPeruPhilippinesPolandPortugalRomaniaRussiaSaudi ArabiaScotlandSenegalSerbiaSierra LeoneSingaporeSomaliaSouth AfricaSouth AmericaSouth Central AsiaSouth Eastern AsiaSouthern EuropeSpainSri LankaSt. Vincent and the GrenadinesSudanSwedenSwitzerlandSyriaTaiwanThailandTrinidad and TobagoTurkeyUgandaUkraineUruguayUzbekistanVenezuelaVietnamWest IndiesWestern AfricaWestern AsiaWestern EuropeYemenZaireZimbabweAzores
Disability Age Under 5
Income
Poverty
Unemployment
Labor Participation
Family Structure
Vehicle Availability
Education Level
Disability

Disability Age Under 5 Comparison

Immigrants from Central America

Immigrants from South America

Good
Good
1.2%
DISABILITY AGE UNDER 5
61.4/ 100
METRIC RATING
166th/ 347
METRIC RANK
1.2%
DISABILITY AGE UNDER 5
67.0/ 100
METRIC RATING
157th/ 347
METRIC RANK

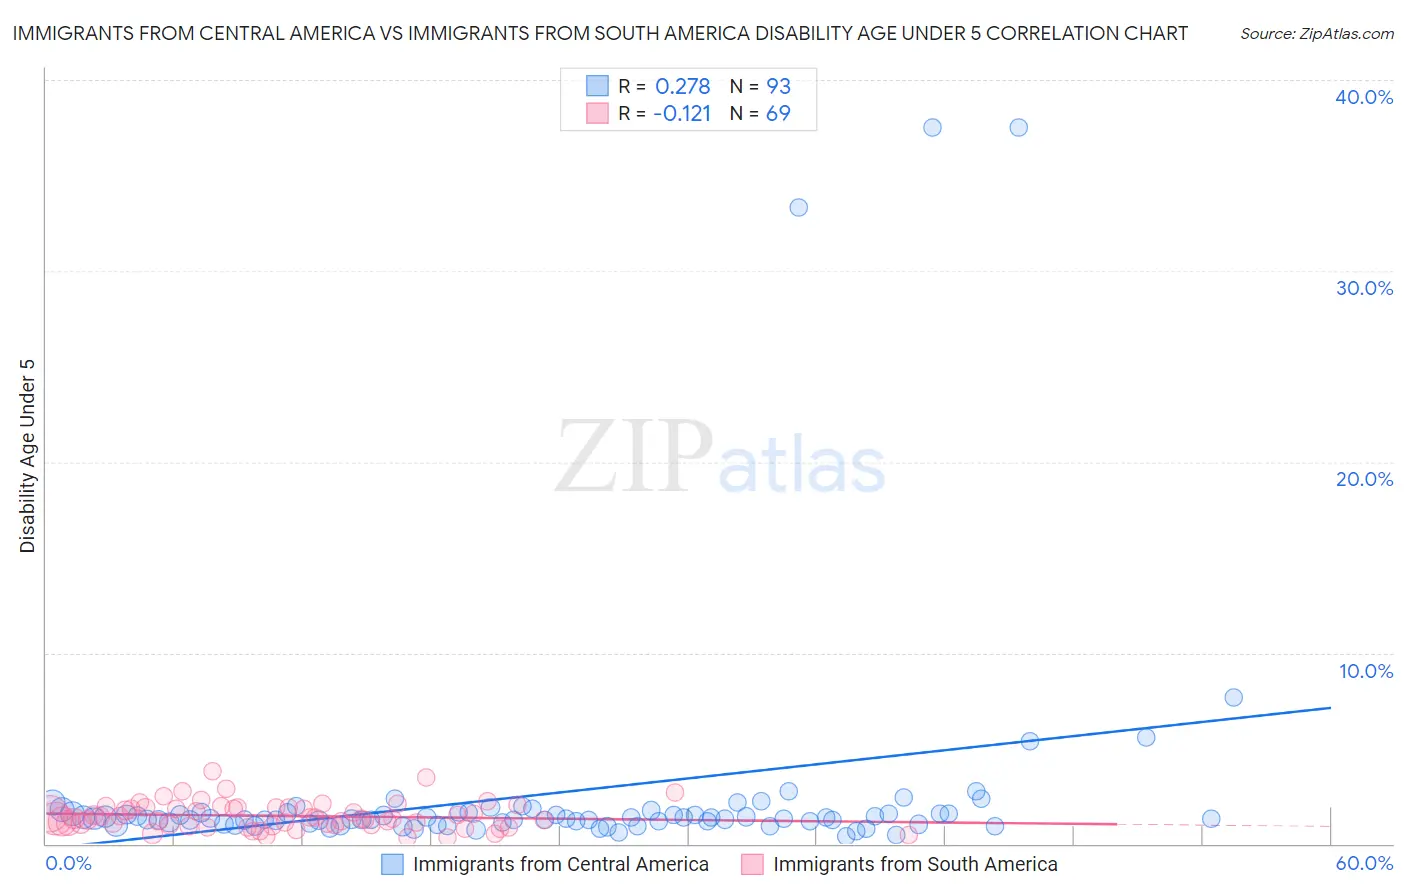
Immigrants from Central America vs Immigrants from South America Disability Age Under 5 Correlation Chart

The statistical analysis conducted on geographies consisting of 255,387,809 people shows a weak positive correlation between the proportion of Immigrants from Central America and percentage of population with a disability under the age of 5 in the United States with a correlation coefficient (R) of 0.278 and weighted average of 1.2%. Similarly, the statistical analysis conducted on geographies consisting of 244,519,101 people shows a poor negative correlation between the proportion of Immigrants from South America and percentage of population with a disability under the age of 5 in the United States with a correlation coefficient (R) of -0.121 and weighted average of 1.2%, a difference of 0.56%.
Immigrants from Central America vs Immigrants from South America Disability Age Under 5

Disability Age Under 5 Correlation Summary

MeasurementImmigrants from Central AmericaImmigrants from South America
Minimum0.41%0.32%
Maximum37.5%3.8%
Range37.1%3.5%
Mean2.6%1.5%
Median1.3%1.3%
Interquartile 25% (IQ1)1.1%0.99%
Interquartile 75% (IQ3)1.6%1.9%
Interquartile Range (IQR)0.53%0.89%
Standard Deviation (Sample)6.2%0.70%
Standard Deviation (Population)6.2%0.70%

Demographics Similar to Immigrants from Central America and Immigrants from South America by Disability Age Under 5

In terms of disability age under 5, the demographic groups most similar to Immigrants from Central America are Immigrants from Kuwait (1.2%, a difference of 0.11%), Immigrants from Argentina (1.2%, a difference of 0.11%), Laotian (1.2%, a difference of 0.13%), Immigrants from Guatemala (1.2%, a difference of 0.18%), and Guatemalan (1.2%, a difference of 0.21%). Similarly, the demographic groups most similar to Immigrants from South America are Arab (1.2%, a difference of 0.060%), Colombian (1.2%, a difference of 0.12%), Immigrants from Latin America (1.2%, a difference of 0.12%), Hawaiian (1.2%, a difference of 0.16%), and Immigrants from Ghana (1.2%, a difference of 0.18%).
DemographicsRating | RankDisability Age Under 5
Yaqui
74.8
/100
|
#151
Good
1.2%
Hondurans
72.5
/100
|
#152
Good
1.2%
Immigrants | Thailand
69.4
/100
|
#153
Good
1.2%
Uruguayans
68.8
/100
|
#154
Good
1.2%
Immigrants | Ghana
68.7
/100
|
#155
Good
1.2%
Hawaiians
68.5
/100
|
#156
Good
1.2%
Immigrants | South America
67.0
/100
|
#157
Good
1.2%
Arabs
66.4
/100
|
#158
Good
1.2%
Colombians
65.8
/100
|
#159
Good
1.2%
Immigrants | Latin America
65.8
/100
|
#160
Good
1.2%
Immigrants | Africa
65.1
/100
|
#161
Good
1.2%
Guatemalans
63.6
/100
|
#162
Good
1.2%
Immigrants | Guatemala
63.2
/100
|
#163
Good
1.2%
Laotians
62.8
/100
|
#164
Good
1.2%
Immigrants | Kuwait
62.6
/100
|
#165
Good
1.2%
Immigrants | Central America
61.4
/100
|
#166
Good
1.2%
Immigrants | Argentina
60.2
/100
|
#167
Good
1.2%
Sierra Leoneans
59.1
/100
|
#168
Average
1.2%
Immigrants | Uruguay
59.0
/100
|
#169
Average
1.2%
Immigrants | Jamaica
58.8
/100
|
#170
Average
1.2%
Guamanians/Chamorros
57.8
/100
|
#171
Average
1.2%