Zip Codes with the Highest Percentage of Population Employed in Health Diagnosing & Treating in New Haven, CT
RELATED REPORTS & OPTIONS
Health Diagnosing & Treating
New Haven
Compare Zip Codes
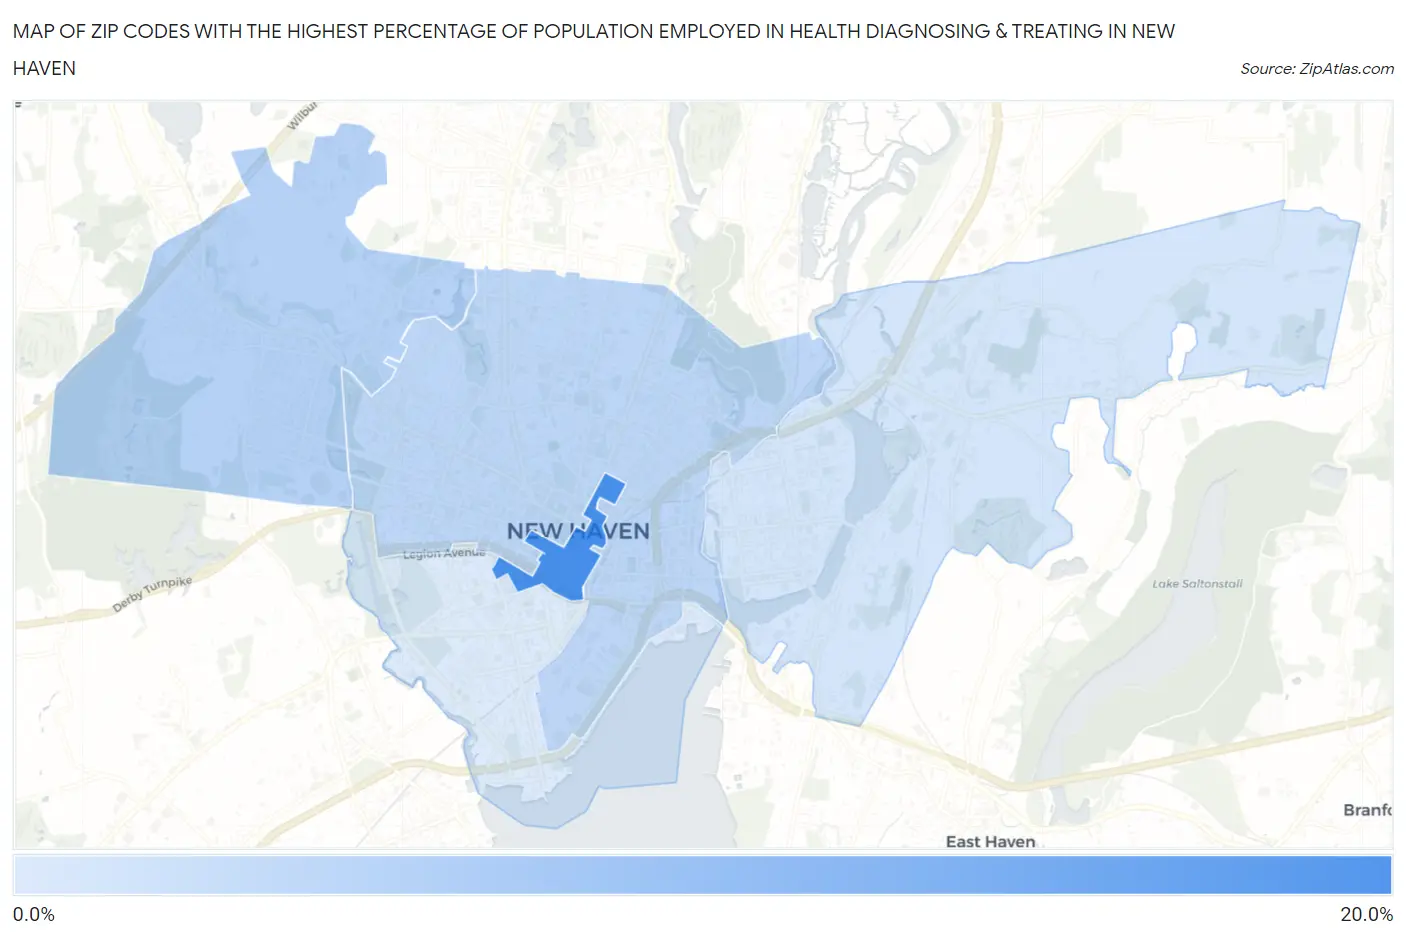
Map of Zip Codes with the Highest Percentage of Population Employed in Health Diagnosing & Treating in New Haven
0.0%
20.0%
Zip Codes with the Highest Percentage of Population Employed in Health Diagnosing & Treating in New Haven, CT
| Zip Code | % Employed | vs State | vs National | |
| 1. | 06510 | 19.7% | 6.7%(+13.0)#2 | 6.2%(+13.4)#574 |
| 2. | 06515 | 8.8% | 6.7%(+2.09)#56 | 6.2%(+2.52)#5,791 |
| 3. | 06511 | 8.2% | 6.7%(+1.50)#70 | 6.2%(+1.93)#7,074 |
| 4. | 06513 | 6.0% | 6.7%(-0.688)#155 | 6.2%(-0.255)#13,905 |
| 5. | 06519 | 5.2% | 6.7%(-1.49)#177 | 6.2%(-1.06)#16,978 |
1
Common Questions
What are the Top 3 Zip Codes with the Highest Percentage of Population Employed in Health Diagnosing & Treating in New Haven, CT?
Top 3 Zip Codes with the Highest Percentage of Population Employed in Health Diagnosing & Treating in New Haven, CT are:
What zip code has the Highest Percentage of Population Employed in Health Diagnosing & Treating in New Haven, CT?
06510 has the Highest Percentage of Population Employed in Health Diagnosing & Treating in New Haven, CT with 19.7%.
What is the Percentage of Population Employed in Health Diagnosing & Treating in New Haven, CT?
Percentage of Population Employed in Health Diagnosing & Treating in New Haven is 7.5%.
What is the Percentage of Population Employed in Health Diagnosing & Treating in Connecticut?
Percentage of Population Employed in Health Diagnosing & Treating in Connecticut is 6.7%.
What is the Percentage of Population Employed in Health Diagnosing & Treating in the United States?
Percentage of Population Employed in Health Diagnosing & Treating in the United States is 6.2%.