Zip Codes with the Highest Percentage of Population Employed in Food Preparation & Serving in New Haven, CT
RELATED REPORTS & OPTIONS
Food Preparation & Serving
New Haven
Compare Zip Codes
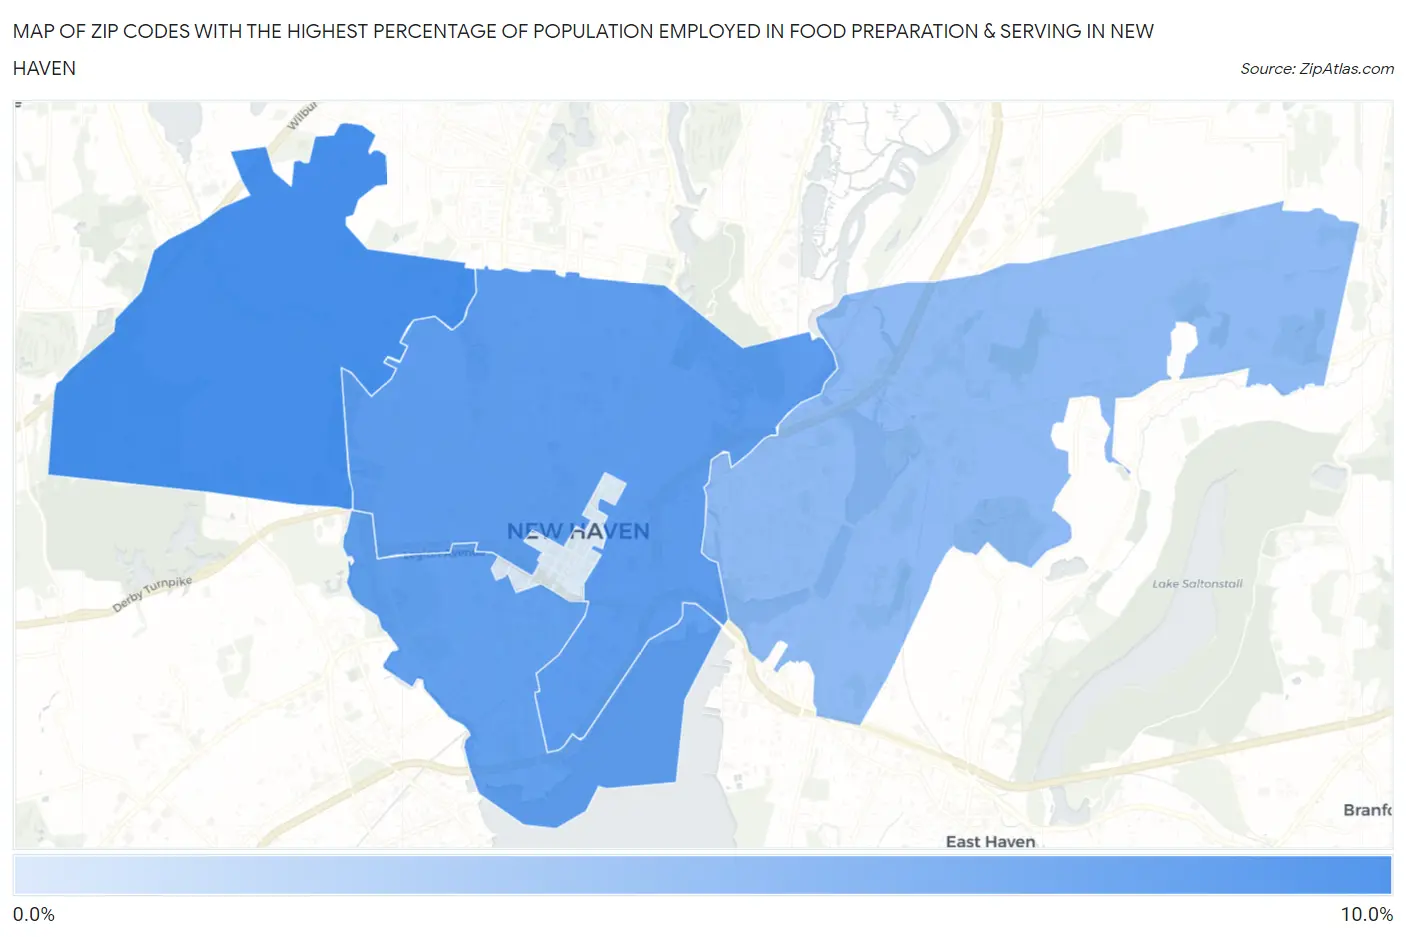
Map of Zip Codes with the Highest Percentage of Population Employed in Food Preparation & Serving in New Haven
0.0%
10.0%
Zip Codes with the Highest Percentage of Population Employed in Food Preparation & Serving in New Haven, CT
| Zip Code | % Employed | vs State | vs National | |
| 1. | 06515 | 9.0% | 4.7%(+4.29)#22 | 5.3%(+3.69)#3,552 |
| 2. | 06511 | 7.7% | 4.7%(+3.04)#31 | 5.3%(+2.44)#5,175 |
| 3. | 06519 | 7.5% | 4.7%(+2.81)#34 | 5.3%(+2.21)#5,566 |
| 4. | 06513 | 5.2% | 4.7%(+0.478)#87 | 5.3%(-0.124)#12,313 |
| 5. | 06510 | 1.2% | 4.7%(-3.45)#240 | 5.3%(-4.05)#26,523 |
1
Common Questions
What are the Top 3 Zip Codes with the Highest Percentage of Population Employed in Food Preparation & Serving in New Haven, CT?
Top 3 Zip Codes with the Highest Percentage of Population Employed in Food Preparation & Serving in New Haven, CT are:
What zip code has the Highest Percentage of Population Employed in Food Preparation & Serving in New Haven, CT?
06515 has the Highest Percentage of Population Employed in Food Preparation & Serving in New Haven, CT with 9.0%.
What is the Percentage of Population Employed in Food Preparation & Serving in New Haven, CT?
Percentage of Population Employed in Food Preparation & Serving in New Haven is 6.9%.
What is the Percentage of Population Employed in Food Preparation & Serving in Connecticut?
Percentage of Population Employed in Food Preparation & Serving in Connecticut is 4.7%.
What is the Percentage of Population Employed in Food Preparation & Serving in the United States?
Percentage of Population Employed in Food Preparation & Serving in the United States is 5.3%.