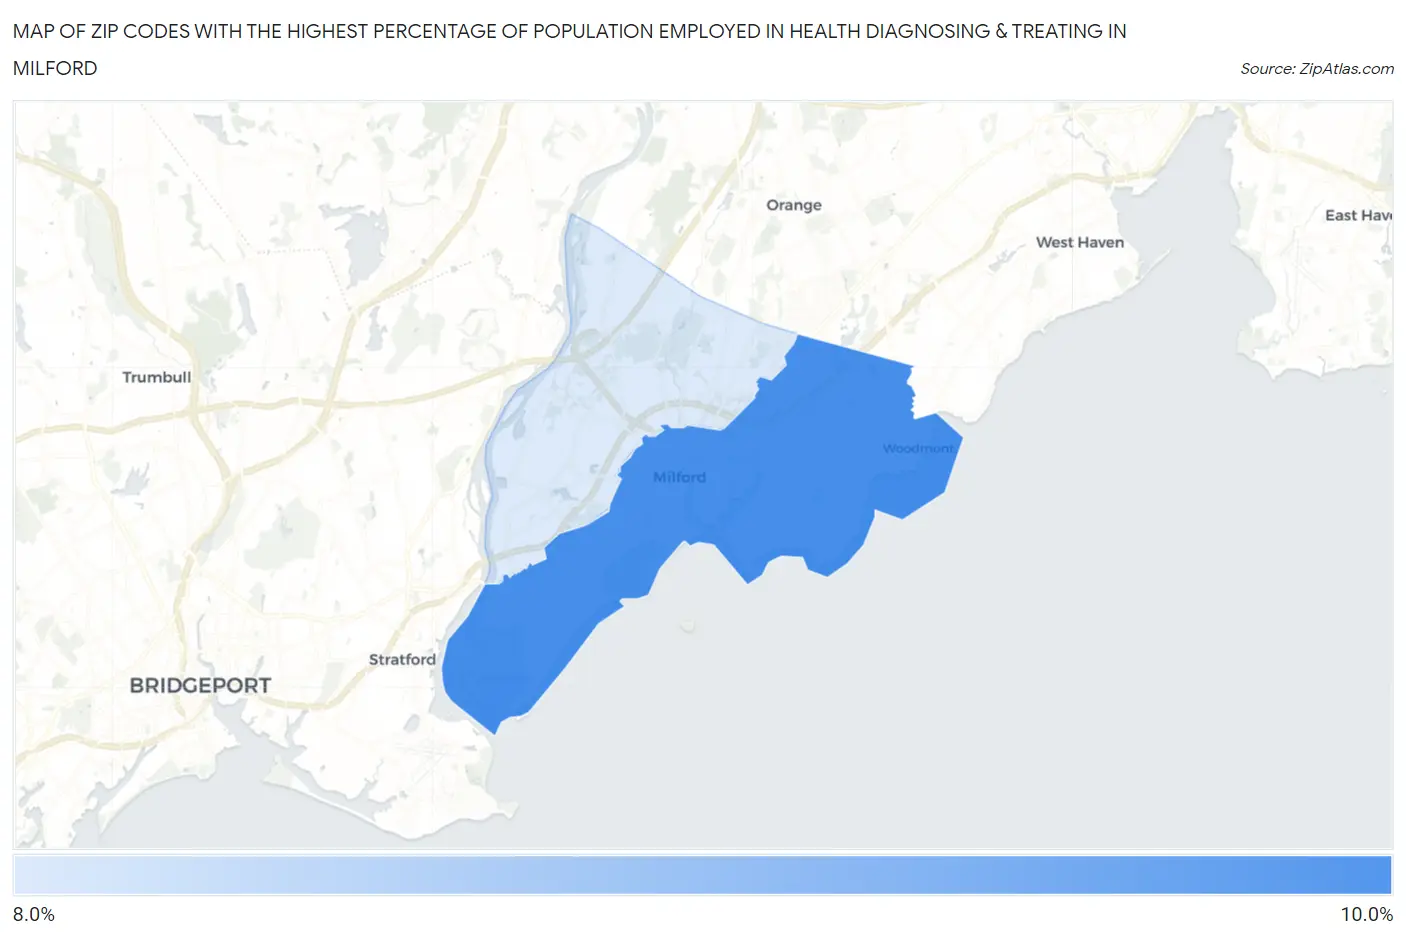
Zip Codes with the Highest Percentage of Population Employed in Health Diagnosing & Treating in Milford, CT
RELATED REPORTS & OPTIONS
Health Diagnosing & Treating
Milford
Compare Zip Codes
Map of Zip Codes with the Highest Percentage of Population Employed in Health Diagnosing & Treating in Milford
0.0%
10.0%
Zip Codes with the Highest Percentage of Population Employed in Health Diagnosing & Treating in Milford, CT
| Zip Code | % Employed | vs State | vs National | |
| 1. | 06460 | 9.6% | 6.7%(+2.91)#36 | 6.2%(+3.34)#4,409 |
| 2. | 06461 | 8.5% | 6.7%(+1.79)#64 | 6.2%(+2.22)#6,411 |
1
Common Questions
What are the Top Zip Codes with the Highest Percentage of Population Employed in Health Diagnosing & Treating in Milford, CT?
Top Zip Codes with the Highest Percentage of Population Employed in Health Diagnosing & Treating in Milford, CT are:
What zip code has the Highest Percentage of Population Employed in Health Diagnosing & Treating in Milford, CT?
06460 has the Highest Percentage of Population Employed in Health Diagnosing & Treating in Milford, CT with 9.6%.
What is the Percentage of Population Employed in Health Diagnosing & Treating in Connecticut?
Percentage of Population Employed in Health Diagnosing & Treating in Connecticut is 6.7%.
What is the Percentage of Population Employed in Health Diagnosing & Treating in the United States?
Percentage of Population Employed in Health Diagnosing & Treating in the United States is 6.2%.