Zip Codes with the Highest Percentage of Population Employed in Health Diagnosing & Treating in Danbury, CT
RELATED REPORTS & OPTIONS
Health Diagnosing & Treating
Danbury
Compare Zip Codes
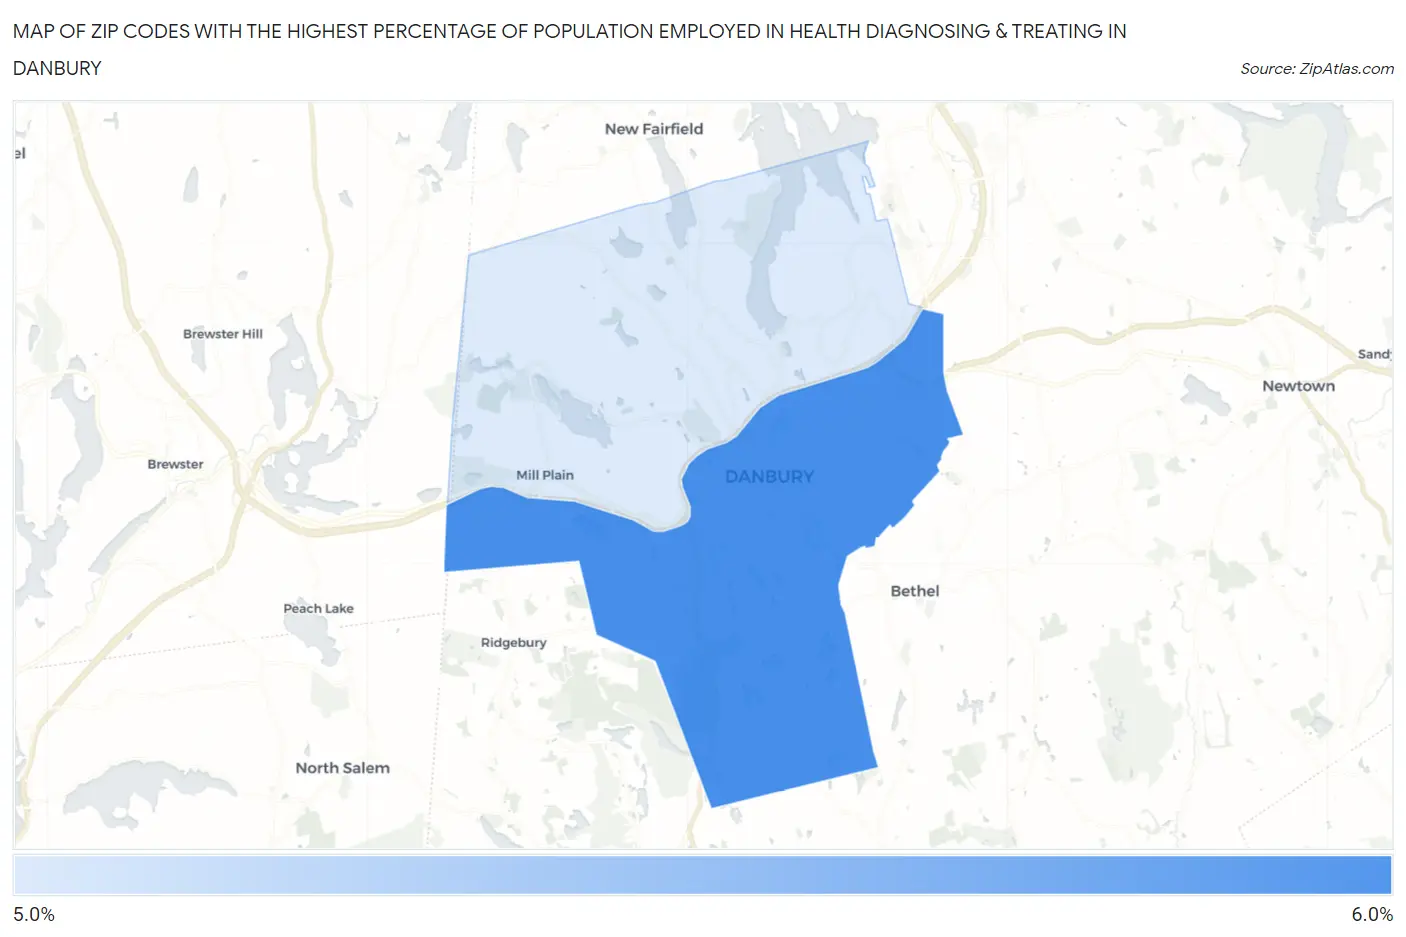
Map of Zip Codes with the Highest Percentage of Population Employed in Health Diagnosing & Treating in Danbury
0.0%
6.0%
Zip Codes with the Highest Percentage of Population Employed in Health Diagnosing & Treating in Danbury, CT
| Zip Code | % Employed | vs State | vs National | |
| 1. | 06810 | 5.7% | 6.7%(-1.02)#165 | 6.2%(-0.592)#15,168 |
| 2. | 06811 | 5.1% | 6.7%(-1.54)#180 | 6.2%(-1.10)#17,159 |
1
Common Questions
What are the Top Zip Codes with the Highest Percentage of Population Employed in Health Diagnosing & Treating in Danbury, CT?
Top Zip Codes with the Highest Percentage of Population Employed in Health Diagnosing & Treating in Danbury, CT are:
What zip code has the Highest Percentage of Population Employed in Health Diagnosing & Treating in Danbury, CT?
06810 has the Highest Percentage of Population Employed in Health Diagnosing & Treating in Danbury, CT with 5.7%.
What is the Percentage of Population Employed in Health Diagnosing & Treating in Danbury, CT?
Percentage of Population Employed in Health Diagnosing & Treating in Danbury is 5.5%.
What is the Percentage of Population Employed in Health Diagnosing & Treating in Connecticut?
Percentage of Population Employed in Health Diagnosing & Treating in Connecticut is 6.7%.
What is the Percentage of Population Employed in Health Diagnosing & Treating in the United States?
Percentage of Population Employed in Health Diagnosing & Treating in the United States is 6.2%.