Zip Codes with the Highest Percentage of Population Employed in Health Diagnosing & Treating in Bridgeport, CT
RELATED REPORTS & OPTIONS
Health Diagnosing & Treating
Bridgeport
Compare Zip Codes
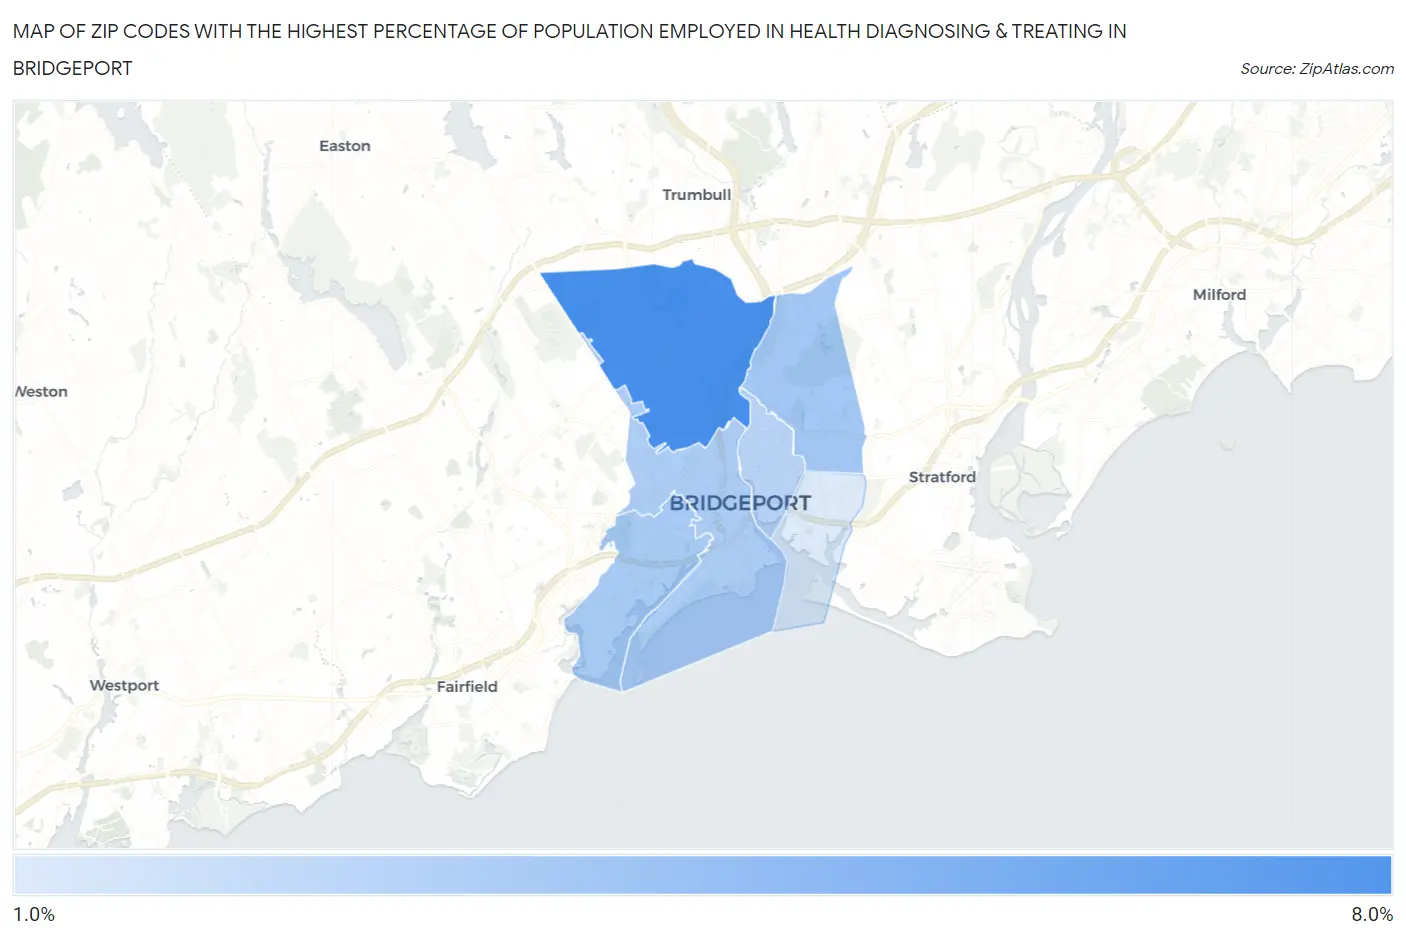
Map of Zip Codes with the Highest Percentage of Population Employed in Health Diagnosing & Treating in Bridgeport
0.0%
8.0%
Zip Codes with the Highest Percentage of Population Employed in Health Diagnosing & Treating in Bridgeport, CT
| Zip Code | % Employed | vs State | vs National | |
| 1. | 06606 | 7.7% | 6.7%(+1.01)#79 | 6.2%(+1.45)#8,250 |
| 2. | 06610 | 4.1% | 6.7%(-2.56)#221 | 6.2%(-2.13)#21,018 |
| 3. | 06605 | 4.0% | 6.7%(-2.68)#225 | 6.2%(-2.25)#21,394 |
| 4. | 06604 | 3.8% | 6.7%(-2.86)#229 | 6.2%(-2.43)#21,950 |
| 5. | 06608 | 3.3% | 6.7%(-3.35)#241 | 6.2%(-2.92)#23,392 |
| 6. | 06607 | 2.0% | 6.7%(-4.72)#261 | 6.2%(-4.28)#26,520 |
1
Common Questions
What are the Top 5 Zip Codes with the Highest Percentage of Population Employed in Health Diagnosing & Treating in Bridgeport, CT?
Top 5 Zip Codes with the Highest Percentage of Population Employed in Health Diagnosing & Treating in Bridgeport, CT are:
What zip code has the Highest Percentage of Population Employed in Health Diagnosing & Treating in Bridgeport, CT?
06606 has the Highest Percentage of Population Employed in Health Diagnosing & Treating in Bridgeport, CT with 7.7%.
What is the Percentage of Population Employed in Health Diagnosing & Treating in Bridgeport, CT?
Percentage of Population Employed in Health Diagnosing & Treating in Bridgeport is 5.2%.
What is the Percentage of Population Employed in Health Diagnosing & Treating in Connecticut?
Percentage of Population Employed in Health Diagnosing & Treating in Connecticut is 6.7%.
What is the Percentage of Population Employed in Health Diagnosing & Treating in the United States?
Percentage of Population Employed in Health Diagnosing & Treating in the United States is 6.2%.