Foxfield, CO
Foxfield Map
Foxfield Overview
673
TOTAL POPULATION
352
MALE POPULATION
321
FEMALE POPULATION
109.66
MALES / 100 FEMALES
91.19
FEMALES / 100 MALES
57.5
MEDIAN AGE
2.6
AVG FAMILY SIZE
2.4
AVG HOUSEHOLD SIZE
$83,677
PER CAPITA INCOME
$172,083
AVG FAMILY INCOME
$168,125
AVG HOUSEHOLD INCOME
35.3%
WAGE / INCOME GAP [ % ]
64.7¢/ $1
WAGE / INCOME GAP [ $ ]
0.40
INEQUALITY / GINI INDEX
345
LABOR FORCE [ PEOPLE ]
58.2%
PERCENT IN LABOR FORCE
3.2%
UNEMPLOYMENT RATE
Foxfield Area Codes
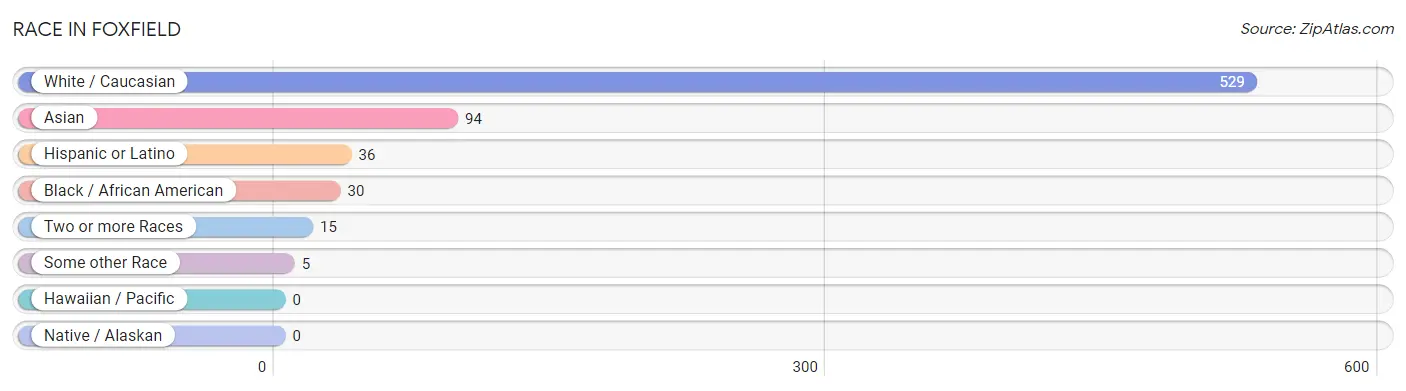
Race in Foxfield
The most populous races in Foxfield are White / Caucasian (529 | 78.6%), Asian (94 | 14.0%), and Hispanic or Latino (36 | 5.3%).
| Race | # Population | % Population |
| Asian | 94 | 14.0% |
| Black / African American | 30 | 4.5% |
| Hawaiian / Pacific | 0 | 0.0% |
| Hispanic or Latino | 36 | 5.3% |
| Native / Alaskan | 0 | 0.0% |
| White / Caucasian | 529 | 78.6% |
| Two or more Races | 15 | 2.2% |
| Some other Race | 5 | 0.7% |
| Total | 673 | 100.0% |
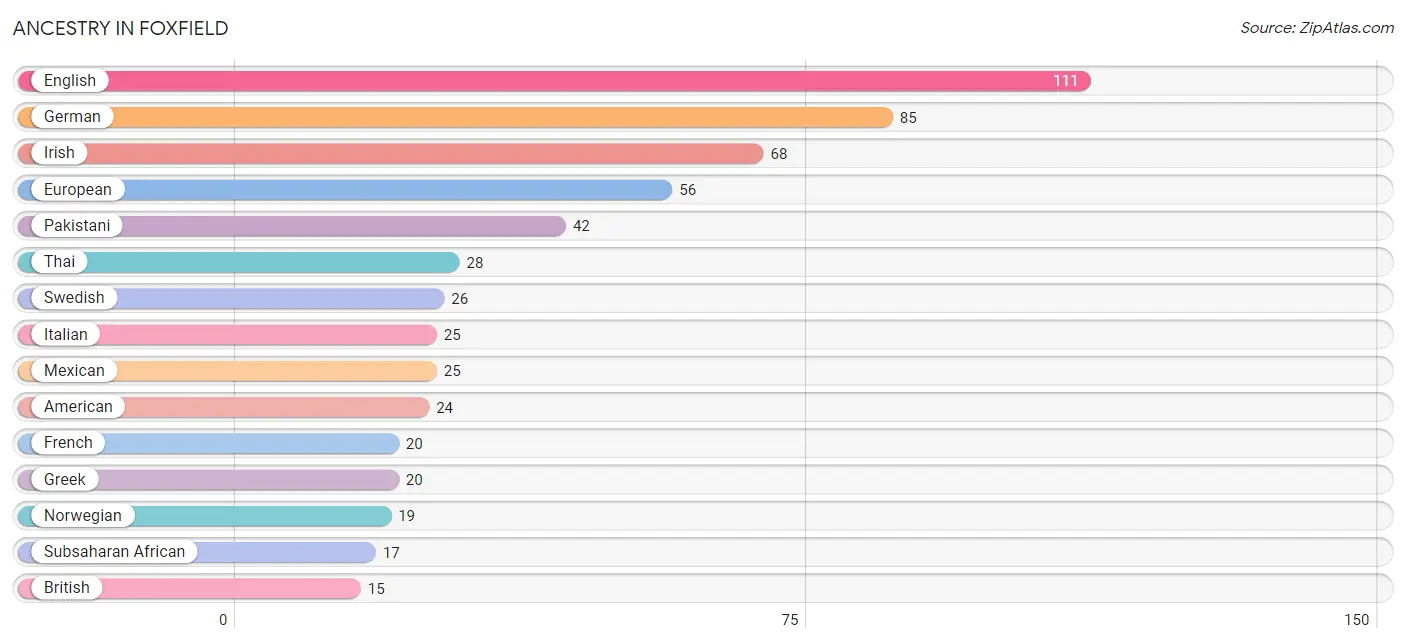
Ancestry in Foxfield
The most populous ancestries reported in Foxfield are English (111 | 16.5%), German (85 | 12.6%), Irish (68 | 10.1%), European (56 | 8.3%), and Pakistani (42 | 6.2%), together accounting for 53.8% of all Foxfield residents.
| Ancestry | # Population | % Population |
| African | 2 | 0.3% |
| American | 24 | 3.6% |
| Arab | 3 | 0.4% |
| Austrian | 3 | 0.4% |
| British | 15 | 2.2% |
| Burmese | 15 | 2.2% |
| Danish | 6 | 0.9% |
| Dutch | 11 | 1.6% |
| English | 111 | 16.5% |
| European | 56 | 8.3% |
| French | 20 | 3.0% |
| German | 85 | 12.6% |
| Greek | 20 | 3.0% |
| Iranian | 2 | 0.3% |
| Irish | 68 | 10.1% |
| Italian | 25 | 3.7% |
| Lithuanian | 5 | 0.7% |
| Mexican | 25 | 3.7% |
| Navajo | 7 | 1.0% |
| Northern European | 11 | 1.6% |
| Norwegian | 19 | 2.8% |
| Pakistani | 42 | 6.2% |
| Polish | 11 | 1.6% |
| Russian | 3 | 0.4% |
| Scotch-Irish | 9 | 1.3% |
| Scottish | 7 | 1.0% |
| South African | 15 | 2.2% |
| Spanish | 7 | 1.0% |
| Subsaharan African | 17 | 2.5% |
| Swedish | 26 | 3.9% |
| Swiss | 5 | 0.7% |
| Syrian | 3 | 0.4% |
| Thai | 28 | 4.2% |
| Ukrainian | 2 | 0.3% |
| Welsh | 2 | 0.3% | View All 35 Rows |
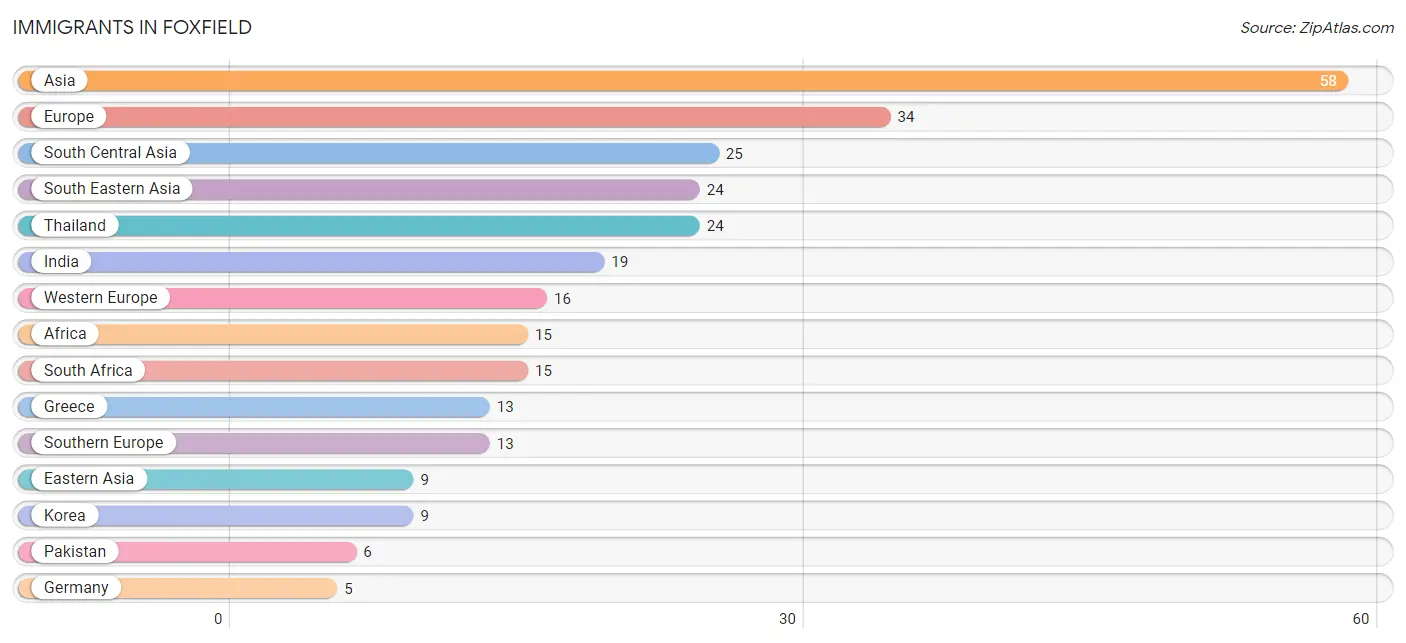
Immigrants in Foxfield
The most numerous immigrant groups reported in Foxfield came from Asia (58 | 8.6%), Europe (34 | 5.1%), South Central Asia (25 | 3.7%), South Eastern Asia (24 | 3.6%), and Thailand (24 | 3.6%), together accounting for 24.5% of all Foxfield residents.
| Immigration Origin | # Population | % Population |
| Africa | 15 | 2.2% |
| Asia | 58 | 8.6% |
| Austria | 3 | 0.4% |
| Eastern Asia | 9 | 1.3% |
| Europe | 34 | 5.1% |
| Germany | 5 | 0.7% |
| Greece | 13 | 1.9% |
| India | 19 | 2.8% |
| Korea | 9 | 1.3% |
| Netherlands | 3 | 0.4% |
| Northern Europe | 5 | 0.7% |
| Pakistan | 6 | 0.9% |
| Scotland | 2 | 0.3% |
| South Africa | 15 | 2.2% |
| South Central Asia | 25 | 3.7% |
| South Eastern Asia | 24 | 3.6% |
| Southern Europe | 13 | 1.9% |
| Switzerland | 5 | 0.7% |
| Thailand | 24 | 3.6% |
| Western Europe | 16 | 2.4% | View All 20 Rows |
Sex and Age in Foxfield
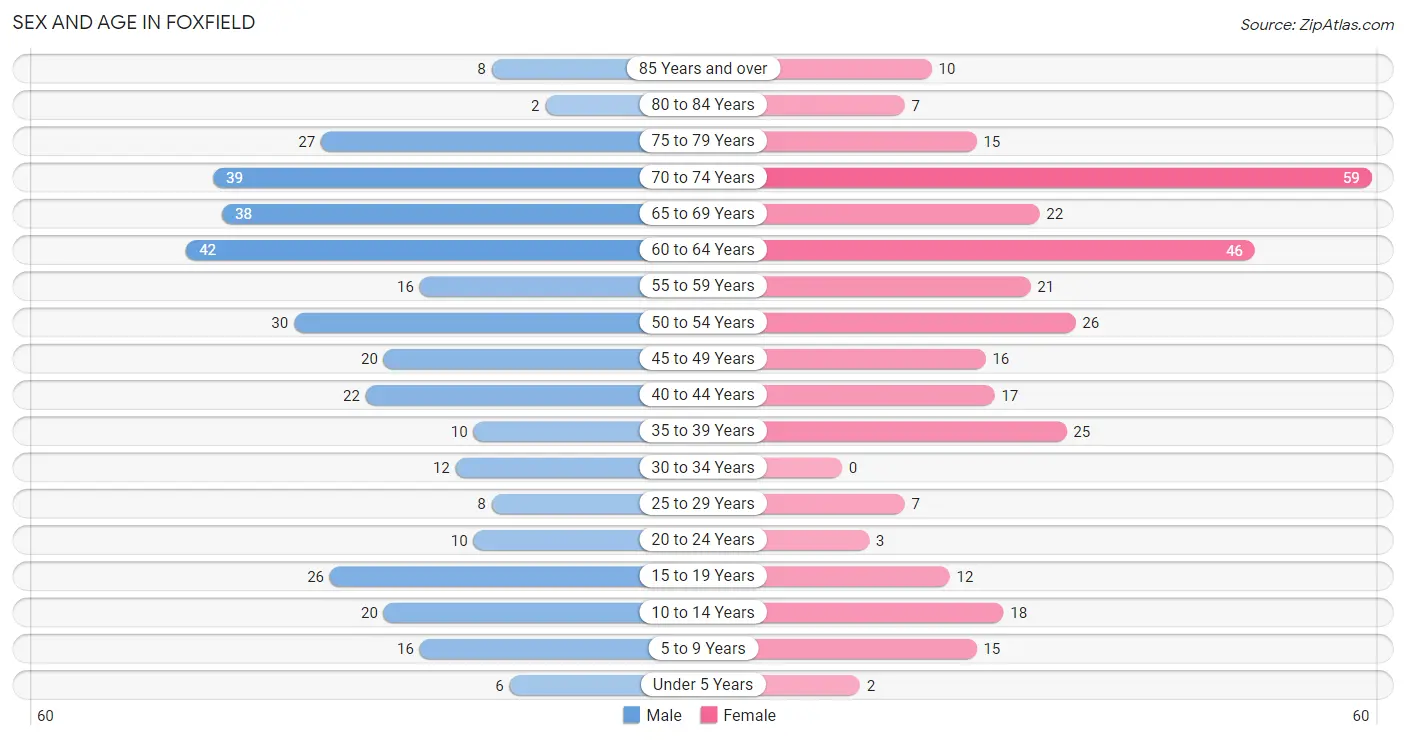
Sex and Age in Foxfield
The most populous age groups in Foxfield are 60 to 64 Years (42 | 11.9%) for men and 70 to 74 Years (59 | 18.4%) for women.
| Age Bracket | Male | Female |
| Under 5 Years | 6 (1.7%) | 2 (0.6%) |
| 5 to 9 Years | 16 (4.5%) | 15 (4.7%) |
| 10 to 14 Years | 20 (5.7%) | 18 (5.6%) |
| 15 to 19 Years | 26 (7.4%) | 12 (3.7%) |
| 20 to 24 Years | 10 (2.8%) | 3 (0.9%) |
| 25 to 29 Years | 8 (2.3%) | 7 (2.2%) |
| 30 to 34 Years | 12 (3.4%) | 0 (0.0%) |
| 35 to 39 Years | 10 (2.8%) | 25 (7.8%) |
| 40 to 44 Years | 22 (6.2%) | 17 (5.3%) |
| 45 to 49 Years | 20 (5.7%) | 16 (5.0%) |
| 50 to 54 Years | 30 (8.5%) | 26 (8.1%) |
| 55 to 59 Years | 16 (4.5%) | 21 (6.5%) |
| 60 to 64 Years | 42 (11.9%) | 46 (14.3%) |
| 65 to 69 Years | 38 (10.8%) | 22 (6.9%) |
| 70 to 74 Years | 39 (11.1%) | 59 (18.4%) |
| 75 to 79 Years | 27 (7.7%) | 15 (4.7%) |
| 80 to 84 Years | 2 (0.6%) | 7 (2.2%) |
| 85 Years and over | 8 (2.3%) | 10 (3.1%) |
| Total | 352 (100.0%) | 321 (100.0%) |
Families and Households in Foxfield
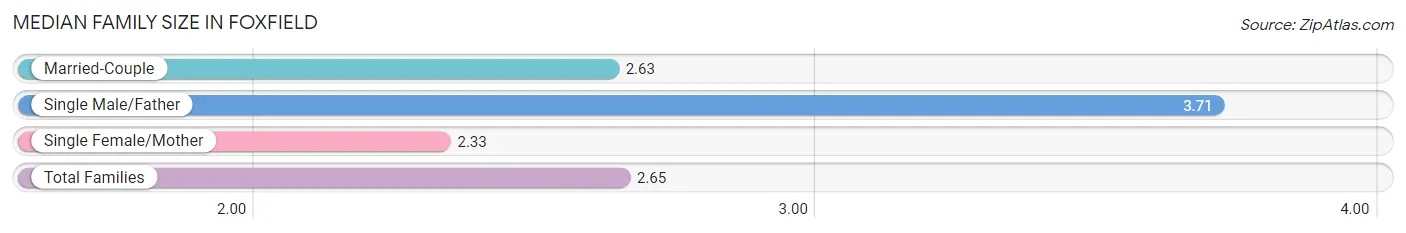
Median Family Size in Foxfield
The median family size in Foxfield is 2.65 persons per family, with single male/father families (7 | 3.1%) accounting for the largest median family size of 3.71 persons per family. On the other hand, single female/mother families (12 | 5.4%) represent the smallest median family size with 2.33 persons per family.
| Family Type | # Families | Family Size |
| Married-Couple | 205 (91.5%) | 2.63 |
| Single Male/Father | 7 (3.1%) | 3.71 |
| Single Female/Mother | 12 (5.4%) | 2.33 |
| Total Families | 224 (100.0%) | 2.65 |
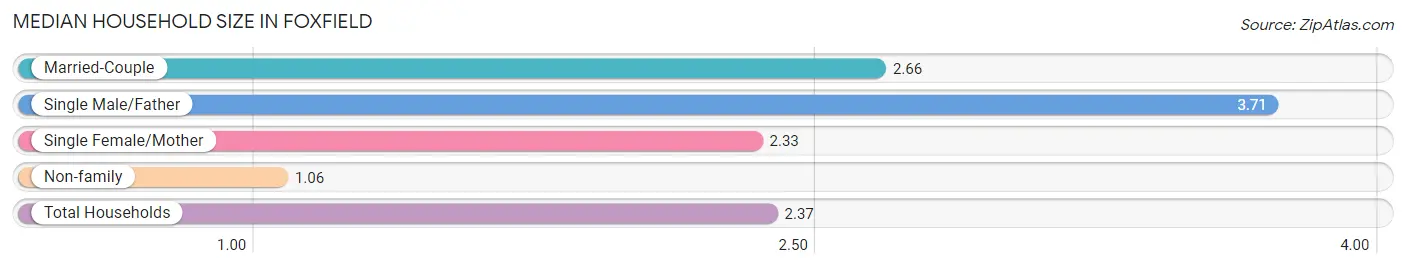
Median Household Size in Foxfield
The median household size in Foxfield is 2.37 persons per household, with single male/father households (7 | 2.5%) accounting for the largest median household size of 3.71 persons per household. non-family households (51 | 18.5%) represent the smallest median household size with 1.06 persons per household.
| Household Type | # Households | Household Size |
| Married-Couple | 205 (74.6%) | 2.66 |
| Single Male/Father | 7 (2.5%) | 3.71 |
| Single Female/Mother | 12 (4.4%) | 2.33 |
| Non-family | 51 (18.5%) | 1.06 |
| Total Households | 275 (100.0%) | 2.37 |
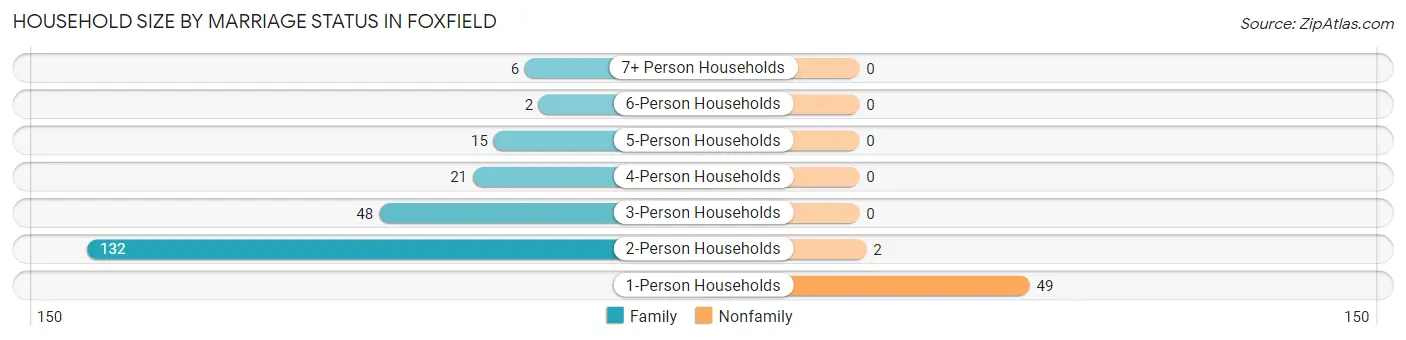
Household Size by Marriage Status in Foxfield
Out of a total of 275 households in Foxfield, 224 (81.5%) are family households, while 51 (18.5%) are nonfamily households. The most numerous type of family households are 2-person households, comprising 132, and the most common type of nonfamily households are 1-person households, comprising 49.
| Household Size | Family Households | Nonfamily Households |
| 1-Person Households | - | 49 (17.8%) |
| 2-Person Households | 132 (48.0%) | 2 (0.7%) |
| 3-Person Households | 48 (17.4%) | 0 (0.0%) |
| 4-Person Households | 21 (7.6%) | 0 (0.0%) |
| 5-Person Households | 15 (5.4%) | 0 (0.0%) |
| 6-Person Households | 2 (0.7%) | 0 (0.0%) |
| 7+ Person Households | 6 (2.2%) | 0 (0.0%) |
| Total | 224 (81.5%) | 51 (18.5%) |
Female Fertility in Foxfield
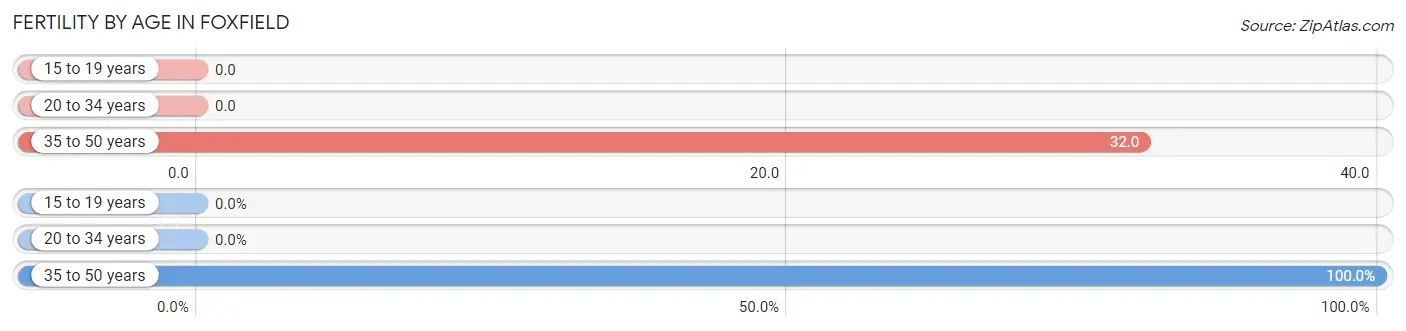
Fertility by Age in Foxfield
Average fertility rate in Foxfield is 24.0 births per 1,000 women. Women in the age bracket of 35 to 50 years have the highest fertility rate with 32.0 births per 1,000 women. Women in the age bracket of 35 to 50 years acount for 100.0% of all women with births.
| Age Bracket | Women with Births | Births / 1,000 Women |
| 15 to 19 years | 0 (0.0%) | 0.0 |
| 20 to 34 years | 0 (0.0%) | 0.0 |
| 35 to 50 years | 2 (100.0%) | 32.0 |
| Total | 2 (100.0%) | 24.0 |
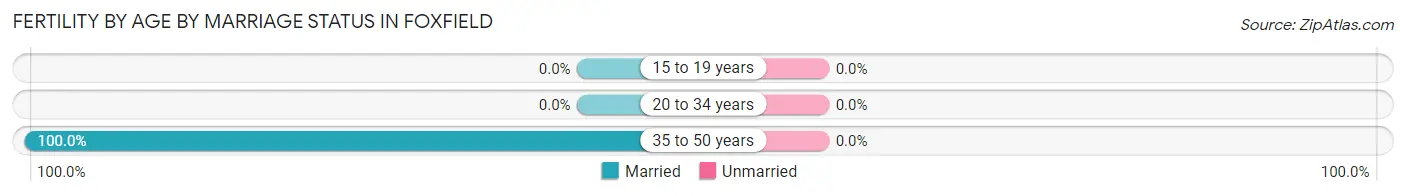
Fertility by Age by Marriage Status in Foxfield
| Age Bracket | Married | Unmarried |
| 15 to 19 years | 0 (0.0%) | 0 (0.0%) |
| 20 to 34 years | 0 (0.0%) | 0 (0.0%) |
| 35 to 50 years | 2 (100.0%) | 0 (0.0%) |
| Total | 2 (100.0%) | 0 (0.0%) |
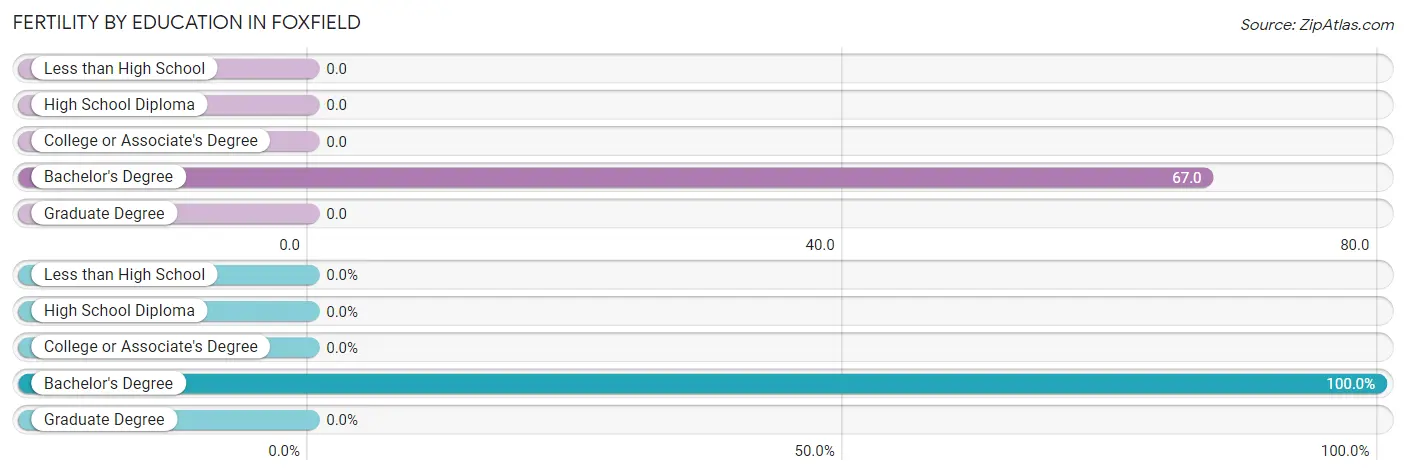
Fertility by Education in Foxfield
| Educational Attainment | Women with Births | Births / 1,000 Women |
| Less than High School | 0 (0.0%) | 0.0 |
| High School Diploma | 0 (0.0%) | 0.0 |
| College or Associate's Degree | 0 (0.0%) | 0.0 |
| Bachelor's Degree | 2 (100.0%) | 67.0 |
| Graduate Degree | 0 (0.0%) | 0.0 |
| Total | 2 (100.0%) | 24.0 |
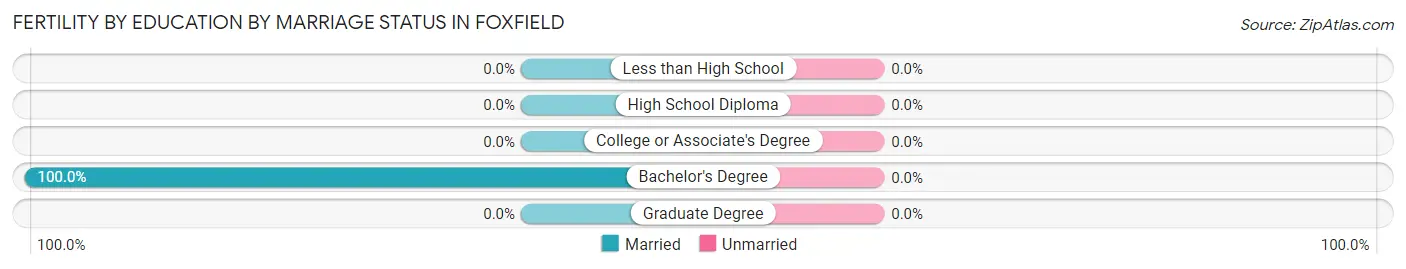
Fertility by Education by Marriage Status in Foxfield
| Educational Attainment | Married | Unmarried |
| Less than High School | 0 (0.0%) | 0 (0.0%) |
| High School Diploma | 0 (0.0%) | 0 (0.0%) |
| College or Associate's Degree | 0 (0.0%) | 0 (0.0%) |
| Bachelor's Degree | 2 (100.0%) | 0 (0.0%) |
| Graduate Degree | 0 (0.0%) | 0 (0.0%) |
| Total | 2 (100.0%) | 0 (0.0%) |
Income in Foxfield
Income Overview in Foxfield
Per Capita Income in Foxfield is $83,677, while median incomes of families and households are $172,083 and $168,125 respectively.
| Characteristic | Number | Measure |
| Per Capita Income | 673 | $83,677 |
| Median Family Income | 224 | $172,083 |
| Mean Family Income | 224 | $199,354 |
| Median Household Income | 275 | $168,125 |
| Mean Household Income | 275 | $207,626 |
| Income Deficit | 224 | $0 |
| Wage / Income Gap (%) | 673 | 35.29% |
| Wage / Income Gap ($) | 673 | 64.71¢ per $1 |
| Gini / Inequality Index | 673 | 0.40 |
Earnings by Sex in Foxfield
Average Earnings in Foxfield are $70,938, $91,750 for men and $59,375 for women, a difference of 35.3%.
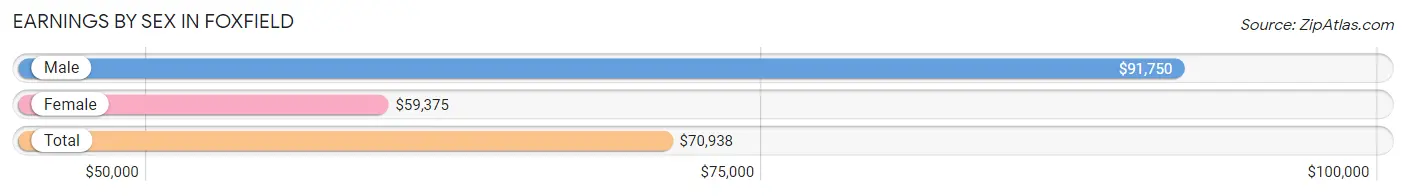
| Sex | Number | Average Earnings |
| Male | 225 (59.8%) | $91,750 |
| Female | 151 (40.2%) | $59,375 |
| Total | 376 (100.0%) | $70,938 |
Earnings by Sex by Income Bracket in Foxfield
The most common earnings brackets in Foxfield are $100,000+ for men (100 | 44.4%) and $75,000 to $99,999 for women (24 | 15.9%).
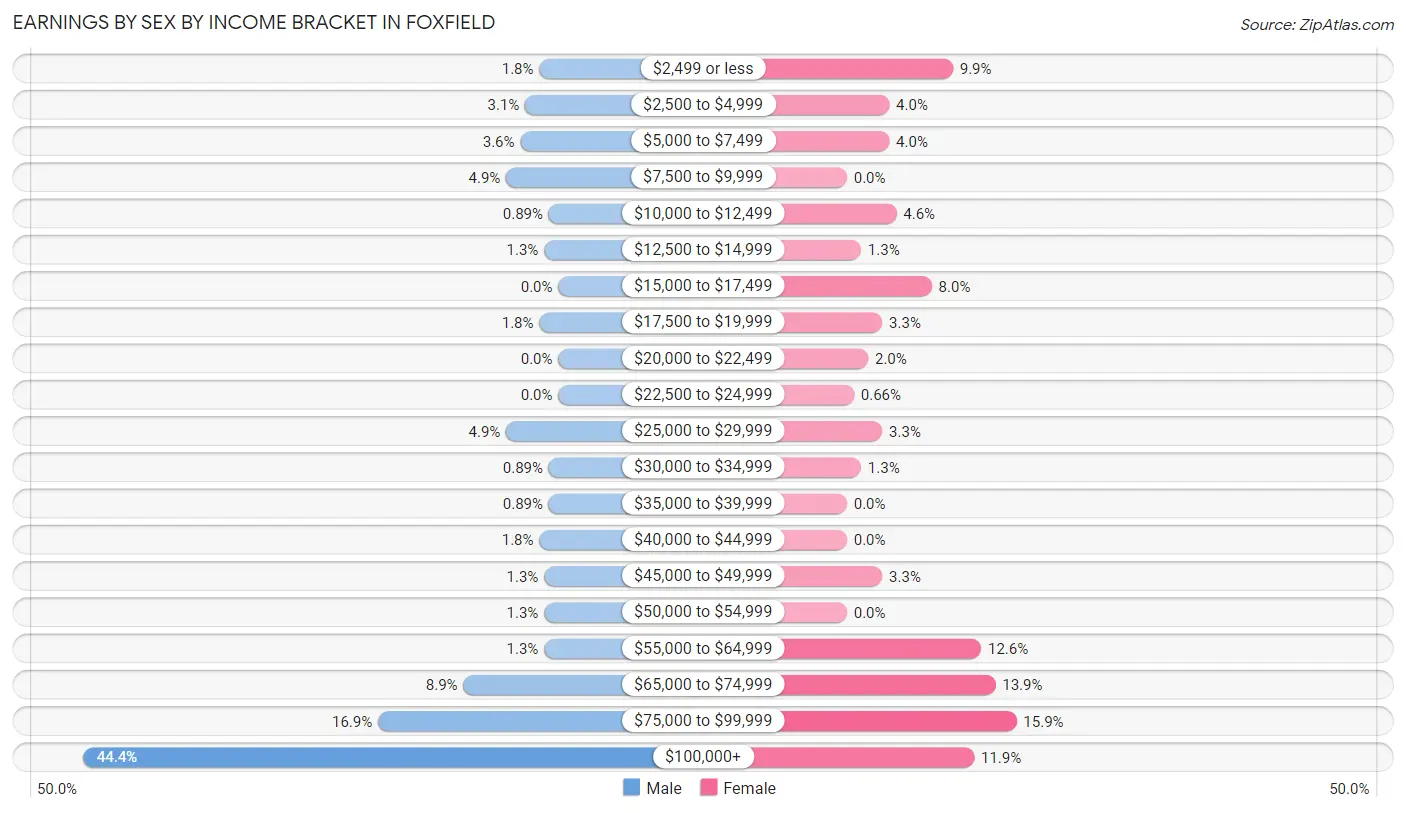
| Income | Male | Female |
| $2,499 or less | 4 (1.8%) | 15 (9.9%) |
| $2,500 to $4,999 | 7 (3.1%) | 6 (4.0%) |
| $5,000 to $7,499 | 8 (3.6%) | 6 (4.0%) |
| $7,500 to $9,999 | 11 (4.9%) | 0 (0.0%) |
| $10,000 to $12,499 | 2 (0.9%) | 7 (4.6%) |
| $12,500 to $14,999 | 3 (1.3%) | 2 (1.3%) |
| $15,000 to $17,499 | 0 (0.0%) | 12 (8.0%) |
| $17,500 to $19,999 | 4 (1.8%) | 5 (3.3%) |
| $20,000 to $22,499 | 0 (0.0%) | 3 (2.0%) |
| $22,500 to $24,999 | 0 (0.0%) | 1 (0.7%) |
| $25,000 to $29,999 | 11 (4.9%) | 5 (3.3%) |
| $30,000 to $34,999 | 2 (0.9%) | 2 (1.3%) |
| $35,000 to $39,999 | 2 (0.9%) | 0 (0.0%) |
| $40,000 to $44,999 | 4 (1.8%) | 0 (0.0%) |
| $45,000 to $49,999 | 3 (1.3%) | 5 (3.3%) |
| $50,000 to $54,999 | 3 (1.3%) | 0 (0.0%) |
| $55,000 to $64,999 | 3 (1.3%) | 19 (12.6%) |
| $65,000 to $74,999 | 20 (8.9%) | 21 (13.9%) |
| $75,000 to $99,999 | 38 (16.9%) | 24 (15.9%) |
| $100,000+ | 100 (44.4%) | 18 (11.9%) |
| Total | 225 (100.0%) | 151 (100.0%) |
Earnings by Sex by Educational Attainment in Foxfield
Average earnings in Foxfield are $102,917 for men and $60,208 for women, a difference of 41.5%. Men with an educational attainment of graduate degree enjoy the highest average annual earnings of $128,000, while those with high school diploma education earn the least with $68,958. Women with an educational attainment of bachelor's degree earn the most with the average annual earnings of $67,188, while those with high school diploma education have the smallest earnings of $19,750.
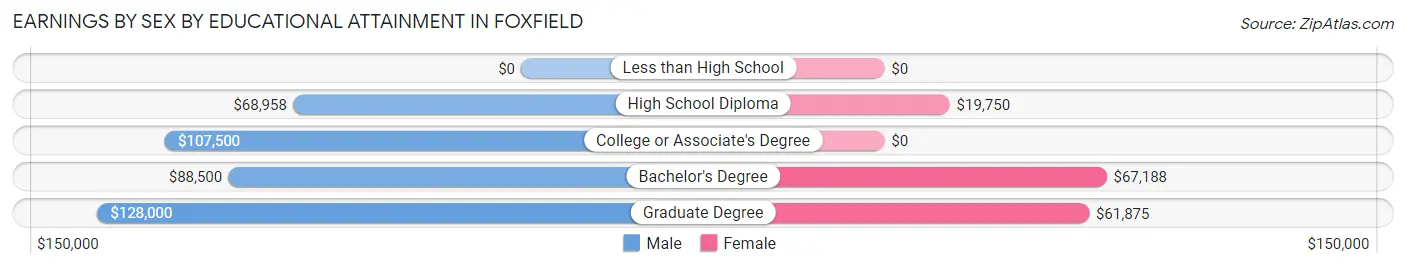
| Educational Attainment | Male Income | Female Income |
| Less than High School | - | - |
| High School Diploma | $68,958 | $19,750 |
| College or Associate's Degree | $107,500 | $0 |
| Bachelor's Degree | $88,500 | $67,188 |
| Graduate Degree | $128,000 | $61,875 |
| Total | $102,917 | $60,208 |
Family Income in Foxfield
Family Income Brackets in Foxfield
According to the Foxfield family income data, there are 82 families falling into the $200,000+ income range, which is the most common income bracket and makes up 36.6% of all families.
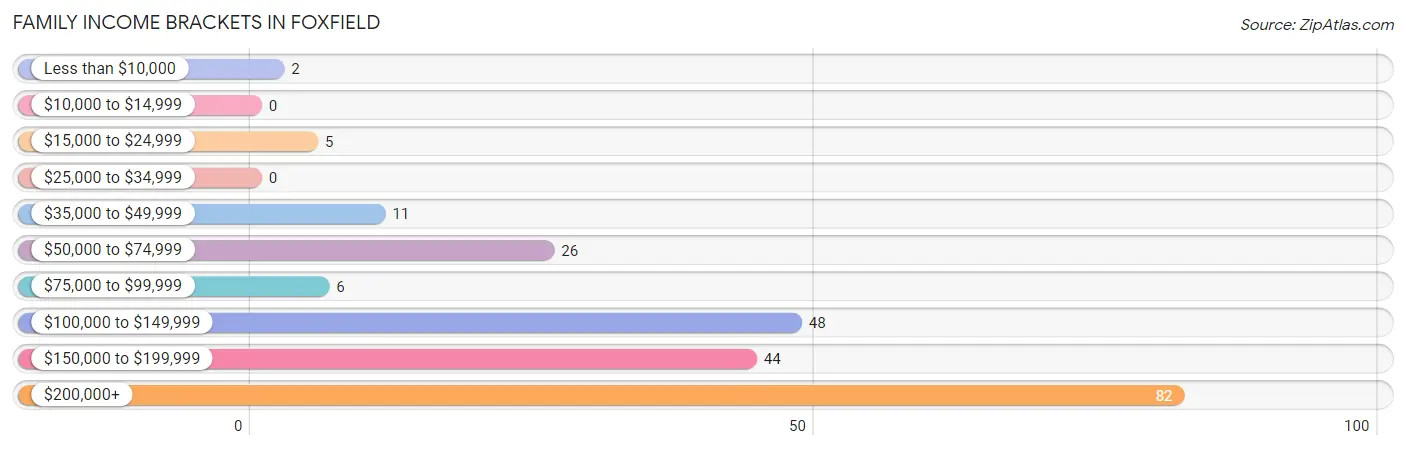
| Income Bracket | # Families | % Families |
| Less than $10,000 | 2 | 0.9% |
| $10,000 to $14,999 | 0 | 0.0% |
| $15,000 to $24,999 | 5 | 2.2% |
| $25,000 to $34,999 | 0 | 0.0% |
| $35,000 to $49,999 | 11 | 4.9% |
| $50,000 to $74,999 | 26 | 11.6% |
| $75,000 to $99,999 | 6 | 2.7% |
| $100,000 to $149,999 | 48 | 21.4% |
| $150,000 to $199,999 | 44 | 19.6% |
| $200,000+ | 82 | 36.6% |
Family Income by Famaliy Size in Foxfield
4-person families (19 | 8.5%) account for the highest median family income in Foxfield with $250,001 per family, while 3-person families (47 | 21.0%) have the highest median income of $76,845 per family member.
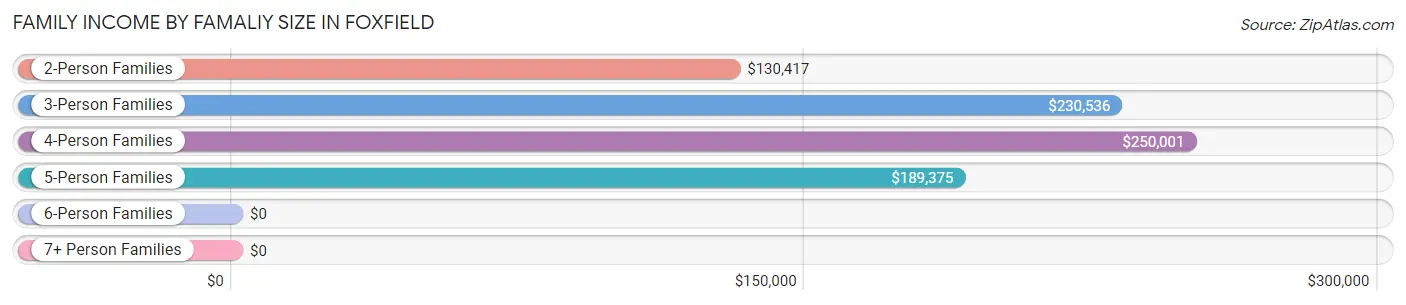
| Income Bracket | # Families | Median Income |
| 2-Person Families | 135 (60.3%) | $130,417 |
| 3-Person Families | 47 (21.0%) | $230,536 |
| 4-Person Families | 19 (8.5%) | $250,001 |
| 5-Person Families | 15 (6.7%) | $189,375 |
| 6-Person Families | 2 (0.9%) | $0 |
| 7+ Person Families | 6 (2.7%) | $0 |
| Total | 224 (100.0%) | $172,083 |
Family Income by Number of Earners in Foxfield
The median family income in Foxfield is $172,083, with families comprising 3+ earners (40) having the highest median family income of $238,333, while families with no earners (44) have the lowest median family income of $65,000, accounting for 17.9% and 19.6% of families, respectively.
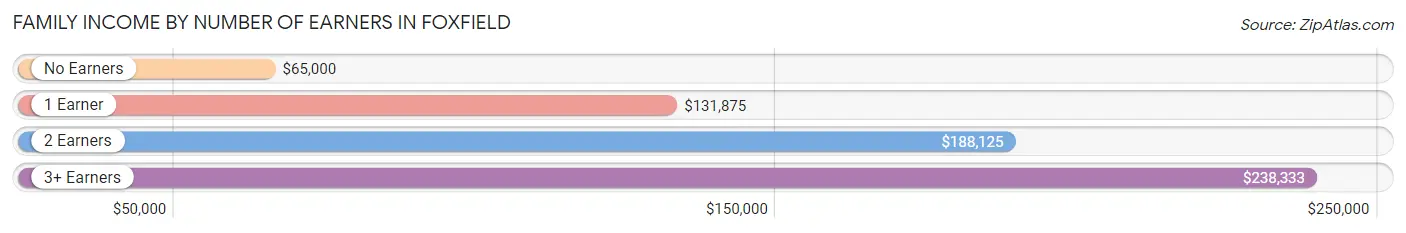
| Number of Earners | # Families | Median Income |
| No Earners | 44 (19.6%) | $65,000 |
| 1 Earner | 49 (21.9%) | $131,875 |
| 2 Earners | 91 (40.6%) | $188,125 |
| 3+ Earners | 40 (17.9%) | $238,333 |
| Total | 224 (100.0%) | $172,083 |
Household Income in Foxfield
Household Income Brackets in Foxfield
With 103 households falling in the category, the $200,000+ income range is the most frequent in Foxfield, accounting for 37.4% of all households. In contrast, only 2 households (0.7%) fall into the less than $10,000 income bracket, making it the least populous group.
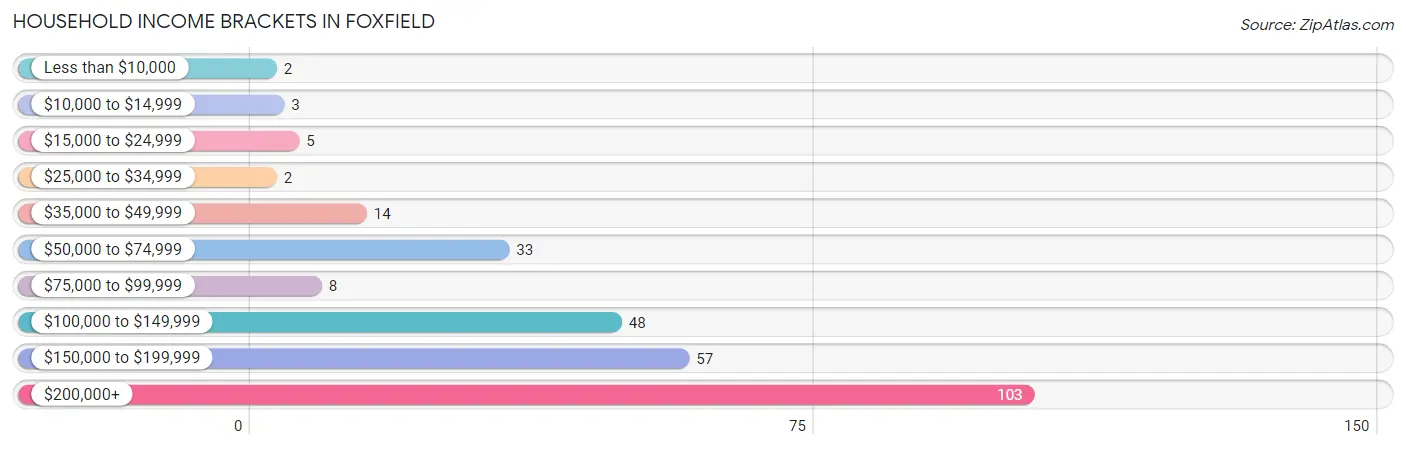
| Income Bracket | # Households | % Households |
| Less than $10,000 | 2 | 0.7% |
| $10,000 to $14,999 | 3 | 1.1% |
| $15,000 to $24,999 | 5 | 1.8% |
| $25,000 to $34,999 | 2 | 0.7% |
| $35,000 to $49,999 | 14 | 5.1% |
| $50,000 to $74,999 | 33 | 12.0% |
| $75,000 to $99,999 | 8 | 2.9% |
| $100,000 to $149,999 | 48 | 17.5% |
| $150,000 to $199,999 | 57 | 20.7% |
| $200,000+ | 103 | 37.5% |
Household Income by Householder Age in Foxfield
The median household income in Foxfield is $168,125, with the highest median household income of $190,625 found in the 45 to 64 years age bracket for the primary householder. A total of 117 households (42.5%) fall into this category.
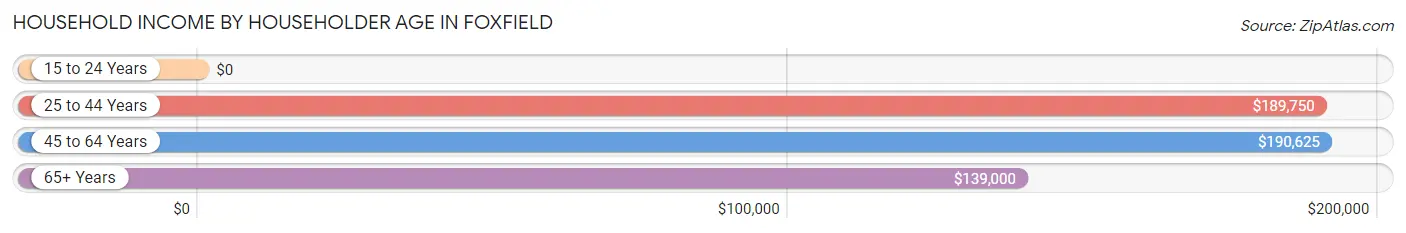
| Income Bracket | # Households | Median Income |
| 15 to 24 Years | 0 (0.0%) | $0 |
| 25 to 44 Years | 32 (11.6%) | $189,750 |
| 45 to 64 Years | 117 (42.5%) | $190,625 |
| 65+ Years | 126 (45.8%) | $139,000 |
| Total | 275 (100.0%) | $168,125 |
Poverty in Foxfield
Income Below Poverty by Sex and Age in Foxfield
With 3.2% poverty level for males and 3.7% for females among the residents of Foxfield, 18 to 24 year old males and 18 to 24 year old females are the most vulnerable to poverty, with 4 males (28.6%) and 4 females (57.1%) in their respective age groups living below the poverty level.
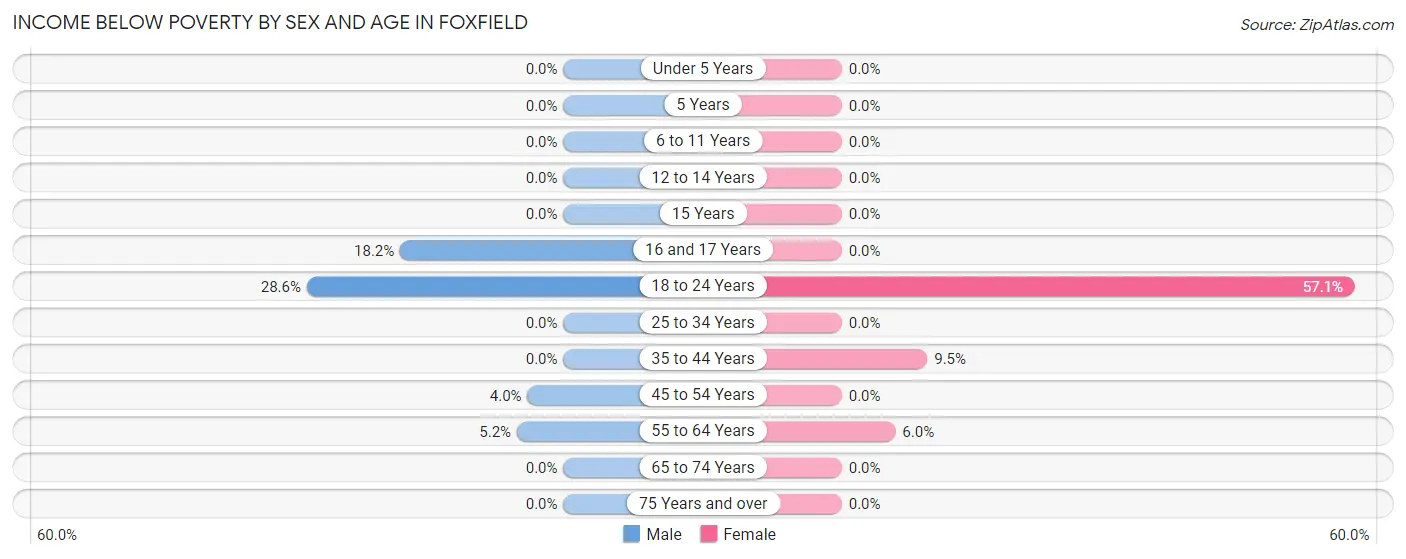
| Age Bracket | Male | Female |
| Under 5 Years | 0 (0.0%) | 0 (0.0%) |
| 5 Years | 0 (0.0%) | 0 (0.0%) |
| 6 to 11 Years | 0 (0.0%) | 0 (0.0%) |
| 12 to 14 Years | 0 (0.0%) | 0 (0.0%) |
| 15 Years | 0 (0.0%) | 0 (0.0%) |
| 16 and 17 Years | 2 (18.2%) | 0 (0.0%) |
| 18 to 24 Years | 4 (28.6%) | 4 (57.1%) |
| 25 to 34 Years | 0 (0.0%) | 0 (0.0%) |
| 35 to 44 Years | 0 (0.0%) | 4 (9.5%) |
| 45 to 54 Years | 2 (4.0%) | 0 (0.0%) |
| 55 to 64 Years | 3 (5.2%) | 4 (6.0%) |
| 65 to 74 Years | 0 (0.0%) | 0 (0.0%) |
| 75 Years and over | 0 (0.0%) | 0 (0.0%) |
| Total | 11 (3.2%) | 12 (3.7%) |
Income Above Poverty by Sex and Age in Foxfield
According to the poverty statistics in Foxfield, males aged under 5 years and females aged under 5 years are the age groups that are most secure financially, with 100.0% of males and 100.0% of females in these age groups living above the poverty line.
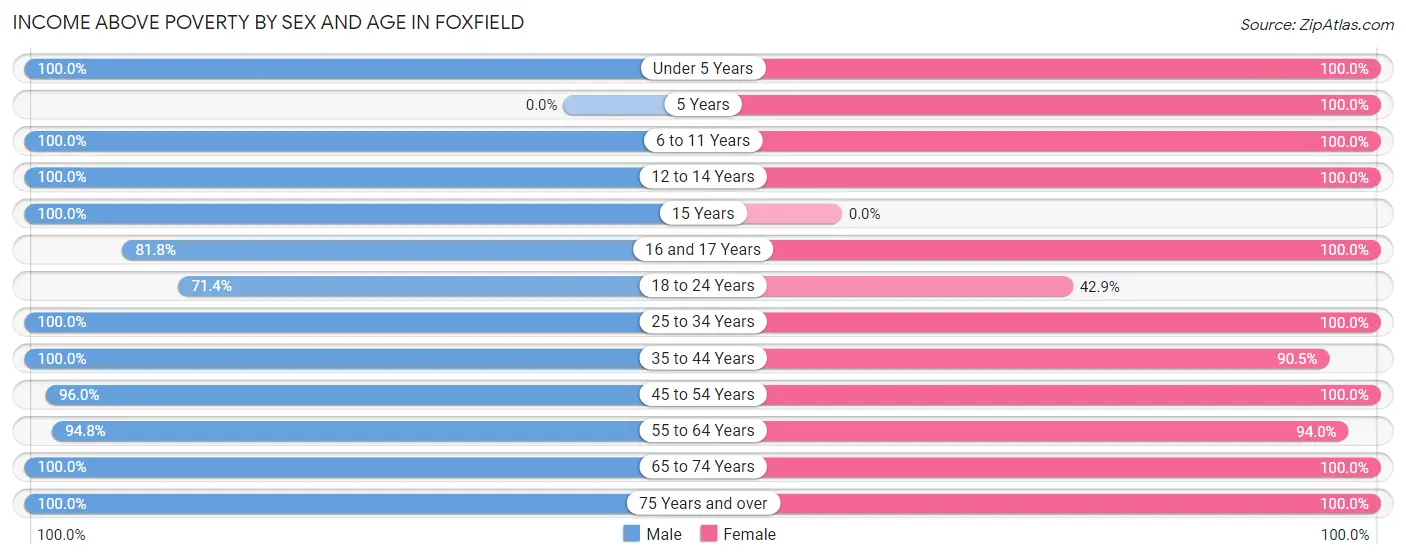
| Age Bracket | Male | Female |
| Under 5 Years | 6 (100.0%) | 2 (100.0%) |
| 5 Years | 0 (0.0%) | 2 (100.0%) |
| 6 to 11 Years | 34 (100.0%) | 15 (100.0%) |
| 12 to 14 Years | 2 (100.0%) | 16 (100.0%) |
| 15 Years | 2 (100.0%) | 0 (0.0%) |
| 16 and 17 Years | 9 (81.8%) | 8 (100.0%) |
| 18 to 24 Years | 10 (71.4%) | 3 (42.9%) |
| 25 to 34 Years | 20 (100.0%) | 7 (100.0%) |
| 35 to 44 Years | 32 (100.0%) | 38 (90.5%) |
| 45 to 54 Years | 48 (96.0%) | 42 (100.0%) |
| 55 to 64 Years | 55 (94.8%) | 63 (94.0%) |
| 65 to 74 Years | 77 (100.0%) | 81 (100.0%) |
| 75 Years and over | 37 (100.0%) | 32 (100.0%) |
| Total | 332 (96.8%) | 309 (96.3%) |
Income Below Poverty Among Married-Couple Families in Foxfield
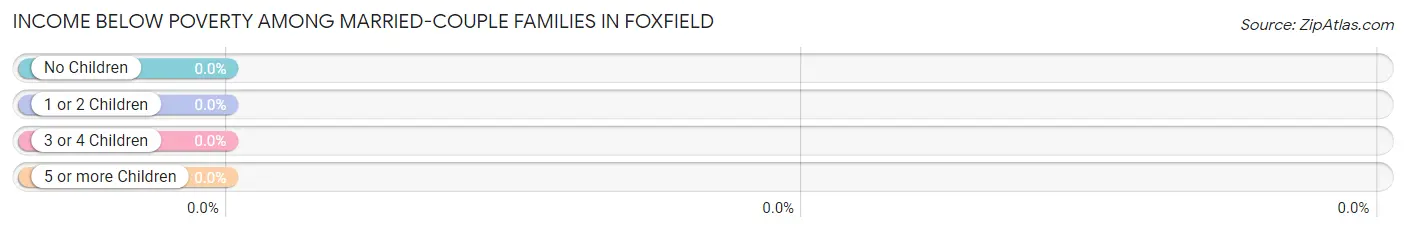
| Children | Above Poverty | Below Poverty |
| No Children | 153 (100.0%) | 0 (0.0%) |
| 1 or 2 Children | 44 (100.0%) | 0 (0.0%) |
| 3 or 4 Children | 8 (100.0%) | 0 (0.0%) |
| 5 or more Children | 0 (0.0%) | 0 (0.0%) |
| Total | 205 (100.0%) | 0 (0.0%) |
Income Below Poverty Among Single-Parent Households in Foxfield
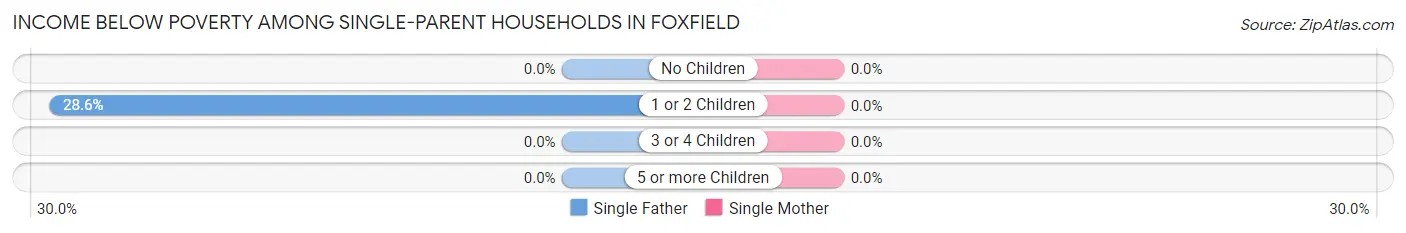
| Children | Single Father | Single Mother |
| No Children | 0 (0.0%) | 0 (0.0%) |
| 1 or 2 Children | 2 (28.6%) | 0 (0.0%) |
| 3 or 4 Children | 0 (0.0%) | 0 (0.0%) |
| 5 or more Children | 0 (0.0%) | 0 (0.0%) |
| Total | 2 (28.6%) | 0 (0.0%) |
Income Below Poverty Among Married-Couple vs Single-Parent Households in Foxfield
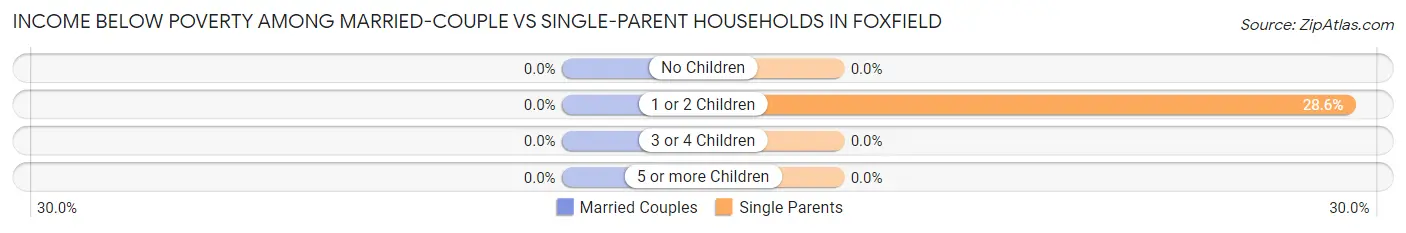
| Children | Married-Couple Families | Single-Parent Households |
| No Children | 0 (0.0%) | 0 (0.0%) |
| 1 or 2 Children | 0 (0.0%) | 2 (28.6%) |
| 3 or 4 Children | 0 (0.0%) | 0 (0.0%) |
| 5 or more Children | 0 (0.0%) | 0 (0.0%) |
| Total | 0 (0.0%) | 2 (10.5%) |
Employment Characteristics in Foxfield
Employment by Class of Employer in Foxfield
Among the 324 employed individuals in Foxfield, private company employees (186 | 57.4%), self-employed (incorporated) (55 | 17.0%), and self-employed (not incorporated) (35 | 10.8%) make up the most common classes of employment.
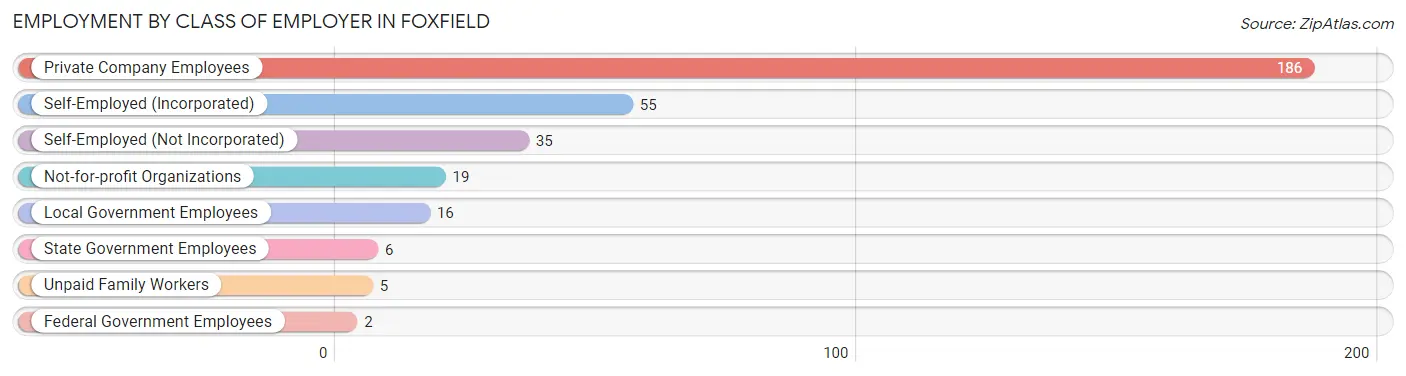
| Employer Class | # Employees | % Employees |
| Private Company Employees | 186 | 57.4% |
| Self-Employed (Incorporated) | 55 | 17.0% |
| Self-Employed (Not Incorporated) | 35 | 10.8% |
| Not-for-profit Organizations | 19 | 5.9% |
| Local Government Employees | 16 | 4.9% |
| State Government Employees | 6 | 1.8% |
| Federal Government Employees | 2 | 0.6% |
| Unpaid Family Workers | 5 | 1.5% |
| Total | 324 | 100.0% |
Employment Status by Age in Foxfield
According to the labor force statistics for Foxfield, out of the total population over 16 years of age (593), 58.2% or 345 individuals are in the labor force, with 3.2% or 11 of them unemployed. The age group with the highest labor force participation rate is 20 to 24 years, with 100.0% or 13 individuals in the labor force. Within the labor force, the 16 to 19 years age range has the highest percentage of unemployed individuals, with 54.5% or 6 of them being unemployed.
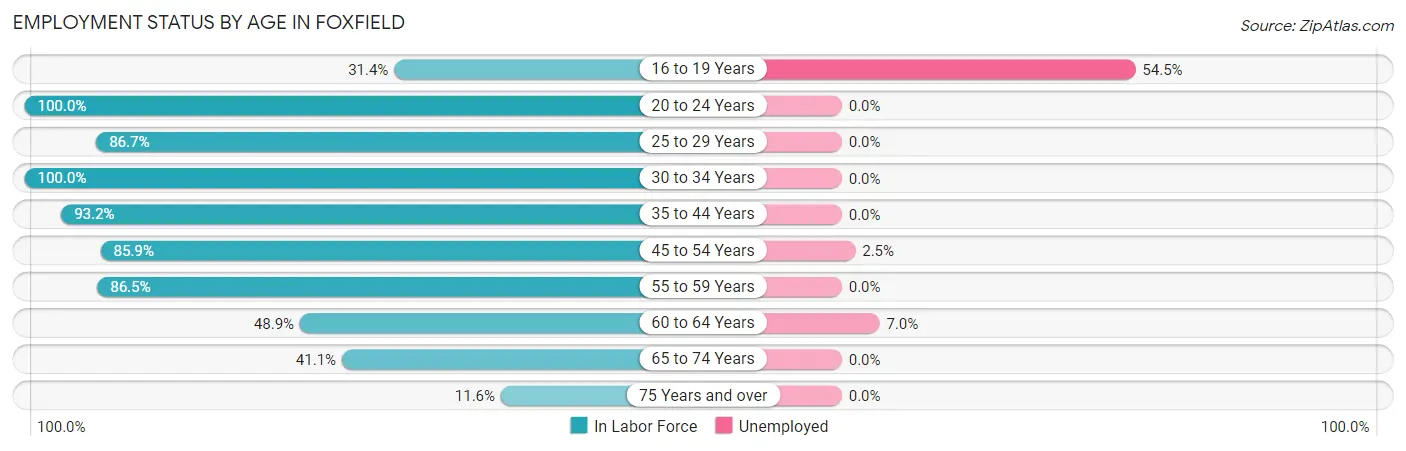
| Age Bracket | In Labor Force | Unemployed |
| 16 to 19 Years | 11 (31.4%) | 6 (54.5%) |
| 20 to 24 Years | 13 (100.0%) | 0 (0.0%) |
| 25 to 29 Years | 13 (86.7%) | 0 (0.0%) |
| 30 to 34 Years | 12 (100.0%) | 0 (0.0%) |
| 35 to 44 Years | 69 (93.2%) | 0 (0.0%) |
| 45 to 54 Years | 79 (85.9%) | 2 (2.5%) |
| 55 to 59 Years | 32 (86.5%) | 0 (0.0%) |
| 60 to 64 Years | 43 (48.9%) | 3 (7.0%) |
| 65 to 74 Years | 65 (41.1%) | 0 (0.0%) |
| 75 Years and over | 8 (11.6%) | 0 (0.0%) |
| Total | 345 (58.2%) | 11 (3.2%) |
Employment Status by Educational Attainment in Foxfield
According to labor force statistics for Foxfield, 78.0% of individuals (248) out of the total population between 25 and 64 years of age (318) are in the labor force, with 2.0% or 5 of them being unemployed. The group with the highest labor force participation rate are those with the educational attainment of bachelor's degree or higher, with 83.8% or 165 individuals in the labor force. Within the labor force, individuals with high school diploma education have the highest percentage of unemployment, with 7.7% or 2 of them being unemployed.
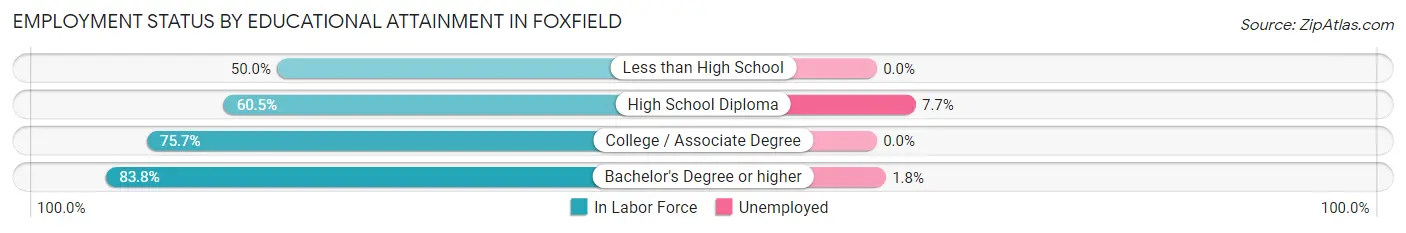
| Educational Attainment | In Labor Force | Unemployed |
| Less than High School | 4 (50.0%) | 0 (0.0%) |
| High School Diploma | 26 (60.5%) | 3 (7.7%) |
| College / Associate Degree | 53 (75.7%) | 0 (0.0%) |
| Bachelor's Degree or higher | 165 (83.8%) | 4 (1.8%) |
| Total | 248 (78.0%) | 6 (2.0%) |
Employment Occupations by Sex in Foxfield
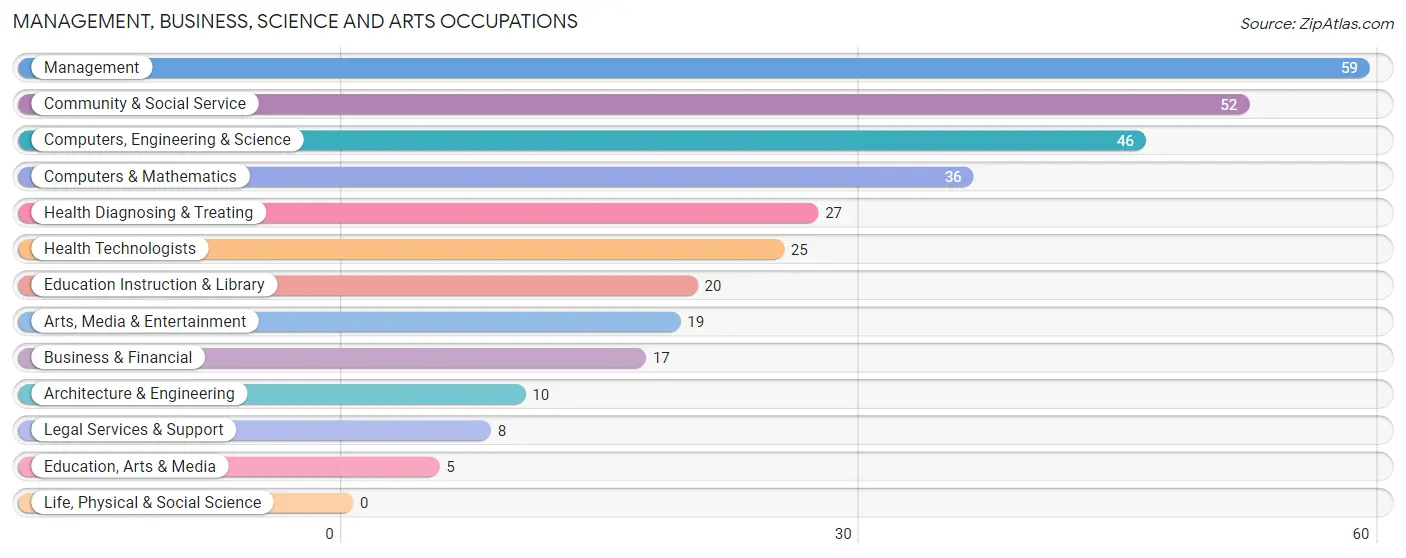
Management, Business, Science and Arts Occupations
The most common Management, Business, Science and Arts occupations in Foxfield are Management (59 | 17.8%), Community & Social Service (52 | 15.7%), Computers, Engineering & Science (46 | 13.9%), Computers & Mathematics (36 | 10.8%), and Health Diagnosing & Treating (27 | 8.1%).
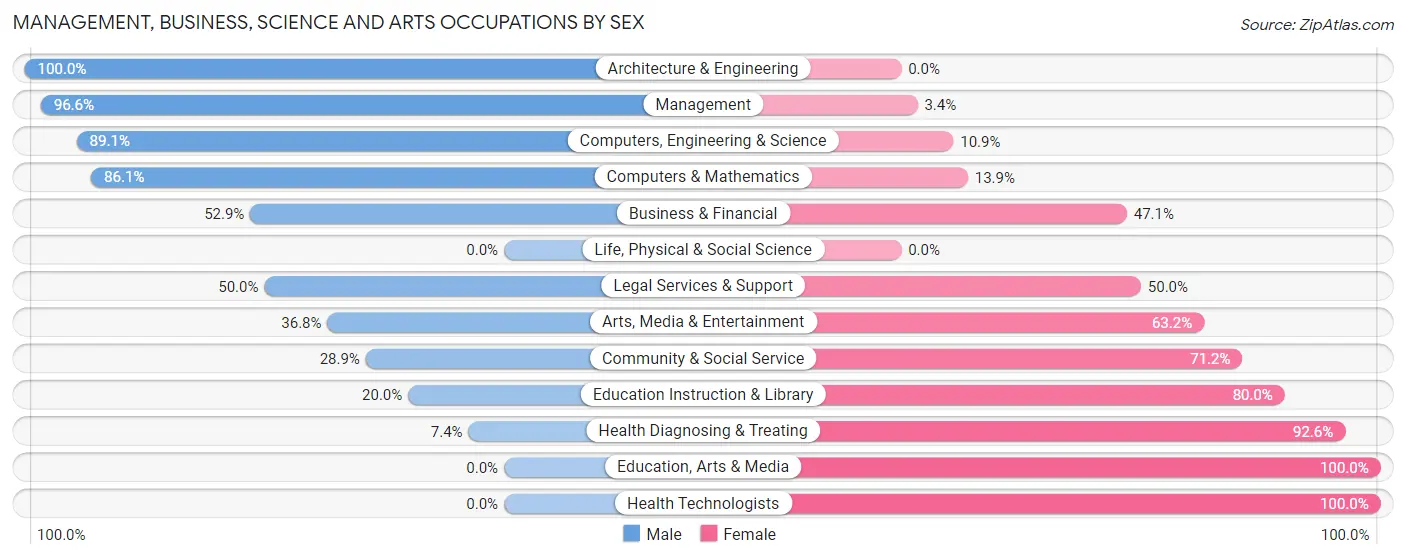
Management, Business, Science and Arts Occupations by Sex
Within the Management, Business, Science and Arts occupations in Foxfield, the most male-oriented occupations are Architecture & Engineering (100.0%), Management (96.6%), and Computers, Engineering & Science (89.1%), while the most female-oriented occupations are Education, Arts & Media (100.0%), Health Technologists (100.0%), and Health Diagnosing & Treating (92.6%).
| Occupation | Male | Female |
| Management | 57 (96.6%) | 2 (3.4%) |
| Business & Financial | 9 (52.9%) | 8 (47.1%) |
| Computers, Engineering & Science | 41 (89.1%) | 5 (10.9%) |
| Computers & Mathematics | 31 (86.1%) | 5 (13.9%) |
| Architecture & Engineering | 10 (100.0%) | 0 (0.0%) |
| Life, Physical & Social Science | 0 (0.0%) | 0 (0.0%) |
| Community & Social Service | 15 (28.8%) | 37 (71.2%) |
| Education, Arts & Media | 0 (0.0%) | 5 (100.0%) |
| Legal Services & Support | 4 (50.0%) | 4 (50.0%) |
| Education Instruction & Library | 4 (20.0%) | 16 (80.0%) |
| Arts, Media & Entertainment | 7 (36.8%) | 12 (63.2%) |
| Health Diagnosing & Treating | 2 (7.4%) | 25 (92.6%) |
| Health Technologists | 0 (0.0%) | 25 (100.0%) |
| Total (Category) | 124 (61.7%) | 77 (38.3%) |
| Total (Overall) | 209 (62.9%) | 123 (37.0%) |
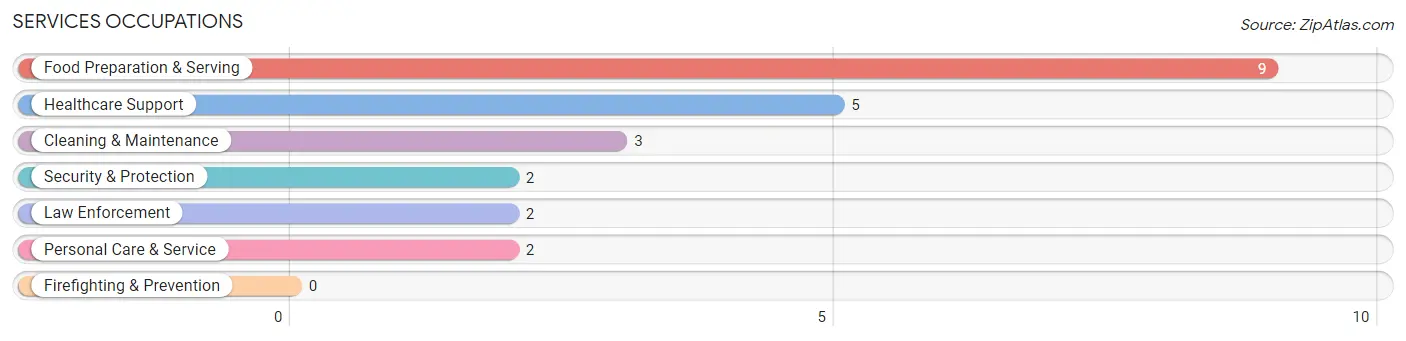
Services Occupations
The most common Services occupations in Foxfield are Food Preparation & Serving (9 | 2.7%), Healthcare Support (5 | 1.5%), Cleaning & Maintenance (3 | 0.9%), Security & Protection (2 | 0.6%), and Law Enforcement (2 | 0.6%).
Services Occupations by Sex
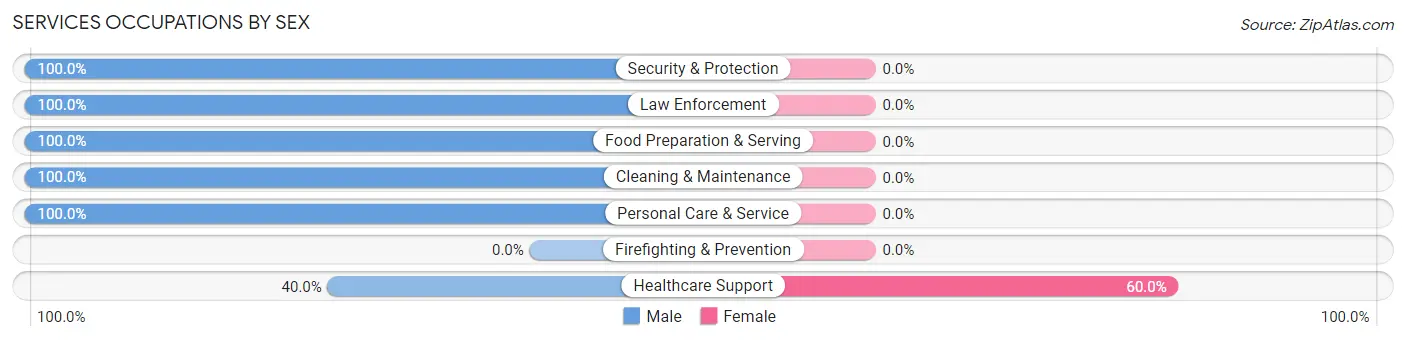
| Occupation | Male | Female |
| Healthcare Support | 2 (40.0%) | 3 (60.0%) |
| Security & Protection | 2 (100.0%) | 0 (0.0%) |
| Firefighting & Prevention | 0 (0.0%) | 0 (0.0%) |
| Law Enforcement | 2 (100.0%) | 0 (0.0%) |
| Food Preparation & Serving | 9 (100.0%) | 0 (0.0%) |
| Cleaning & Maintenance | 3 (100.0%) | 0 (0.0%) |
| Personal Care & Service | 2 (100.0%) | 0 (0.0%) |
| Total (Category) | 18 (85.7%) | 3 (14.3%) |
| Total (Overall) | 209 (62.9%) | 123 (37.0%) |
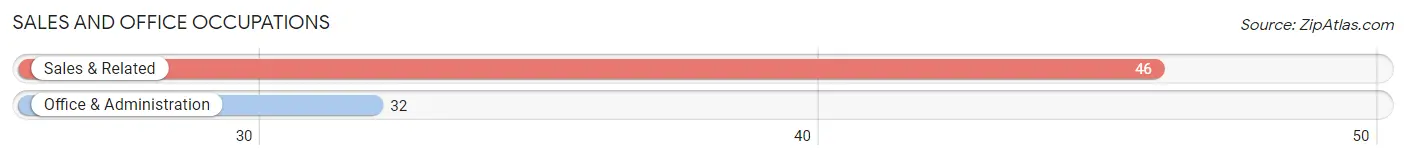
Sales and Office Occupations
The most common Sales and Office occupations in Foxfield are Sales & Related (46 | 13.9%), and Office & Administration (32 | 9.6%).
Sales and Office Occupations by Sex
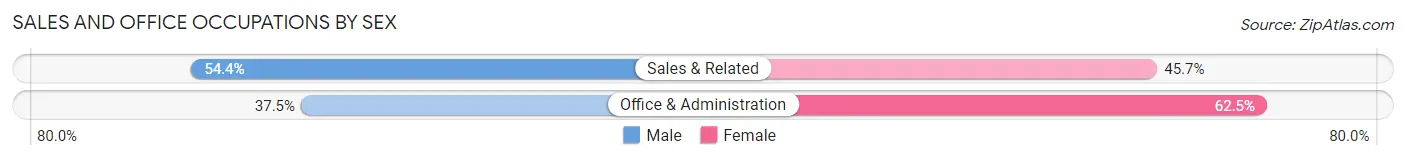
| Occupation | Male | Female |
| Sales & Related | 25 (54.3%) | 21 (45.7%) |
| Office & Administration | 12 (37.5%) | 20 (62.5%) |
| Total (Category) | 37 (47.4%) | 41 (52.6%) |
| Total (Overall) | 209 (62.9%) | 123 (37.0%) |
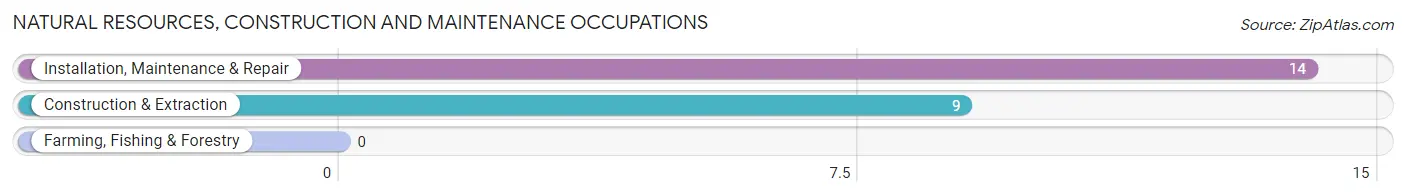
Natural Resources, Construction and Maintenance Occupations
The most common Natural Resources, Construction and Maintenance occupations in Foxfield are Installation, Maintenance & Repair (14 | 4.2%), and Construction & Extraction (9 | 2.7%).
Natural Resources, Construction and Maintenance Occupations by Sex
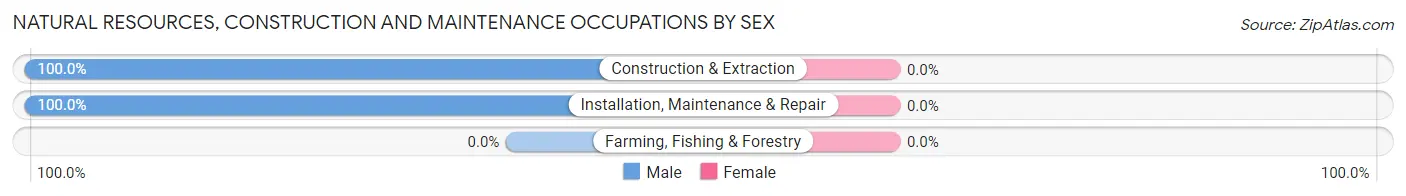
| Occupation | Male | Female |
| Farming, Fishing & Forestry | 0 (0.0%) | 0 (0.0%) |
| Construction & Extraction | 9 (100.0%) | 0 (0.0%) |
| Installation, Maintenance & Repair | 14 (100.0%) | 0 (0.0%) |
| Total (Category) | 23 (100.0%) | 0 (0.0%) |
| Total (Overall) | 209 (62.9%) | 123 (37.0%) |
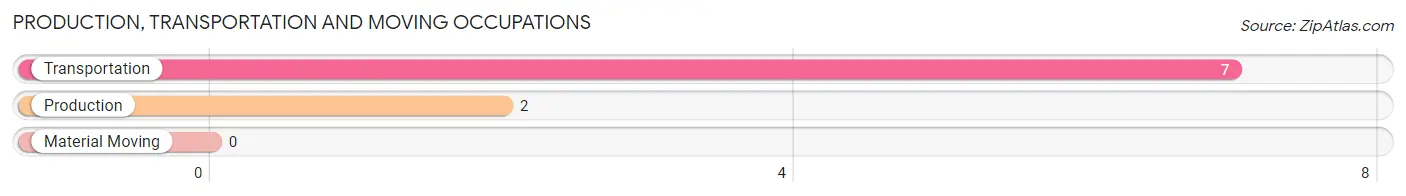
Production, Transportation and Moving Occupations
The most common Production, Transportation and Moving occupations in Foxfield are Transportation (7 | 2.1%), and Production (2 | 0.6%).
Production, Transportation and Moving Occupations by Sex
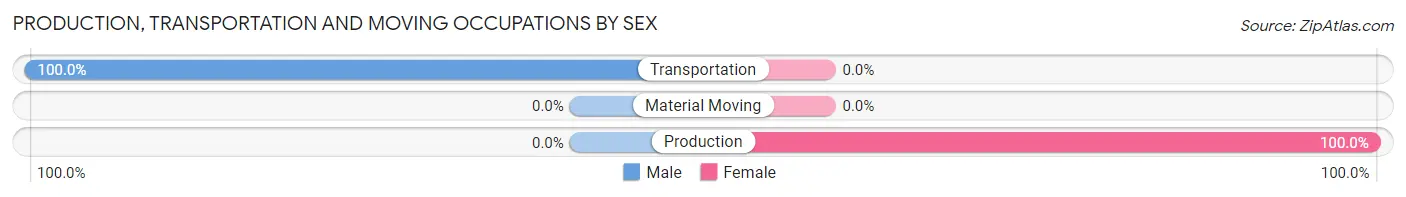
| Occupation | Male | Female |
| Production | 0 (0.0%) | 2 (100.0%) |
| Transportation | 7 (100.0%) | 0 (0.0%) |
| Material Moving | 0 (0.0%) | 0 (0.0%) |
| Total (Category) | 7 (77.8%) | 2 (22.2%) |
| Total (Overall) | 209 (62.9%) | 123 (37.0%) |
Employment Industries by Sex in Foxfield
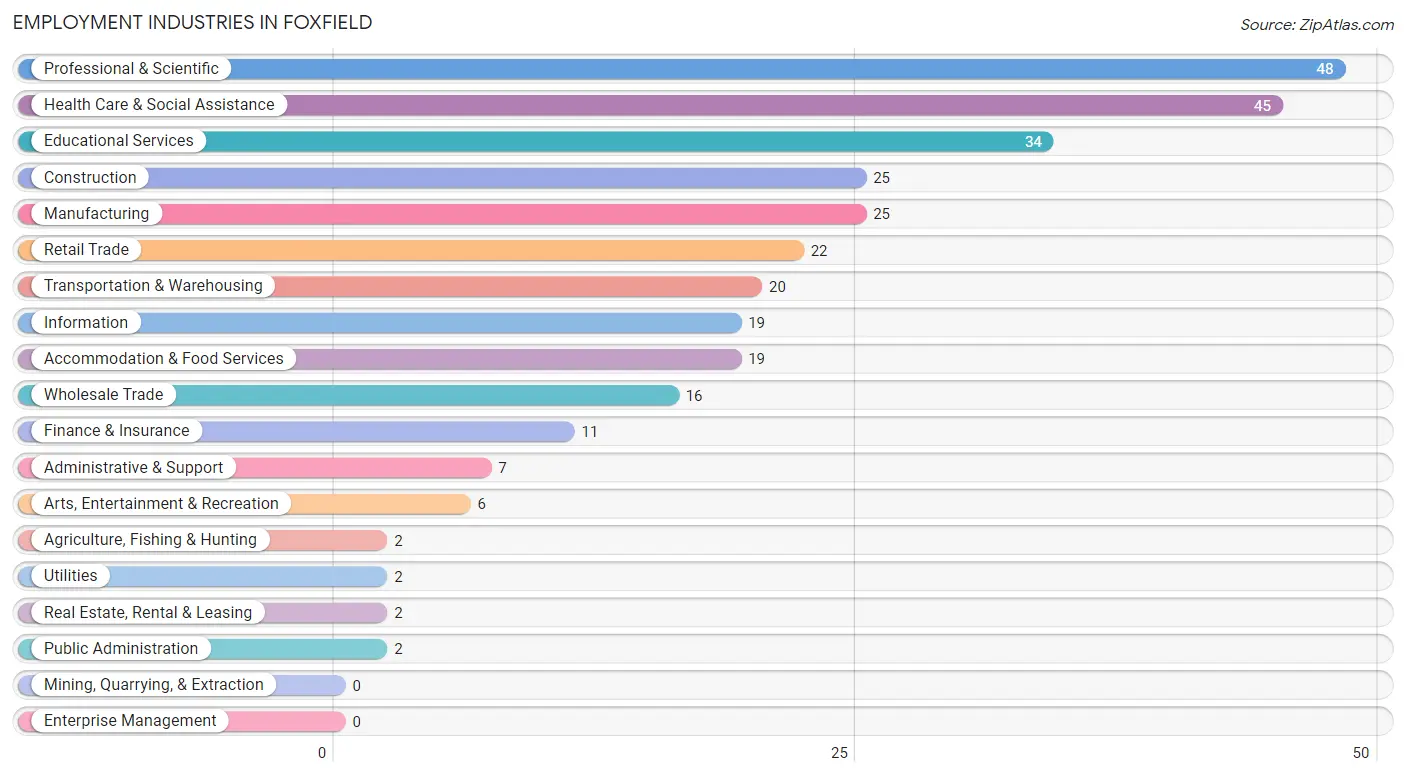
Employment Industries in Foxfield
The major employment industries in Foxfield include Professional & Scientific (48 | 14.5%), Health Care & Social Assistance (45 | 13.6%), Educational Services (34 | 10.2%), Construction (25 | 7.5%), and Manufacturing (25 | 7.5%).
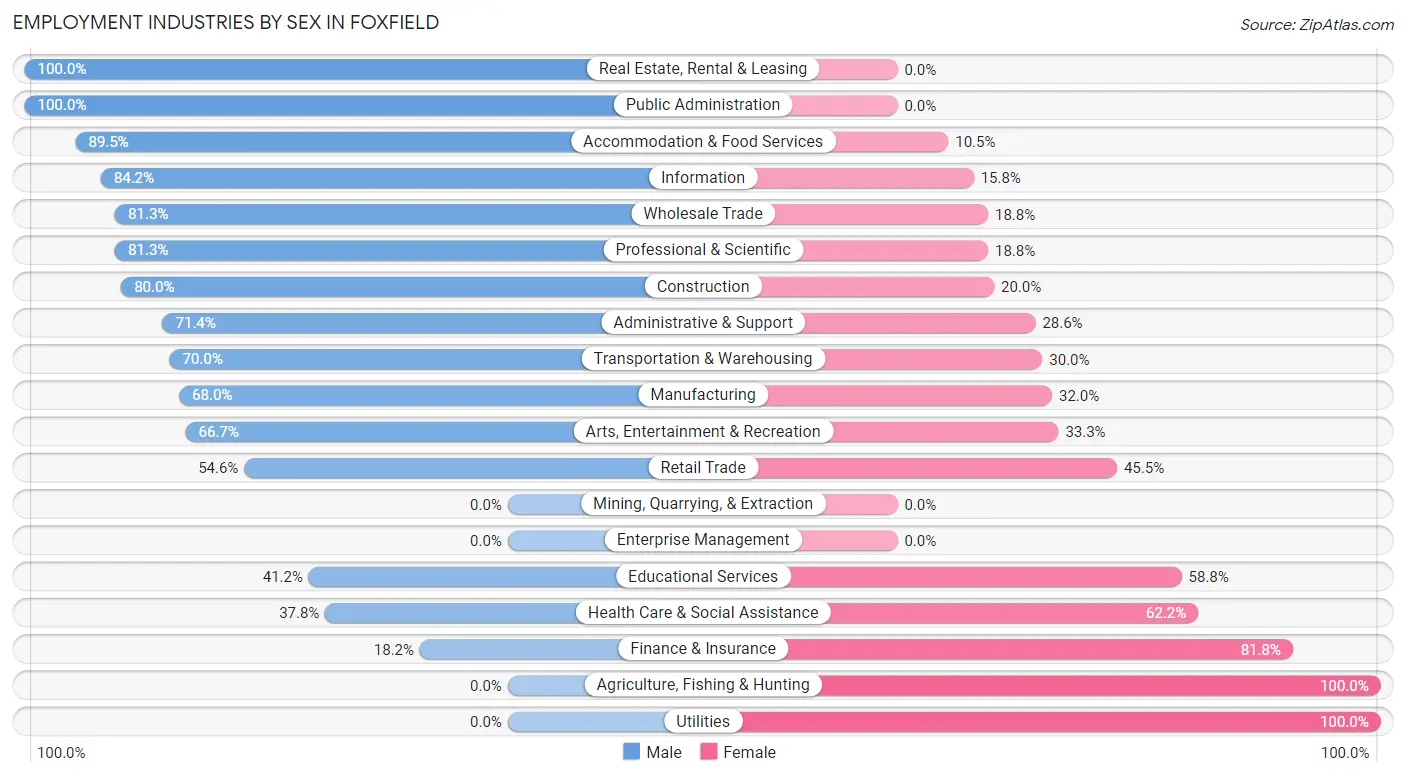
Employment Industries by Sex in Foxfield
The Foxfield industries that see more men than women are Real Estate, Rental & Leasing (100.0%), Public Administration (100.0%), and Accommodation & Food Services (89.5%), whereas the industries that tend to have a higher number of women are Agriculture, Fishing & Hunting (100.0%), Utilities (100.0%), and Finance & Insurance (81.8%).
| Industry | Male | Female |
| Agriculture, Fishing & Hunting | 0 (0.0%) | 2 (100.0%) |
| Mining, Quarrying, & Extraction | 0 (0.0%) | 0 (0.0%) |
| Construction | 20 (80.0%) | 5 (20.0%) |
| Manufacturing | 17 (68.0%) | 8 (32.0%) |
| Wholesale Trade | 13 (81.2%) | 3 (18.8%) |
| Retail Trade | 12 (54.5%) | 10 (45.5%) |
| Transportation & Warehousing | 14 (70.0%) | 6 (30.0%) |
| Utilities | 0 (0.0%) | 2 (100.0%) |
| Information | 16 (84.2%) | 3 (15.8%) |
| Finance & Insurance | 2 (18.2%) | 9 (81.8%) |
| Real Estate, Rental & Leasing | 2 (100.0%) | 0 (0.0%) |
| Professional & Scientific | 39 (81.2%) | 9 (18.8%) |
| Enterprise Management | 0 (0.0%) | 0 (0.0%) |
| Administrative & Support | 5 (71.4%) | 2 (28.6%) |
| Educational Services | 14 (41.2%) | 20 (58.8%) |
| Health Care & Social Assistance | 17 (37.8%) | 28 (62.2%) |
| Arts, Entertainment & Recreation | 4 (66.7%) | 2 (33.3%) |
| Accommodation & Food Services | 17 (89.5%) | 2 (10.5%) |
| Public Administration | 2 (100.0%) | 0 (0.0%) |
| Total | 209 (62.9%) | 123 (37.0%) |
Education in Foxfield
School Enrollment in Foxfield
The most common levels of schooling among the 120 students in Foxfield are high school (35 | 29.2%), middle school (32 | 26.7%), and elementary school (31 | 25.8%).
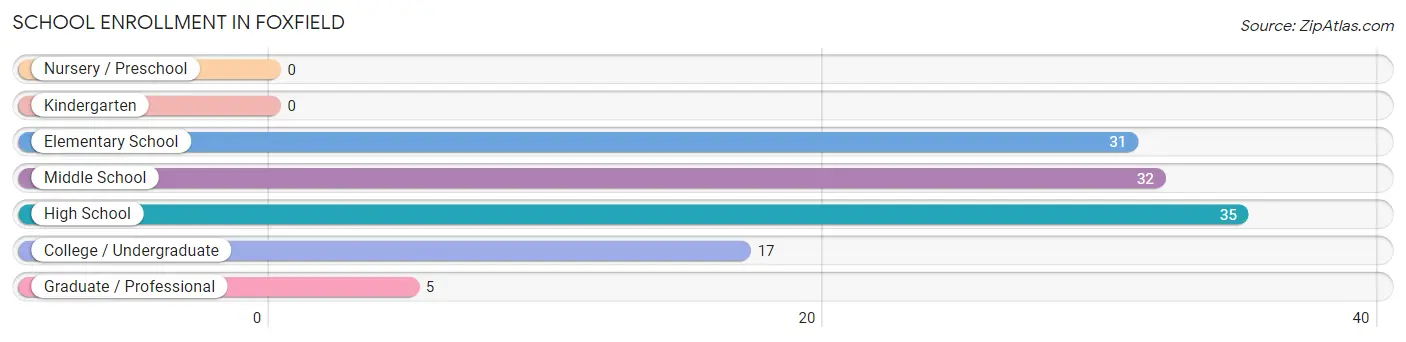
| School Level | # Students | % Students |
| Nursery / Preschool | 0 | 0.0% |
| Kindergarten | 0 | 0.0% |
| Elementary School | 31 | 25.8% |
| Middle School | 32 | 26.7% |
| High School | 35 | 29.2% |
| College / Undergraduate | 17 | 14.2% |
| Graduate / Professional | 5 | 4.2% |
| Total | 120 | 100.0% |
School Enrollment by Age by Funding Source in Foxfield
Out of a total of 120 students who are enrolled in schools in Foxfield, 18 (15.0%) attend a private institution, while the remaining 102 (85.0%) are enrolled in public schools. The age group of 15 to 17 year olds has the highest likelihood of being enrolled in private schools, with 7 (29.2% in the age bracket) enrolled. Conversely, the age group of 20 to 24 year olds has the lowest likelihood of being enrolled in a private school, with 7 (100.0% in the age bracket) attending a public institution.
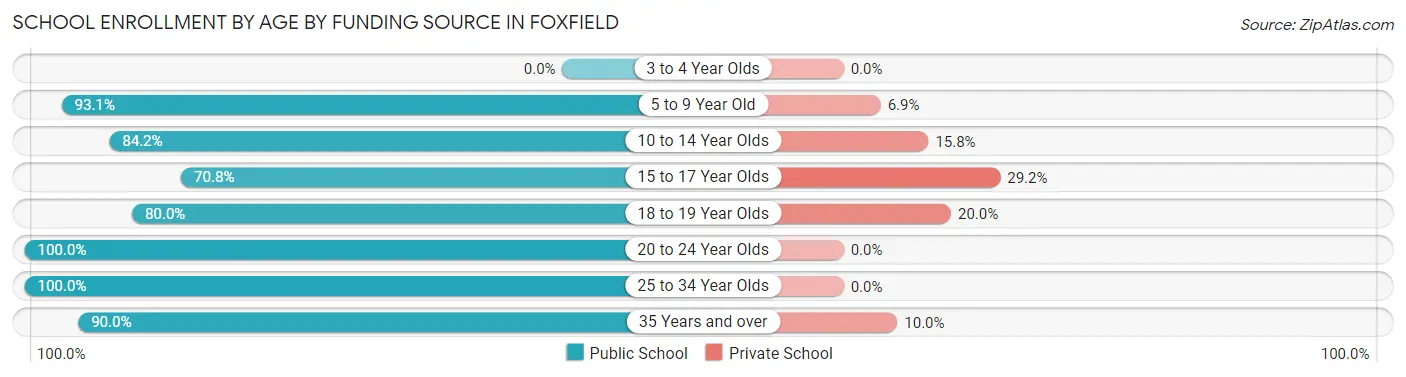
| Age Bracket | Public School | Private School |
| 3 to 4 Year Olds | 0 (0.0%) | 0 (0.0%) |
| 5 to 9 Year Old | 27 (93.1%) | 2 (6.9%) |
| 10 to 14 Year Olds | 32 (84.2%) | 6 (15.8%) |
| 15 to 17 Year Olds | 17 (70.8%) | 7 (29.2%) |
| 18 to 19 Year Olds | 8 (80.0%) | 2 (20.0%) |
| 20 to 24 Year Olds | 7 (100.0%) | 0 (0.0%) |
| 25 to 34 Year Olds | 2 (100.0%) | 0 (0.0%) |
| 35 Years and over | 9 (90.0%) | 1 (10.0%) |
| Total | 102 (85.0%) | 18 (15.0%) |
Educational Attainment by Field of Study in Foxfield
Business (77 | 21.8%), engineering (60 | 17.0%), education (37 | 10.5%), science & technology (36 | 10.2%), and bio, nature & agricultural (28 | 7.9%) are the most common fields of study among 353 individuals in Foxfield who have obtained a bachelor's degree or higher.
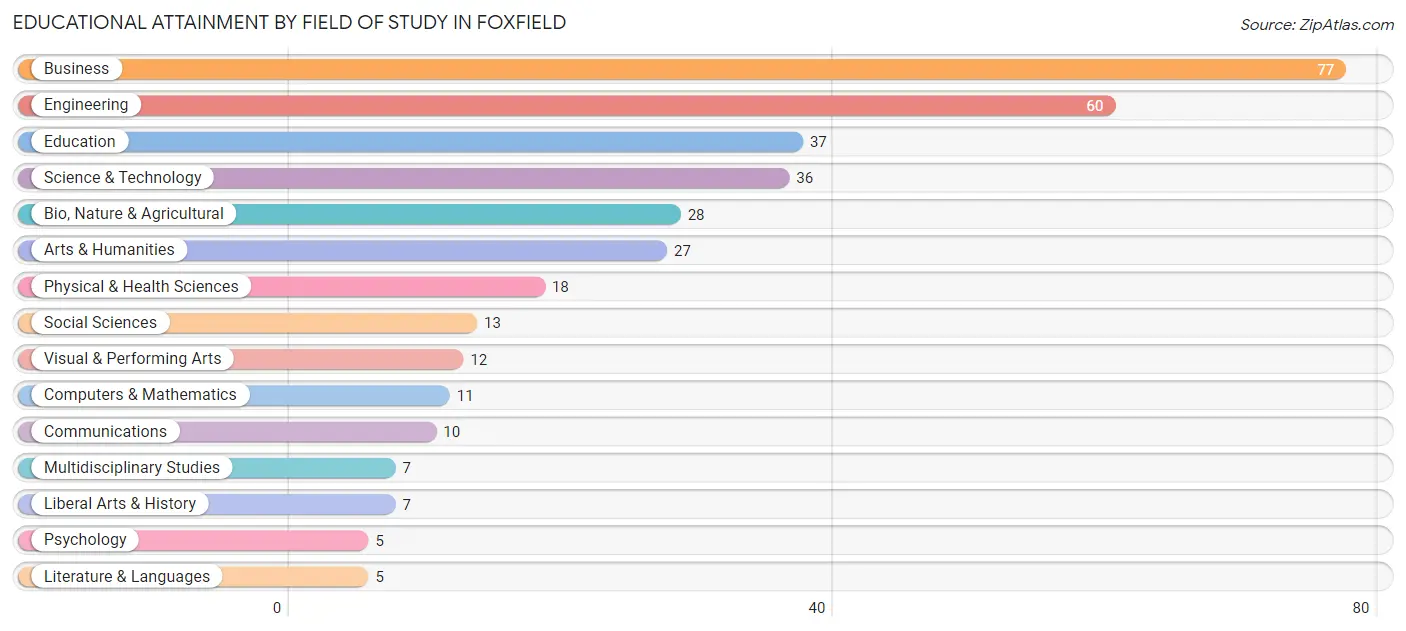
| Field of Study | # Graduates | % Graduates |
| Computers & Mathematics | 11 | 3.1% |
| Bio, Nature & Agricultural | 28 | 7.9% |
| Physical & Health Sciences | 18 | 5.1% |
| Psychology | 5 | 1.4% |
| Social Sciences | 13 | 3.7% |
| Engineering | 60 | 17.0% |
| Multidisciplinary Studies | 7 | 2.0% |
| Science & Technology | 36 | 10.2% |
| Business | 77 | 21.8% |
| Education | 37 | 10.5% |
| Literature & Languages | 5 | 1.4% |
| Liberal Arts & History | 7 | 2.0% |
| Visual & Performing Arts | 12 | 3.4% |
| Communications | 10 | 2.8% |
| Arts & Humanities | 27 | 7.6% |
| Total | 353 | 100.0% |
Transportation & Commute in Foxfield
Vehicle Availability by Sex in Foxfield
The most prevalent vehicle ownership categories in Foxfield are males with 3 vehicles (94, accounting for 47.0%) and females with 3 vehicles (52, making up 79.7%).
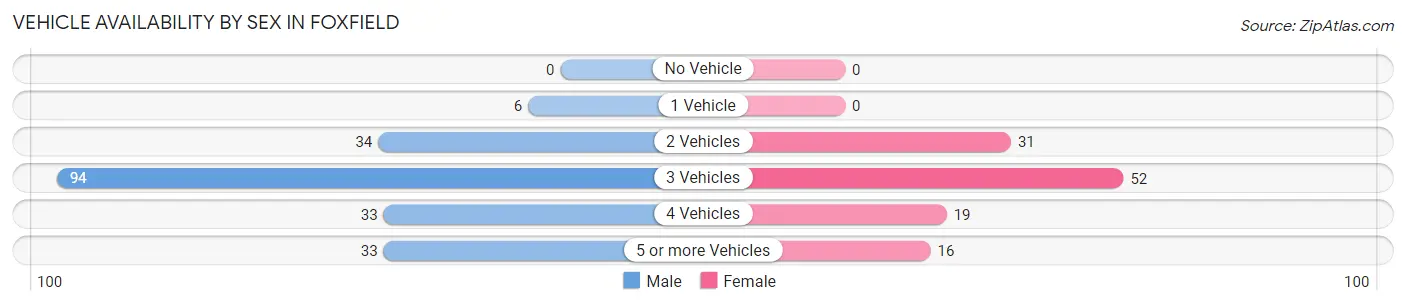
| Vehicles Available | Male | Female |
| No Vehicle | 0 (0.0%) | 0 (0.0%) |
| 1 Vehicle | 6 (3.0%) | 0 (0.0%) |
| 2 Vehicles | 34 (17.0%) | 31 (26.3%) |
| 3 Vehicles | 94 (47.0%) | 52 (44.1%) |
| 4 Vehicles | 33 (16.5%) | 19 (16.1%) |
| 5 or more Vehicles | 33 (16.5%) | 16 (13.6%) |
| Total | 200 (100.0%) | 118 (100.0%) |
Commute Time in Foxfield
The most frequently occuring commute durations in Foxfield are 30 to 34 minutes (68 commuters, 24.6%), 20 to 24 minutes (51 commuters, 18.5%), and 10 to 14 minutes (40 commuters, 14.5%).
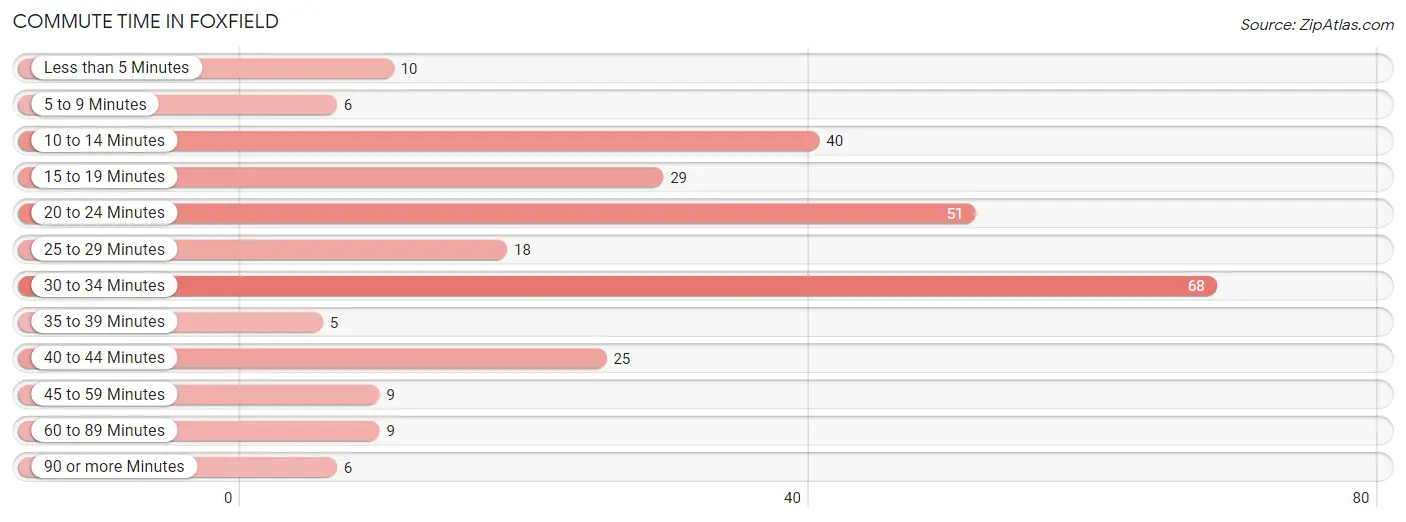
| Commute Time | # Commuters | % Commuters |
| Less than 5 Minutes | 10 | 3.6% |
| 5 to 9 Minutes | 6 | 2.2% |
| 10 to 14 Minutes | 40 | 14.5% |
| 15 to 19 Minutes | 29 | 10.5% |
| 20 to 24 Minutes | 51 | 18.5% |
| 25 to 29 Minutes | 18 | 6.5% |
| 30 to 34 Minutes | 68 | 24.6% |
| 35 to 39 Minutes | 5 | 1.8% |
| 40 to 44 Minutes | 25 | 9.1% |
| 45 to 59 Minutes | 9 | 3.3% |
| 60 to 89 Minutes | 9 | 3.3% |
| 90 or more Minutes | 6 | 2.2% |
Commute Time by Sex in Foxfield
The most common commute times in Foxfield are 30 to 34 minutes (49 commuters, 28.3%) for males and 30 to 34 minutes (19 commuters, 18.4%) for females.
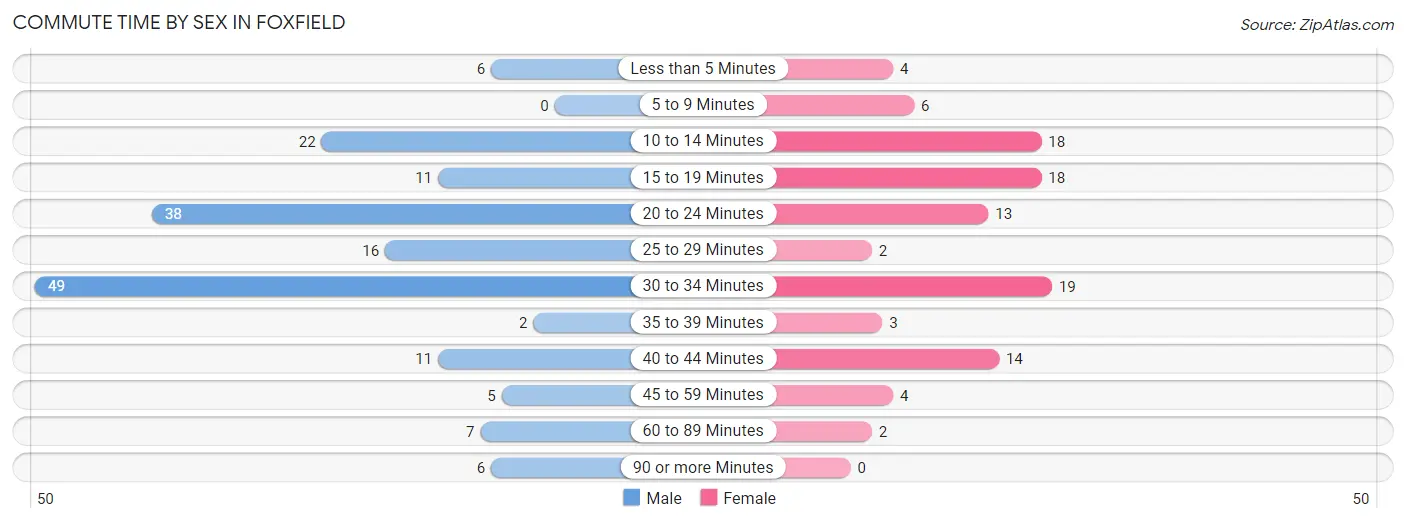
| Commute Time | Male | Female |
| Less than 5 Minutes | 6 (3.5%) | 4 (3.9%) |
| 5 to 9 Minutes | 0 (0.0%) | 6 (5.8%) |
| 10 to 14 Minutes | 22 (12.7%) | 18 (17.5%) |
| 15 to 19 Minutes | 11 (6.4%) | 18 (17.5%) |
| 20 to 24 Minutes | 38 (22.0%) | 13 (12.6%) |
| 25 to 29 Minutes | 16 (9.2%) | 2 (1.9%) |
| 30 to 34 Minutes | 49 (28.3%) | 19 (18.4%) |
| 35 to 39 Minutes | 2 (1.2%) | 3 (2.9%) |
| 40 to 44 Minutes | 11 (6.4%) | 14 (13.6%) |
| 45 to 59 Minutes | 5 (2.9%) | 4 (3.9%) |
| 60 to 89 Minutes | 7 (4.1%) | 2 (1.9%) |
| 90 or more Minutes | 6 (3.5%) | 0 (0.0%) |
Time of Departure to Work by Sex in Foxfield
The most frequent times of departure to work in Foxfield are 7:30 AM to 7:59 AM (38, 22.0%) for males and 6:00 AM to 6:29 AM (19, 18.4%) for females.
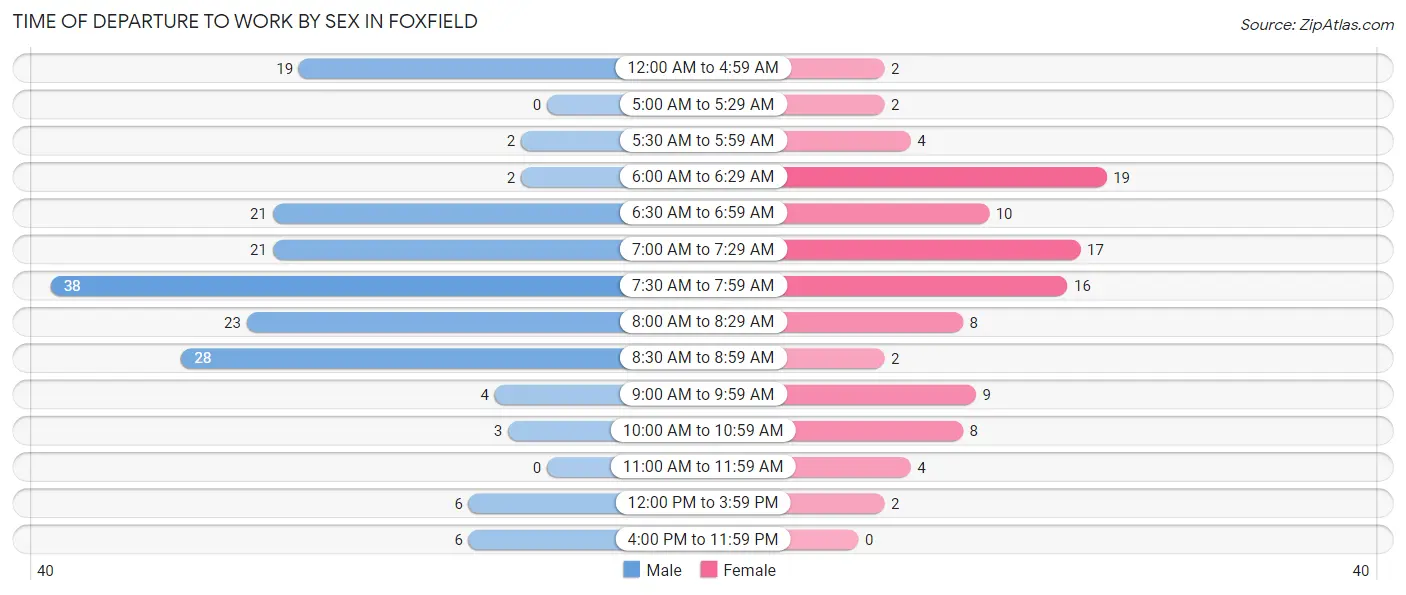
| Time of Departure | Male | Female |
| 12:00 AM to 4:59 AM | 19 (11.0%) | 2 (1.9%) |
| 5:00 AM to 5:29 AM | 0 (0.0%) | 2 (1.9%) |
| 5:30 AM to 5:59 AM | 2 (1.2%) | 4 (3.9%) |
| 6:00 AM to 6:29 AM | 2 (1.2%) | 19 (18.4%) |
| 6:30 AM to 6:59 AM | 21 (12.1%) | 10 (9.7%) |
| 7:00 AM to 7:29 AM | 21 (12.1%) | 17 (16.5%) |
| 7:30 AM to 7:59 AM | 38 (22.0%) | 16 (15.5%) |
| 8:00 AM to 8:29 AM | 23 (13.3%) | 8 (7.8%) |
| 8:30 AM to 8:59 AM | 28 (16.2%) | 2 (1.9%) |
| 9:00 AM to 9:59 AM | 4 (2.3%) | 9 (8.7%) |
| 10:00 AM to 10:59 AM | 3 (1.7%) | 8 (7.8%) |
| 11:00 AM to 11:59 AM | 0 (0.0%) | 4 (3.9%) |
| 12:00 PM to 3:59 PM | 6 (3.5%) | 2 (1.9%) |
| 4:00 PM to 11:59 PM | 6 (3.5%) | 0 (0.0%) |
| Total | 173 (100.0%) | 103 (100.0%) |
Housing Occupancy in Foxfield
Occupancy by Ownership in Foxfield
Of the total 275 dwellings in Foxfield, owner-occupied units account for 273 (99.3%), while renter-occupied units make up 2 (0.7%).
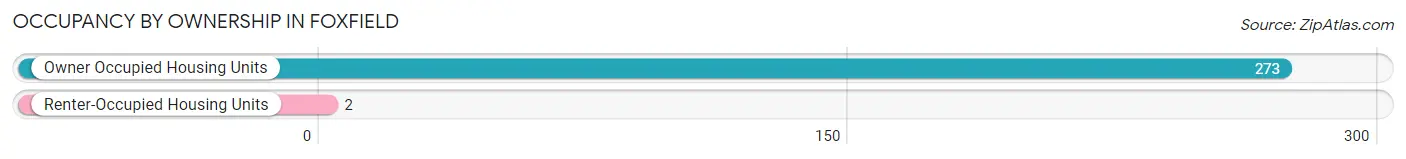
| Occupancy | # Housing Units | % Housing Units |
| Owner Occupied Housing Units | 273 | 99.3% |
| Renter-Occupied Housing Units | 2 | 0.7% |
| Total Occupied Housing Units | 275 | 100.0% |
Occupancy by Household Size in Foxfield
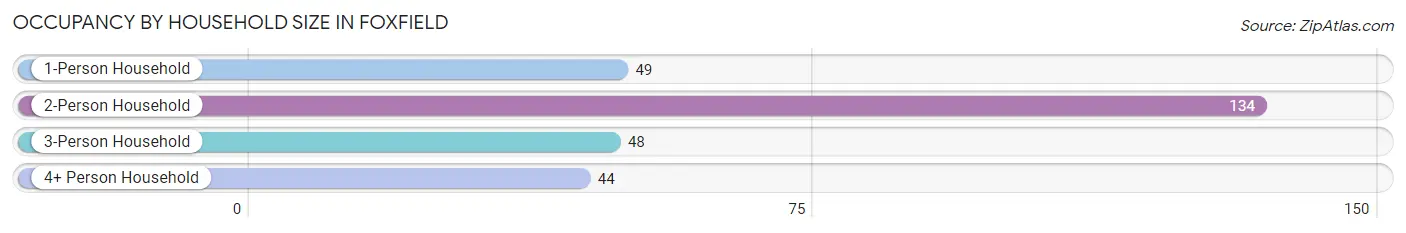
| Household Size | # Housing Units | % Housing Units |
| 1-Person Household | 49 | 17.8% |
| 2-Person Household | 134 | 48.7% |
| 3-Person Household | 48 | 17.4% |
| 4+ Person Household | 44 | 16.0% |
| Total Housing Units | 275 | 100.0% |
Occupancy by Ownership by Household Size in Foxfield
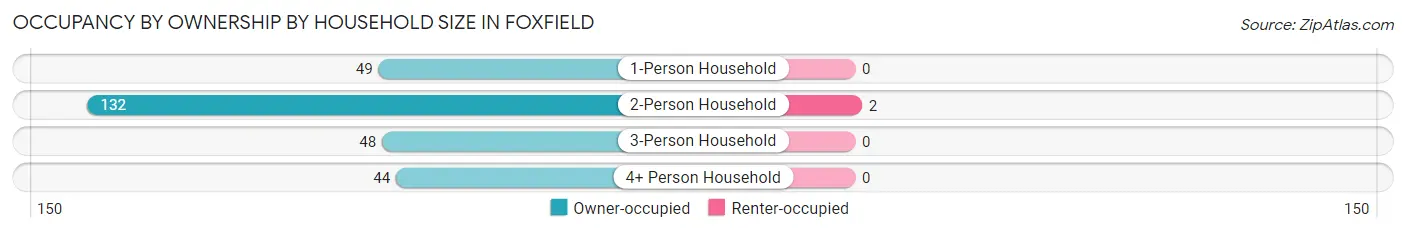
| Household Size | Owner-occupied | Renter-occupied |
| 1-Person Household | 49 (100.0%) | 0 (0.0%) |
| 2-Person Household | 132 (98.5%) | 2 (1.5%) |
| 3-Person Household | 48 (100.0%) | 0 (0.0%) |
| 4+ Person Household | 44 (100.0%) | 0 (0.0%) |
| Total Housing Units | 273 (99.3%) | 2 (0.7%) |
Occupancy by Educational Attainment in Foxfield
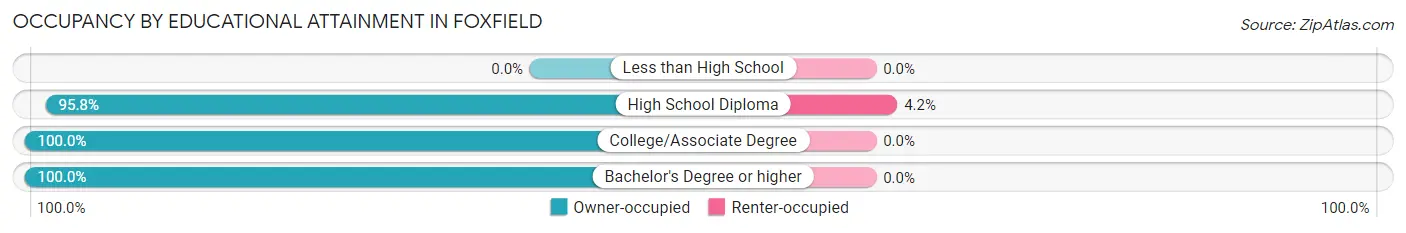
| Household Size | Owner-occupied | Renter-occupied |
| Less than High School | 0 (0.0%) | 0 (0.0%) |
| High School Diploma | 46 (95.8%) | 2 (4.2%) |
| College/Associate Degree | 64 (100.0%) | 0 (0.0%) |
| Bachelor's Degree or higher | 163 (100.0%) | 0 (0.0%) |
Occupancy by Age of Householder in Foxfield
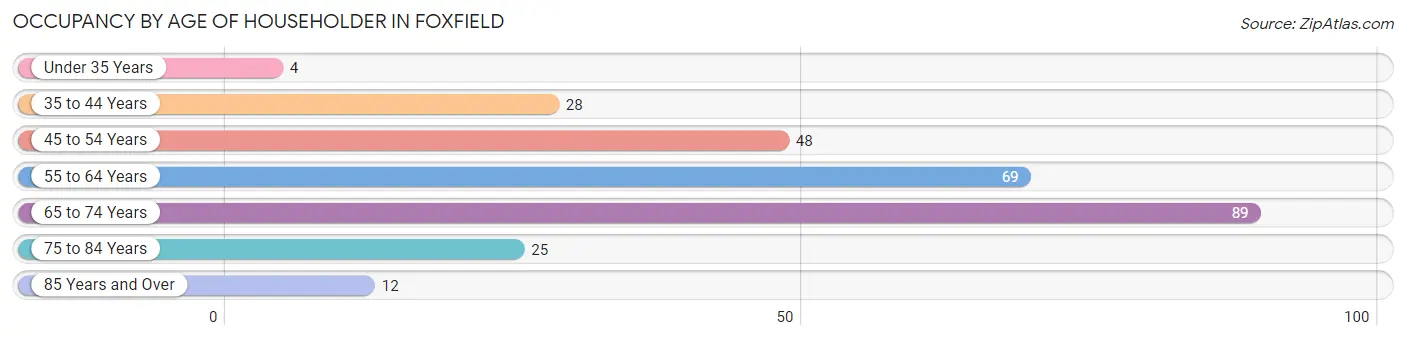
| Age Bracket | # Households | % Households |
| Under 35 Years | 4 | 1.5% |
| 35 to 44 Years | 28 | 10.2% |
| 45 to 54 Years | 48 | 17.4% |
| 55 to 64 Years | 69 | 25.1% |
| 65 to 74 Years | 89 | 32.4% |
| 75 to 84 Years | 25 | 9.1% |
| 85 Years and Over | 12 | 4.4% |
| Total | 275 | 100.0% |
Housing Finances in Foxfield
Median Income by Occupancy in Foxfield
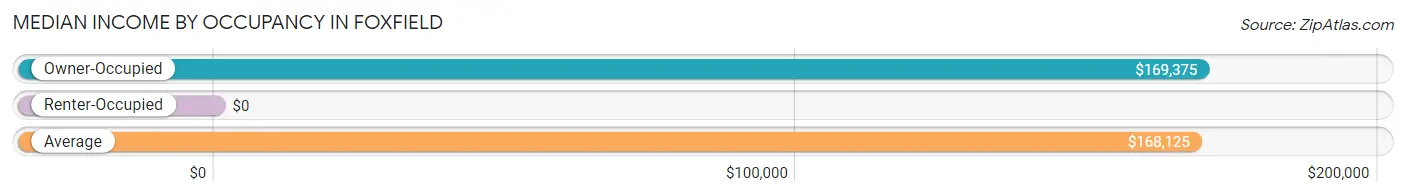
| Occupancy Type | # Households | Median Income |
| Owner-Occupied | 273 (99.3%) | $169,375 |
| Renter-Occupied | 2 (0.7%) | $0 |
| Average | 275 (100.0%) | $168,125 |
Occupancy by Householder Income Bracket in Foxfield
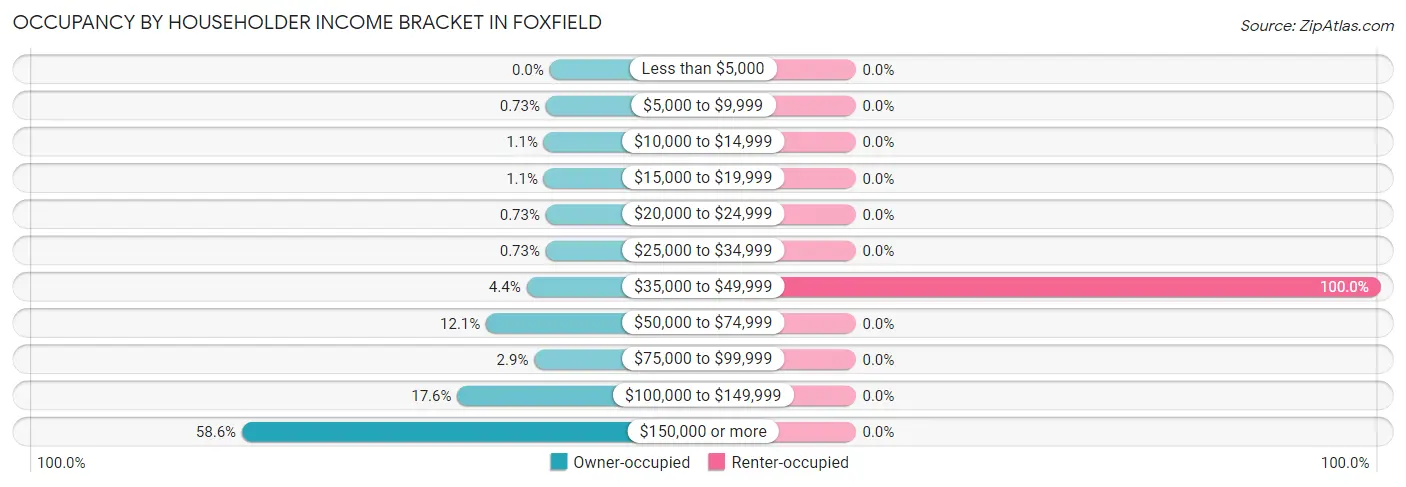
| Income Bracket | Owner-occupied | Renter-occupied |
| Less than $5,000 | 0 (0.0%) | 0 (0.0%) |
| $5,000 to $9,999 | 2 (0.7%) | 0 (0.0%) |
| $10,000 to $14,999 | 3 (1.1%) | 0 (0.0%) |
| $15,000 to $19,999 | 3 (1.1%) | 0 (0.0%) |
| $20,000 to $24,999 | 2 (0.7%) | 0 (0.0%) |
| $25,000 to $34,999 | 2 (0.7%) | 0 (0.0%) |
| $35,000 to $49,999 | 12 (4.4%) | 2 (100.0%) |
| $50,000 to $74,999 | 33 (12.1%) | 0 (0.0%) |
| $75,000 to $99,999 | 8 (2.9%) | 0 (0.0%) |
| $100,000 to $149,999 | 48 (17.6%) | 0 (0.0%) |
| $150,000 or more | 160 (58.6%) | 0 (0.0%) |
| Total | 273 (100.0%) | 2 (100.0%) |
Monthly Housing Cost Tiers in Foxfield
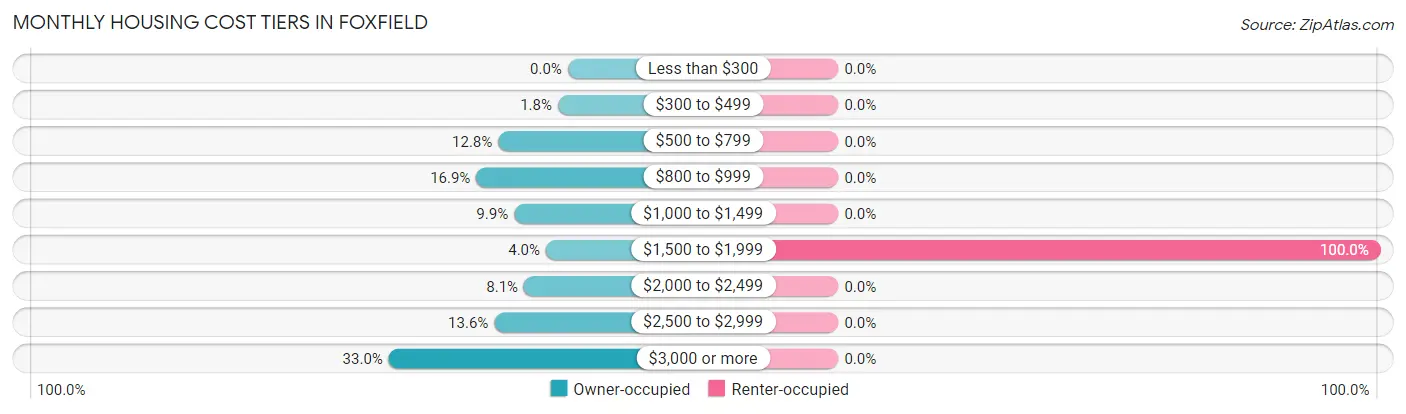
| Monthly Cost | Owner-occupied | Renter-occupied |
| Less than $300 | 0 (0.0%) | 0 (0.0%) |
| $300 to $499 | 5 (1.8%) | 0 (0.0%) |
| $500 to $799 | 35 (12.8%) | 0 (0.0%) |
| $800 to $999 | 46 (16.9%) | 0 (0.0%) |
| $1,000 to $1,499 | 27 (9.9%) | 0 (0.0%) |
| $1,500 to $1,999 | 11 (4.0%) | 2 (100.0%) |
| $2,000 to $2,499 | 22 (8.1%) | 0 (0.0%) |
| $2,500 to $2,999 | 37 (13.6%) | 0 (0.0%) |
| $3,000 or more | 90 (33.0%) | 0 (0.0%) |
| Total | 273 (100.0%) | 2 (100.0%) |
Physical Housing Characteristics in Foxfield
Housing Structures in Foxfield
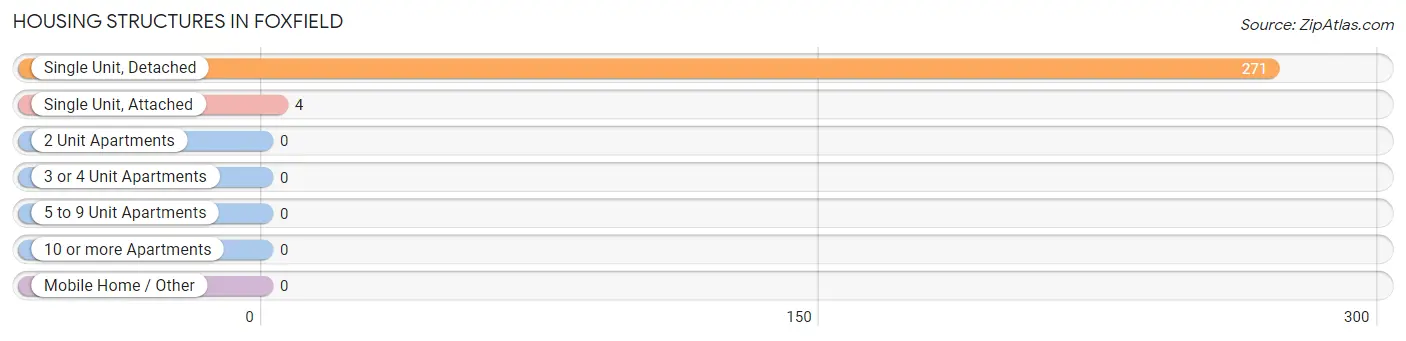
| Structure Type | # Housing Units | % Housing Units |
| Single Unit, Detached | 271 | 98.6% |
| Single Unit, Attached | 4 | 1.5% |
| 2 Unit Apartments | 0 | 0.0% |
| 3 or 4 Unit Apartments | 0 | 0.0% |
| 5 to 9 Unit Apartments | 0 | 0.0% |
| 10 or more Apartments | 0 | 0.0% |
| Mobile Home / Other | 0 | 0.0% |
| Total | 275 | 100.0% |
Housing Structures by Occupancy in Foxfield
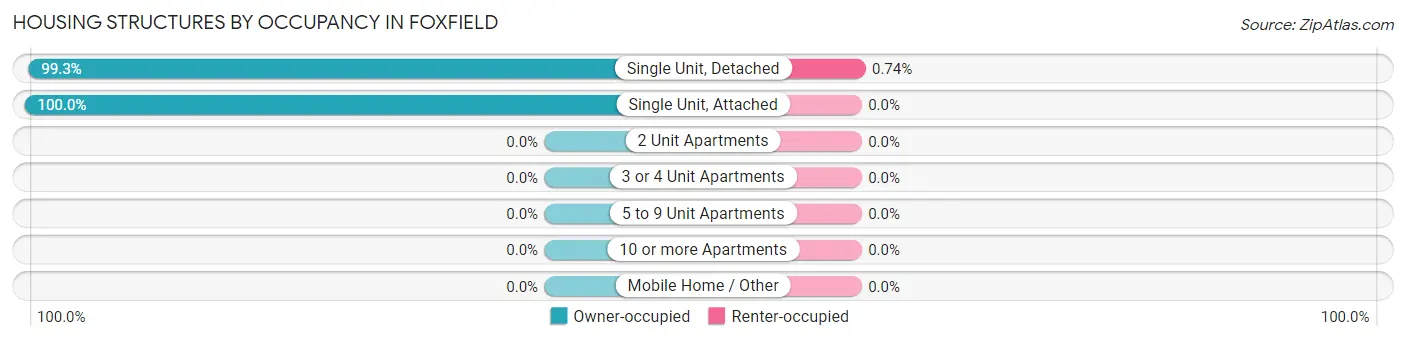
| Structure Type | Owner-occupied | Renter-occupied |
| Single Unit, Detached | 269 (99.3%) | 2 (0.7%) |
| Single Unit, Attached | 4 (100.0%) | 0 (0.0%) |
| 2 Unit Apartments | 0 (0.0%) | 0 (0.0%) |
| 3 or 4 Unit Apartments | 0 (0.0%) | 0 (0.0%) |
| 5 to 9 Unit Apartments | 0 (0.0%) | 0 (0.0%) |
| 10 or more Apartments | 0 (0.0%) | 0 (0.0%) |
| Mobile Home / Other | 0 (0.0%) | 0 (0.0%) |
| Total | 273 (99.3%) | 2 (0.7%) |
Housing Structures by Number of Rooms in Foxfield
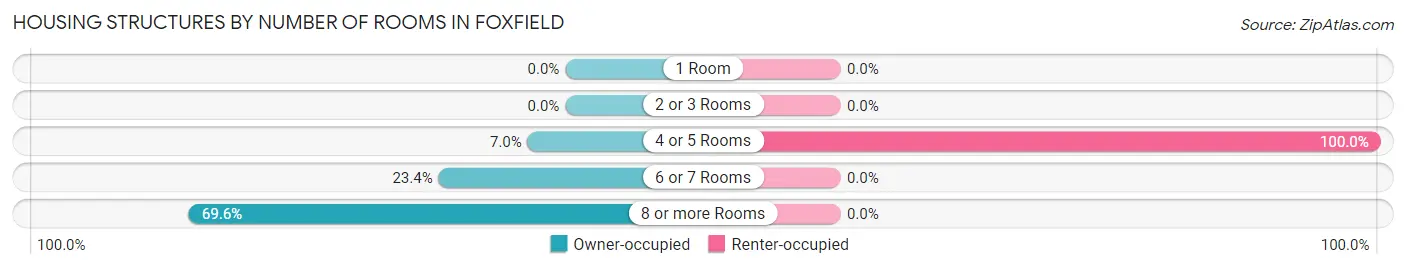
| Number of Rooms | Owner-occupied | Renter-occupied |
| 1 Room | 0 (0.0%) | 0 (0.0%) |
| 2 or 3 Rooms | 0 (0.0%) | 0 (0.0%) |
| 4 or 5 Rooms | 19 (7.0%) | 2 (100.0%) |
| 6 or 7 Rooms | 64 (23.4%) | 0 (0.0%) |
| 8 or more Rooms | 190 (69.6%) | 0 (0.0%) |
| Total | 273 (100.0%) | 2 (100.0%) |
Housing Structure by Heating Type in Foxfield
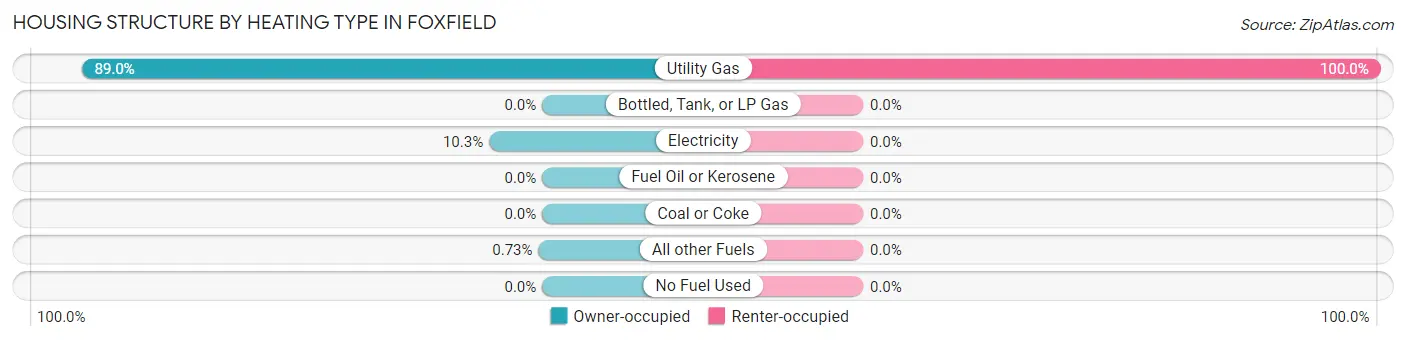
| Heating Type | Owner-occupied | Renter-occupied |
| Utility Gas | 243 (89.0%) | 2 (100.0%) |
| Bottled, Tank, or LP Gas | 0 (0.0%) | 0 (0.0%) |
| Electricity | 28 (10.3%) | 0 (0.0%) |
| Fuel Oil or Kerosene | 0 (0.0%) | 0 (0.0%) |
| Coal or Coke | 0 (0.0%) | 0 (0.0%) |
| All other Fuels | 2 (0.7%) | 0 (0.0%) |
| No Fuel Used | 0 (0.0%) | 0 (0.0%) |
| Total | 273 (100.0%) | 2 (100.0%) |
Household Vehicle Usage in Foxfield
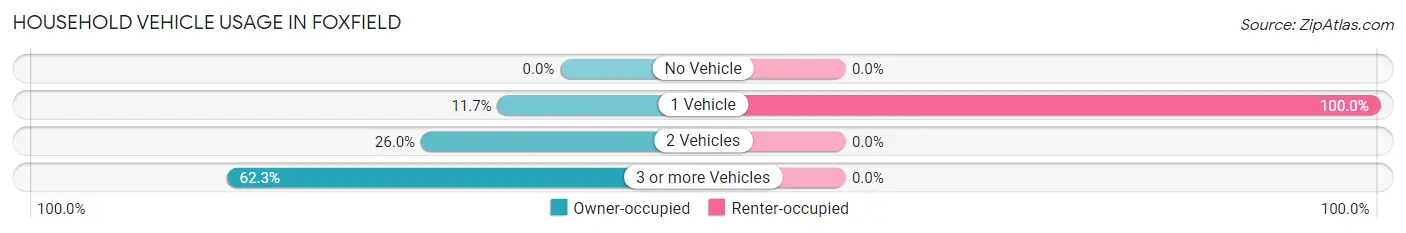
| Vehicles per Household | Owner-occupied | Renter-occupied |
| No Vehicle | 0 (0.0%) | 0 (0.0%) |
| 1 Vehicle | 32 (11.7%) | 2 (100.0%) |
| 2 Vehicles | 71 (26.0%) | 0 (0.0%) |
| 3 or more Vehicles | 170 (62.3%) | 0 (0.0%) |
| Total | 273 (100.0%) | 2 (100.0%) |
Real Estate & Mortgages in Foxfield
Real Estate and Mortgage Overview in Foxfield
| Characteristic | Without Mortgage | With Mortgage |
| Housing Units | 116 | 157 |
| Median Property Value | $914,500 | $936,300 |
| Median Household Income | $141,667 | $103 |
| Monthly Housing Costs | $890 | $87 |
| Real Estate Taxes | $3,978 | $0 |
Property Value by Mortgage Status in Foxfield
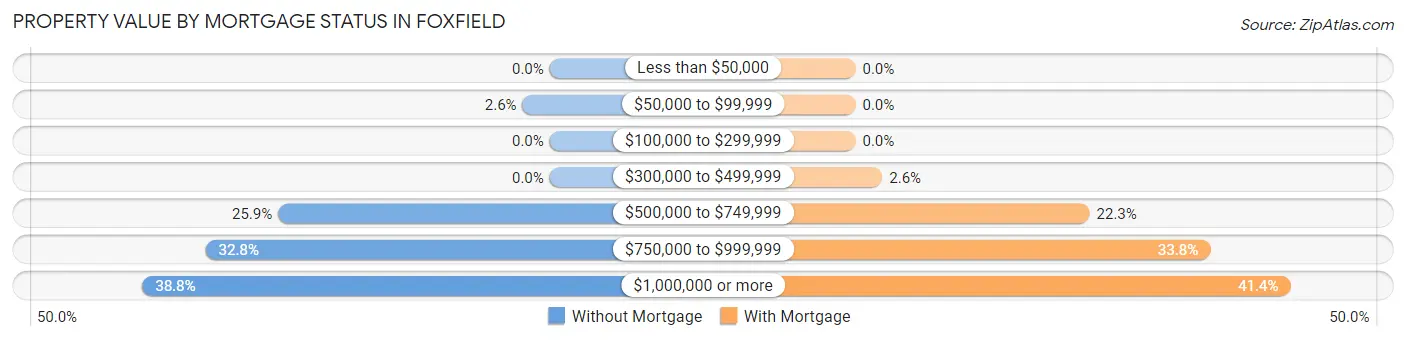
| Property Value | Without Mortgage | With Mortgage |
| Less than $50,000 | 0 (0.0%) | 0 (0.0%) |
| $50,000 to $99,999 | 3 (2.6%) | 0 (0.0%) |
| $100,000 to $299,999 | 0 (0.0%) | 0 (0.0%) |
| $300,000 to $499,999 | 0 (0.0%) | 4 (2.5%) |
| $500,000 to $749,999 | 30 (25.9%) | 35 (22.3%) |
| $750,000 to $999,999 | 38 (32.8%) | 53 (33.8%) |
| $1,000,000 or more | 45 (38.8%) | 65 (41.4%) |
| Total | 116 (100.0%) | 157 (100.0%) |
Household Income by Mortgage Status in Foxfield
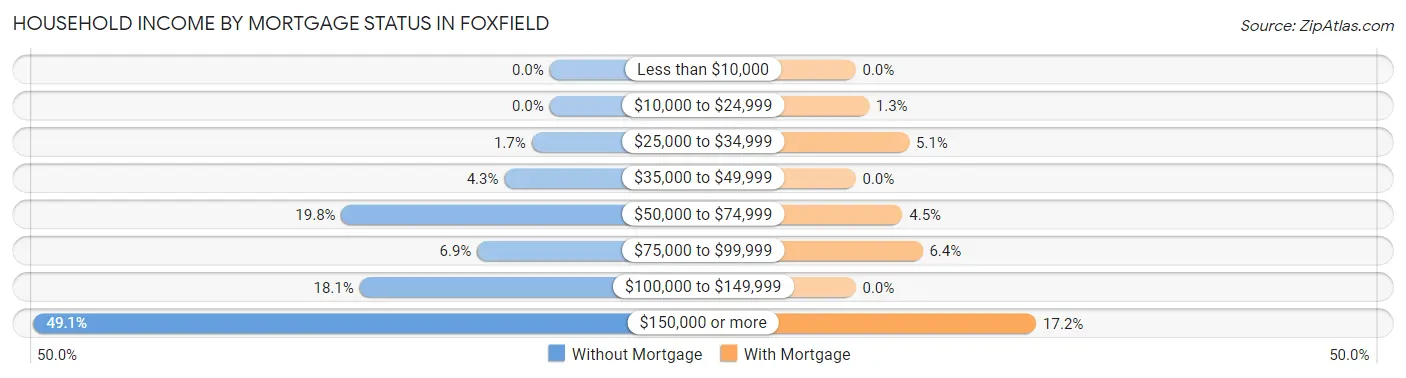
| Household Income | Without Mortgage | With Mortgage |
| Less than $10,000 | 0 (0.0%) | 0 (0.0%) |
| $10,000 to $24,999 | 0 (0.0%) | 2 (1.3%) |
| $25,000 to $34,999 | 2 (1.7%) | 8 (5.1%) |
| $35,000 to $49,999 | 5 (4.3%) | 0 (0.0%) |
| $50,000 to $74,999 | 23 (19.8%) | 7 (4.5%) |
| $75,000 to $99,999 | 8 (6.9%) | 10 (6.4%) |
| $100,000 to $149,999 | 21 (18.1%) | 0 (0.0%) |
| $150,000 or more | 57 (49.1%) | 27 (17.2%) |
| Total | 116 (100.0%) | 157 (100.0%) |
Property Value to Household Income Ratio in Foxfield
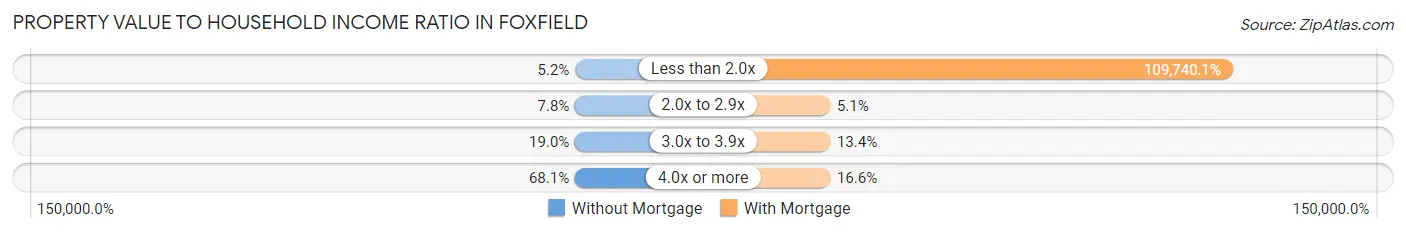
| Value-to-Income Ratio | Without Mortgage | With Mortgage |
| Less than 2.0x | 6 (5.2%) | 172,292 (109,740.1%) |
| 2.0x to 2.9x | 9 (7.8%) | 8 (5.1%) |
| 3.0x to 3.9x | 22 (19.0%) | 21 (13.4%) |
| 4.0x or more | 79 (68.1%) | 26 (16.6%) |
| Total | 116 (100.0%) | 157 (100.0%) |
Real Estate Taxes by Mortgage Status in Foxfield
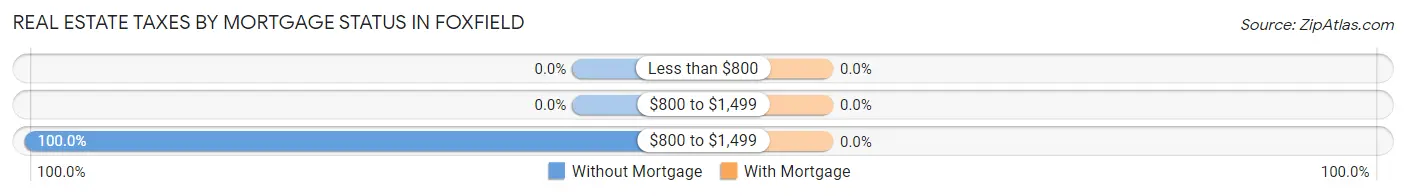
| Property Taxes | Without Mortgage | With Mortgage |
| Less than $800 | 0 (0.0%) | 0 (0.0%) |
| $800 to $1,499 | 0 (0.0%) | 0 (0.0%) |
| $800 to $1,499 | 116 (100.0%) | 0 (0.0%) |
| Total | 116 (100.0%) | 157 (100.0%) |
Health & Disability in Foxfield
Health Insurance Coverage by Age in Foxfield
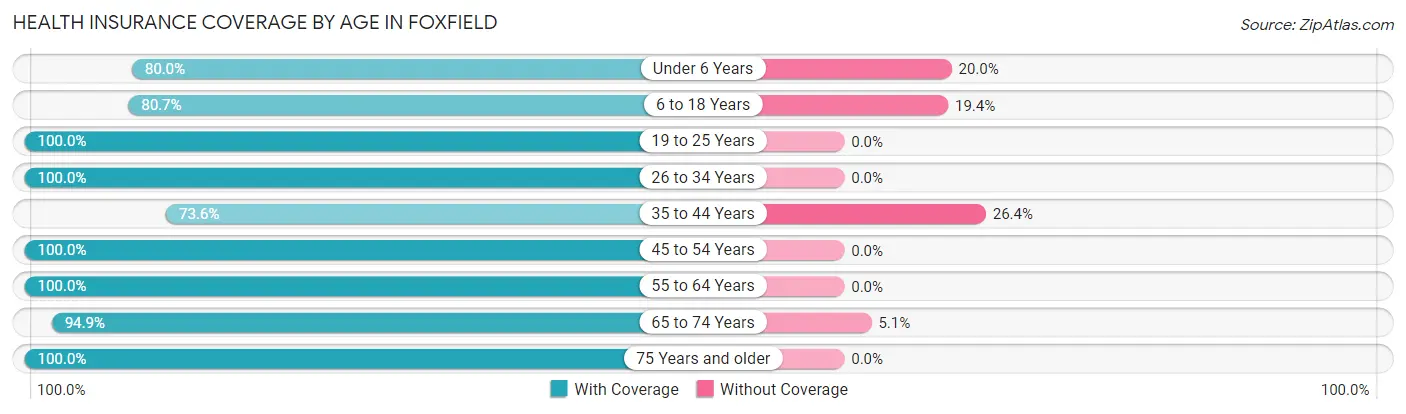
| Age Bracket | With Coverage | Without Coverage |
| Under 6 Years | 8 (80.0%) | 2 (20.0%) |
| 6 to 18 Years | 75 (80.6%) | 18 (19.4%) |
| 19 to 25 Years | 20 (100.0%) | 0 (0.0%) |
| 26 to 34 Years | 27 (100.0%) | 0 (0.0%) |
| 35 to 44 Years | 53 (73.6%) | 19 (26.4%) |
| 45 to 54 Years | 92 (100.0%) | 0 (0.0%) |
| 55 to 64 Years | 125 (100.0%) | 0 (0.0%) |
| 65 to 74 Years | 150 (94.9%) | 8 (5.1%) |
| 75 Years and older | 69 (100.0%) | 0 (0.0%) |
| Total | 619 (92.9%) | 47 (7.1%) |
Health Insurance Coverage by Citizenship Status in Foxfield
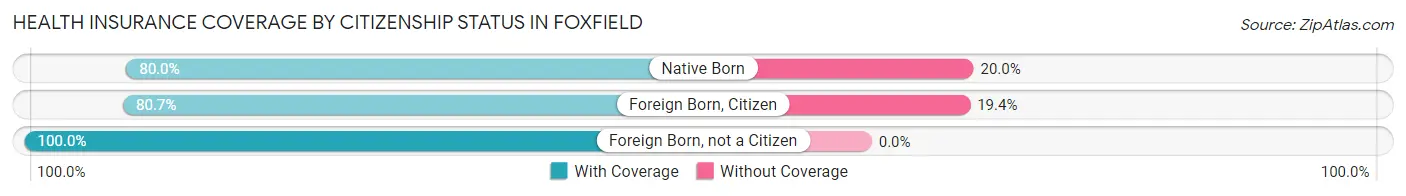
| Citizenship Status | With Coverage | Without Coverage |
| Native Born | 8 (80.0%) | 2 (20.0%) |
| Foreign Born, Citizen | 75 (80.6%) | 18 (19.4%) |
| Foreign Born, not a Citizen | 20 (100.0%) | 0 (0.0%) |
Health Insurance Coverage by Household Income in Foxfield
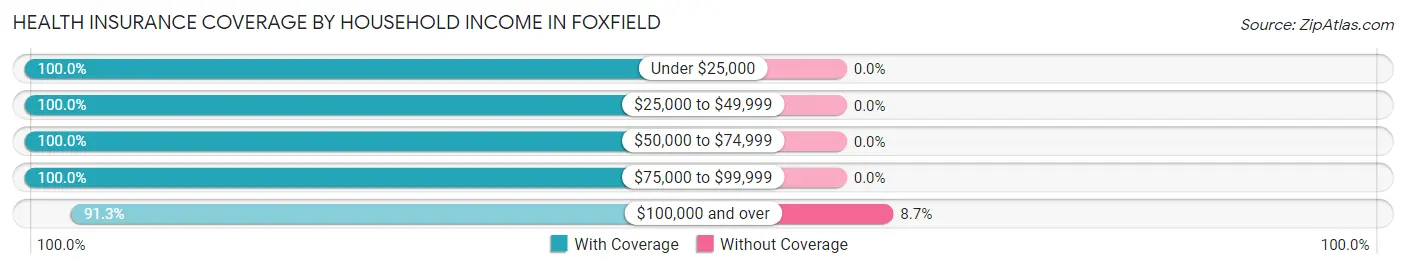
| Household Income | With Coverage | Without Coverage |
| Under $25,000 | 22 (100.0%) | 0 (0.0%) |
| $25,000 to $49,999 | 27 (100.0%) | 0 (0.0%) |
| $50,000 to $74,999 | 56 (100.0%) | 0 (0.0%) |
| $75,000 to $99,999 | 19 (100.0%) | 0 (0.0%) |
| $100,000 and over | 481 (91.3%) | 46 (8.7%) |
Public vs Private Health Insurance Coverage by Age in Foxfield
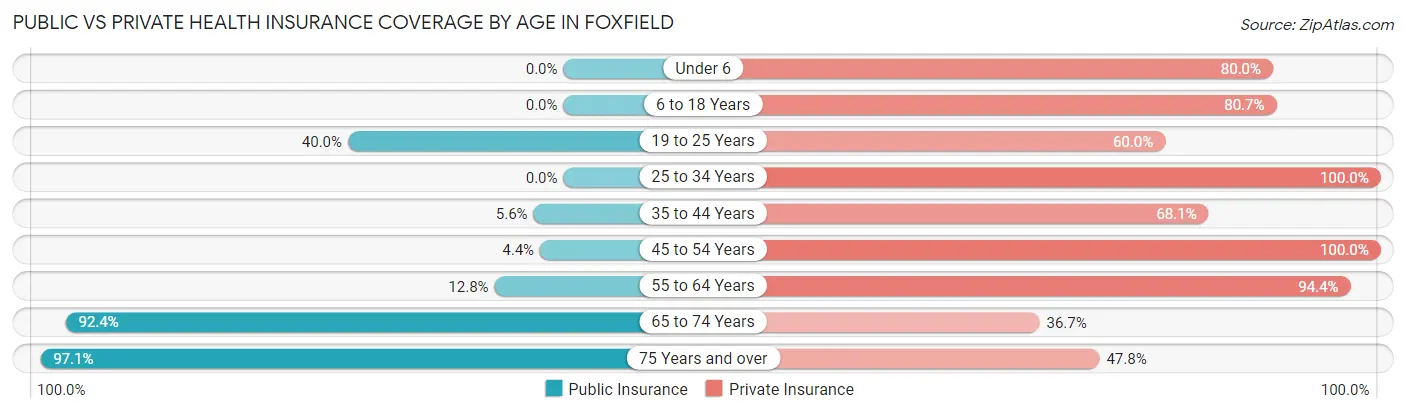
| Age Bracket | Public Insurance | Private Insurance |
| Under 6 | 0 (0.0%) | 8 (80.0%) |
| 6 to 18 Years | 0 (0.0%) | 75 (80.6%) |
| 19 to 25 Years | 8 (40.0%) | 12 (60.0%) |
| 25 to 34 Years | 0 (0.0%) | 27 (100.0%) |
| 35 to 44 Years | 4 (5.6%) | 49 (68.1%) |
| 45 to 54 Years | 4 (4.3%) | 92 (100.0%) |
| 55 to 64 Years | 16 (12.8%) | 118 (94.4%) |
| 65 to 74 Years | 146 (92.4%) | 58 (36.7%) |
| 75 Years and over | 67 (97.1%) | 33 (47.8%) |
| Total | 245 (36.8%) | 472 (70.9%) |
Disability Status by Sex by Age in Foxfield
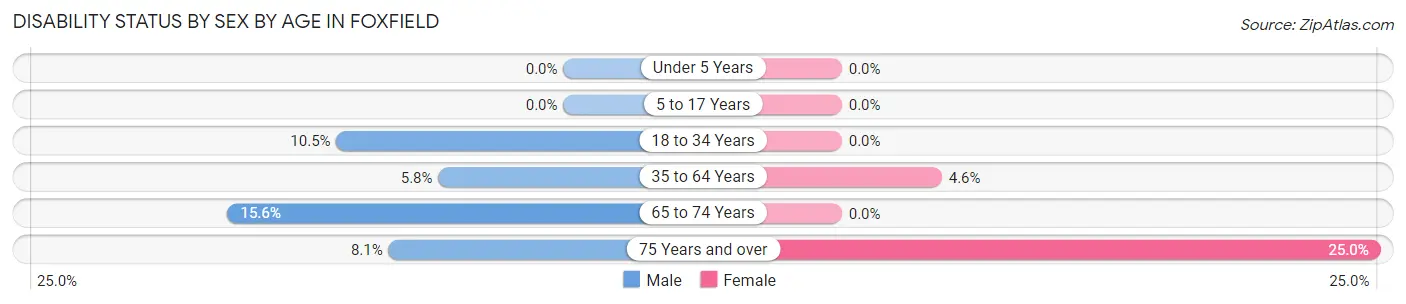
| Age Bracket | Male | Female |
| Under 5 Years | 0 (0.0%) | 0 (0.0%) |
| 5 to 17 Years | 0 (0.0%) | 0 (0.0%) |
| 18 to 34 Years | 4 (10.5%) | 0 (0.0%) |
| 35 to 64 Years | 8 (5.8%) | 7 (4.6%) |
| 65 to 74 Years | 12 (15.6%) | 0 (0.0%) |
| 75 Years and over | 3 (8.1%) | 8 (25.0%) |
Disability Class by Sex by Age in Foxfield
Disability Class: Hearing Difficulty
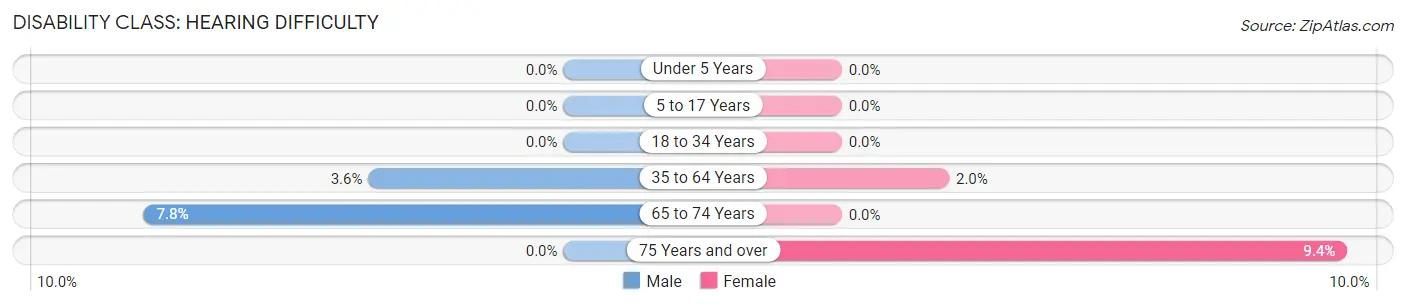
| Age Bracket | Male | Female |
| Under 5 Years | 0 (0.0%) | 0 (0.0%) |
| 5 to 17 Years | 0 (0.0%) | 0 (0.0%) |
| 18 to 34 Years | 0 (0.0%) | 0 (0.0%) |
| 35 to 64 Years | 5 (3.6%) | 3 (2.0%) |
| 65 to 74 Years | 6 (7.8%) | 0 (0.0%) |
| 75 Years and over | 0 (0.0%) | 3 (9.4%) |
Disability Class: Vision Difficulty
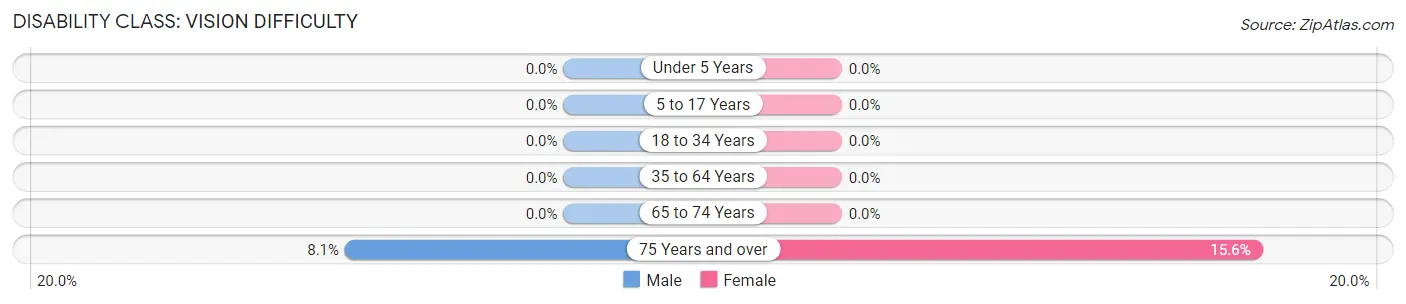
| Age Bracket | Male | Female |
| Under 5 Years | 0 (0.0%) | 0 (0.0%) |
| 5 to 17 Years | 0 (0.0%) | 0 (0.0%) |
| 18 to 34 Years | 0 (0.0%) | 0 (0.0%) |
| 35 to 64 Years | 0 (0.0%) | 0 (0.0%) |
| 65 to 74 Years | 0 (0.0%) | 0 (0.0%) |
| 75 Years and over | 3 (8.1%) | 5 (15.6%) |
Disability Class: Cognitive Difficulty
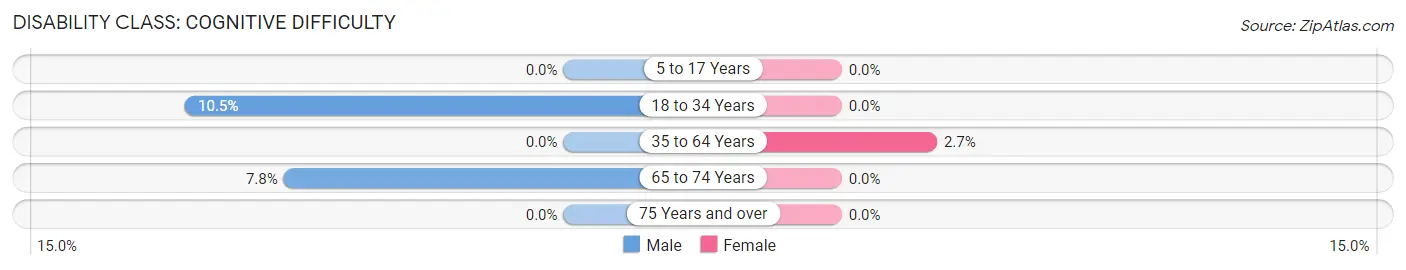
| Age Bracket | Male | Female |
| 5 to 17 Years | 0 (0.0%) | 0 (0.0%) |
| 18 to 34 Years | 4 (10.5%) | 0 (0.0%) |
| 35 to 64 Years | 0 (0.0%) | 4 (2.6%) |
| 65 to 74 Years | 6 (7.8%) | 0 (0.0%) |
| 75 Years and over | 0 (0.0%) | 0 (0.0%) |
Disability Class: Ambulatory Difficulty
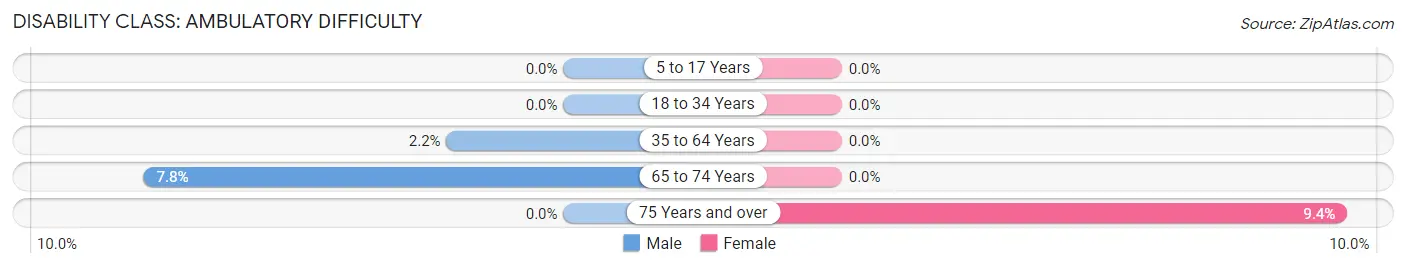
| Age Bracket | Male | Female |
| 5 to 17 Years | 0 (0.0%) | 0 (0.0%) |
| 18 to 34 Years | 0 (0.0%) | 0 (0.0%) |
| 35 to 64 Years | 3 (2.2%) | 0 (0.0%) |
| 65 to 74 Years | 6 (7.8%) | 0 (0.0%) |
| 75 Years and over | 0 (0.0%) | 3 (9.4%) |
Disability Class: Self-Care Difficulty
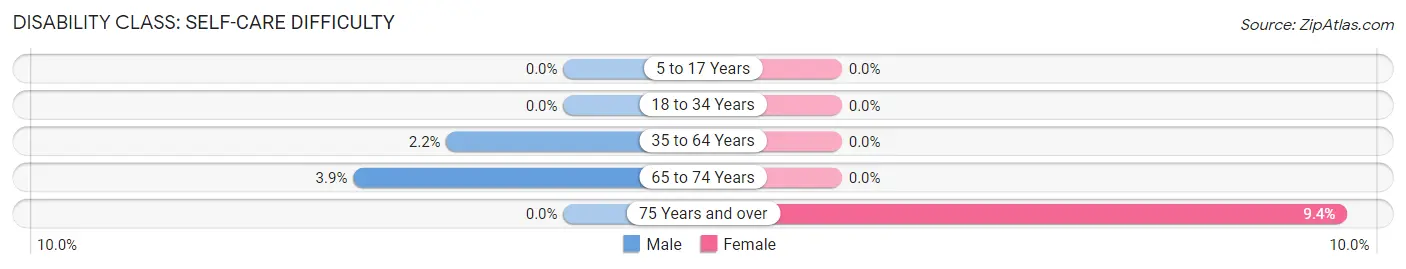
| Age Bracket | Male | Female |
| 5 to 17 Years | 0 (0.0%) | 0 (0.0%) |
| 18 to 34 Years | 0 (0.0%) | 0 (0.0%) |
| 35 to 64 Years | 3 (2.2%) | 0 (0.0%) |
| 65 to 74 Years | 3 (3.9%) | 0 (0.0%) |
| 75 Years and over | 0 (0.0%) | 3 (9.4%) |
Technology Access in Foxfield
Computing Device Access in Foxfield
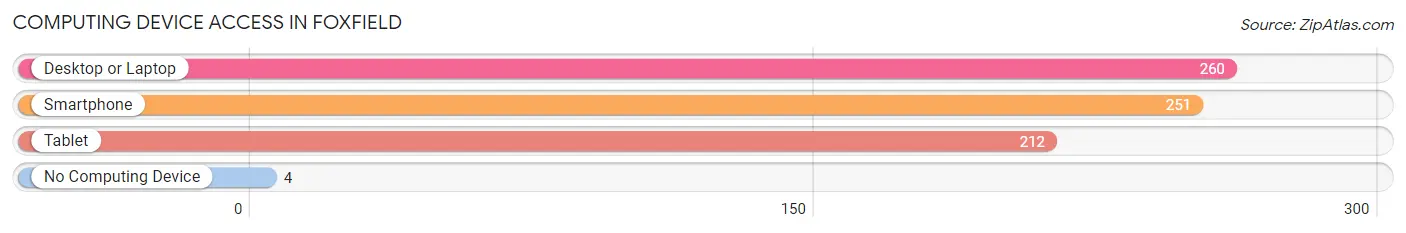
| Device Type | # Households | % Households |
| Desktop or Laptop | 260 | 94.6% |
| Smartphone | 251 | 91.3% |
| Tablet | 212 | 77.1% |
| No Computing Device | 4 | 1.5% |
| Total | 275 | 100.0% |
Internet Access in Foxfield
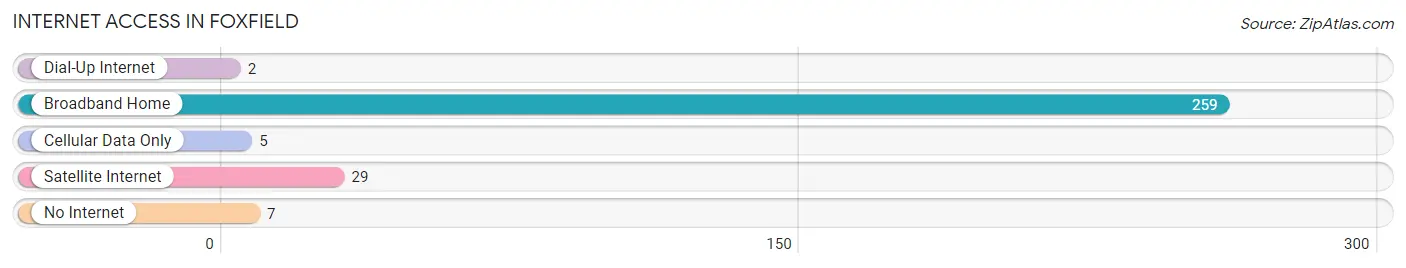
| Internet Type | # Households | % Households |
| Dial-Up Internet | 2 | 0.7% |
| Broadband Home | 259 | 94.2% |
| Cellular Data Only | 5 | 1.8% |
| Satellite Internet | 29 | 10.5% |
| No Internet | 7 | 2.5% |
| Total | 275 | 100.0% |
Foxfield Summary
Foxfield is a small town located in Douglas County, Colorado, United States. It is situated in the foothills of the Rocky Mountains, approximately 20 miles south of Denver. The town was founded in 1872 and has a population of approximately 1,500 people.
History
Foxfield was founded in 1872 by a group of settlers from the Midwest. The town was named after a nearby fox den, and the settlers chose the area because of its proximity to Denver and the Rocky Mountains. The town was originally a farming community, but it soon became a popular destination for tourists and outdoor enthusiasts.
In the early 1900s, Foxfield began to grow and develop. The town was incorporated in 1909 and the first mayor was elected in 1910. The town was home to a variety of businesses, including a general store, a blacksmith, a livery stable, and a hotel.
In the 1950s, Foxfield began to experience a population boom. The town was home to a variety of industries, including a sawmill, a dairy, and a brickyard. The town also had a variety of recreational activities, including a golf course, a ski resort, and a rodeo.
Geography
Foxfield is located in the foothills of the Rocky Mountains, approximately 20 miles south of Denver. The town is situated at an elevation of 6,000 feet and is surrounded by rolling hills and open meadows. The town is located in a semi-arid climate, with hot summers and cold winters.
The town is home to a variety of wildlife, including deer, elk, coyotes, and foxes. The nearby mountains are home to a variety of birds, including hawks, eagles, and owls.
Economy
Foxfield is a small town with a limited economy. The town is home to a variety of small businesses, including a general store, a hardware store, and a restaurant. The town is also home to a variety of recreational activities, including a golf course, a ski resort, and a rodeo.
The town is also home to a variety of agricultural businesses, including a dairy, a winery, and a farm. The town is also home to a variety of manufacturing businesses, including a sawmill and a brickyard.
Demographics
As of the 2010 census, Foxfield had a population of 1,500 people. The town is predominantly white, with approximately 90% of the population being Caucasian. The town is also home to a variety of other ethnicities, including African American, Hispanic, and Asian.
The median household income in Foxfield is approximately $50,000, and the median home value is approximately $200,000. The town has a low unemployment rate, and the majority of the population is employed in the service industry.
Conclusion
Foxfield is a small town located in Douglas County, Colorado, United States. It is situated in the foothills of the Rocky Mountains, approximately 20 miles south of Denver. The town was founded in 1872 and has a population of approximately 1,500 people. Foxfield is a small town with a limited economy, but it is home to a variety of businesses, recreational activities, and agricultural businesses. The town is predominantly white, with approximately 90% of the population being Caucasian. The median household income in Foxfield is approximately $50,000, and the median home value is approximately $200,000.
Common Questions
What is the Total Population of Foxfield?
Total Population of Foxfield is 673.
What is the Total Male Population of Foxfield?
Total Male Population of Foxfield is 352.
What is the Total Female Population of Foxfield?
Total Female Population of Foxfield is 321.
What is the Ratio of Males per 100 Females in Foxfield?
There are 109.66 Males per 100 Females in Foxfield.
What is the Ratio of Females per 100 Males in Foxfield?
There are 91.19 Females per 100 Males in Foxfield.
What is the Median Population Age in Foxfield?
Median Population Age in Foxfield is 57.5 Years.
What is the Average Family Size in Foxfield
Average Family Size in Foxfield is 2.6 People.
What is the Average Household Size in Foxfield
Average Household Size in Foxfield is 2.4 People.
What is Per Capita Income in Foxfield?
Per Capita income in Foxfield is $83,677.
What is the Median Family Income in Foxfield?
Median Family Income in Foxfield is $172,083.
What is the Median Household income in Foxfield?
Median Household Income in Foxfield is $168,125.
What is Income or Wage Gap in Foxfield?
Income or Wage Gap in Foxfield is 35.3%.
Women in Foxfield earn 64.7 cents for every dollar earned by a man.
What is Inequality or Gini Index in Foxfield?
Inequality or Gini Index in Foxfield is 0.40.
How Large is the Labor Force in Foxfield?
There are 345 People in the Labor Forcein in Foxfield.
What is the Percentage of People in the Labor Force in Foxfield?
58.2% of People are in the Labor Force in Foxfield.
What is the Unemployment Rate in Foxfield?
Unemployment Rate in Foxfield is 3.2%.