Zip Codes with the Highest Percentage of Population Employed in Mining, Quarrying, & Extraction in Woodland, CA
RELATED REPORTS & OPTIONS
Mining, Quarrying, & Extraction
Woodland
Compare Zip Codes
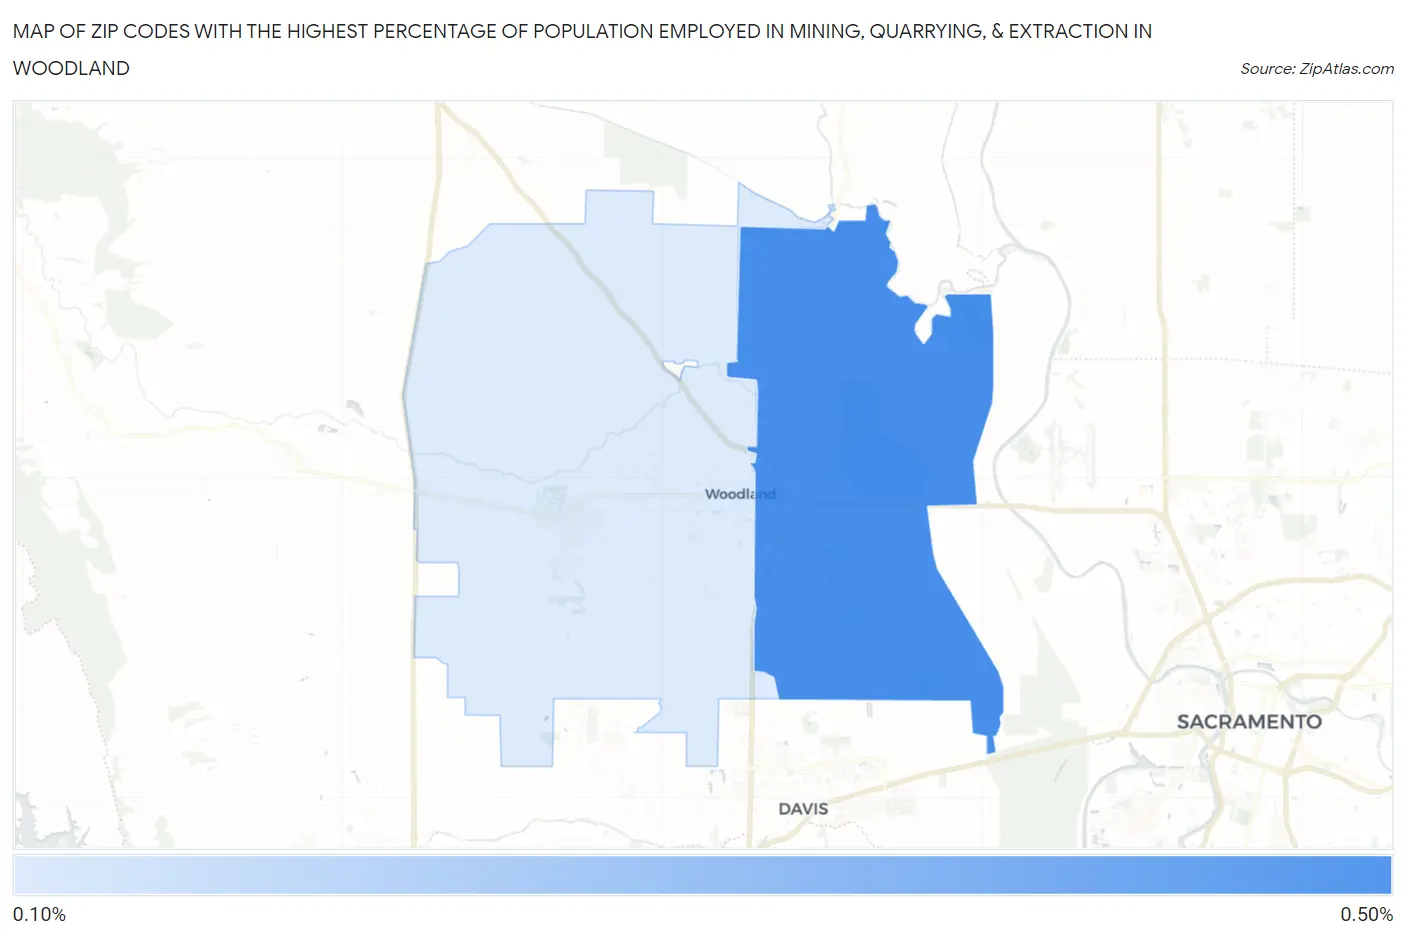
Map of Zip Codes with the Highest Percentage of Population Employed in Mining, Quarrying, & Extraction in Woodland
0.0%
0.50%
Zip Codes with the Highest Percentage of Population Employed in Mining, Quarrying, & Extraction in Woodland, CA
| Zip Code | % Employed | vs State | vs National | |
| 1. | 95776 | 0.45% | 0.12%(+0.324)#117 | 0.44%(+0.006)#7,503 |
| 2. | 95695 | 0.10% | 0.12%(-0.019)#312 | 0.44%(-0.336)#10,774 |
1
Common Questions
What are the Top Zip Codes with the Highest Percentage of Population Employed in Mining, Quarrying, & Extraction in Woodland, CA?
Top Zip Codes with the Highest Percentage of Population Employed in Mining, Quarrying, & Extraction in Woodland, CA are:
What zip code has the Highest Percentage of Population Employed in Mining, Quarrying, & Extraction in Woodland, CA?
95776 has the Highest Percentage of Population Employed in Mining, Quarrying, & Extraction in Woodland, CA with 0.45%.
What is the Percentage of Population Employed in Mining, Quarrying, & Extraction in Woodland, CA?
Percentage of Population Employed in Mining, Quarrying, & Extraction in Woodland is 0.26%.
What is the Percentage of Population Employed in Mining, Quarrying, & Extraction in California?
Percentage of Population Employed in Mining, Quarrying, & Extraction in California is 0.12%.
What is the Percentage of Population Employed in Mining, Quarrying, & Extraction in the United States?
Percentage of Population Employed in Mining, Quarrying, & Extraction in the United States is 0.44%.