Zip Codes with the Highest Percentage of Population Employed in Legal Services & Support in San Jacinto, CA
RELATED REPORTS & OPTIONS
Legal Services & Support
San Jacinto
Compare Zip Codes
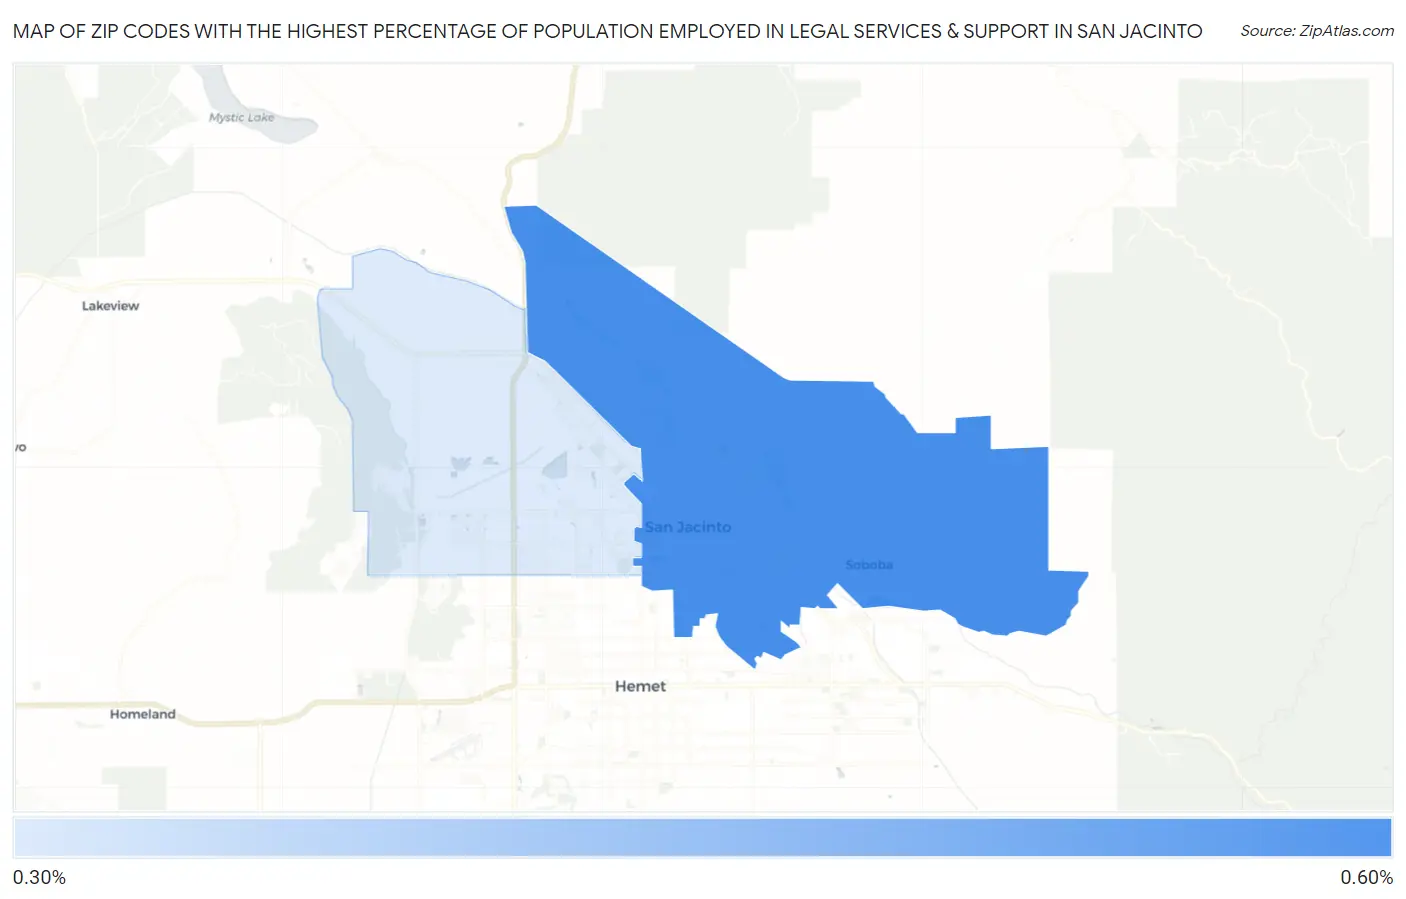
Map of Zip Codes with the Highest Percentage of Population Employed in Legal Services & Support in San Jacinto
0.0%
0.60%
Zip Codes with the Highest Percentage of Population Employed in Legal Services & Support in San Jacinto, CA
| Zip Code | % Employed | vs State | vs National | |
| 1. | 92583 | 0.55% | 1.3%(-0.704)#895 | 1.2%(-0.629)#12,008 |
| 2. | 92582 | 0.31% | 1.3%(-0.948)#1,055 | 1.2%(-0.874)#14,924 |
1
Common Questions
What are the Top Zip Codes with the Highest Percentage of Population Employed in Legal Services & Support in San Jacinto, CA?
Top Zip Codes with the Highest Percentage of Population Employed in Legal Services & Support in San Jacinto, CA are:
What zip code has the Highest Percentage of Population Employed in Legal Services & Support in San Jacinto, CA?
92583 has the Highest Percentage of Population Employed in Legal Services & Support in San Jacinto, CA with 0.55%.
What is the Percentage of Population Employed in Legal Services & Support in San Jacinto, CA?
Percentage of Population Employed in Legal Services & Support in San Jacinto is 0.43%.
What is the Percentage of Population Employed in Legal Services & Support in California?
Percentage of Population Employed in Legal Services & Support in California is 1.3%.
What is the Percentage of Population Employed in Legal Services & Support in the United States?
Percentage of Population Employed in Legal Services & Support in the United States is 1.2%.