Zip Codes with the Highest Percentage of Population Employed in Architecture & Engineering in Beverly Hills, CA
RELATED REPORTS & OPTIONS
Architecture & Engineering
Beverly Hills
Compare Zip Codes
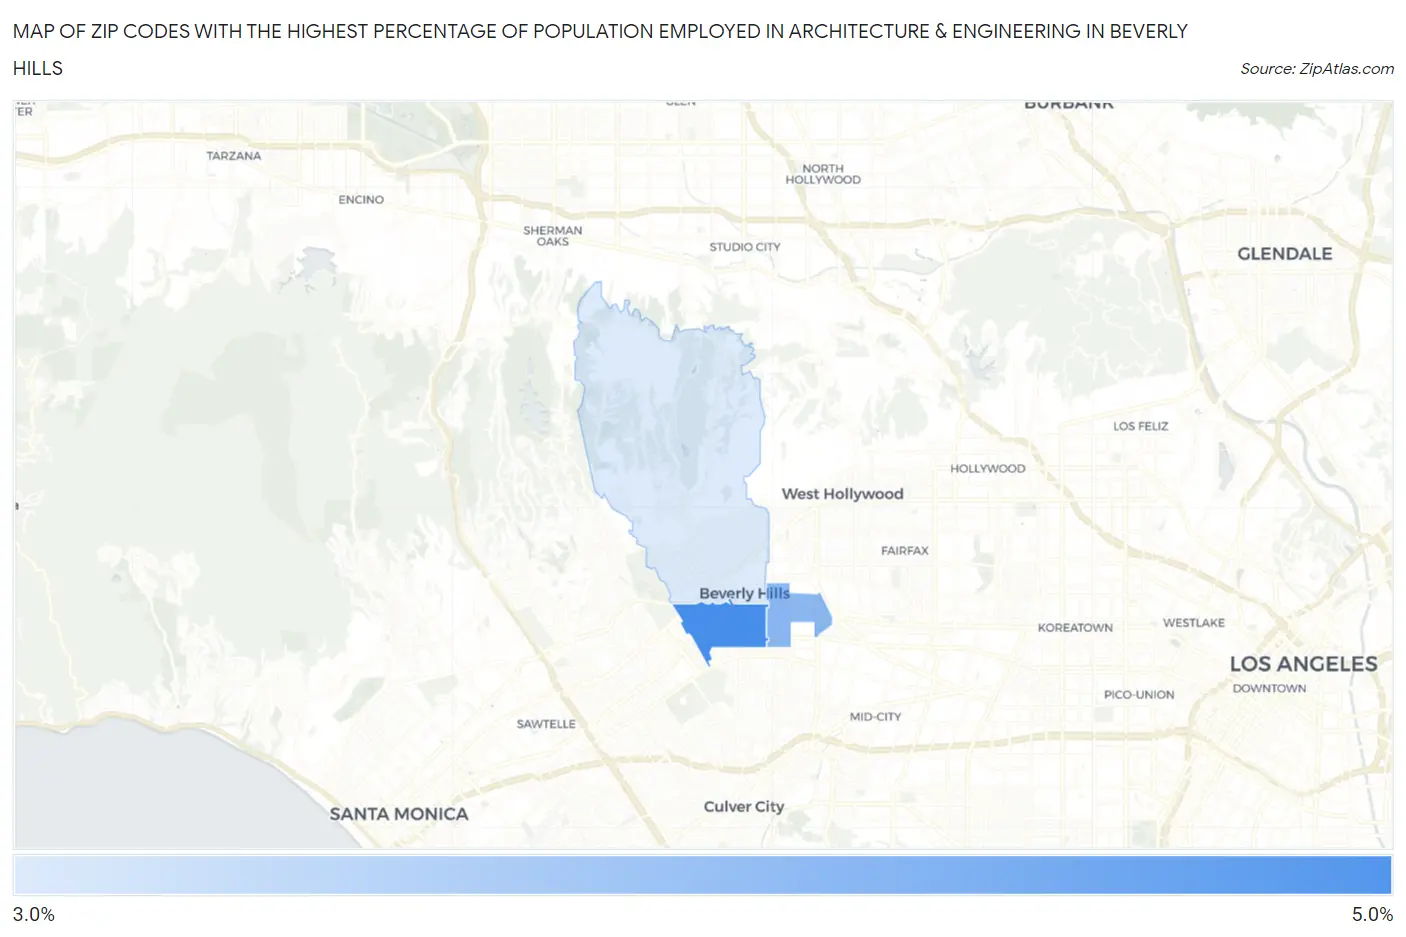
Map of Zip Codes with the Highest Percentage of Population Employed in Architecture & Engineering in Beverly Hills
0.0%
5.0%
Zip Codes with the Highest Percentage of Population Employed in Architecture & Engineering in Beverly Hills, CA
| Zip Code | % Employed | vs State | vs National | |
| 1. | 90212 | 4.2% | 2.6%(+1.66)#218 | 2.1%(+2.07)#2,473 |
| 2. | 90211 | 3.8% | 2.6%(+1.28)#256 | 2.1%(+1.68)#3,038 |
| 3. | 90210 | 3.4% | 2.6%(+0.808)#330 | 2.1%(+1.21)#4,039 |
1
Common Questions
What are the Top Zip Codes with the Highest Percentage of Population Employed in Architecture & Engineering in Beverly Hills, CA?
Top Zip Codes with the Highest Percentage of Population Employed in Architecture & Engineering in Beverly Hills, CA are:
What zip code has the Highest Percentage of Population Employed in Architecture & Engineering in Beverly Hills, CA?
90212 has the Highest Percentage of Population Employed in Architecture & Engineering in Beverly Hills, CA with 4.2%.
What is the Percentage of Population Employed in Architecture & Engineering in Beverly Hills, CA?
Percentage of Population Employed in Architecture & Engineering in Beverly Hills is 3.5%.
What is the Percentage of Population Employed in Architecture & Engineering in California?
Percentage of Population Employed in Architecture & Engineering in California is 2.6%.
What is the Percentage of Population Employed in Architecture & Engineering in the United States?
Percentage of Population Employed in Architecture & Engineering in the United States is 2.1%.