Zip Codes with the Highest Percentage of Population with a Degree in Liberal Arts and History in Tucson, AZ
RELATED REPORTS & OPTIONS
Liberal Arts and History
Tucson
Compare Zip Codes
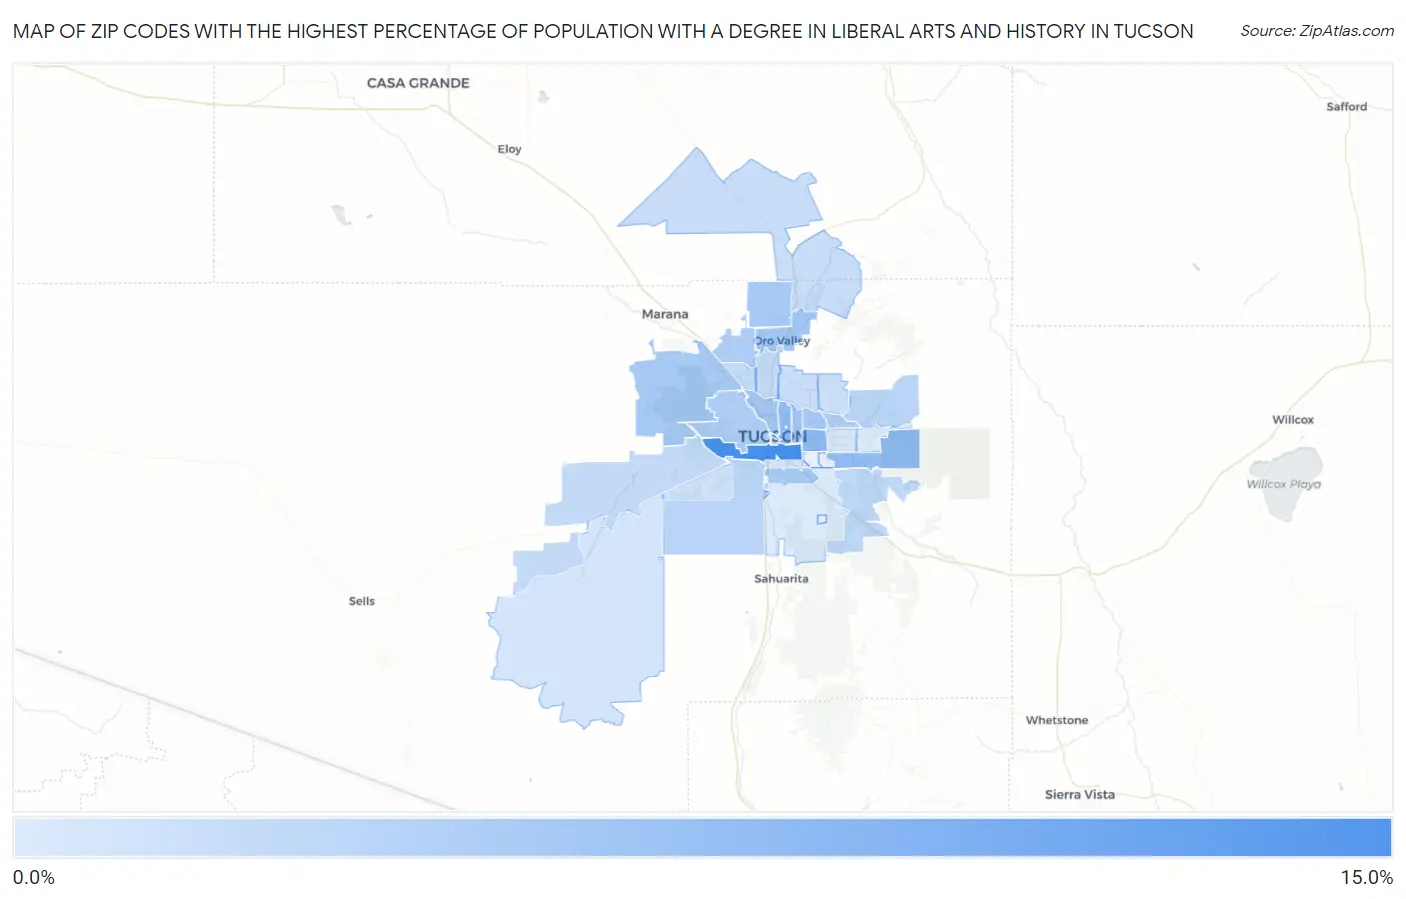
Map of Zip Codes with the Highest Percentage of Population with a Degree in Liberal Arts and History in Tucson
0.0%
15.0%
Zip Codes with the Highest Percentage of Population with a Degree in Liberal Arts and History in Tucson, AZ
| Zip Code | % Graduates | vs State | vs National | |
| 1. | 85713 | 11.6% | 4.3%(+7.34)#30 | 4.9%(+6.72)#2,335 |
| 2. | 85711 | 7.1% | 4.3%(+2.80)#62 | 4.9%(+2.18)#6,295 |
| 3. | 85719 | 6.7% | 4.3%(+2.45)#68 | 4.9%(+1.83)#6,939 |
| 4. | 85730 | 6.6% | 4.3%(+2.31)#73 | 4.9%(+1.69)#7,226 |
| 5. | 85716 | 5.8% | 4.3%(+1.53)#89 | 4.9%(+0.910)#9,088 |
| 6. | 85737 | 5.5% | 4.3%(+1.29)#100 | 4.9%(+0.669)#9,752 |
| 7. | 85705 | 5.5% | 4.3%(+1.29)#101 | 4.9%(+0.666)#9,760 |
| 8. | 85712 | 5.4% | 4.3%(+1.15)#106 | 4.9%(+0.536)#10,112 |
| 9. | 85743 | 5.3% | 4.3%(+1.09)#108 | 4.9%(+0.471)#10,297 |
| 10. | 85706 | 5.3% | 4.3%(+1.05)#111 | 4.9%(+0.430)#10,437 |
| 11. | 85755 | 5.2% | 4.3%(+0.975)#115 | 4.9%(+0.356)#10,657 |
| 12. | 85715 | 4.9% | 4.3%(+0.644)#129 | 4.9%(+0.025)#11,646 |
| 13. | 85745 | 4.8% | 4.3%(+0.596)#134 | 4.9%(-0.023)#11,815 |
| 14. | 85742 | 4.8% | 4.3%(+0.573)#136 | 4.9%(-0.046)#11,898 |
| 15. | 85749 | 4.2% | 4.3%(-0.091)#172 | 4.9%(-0.710)#14,171 |
| 16. | 85746 | 4.1% | 4.3%(-0.132)#175 | 4.9%(-0.751)#14,327 |
| 17. | 85701 | 3.9% | 4.3%(-0.334)#186 | 4.9%(-0.953)#15,111 |
| 18. | 85747 | 3.8% | 4.3%(-0.433)#192 | 4.9%(-1.05)#15,440 |
| 19. | 85735 | 3.5% | 4.3%(-0.729)#203 | 4.9%(-1.35)#16,505 |
| 20. | 85704 | 3.4% | 4.3%(-0.865)#217 | 4.9%(-1.48)#17,009 |
| 21. | 85741 | 3.4% | 4.3%(-0.896)#220 | 4.9%(-1.52)#17,114 |
| 22. | 85739 | 3.3% | 4.3%(-0.931)#221 | 4.9%(-1.55)#17,243 |
| 23. | 85718 | 3.2% | 4.3%(-1.01)#228 | 4.9%(-1.63)#17,504 |
| 24. | 85750 | 3.0% | 4.3%(-1.23)#240 | 4.9%(-1.85)#18,274 |
| 25. | 85757 | 2.8% | 4.3%(-1.42)#245 | 4.9%(-2.04)#18,909 |
| 26. | 85736 | 2.6% | 4.3%(-1.70)#256 | 4.9%(-2.32)#19,811 |
| 27. | 85714 | 2.5% | 4.3%(-1.71)#257 | 4.9%(-2.33)#19,847 |
| 28. | 85710 | 2.5% | 4.3%(-1.79)#261 | 4.9%(-2.41)#20,111 |
| 29. | 85748 | 2.0% | 4.3%(-2.27)#271 | 4.9%(-2.89)#21,412 |
| 30. | 85756 | 2.0% | 4.3%(-2.28)#272 | 4.9%(-2.90)#21,432 |
1
Common Questions
What are the Top 10 Zip Codes with the Highest Percentage of Population with a Degree in Liberal Arts and History in Tucson, AZ?
Top 10 Zip Codes with the Highest Percentage of Population with a Degree in Liberal Arts and History in Tucson, AZ are:
What zip code has the Highest Percentage of Population with a Degree in Liberal Arts and History in Tucson, AZ?
85713 has the Highest Percentage of Population with a Degree in Liberal Arts and History in Tucson, AZ with 11.6%.
What is the Percentage of Population with a Degree in Liberal Arts and History in Tucson, AZ?
Percentage of Population with a Degree in Liberal Arts and History in Tucson is 4.8%.
What is the Percentage of Population with a Degree in Liberal Arts and History in Arizona?
Percentage of Population with a Degree in Liberal Arts and History in Arizona is 4.3%.
What is the Percentage of Population with a Degree in Liberal Arts and History in the United States?
Percentage of Population with a Degree in Liberal Arts and History in the United States is 4.9%.