Zip Codes with the Highest Percentage of Population Employed in Security & Protection in Tucson, AZ
RELATED REPORTS & OPTIONS
Security & Protection
Tucson
Compare Zip Codes
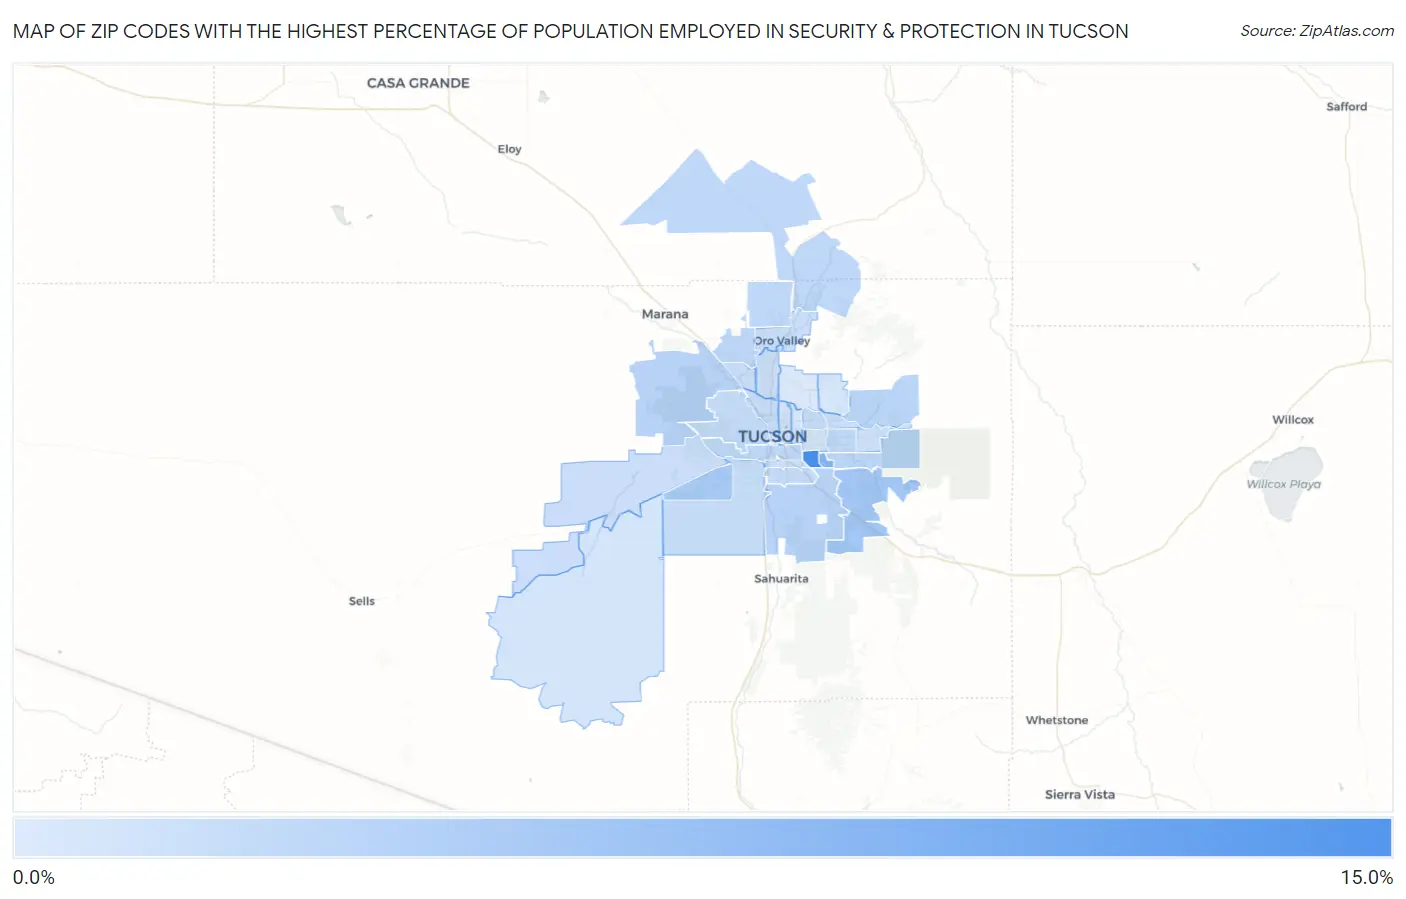
Map of Zip Codes with the Highest Percentage of Population Employed in Security & Protection in Tucson
0.0%
15.0%
Zip Codes with the Highest Percentage of Population Employed in Security & Protection in Tucson, AZ
| Zip Code | % Employed | vs State | vs National | |
| 1. | 85707 | 14.6% | 2.5%(+12.2)#13 | 2.1%(+12.5)#380 |
| 2. | 85708 | 8.7% | 2.5%(+6.22)#33 | 2.1%(+6.52)#972 |
| 3. | 85747 | 5.8% | 2.5%(+3.34)#58 | 2.1%(+3.64)#2,215 |
| 4. | 85757 | 5.3% | 2.5%(+2.82)#71 | 2.1%(+3.12)#2,660 |
| 5. | 85756 | 3.9% | 2.5%(+1.45)#103 | 2.1%(+1.76)#4,675 |
| 6. | 85743 | 3.9% | 2.5%(+1.44)#104 | 2.1%(+1.75)#4,700 |
| 7. | 85749 | 3.6% | 2.5%(+1.12)#116 | 2.1%(+1.43)#5,462 |
| 8. | 85730 | 3.5% | 2.5%(+1.00)#117 | 2.1%(+1.31)#5,788 |
| 9. | 85742 | 3.4% | 2.5%(+0.903)#123 | 2.1%(+1.21)#6,070 |
| 10. | 85755 | 3.2% | 2.5%(+0.735)#131 | 2.1%(+1.04)#6,582 |
| 11. | 85739 | 3.2% | 2.5%(+0.705)#134 | 2.1%(+1.01)#6,672 |
| 12. | 85710 | 3.1% | 2.5%(+0.675)#138 | 2.1%(+0.979)#6,788 |
| 13. | 85713 | 3.1% | 2.5%(+0.673)#139 | 2.1%(+0.977)#6,791 |
| 14. | 85745 | 2.9% | 2.5%(+0.427)#154 | 2.1%(+0.731)#7,731 |
| 15. | 85706 | 2.8% | 2.5%(+0.390)#156 | 2.1%(+0.694)#7,906 |
| 16. | 85712 | 2.7% | 2.5%(+0.252)#166 | 2.1%(+0.556)#8,513 |
| 17. | 85746 | 2.6% | 2.5%(+0.182)#170 | 2.1%(+0.486)#8,847 |
| 18. | 85705 | 2.5% | 2.5%(+0.038)#179 | 2.1%(+0.341)#9,568 |
| 19. | 85741 | 2.4% | 2.5%(-0.011)#182 | 2.1%(+0.293)#9,843 |
| 20. | 85715 | 2.4% | 2.5%(-0.041)#186 | 2.1%(+0.263)#10,002 |
| 21. | 85704 | 2.2% | 2.5%(-0.269)#203 | 2.1%(+0.035)#11,349 |
| 22. | 85737 | 2.1% | 2.5%(-0.308)#206 | 2.1%(-0.004)#11,611 |
| 23. | 85735 | 2.1% | 2.5%(-0.381)#212 | 2.1%(-0.077)#12,104 |
| 24. | 85714 | 1.9% | 2.5%(-0.507)#221 | 2.1%(-0.203)#12,919 |
| 25. | 85748 | 1.9% | 2.5%(-0.545)#231 | 2.1%(-0.241)#13,171 |
| 26. | 85711 | 1.5% | 2.5%(-0.956)#272 | 2.1%(-0.652)#16,236 |
| 27. | 85719 | 1.5% | 2.5%(-0.963)#273 | 2.1%(-0.659)#16,298 |
| 28. | 85736 | 1.4% | 2.5%(-1.03)#278 | 2.1%(-0.728)#16,802 |
| 29. | 85716 | 1.4% | 2.5%(-1.08)#279 | 2.1%(-0.777)#17,176 |
| 30. | 85750 | 1.1% | 2.5%(-1.31)#304 | 2.1%(-1.01)#18,956 |
| 31. | 85718 | 0.80% | 2.5%(-1.65)#320 | 2.1%(-1.35)#21,426 |
| 32. | 85701 | 0.54% | 2.5%(-1.92)#327 | 2.1%(-1.61)#23,046 |
1
Common Questions
What are the Top 10 Zip Codes with the Highest Percentage of Population Employed in Security & Protection in Tucson, AZ?
Top 10 Zip Codes with the Highest Percentage of Population Employed in Security & Protection in Tucson, AZ are:
What zip code has the Highest Percentage of Population Employed in Security & Protection in Tucson, AZ?
85707 has the Highest Percentage of Population Employed in Security & Protection in Tucson, AZ with 14.6%.
What is the Percentage of Population Employed in Security & Protection in Tucson, AZ?
Percentage of Population Employed in Security & Protection in Tucson is 2.6%.
What is the Percentage of Population Employed in Security & Protection in Arizona?
Percentage of Population Employed in Security & Protection in Arizona is 2.5%.
What is the Percentage of Population Employed in Security & Protection in the United States?
Percentage of Population Employed in Security & Protection in the United States is 2.1%.