Zip Codes with the Highest Percentage of Population Employed in Life, Physical & Social Science in Tucson, AZ
RELATED REPORTS & OPTIONS
Life, Physical & Social Science
Tucson
Compare Zip Codes
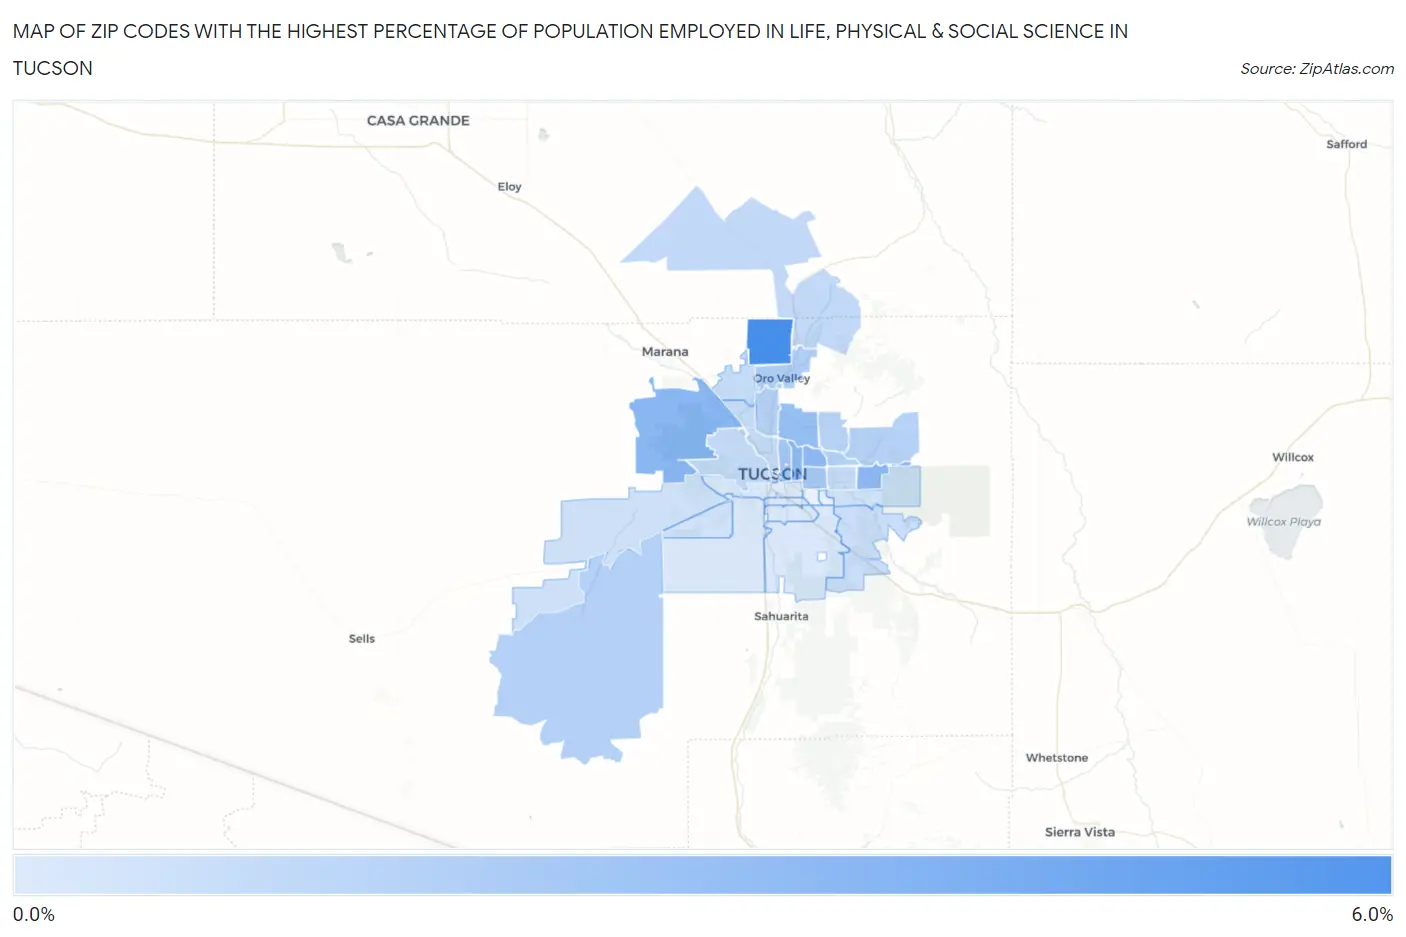
Map of Zip Codes with the Highest Percentage of Population Employed in Life, Physical & Social Science in Tucson
0.0%
6.0%
Zip Codes with the Highest Percentage of Population Employed in Life, Physical & Social Science in Tucson, AZ
| Zip Code | % Employed | vs State | vs National | |
| 1. | 85755 | 5.2% | 0.83%(+4.37)#8 | 1.1%(+4.11)#710 |
| 2. | 85743 | 2.9% | 0.83%(+2.04)#19 | 1.1%(+1.78)#2,033 |
| 3. | 85748 | 2.8% | 0.83%(+2.00)#22 | 1.1%(+1.74)#2,072 |
| 4. | 85716 | 2.8% | 0.83%(+1.96)#23 | 1.1%(+1.70)#2,128 |
| 5. | 85712 | 2.7% | 0.83%(+1.84)#24 | 1.1%(+1.59)#2,275 |
| 6. | 85718 | 2.5% | 0.83%(+1.63)#30 | 1.1%(+1.37)#2,643 |
| 7. | 85719 | 2.0% | 0.83%(+1.15)#39 | 1.1%(+0.894)#3,730 |
| 8. | 85711 | 1.9% | 0.83%(+1.08)#42 | 1.1%(+0.817)#3,951 |
| 9. | 85737 | 1.5% | 0.83%(+0.672)#58 | 1.1%(+0.413)#5,636 |
| 10. | 85715 | 1.4% | 0.83%(+0.605)#64 | 1.1%(+0.347)#5,979 |
| 11. | 85736 | 1.4% | 0.83%(+0.588)#65 | 1.1%(+0.329)#6,083 |
| 12. | 85749 | 1.4% | 0.83%(+0.554)#67 | 1.1%(+0.296)#6,271 |
| 13. | 85704 | 1.4% | 0.83%(+0.519)#71 | 1.1%(+0.261)#6,461 |
| 14. | 85750 | 1.3% | 0.83%(+0.484)#77 | 1.1%(+0.225)#6,694 |
| 15. | 85739 | 1.00% | 0.83%(+0.166)#110 | 1.1%(-0.093)#9,057 |
| 16. | 85745 | 0.94% | 0.83%(+0.106)#118 | 1.1%(-0.152)#9,586 |
| 17. | 85710 | 0.90% | 0.83%(+0.072)#123 | 1.1%(-0.186)#9,913 |
| 18. | 85705 | 0.89% | 0.83%(+0.055)#127 | 1.1%(-0.204)#10,076 |
| 19. | 85742 | 0.84% | 0.83%(+0.008)#132 | 1.1%(-0.250)#10,568 |
| 20. | 85701 | 0.84% | 0.83%(+0.006)#133 | 1.1%(-0.252)#10,594 |
| 21. | 85741 | 0.83% | 0.83%(-0.002)#135 | 1.1%(-0.260)#10,686 |
| 22. | 85747 | 0.70% | 0.83%(-0.128)#154 | 1.1%(-0.386)#11,971 |
| 23. | 85735 | 0.55% | 0.83%(-0.286)#179 | 1.1%(-0.545)#13,951 |
| 24. | 85757 | 0.45% | 0.83%(-0.382)#198 | 1.1%(-0.640)#15,124 |
| 25. | 85730 | 0.44% | 0.83%(-0.390)#201 | 1.1%(-0.648)#15,221 |
| 26. | 85746 | 0.19% | 0.83%(-0.641)#243 | 1.1%(-0.899)#18,283 |
| 27. | 85706 | 0.14% | 0.83%(-0.689)#250 | 1.1%(-0.947)#18,744 |
| 28. | 85714 | 0.14% | 0.83%(-0.694)#252 | 1.1%(-0.952)#18,781 |
| 29. | 85756 | 0.12% | 0.83%(-0.709)#254 | 1.1%(-0.967)#18,909 |
| 30. | 85713 | 0.054% | 0.83%(-0.778)#259 | 1.1%(-1.04)#19,318 |
1
Common Questions
What are the Top 10 Zip Codes with the Highest Percentage of Population Employed in Life, Physical & Social Science in Tucson, AZ?
Top 10 Zip Codes with the Highest Percentage of Population Employed in Life, Physical & Social Science in Tucson, AZ are:
What zip code has the Highest Percentage of Population Employed in Life, Physical & Social Science in Tucson, AZ?
85755 has the Highest Percentage of Population Employed in Life, Physical & Social Science in Tucson, AZ with 5.2%.
What is the Percentage of Population Employed in Life, Physical & Social Science in Tucson, AZ?
Percentage of Population Employed in Life, Physical & Social Science in Tucson is 1.1%.
What is the Percentage of Population Employed in Life, Physical & Social Science in Arizona?
Percentage of Population Employed in Life, Physical & Social Science in Arizona is 0.83%.
What is the Percentage of Population Employed in Life, Physical & Social Science in the United States?
Percentage of Population Employed in Life, Physical & Social Science in the United States is 1.1%.