Zip Codes with the Highest Percentage of Population with a Degree in Engineering in Tucson, AZ
RELATED REPORTS & OPTIONS
Engineering
Tucson
Compare Zip Codes
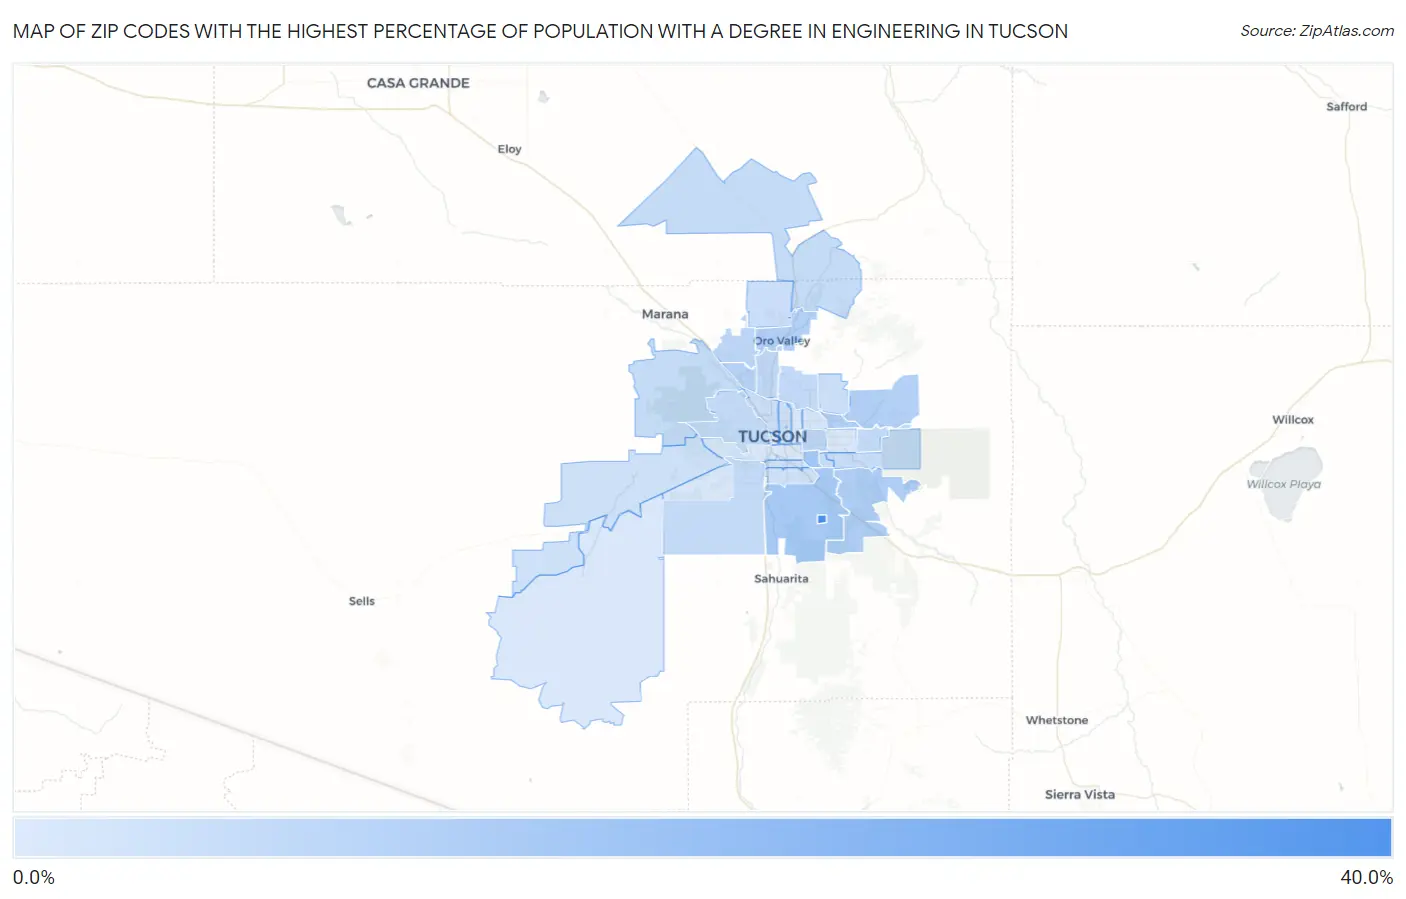
Map of Zip Codes with the Highest Percentage of Population with a Degree in Engineering in Tucson
0.0%
40.0%
Zip Codes with the Highest Percentage of Population with a Degree in Engineering in Tucson, AZ
| Zip Code | % Graduates | vs State | vs National | |
| 1. | 85734 | 36.5% | 8.0%(+28.5)#6 | 7.6%(+28.9)#254 |
| 2. | 85707 | 15.6% | 8.0%(+7.58)#23 | 7.6%(+7.91)#1,595 |
| 3. | 85756 | 14.7% | 8.0%(+6.68)#26 | 7.6%(+7.00)#1,830 |
| 4. | 85747 | 12.9% | 8.0%(+4.91)#35 | 7.6%(+5.24)#2,456 |
| 5. | 85715 | 12.4% | 8.0%(+4.47)#39 | 7.6%(+4.80)#2,651 |
| 6. | 85737 | 12.3% | 8.0%(+4.28)#41 | 7.6%(+4.61)#2,775 |
| 7. | 85749 | 11.9% | 8.0%(+3.95)#46 | 7.6%(+4.27)#2,935 |
| 8. | 85741 | 11.5% | 8.0%(+3.48)#51 | 7.6%(+3.81)#3,207 |
| 9. | 85711 | 10.5% | 8.0%(+2.47)#64 | 7.6%(+2.80)#4,020 |
| 10. | 85742 | 10.1% | 8.0%(+2.17)#69 | 7.6%(+2.50)#4,317 |
| 11. | 85718 | 9.5% | 8.0%(+1.53)#79 | 7.6%(+1.86)#4,968 |
| 12. | 85704 | 9.3% | 8.0%(+1.31)#84 | 7.6%(+1.63)#5,223 |
| 13. | 85748 | 8.9% | 8.0%(+0.971)#91 | 7.6%(+1.30)#5,682 |
| 14. | 85746 | 8.7% | 8.0%(+0.735)#96 | 7.6%(+1.06)#6,000 |
| 15. | 85745 | 8.7% | 8.0%(+0.690)#97 | 7.6%(+1.02)#6,054 |
| 16. | 85739 | 8.5% | 8.0%(+0.529)#102 | 7.6%(+0.858)#6,270 |
| 17. | 85743 | 8.2% | 8.0%(+0.217)#104 | 7.6%(+0.545)#6,764 |
| 18. | 85730 | 8.1% | 8.0%(+0.161)#108 | 7.6%(+0.490)#6,866 |
| 19. | 85708 | 7.7% | 8.0%(-0.234)#119 | 7.6%(+0.094)#7,538 |
| 20. | 85705 | 7.5% | 8.0%(-0.431)#129 | 7.6%(-0.103)#7,920 |
| 21. | 85755 | 7.4% | 8.0%(-0.585)#135 | 7.6%(-0.256)#8,221 |
| 22. | 85719 | 7.2% | 8.0%(-0.775)#139 | 7.6%(-0.446)#8,576 |
| 23. | 85750 | 7.0% | 8.0%(-1.02)#151 | 7.6%(-0.690)#9,093 |
| 24. | 85714 | 6.9% | 8.0%(-1.04)#154 | 7.6%(-0.707)#9,139 |
| 25. | 85706 | 6.7% | 8.0%(-1.31)#164 | 7.6%(-0.981)#9,677 |
| 26. | 85735 | 6.6% | 8.0%(-1.33)#165 | 7.6%(-0.999)#9,728 |
| 27. | 85712 | 5.2% | 8.0%(-2.76)#217 | 7.6%(-2.43)#13,148 |
| 28. | 85757 | 4.8% | 8.0%(-3.13)#231 | 7.6%(-2.80)#14,126 |
| 29. | 85710 | 4.7% | 8.0%(-3.28)#235 | 7.6%(-2.95)#14,529 |
| 30. | 85736 | 4.6% | 8.0%(-3.38)#242 | 7.6%(-3.06)#14,824 |
| 31. | 85716 | 4.4% | 8.0%(-3.60)#246 | 7.6%(-3.27)#15,374 |
| 32. | 85713 | 4.2% | 8.0%(-3.73)#252 | 7.6%(-3.40)#15,693 |
| 33. | 85701 | 4.0% | 8.0%(-4.02)#262 | 7.6%(-3.69)#16,474 |
1
Common Questions
What are the Top 10 Zip Codes with the Highest Percentage of Population with a Degree in Engineering in Tucson, AZ?
Top 10 Zip Codes with the Highest Percentage of Population with a Degree in Engineering in Tucson, AZ are:
What zip code has the Highest Percentage of Population with a Degree in Engineering in Tucson, AZ?
85734 has the Highest Percentage of Population with a Degree in Engineering in Tucson, AZ with 36.5%.
What is the Percentage of Population with a Degree in Engineering in Tucson, AZ?
Percentage of Population with a Degree in Engineering in Tucson is 7.8%.
What is the Percentage of Population with a Degree in Engineering in Arizona?
Percentage of Population with a Degree in Engineering in Arizona is 8.0%.
What is the Percentage of Population with a Degree in Engineering in the United States?
Percentage of Population with a Degree in Engineering in the United States is 7.6%.