Zip Codes with the Highest Percentage of Population Employed in Installation, Maintenance & Repair in Tucson, AZ
RELATED REPORTS & OPTIONS
Installation, Maintenance & Repair
Tucson
Compare Zip Codes
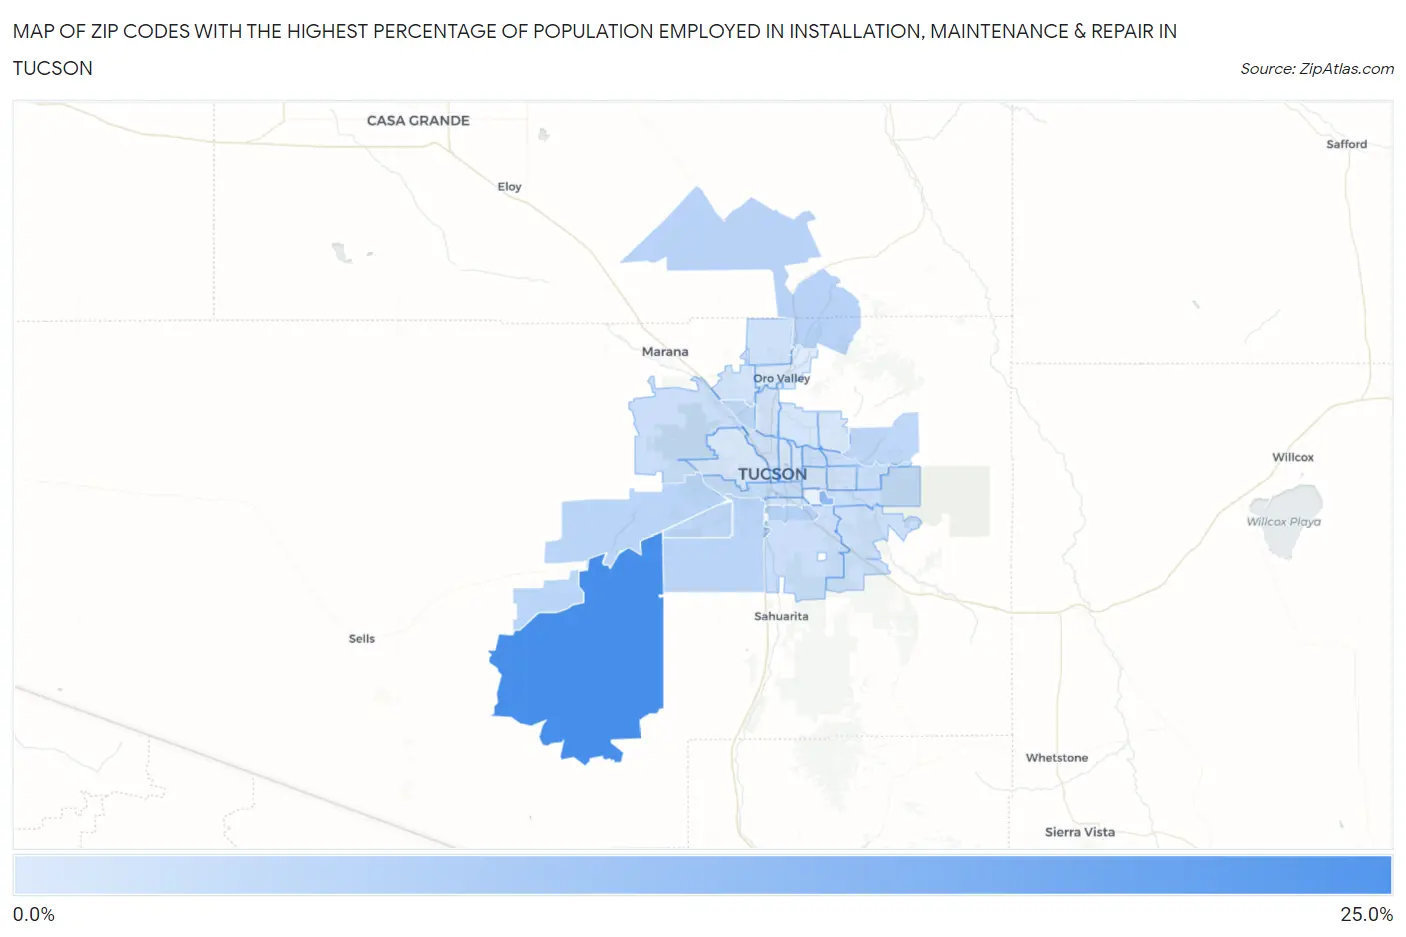
Map of Zip Codes with the Highest Percentage of Population Employed in Installation, Maintenance & Repair in Tucson
0.0%
25.0%
Zip Codes with the Highest Percentage of Population Employed in Installation, Maintenance & Repair in Tucson, AZ
| Zip Code | % Employed | vs State | vs National | |
| 1. | 85736 | 20.6% | 3.3%(+17.4)#3 | 3.1%(+17.6)#357 |
| 2. | 85708 | 11.1% | 3.3%(+7.87)#17 | 3.1%(+8.06)#1,578 |
| 3. | 85706 | 5.7% | 3.3%(+2.47)#47 | 3.1%(+2.66)#6,722 |
| 4. | 85739 | 5.6% | 3.3%(+2.32)#53 | 3.1%(+2.51)#7,057 |
| 5. | 85746 | 5.3% | 3.3%(+2.02)#61 | 3.1%(+2.21)#7,870 |
| 6. | 85735 | 5.2% | 3.3%(+1.91)#68 | 3.1%(+2.10)#8,194 |
| 7. | 85757 | 5.1% | 3.3%(+1.80)#71 | 3.1%(+1.99)#8,539 |
| 8. | 85741 | 5.0% | 3.3%(+1.71)#78 | 3.1%(+1.90)#8,837 |
| 9. | 85749 | 4.7% | 3.3%(+1.45)#85 | 3.1%(+1.64)#9,677 |
| 10. | 85713 | 4.0% | 3.3%(+0.703)#116 | 3.1%(+0.893)#12,542 |
| 11. | 85712 | 3.8% | 3.3%(+0.509)#126 | 3.1%(+0.699)#13,387 |
| 12. | 85748 | 3.5% | 3.3%(+0.251)#141 | 3.1%(+0.441)#14,594 |
| 13. | 85730 | 3.4% | 3.3%(+0.156)#153 | 3.1%(+0.346)#15,023 |
| 14. | 85715 | 3.4% | 3.3%(+0.138)#154 | 3.1%(+0.328)#15,107 |
| 15. | 85743 | 3.3% | 3.3%(+0.052)#161 | 3.1%(+0.242)#15,511 |
| 16. | 85756 | 3.2% | 3.3%(-0.067)#168 | 3.1%(+0.123)#16,079 |
| 17. | 85747 | 3.1% | 3.3%(-0.111)#175 | 3.1%(+0.078)#16,300 |
| 18. | 85710 | 3.0% | 3.3%(-0.293)#187 | 3.1%(-0.103)#17,169 |
| 19. | 85714 | 2.7% | 3.3%(-0.520)#211 | 3.1%(-0.330)#18,341 |
| 20. | 85705 | 2.7% | 3.3%(-0.577)#215 | 3.1%(-0.387)#18,656 |
| 21. | 85755 | 2.7% | 3.3%(-0.596)#216 | 3.1%(-0.406)#18,755 |
| 22. | 85711 | 2.4% | 3.3%(-0.866)#233 | 3.1%(-0.677)#20,104 |
| 23. | 85704 | 2.4% | 3.3%(-0.903)#237 | 3.1%(-0.713)#20,296 |
| 24. | 85742 | 2.4% | 3.3%(-0.907)#238 | 3.1%(-0.717)#20,321 |
| 25. | 85718 | 2.3% | 3.3%(-0.978)#245 | 3.1%(-0.789)#20,684 |
| 26. | 85701 | 2.0% | 3.3%(-1.21)#260 | 3.1%(-1.02)#21,797 |
| 27. | 85716 | 1.8% | 3.3%(-1.45)#272 | 3.1%(-1.26)#22,839 |
| 28. | 85719 | 1.7% | 3.3%(-1.57)#278 | 3.1%(-1.38)#23,403 |
| 29. | 85745 | 1.7% | 3.3%(-1.57)#279 | 3.1%(-1.38)#23,408 |
| 30. | 85750 | 1.7% | 3.3%(-1.58)#280 | 3.1%(-1.39)#23,426 |
| 31. | 85737 | 1.1% | 3.3%(-2.17)#310 | 3.1%(-1.98)#25,638 |
1
Common Questions
What are the Top 10 Zip Codes with the Highest Percentage of Population Employed in Installation, Maintenance & Repair in Tucson, AZ?
Top 10 Zip Codes with the Highest Percentage of Population Employed in Installation, Maintenance & Repair in Tucson, AZ are:
What zip code has the Highest Percentage of Population Employed in Installation, Maintenance & Repair in Tucson, AZ?
85736 has the Highest Percentage of Population Employed in Installation, Maintenance & Repair in Tucson, AZ with 20.6%.
What is the Percentage of Population Employed in Installation, Maintenance & Repair in Tucson, AZ?
Percentage of Population Employed in Installation, Maintenance & Repair in Tucson is 3.1%.
What is the Percentage of Population Employed in Installation, Maintenance & Repair in Arizona?
Percentage of Population Employed in Installation, Maintenance & Repair in Arizona is 3.3%.
What is the Percentage of Population Employed in Installation, Maintenance & Repair in the United States?
Percentage of Population Employed in Installation, Maintenance & Repair in the United States is 3.1%.