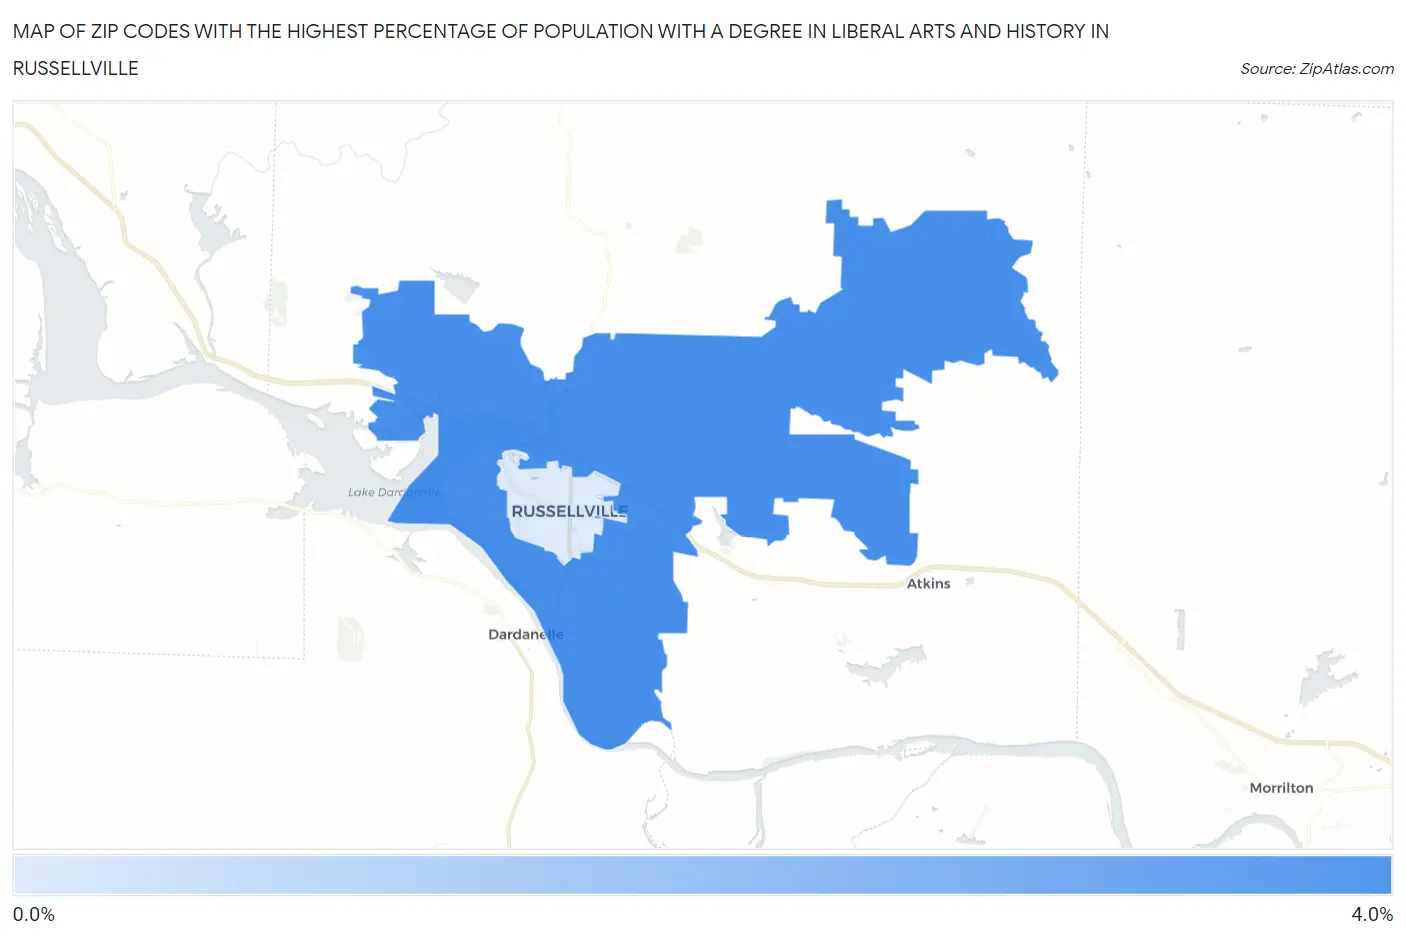
Zip Codes with the Highest Percentage of Population with a Degree in Liberal Arts and History in Russellville, AR
RELATED REPORTS & OPTIONS
Liberal Arts and History
Russellville
Compare Zip Codes
Map of Zip Codes with the Highest Percentage of Population with a Degree in Liberal Arts and History in Russellville
0.0%
4.0%
Zip Codes with the Highest Percentage of Population with a Degree in Liberal Arts and History in Russellville, AR
| Zip Code | % Graduates | vs State | vs National | |
| 1. | 72802 | 3.5% | 4.9%(-1.40)#227 | 4.9%(-1.37)#16,594 |
| 2. | 72801 | 0.86% | 4.9%(-4.04)#315 | 4.9%(-4.01)#23,620 |
1
Common Questions
What are the Top Zip Codes with the Highest Percentage of Population with a Degree in Liberal Arts and History in Russellville, AR?
Top Zip Codes with the Highest Percentage of Population with a Degree in Liberal Arts and History in Russellville, AR are:
What zip code has the Highest Percentage of Population with a Degree in Liberal Arts and History in Russellville, AR?
72802 has the Highest Percentage of Population with a Degree in Liberal Arts and History in Russellville, AR with 3.5%.
What is the Percentage of Population with a Degree in Liberal Arts and History in Russellville, AR?
Percentage of Population with a Degree in Liberal Arts and History in Russellville is 0.88%.
What is the Percentage of Population with a Degree in Liberal Arts and History in Arkansas?
Percentage of Population with a Degree in Liberal Arts and History in Arkansas is 4.9%.
What is the Percentage of Population with a Degree in Liberal Arts and History in the United States?
Percentage of Population with a Degree in Liberal Arts and History in the United States is 4.9%.