Zip Codes with the Highest Percentage of Households Without a Vehicle in Pine Bluff, AR
RELATED REPORTS & OPTIONS
Households without a Cars
Pine Bluff
Compare Zip Codes
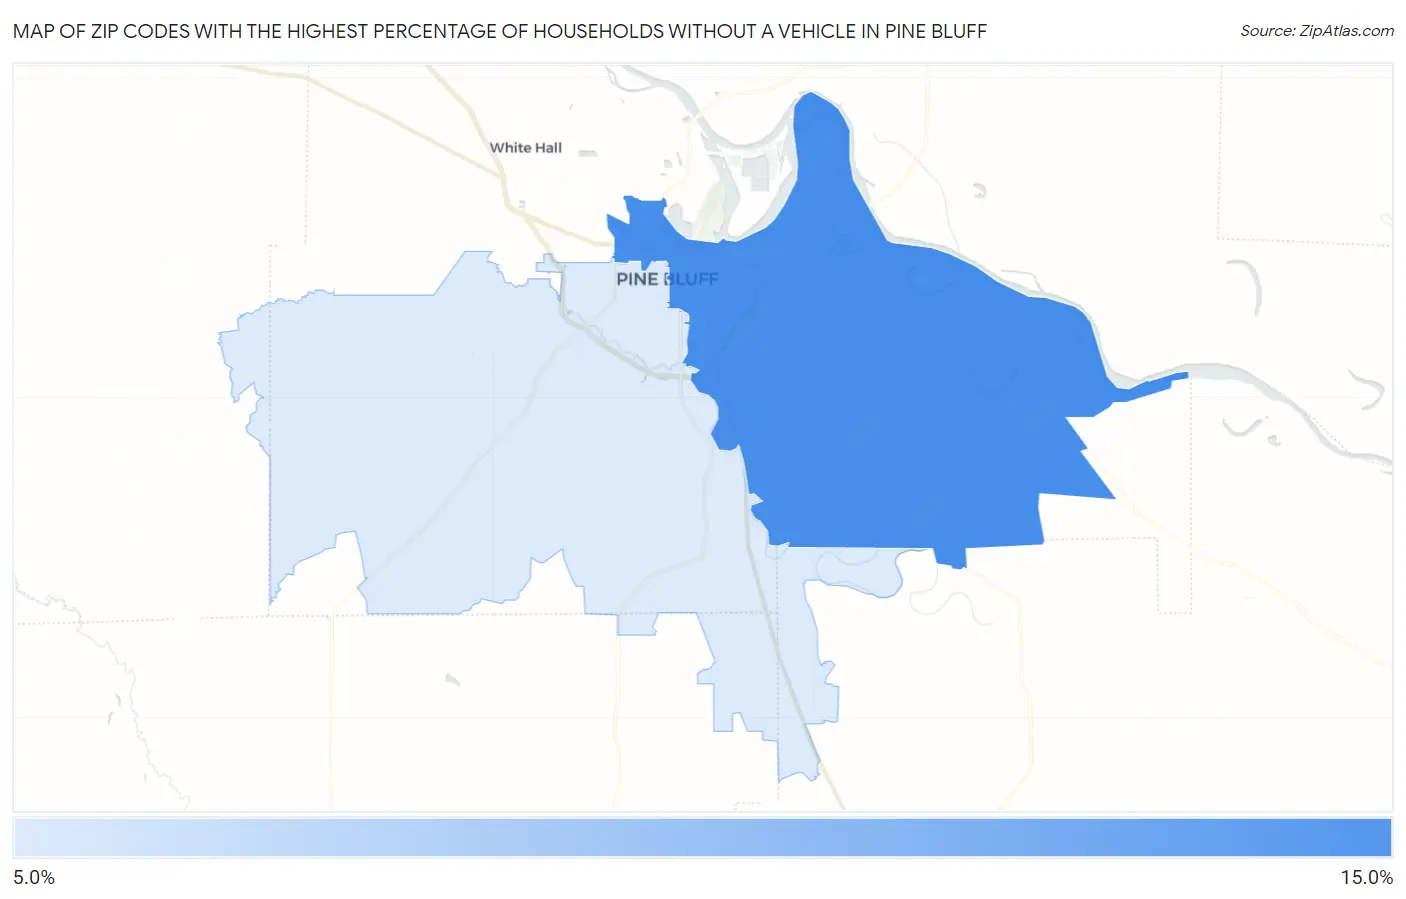
Map of Zip Codes with the Highest Percentage of Households Without a Vehicle in Pine Bluff
0.0%
15.0%
Zip Codes with the Highest Percentage of Households Without a Vehicle in Pine Bluff, AR
| Zip Code | Housholds Without a Car | vs State | vs National | |
| 1. | 71601 | 12.2% | 6.0%(+6.20)#63 | 8.3%(+3.90)#3,458 |
| 2. | 71603 | 8.8% | 6.0%(+2.80)#116 | 8.3%(+0.500)#5,954 |
1
Common Questions
What are the Top Zip Codes with the Highest Percentage of Households Without a Vehicle in Pine Bluff, AR?
Top Zip Codes with the Highest Percentage of Households Without a Vehicle in Pine Bluff, AR are:
What zip code has the Highest Percentage of Households Without a Vehicle in Pine Bluff, AR?
71601 has the Highest Percentage of Households Without a Vehicle in Pine Bluff, AR with 12.2%.
What is the Percentage of Households Without a Vehicle in Pine Bluff, AR?
Percentage of Households Without a Vehicle in Pine Bluff is 10.2%.
What is the Percentage of Households Without a Vehicle in Arkansas?
Percentage of Households Without a Vehicle in Arkansas is 6.0%.
What is the Percentage of Households Without a Vehicle in the United States?
Percentage of Households Without a Vehicle in the United States is 8.3%.