Dumas, AR
Dumas Map
Dumas Overview
3,965
TOTAL POPULATION
1,701
MALE POPULATION
2,264
FEMALE POPULATION
75.13
MALES / 100 FEMALES
133.10
FEMALES / 100 MALES
34.5
MEDIAN AGE
3.1
AVG FAMILY SIZE
2.3
AVG HOUSEHOLD SIZE
$17,722
PER CAPITA INCOME
$43,500
AVG FAMILY INCOME
$34,554
AVG HOUSEHOLD INCOME
22.2%
WAGE / INCOME GAP [ % ]
77.8¢/ $1
WAGE / INCOME GAP [ $ ]
0.42
INEQUALITY / GINI INDEX
1,587
LABOR FORCE [ PEOPLE ]
53.4%
PERCENT IN LABOR FORCE
9.0%
UNEMPLOYMENT RATE
Dumas Zip Codes
Dumas Area Codes
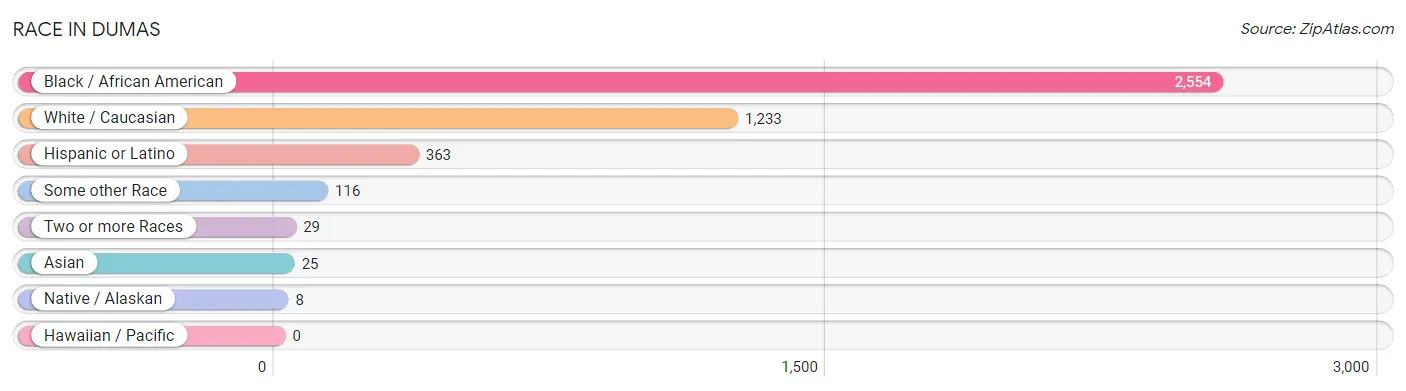
Race in Dumas
The most populous races in Dumas are Black / African American (2,554 | 64.4%), White / Caucasian (1,233 | 31.1%), and Hispanic or Latino (363 | 9.2%).
| Race | # Population | % Population |
| Asian | 25 | 0.6% |
| Black / African American | 2,554 | 64.4% |
| Hawaiian / Pacific | 0 | 0.0% |
| Hispanic or Latino | 363 | 9.2% |
| Native / Alaskan | 8 | 0.2% |
| White / Caucasian | 1,233 | 31.1% |
| Two or more Races | 29 | 0.7% |
| Some other Race | 116 | 2.9% |
| Total | 3,965 | 100.0% |
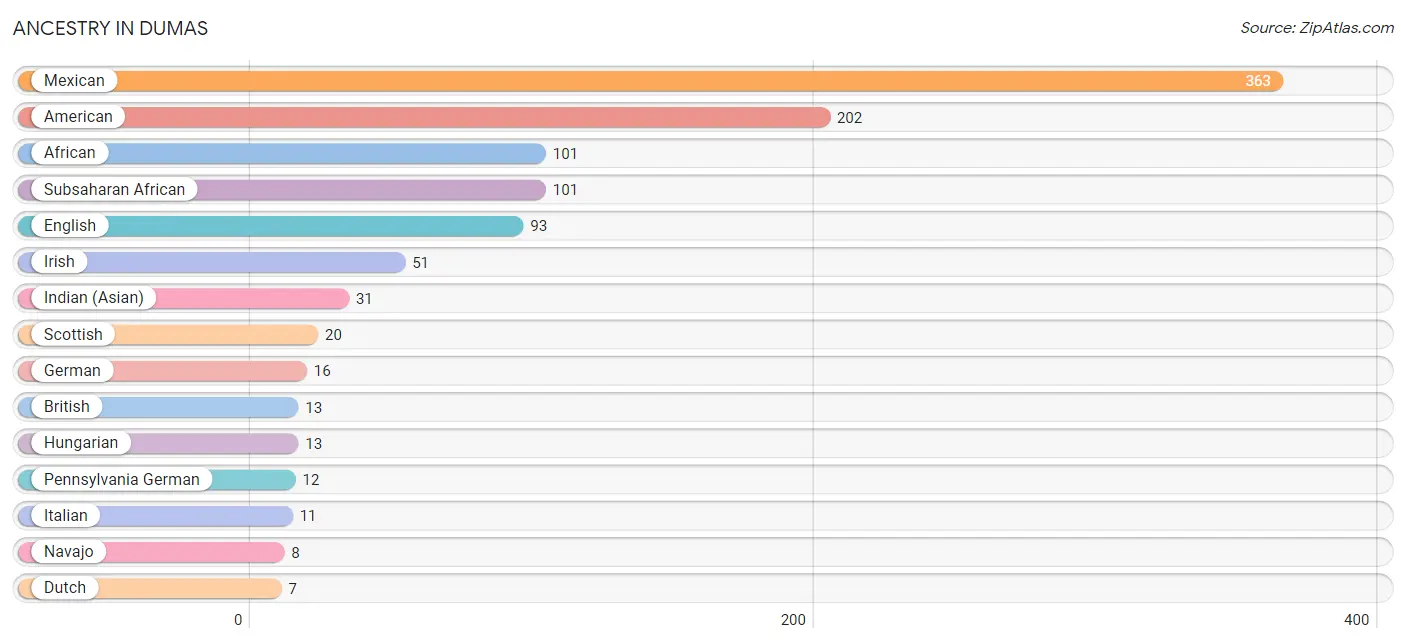
Ancestry in Dumas
The most populous ancestries reported in Dumas are Mexican (363 | 9.2%), American (202 | 5.1%), African (101 | 2.5%), Subsaharan African (101 | 2.5%), and English (93 | 2.4%), together accounting for 21.7% of all Dumas residents.
| Ancestry | # Population | % Population |
| African | 101 | 2.5% |
| American | 202 | 5.1% |
| British | 13 | 0.3% |
| Canadian | 4 | 0.1% |
| Dutch | 7 | 0.2% |
| English | 93 | 2.4% |
| European | 5 | 0.1% |
| German | 16 | 0.4% |
| Hungarian | 13 | 0.3% |
| Indian (Asian) | 31 | 0.8% |
| Irish | 51 | 1.3% |
| Italian | 11 | 0.3% |
| Mexican | 363 | 9.2% |
| Navajo | 8 | 0.2% |
| Pennsylvania German | 12 | 0.3% |
| Scottish | 20 | 0.5% |
| Subsaharan African | 101 | 2.5% | View All 17 Rows |
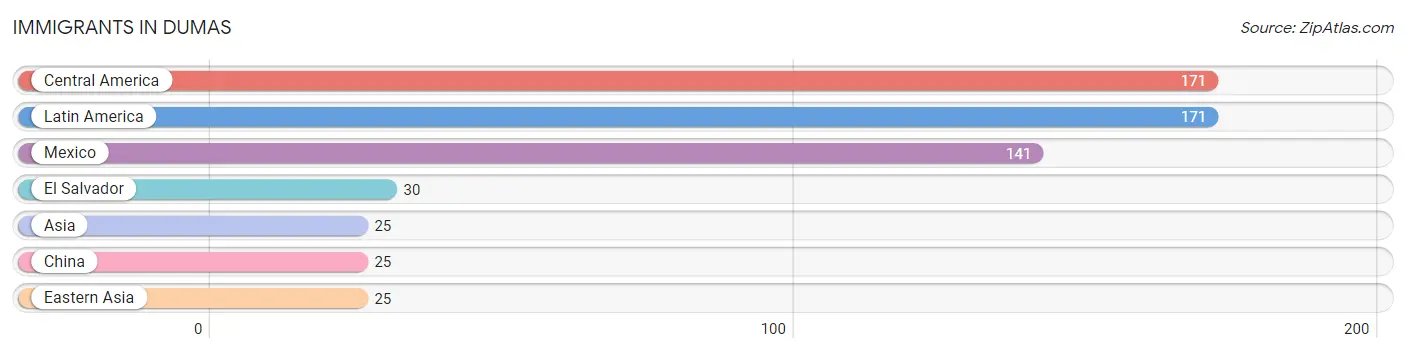
Immigrants in Dumas
The most numerous immigrant groups reported in Dumas came from Central America (171 | 4.3%), Latin America (171 | 4.3%), Mexico (141 | 3.6%), El Salvador (30 | 0.8%), and Asia (25 | 0.6%), together accounting for 13.6% of all Dumas residents.
| Immigration Origin | # Population | % Population |
| Asia | 25 | 0.6% |
| Central America | 171 | 4.3% |
| China | 25 | 0.6% |
| Eastern Asia | 25 | 0.6% |
| El Salvador | 30 | 0.8% |
| Latin America | 171 | 4.3% |
| Mexico | 141 | 3.6% | View All 7 Rows |
Sex and Age in Dumas
Sex and Age in Dumas
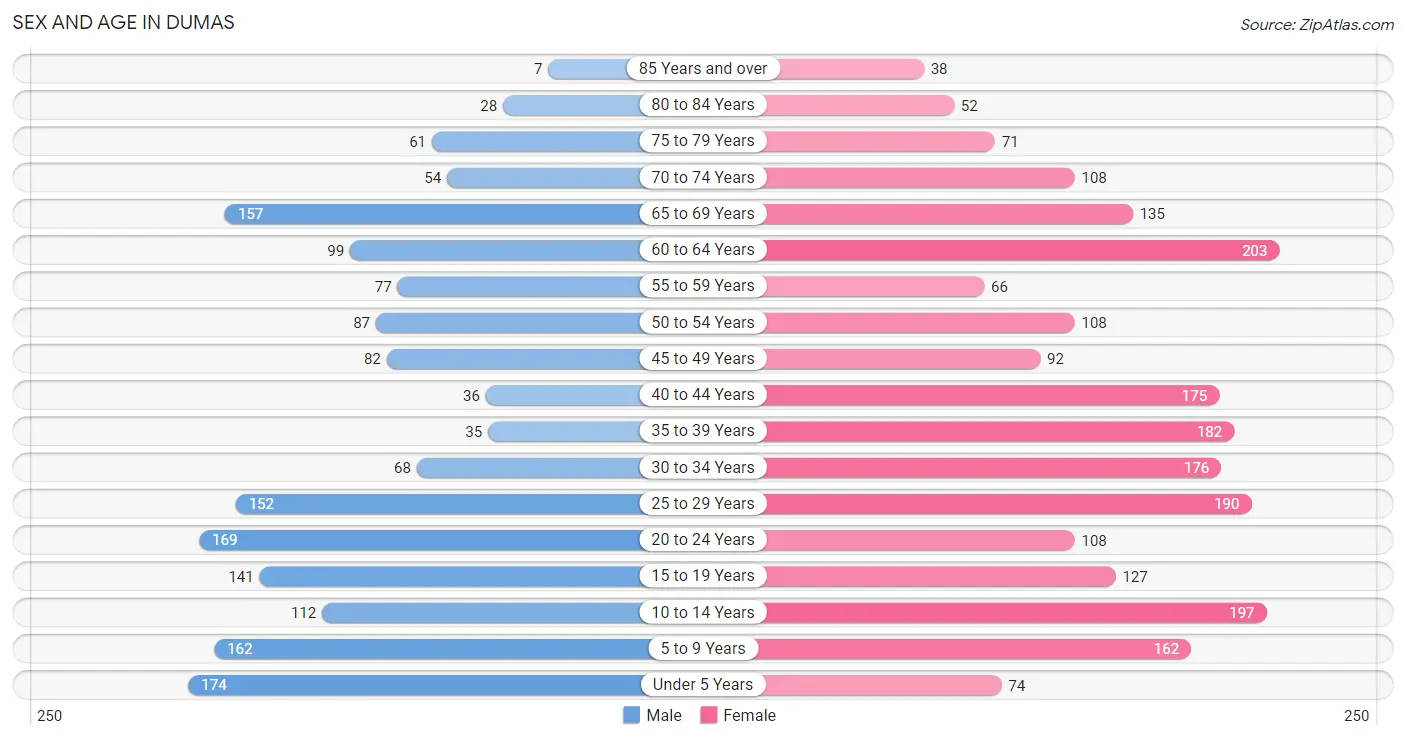
The most populous age groups in Dumas are Under 5 Years (174 | 10.2%) for men and 60 to 64 Years (203 | 9.0%) for women.
| Age Bracket | Male | Female |
| Under 5 Years | 174 (10.2%) | 74 (3.3%) |
| 5 to 9 Years | 162 (9.5%) | 162 (7.2%) |
| 10 to 14 Years | 112 (6.6%) | 197 (8.7%) |
| 15 to 19 Years | 141 (8.3%) | 127 (5.6%) |
| 20 to 24 Years | 169 (9.9%) | 108 (4.8%) |
| 25 to 29 Years | 152 (8.9%) | 190 (8.4%) |
| 30 to 34 Years | 68 (4.0%) | 176 (7.8%) |
| 35 to 39 Years | 35 (2.1%) | 182 (8.0%) |
| 40 to 44 Years | 36 (2.1%) | 175 (7.7%) |
| 45 to 49 Years | 82 (4.8%) | 92 (4.1%) |
| 50 to 54 Years | 87 (5.1%) | 108 (4.8%) |
| 55 to 59 Years | 77 (4.5%) | 66 (2.9%) |
| 60 to 64 Years | 99 (5.8%) | 203 (9.0%) |
| 65 to 69 Years | 157 (9.2%) | 135 (6.0%) |
| 70 to 74 Years | 54 (3.2%) | 108 (4.8%) |
| 75 to 79 Years | 61 (3.6%) | 71 (3.1%) |
| 80 to 84 Years | 28 (1.7%) | 52 (2.3%) |
| 85 Years and over | 7 (0.4%) | 38 (1.7%) |
| Total | 1,701 (100.0%) | 2,264 (100.0%) |
Families and Households in Dumas
Median Family Size in Dumas
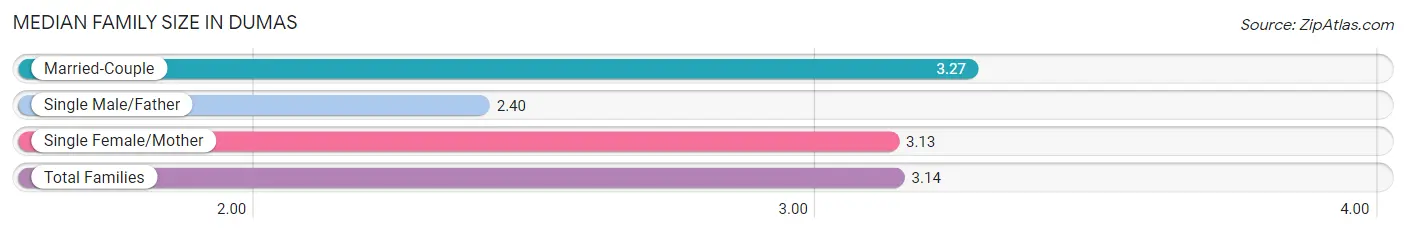
The median family size in Dumas is 3.14 persons per family, with married-couple families (528 | 55.1%) accounting for the largest median family size of 3.27 persons per family. On the other hand, single male/father families (89 | 9.3%) represent the smallest median family size with 2.40 persons per family.
| Family Type | # Families | Family Size |
| Married-Couple | 528 (55.1%) | 3.27 |
| Single Male/Father | 89 (9.3%) | 2.40 |
| Single Female/Mother | 341 (35.6%) | 3.13 |
| Total Families | 958 (100.0%) | 3.14 |
Median Household Size in Dumas
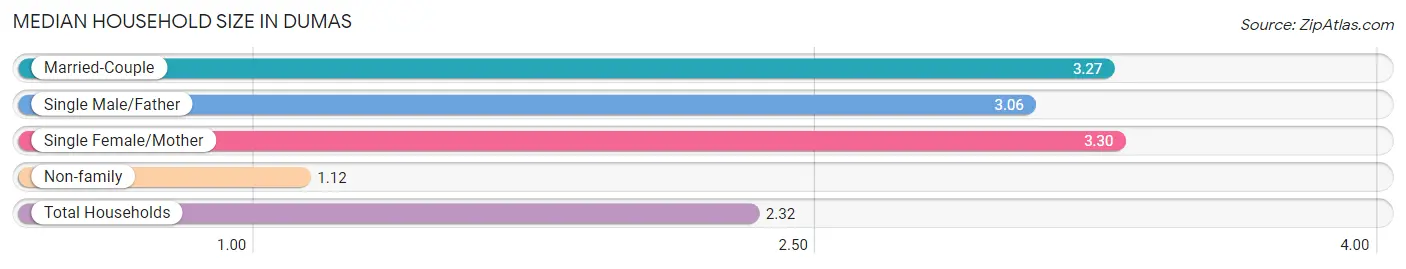
The median household size in Dumas is 2.32 persons per household, with single female/mother households (341 | 20.0%) accounting for the largest median household size of 3.3 persons per household. non-family households (751 | 43.9%) represent the smallest median household size with 1.12 persons per household.
| Household Type | # Households | Household Size |
| Married-Couple | 528 (30.9%) | 3.27 |
| Single Male/Father | 89 (5.2%) | 3.06 |
| Single Female/Mother | 341 (20.0%) | 3.30 |
| Non-family | 751 (43.9%) | 1.12 |
| Total Households | 1,709 (100.0%) | 2.32 |
Household Size by Marriage Status in Dumas
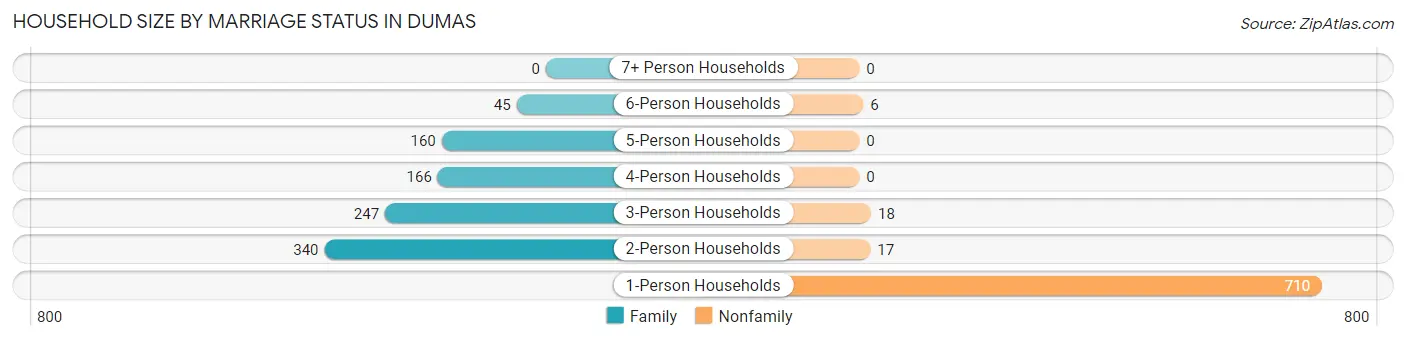
Out of a total of 1,709 households in Dumas, 958 (56.1%) are family households, while 751 (43.9%) are nonfamily households. The most numerous type of family households are 2-person households, comprising 340, and the most common type of nonfamily households are 1-person households, comprising 710.
| Household Size | Family Households | Nonfamily Households |
| 1-Person Households | - | 710 (41.5%) |
| 2-Person Households | 340 (19.9%) | 17 (1.0%) |
| 3-Person Households | 247 (14.4%) | 18 (1.1%) |
| 4-Person Households | 166 (9.7%) | 0 (0.0%) |
| 5-Person Households | 160 (9.4%) | 0 (0.0%) |
| 6-Person Households | 45 (2.6%) | 6 (0.4%) |
| 7+ Person Households | 0 (0.0%) | 0 (0.0%) |
| Total | 958 (56.1%) | 751 (43.9%) |
Female Fertility in Dumas
Fertility by Age in Dumas
Average fertility rate in Dumas is 14.0 births per 1,000 women. Women in the age bracket of 20 to 34 years have the highest fertility rate with 32.0 births per 1,000 women. Women in the age bracket of 20 to 34 years acount for 100.0% of all women with births.
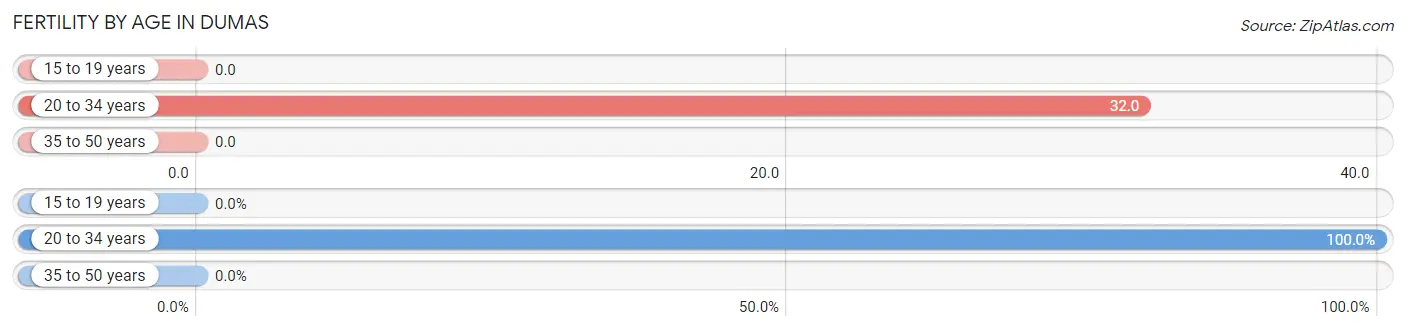
| Age Bracket | Women with Births | Births / 1,000 Women |
| 15 to 19 years | 0 (0.0%) | 0.0 |
| 20 to 34 years | 15 (100.0%) | 32.0 |
| 35 to 50 years | 0 (0.0%) | 0.0 |
| Total | 15 (100.0%) | 14.0 |
Fertility by Age by Marriage Status in Dumas
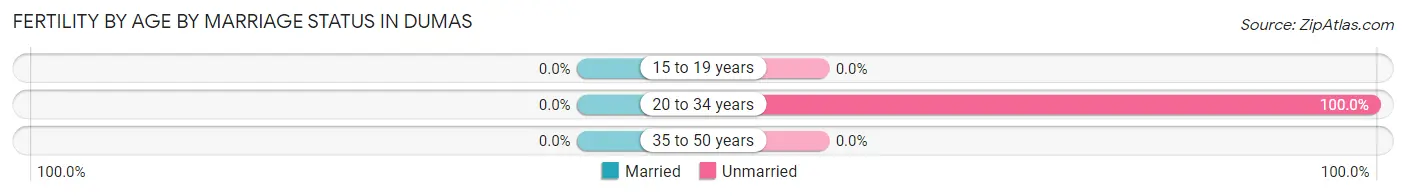
| Age Bracket | Married | Unmarried |
| 15 to 19 years | 0 (0.0%) | 0 (0.0%) |
| 20 to 34 years | 0 (0.0%) | 15 (100.0%) |
| 35 to 50 years | 0 (0.0%) | 0 (0.0%) |
| Total | 0 (0.0%) | 15 (100.0%) |
Fertility by Education in Dumas
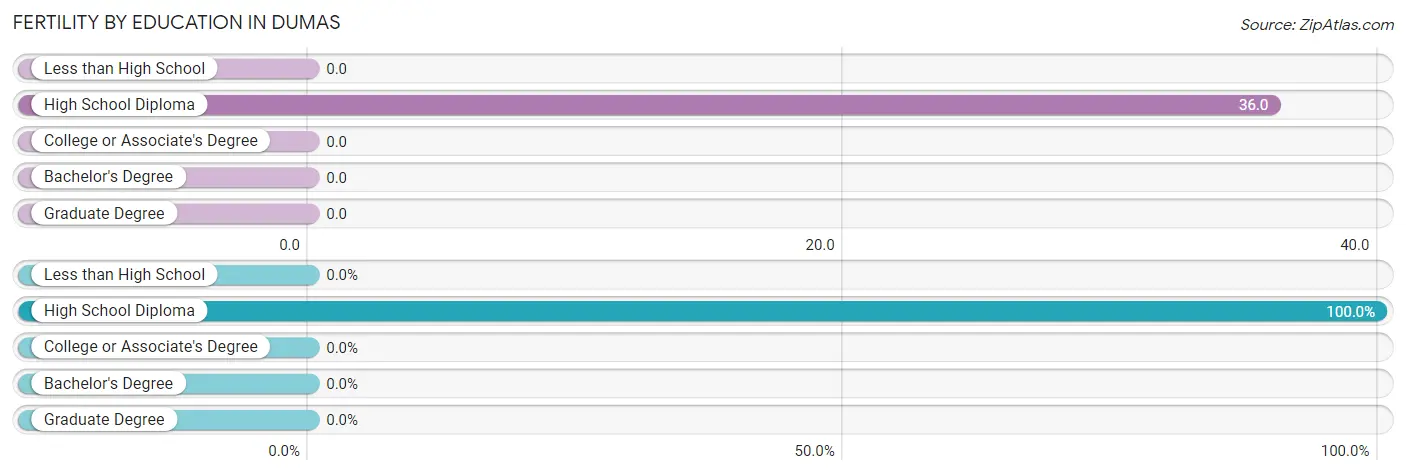
| Educational Attainment | Women with Births | Births / 1,000 Women |
| Less than High School | 0 (0.0%) | 0.0 |
| High School Diploma | 15 (100.0%) | 36.0 |
| College or Associate's Degree | 0 (0.0%) | 0.0 |
| Bachelor's Degree | 0 (0.0%) | 0.0 |
| Graduate Degree | 0 (0.0%) | 0.0 |
| Total | 15 (100.0%) | 14.0 |
Fertility by Education by Marriage Status in Dumas
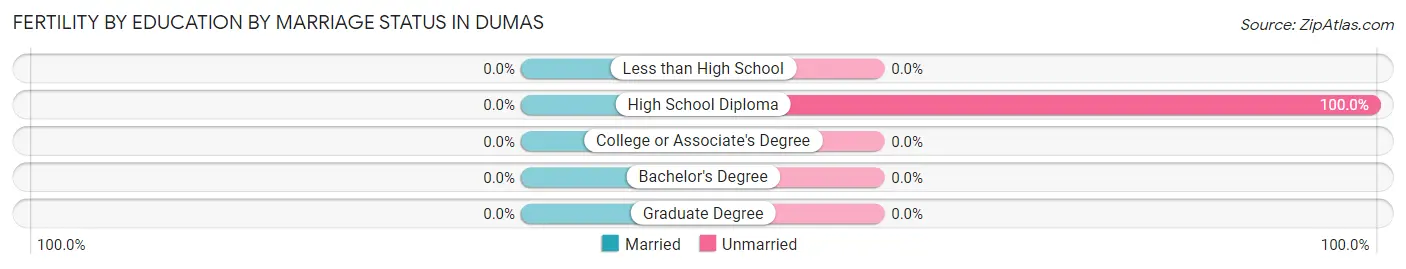
| Educational Attainment | Married | Unmarried |
| Less than High School | 0 (0.0%) | 0 (0.0%) |
| High School Diploma | 0 (0.0%) | 15 (100.0%) |
| College or Associate's Degree | 0 (0.0%) | 0 (0.0%) |
| Bachelor's Degree | 0 (0.0%) | 0 (0.0%) |
| Graduate Degree | 0 (0.0%) | 0 (0.0%) |
| Total | 0 (0.0%) | 15 (100.0%) |
Income in Dumas
Income Overview in Dumas
Per Capita Income in Dumas is $17,722, while median incomes of families and households are $43,500 and $34,554 respectively.
| Characteristic | Number | Measure |
| Per Capita Income | 3,965 | $17,722 |
| Median Family Income | 958 | $43,500 |
| Mean Family Income | 958 | $50,109 |
| Median Household Income | 1,709 | $34,554 |
| Mean Household Income | 1,709 | $41,227 |
| Income Deficit | 958 | $0 |
| Wage / Income Gap (%) | 3,965 | 22.22% |
| Wage / Income Gap ($) | 3,965 | 77.78¢ per $1 |
| Gini / Inequality Index | 3,965 | 0.42 |
Earnings by Sex in Dumas
Average Earnings in Dumas are $27,166, $31,411 for men and $24,433 for women, a difference of 22.2%.
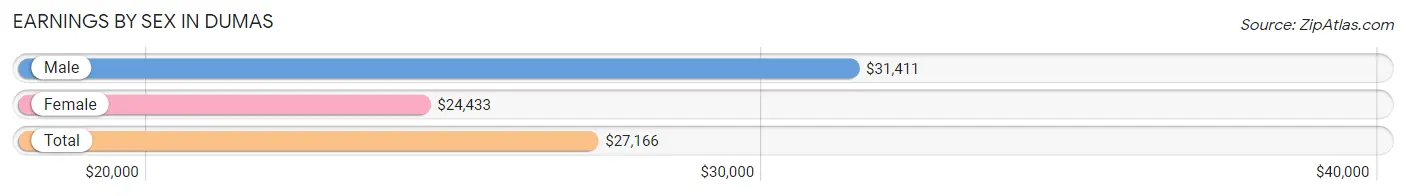
| Sex | Number | Average Earnings |
| Male | 811 (48.1%) | $31,411 |
| Female | 876 (51.9%) | $24,433 |
| Total | 1,687 (100.0%) | $27,166 |
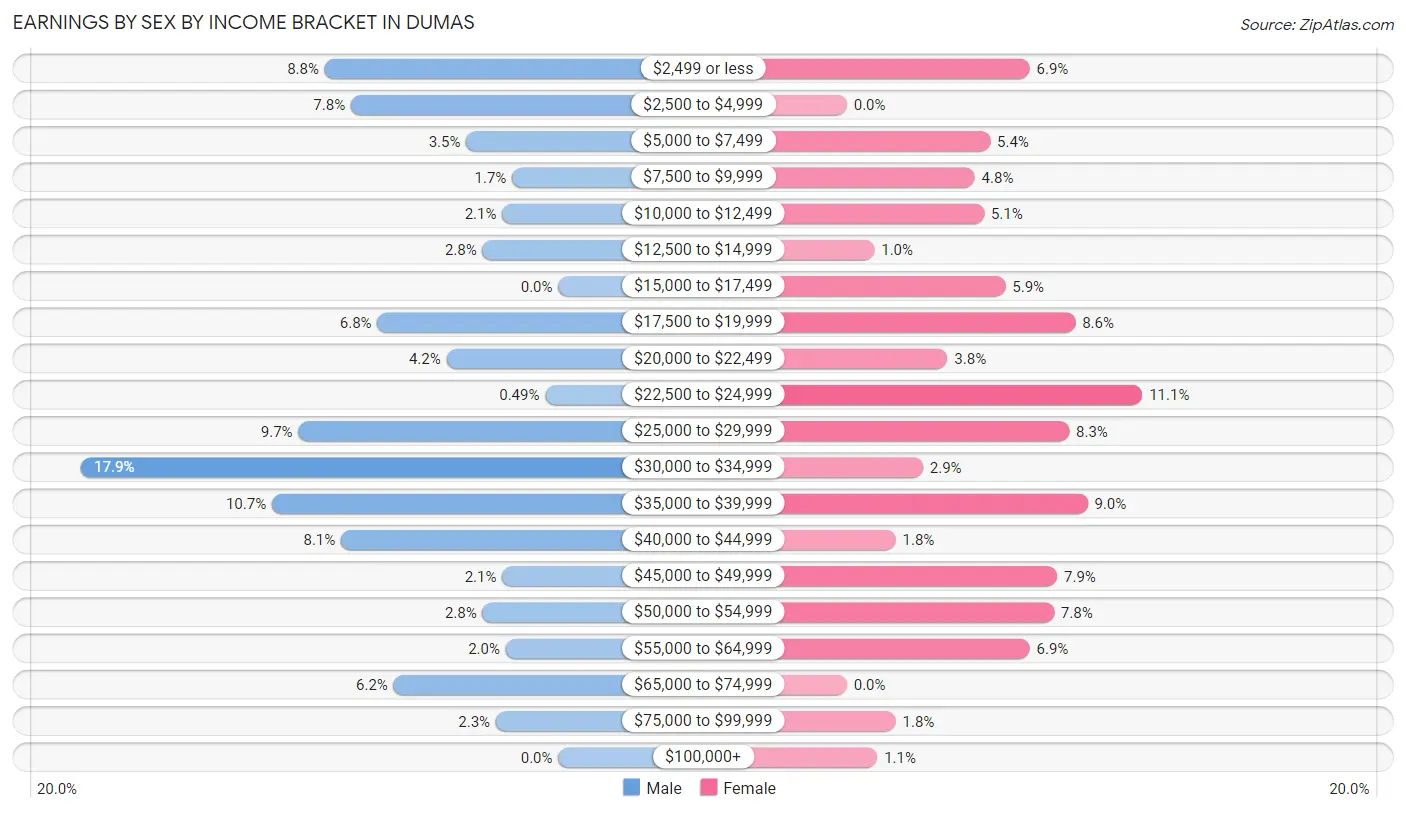
Earnings by Sex by Income Bracket in Dumas
The most common earnings brackets in Dumas are $30,000 to $34,999 for men (145 | 17.9%) and $22,500 to $24,999 for women (97 | 11.1%).
| Income | Male | Female |
| $2,499 or less | 71 (8.7%) | 60 (6.9%) |
| $2,500 to $4,999 | 63 (7.8%) | 0 (0.0%) |
| $5,000 to $7,499 | 28 (3.5%) | 47 (5.4%) |
| $7,500 to $9,999 | 14 (1.7%) | 42 (4.8%) |
| $10,000 to $12,499 | 17 (2.1%) | 45 (5.1%) |
| $12,500 to $14,999 | 23 (2.8%) | 9 (1.0%) |
| $15,000 to $17,499 | 0 (0.0%) | 52 (5.9%) |
| $17,500 to $19,999 | 55 (6.8%) | 75 (8.6%) |
| $20,000 to $22,499 | 34 (4.2%) | 33 (3.8%) |
| $22,500 to $24,999 | 4 (0.5%) | 97 (11.1%) |
| $25,000 to $29,999 | 79 (9.7%) | 73 (8.3%) |
| $30,000 to $34,999 | 145 (17.9%) | 25 (2.9%) |
| $35,000 to $39,999 | 87 (10.7%) | 79 (9.0%) |
| $40,000 to $44,999 | 66 (8.1%) | 16 (1.8%) |
| $45,000 to $49,999 | 17 (2.1%) | 69 (7.9%) |
| $50,000 to $54,999 | 23 (2.8%) | 68 (7.8%) |
| $55,000 to $64,999 | 16 (2.0%) | 60 (6.9%) |
| $65,000 to $74,999 | 50 (6.2%) | 0 (0.0%) |
| $75,000 to $99,999 | 19 (2.3%) | 16 (1.8%) |
| $100,000+ | 0 (0.0%) | 10 (1.1%) |
| Total | 811 (100.0%) | 876 (100.0%) |
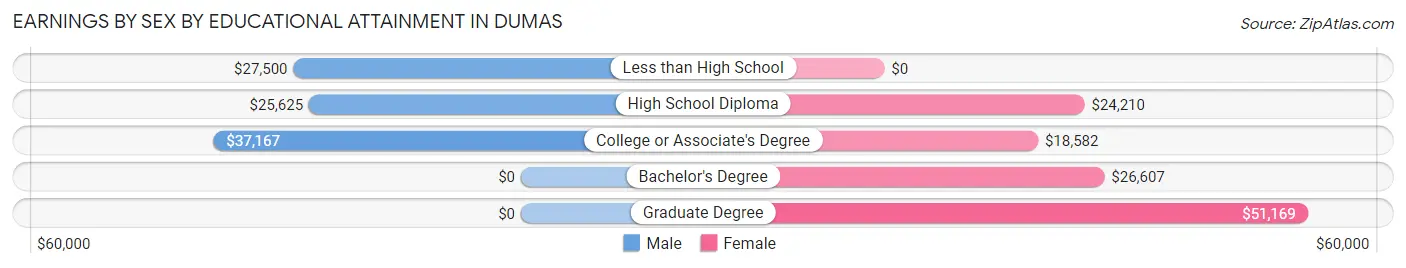
Earnings by Sex by Educational Attainment in Dumas
Average earnings in Dumas are $29,159 for men and $24,150 for women, a difference of 17.2%. Men with an educational attainment of college or associate's degree enjoy the highest average annual earnings of $37,167, while those with high school diploma education earn the least with $25,625. Women with an educational attainment of graduate degree earn the most with the average annual earnings of $51,169, while those with college or associate's degree education have the smallest earnings of $18,582.
| Educational Attainment | Male Income | Female Income |
| Less than High School | $27,500 | $0 |
| High School Diploma | $25,625 | $24,210 |
| College or Associate's Degree | $37,167 | $18,582 |
| Bachelor's Degree | - | - |
| Graduate Degree | - | - |
| Total | $29,159 | $24,150 |
Family Income in Dumas
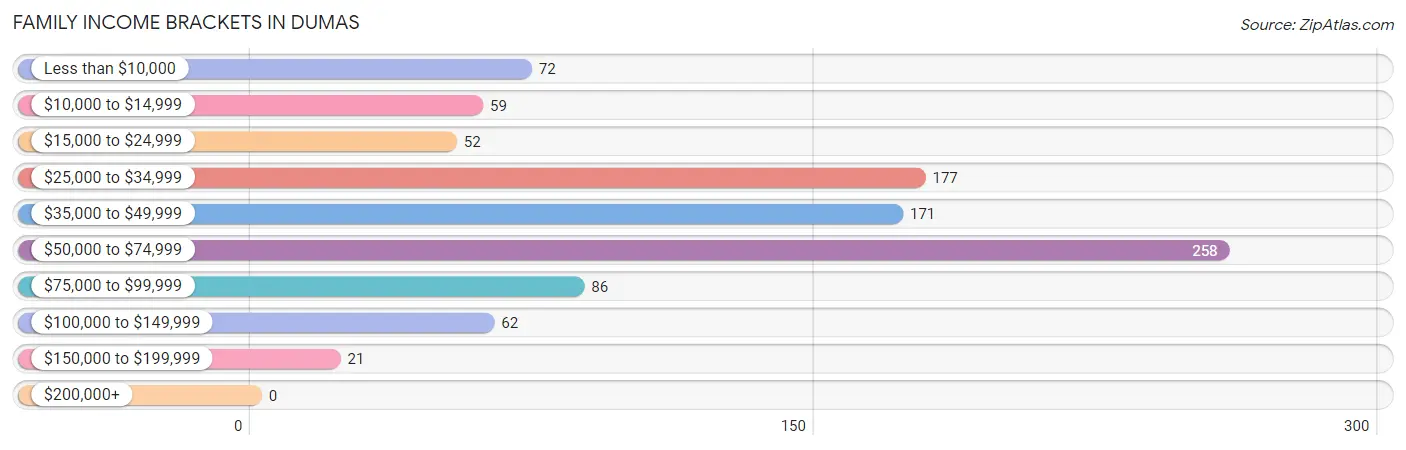
Family Income Brackets in Dumas
According to the Dumas family income data, there are 258 families falling into the $50,000 to $74,999 income range, which is the most common income bracket and makes up 26.9% of all families.
| Income Bracket | # Families | % Families |
| Less than $10,000 | 72 | 7.5% |
| $10,000 to $14,999 | 59 | 6.2% |
| $15,000 to $24,999 | 52 | 5.4% |
| $25,000 to $34,999 | 177 | 18.5% |
| $35,000 to $49,999 | 171 | 17.8% |
| $50,000 to $74,999 | 258 | 26.9% |
| $75,000 to $99,999 | 86 | 9.0% |
| $100,000 to $149,999 | 62 | 6.5% |
| $150,000 to $199,999 | 21 | 2.2% |
| $200,000+ | 0 | 0.0% |
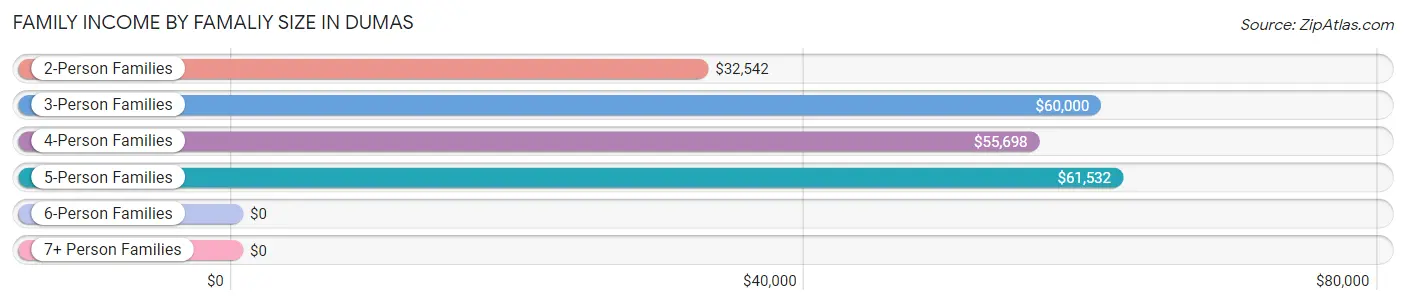
Family Income by Famaliy Size in Dumas
5-person families (154 | 16.1%) account for the highest median family income in Dumas with $61,532 per family, while 3-person families (234 | 24.4%) have the highest median income of $20,000 per family member.
| Income Bracket | # Families | Median Income |
| 2-Person Families | 405 (42.3%) | $32,542 |
| 3-Person Families | 234 (24.4%) | $60,000 |
| 4-Person Families | 120 (12.5%) | $55,698 |
| 5-Person Families | 154 (16.1%) | $61,532 |
| 6-Person Families | 45 (4.7%) | $0 |
| 7+ Person Families | 0 (0.0%) | $0 |
| Total | 958 (100.0%) | $43,500 |
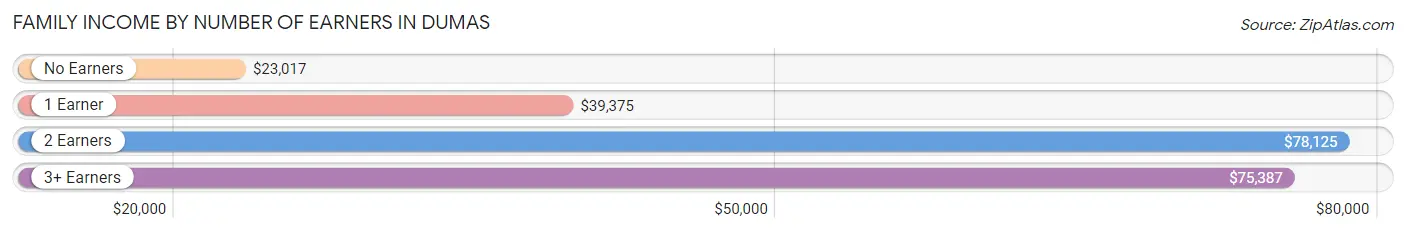
Family Income by Number of Earners in Dumas
The median family income in Dumas is $43,500, with families comprising 2 earners (174) having the highest median family income of $78,125, while families with no earners (176) have the lowest median family income of $23,017, accounting for 18.2% and 18.4% of families, respectively.
| Number of Earners | # Families | Median Income |
| No Earners | 176 (18.4%) | $23,017 |
| 1 Earner | 499 (52.1%) | $39,375 |
| 2 Earners | 174 (18.2%) | $78,125 |
| 3+ Earners | 109 (11.4%) | $75,387 |
| Total | 958 (100.0%) | $43,500 |
Household Income in Dumas
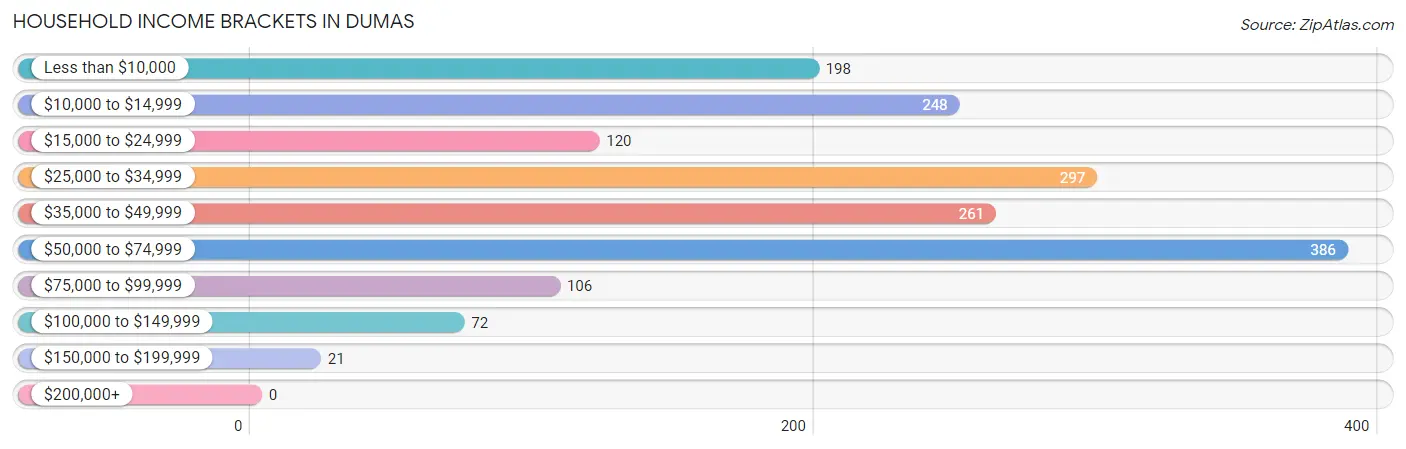
Household Income Brackets in Dumas
With 386 households falling in the category, the $50,000 to $74,999 income range is the most frequent in Dumas, accounting for 22.6% of all households.
| Income Bracket | # Households | % Households |
| Less than $10,000 | 198 | 11.6% |
| $10,000 to $14,999 | 248 | 14.5% |
| $15,000 to $24,999 | 120 | 7.0% |
| $25,000 to $34,999 | 297 | 17.4% |
| $35,000 to $49,999 | 261 | 15.3% |
| $50,000 to $74,999 | 386 | 22.6% |
| $75,000 to $99,999 | 106 | 6.2% |
| $100,000 to $149,999 | 72 | 4.2% |
| $150,000 to $199,999 | 21 | 1.2% |
| $200,000+ | 0 | 0.0% |
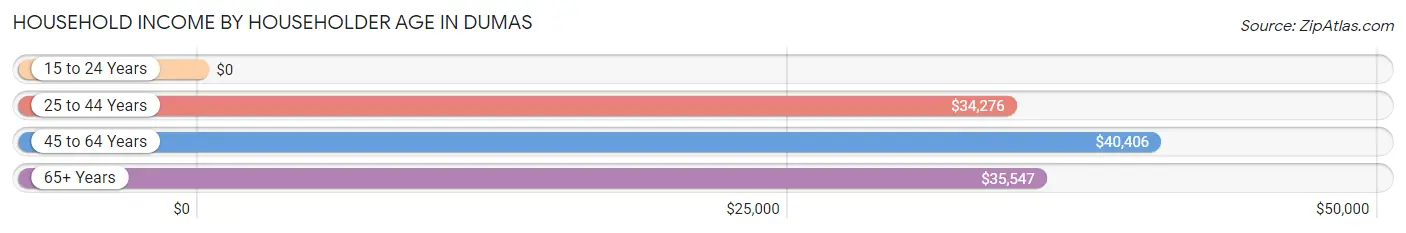
Household Income by Householder Age in Dumas
The median household income in Dumas is $34,554, with the highest median household income of $40,406 found in the 45 to 64 years age bracket for the primary householder. A total of 543 households (31.8%) fall into this category. Meanwhile, the 15 to 24 years age bracket for the primary householder has the lowest median household income of $0, with 24 households (1.4%) in this group.
| Income Bracket | # Households | Median Income |
| 15 to 24 Years | 24 (1.4%) | $0 |
| 25 to 44 Years | 595 (34.8%) | $34,276 |
| 45 to 64 Years | 543 (31.8%) | $40,406 |
| 65+ Years | 547 (32.0%) | $35,547 |
| Total | 1,709 (100.0%) | $34,554 |
Poverty in Dumas
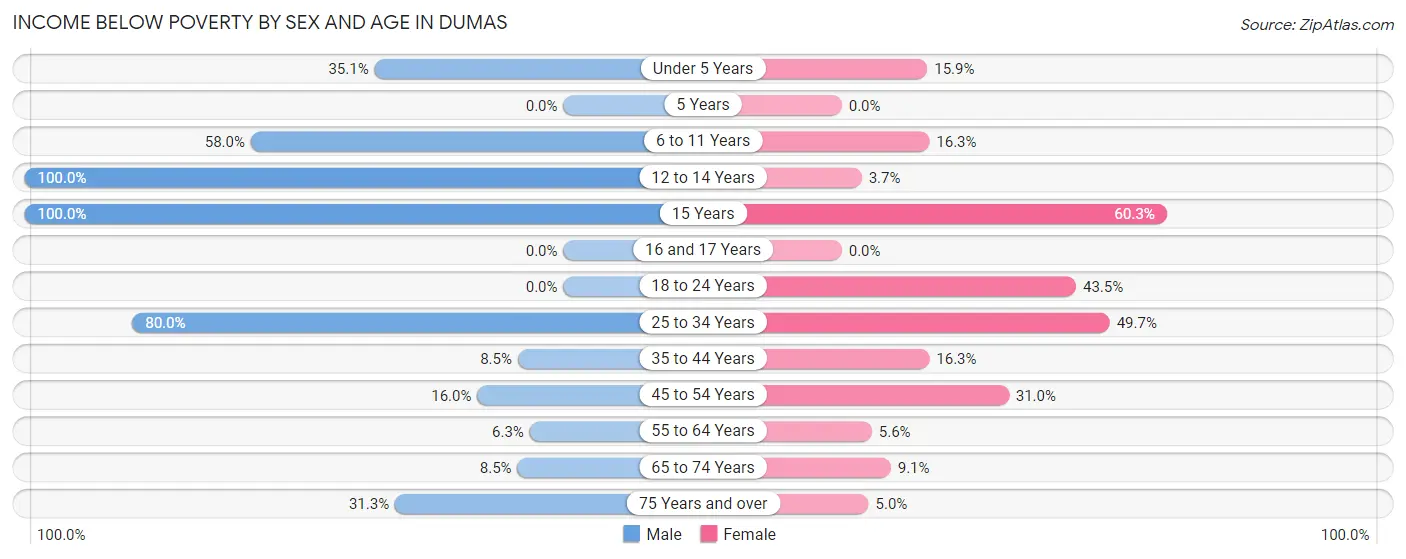
Income Below Poverty by Sex and Age in Dumas
With 31.6% poverty level for males and 21.9% for females among the residents of Dumas, 12 to 14 year old males and 15 year old females are the most vulnerable to poverty, with 23 males (100.0%) and 41 females (60.3%) in their respective age groups living below the poverty level.
| Age Bracket | Male | Female |
| Under 5 Years | 61 (35.1%) | 10 (15.9%) |
| 5 Years | 0 (0.0%) | 0 (0.0%) |
| 6 to 11 Years | 141 (58.0%) | 39 (16.3%) |
| 12 to 14 Years | 23 (100.0%) | 4 (3.7%) |
| 15 Years | 44 (100.0%) | 41 (60.3%) |
| 16 and 17 Years | 0 (0.0%) | 0 (0.0%) |
| 18 to 24 Years | 0 (0.0%) | 50 (43.5%) |
| 25 to 34 Years | 176 (80.0%) | 182 (49.7%) |
| 35 to 44 Years | 6 (8.5%) | 58 (16.3%) |
| 45 to 54 Years | 27 (16.0%) | 62 (31.0%) |
| 55 to 64 Years | 11 (6.2%) | 15 (5.6%) |
| 65 to 74 Years | 18 (8.5%) | 22 (9.1%) |
| 75 Years and over | 30 (31.2%) | 8 (5.0%) |
| Total | 537 (31.6%) | 491 (21.9%) |
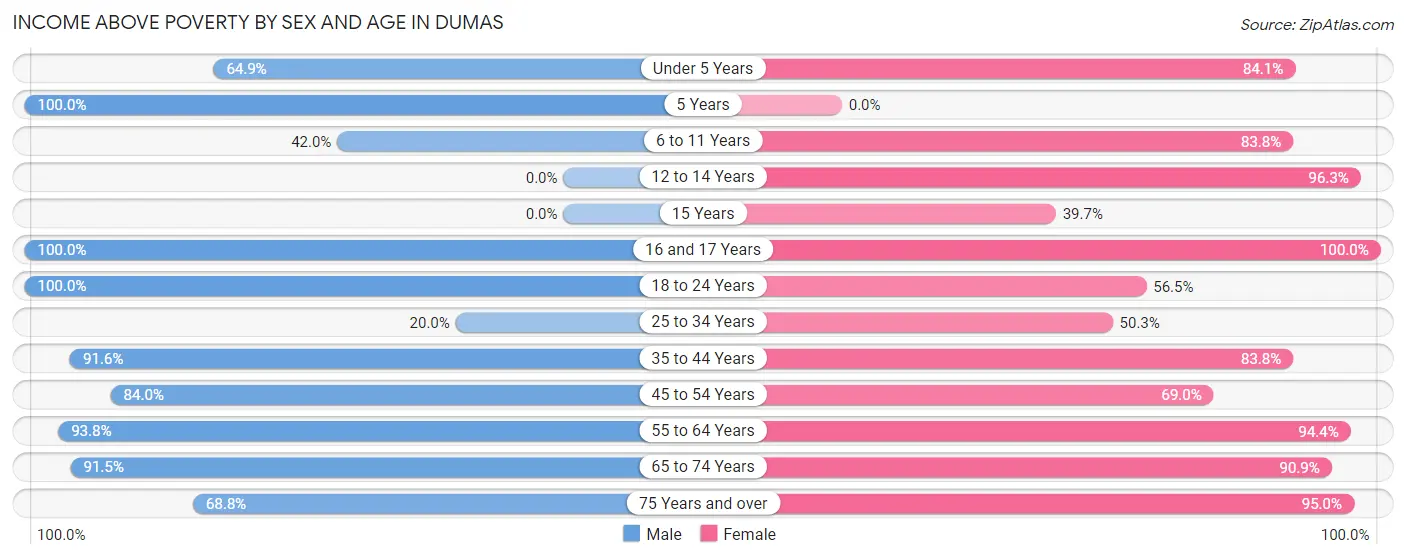
Income Above Poverty by Sex and Age in Dumas
According to the poverty statistics in Dumas, males aged 5 years and females aged 16 and 17 years are the age groups that are most secure financially, with 100.0% of males and 100.0% of females in these age groups living above the poverty line.
| Age Bracket | Male | Female |
| Under 5 Years | 113 (64.9%) | 53 (84.1%) |
| 5 Years | 8 (100.0%) | 0 (0.0%) |
| 6 to 11 Years | 102 (42.0%) | 201 (83.8%) |
| 12 to 14 Years | 0 (0.0%) | 104 (96.3%) |
| 15 Years | 0 (0.0%) | 27 (39.7%) |
| 16 and 17 Years | 5 (100.0%) | 52 (100.0%) |
| 18 to 24 Years | 261 (100.0%) | 65 (56.5%) |
| 25 to 34 Years | 44 (20.0%) | 184 (50.3%) |
| 35 to 44 Years | 65 (91.5%) | 299 (83.8%) |
| 45 to 54 Years | 142 (84.0%) | 138 (69.0%) |
| 55 to 64 Years | 165 (93.8%) | 254 (94.4%) |
| 65 to 74 Years | 193 (91.5%) | 220 (90.9%) |
| 75 Years and over | 66 (68.8%) | 153 (95.0%) |
| Total | 1,164 (68.4%) | 1,750 (78.1%) |
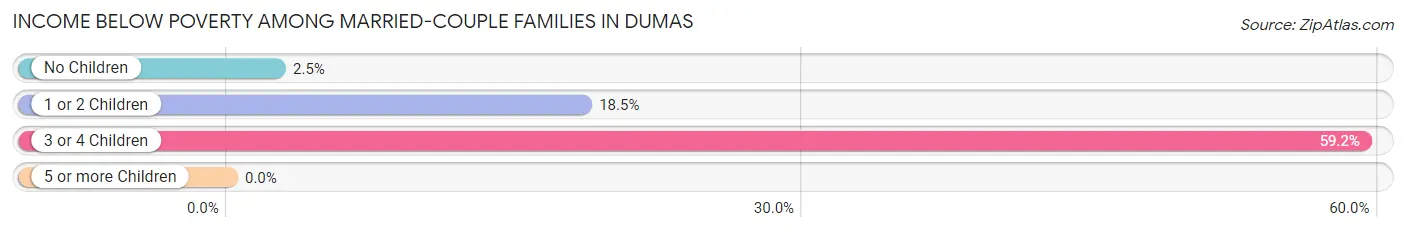
Income Below Poverty Among Married-Couple Families in Dumas
The poverty statistics for married-couple families in Dumas show that 15.9% or 84 of the total 528 families live below the poverty line. Families with 3 or 4 children have the highest poverty rate of 59.2%, comprising of 45 families. On the other hand, families with no children have the lowest poverty rate of 2.5%, which includes 7 families.
| Children | Above Poverty | Below Poverty |
| No Children | 272 (97.5%) | 7 (2.5%) |
| 1 or 2 Children | 141 (81.5%) | 32 (18.5%) |
| 3 or 4 Children | 31 (40.8%) | 45 (59.2%) |
| 5 or more Children | 0 (0.0%) | 0 (0.0%) |
| Total | 444 (84.1%) | 84 (15.9%) |
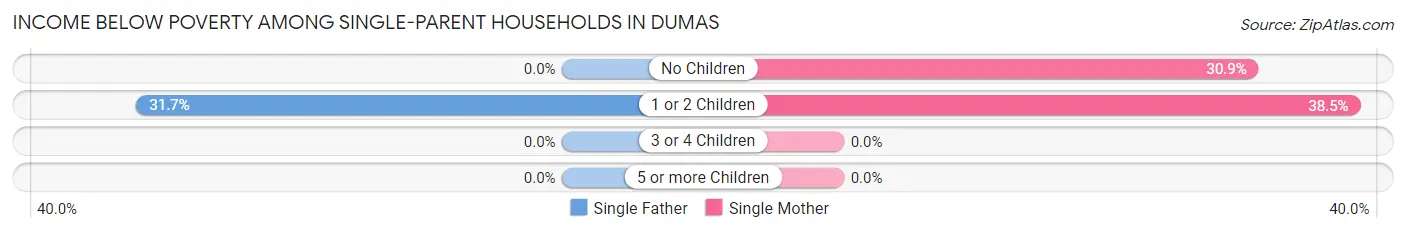
Income Below Poverty Among Single-Parent Households in Dumas
According to the poverty data in Dumas, 21.3% or 19 single-father households and 32.6% or 111 single-mother households are living below the poverty line. Among single-father households, those with 1 or 2 children have the highest poverty rate, with 19 households (31.7%) experiencing poverty. Likewise, among single-mother households, those with 1 or 2 children have the highest poverty rate, with 77 households (38.5%) falling below the poverty line.
| Children | Single Father | Single Mother |
| No Children | 0 (0.0%) | 34 (30.9%) |
| 1 or 2 Children | 19 (31.7%) | 77 (38.5%) |
| 3 or 4 Children | 0 (0.0%) | 0 (0.0%) |
| 5 or more Children | 0 (0.0%) | 0 (0.0%) |
| Total | 19 (21.3%) | 111 (32.6%) |
Income Below Poverty Among Married-Couple vs Single-Parent Households in Dumas
The poverty data for Dumas shows that 84 of the married-couple family households (15.9%) and 130 of the single-parent households (30.2%) are living below the poverty level. Within the married-couple family households, those with 3 or 4 children have the highest poverty rate, with 45 households (59.2%) falling below the poverty line. Among the single-parent households, those with 1 or 2 children have the highest poverty rate, with 96 household (36.9%) living below poverty.
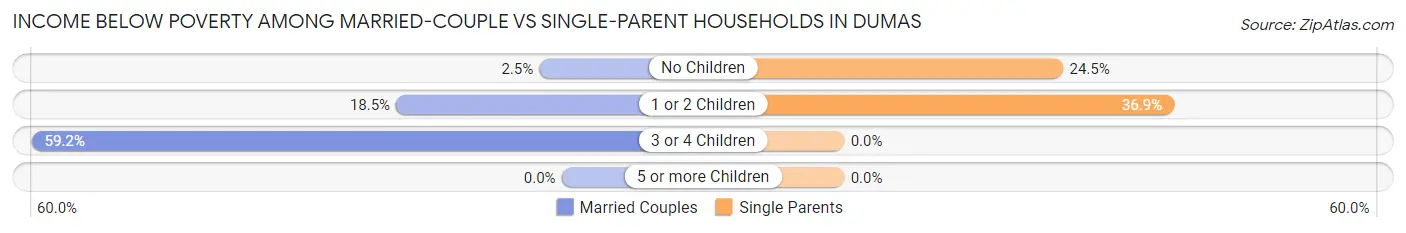
| Children | Married-Couple Families | Single-Parent Households |
| No Children | 7 (2.5%) | 34 (24.5%) |
| 1 or 2 Children | 32 (18.5%) | 96 (36.9%) |
| 3 or 4 Children | 45 (59.2%) | 0 (0.0%) |
| 5 or more Children | 0 (0.0%) | 0 (0.0%) |
| Total | 84 (15.9%) | 130 (30.2%) |
Employment Characteristics in Dumas
Employment by Class of Employer in Dumas
Among the 1,444 employed individuals in Dumas, private company employees (953 | 66.0%), state government employees (211 | 14.6%), and local government employees (104 | 7.2%) make up the most common classes of employment.
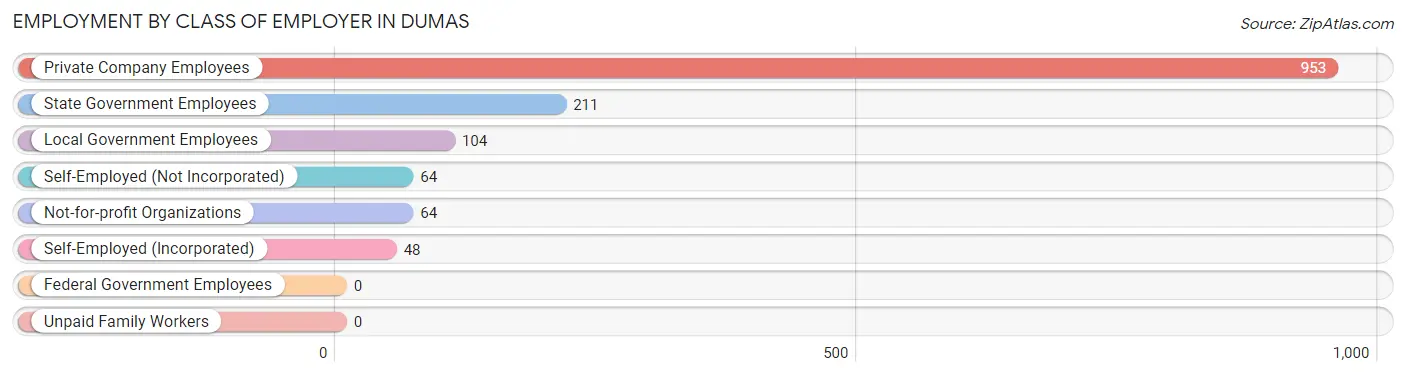
| Employer Class | # Employees | % Employees |
| Private Company Employees | 953 | 66.0% |
| Self-Employed (Incorporated) | 48 | 3.3% |
| Self-Employed (Not Incorporated) | 64 | 4.4% |
| Not-for-profit Organizations | 64 | 4.4% |
| Local Government Employees | 104 | 7.2% |
| State Government Employees | 211 | 14.6% |
| Federal Government Employees | 0 | 0.0% |
| Unpaid Family Workers | 0 | 0.0% |
| Total | 1,444 | 100.0% |
Employment Status by Age in Dumas
According to the labor force statistics for Dumas, out of the total population over 16 years of age (2,972), 53.4% or 1,587 individuals are in the labor force, with 9.0% or 143 of them unemployed. The age group with the highest labor force participation rate is 30 to 34 years, with 87.3% or 213 individuals in the labor force. Within the labor force, the 25 to 29 years age range has the highest percentage of unemployed individuals, with 35.8% or 63 of them being unemployed.
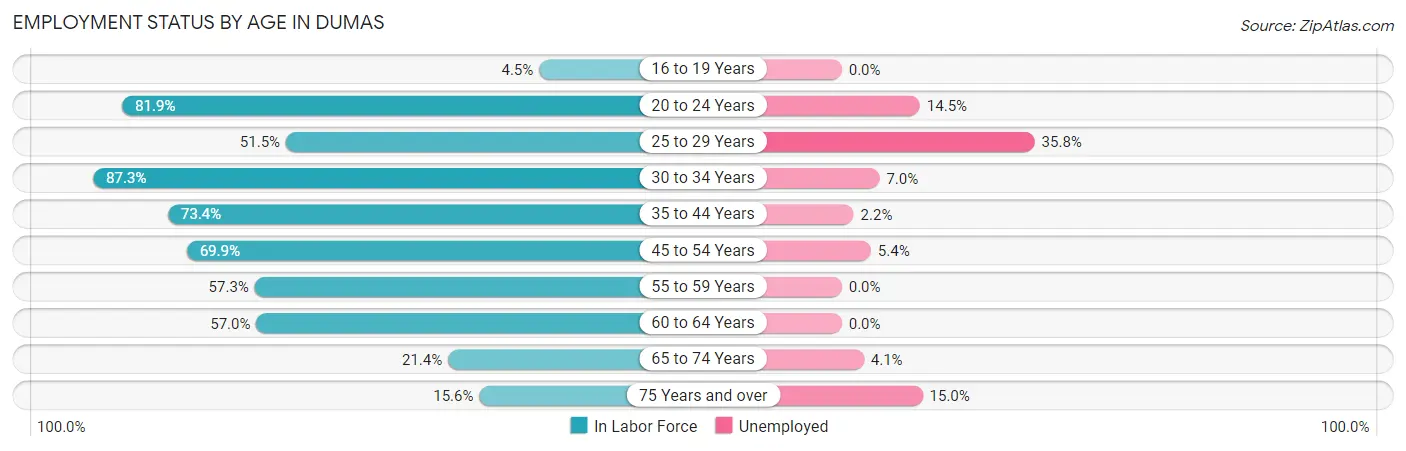
| Age Bracket | In Labor Force | Unemployed |
| 16 to 19 Years | 7 (4.5%) | 0 (0.0%) |
| 20 to 24 Years | 227 (81.9%) | 33 (14.5%) |
| 25 to 29 Years | 176 (51.5%) | 63 (35.8%) |
| 30 to 34 Years | 213 (87.3%) | 15 (7.0%) |
| 35 to 44 Years | 314 (73.4%) | 7 (2.2%) |
| 45 to 54 Years | 258 (69.9%) | 14 (5.4%) |
| 55 to 59 Years | 82 (57.3%) | 0 (0.0%) |
| 60 to 64 Years | 172 (57.0%) | 0 (0.0%) |
| 65 to 74 Years | 97 (21.4%) | 4 (4.1%) |
| 75 Years and over | 40 (15.6%) | 6 (15.0%) |
| Total | 1,587 (53.4%) | 143 (9.0%) |
Employment Status by Educational Attainment in Dumas
According to labor force statistics for Dumas, 66.5% of individuals (1,216) out of the total population between 25 and 64 years of age (1,828) are in the labor force, with 8.1% or 98 of them being unemployed. The group with the highest labor force participation rate are those with the educational attainment of bachelor's degree or higher, with 91.5% or 205 individuals in the labor force. Within the labor force, individuals with high school diploma education have the highest percentage of unemployment, with 19.4% or 99 of them being unemployed.
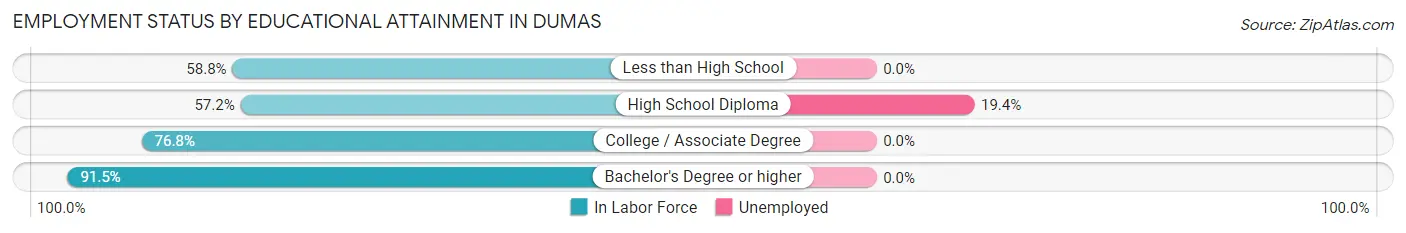
| Educational Attainment | In Labor Force | Unemployed |
| Less than High School | 154 (58.8%) | 0 (0.0%) |
| High School Diploma | 509 (57.2%) | 173 (19.4%) |
| College / Associate Degree | 347 (76.8%) | 0 (0.0%) |
| Bachelor's Degree or higher | 205 (91.5%) | 0 (0.0%) |
| Total | 1,216 (66.5%) | 148 (8.1%) |
Employment Occupations by Sex in Dumas
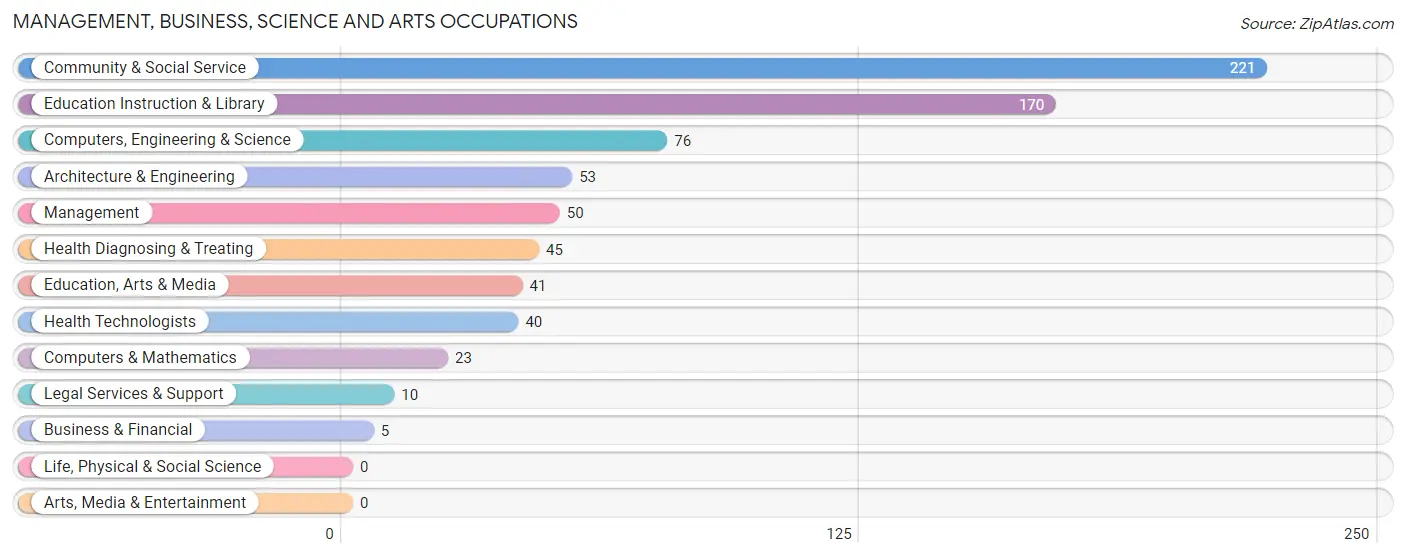
Management, Business, Science and Arts Occupations
The most common Management, Business, Science and Arts occupations in Dumas are Community & Social Service (221 | 15.3%), Education Instruction & Library (170 | 11.8%), Computers, Engineering & Science (76 | 5.3%), Architecture & Engineering (53 | 3.7%), and Management (50 | 3.5%).
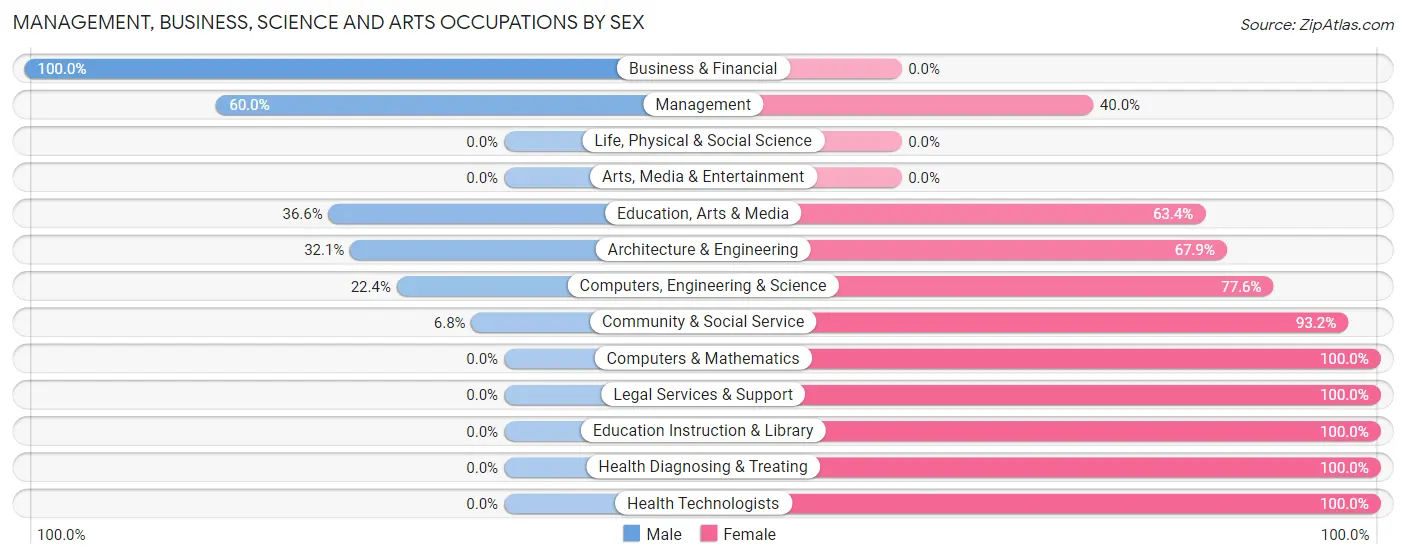
Management, Business, Science and Arts Occupations by Sex
Within the Management, Business, Science and Arts occupations in Dumas, the most male-oriented occupations are Business & Financial (100.0%), Management (60.0%), and Education, Arts & Media (36.6%), while the most female-oriented occupations are Computers & Mathematics (100.0%), Legal Services & Support (100.0%), and Education Instruction & Library (100.0%).
| Occupation | Male | Female |
| Management | 30 (60.0%) | 20 (40.0%) |
| Business & Financial | 5 (100.0%) | 0 (0.0%) |
| Computers, Engineering & Science | 17 (22.4%) | 59 (77.6%) |
| Computers & Mathematics | 0 (0.0%) | 23 (100.0%) |
| Architecture & Engineering | 17 (32.1%) | 36 (67.9%) |
| Life, Physical & Social Science | 0 (0.0%) | 0 (0.0%) |
| Community & Social Service | 15 (6.8%) | 206 (93.2%) |
| Education, Arts & Media | 15 (36.6%) | 26 (63.4%) |
| Legal Services & Support | 0 (0.0%) | 10 (100.0%) |
| Education Instruction & Library | 0 (0.0%) | 170 (100.0%) |
| Arts, Media & Entertainment | 0 (0.0%) | 0 (0.0%) |
| Health Diagnosing & Treating | 0 (0.0%) | 45 (100.0%) |
| Health Technologists | 0 (0.0%) | 40 (100.0%) |
| Total (Category) | 67 (16.9%) | 330 (83.1%) |
| Total (Overall) | 669 (46.3%) | 775 (53.7%) |
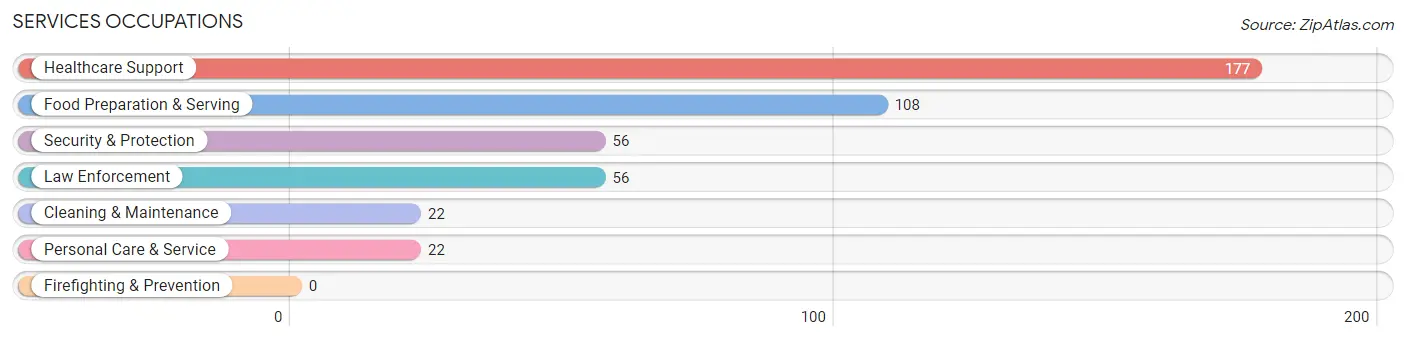
Services Occupations
The most common Services occupations in Dumas are Healthcare Support (177 | 12.3%), Food Preparation & Serving (108 | 7.5%), Security & Protection (56 | 3.9%), Law Enforcement (56 | 3.9%), and Cleaning & Maintenance (22 | 1.5%).
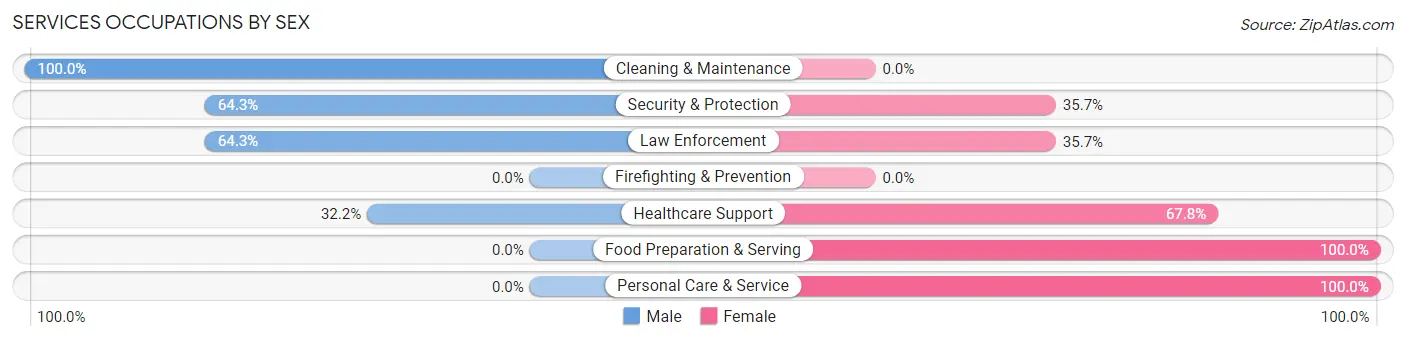
Services Occupations by Sex
Within the Services occupations in Dumas, the most male-oriented occupations are Cleaning & Maintenance (100.0%), Security & Protection (64.3%), and Law Enforcement (64.3%), while the most female-oriented occupations are Food Preparation & Serving (100.0%), Personal Care & Service (100.0%), and Healthcare Support (67.8%).
| Occupation | Male | Female |
| Healthcare Support | 57 (32.2%) | 120 (67.8%) |
| Security & Protection | 36 (64.3%) | 20 (35.7%) |
| Firefighting & Prevention | 0 (0.0%) | 0 (0.0%) |
| Law Enforcement | 36 (64.3%) | 20 (35.7%) |
| Food Preparation & Serving | 0 (0.0%) | 108 (100.0%) |
| Cleaning & Maintenance | 22 (100.0%) | 0 (0.0%) |
| Personal Care & Service | 0 (0.0%) | 22 (100.0%) |
| Total (Category) | 115 (29.9%) | 270 (70.1%) |
| Total (Overall) | 669 (46.3%) | 775 (53.7%) |
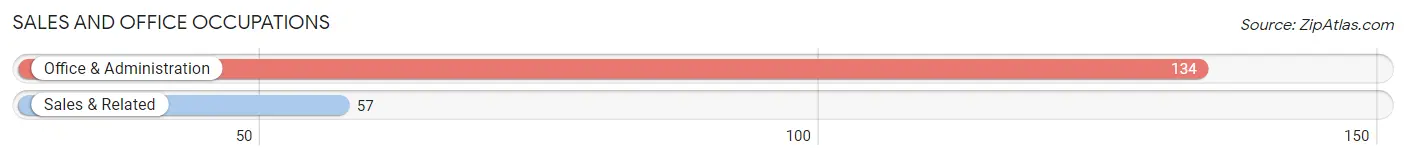
Sales and Office Occupations
The most common Sales and Office occupations in Dumas are Office & Administration (134 | 9.3%), and Sales & Related (57 | 4.0%).
Sales and Office Occupations by Sex
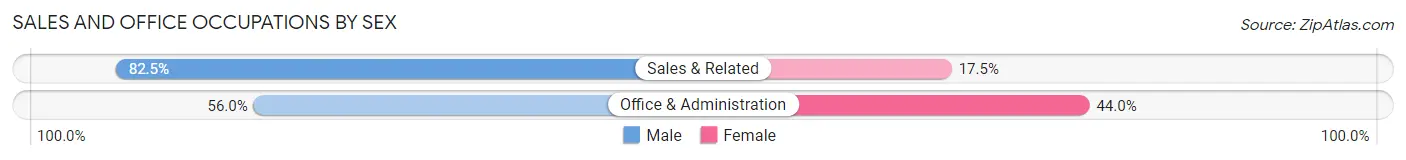
| Occupation | Male | Female |
| Sales & Related | 47 (82.5%) | 10 (17.5%) |
| Office & Administration | 75 (56.0%) | 59 (44.0%) |
| Total (Category) | 122 (63.9%) | 69 (36.1%) |
| Total (Overall) | 669 (46.3%) | 775 (53.7%) |
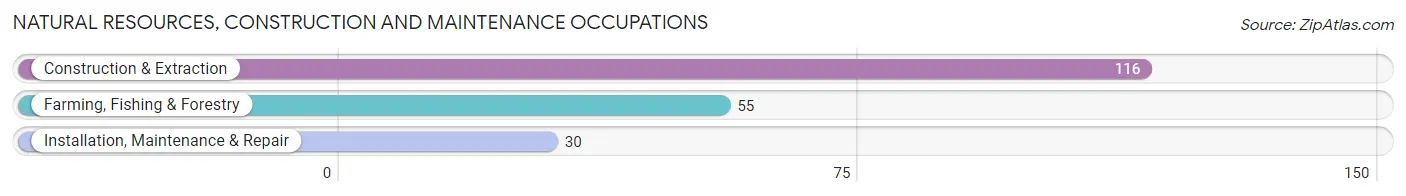
Natural Resources, Construction and Maintenance Occupations
The most common Natural Resources, Construction and Maintenance occupations in Dumas are Construction & Extraction (116 | 8.0%), Farming, Fishing & Forestry (55 | 3.8%), and Installation, Maintenance & Repair (30 | 2.1%).
Natural Resources, Construction and Maintenance Occupations by Sex
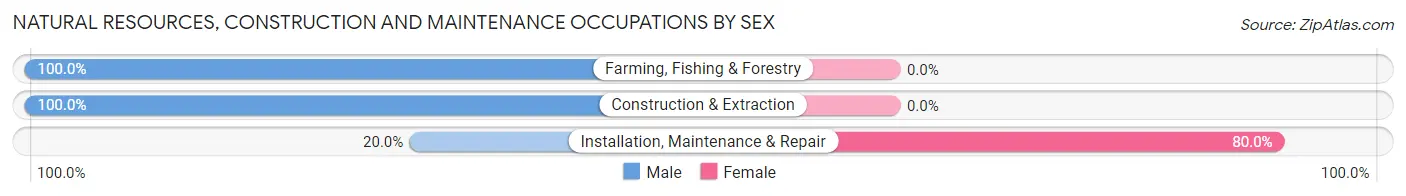
| Occupation | Male | Female |
| Farming, Fishing & Forestry | 55 (100.0%) | 0 (0.0%) |
| Construction & Extraction | 116 (100.0%) | 0 (0.0%) |
| Installation, Maintenance & Repair | 6 (20.0%) | 24 (80.0%) |
| Total (Category) | 177 (88.1%) | 24 (11.9%) |
| Total (Overall) | 669 (46.3%) | 775 (53.7%) |
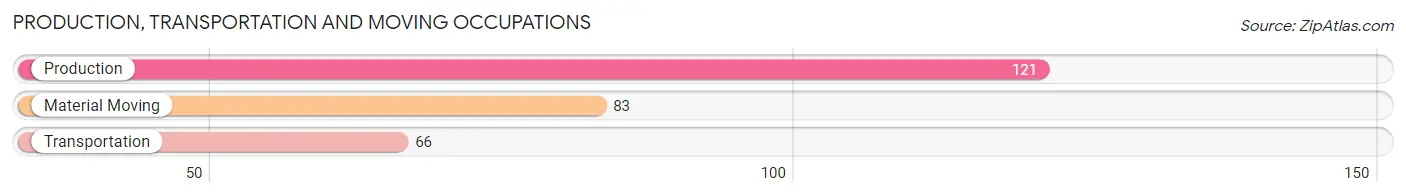
Production, Transportation and Moving Occupations
The most common Production, Transportation and Moving occupations in Dumas are Production (121 | 8.4%), Material Moving (83 | 5.8%), and Transportation (66 | 4.6%).
Production, Transportation and Moving Occupations by Sex
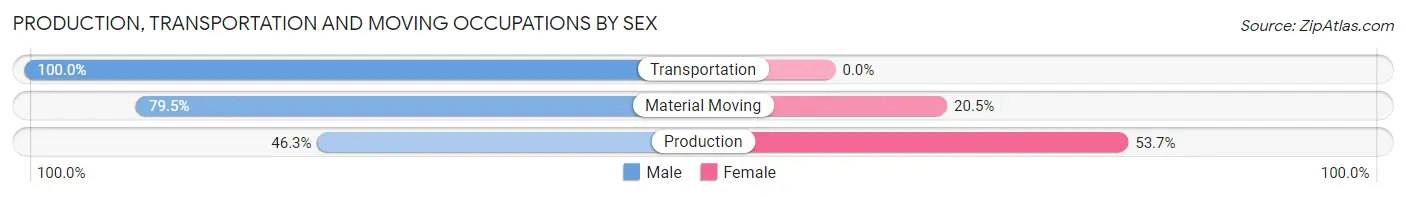
| Occupation | Male | Female |
| Production | 56 (46.3%) | 65 (53.7%) |
| Transportation | 66 (100.0%) | 0 (0.0%) |
| Material Moving | 66 (79.5%) | 17 (20.5%) |
| Total (Category) | 188 (69.6%) | 82 (30.4%) |
| Total (Overall) | 669 (46.3%) | 775 (53.7%) |
Employment Industries by Sex in Dumas
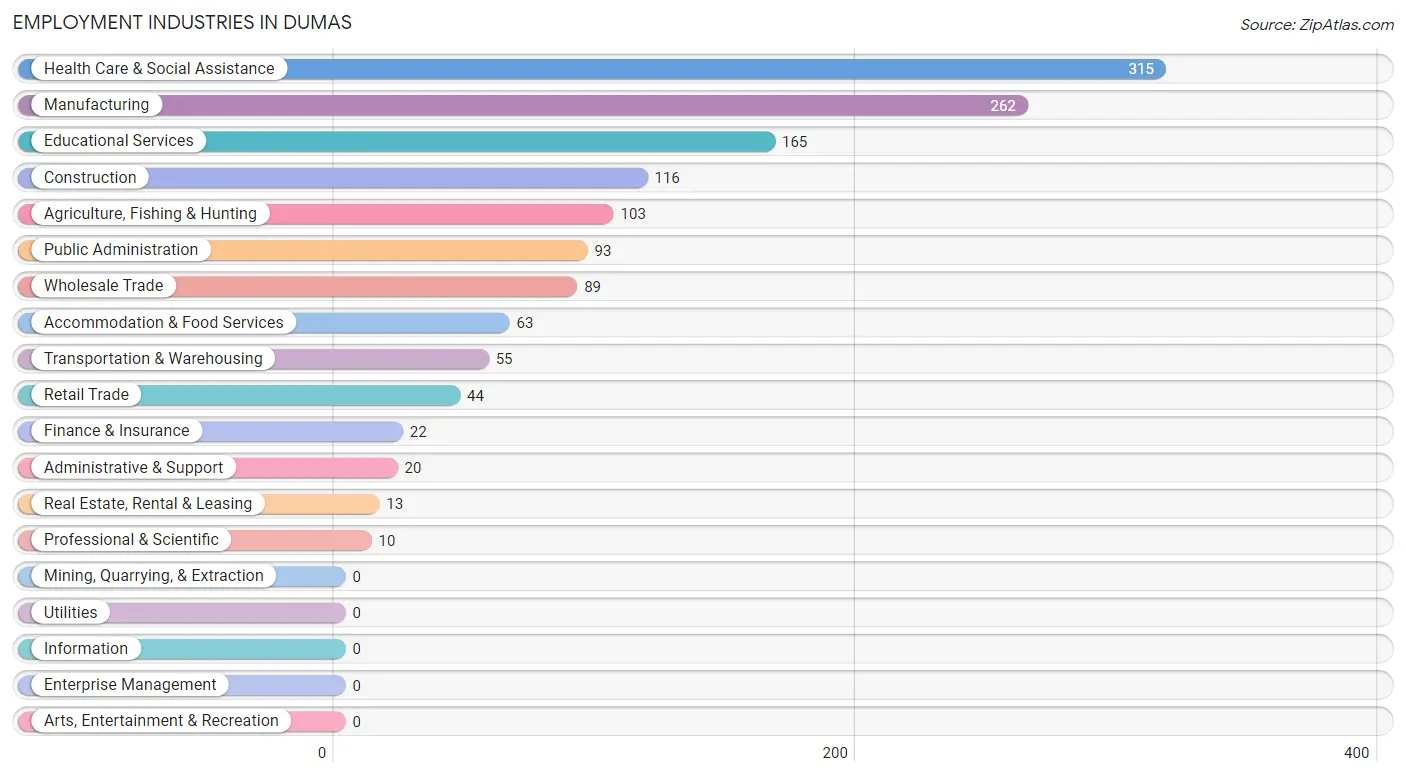
Employment Industries in Dumas
The major employment industries in Dumas include Health Care & Social Assistance (315 | 21.8%), Manufacturing (262 | 18.1%), Educational Services (165 | 11.4%), Construction (116 | 8.0%), and Agriculture, Fishing & Hunting (103 | 7.1%).
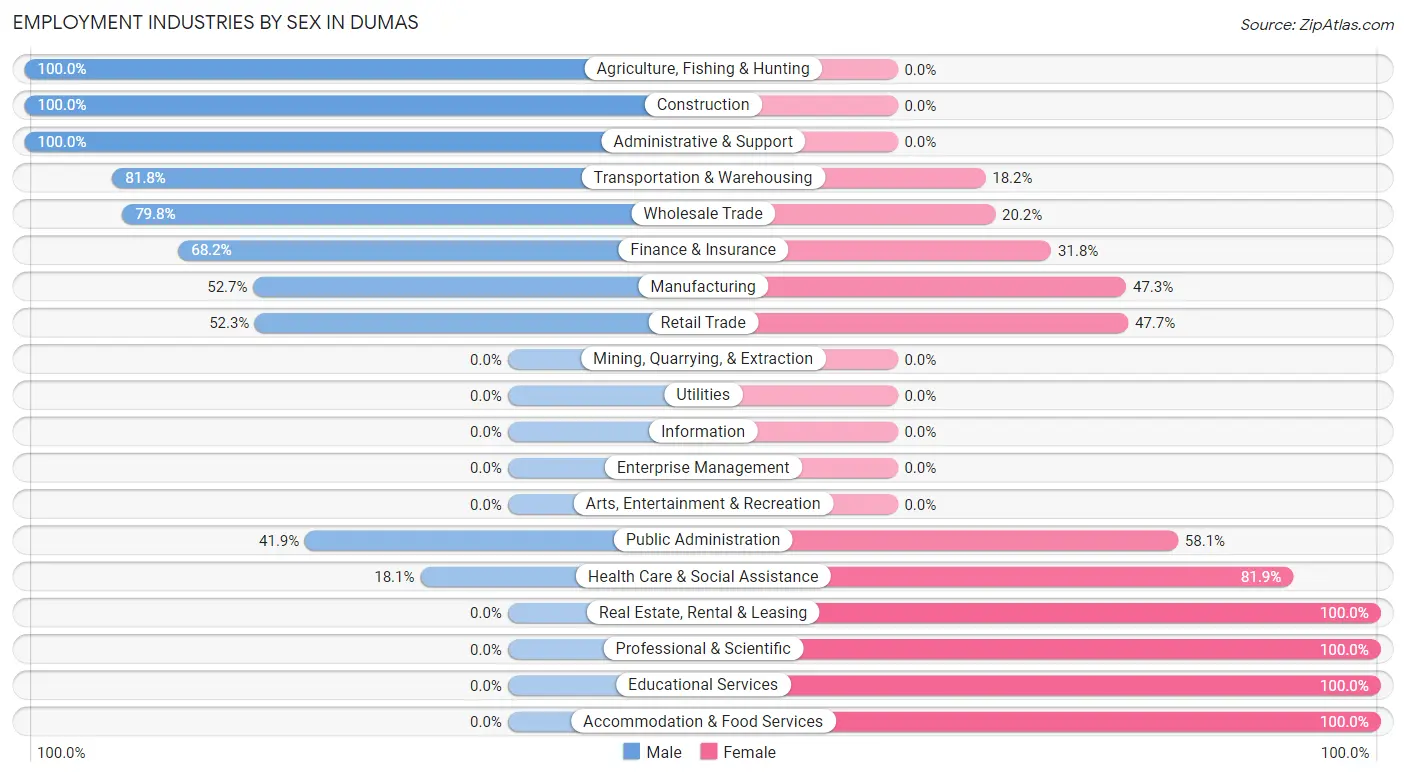
Employment Industries by Sex in Dumas
The Dumas industries that see more men than women are Agriculture, Fishing & Hunting (100.0%), Construction (100.0%), and Administrative & Support (100.0%), whereas the industries that tend to have a higher number of women are Real Estate, Rental & Leasing (100.0%), Professional & Scientific (100.0%), and Educational Services (100.0%).
| Industry | Male | Female |
| Agriculture, Fishing & Hunting | 103 (100.0%) | 0 (0.0%) |
| Mining, Quarrying, & Extraction | 0 (0.0%) | 0 (0.0%) |
| Construction | 116 (100.0%) | 0 (0.0%) |
| Manufacturing | 138 (52.7%) | 124 (47.3%) |
| Wholesale Trade | 71 (79.8%) | 18 (20.2%) |
| Retail Trade | 23 (52.3%) | 21 (47.7%) |
| Transportation & Warehousing | 45 (81.8%) | 10 (18.2%) |
| Utilities | 0 (0.0%) | 0 (0.0%) |
| Information | 0 (0.0%) | 0 (0.0%) |
| Finance & Insurance | 15 (68.2%) | 7 (31.8%) |
| Real Estate, Rental & Leasing | 0 (0.0%) | 13 (100.0%) |
| Professional & Scientific | 0 (0.0%) | 10 (100.0%) |
| Enterprise Management | 0 (0.0%) | 0 (0.0%) |
| Administrative & Support | 20 (100.0%) | 0 (0.0%) |
| Educational Services | 0 (0.0%) | 165 (100.0%) |
| Health Care & Social Assistance | 57 (18.1%) | 258 (81.9%) |
| Arts, Entertainment & Recreation | 0 (0.0%) | 0 (0.0%) |
| Accommodation & Food Services | 0 (0.0%) | 63 (100.0%) |
| Public Administration | 39 (41.9%) | 54 (58.1%) |
| Total | 669 (46.3%) | 775 (53.7%) |
Education in Dumas
School Enrollment in Dumas
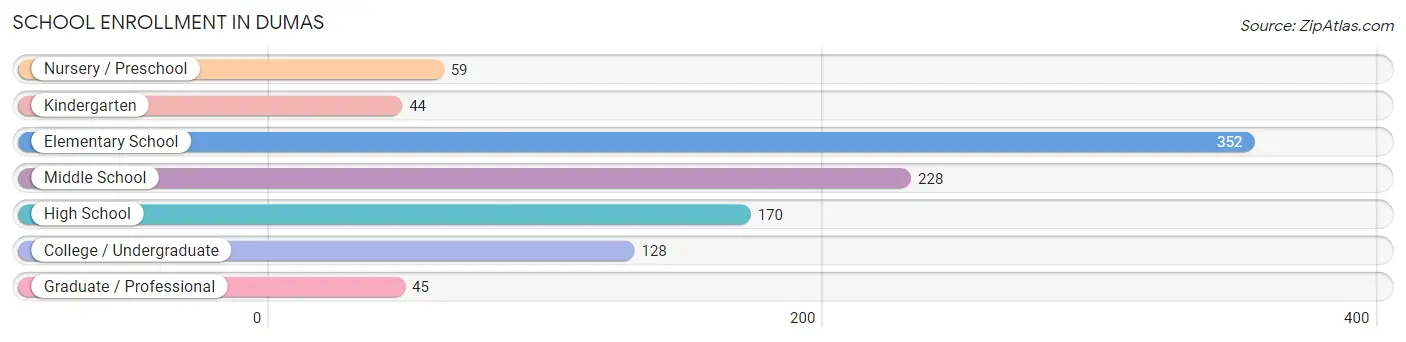
The most common levels of schooling among the 1,026 students in Dumas are elementary school (352 | 34.3%), middle school (228 | 22.2%), and high school (170 | 16.6%).
| School Level | # Students | % Students |
| Nursery / Preschool | 59 | 5.8% |
| Kindergarten | 44 | 4.3% |
| Elementary School | 352 | 34.3% |
| Middle School | 228 | 22.2% |
| High School | 170 | 16.6% |
| College / Undergraduate | 128 | 12.5% |
| Graduate / Professional | 45 | 4.4% |
| Total | 1,026 | 100.0% |
School Enrollment by Age by Funding Source in Dumas
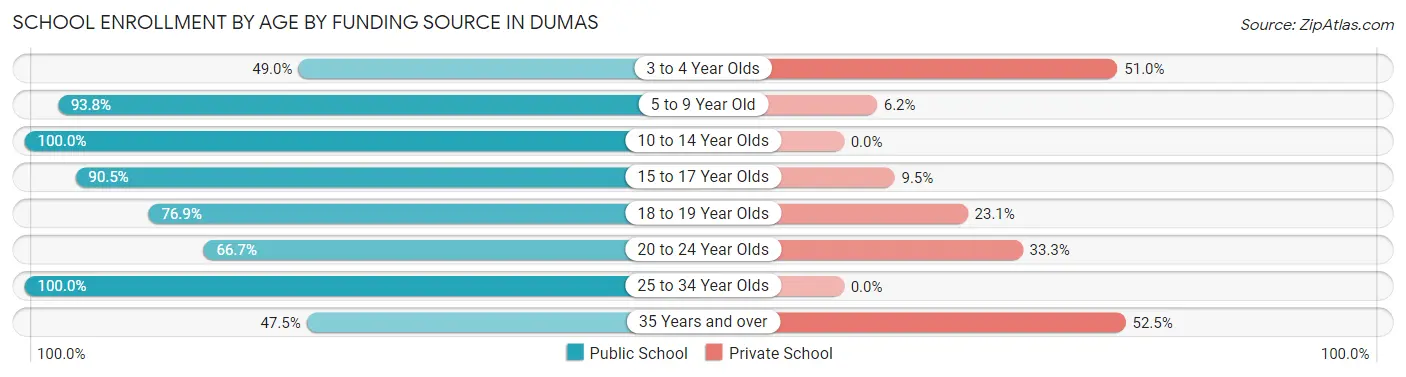
Out of a total of 1,026 students who are enrolled in schools in Dumas, 107 (10.4%) attend a private institution, while the remaining 919 (89.6%) are enrolled in public schools. The age group of 35 years and over has the highest likelihood of being enrolled in private schools, with 21 (52.5% in the age bracket) enrolled. Conversely, the age group of 10 to 14 year olds has the lowest likelihood of being enrolled in a private school, with 309 (100.0% in the age bracket) attending a public institution.
| Age Bracket | Public School | Private School |
| 3 to 4 Year Olds | 25 (49.0%) | 26 (51.0%) |
| 5 to 9 Year Old | 304 (93.8%) | 20 (6.2%) |
| 10 to 14 Year Olds | 309 (100.0%) | 0 (0.0%) |
| 15 to 17 Year Olds | 153 (90.5%) | 16 (9.5%) |
| 18 to 19 Year Olds | 40 (76.9%) | 12 (23.1%) |
| 20 to 24 Year Olds | 24 (66.7%) | 12 (33.3%) |
| 25 to 34 Year Olds | 45 (100.0%) | 0 (0.0%) |
| 35 Years and over | 19 (47.5%) | 21 (52.5%) |
| Total | 919 (89.6%) | 107 (10.4%) |
Educational Attainment by Field of Study in Dumas
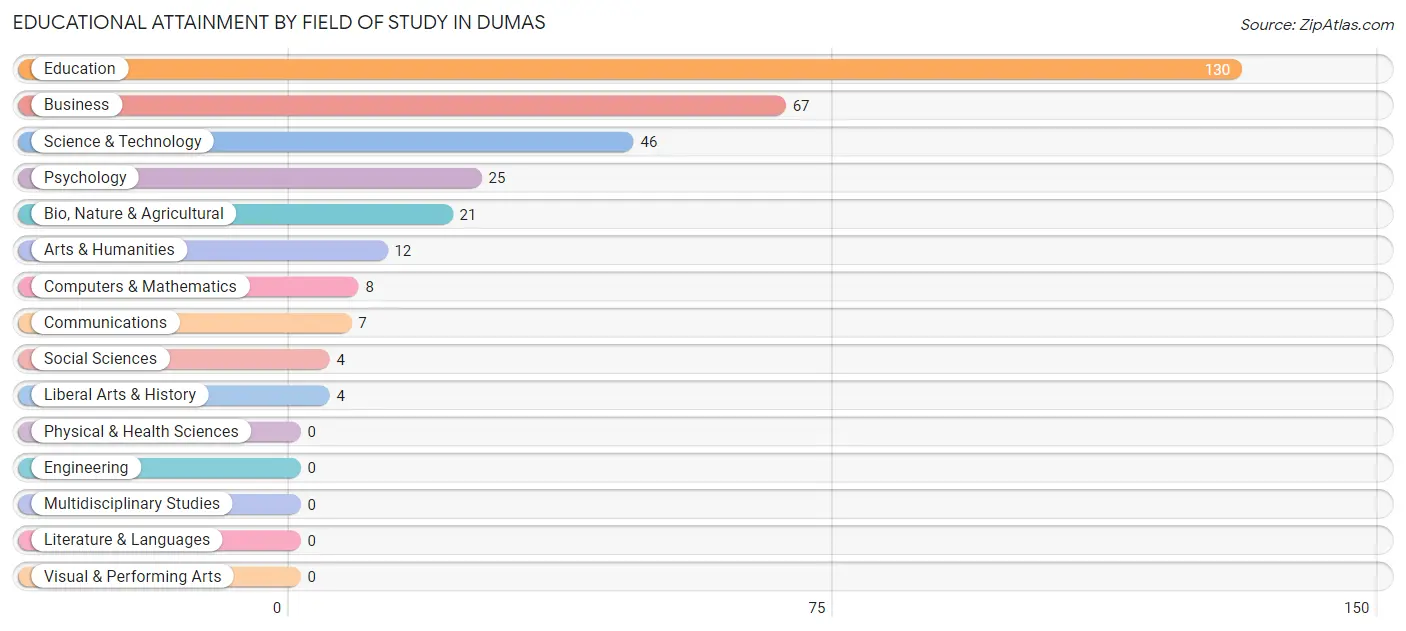
Education (130 | 40.1%), business (67 | 20.7%), science & technology (46 | 14.2%), psychology (25 | 7.7%), and bio, nature & agricultural (21 | 6.5%) are the most common fields of study among 324 individuals in Dumas who have obtained a bachelor's degree or higher.
| Field of Study | # Graduates | % Graduates |
| Computers & Mathematics | 8 | 2.5% |
| Bio, Nature & Agricultural | 21 | 6.5% |
| Physical & Health Sciences | 0 | 0.0% |
| Psychology | 25 | 7.7% |
| Social Sciences | 4 | 1.2% |
| Engineering | 0 | 0.0% |
| Multidisciplinary Studies | 0 | 0.0% |
| Science & Technology | 46 | 14.2% |
| Business | 67 | 20.7% |
| Education | 130 | 40.1% |
| Literature & Languages | 0 | 0.0% |
| Liberal Arts & History | 4 | 1.2% |
| Visual & Performing Arts | 0 | 0.0% |
| Communications | 7 | 2.2% |
| Arts & Humanities | 12 | 3.7% |
| Total | 324 | 100.0% |
Transportation & Commute in Dumas
Vehicle Availability by Sex in Dumas
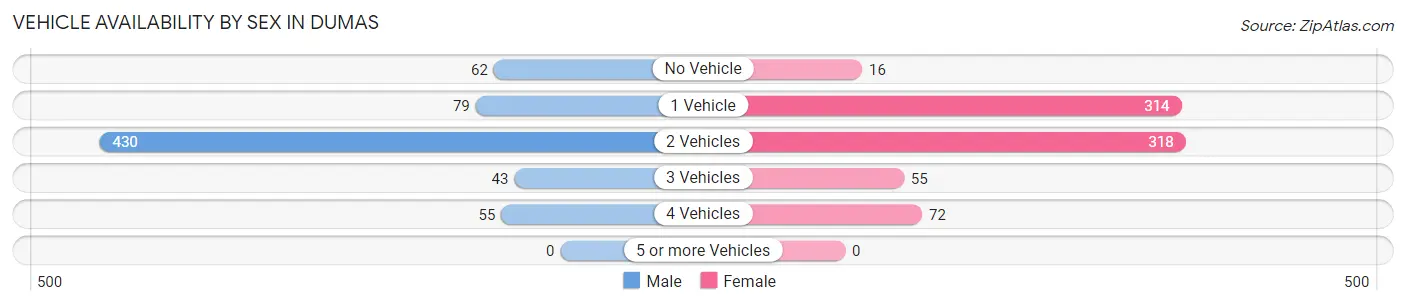
The most prevalent vehicle ownership categories in Dumas are males with 2 vehicles (430, accounting for 64.3%) and females with 2 vehicles (318, making up 55.5%).
| Vehicles Available | Male | Female |
| No Vehicle | 62 (9.3%) | 16 (2.1%) |
| 1 Vehicle | 79 (11.8%) | 314 (40.5%) |
| 2 Vehicles | 430 (64.3%) | 318 (41.0%) |
| 3 Vehicles | 43 (6.4%) | 55 (7.1%) |
| 4 Vehicles | 55 (8.2%) | 72 (9.3%) |
| 5 or more Vehicles | 0 (0.0%) | 0 (0.0%) |
| Total | 669 (100.0%) | 775 (100.0%) |
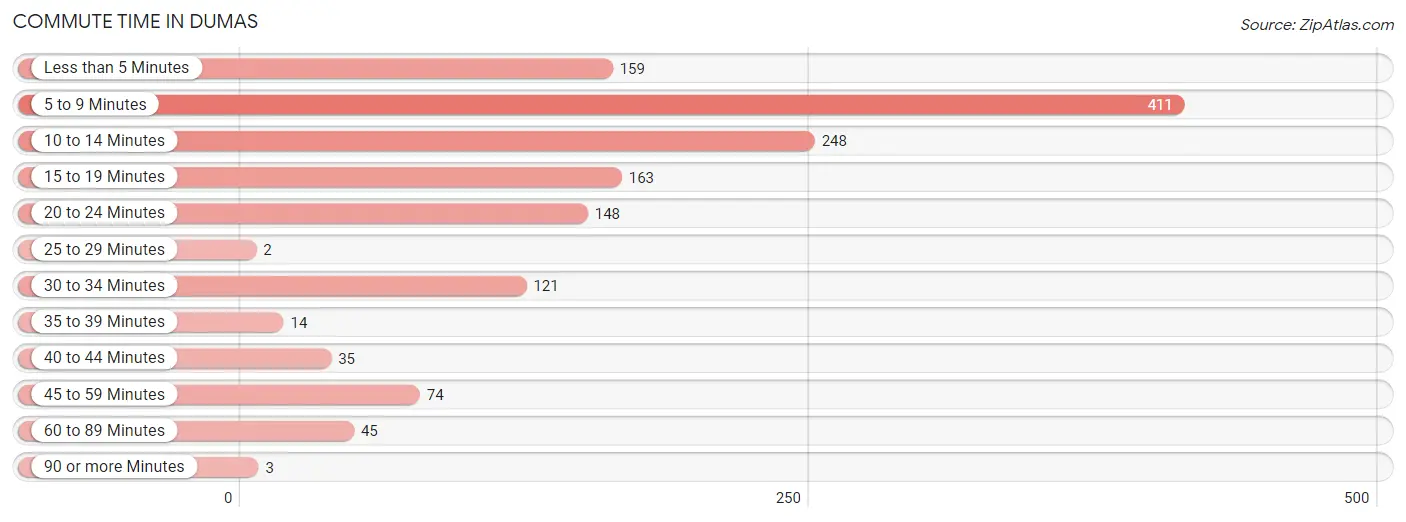
Commute Time in Dumas
The most frequently occuring commute durations in Dumas are 5 to 9 minutes (411 commuters, 28.9%), 10 to 14 minutes (248 commuters, 17.4%), and 15 to 19 minutes (163 commuters, 11.5%).
| Commute Time | # Commuters | % Commuters |
| Less than 5 Minutes | 159 | 11.2% |
| 5 to 9 Minutes | 411 | 28.9% |
| 10 to 14 Minutes | 248 | 17.4% |
| 15 to 19 Minutes | 163 | 11.5% |
| 20 to 24 Minutes | 148 | 10.4% |
| 25 to 29 Minutes | 2 | 0.1% |
| 30 to 34 Minutes | 121 | 8.5% |
| 35 to 39 Minutes | 14 | 1.0% |
| 40 to 44 Minutes | 35 | 2.5% |
| 45 to 59 Minutes | 74 | 5.2% |
| 60 to 89 Minutes | 45 | 3.2% |
| 90 or more Minutes | 3 | 0.2% |
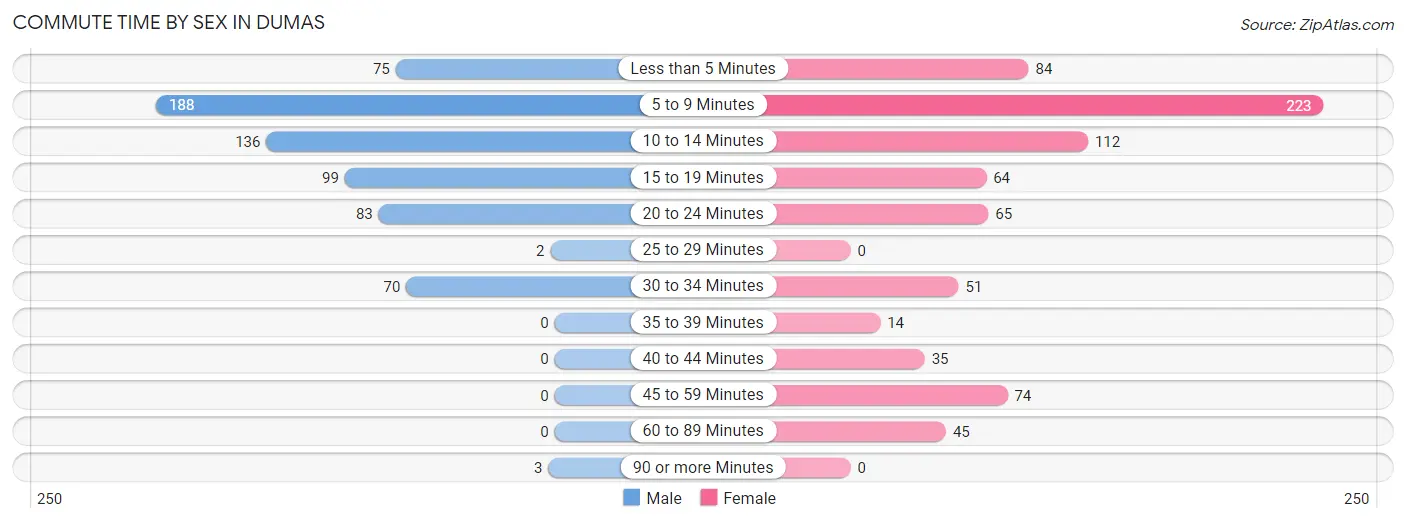
Commute Time by Sex in Dumas
The most common commute times in Dumas are 5 to 9 minutes (188 commuters, 28.7%) for males and 5 to 9 minutes (223 commuters, 29.1%) for females.
| Commute Time | Male | Female |
| Less than 5 Minutes | 75 (11.4%) | 84 (11.0%) |
| 5 to 9 Minutes | 188 (28.7%) | 223 (29.1%) |
| 10 to 14 Minutes | 136 (20.7%) | 112 (14.6%) |
| 15 to 19 Minutes | 99 (15.1%) | 64 (8.3%) |
| 20 to 24 Minutes | 83 (12.7%) | 65 (8.5%) |
| 25 to 29 Minutes | 2 (0.3%) | 0 (0.0%) |
| 30 to 34 Minutes | 70 (10.7%) | 51 (6.7%) |
| 35 to 39 Minutes | 0 (0.0%) | 14 (1.8%) |
| 40 to 44 Minutes | 0 (0.0%) | 35 (4.6%) |
| 45 to 59 Minutes | 0 (0.0%) | 74 (9.7%) |
| 60 to 89 Minutes | 0 (0.0%) | 45 (5.9%) |
| 90 or more Minutes | 3 (0.5%) | 0 (0.0%) |
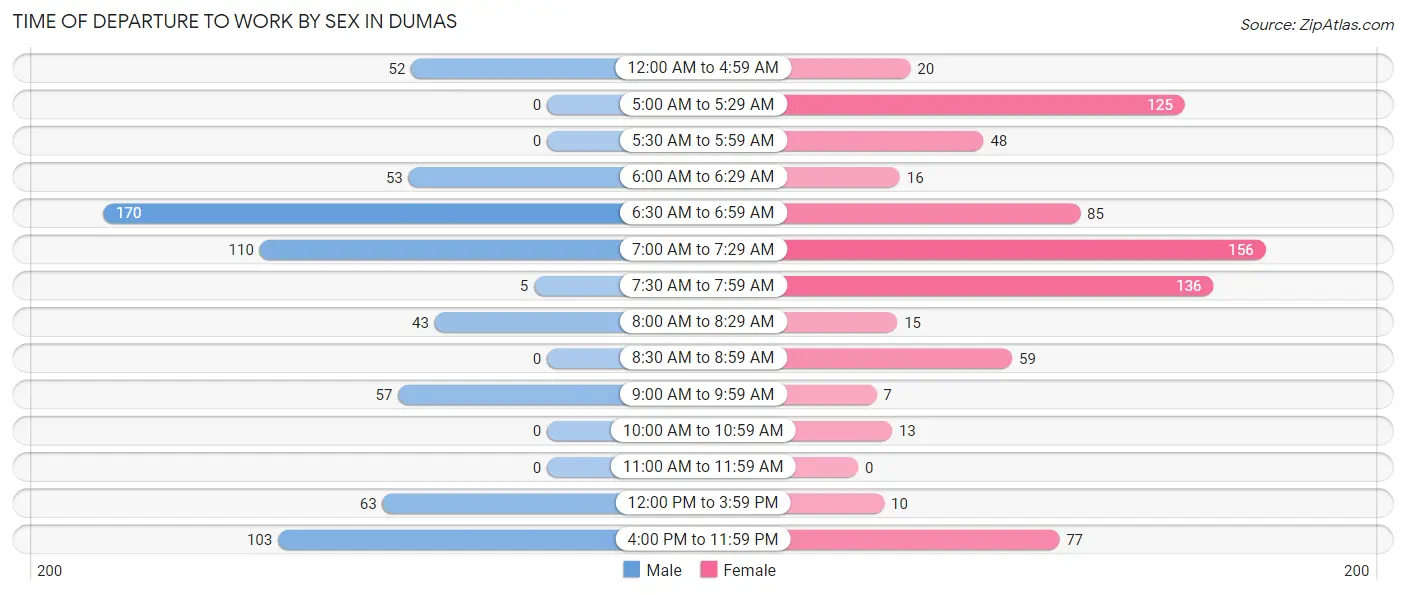
Time of Departure to Work by Sex in Dumas
The most frequent times of departure to work in Dumas are 6:30 AM to 6:59 AM (170, 25.9%) for males and 7:00 AM to 7:29 AM (156, 20.3%) for females.
| Time of Departure | Male | Female |
| 12:00 AM to 4:59 AM | 52 (7.9%) | 20 (2.6%) |
| 5:00 AM to 5:29 AM | 0 (0.0%) | 125 (16.3%) |
| 5:30 AM to 5:59 AM | 0 (0.0%) | 48 (6.3%) |
| 6:00 AM to 6:29 AM | 53 (8.1%) | 16 (2.1%) |
| 6:30 AM to 6:59 AM | 170 (25.9%) | 85 (11.1%) |
| 7:00 AM to 7:29 AM | 110 (16.8%) | 156 (20.3%) |
| 7:30 AM to 7:59 AM | 5 (0.8%) | 136 (17.7%) |
| 8:00 AM to 8:29 AM | 43 (6.6%) | 15 (2.0%) |
| 8:30 AM to 8:59 AM | 0 (0.0%) | 59 (7.7%) |
| 9:00 AM to 9:59 AM | 57 (8.7%) | 7 (0.9%) |
| 10:00 AM to 10:59 AM | 0 (0.0%) | 13 (1.7%) |
| 11:00 AM to 11:59 AM | 0 (0.0%) | 0 (0.0%) |
| 12:00 PM to 3:59 PM | 63 (9.6%) | 10 (1.3%) |
| 4:00 PM to 11:59 PM | 103 (15.7%) | 77 (10.0%) |
| Total | 656 (100.0%) | 767 (100.0%) |
Housing Occupancy in Dumas
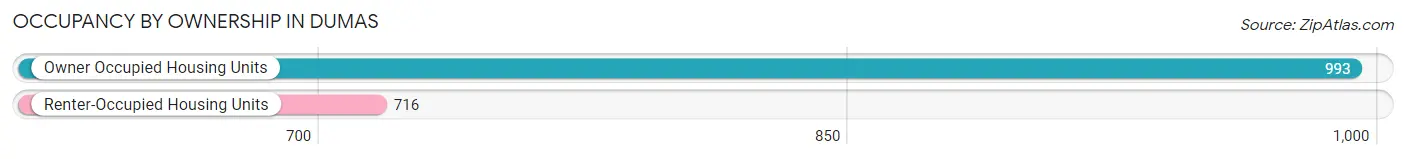
Occupancy by Ownership in Dumas
Of the total 1,709 dwellings in Dumas, owner-occupied units account for 993 (58.1%), while renter-occupied units make up 716 (41.9%).
| Occupancy | # Housing Units | % Housing Units |
| Owner Occupied Housing Units | 993 | 58.1% |
| Renter-Occupied Housing Units | 716 | 41.9% |
| Total Occupied Housing Units | 1,709 | 100.0% |
Occupancy by Household Size in Dumas
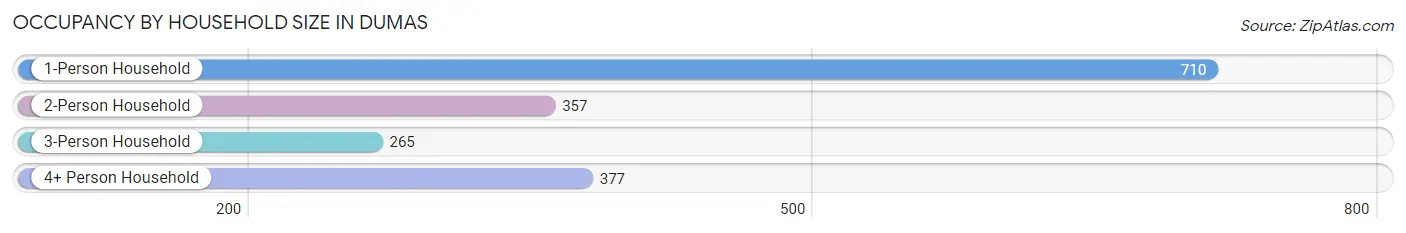
| Household Size | # Housing Units | % Housing Units |
| 1-Person Household | 710 | 41.5% |
| 2-Person Household | 357 | 20.9% |
| 3-Person Household | 265 | 15.5% |
| 4+ Person Household | 377 | 22.1% |
| Total Housing Units | 1,709 | 100.0% |
Occupancy by Ownership by Household Size in Dumas
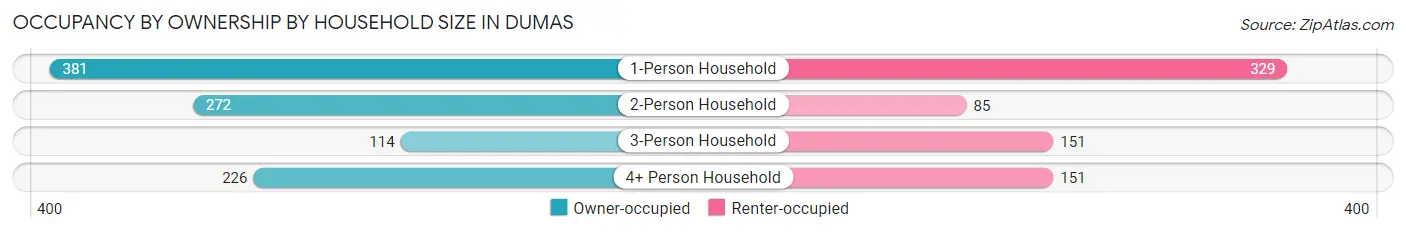
| Household Size | Owner-occupied | Renter-occupied |
| 1-Person Household | 381 (53.7%) | 329 (46.3%) |
| 2-Person Household | 272 (76.2%) | 85 (23.8%) |
| 3-Person Household | 114 (43.0%) | 151 (57.0%) |
| 4+ Person Household | 226 (60.0%) | 151 (40.1%) |
| Total Housing Units | 993 (58.1%) | 716 (41.9%) |
Occupancy by Educational Attainment in Dumas
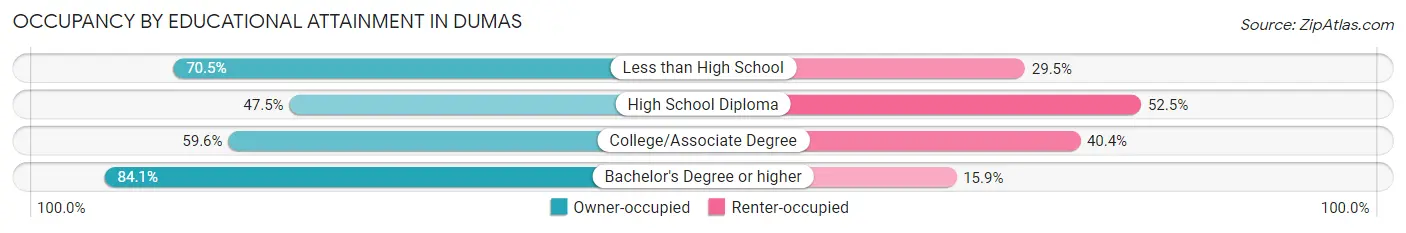
| Household Size | Owner-occupied | Renter-occupied |
| Less than High School | 177 (70.5%) | 74 (29.5%) |
| High School Diploma | 390 (47.5%) | 431 (52.5%) |
| College/Associate Degree | 267 (59.6%) | 181 (40.4%) |
| Bachelor's Degree or higher | 159 (84.1%) | 30 (15.9%) |
Occupancy by Age of Householder in Dumas
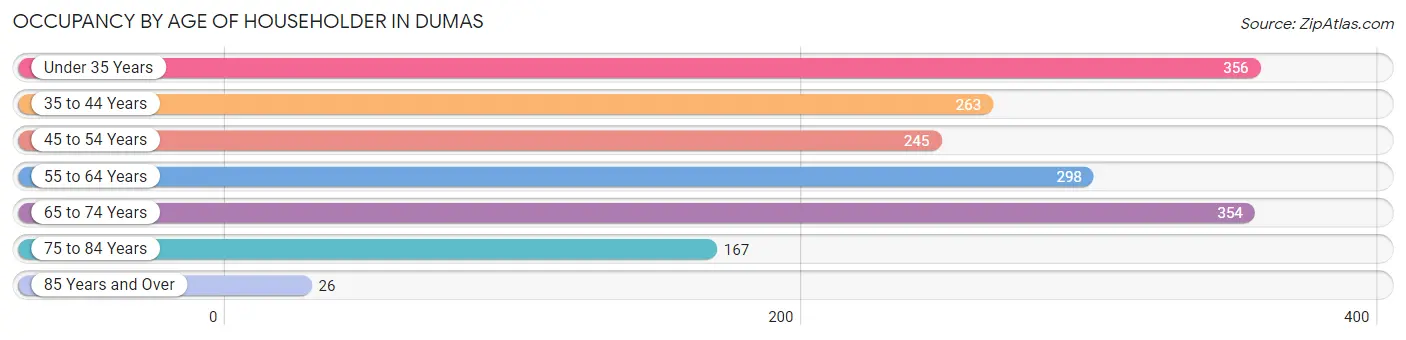
| Age Bracket | # Households | % Households |
| Under 35 Years | 356 | 20.8% |
| 35 to 44 Years | 263 | 15.4% |
| 45 to 54 Years | 245 | 14.3% |
| 55 to 64 Years | 298 | 17.4% |
| 65 to 74 Years | 354 | 20.7% |
| 75 to 84 Years | 167 | 9.8% |
| 85 Years and Over | 26 | 1.5% |
| Total | 1,709 | 100.0% |
Housing Finances in Dumas
Median Income by Occupancy in Dumas
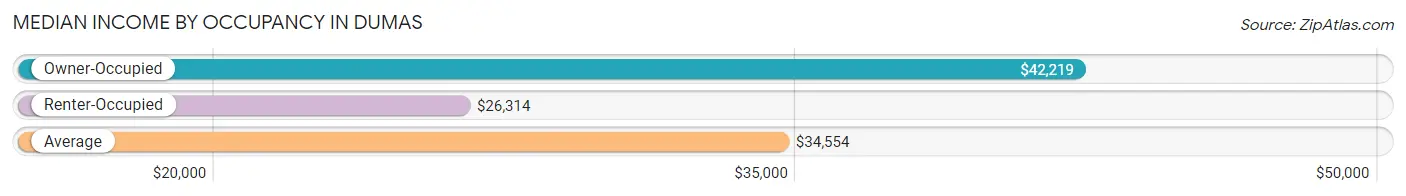
| Occupancy Type | # Households | Median Income |
| Owner-Occupied | 993 (58.1%) | $42,219 |
| Renter-Occupied | 716 (41.9%) | $26,314 |
| Average | 1,709 (100.0%) | $34,554 |
Occupancy by Householder Income Bracket in Dumas
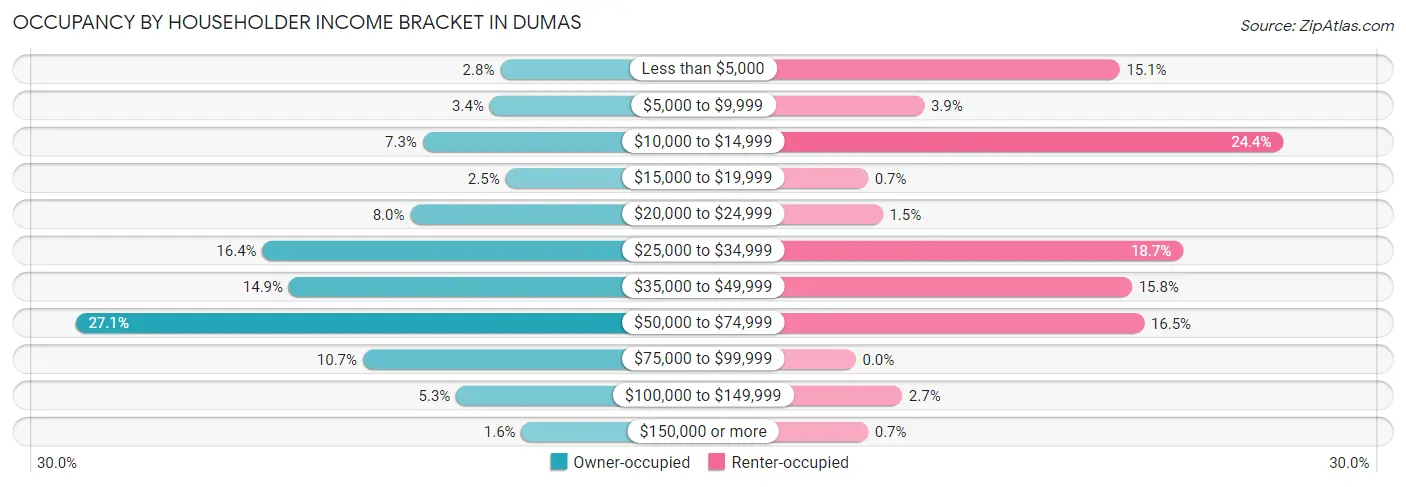
| Income Bracket | Owner-occupied | Renter-occupied |
| Less than $5,000 | 28 (2.8%) | 108 (15.1%) |
| $5,000 to $9,999 | 34 (3.4%) | 28 (3.9%) |
| $10,000 to $14,999 | 72 (7.2%) | 175 (24.4%) |
| $15,000 to $19,999 | 25 (2.5%) | 5 (0.7%) |
| $20,000 to $24,999 | 79 (8.0%) | 11 (1.5%) |
| $25,000 to $34,999 | 163 (16.4%) | 134 (18.7%) |
| $35,000 to $49,999 | 148 (14.9%) | 113 (15.8%) |
| $50,000 to $74,999 | 269 (27.1%) | 118 (16.5%) |
| $75,000 to $99,999 | 106 (10.7%) | 0 (0.0%) |
| $100,000 to $149,999 | 53 (5.3%) | 19 (2.6%) |
| $150,000 or more | 16 (1.6%) | 5 (0.7%) |
| Total | 993 (100.0%) | 716 (100.0%) |
Monthly Housing Cost Tiers in Dumas
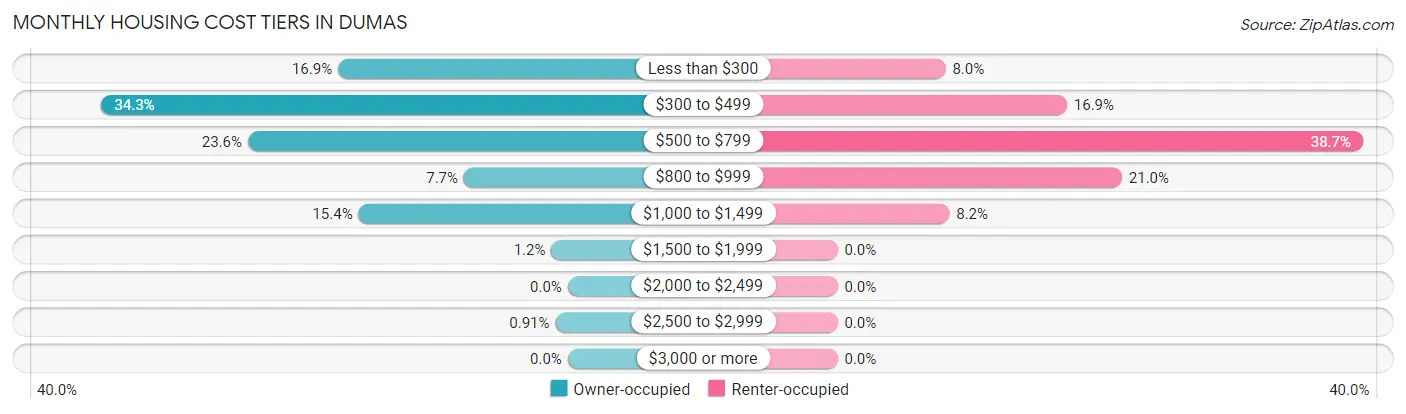
| Monthly Cost | Owner-occupied | Renter-occupied |
| Less than $300 | 168 (16.9%) | 57 (8.0%) |
| $300 to $499 | 341 (34.3%) | 121 (16.9%) |
| $500 to $799 | 234 (23.6%) | 277 (38.7%) |
| $800 to $999 | 76 (7.6%) | 150 (20.9%) |
| $1,000 to $1,499 | 153 (15.4%) | 59 (8.2%) |
| $1,500 to $1,999 | 12 (1.2%) | 0 (0.0%) |
| $2,000 to $2,499 | 0 (0.0%) | 0 (0.0%) |
| $2,500 to $2,999 | 9 (0.9%) | 0 (0.0%) |
| $3,000 or more | 0 (0.0%) | 0 (0.0%) |
| Total | 993 (100.0%) | 716 (100.0%) |
Physical Housing Characteristics in Dumas
Housing Structures in Dumas
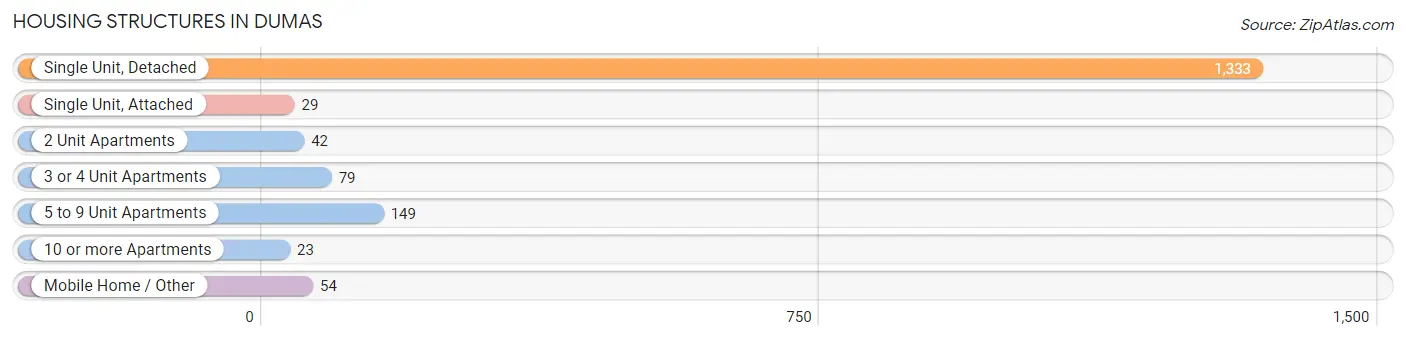
| Structure Type | # Housing Units | % Housing Units |
| Single Unit, Detached | 1,333 | 78.0% |
| Single Unit, Attached | 29 | 1.7% |
| 2 Unit Apartments | 42 | 2.5% |
| 3 or 4 Unit Apartments | 79 | 4.6% |
| 5 to 9 Unit Apartments | 149 | 8.7% |
| 10 or more Apartments | 23 | 1.3% |
| Mobile Home / Other | 54 | 3.2% |
| Total | 1,709 | 100.0% |
Housing Structures by Occupancy in Dumas
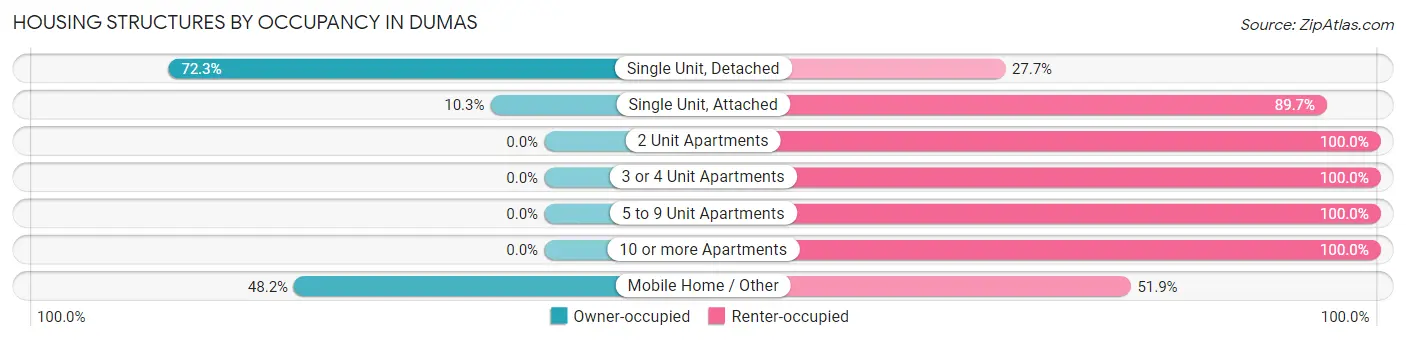
| Structure Type | Owner-occupied | Renter-occupied |
| Single Unit, Detached | 964 (72.3%) | 369 (27.7%) |
| Single Unit, Attached | 3 (10.3%) | 26 (89.7%) |
| 2 Unit Apartments | 0 (0.0%) | 42 (100.0%) |
| 3 or 4 Unit Apartments | 0 (0.0%) | 79 (100.0%) |
| 5 to 9 Unit Apartments | 0 (0.0%) | 149 (100.0%) |
| 10 or more Apartments | 0 (0.0%) | 23 (100.0%) |
| Mobile Home / Other | 26 (48.1%) | 28 (51.8%) |
| Total | 993 (58.1%) | 716 (41.9%) |
Housing Structures by Number of Rooms in Dumas
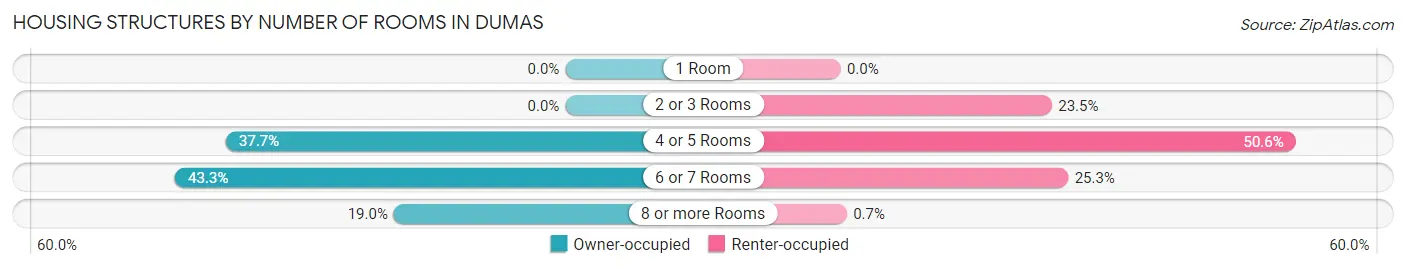
| Number of Rooms | Owner-occupied | Renter-occupied |
| 1 Room | 0 (0.0%) | 0 (0.0%) |
| 2 or 3 Rooms | 0 (0.0%) | 168 (23.5%) |
| 4 or 5 Rooms | 374 (37.7%) | 362 (50.6%) |
| 6 or 7 Rooms | 430 (43.3%) | 181 (25.3%) |
| 8 or more Rooms | 189 (19.0%) | 5 (0.7%) |
| Total | 993 (100.0%) | 716 (100.0%) |
Housing Structure by Heating Type in Dumas
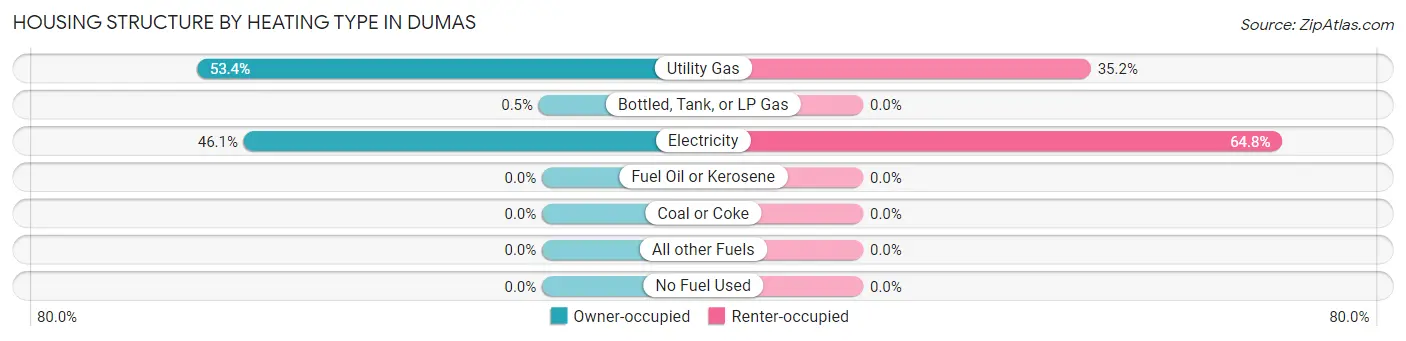
| Heating Type | Owner-occupied | Renter-occupied |
| Utility Gas | 530 (53.4%) | 252 (35.2%) |
| Bottled, Tank, or LP Gas | 5 (0.5%) | 0 (0.0%) |
| Electricity | 458 (46.1%) | 464 (64.8%) |
| Fuel Oil or Kerosene | 0 (0.0%) | 0 (0.0%) |
| Coal or Coke | 0 (0.0%) | 0 (0.0%) |
| All other Fuels | 0 (0.0%) | 0 (0.0%) |
| No Fuel Used | 0 (0.0%) | 0 (0.0%) |
| Total | 993 (100.0%) | 716 (100.0%) |
Household Vehicle Usage in Dumas
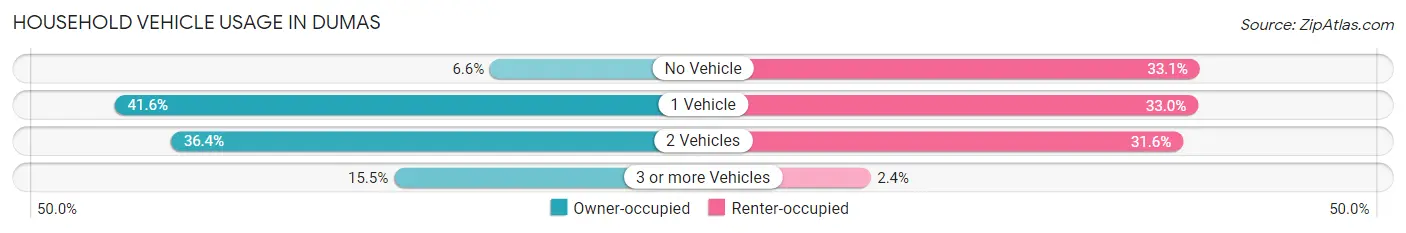
| Vehicles per Household | Owner-occupied | Renter-occupied |
| No Vehicle | 65 (6.6%) | 237 (33.1%) |
| 1 Vehicle | 413 (41.6%) | 236 (33.0%) |
| 2 Vehicles | 361 (36.3%) | 226 (31.6%) |
| 3 or more Vehicles | 154 (15.5%) | 17 (2.4%) |
| Total | 993 (100.0%) | 716 (100.0%) |
Real Estate & Mortgages in Dumas
Real Estate and Mortgage Overview in Dumas
| Characteristic | Without Mortgage | With Mortgage |
| Housing Units | 565 | 428 |
| Median Property Value | $58,300 | $97,400 |
| Median Household Income | $37,067 | $7 |
| Monthly Housing Costs | $386 | $0 |
| Real Estate Taxes | $410 | $31 |
Property Value by Mortgage Status in Dumas
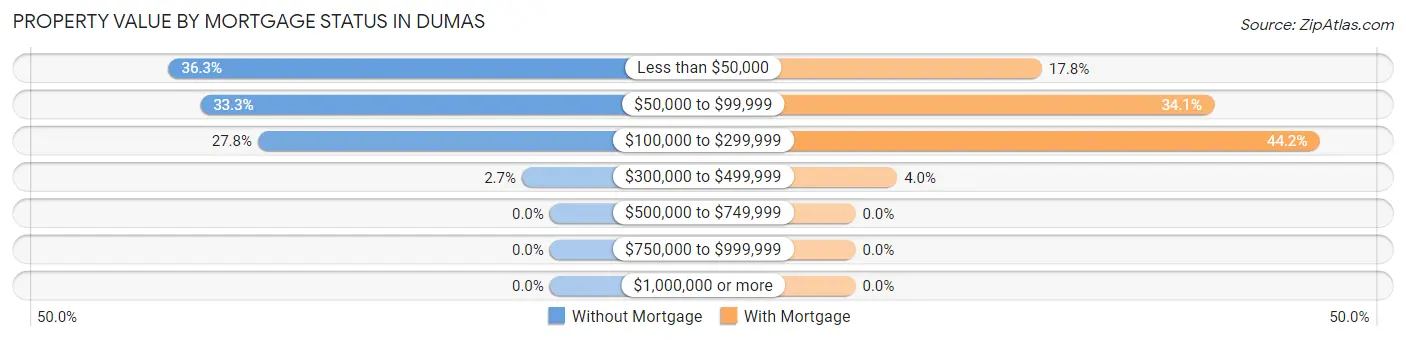
| Property Value | Without Mortgage | With Mortgage |
| Less than $50,000 | 205 (36.3%) | 76 (17.8%) |
| $50,000 to $99,999 | 188 (33.3%) | 146 (34.1%) |
| $100,000 to $299,999 | 157 (27.8%) | 189 (44.2%) |
| $300,000 to $499,999 | 15 (2.6%) | 17 (4.0%) |
| $500,000 to $749,999 | 0 (0.0%) | 0 (0.0%) |
| $750,000 to $999,999 | 0 (0.0%) | 0 (0.0%) |
| $1,000,000 or more | 0 (0.0%) | 0 (0.0%) |
| Total | 565 (100.0%) | 428 (100.0%) |
Household Income by Mortgage Status in Dumas
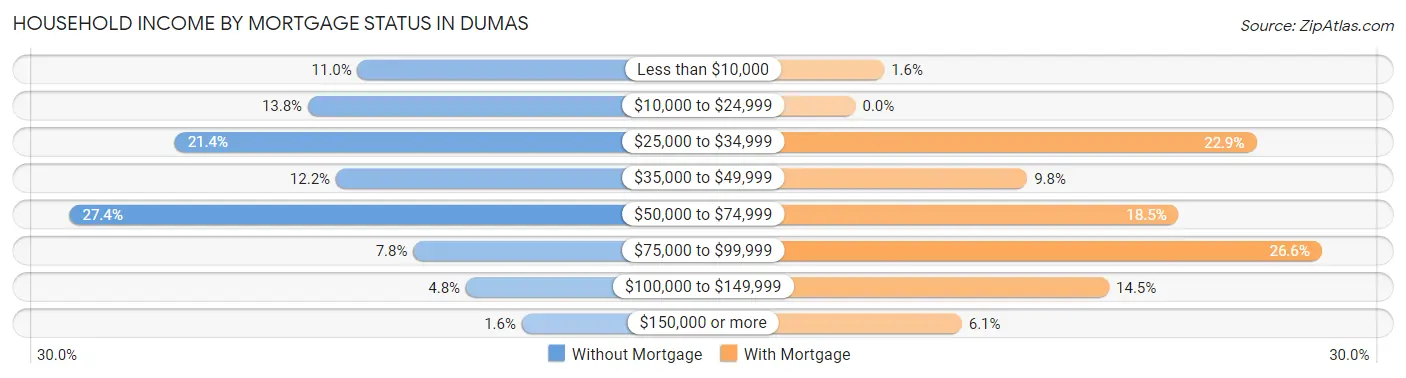
| Household Income | Without Mortgage | With Mortgage |
| Less than $10,000 | 62 (11.0%) | 7 (1.6%) |
| $10,000 to $24,999 | 78 (13.8%) | 0 (0.0%) |
| $25,000 to $34,999 | 121 (21.4%) | 98 (22.9%) |
| $35,000 to $49,999 | 69 (12.2%) | 42 (9.8%) |
| $50,000 to $74,999 | 155 (27.4%) | 79 (18.5%) |
| $75,000 to $99,999 | 44 (7.8%) | 114 (26.6%) |
| $100,000 to $149,999 | 27 (4.8%) | 62 (14.5%) |
| $150,000 or more | 9 (1.6%) | 26 (6.1%) |
| Total | 565 (100.0%) | 428 (100.0%) |
Property Value to Household Income Ratio in Dumas
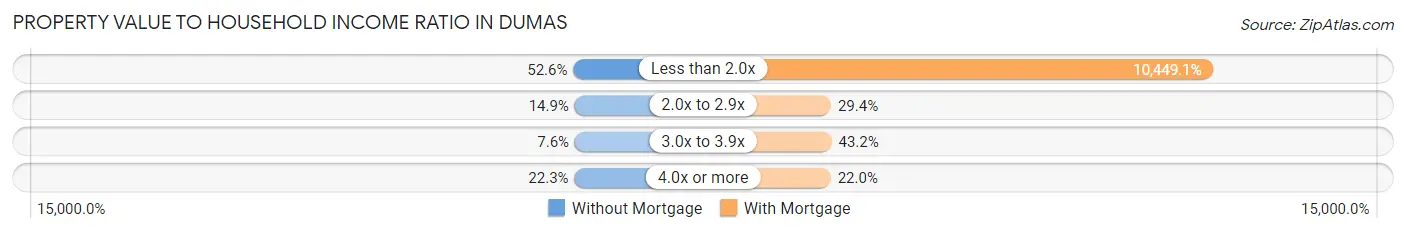
| Value-to-Income Ratio | Without Mortgage | With Mortgage |
| Less than 2.0x | 297 (52.6%) | 44,722 (10,449.1%) |
| 2.0x to 2.9x | 84 (14.9%) | 126 (29.4%) |
| 3.0x to 3.9x | 43 (7.6%) | 185 (43.2%) |
| 4.0x or more | 126 (22.3%) | 94 (22.0%) |
| Total | 565 (100.0%) | 428 (100.0%) |
Real Estate Taxes by Mortgage Status in Dumas
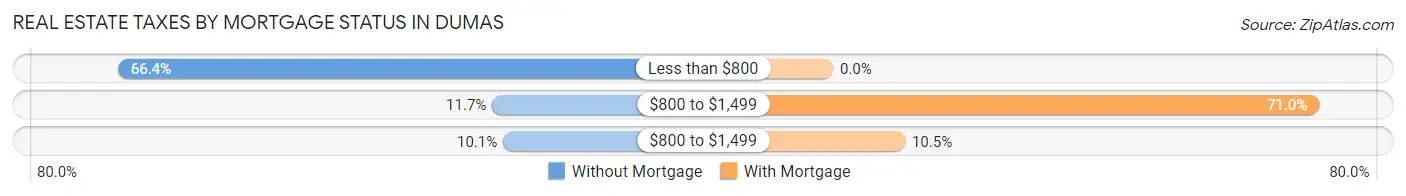
| Property Taxes | Without Mortgage | With Mortgage |
| Less than $800 | 375 (66.4%) | 0 (0.0%) |
| $800 to $1,499 | 66 (11.7%) | 304 (71.0%) |
| $800 to $1,499 | 57 (10.1%) | 45 (10.5%) |
| Total | 565 (100.0%) | 428 (100.0%) |
Health & Disability in Dumas
Health Insurance Coverage by Age in Dumas
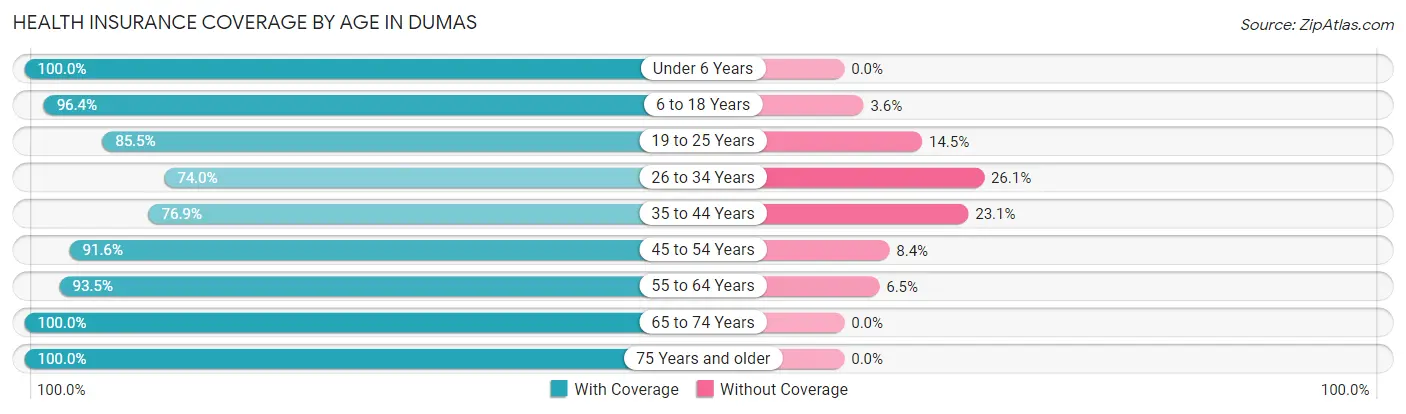
| Age Bracket | With Coverage | Without Coverage |
| Under 6 Years | 256 (100.0%) | 0 (0.0%) |
| 6 to 18 Years | 811 (96.4%) | 30 (3.6%) |
| 19 to 25 Years | 336 (85.5%) | 57 (14.5%) |
| 26 to 34 Years | 386 (74.0%) | 136 (26.1%) |
| 35 to 44 Years | 329 (76.9%) | 99 (23.1%) |
| 45 to 54 Years | 338 (91.6%) | 31 (8.4%) |
| 55 to 64 Years | 416 (93.5%) | 29 (6.5%) |
| 65 to 74 Years | 453 (100.0%) | 0 (0.0%) |
| 75 Years and older | 257 (100.0%) | 0 (0.0%) |
| Total | 3,582 (90.4%) | 382 (9.6%) |
Health Insurance Coverage by Citizenship Status in Dumas
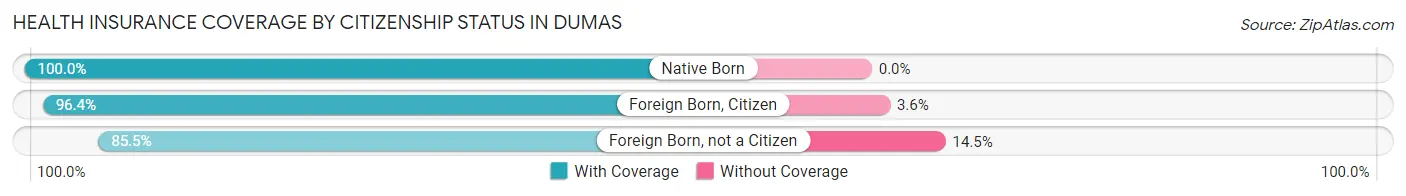
| Citizenship Status | With Coverage | Without Coverage |
| Native Born | 256 (100.0%) | 0 (0.0%) |
| Foreign Born, Citizen | 811 (96.4%) | 30 (3.6%) |
| Foreign Born, not a Citizen | 336 (85.5%) | 57 (14.5%) |
Health Insurance Coverage by Household Income in Dumas
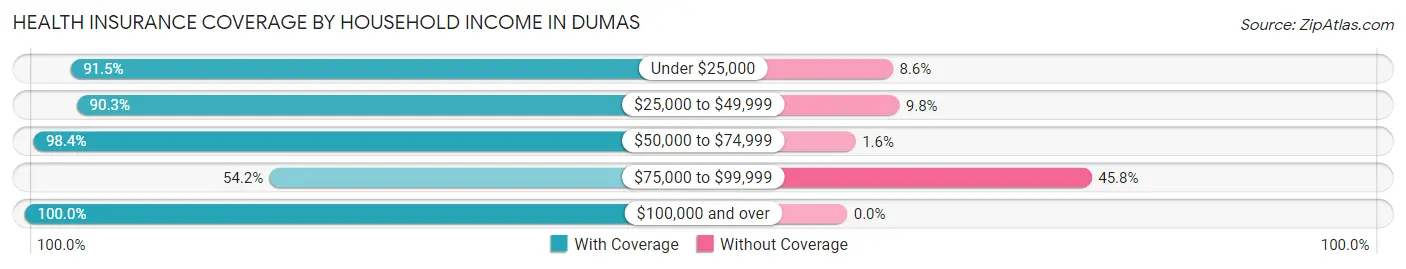
| Household Income | With Coverage | Without Coverage |
| Under $25,000 | 792 (91.4%) | 74 (8.6%) |
| $25,000 to $49,999 | 1,120 (90.2%) | 121 (9.8%) |
| $50,000 to $74,999 | 1,118 (98.4%) | 18 (1.6%) |
| $75,000 to $99,999 | 200 (54.2%) | 169 (45.8%) |
| $100,000 and over | 352 (100.0%) | 0 (0.0%) |
Public vs Private Health Insurance Coverage by Age in Dumas
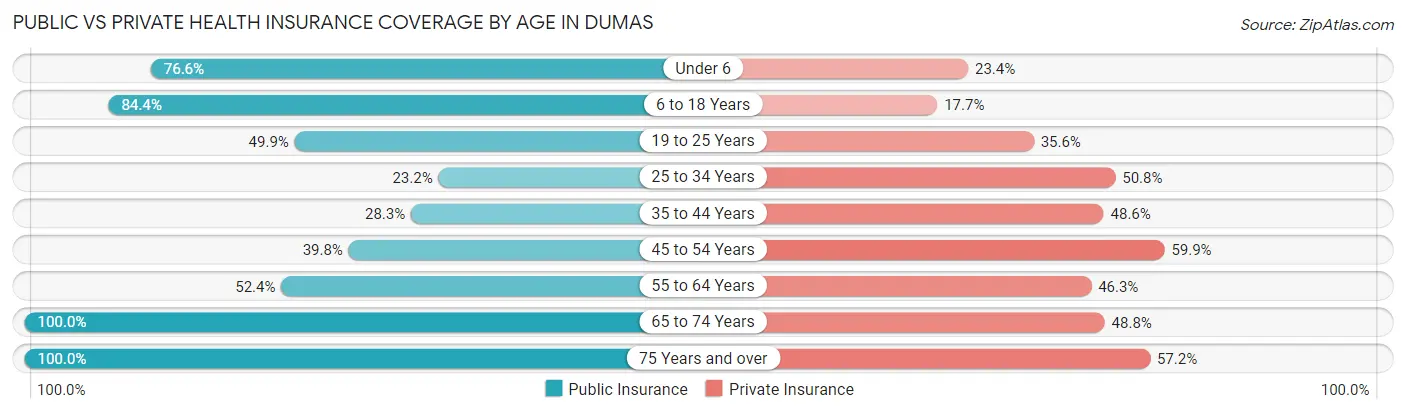
| Age Bracket | Public Insurance | Private Insurance |
| Under 6 | 196 (76.6%) | 60 (23.4%) |
| 6 to 18 Years | 710 (84.4%) | 149 (17.7%) |
| 19 to 25 Years | 196 (49.9%) | 140 (35.6%) |
| 25 to 34 Years | 121 (23.2%) | 265 (50.8%) |
| 35 to 44 Years | 121 (28.3%) | 208 (48.6%) |
| 45 to 54 Years | 147 (39.8%) | 221 (59.9%) |
| 55 to 64 Years | 233 (52.4%) | 206 (46.3%) |
| 65 to 74 Years | 453 (100.0%) | 221 (48.8%) |
| 75 Years and over | 257 (100.0%) | 147 (57.2%) |
| Total | 2,434 (61.4%) | 1,617 (40.8%) |
Disability Status by Sex by Age in Dumas
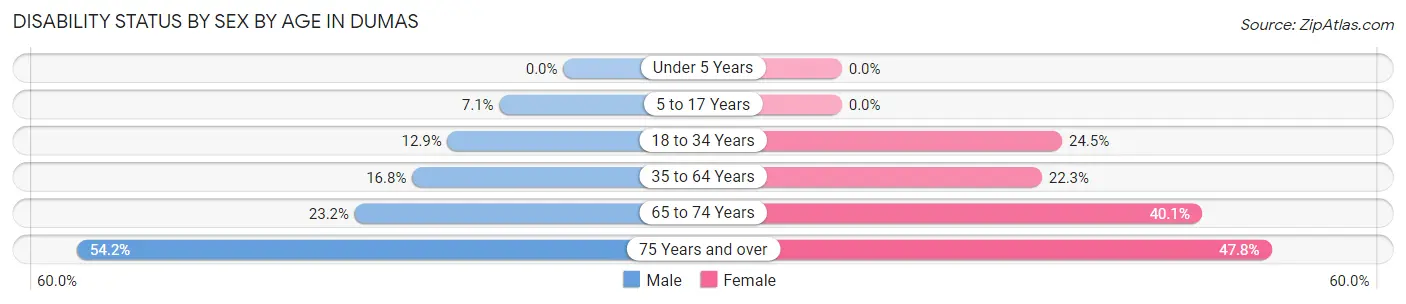
| Age Bracket | Male | Female |
| Under 5 Years | 0 (0.0%) | 0 (0.0%) |
| 5 to 17 Years | 23 (7.1%) | 0 (0.0%) |
| 18 to 34 Years | 62 (12.9%) | 118 (24.5%) |
| 35 to 64 Years | 70 (16.8%) | 184 (22.3%) |
| 65 to 74 Years | 49 (23.2%) | 97 (40.1%) |
| 75 Years and over | 52 (54.2%) | 77 (47.8%) |
Disability Class by Sex by Age in Dumas
Disability Class: Hearing Difficulty
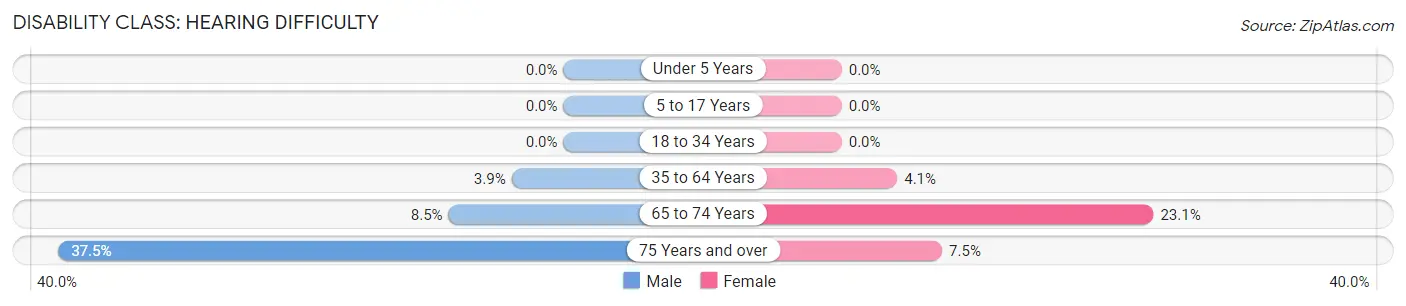
| Age Bracket | Male | Female |
| Under 5 Years | 0 (0.0%) | 0 (0.0%) |
| 5 to 17 Years | 0 (0.0%) | 0 (0.0%) |
| 18 to 34 Years | 0 (0.0%) | 0 (0.0%) |
| 35 to 64 Years | 16 (3.8%) | 34 (4.1%) |
| 65 to 74 Years | 18 (8.5%) | 56 (23.1%) |
| 75 Years and over | 36 (37.5%) | 12 (7.4%) |
Disability Class: Vision Difficulty
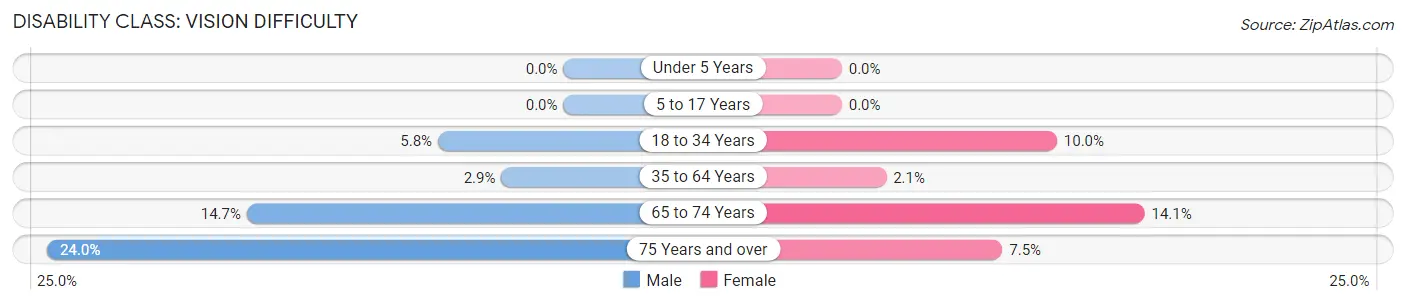
| Age Bracket | Male | Female |
| Under 5 Years | 0 (0.0%) | 0 (0.0%) |
| 5 to 17 Years | 0 (0.0%) | 0 (0.0%) |
| 18 to 34 Years | 28 (5.8%) | 48 (10.0%) |
| 35 to 64 Years | 12 (2.9%) | 17 (2.1%) |
| 65 to 74 Years | 31 (14.7%) | 34 (14.1%) |
| 75 Years and over | 23 (24.0%) | 12 (7.4%) |
Disability Class: Cognitive Difficulty
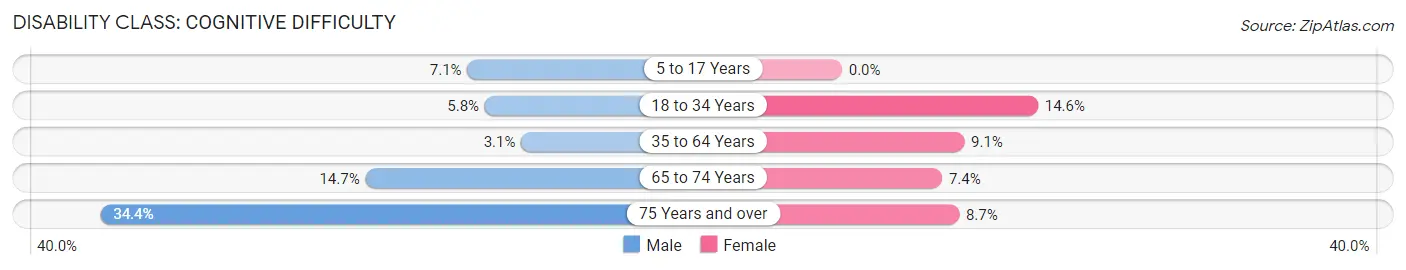
| Age Bracket | Male | Female |
| 5 to 17 Years | 23 (7.1%) | 0 (0.0%) |
| 18 to 34 Years | 28 (5.8%) | 70 (14.5%) |
| 35 to 64 Years | 13 (3.1%) | 75 (9.1%) |
| 65 to 74 Years | 31 (14.7%) | 18 (7.4%) |
| 75 Years and over | 33 (34.4%) | 14 (8.7%) |
Disability Class: Ambulatory Difficulty
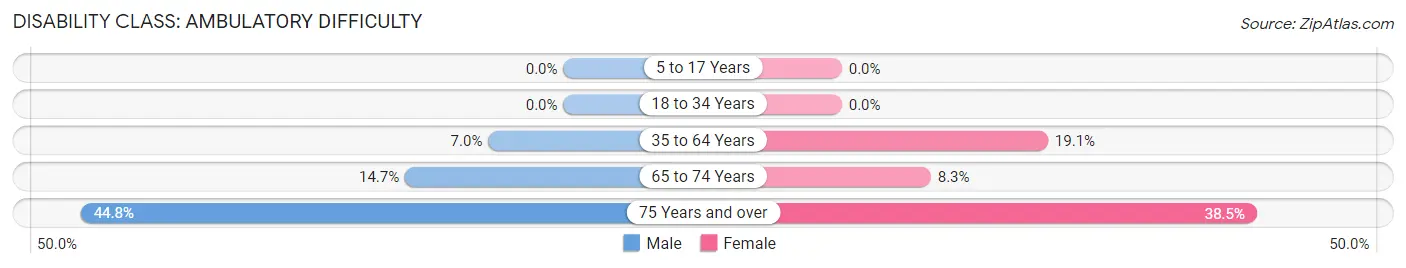
| Age Bracket | Male | Female |
| 5 to 17 Years | 0 (0.0%) | 0 (0.0%) |
| 18 to 34 Years | 0 (0.0%) | 0 (0.0%) |
| 35 to 64 Years | 29 (7.0%) | 158 (19.1%) |
| 65 to 74 Years | 31 (14.7%) | 20 (8.3%) |
| 75 Years and over | 43 (44.8%) | 62 (38.5%) |
Disability Class: Self-Care Difficulty
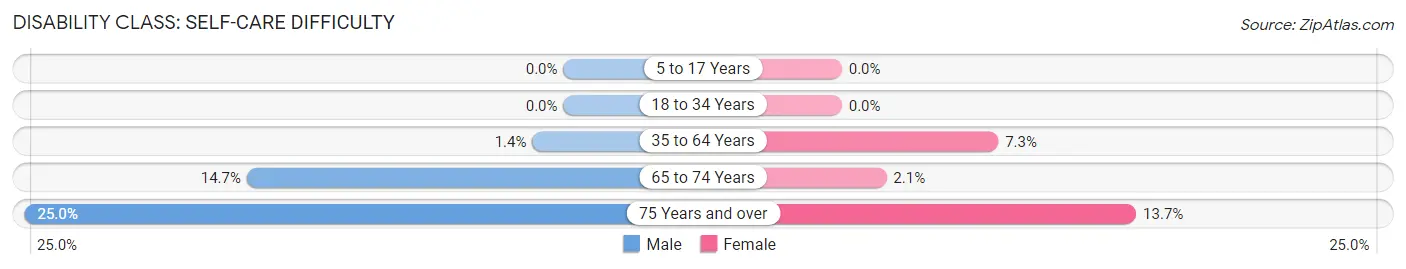
| Age Bracket | Male | Female |
| 5 to 17 Years | 0 (0.0%) | 0 (0.0%) |
| 18 to 34 Years | 0 (0.0%) | 0 (0.0%) |
| 35 to 64 Years | 6 (1.4%) | 60 (7.3%) |
| 65 to 74 Years | 31 (14.7%) | 5 (2.1%) |
| 75 Years and over | 24 (25.0%) | 22 (13.7%) |
Technology Access in Dumas
Computing Device Access in Dumas
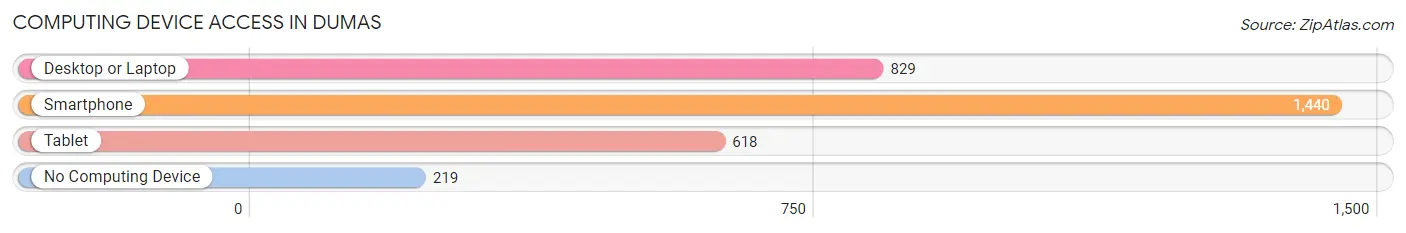
| Device Type | # Households | % Households |
| Desktop or Laptop | 829 | 48.5% |
| Smartphone | 1,440 | 84.3% |
| Tablet | 618 | 36.2% |
| No Computing Device | 219 | 12.8% |
| Total | 1,709 | 100.0% |
Internet Access in Dumas
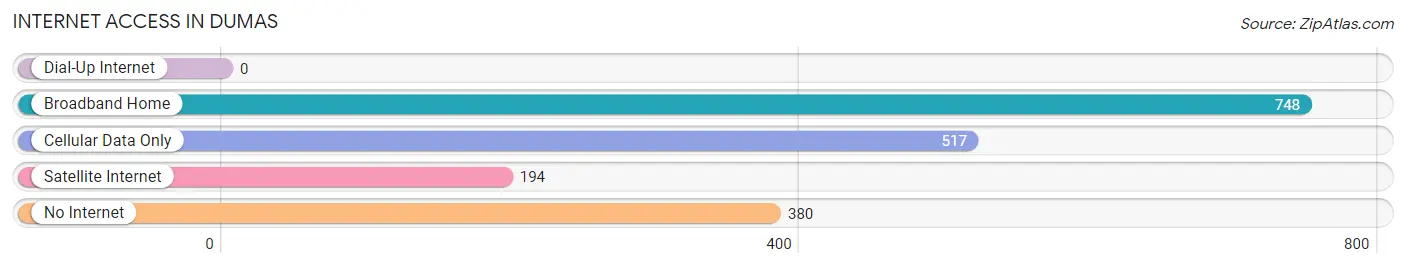
| Internet Type | # Households | % Households |
| Dial-Up Internet | 0 | 0.0% |
| Broadband Home | 748 | 43.8% |
| Cellular Data Only | 517 | 30.2% |
| Satellite Internet | 194 | 11.4% |
| No Internet | 380 | 22.2% |
| Total | 1,709 | 100.0% |
Dumas Summary
Dumas, Arkansas is a small city located in Desha County in the southeastern corner of the state. It is situated on the banks of the Arkansas River, about 30 miles south of Pine Bluff. The city has a population of about 5,000 people and is the county seat of Desha County.
History
Dumas was founded in 1883 by the Arkansas and Louisiana Railroad. The town was named after the French-born railroad engineer, Charles Dumas. The railroad was built to connect the Arkansas River to the Mississippi River. The town quickly grew and by 1890, it had a population of over 1,000 people.
In the early 1900s, the town was a major cotton-producing center. The cotton industry was the main source of income for the town and its residents. The town also had a thriving lumber industry, which provided jobs for many of the town’s residents.
In the 1920s, the Great Depression hit the town hard. Many of the town’s businesses closed and the population declined. The town was able to recover in the 1940s and 1950s, thanks to the growth of the cotton industry.
In the 1960s, the town began to diversify its economy. The town’s economy shifted from cotton to other industries, such as manufacturing and tourism. The town also began to attract new businesses, such as a hospital and a college.
Geography
Dumas is located in the southeastern corner of Arkansas, about 30 miles south of Pine Bluff. The town is situated on the banks of the Arkansas River. The town is surrounded by farmland and is located in the Arkansas Delta region.
The climate in Dumas is humid subtropical, with hot, humid summers and mild winters. The average annual temperature is around 65 degrees Fahrenheit. The town receives an average of 48 inches of rain per year.
Economy
The economy of Dumas is largely based on agriculture. The town is home to several large farms, which produce cotton, soybeans, corn, and other crops. The town also has a thriving lumber industry, which provides jobs for many of the town’s residents.
The town is also home to several manufacturing companies, which produce a variety of products, such as furniture, clothing, and electronics. The town also has a growing tourism industry, which attracts visitors from all over the state.
Demographics
As of the 2010 census, the population of Dumas was 5,039. The town is predominantly white, with a small African American population. The median household income in the town is $31,000, and the median home value is $90,000.
The town is served by the Dumas School District, which includes two elementary schools, one middle school, and one high school. The town also has a public library and a community college.
Conclusion
Dumas, Arkansas is a small city located in Desha County in the southeastern corner of the state. It is situated on the banks of the Arkansas River, about 30 miles south of Pine Bluff. The city has a population of about 5,000 people and is the county seat of Desha County. The town’s economy is largely based on agriculture, with a thriving cotton, lumber, and manufacturing industry. The town also has a growing tourism industry, which attracts visitors from all over the state. The town is predominantly white, with a small African American population. The median household income in the town is $31,000, and the median home value is $90,000.
Common Questions
What is the Total Population of Dumas?
Total Population of Dumas is 3,965.
What is the Total Male Population of Dumas?
Total Male Population of Dumas is 1,701.
What is the Total Female Population of Dumas?
Total Female Population of Dumas is 2,264.
What is the Ratio of Males per 100 Females in Dumas?
There are 75.13 Males per 100 Females in Dumas.
What is the Ratio of Females per 100 Males in Dumas?
There are 133.10 Females per 100 Males in Dumas.
What is the Median Population Age in Dumas?
Median Population Age in Dumas is 34.5 Years.
What is the Average Family Size in Dumas
Average Family Size in Dumas is 3.1 People.
What is the Average Household Size in Dumas
Average Household Size in Dumas is 2.3 People.
What is Per Capita Income in Dumas?
Per Capita income in Dumas is $17,722.
What is the Median Family Income in Dumas?
Median Family Income in Dumas is $43,500.
What is the Median Household income in Dumas?
Median Household Income in Dumas is $34,554.
What is Income or Wage Gap in Dumas?
Income or Wage Gap in Dumas is 22.2%.
Women in Dumas earn 77.8 cents for every dollar earned by a man.
What is Inequality or Gini Index in Dumas?
Inequality or Gini Index in Dumas is 0.42.
How Large is the Labor Force in Dumas?
There are 1,587 People in the Labor Forcein in Dumas.
What is the Percentage of People in the Labor Force in Dumas?
53.4% of People are in the Labor Force in Dumas.
What is the Unemployment Rate in Dumas?
Unemployment Rate in Dumas is 9.0%.