West Baraboo, WI
West Baraboo Map
West Baraboo Overview
1,557
TOTAL POPULATION
830
MALE POPULATION
727
FEMALE POPULATION
114.17
MALES / 100 FEMALES
87.59
FEMALES / 100 MALES
35.3
MEDIAN AGE
2.7
AVG FAMILY SIZE
2.2
AVG HOUSEHOLD SIZE
$30,989
PER CAPITA INCOME
$70,000
AVG FAMILY INCOME
$55,952
AVG HOUSEHOLD INCOME
3.6%
WAGE / INCOME GAP [ % ]
96.4¢/ $1
WAGE / INCOME GAP [ $ ]
0.39
INEQUALITY / GINI INDEX
969
LABOR FORCE [ PEOPLE ]
76.0%
PERCENT IN LABOR FORCE
3.8%
UNEMPLOYMENT RATE
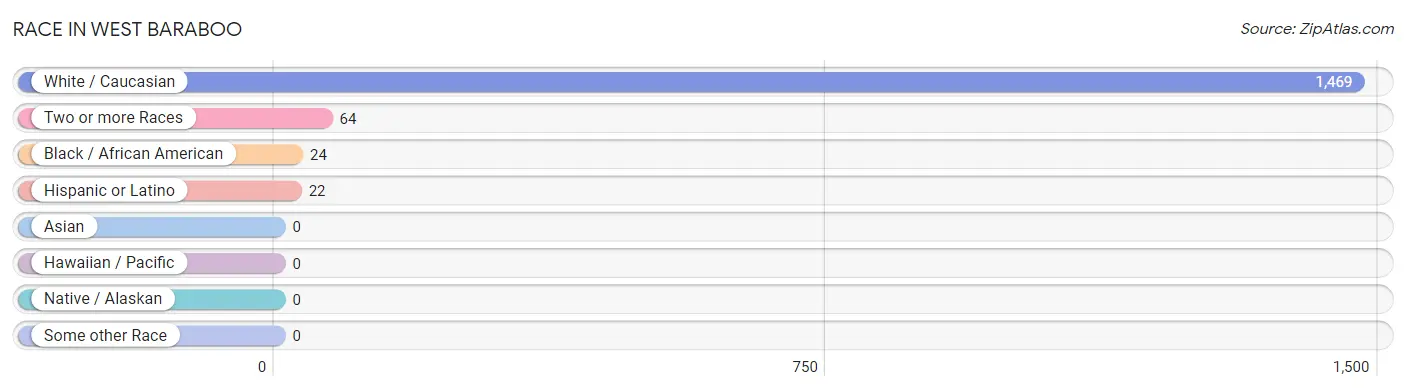
Race in West Baraboo
The most populous races in West Baraboo are White / Caucasian (1,469 | 94.4%), Two or more Races (64 | 4.1%), and Black / African American (24 | 1.5%).
| Race | # Population | % Population |
| Asian | 0 | 0.0% |
| Black / African American | 24 | 1.5% |
| Hawaiian / Pacific | 0 | 0.0% |
| Hispanic or Latino | 22 | 1.4% |
| Native / Alaskan | 0 | 0.0% |
| White / Caucasian | 1,469 | 94.4% |
| Two or more Races | 64 | 4.1% |
| Some other Race | 0 | 0.0% |
| Total | 1,557 | 100.0% |
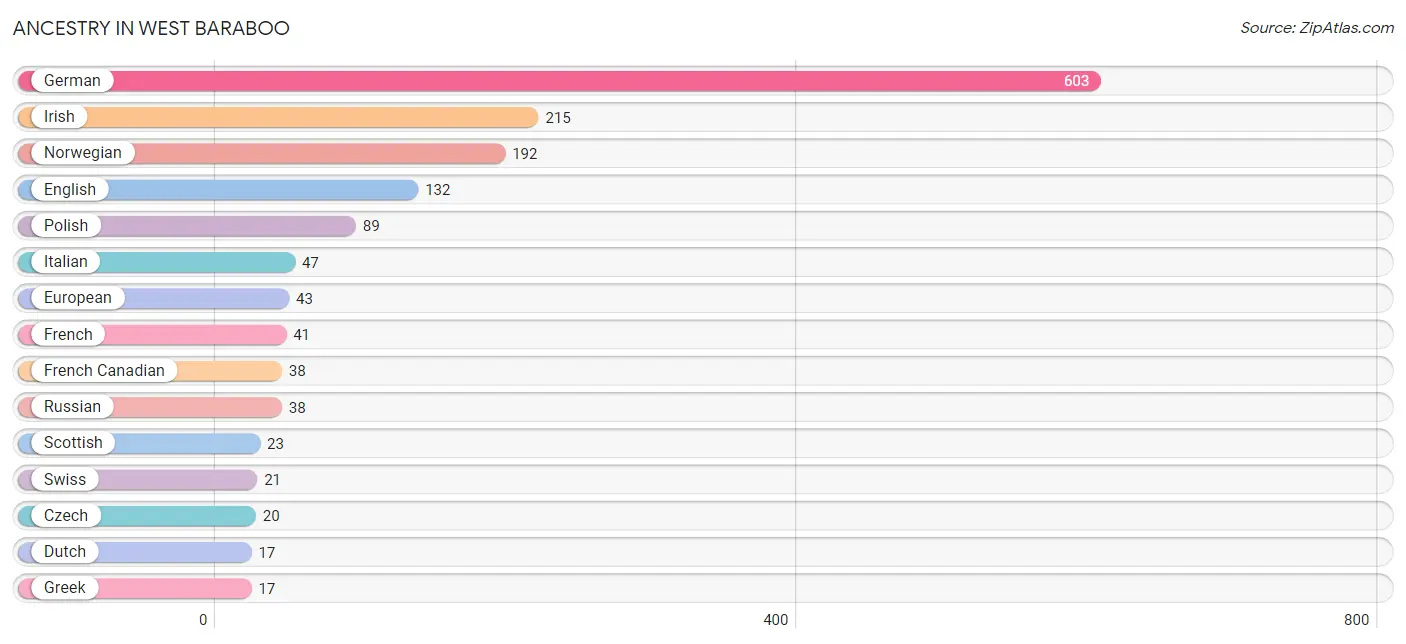
Ancestry in West Baraboo
The most populous ancestries reported in West Baraboo are German (603 | 38.7%), Irish (215 | 13.8%), Norwegian (192 | 12.3%), English (132 | 8.5%), and Polish (89 | 5.7%), together accounting for 79.1% of all West Baraboo residents.
| Ancestry | # Population | % Population |
| American | 6 | 0.4% |
| Argentinean | 5 | 0.3% |
| Austrian | 4 | 0.3% |
| British | 4 | 0.3% |
| Canadian | 14 | 0.9% |
| Central American | 4 | 0.3% |
| Colombian | 1 | 0.1% |
| Czech | 20 | 1.3% |
| Danish | 4 | 0.3% |
| Dutch | 17 | 1.1% |
| Eastern European | 13 | 0.8% |
| English | 132 | 8.5% |
| European | 43 | 2.8% |
| Finnish | 5 | 0.3% |
| French | 41 | 2.6% |
| French Canadian | 38 | 2.4% |
| German | 603 | 38.7% |
| Greek | 17 | 1.1% |
| Hungarian | 2 | 0.1% |
| Irish | 215 | 13.8% |
| Italian | 47 | 3.0% |
| Jamaican | 13 | 0.8% |
| Latvian | 2 | 0.1% |
| Lithuanian | 3 | 0.2% |
| Mexican | 8 | 0.5% |
| Nicaraguan | 4 | 0.3% |
| Northern European | 11 | 0.7% |
| Norwegian | 192 | 12.3% |
| Polish | 89 | 5.7% |
| Portuguese | 7 | 0.4% |
| Puerto Rican | 1 | 0.1% |
| Romanian | 13 | 0.8% |
| Russian | 38 | 2.4% |
| Scottish | 23 | 1.5% |
| South American | 6 | 0.4% |
| South American Indian | 5 | 0.3% |
| Spanish | 3 | 0.2% |
| Swedish | 8 | 0.5% |
| Swiss | 21 | 1.3% |
| Ukrainian | 6 | 0.4% |
| Welsh | 4 | 0.3% |
| Yugoslavian | 3 | 0.2% | View All 42 Rows |
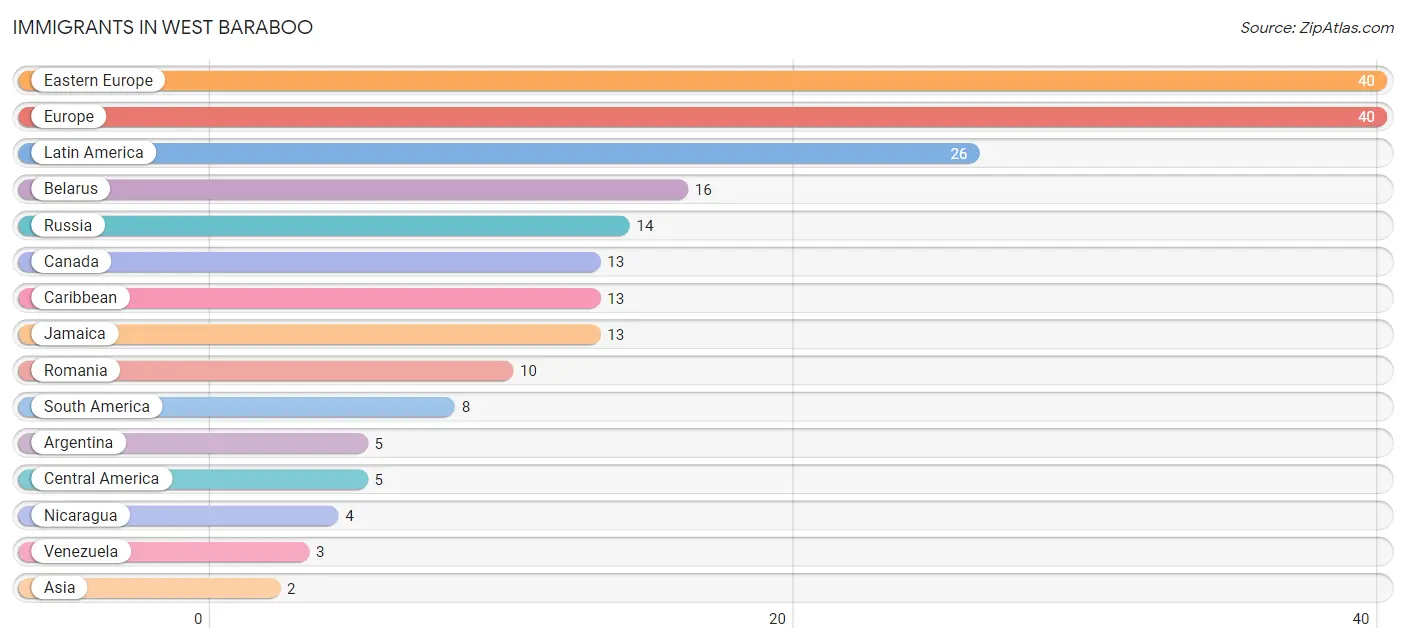
Immigrants in West Baraboo
The most numerous immigrant groups reported in West Baraboo came from Eastern Europe (40 | 2.6%), Europe (40 | 2.6%), Latin America (26 | 1.7%), Belarus (16 | 1.0%), and Russia (14 | 0.9%), together accounting for 8.7% of all West Baraboo residents.
| Immigration Origin | # Population | % Population |
| Argentina | 5 | 0.3% |
| Asia | 2 | 0.1% |
| Belarus | 16 | 1.0% |
| Canada | 13 | 0.8% |
| Caribbean | 13 | 0.8% |
| Central America | 5 | 0.3% |
| Eastern Europe | 40 | 2.6% |
| Europe | 40 | 2.6% |
| Jamaica | 13 | 0.8% |
| Kazakhstan | 2 | 0.1% |
| Latin America | 26 | 1.7% |
| Mexico | 1 | 0.1% |
| Nicaragua | 4 | 0.3% |
| Romania | 10 | 0.6% |
| Russia | 14 | 0.9% |
| South America | 8 | 0.5% |
| South Central Asia | 2 | 0.1% |
| Venezuela | 3 | 0.2% | View All 18 Rows |
Sex and Age in West Baraboo
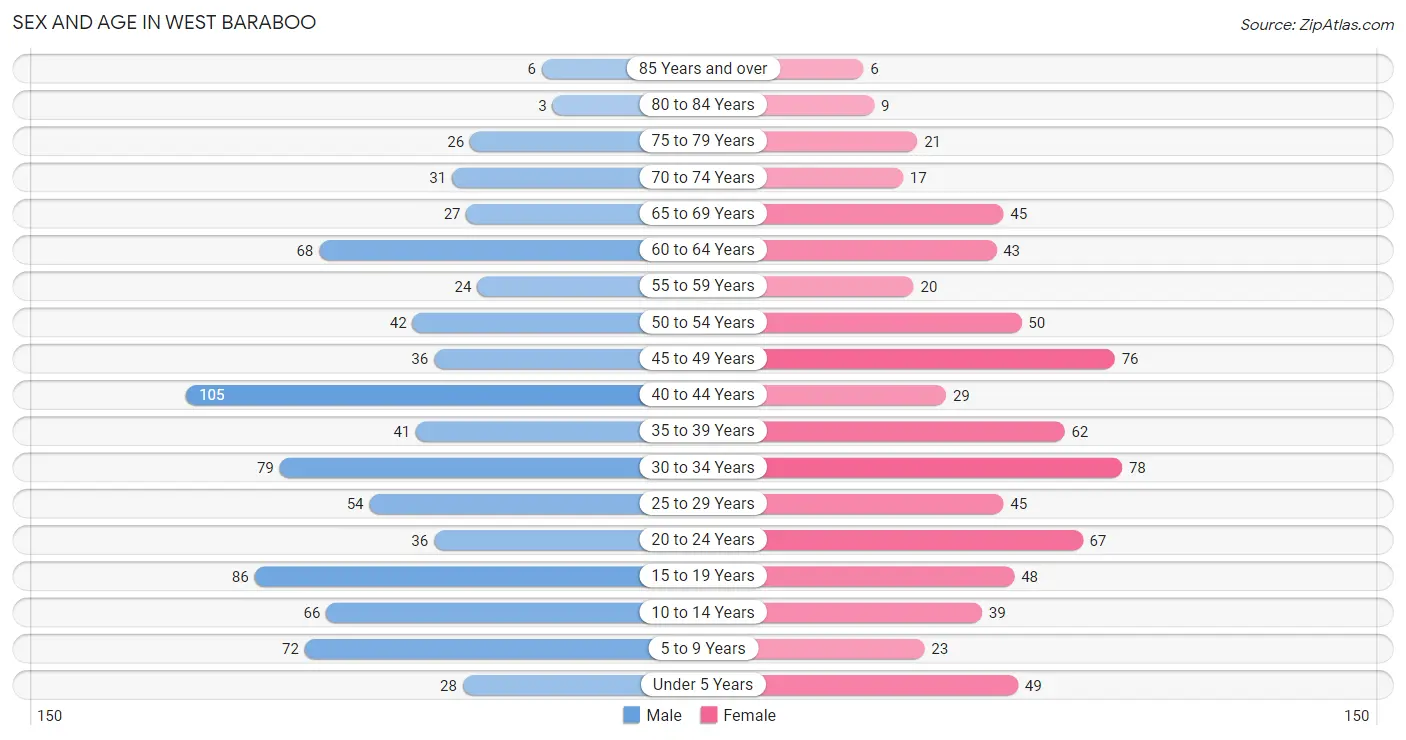
Sex and Age in West Baraboo
The most populous age groups in West Baraboo are 40 to 44 Years (105 | 12.7%) for men and 30 to 34 Years (78 | 10.7%) for women.
| Age Bracket | Male | Female |
| Under 5 Years | 28 (3.4%) | 49 (6.7%) |
| 5 to 9 Years | 72 (8.7%) | 23 (3.2%) |
| 10 to 14 Years | 66 (8.0%) | 39 (5.4%) |
| 15 to 19 Years | 86 (10.4%) | 48 (6.6%) |
| 20 to 24 Years | 36 (4.3%) | 67 (9.2%) |
| 25 to 29 Years | 54 (6.5%) | 45 (6.2%) |
| 30 to 34 Years | 79 (9.5%) | 78 (10.7%) |
| 35 to 39 Years | 41 (4.9%) | 62 (8.5%) |
| 40 to 44 Years | 105 (12.7%) | 29 (4.0%) |
| 45 to 49 Years | 36 (4.3%) | 76 (10.4%) |
| 50 to 54 Years | 42 (5.1%) | 50 (6.9%) |
| 55 to 59 Years | 24 (2.9%) | 20 (2.8%) |
| 60 to 64 Years | 68 (8.2%) | 43 (5.9%) |
| 65 to 69 Years | 27 (3.3%) | 45 (6.2%) |
| 70 to 74 Years | 31 (3.7%) | 17 (2.3%) |
| 75 to 79 Years | 26 (3.1%) | 21 (2.9%) |
| 80 to 84 Years | 3 (0.4%) | 9 (1.2%) |
| 85 Years and over | 6 (0.7%) | 6 (0.8%) |
| Total | 830 (100.0%) | 727 (100.0%) |
Families and Households in West Baraboo
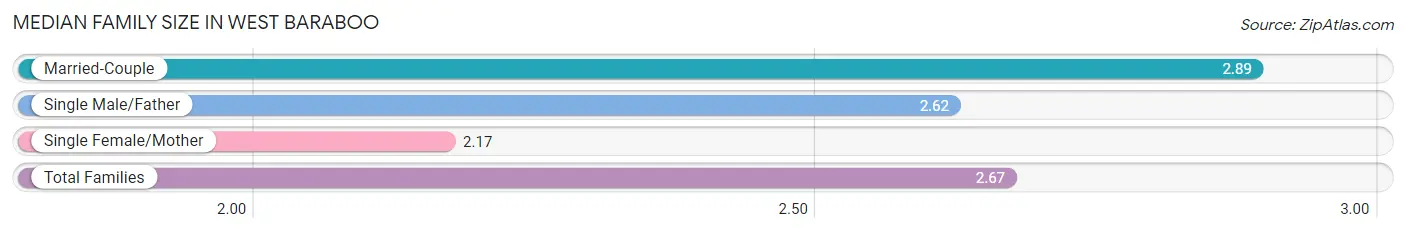
Median Family Size in West Baraboo
The median family size in West Baraboo is 2.67 persons per family, with married-couple families (251 | 59.5%) accounting for the largest median family size of 2.89 persons per family. On the other hand, single female/mother families (102 | 24.2%) represent the smallest median family size with 2.17 persons per family.
| Family Type | # Families | Family Size |
| Married-Couple | 251 (59.5%) | 2.89 |
| Single Male/Father | 69 (16.4%) | 2.62 |
| Single Female/Mother | 102 (24.2%) | 2.17 |
| Total Families | 422 (100.0%) | 2.67 |
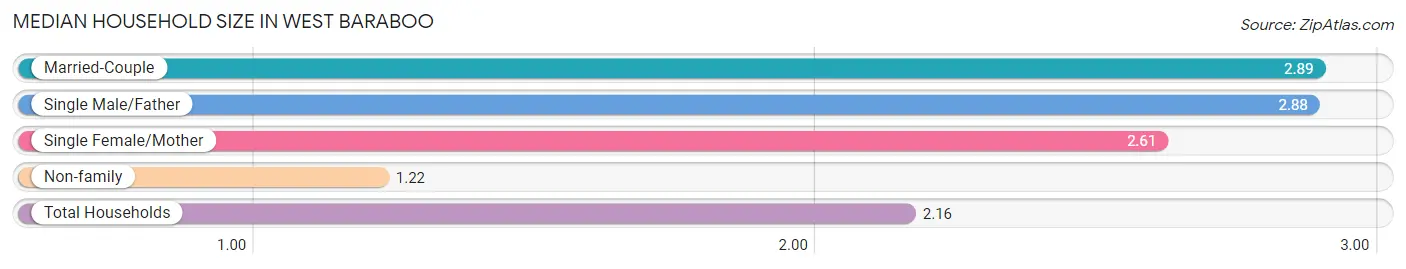
Median Household Size in West Baraboo
The median household size in West Baraboo is 2.16 persons per household, with married-couple households (251 | 34.8%) accounting for the largest median household size of 2.89 persons per household. non-family households (300 | 41.5%) represent the smallest median household size with 1.22 persons per household.
| Household Type | # Households | Household Size |
| Married-Couple | 251 (34.8%) | 2.89 |
| Single Male/Father | 69 (9.6%) | 2.88 |
| Single Female/Mother | 102 (14.1%) | 2.61 |
| Non-family | 300 (41.5%) | 1.22 |
| Total Households | 722 (100.0%) | 2.16 |
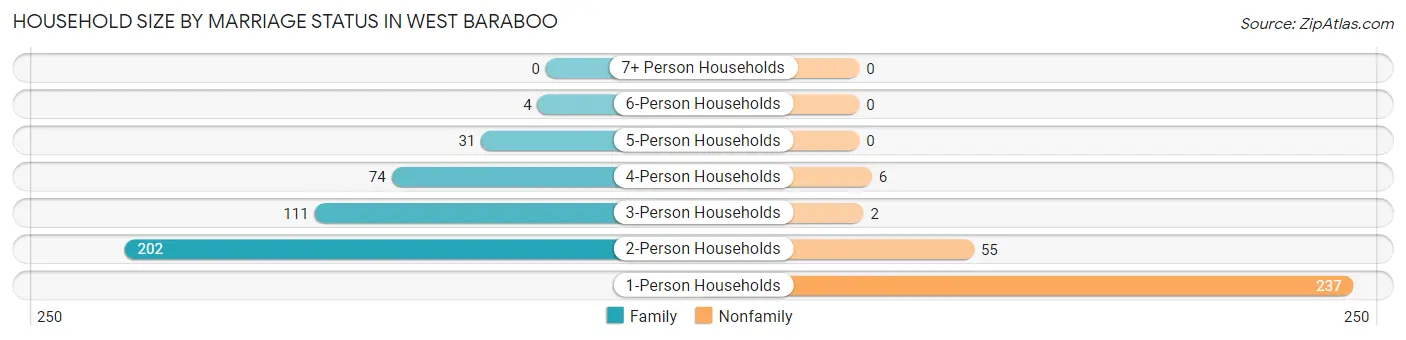
Household Size by Marriage Status in West Baraboo
Out of a total of 722 households in West Baraboo, 422 (58.5%) are family households, while 300 (41.5%) are nonfamily households. The most numerous type of family households are 2-person households, comprising 202, and the most common type of nonfamily households are 1-person households, comprising 237.
| Household Size | Family Households | Nonfamily Households |
| 1-Person Households | - | 237 (32.8%) |
| 2-Person Households | 202 (28.0%) | 55 (7.6%) |
| 3-Person Households | 111 (15.4%) | 2 (0.3%) |
| 4-Person Households | 74 (10.2%) | 6 (0.8%) |
| 5-Person Households | 31 (4.3%) | 0 (0.0%) |
| 6-Person Households | 4 (0.5%) | 0 (0.0%) |
| 7+ Person Households | 0 (0.0%) | 0 (0.0%) |
| Total | 422 (58.5%) | 300 (41.5%) |
Female Fertility in West Baraboo
Fertility by Age in West Baraboo
Average fertility rate in West Baraboo is 33.0 births per 1,000 women. Women in the age bracket of 20 to 34 years have the highest fertility rate with 74.0 births per 1,000 women. Women in the age bracket of 20 to 34 years acount for 100.0% of all women with births.
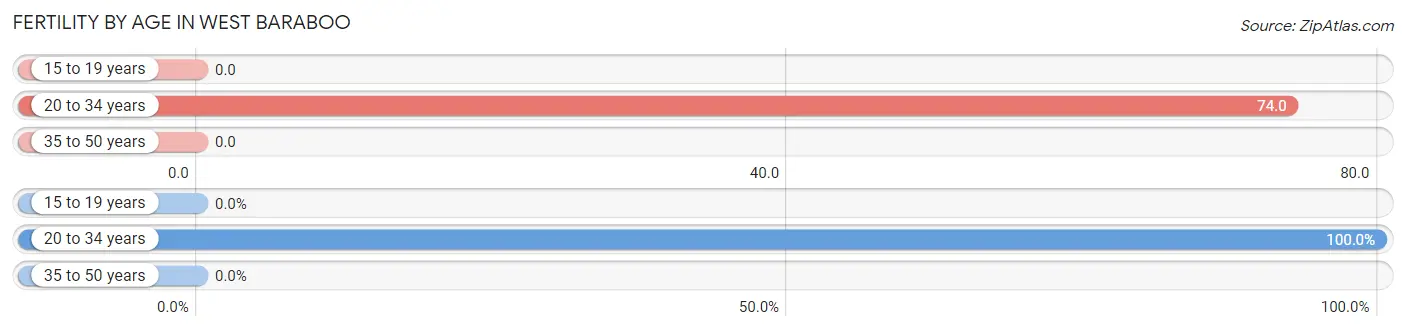
| Age Bracket | Women with Births | Births / 1,000 Women |
| 15 to 19 years | 0 (0.0%) | 0.0 |
| 20 to 34 years | 14 (100.0%) | 74.0 |
| 35 to 50 years | 0 (0.0%) | 0.0 |
| Total | 14 (100.0%) | 33.0 |
Fertility by Age by Marriage Status in West Baraboo
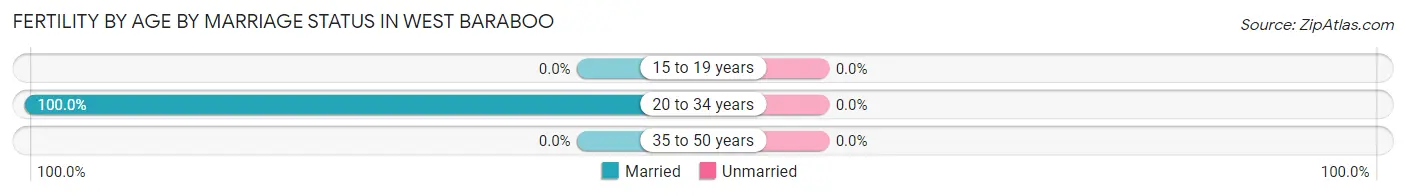
| Age Bracket | Married | Unmarried |
| 15 to 19 years | 0 (0.0%) | 0 (0.0%) |
| 20 to 34 years | 14 (100.0%) | 0 (0.0%) |
| 35 to 50 years | 0 (0.0%) | 0 (0.0%) |
| Total | 14 (100.0%) | 0 (0.0%) |
Fertility by Education in West Baraboo
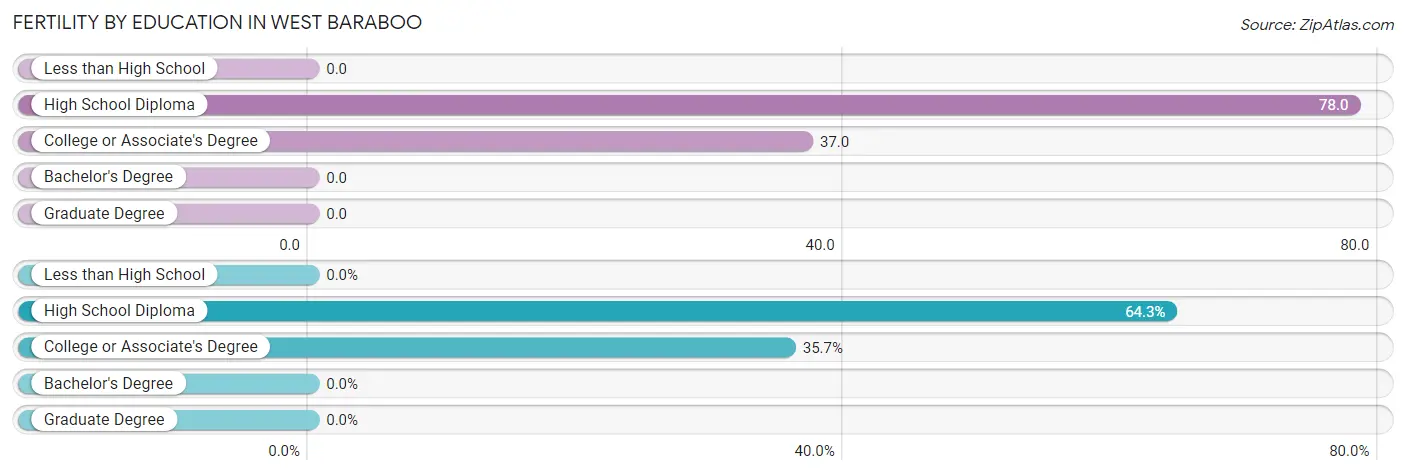
| Educational Attainment | Women with Births | Births / 1,000 Women |
| Less than High School | 0 (0.0%) | 0.0 |
| High School Diploma | 9 (64.3%) | 78.0 |
| College or Associate's Degree | 5 (35.7%) | 37.0 |
| Bachelor's Degree | 0 (0.0%) | 0.0 |
| Graduate Degree | 0 (0.0%) | 0.0 |
| Total | 14 (100.0%) | 33.0 |
Fertility by Education by Marriage Status in West Baraboo
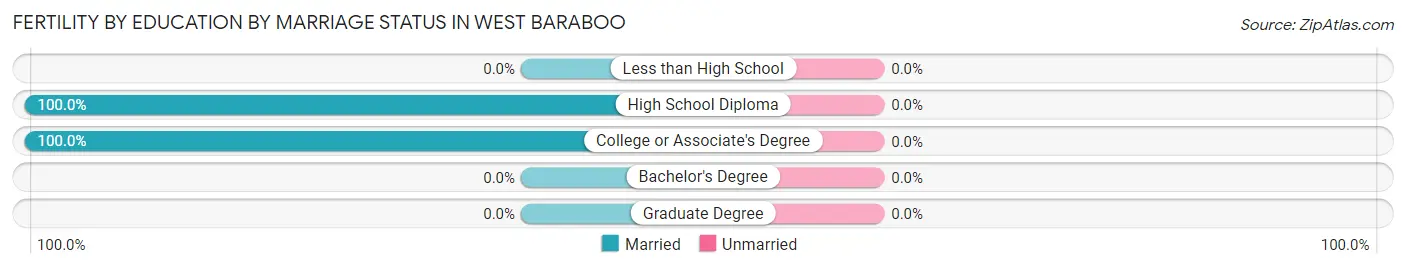
| Educational Attainment | Married | Unmarried |
| Less than High School | 0 (0.0%) | 0 (0.0%) |
| High School Diploma | 9 (100.0%) | 0 (0.0%) |
| College or Associate's Degree | 5 (100.0%) | 0 (0.0%) |
| Bachelor's Degree | 0 (0.0%) | 0 (0.0%) |
| Graduate Degree | 0 (0.0%) | 0 (0.0%) |
| Total | 14 (100.0%) | 0 (0.0%) |
Income in West Baraboo
Income Overview in West Baraboo
Per Capita Income in West Baraboo is $30,989, while median incomes of families and households are $70,000 and $55,952 respectively.
| Characteristic | Number | Measure |
| Per Capita Income | 1,557 | $30,989 |
| Median Family Income | 422 | $70,000 |
| Mean Family Income | 422 | $83,108 |
| Median Household Income | 722 | $55,952 |
| Mean Household Income | 722 | $67,849 |
| Income Deficit | 422 | $0 |
| Wage / Income Gap (%) | 1,557 | 3.64% |
| Wage / Income Gap ($) | 1,557 | 96.36¢ per $1 |
| Gini / Inequality Index | 1,557 | 0.39 |
Earnings by Sex in West Baraboo
Average Earnings in West Baraboo are $33,588, $34,083 for men and $32,844 for women, a difference of 3.6%.
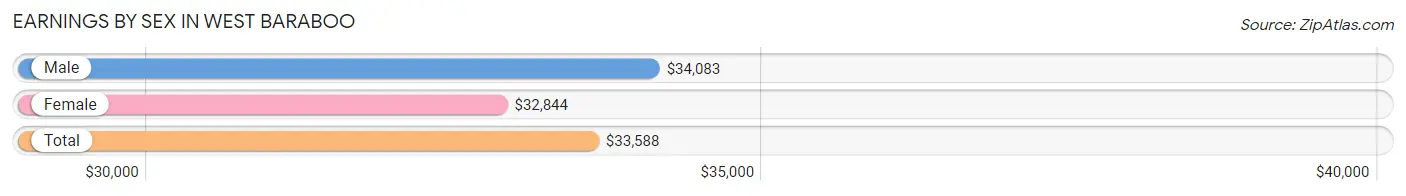
| Sex | Number | Average Earnings |
| Male | 562 (53.7%) | $34,083 |
| Female | 485 (46.3%) | $32,844 |
| Total | 1,047 (100.0%) | $33,588 |
Earnings by Sex by Income Bracket in West Baraboo
The most common earnings brackets in West Baraboo are $30,000 to $34,999 for men (64 | 11.4%) and $30,000 to $34,999 for women (86 | 17.7%).
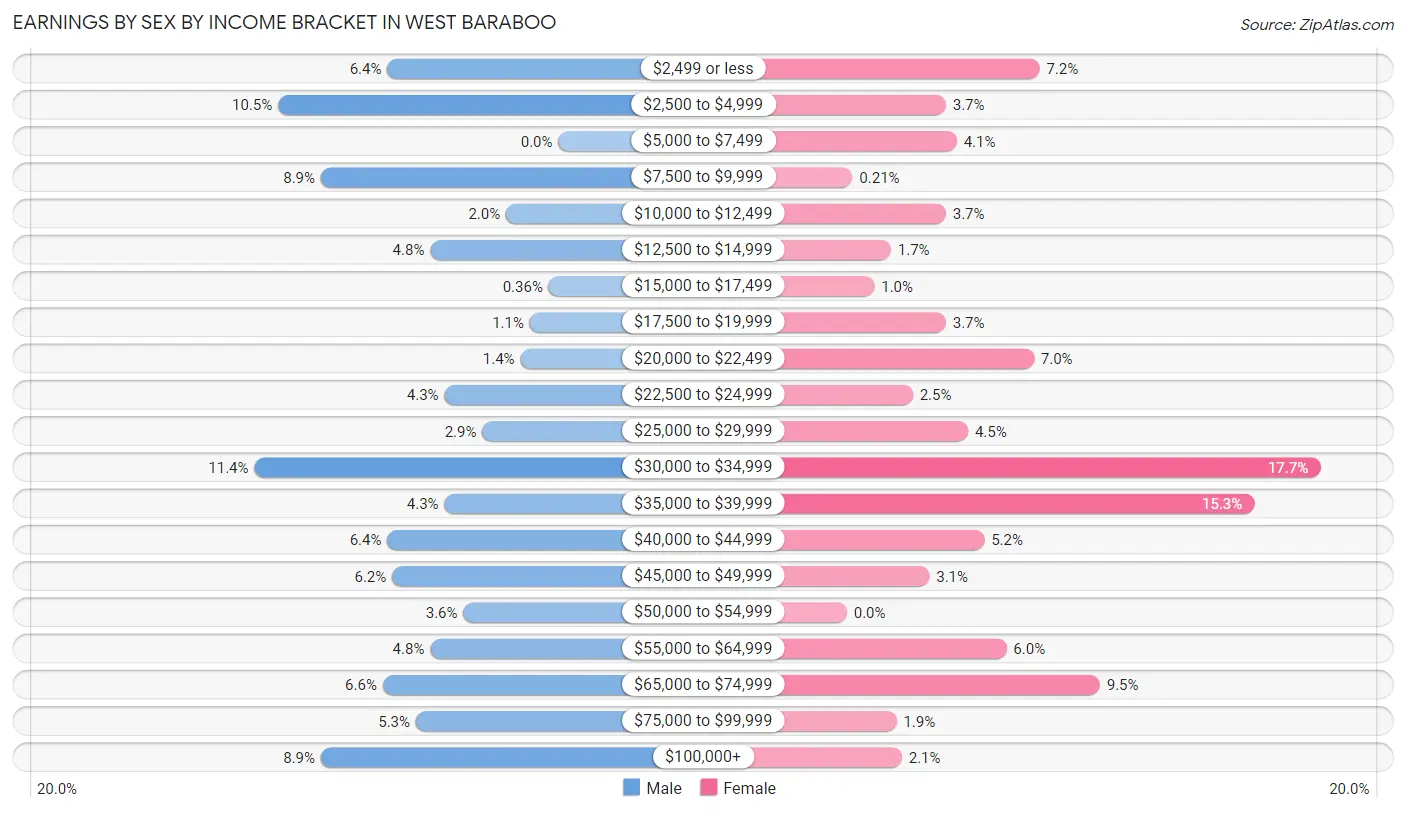
| Income | Male | Female |
| $2,499 or less | 36 (6.4%) | 35 (7.2%) |
| $2,500 to $4,999 | 59 (10.5%) | 18 (3.7%) |
| $5,000 to $7,499 | 0 (0.0%) | 20 (4.1%) |
| $7,500 to $9,999 | 50 (8.9%) | 1 (0.2%) |
| $10,000 to $12,499 | 11 (2.0%) | 18 (3.7%) |
| $12,500 to $14,999 | 27 (4.8%) | 8 (1.7%) |
| $15,000 to $17,499 | 2 (0.4%) | 5 (1.0%) |
| $17,500 to $19,999 | 6 (1.1%) | 18 (3.7%) |
| $20,000 to $22,499 | 8 (1.4%) | 34 (7.0%) |
| $22,500 to $24,999 | 24 (4.3%) | 12 (2.5%) |
| $25,000 to $29,999 | 16 (2.9%) | 22 (4.5%) |
| $30,000 to $34,999 | 64 (11.4%) | 86 (17.7%) |
| $35,000 to $39,999 | 24 (4.3%) | 74 (15.3%) |
| $40,000 to $44,999 | 36 (6.4%) | 25 (5.1%) |
| $45,000 to $49,999 | 35 (6.2%) | 15 (3.1%) |
| $50,000 to $54,999 | 20 (3.6%) | 0 (0.0%) |
| $55,000 to $64,999 | 27 (4.8%) | 29 (6.0%) |
| $65,000 to $74,999 | 37 (6.6%) | 46 (9.5%) |
| $75,000 to $99,999 | 30 (5.3%) | 9 (1.9%) |
| $100,000+ | 50 (8.9%) | 10 (2.1%) |
| Total | 562 (100.0%) | 485 (100.0%) |
Earnings by Sex by Educational Attainment in West Baraboo
Average earnings in West Baraboo are $37,969 for men and $35,078 for women, a difference of 7.6%. Men with an educational attainment of bachelor's degree enjoy the highest average annual earnings of $52,188, while those with college or associate's degree education earn the least with $34,392. Women with an educational attainment of bachelor's degree earn the most with the average annual earnings of $70,238, while those with college or associate's degree education have the smallest earnings of $30,742.
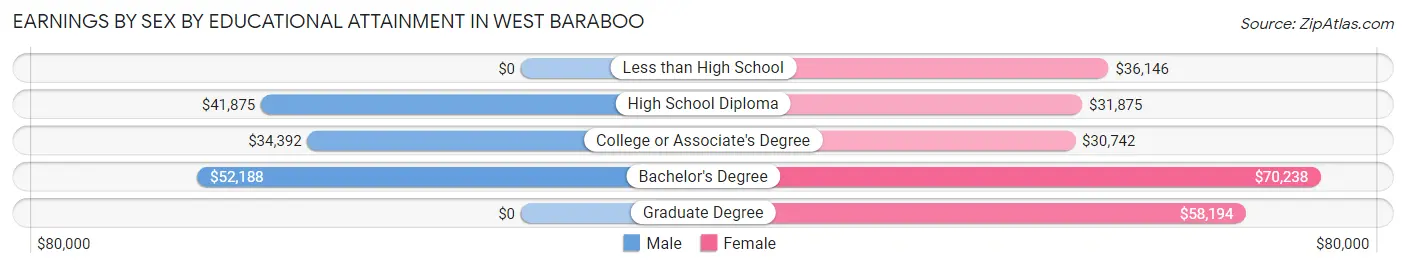
| Educational Attainment | Male Income | Female Income |
| Less than High School | - | - |
| High School Diploma | $41,875 | $31,875 |
| College or Associate's Degree | $34,392 | $30,742 |
| Bachelor's Degree | $52,188 | $70,238 |
| Graduate Degree | - | - |
| Total | $37,969 | $35,078 |
Family Income in West Baraboo
Family Income Brackets in West Baraboo
According to the West Baraboo family income data, there are 81 families falling into the $100,000 to $149,999 income range, which is the most common income bracket and makes up 19.2% of all families.
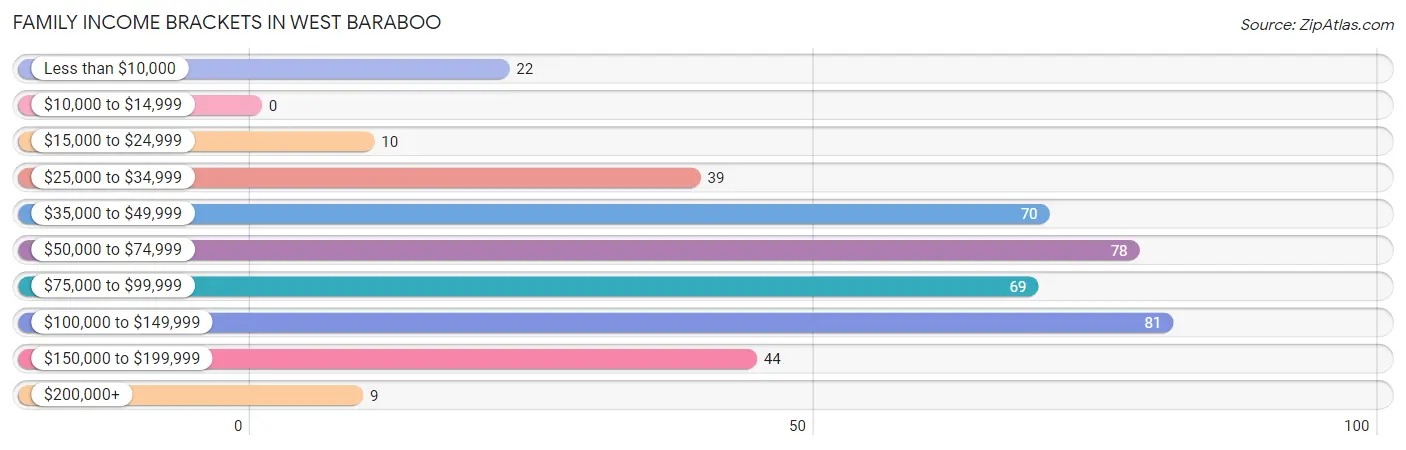
| Income Bracket | # Families | % Families |
| Less than $10,000 | 22 | 5.2% |
| $10,000 to $14,999 | 0 | 0.0% |
| $15,000 to $24,999 | 10 | 2.4% |
| $25,000 to $34,999 | 39 | 9.2% |
| $35,000 to $49,999 | 70 | 16.6% |
| $50,000 to $74,999 | 78 | 18.5% |
| $75,000 to $99,999 | 69 | 16.4% |
| $100,000 to $149,999 | 81 | 19.2% |
| $150,000 to $199,999 | 44 | 10.4% |
| $200,000+ | 9 | 2.1% |
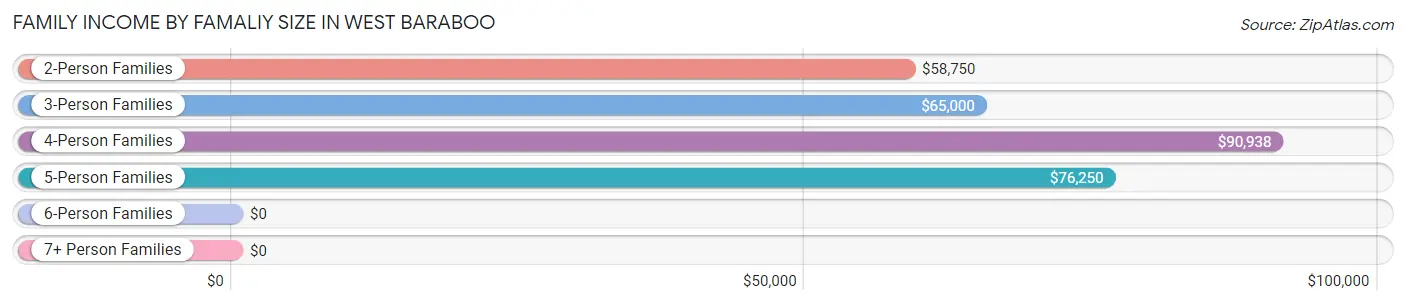
Family Income by Famaliy Size in West Baraboo
4-person families (69 | 16.4%) account for the highest median family income in West Baraboo with $90,938 per family, while 2-person families (220 | 52.1%) have the highest median income of $29,375 per family member.
| Income Bracket | # Families | Median Income |
| 2-Person Families | 220 (52.1%) | $58,750 |
| 3-Person Families | 116 (27.5%) | $65,000 |
| 4-Person Families | 69 (16.4%) | $90,938 |
| 5-Person Families | 13 (3.1%) | $76,250 |
| 6-Person Families | 4 (0.9%) | $0 |
| 7+ Person Families | 0 (0.0%) | $0 |
| Total | 422 (100.0%) | $70,000 |
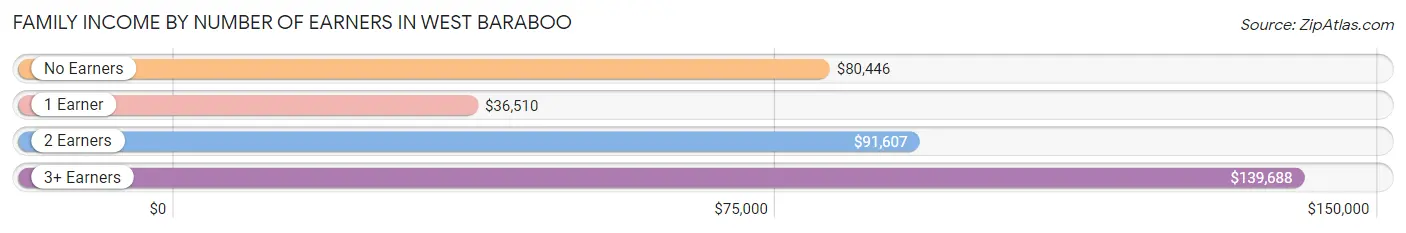
Family Income by Number of Earners in West Baraboo
The median family income in West Baraboo is $70,000, with families comprising 3+ earners (53) having the highest median family income of $139,688, while families with 1 earner (157) have the lowest median family income of $36,510, accounting for 12.6% and 37.2% of families, respectively.
| Number of Earners | # Families | Median Income |
| No Earners | 35 (8.3%) | $80,446 |
| 1 Earner | 157 (37.2%) | $36,510 |
| 2 Earners | 177 (41.9%) | $91,607 |
| 3+ Earners | 53 (12.6%) | $139,688 |
| Total | 422 (100.0%) | $70,000 |
Household Income in West Baraboo
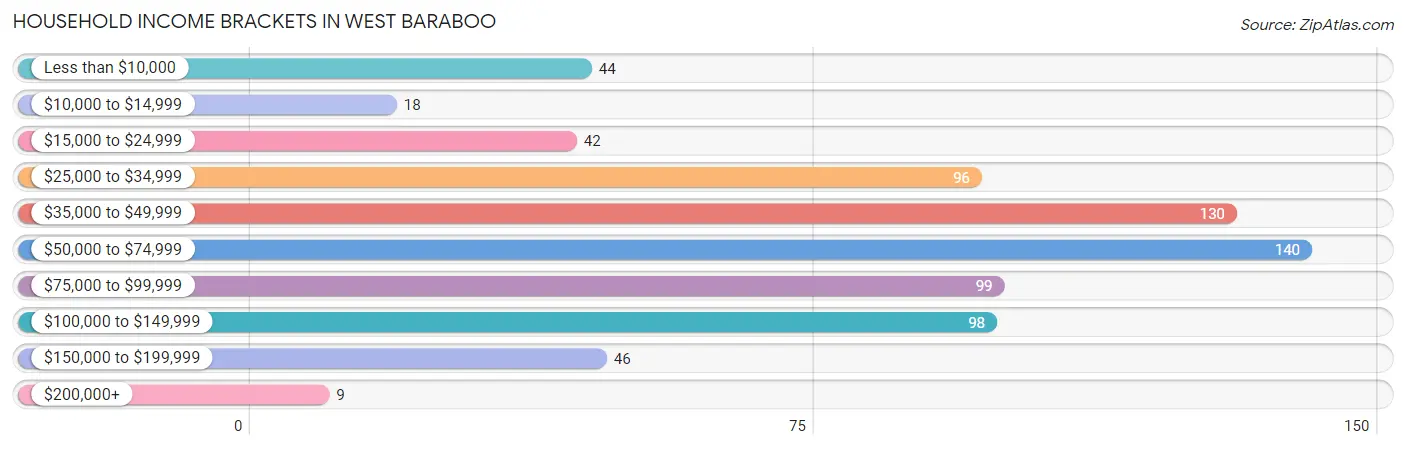
Household Income Brackets in West Baraboo
With 140 households falling in the category, the $50,000 to $74,999 income range is the most frequent in West Baraboo, accounting for 19.4% of all households. In contrast, only 9 households (1.3%) fall into the $200,000+ income bracket, making it the least populous group.
| Income Bracket | # Households | % Households |
| Less than $10,000 | 44 | 6.1% |
| $10,000 to $14,999 | 18 | 2.5% |
| $15,000 to $24,999 | 42 | 5.8% |
| $25,000 to $34,999 | 96 | 13.3% |
| $35,000 to $49,999 | 130 | 18.0% |
| $50,000 to $74,999 | 140 | 19.4% |
| $75,000 to $99,999 | 99 | 13.7% |
| $100,000 to $149,999 | 98 | 13.6% |
| $150,000 to $199,999 | 46 | 6.4% |
| $200,000+ | 9 | 1.2% |
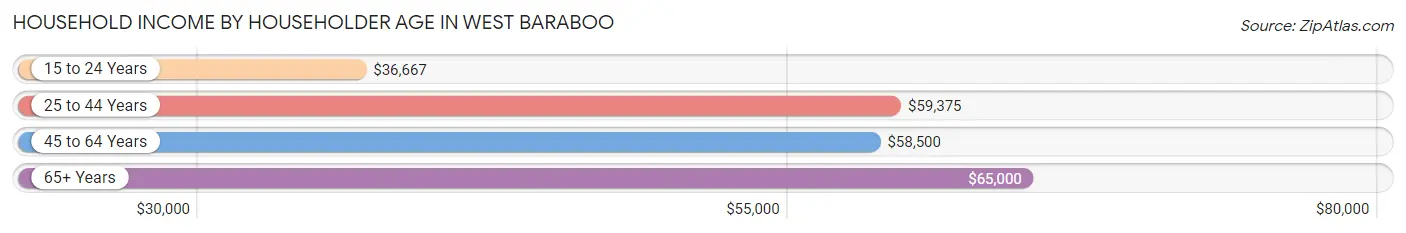
Household Income by Householder Age in West Baraboo
The median household income in West Baraboo is $55,952, with the highest median household income of $65,000 found in the 65+ years age bracket for the primary householder. A total of 128 households (17.7%) fall into this category. Meanwhile, the 15 to 24 years age bracket for the primary householder has the lowest median household income of $36,667, with 72 households (10.0%) in this group.
| Income Bracket | # Households | Median Income |
| 15 to 24 Years | 72 (10.0%) | $36,667 |
| 25 to 44 Years | 294 (40.7%) | $59,375 |
| 45 to 64 Years | 228 (31.6%) | $58,500 |
| 65+ Years | 128 (17.7%) | $65,000 |
| Total | 722 (100.0%) | $55,952 |
Poverty in West Baraboo
Income Below Poverty by Sex and Age in West Baraboo
With 10.1% poverty level for males and 10.9% for females among the residents of West Baraboo, 5 year old males and 75 year old and over females are the most vulnerable to poverty, with 5 males (100.0%) and 11 females (30.6%) in their respective age groups living below the poverty level.
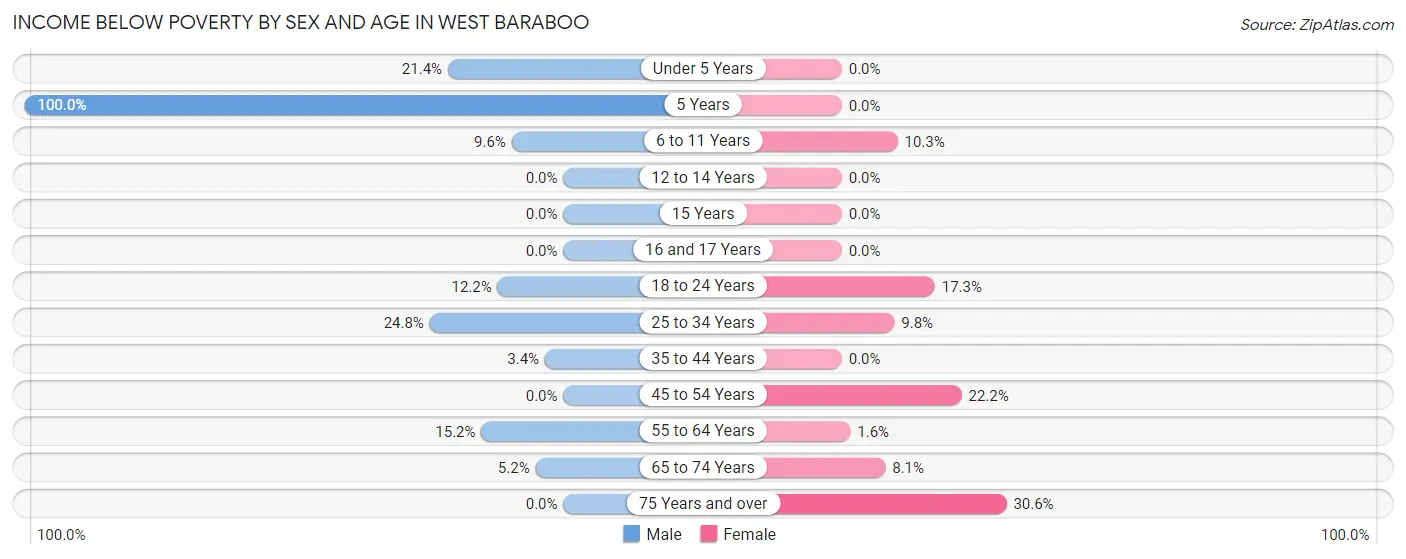
| Age Bracket | Male | Female |
| Under 5 Years | 6 (21.4%) | 0 (0.0%) |
| 5 Years | 5 (100.0%) | 0 (0.0%) |
| 6 to 11 Years | 7 (9.6%) | 3 (10.3%) |
| 12 to 14 Years | 0 (0.0%) | 0 (0.0%) |
| 15 Years | 0 (0.0%) | 0 (0.0%) |
| 16 and 17 Years | 0 (0.0%) | 0 (0.0%) |
| 18 to 24 Years | 10 (12.2%) | 19 (17.3%) |
| 25 to 34 Years | 33 (24.8%) | 12 (9.8%) |
| 35 to 44 Years | 5 (3.4%) | 0 (0.0%) |
| 45 to 54 Years | 0 (0.0%) | 28 (22.2%) |
| 55 to 64 Years | 14 (15.2%) | 1 (1.6%) |
| 65 to 74 Years | 3 (5.2%) | 5 (8.1%) |
| 75 Years and over | 0 (0.0%) | 11 (30.6%) |
| Total | 83 (10.1%) | 79 (10.9%) |
Income Above Poverty by Sex and Age in West Baraboo
According to the poverty statistics in West Baraboo, males aged 12 to 14 years and females aged under 5 years are the age groups that are most secure financially, with 100.0% of males and 100.0% of females in these age groups living above the poverty line.
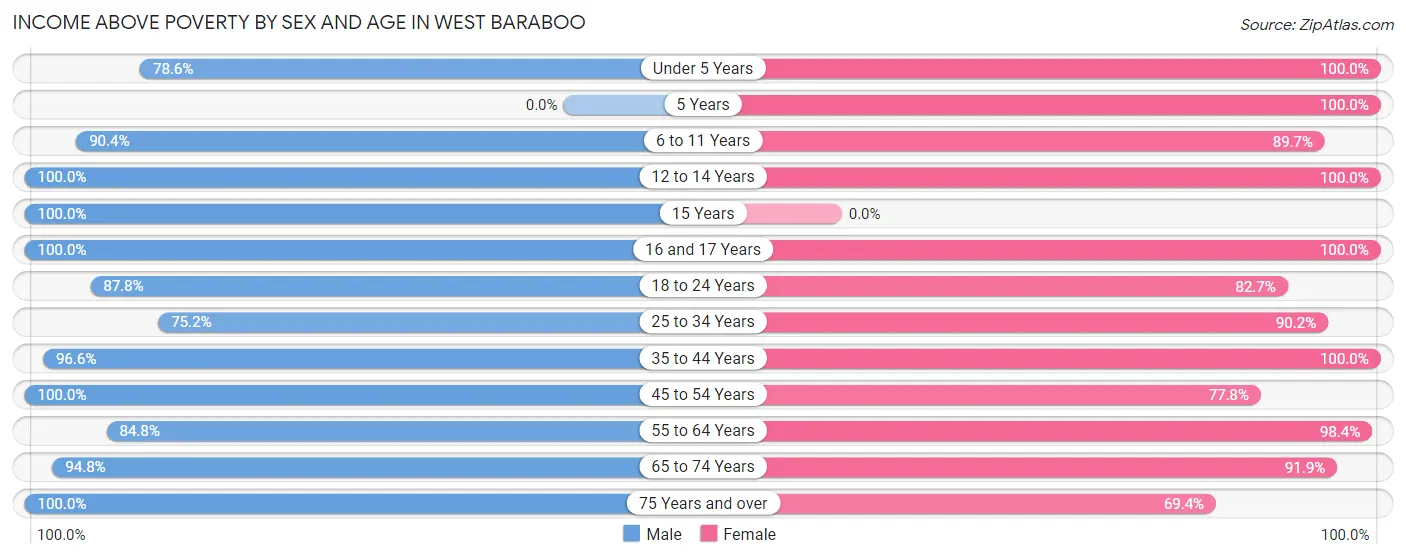
| Age Bracket | Male | Female |
| Under 5 Years | 22 (78.6%) | 49 (100.0%) |
| 5 Years | 0 (0.0%) | 12 (100.0%) |
| 6 to 11 Years | 66 (90.4%) | 26 (89.7%) |
| 12 to 14 Years | 50 (100.0%) | 21 (100.0%) |
| 15 Years | 5 (100.0%) | 0 (0.0%) |
| 16 and 17 Years | 35 (100.0%) | 5 (100.0%) |
| 18 to 24 Years | 72 (87.8%) | 91 (82.7%) |
| 25 to 34 Years | 100 (75.2%) | 111 (90.2%) |
| 35 to 44 Years | 141 (96.6%) | 91 (100.0%) |
| 45 to 54 Years | 78 (100.0%) | 98 (77.8%) |
| 55 to 64 Years | 78 (84.8%) | 62 (98.4%) |
| 65 to 74 Years | 55 (94.8%) | 57 (91.9%) |
| 75 Years and over | 35 (100.0%) | 25 (69.4%) |
| Total | 737 (89.9%) | 648 (89.1%) |
Income Below Poverty Among Married-Couple Families in West Baraboo
The poverty statistics for married-couple families in West Baraboo show that 1.2% or 3 of the total 251 families live below the poverty line. Families with 1 or 2 children have the highest poverty rate of 3.6%, comprising of 3 families. On the other hand, families with no children have the lowest poverty rate of 0.0%, which includes 0 families.
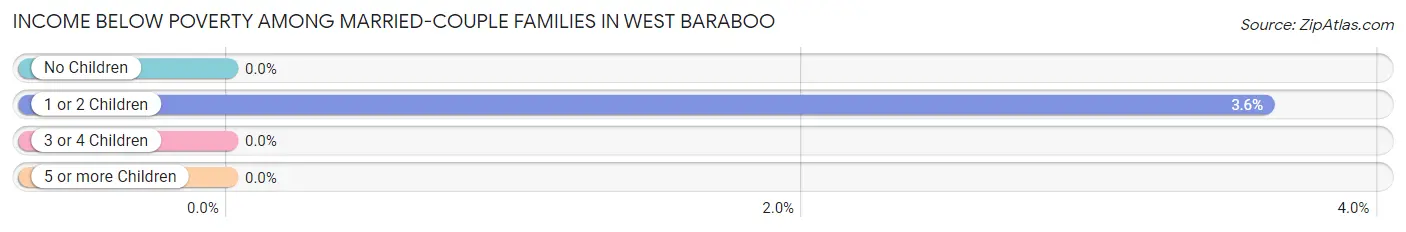
| Children | Above Poverty | Below Poverty |
| No Children | 155 (100.0%) | 0 (0.0%) |
| 1 or 2 Children | 80 (96.4%) | 3 (3.6%) |
| 3 or 4 Children | 13 (100.0%) | 0 (0.0%) |
| 5 or more Children | 0 (0.0%) | 0 (0.0%) |
| Total | 248 (98.8%) | 3 (1.2%) |
Income Below Poverty Among Single-Parent Households in West Baraboo
According to the poverty data in West Baraboo, 4.3% or 3 single-father households and 23.5% or 24 single-mother households are living below the poverty line. Among single-father households, those with 1 or 2 children have the highest poverty rate, with 3 households (5.6%) experiencing poverty. Likewise, among single-mother households, those with 3 or 4 children have the highest poverty rate, with 5 households (100.0%) falling below the poverty line.
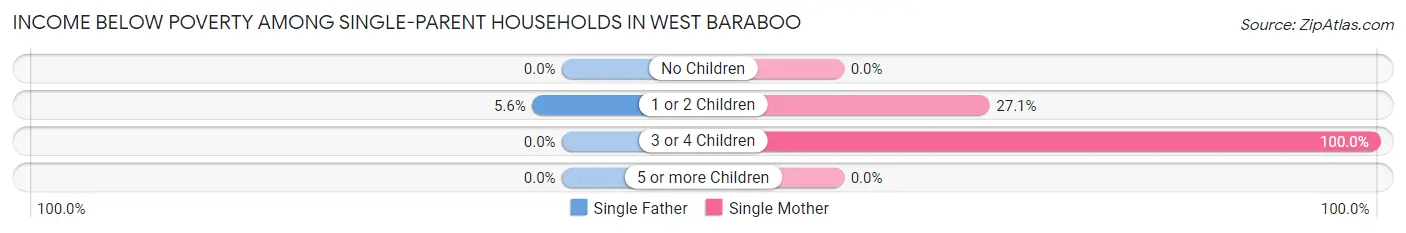
| Children | Single Father | Single Mother |
| No Children | 0 (0.0%) | 0 (0.0%) |
| 1 or 2 Children | 3 (5.6%) | 19 (27.1%) |
| 3 or 4 Children | 0 (0.0%) | 5 (100.0%) |
| 5 or more Children | 0 (0.0%) | 0 (0.0%) |
| Total | 3 (4.3%) | 24 (23.5%) |
Income Below Poverty Among Married-Couple vs Single-Parent Households in West Baraboo
The poverty data for West Baraboo shows that 3 of the married-couple family households (1.2%) and 27 of the single-parent households (15.8%) are living below the poverty level. Within the married-couple family households, those with 1 or 2 children have the highest poverty rate, with 3 households (3.6%) falling below the poverty line. Among the single-parent households, those with 3 or 4 children have the highest poverty rate, with 5 household (100.0%) living below poverty.
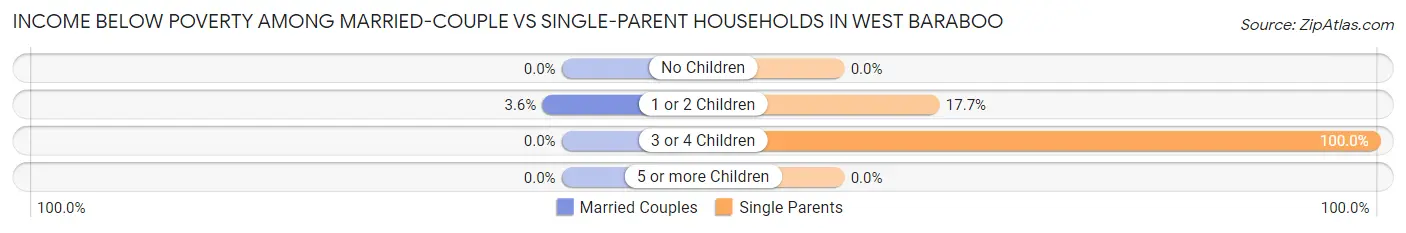
| Children | Married-Couple Families | Single-Parent Households |
| No Children | 0 (0.0%) | 0 (0.0%) |
| 1 or 2 Children | 3 (3.6%) | 22 (17.7%) |
| 3 or 4 Children | 0 (0.0%) | 5 (100.0%) |
| 5 or more Children | 0 (0.0%) | 0 (0.0%) |
| Total | 3 (1.2%) | 27 (15.8%) |
Employment Characteristics in West Baraboo
Employment by Class of Employer in West Baraboo
Among the 916 employed individuals in West Baraboo, private company employees (679 | 74.1%), not-for-profit organizations (60 | 6.6%), and local government employees (53 | 5.8%) make up the most common classes of employment.
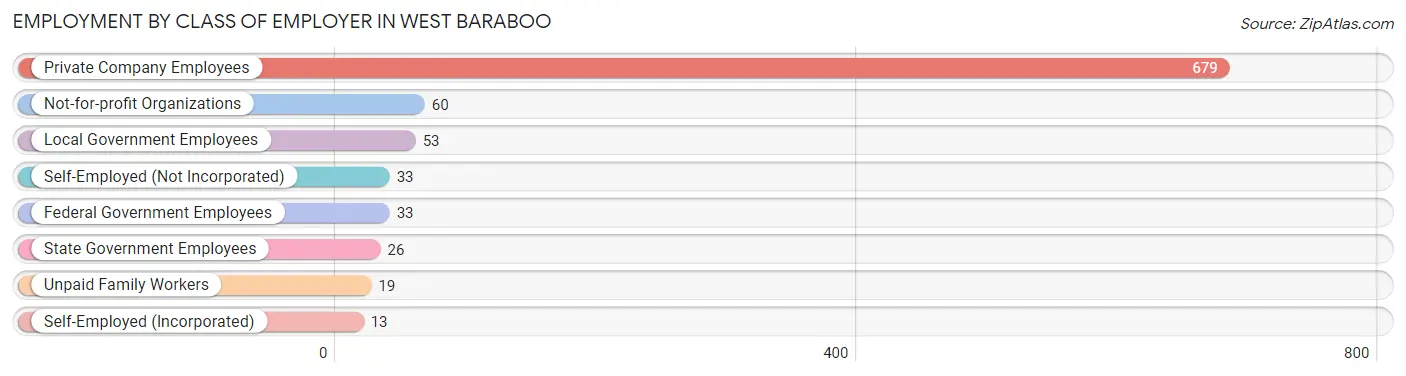
| Employer Class | # Employees | % Employees |
| Private Company Employees | 679 | 74.1% |
| Self-Employed (Incorporated) | 13 | 1.4% |
| Self-Employed (Not Incorporated) | 33 | 3.6% |
| Not-for-profit Organizations | 60 | 6.6% |
| Local Government Employees | 53 | 5.8% |
| State Government Employees | 26 | 2.8% |
| Federal Government Employees | 33 | 3.6% |
| Unpaid Family Workers | 19 | 2.1% |
| Total | 916 | 100.0% |
Employment Status by Age in West Baraboo
According to the labor force statistics for West Baraboo, out of the total population over 16 years of age (1,275), 76.0% or 969 individuals are in the labor force, with 3.8% or 37 of them unemployed. The age group with the highest labor force participation rate is 45 to 54 years, with 92.6% or 189 individuals in the labor force. Within the labor force, the 30 to 34 years age range has the highest percentage of unemployed individuals, with 11.9% or 17 of them being unemployed.
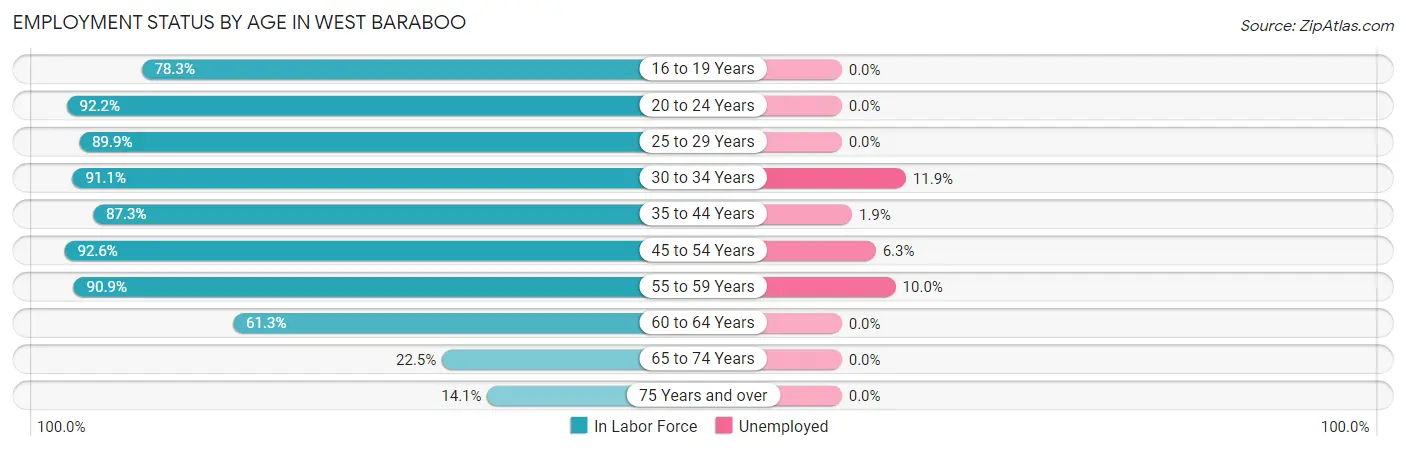
| Age Bracket | In Labor Force | Unemployed |
| 16 to 19 Years | 101 (78.3%) | 0 (0.0%) |
| 20 to 24 Years | 95 (92.2%) | 0 (0.0%) |
| 25 to 29 Years | 89 (89.9%) | 0 (0.0%) |
| 30 to 34 Years | 143 (91.1%) | 17 (11.9%) |
| 35 to 44 Years | 207 (87.3%) | 4 (1.9%) |
| 45 to 54 Years | 189 (92.6%) | 12 (6.3%) |
| 55 to 59 Years | 40 (90.9%) | 4 (10.0%) |
| 60 to 64 Years | 68 (61.3%) | 0 (0.0%) |
| 65 to 74 Years | 27 (22.5%) | 0 (0.0%) |
| 75 Years and over | 10 (14.1%) | 0 (0.0%) |
| Total | 969 (76.0%) | 37 (3.8%) |
Employment Status by Educational Attainment in West Baraboo
According to labor force statistics for West Baraboo, 86.4% of individuals (736) out of the total population between 25 and 64 years of age (852) are in the labor force, with 5.0% or 37 of them being unemployed. The group with the highest labor force participation rate are those with the educational attainment of bachelor's degree or higher, with 98.6% or 206 individuals in the labor force. Within the labor force, individuals with less than high school education have the highest percentage of unemployment, with 18.7% or 14 of them being unemployed.
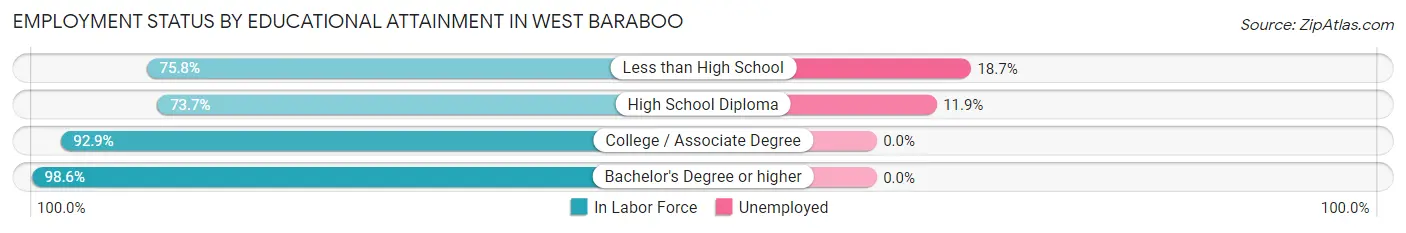
| Educational Attainment | In Labor Force | Unemployed |
| Less than High School | 75 (75.8%) | 19 (18.7%) |
| High School Diploma | 193 (73.7%) | 31 (11.9%) |
| College / Associate Degree | 262 (92.9%) | 0 (0.0%) |
| Bachelor's Degree or higher | 206 (98.6%) | 0 (0.0%) |
| Total | 736 (86.4%) | 43 (5.0%) |
Employment Occupations by Sex in West Baraboo
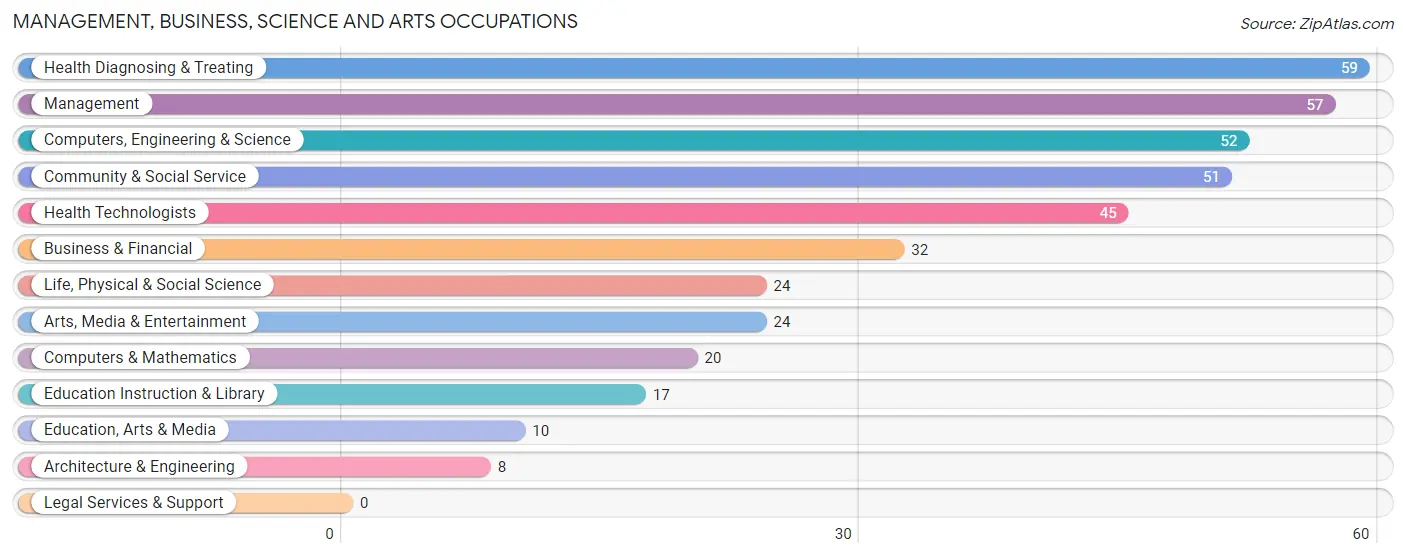
Management, Business, Science and Arts Occupations
The most common Management, Business, Science and Arts occupations in West Baraboo are Health Diagnosing & Treating (59 | 6.3%), Management (57 | 6.1%), Computers, Engineering & Science (52 | 5.6%), Community & Social Service (51 | 5.5%), and Health Technologists (45 | 4.8%).
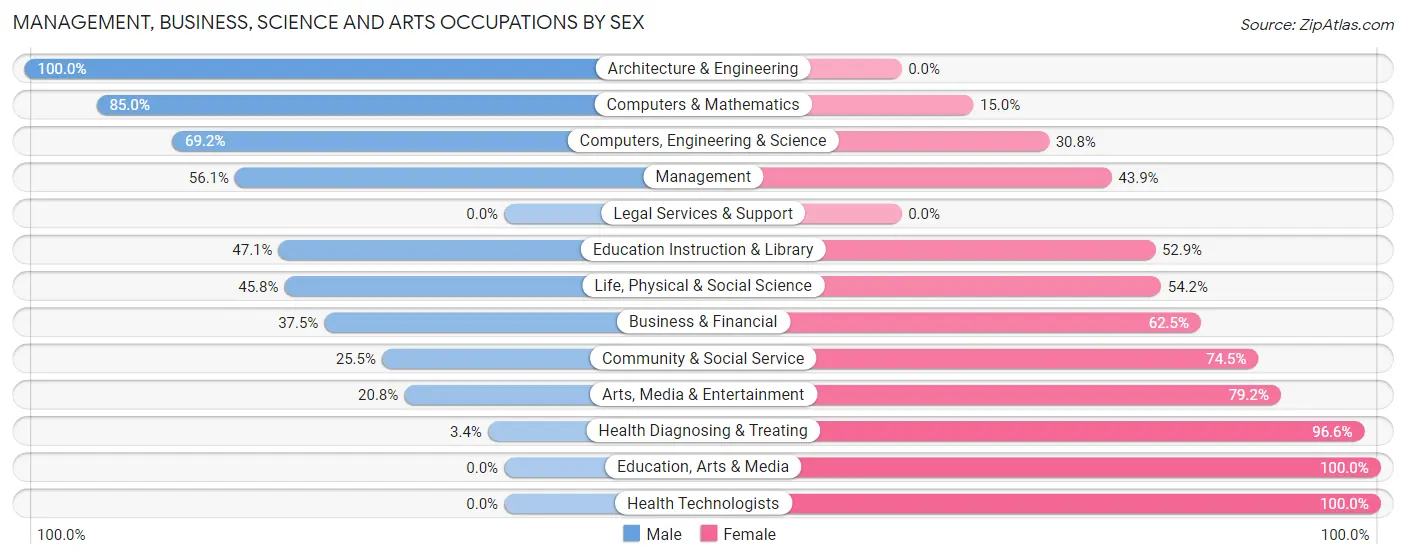
Management, Business, Science and Arts Occupations by Sex
Within the Management, Business, Science and Arts occupations in West Baraboo, the most male-oriented occupations are Architecture & Engineering (100.0%), Computers & Mathematics (85.0%), and Computers, Engineering & Science (69.2%), while the most female-oriented occupations are Education, Arts & Media (100.0%), Health Technologists (100.0%), and Health Diagnosing & Treating (96.6%).
| Occupation | Male | Female |
| Management | 32 (56.1%) | 25 (43.9%) |
| Business & Financial | 12 (37.5%) | 20 (62.5%) |
| Computers, Engineering & Science | 36 (69.2%) | 16 (30.8%) |
| Computers & Mathematics | 17 (85.0%) | 3 (15.0%) |
| Architecture & Engineering | 8 (100.0%) | 0 (0.0%) |
| Life, Physical & Social Science | 11 (45.8%) | 13 (54.2%) |
| Community & Social Service | 13 (25.5%) | 38 (74.5%) |
| Education, Arts & Media | 0 (0.0%) | 10 (100.0%) |
| Legal Services & Support | 0 (0.0%) | 0 (0.0%) |
| Education Instruction & Library | 8 (47.1%) | 9 (52.9%) |
| Arts, Media & Entertainment | 5 (20.8%) | 19 (79.2%) |
| Health Diagnosing & Treating | 2 (3.4%) | 57 (96.6%) |
| Health Technologists | 0 (0.0%) | 45 (100.0%) |
| Total (Category) | 95 (37.9%) | 156 (62.2%) |
| Total (Overall) | 489 (52.5%) | 443 (47.5%) |
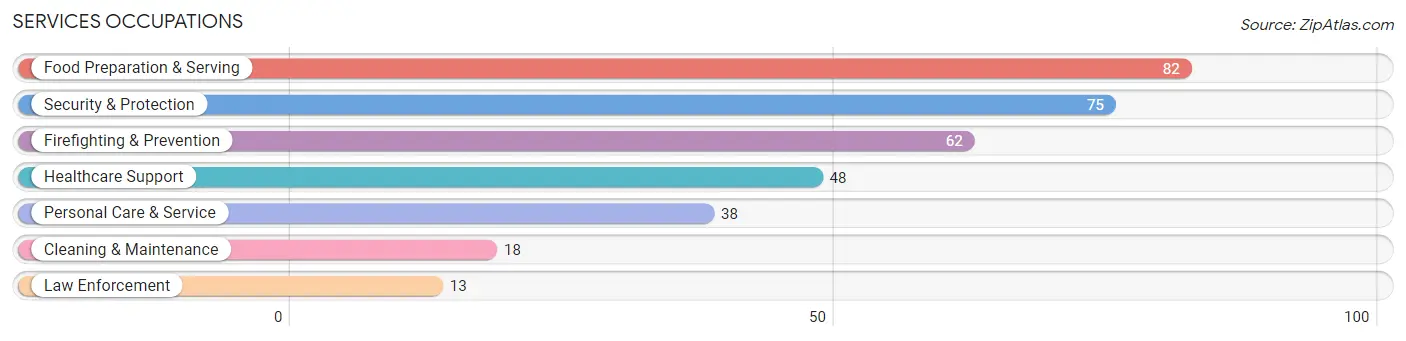
Services Occupations
The most common Services occupations in West Baraboo are Food Preparation & Serving (82 | 8.8%), Security & Protection (75 | 8.1%), Firefighting & Prevention (62 | 6.7%), Healthcare Support (48 | 5.1%), and Personal Care & Service (38 | 4.1%).
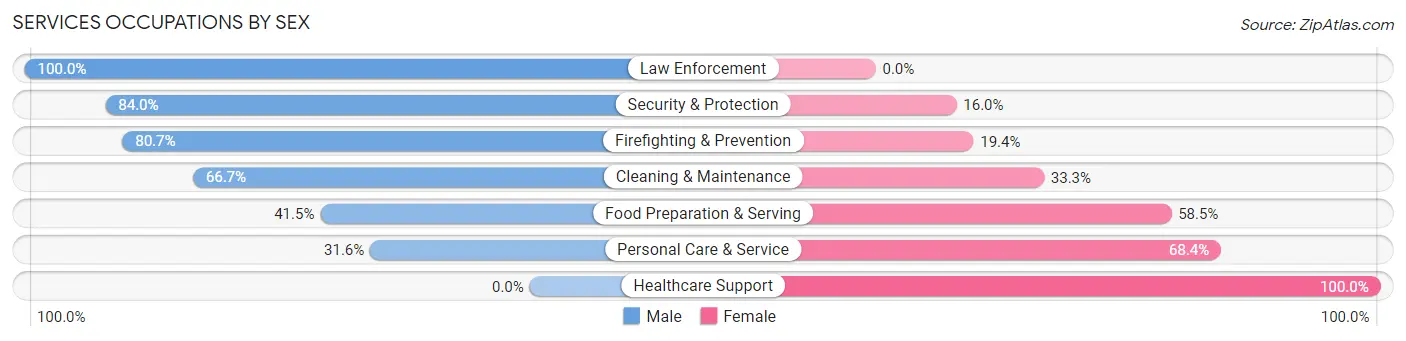
Services Occupations by Sex
Within the Services occupations in West Baraboo, the most male-oriented occupations are Law Enforcement (100.0%), Security & Protection (84.0%), and Firefighting & Prevention (80.6%), while the most female-oriented occupations are Healthcare Support (100.0%), Personal Care & Service (68.4%), and Food Preparation & Serving (58.5%).
| Occupation | Male | Female |
| Healthcare Support | 0 (0.0%) | 48 (100.0%) |
| Security & Protection | 63 (84.0%) | 12 (16.0%) |
| Firefighting & Prevention | 50 (80.6%) | 12 (19.4%) |
| Law Enforcement | 13 (100.0%) | 0 (0.0%) |
| Food Preparation & Serving | 34 (41.5%) | 48 (58.5%) |
| Cleaning & Maintenance | 12 (66.7%) | 6 (33.3%) |
| Personal Care & Service | 12 (31.6%) | 26 (68.4%) |
| Total (Category) | 121 (46.4%) | 140 (53.6%) |
| Total (Overall) | 489 (52.5%) | 443 (47.5%) |
Sales and Office Occupations
The most common Sales and Office occupations in West Baraboo are Sales & Related (91 | 9.8%), and Office & Administration (75 | 8.1%).
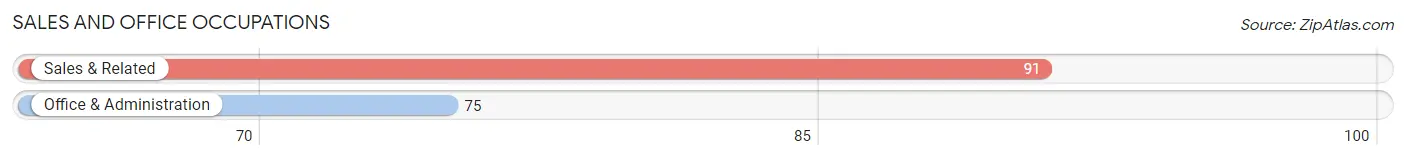
Sales and Office Occupations by Sex
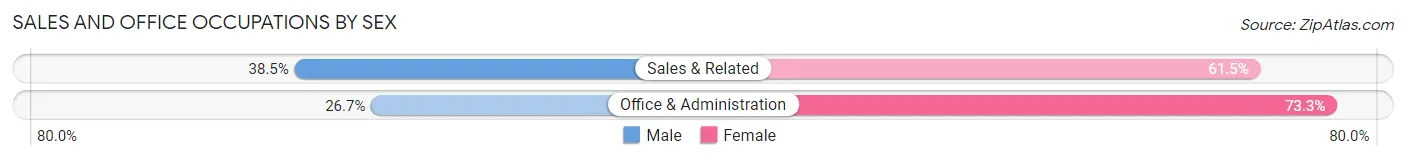
| Occupation | Male | Female |
| Sales & Related | 35 (38.5%) | 56 (61.5%) |
| Office & Administration | 20 (26.7%) | 55 (73.3%) |
| Total (Category) | 55 (33.1%) | 111 (66.9%) |
| Total (Overall) | 489 (52.5%) | 443 (47.5%) |
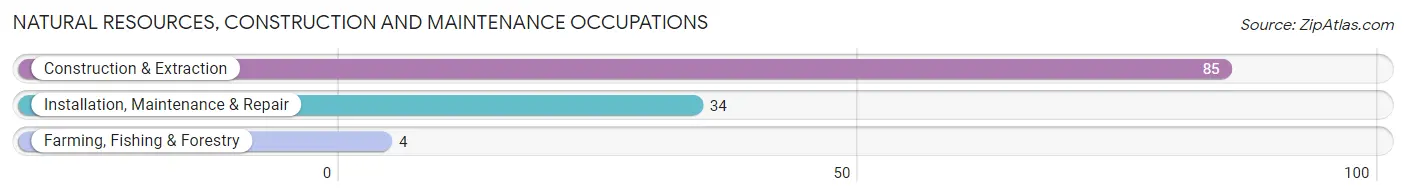
Natural Resources, Construction and Maintenance Occupations
The most common Natural Resources, Construction and Maintenance occupations in West Baraboo are Construction & Extraction (85 | 9.1%), Installation, Maintenance & Repair (34 | 3.6%), and Farming, Fishing & Forestry (4 | 0.4%).
Natural Resources, Construction and Maintenance Occupations by Sex
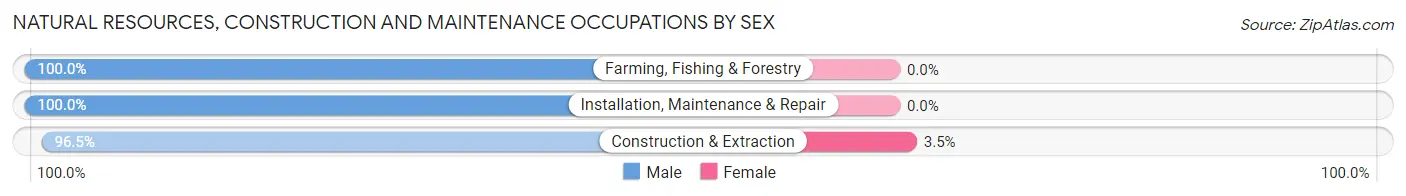
| Occupation | Male | Female |
| Farming, Fishing & Forestry | 4 (100.0%) | 0 (0.0%) |
| Construction & Extraction | 82 (96.5%) | 3 (3.5%) |
| Installation, Maintenance & Repair | 34 (100.0%) | 0 (0.0%) |
| Total (Category) | 120 (97.6%) | 3 (2.4%) |
| Total (Overall) | 489 (52.5%) | 443 (47.5%) |
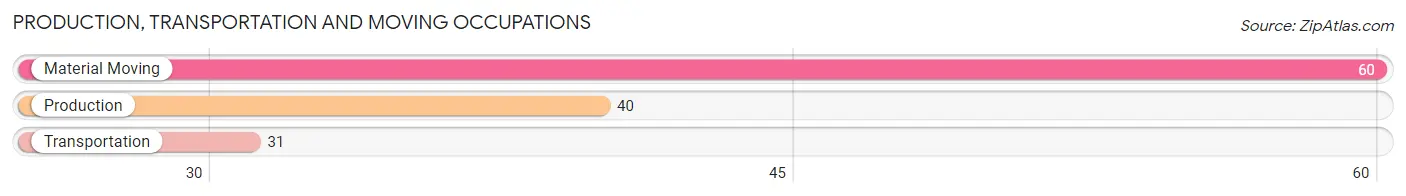
Production, Transportation and Moving Occupations
The most common Production, Transportation and Moving occupations in West Baraboo are Material Moving (60 | 6.4%), Production (40 | 4.3%), and Transportation (31 | 3.3%).
Production, Transportation and Moving Occupations by Sex
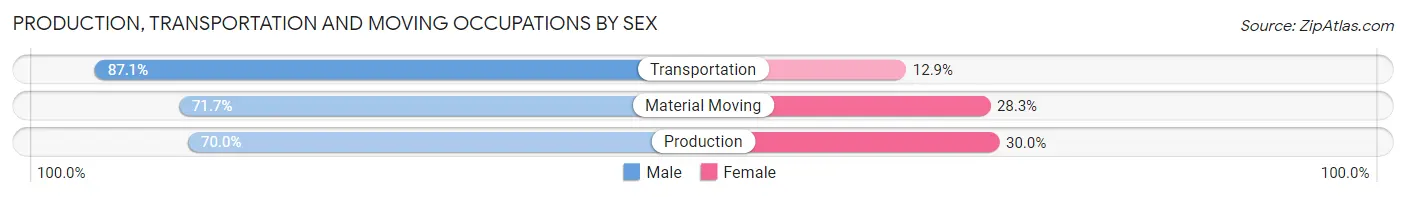
| Occupation | Male | Female |
| Production | 28 (70.0%) | 12 (30.0%) |
| Transportation | 27 (87.1%) | 4 (12.9%) |
| Material Moving | 43 (71.7%) | 17 (28.3%) |
| Total (Category) | 98 (74.8%) | 33 (25.2%) |
| Total (Overall) | 489 (52.5%) | 443 (47.5%) |
Employment Industries by Sex in West Baraboo
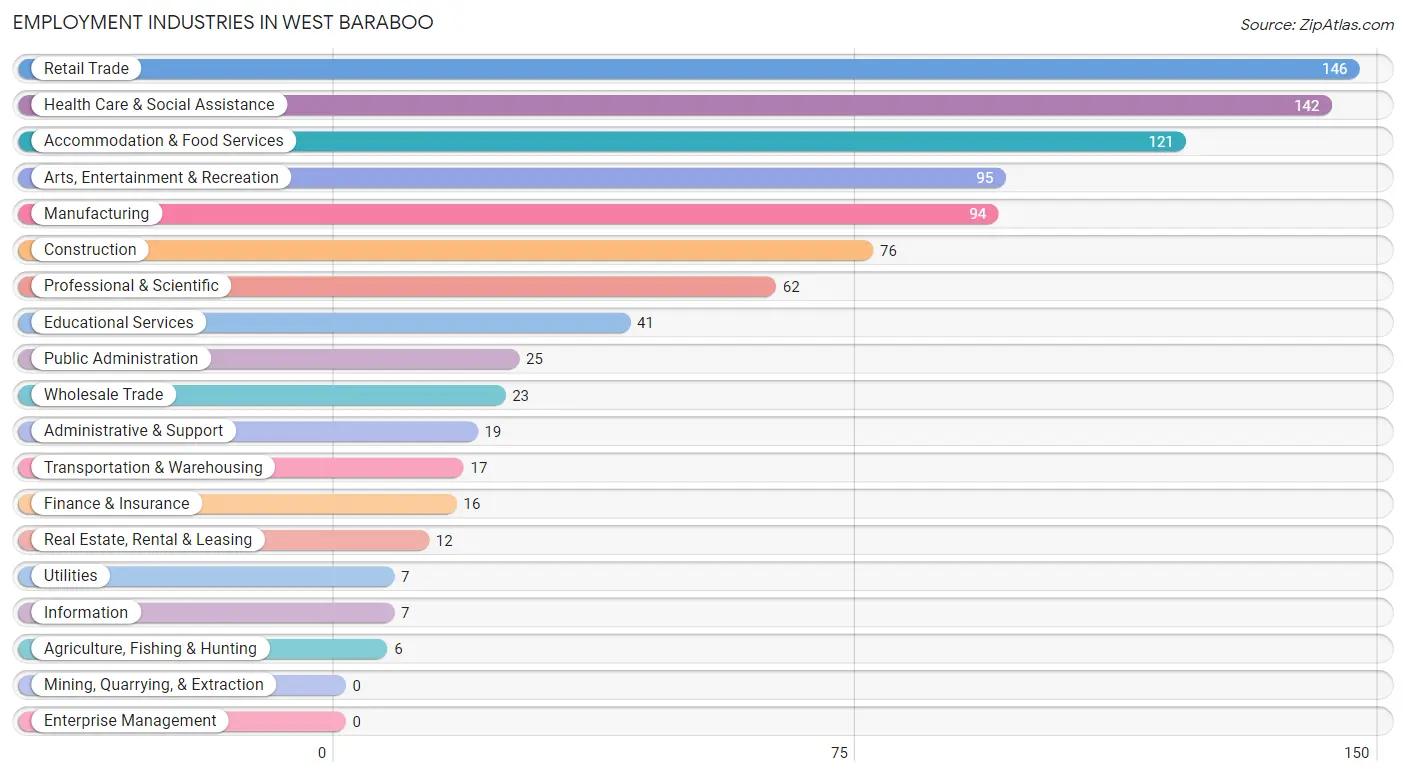
Employment Industries in West Baraboo
The major employment industries in West Baraboo include Retail Trade (146 | 15.7%), Health Care & Social Assistance (142 | 15.2%), Accommodation & Food Services (121 | 13.0%), Arts, Entertainment & Recreation (95 | 10.2%), and Manufacturing (94 | 10.1%).
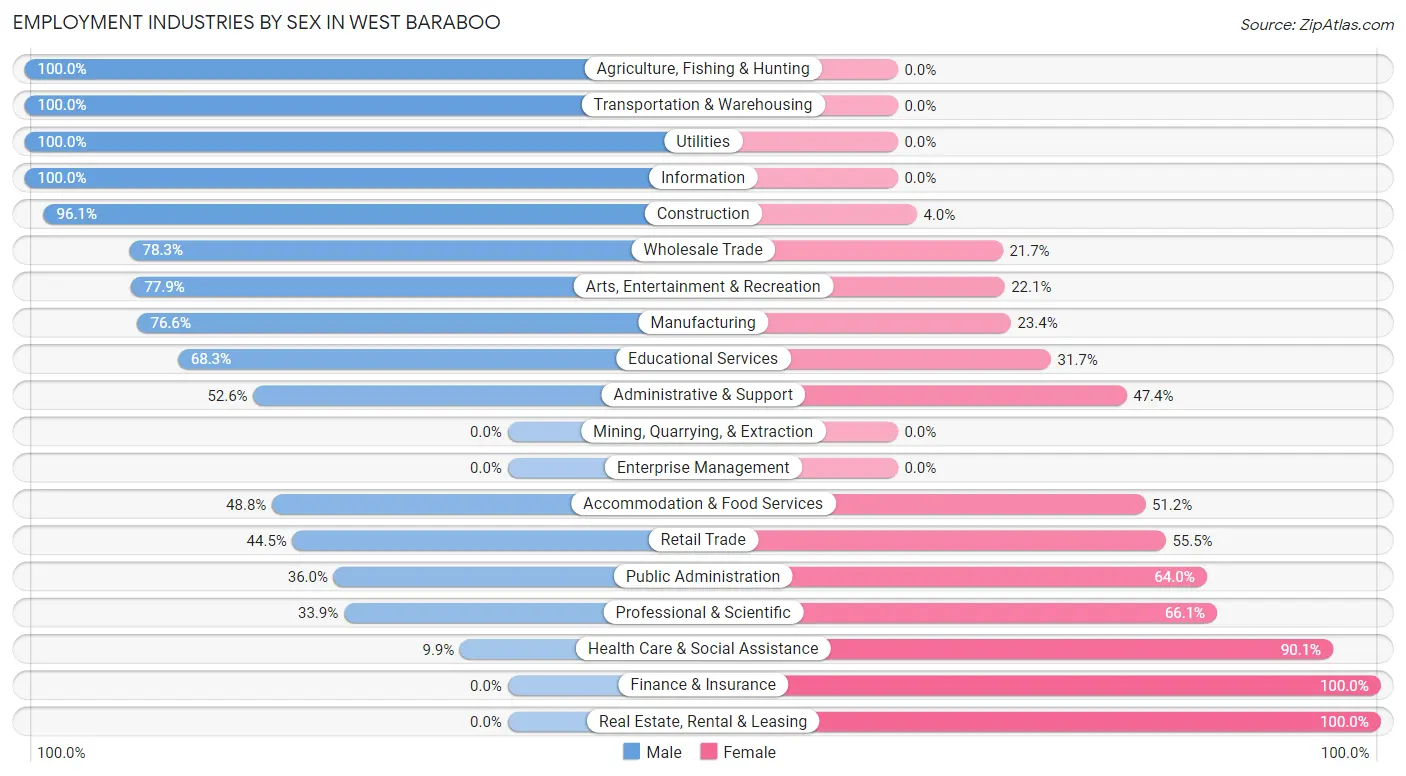
Employment Industries by Sex in West Baraboo
The West Baraboo industries that see more men than women are Agriculture, Fishing & Hunting (100.0%), Transportation & Warehousing (100.0%), and Utilities (100.0%), whereas the industries that tend to have a higher number of women are Finance & Insurance (100.0%), Real Estate, Rental & Leasing (100.0%), and Health Care & Social Assistance (90.1%).
| Industry | Male | Female |
| Agriculture, Fishing & Hunting | 6 (100.0%) | 0 (0.0%) |
| Mining, Quarrying, & Extraction | 0 (0.0%) | 0 (0.0%) |
| Construction | 73 (96.1%) | 3 (4.0%) |
| Manufacturing | 72 (76.6%) | 22 (23.4%) |
| Wholesale Trade | 18 (78.3%) | 5 (21.7%) |
| Retail Trade | 65 (44.5%) | 81 (55.5%) |
| Transportation & Warehousing | 17 (100.0%) | 0 (0.0%) |
| Utilities | 7 (100.0%) | 0 (0.0%) |
| Information | 7 (100.0%) | 0 (0.0%) |
| Finance & Insurance | 0 (0.0%) | 16 (100.0%) |
| Real Estate, Rental & Leasing | 0 (0.0%) | 12 (100.0%) |
| Professional & Scientific | 21 (33.9%) | 41 (66.1%) |
| Enterprise Management | 0 (0.0%) | 0 (0.0%) |
| Administrative & Support | 10 (52.6%) | 9 (47.4%) |
| Educational Services | 28 (68.3%) | 13 (31.7%) |
| Health Care & Social Assistance | 14 (9.9%) | 128 (90.1%) |
| Arts, Entertainment & Recreation | 74 (77.9%) | 21 (22.1%) |
| Accommodation & Food Services | 59 (48.8%) | 62 (51.2%) |
| Public Administration | 9 (36.0%) | 16 (64.0%) |
| Total | 489 (52.5%) | 443 (47.5%) |
Education in West Baraboo
School Enrollment in West Baraboo
The most common levels of schooling among the 331 students in West Baraboo are middle school (90 | 27.2%), elementary school (87 | 26.3%), and high school (56 | 16.9%).
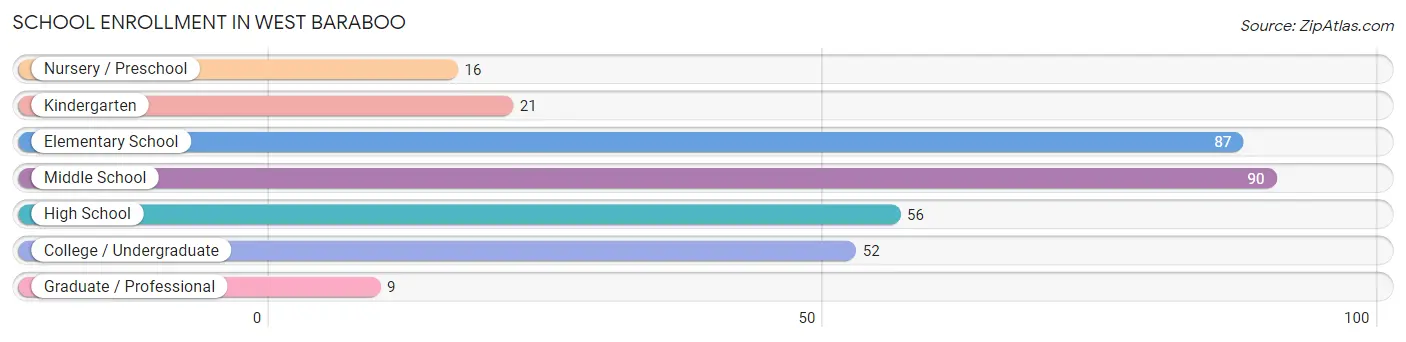
| School Level | # Students | % Students |
| Nursery / Preschool | 16 | 4.8% |
| Kindergarten | 21 | 6.3% |
| Elementary School | 87 | 26.3% |
| Middle School | 90 | 27.2% |
| High School | 56 | 16.9% |
| College / Undergraduate | 52 | 15.7% |
| Graduate / Professional | 9 | 2.7% |
| Total | 331 | 100.0% |
School Enrollment by Age by Funding Source in West Baraboo
Out of a total of 331 students who are enrolled in schools in West Baraboo, 25 (7.6%) attend a private institution, while the remaining 306 (92.4%) are enrolled in public schools. The age group of 20 to 24 year olds has the highest likelihood of being enrolled in private schools, with 8 (34.8% in the age bracket) enrolled. Conversely, the age group of 3 to 4 year olds has the lowest likelihood of being enrolled in a private school, with 21 (100.0% in the age bracket) attending a public institution.
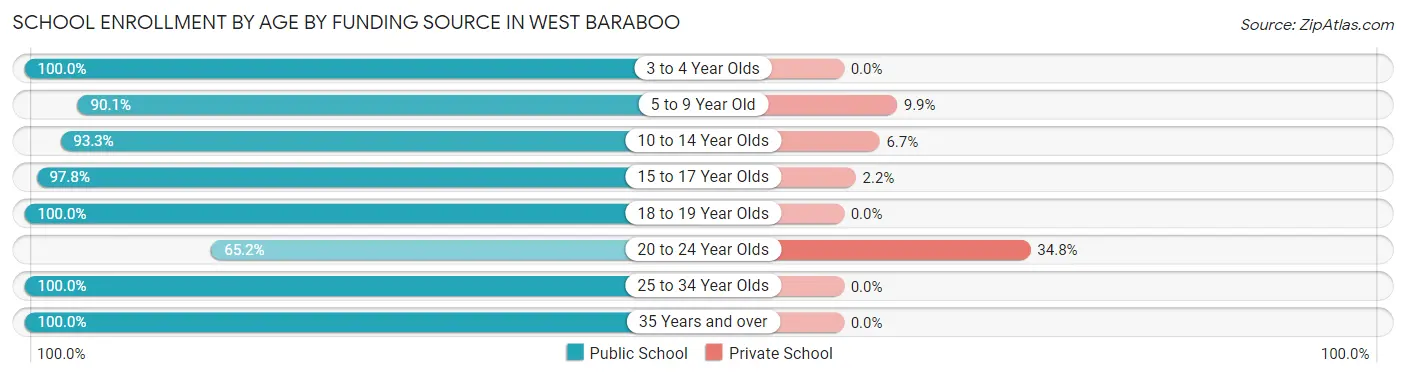
| Age Bracket | Public School | Private School |
| 3 to 4 Year Olds | 21 (100.0%) | 0 (0.0%) |
| 5 to 9 Year Old | 82 (90.1%) | 9 (9.9%) |
| 10 to 14 Year Olds | 98 (93.3%) | 7 (6.7%) |
| 15 to 17 Year Olds | 44 (97.8%) | 1 (2.2%) |
| 18 to 19 Year Olds | 25 (100.0%) | 0 (0.0%) |
| 20 to 24 Year Olds | 15 (65.2%) | 8 (34.8%) |
| 25 to 34 Year Olds | 11 (100.0%) | 0 (0.0%) |
| 35 Years and over | 10 (100.0%) | 0 (0.0%) |
| Total | 306 (92.4%) | 25 (7.6%) |
Educational Attainment by Field of Study in West Baraboo
Science & technology (55 | 20.4%), physical & health sciences (28 | 10.4%), engineering (26 | 9.7%), business (25 | 9.3%), and education (25 | 9.3%) are the most common fields of study among 269 individuals in West Baraboo who have obtained a bachelor's degree or higher.
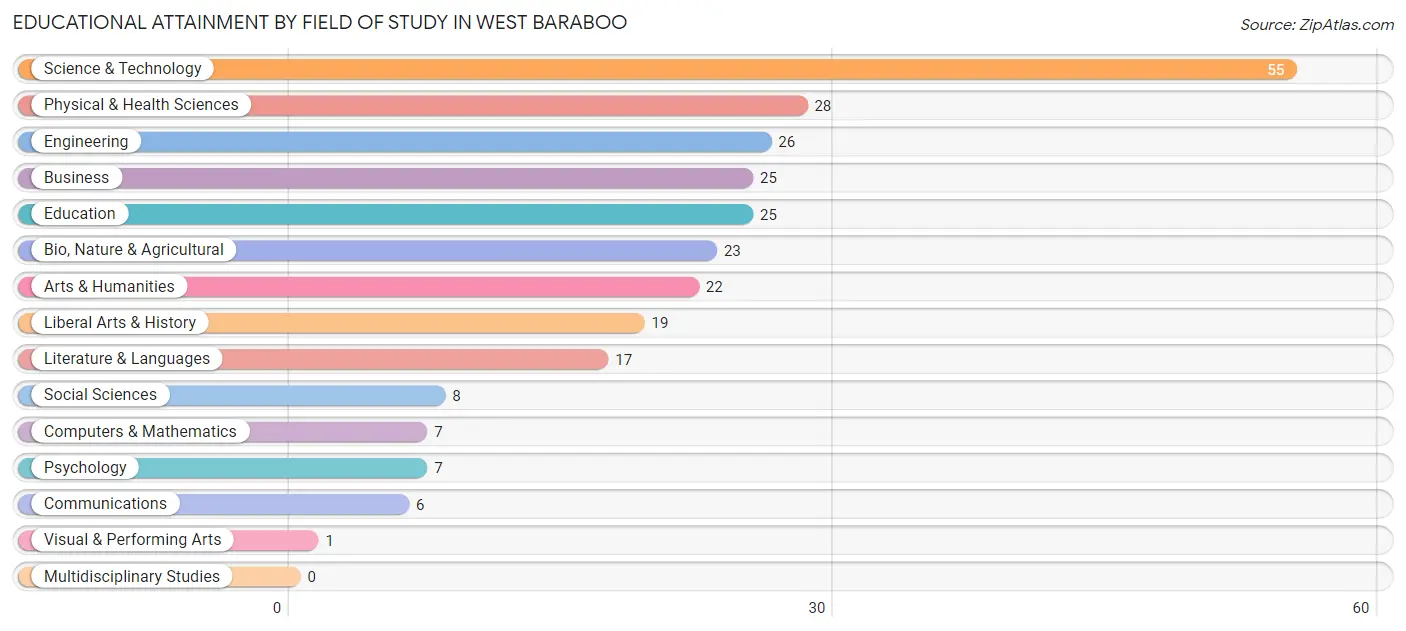
| Field of Study | # Graduates | % Graduates |
| Computers & Mathematics | 7 | 2.6% |
| Bio, Nature & Agricultural | 23 | 8.6% |
| Physical & Health Sciences | 28 | 10.4% |
| Psychology | 7 | 2.6% |
| Social Sciences | 8 | 3.0% |
| Engineering | 26 | 9.7% |
| Multidisciplinary Studies | 0 | 0.0% |
| Science & Technology | 55 | 20.4% |
| Business | 25 | 9.3% |
| Education | 25 | 9.3% |
| Literature & Languages | 17 | 6.3% |
| Liberal Arts & History | 19 | 7.1% |
| Visual & Performing Arts | 1 | 0.4% |
| Communications | 6 | 2.2% |
| Arts & Humanities | 22 | 8.2% |
| Total | 269 | 100.0% |
Transportation & Commute in West Baraboo
Vehicle Availability by Sex in West Baraboo
The most prevalent vehicle ownership categories in West Baraboo are males with 2 vehicles (212, accounting for 44.5%) and females with 2 vehicles (170, making up 48.2%).
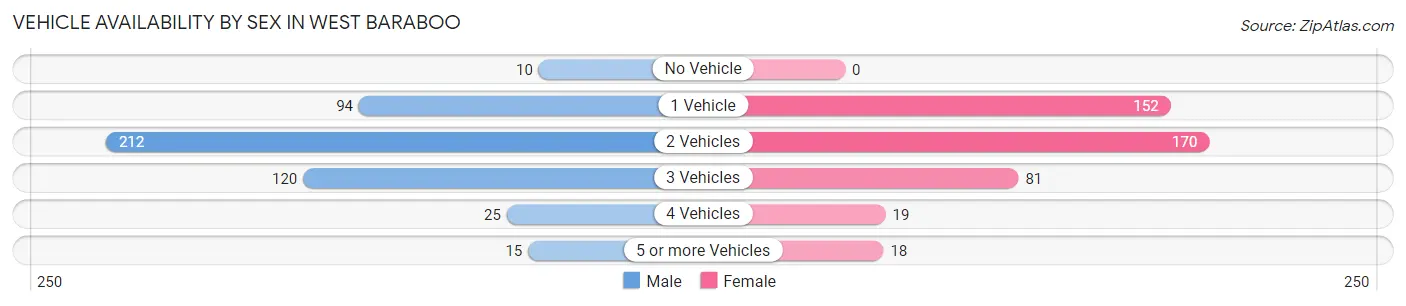
| Vehicles Available | Male | Female |
| No Vehicle | 10 (2.1%) | 0 (0.0%) |
| 1 Vehicle | 94 (19.8%) | 152 (34.5%) |
| 2 Vehicles | 212 (44.5%) | 170 (38.6%) |
| 3 Vehicles | 120 (25.2%) | 81 (18.4%) |
| 4 Vehicles | 25 (5.2%) | 19 (4.3%) |
| 5 or more Vehicles | 15 (3.2%) | 18 (4.1%) |
| Total | 476 (100.0%) | 440 (100.0%) |
Commute Time in West Baraboo
The most frequently occuring commute durations in West Baraboo are 5 to 9 minutes (221 commuters, 25.4%), 45 to 59 minutes (169 commuters, 19.4%), and 10 to 14 minutes (136 commuters, 15.6%).
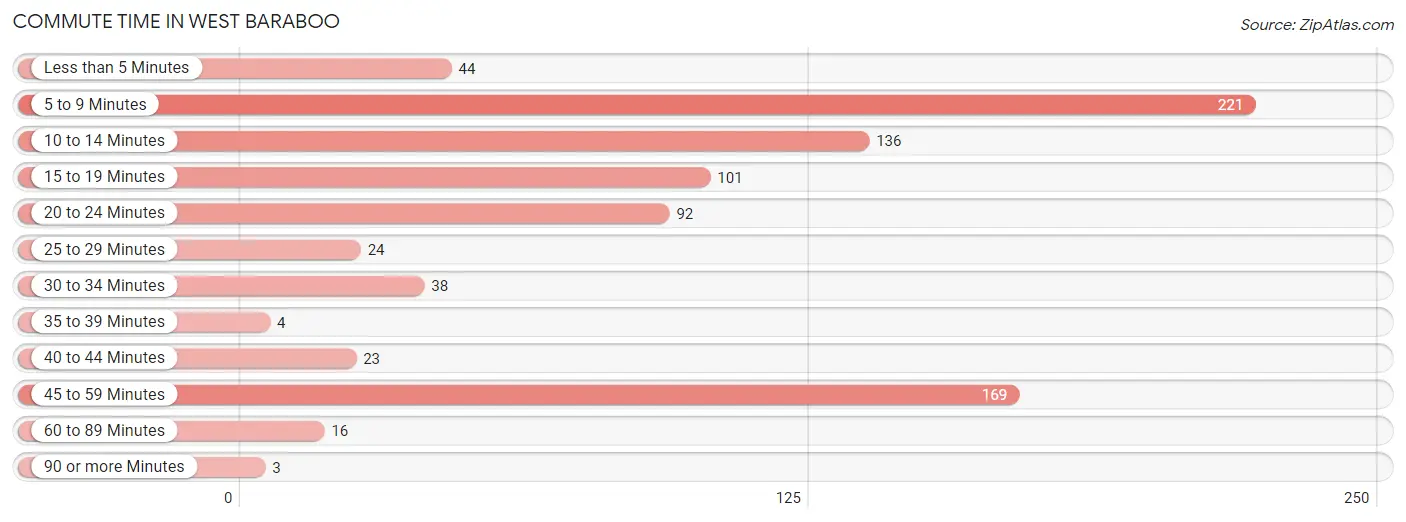
| Commute Time | # Commuters | % Commuters |
| Less than 5 Minutes | 44 | 5.1% |
| 5 to 9 Minutes | 221 | 25.4% |
| 10 to 14 Minutes | 136 | 15.6% |
| 15 to 19 Minutes | 101 | 11.6% |
| 20 to 24 Minutes | 92 | 10.6% |
| 25 to 29 Minutes | 24 | 2.8% |
| 30 to 34 Minutes | 38 | 4.4% |
| 35 to 39 Minutes | 4 | 0.5% |
| 40 to 44 Minutes | 23 | 2.6% |
| 45 to 59 Minutes | 169 | 19.4% |
| 60 to 89 Minutes | 16 | 1.8% |
| 90 or more Minutes | 3 | 0.3% |
Commute Time by Sex in West Baraboo
The most common commute times in West Baraboo are 45 to 59 minutes (118 commuters, 25.0%) for males and 5 to 9 minutes (116 commuters, 29.1%) for females.
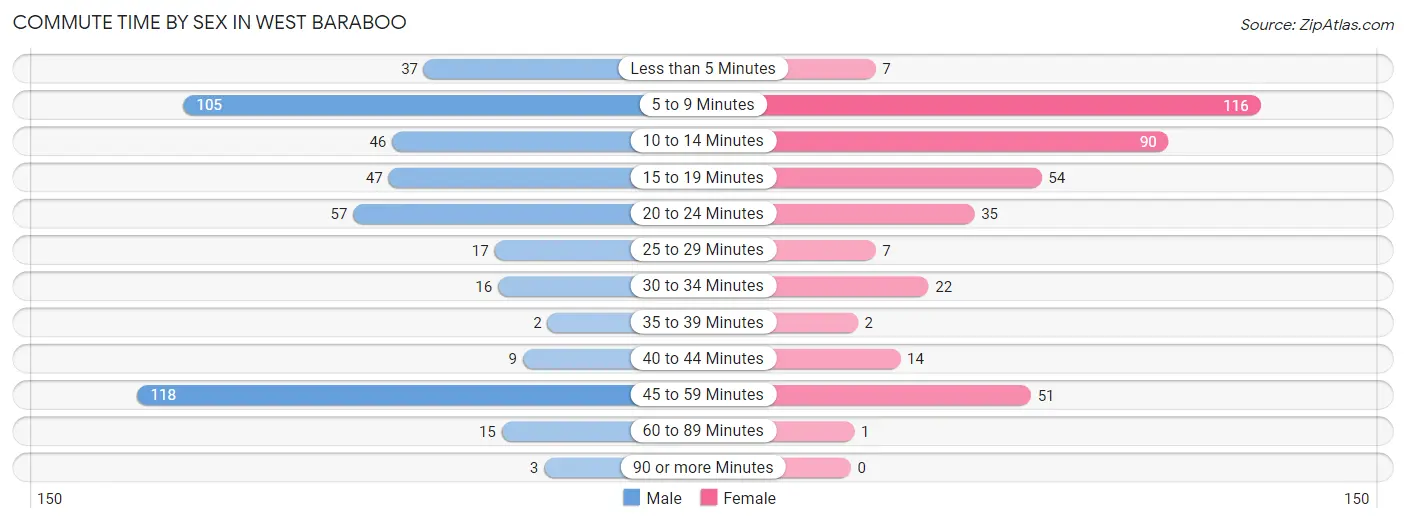
| Commute Time | Male | Female |
| Less than 5 Minutes | 37 (7.8%) | 7 (1.8%) |
| 5 to 9 Minutes | 105 (22.3%) | 116 (29.1%) |
| 10 to 14 Minutes | 46 (9.8%) | 90 (22.6%) |
| 15 to 19 Minutes | 47 (10.0%) | 54 (13.5%) |
| 20 to 24 Minutes | 57 (12.1%) | 35 (8.8%) |
| 25 to 29 Minutes | 17 (3.6%) | 7 (1.8%) |
| 30 to 34 Minutes | 16 (3.4%) | 22 (5.5%) |
| 35 to 39 Minutes | 2 (0.4%) | 2 (0.5%) |
| 40 to 44 Minutes | 9 (1.9%) | 14 (3.5%) |
| 45 to 59 Minutes | 118 (25.0%) | 51 (12.8%) |
| 60 to 89 Minutes | 15 (3.2%) | 1 (0.3%) |
| 90 or more Minutes | 3 (0.6%) | 0 (0.0%) |
Time of Departure to Work by Sex in West Baraboo
The most frequent times of departure to work in West Baraboo are 6:00 AM to 6:29 AM (97, 20.5%) for males and 7:00 AM to 7:29 AM (77, 19.3%) for females.
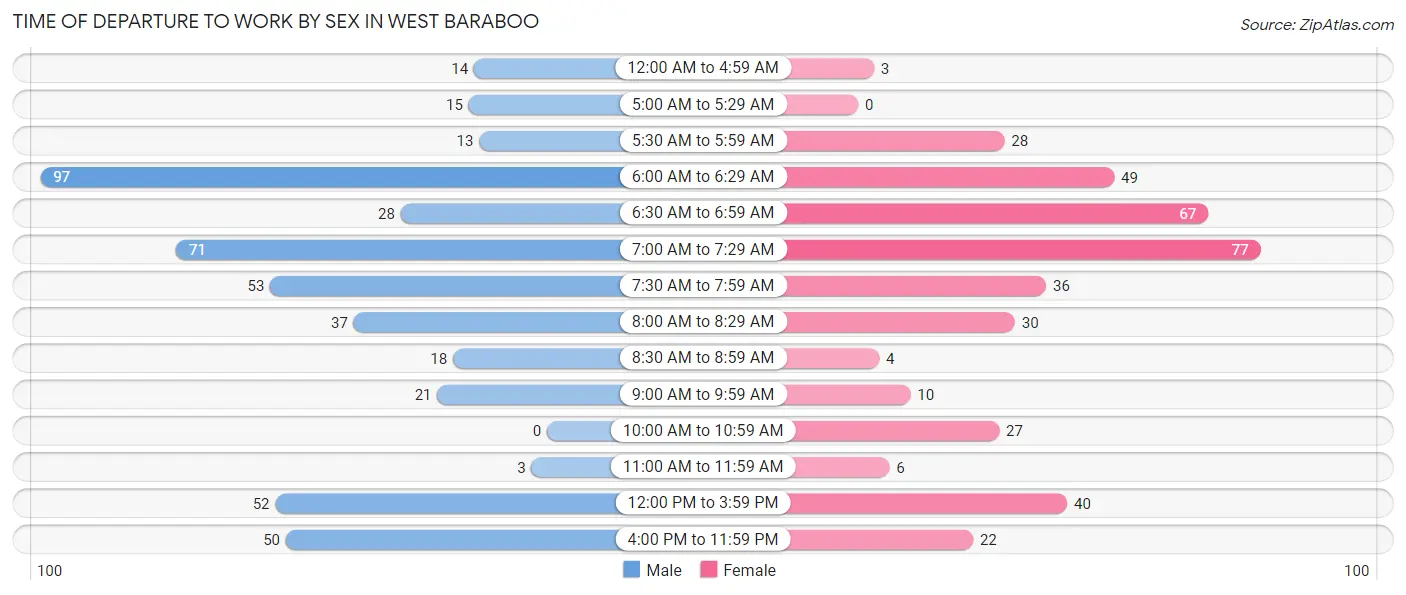
| Time of Departure | Male | Female |
| 12:00 AM to 4:59 AM | 14 (3.0%) | 3 (0.7%) |
| 5:00 AM to 5:29 AM | 15 (3.2%) | 0 (0.0%) |
| 5:30 AM to 5:59 AM | 13 (2.8%) | 28 (7.0%) |
| 6:00 AM to 6:29 AM | 97 (20.5%) | 49 (12.3%) |
| 6:30 AM to 6:59 AM | 28 (5.9%) | 67 (16.8%) |
| 7:00 AM to 7:29 AM | 71 (15.0%) | 77 (19.3%) |
| 7:30 AM to 7:59 AM | 53 (11.2%) | 36 (9.0%) |
| 8:00 AM to 8:29 AM | 37 (7.8%) | 30 (7.5%) |
| 8:30 AM to 8:59 AM | 18 (3.8%) | 4 (1.0%) |
| 9:00 AM to 9:59 AM | 21 (4.4%) | 10 (2.5%) |
| 10:00 AM to 10:59 AM | 0 (0.0%) | 27 (6.8%) |
| 11:00 AM to 11:59 AM | 3 (0.6%) | 6 (1.5%) |
| 12:00 PM to 3:59 PM | 52 (11.0%) | 40 (10.0%) |
| 4:00 PM to 11:59 PM | 50 (10.6%) | 22 (5.5%) |
| Total | 472 (100.0%) | 399 (100.0%) |
Housing Occupancy in West Baraboo
Occupancy by Ownership in West Baraboo
Of the total 722 dwellings in West Baraboo, owner-occupied units account for 335 (46.4%), while renter-occupied units make up 387 (53.6%).
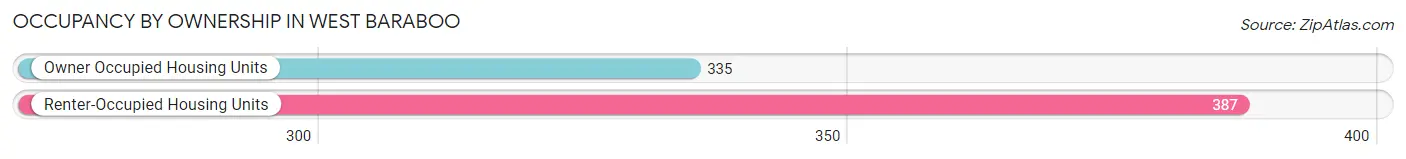
| Occupancy | # Housing Units | % Housing Units |
| Owner Occupied Housing Units | 335 | 46.4% |
| Renter-Occupied Housing Units | 387 | 53.6% |
| Total Occupied Housing Units | 722 | 100.0% |
Occupancy by Household Size in West Baraboo
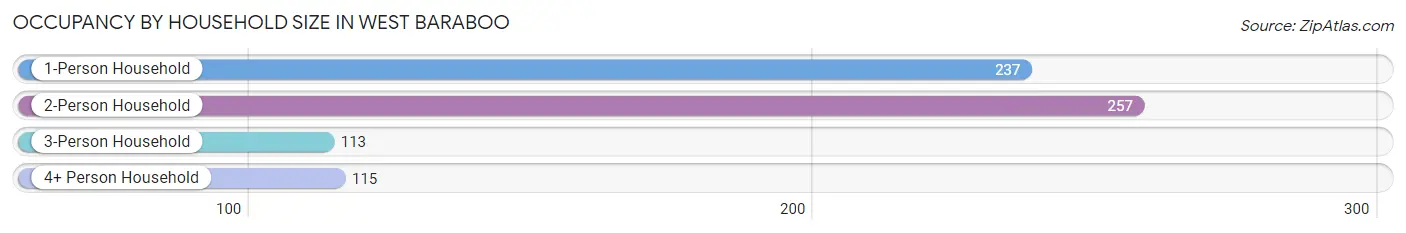
| Household Size | # Housing Units | % Housing Units |
| 1-Person Household | 237 | 32.8% |
| 2-Person Household | 257 | 35.6% |
| 3-Person Household | 113 | 15.7% |
| 4+ Person Household | 115 | 15.9% |
| Total Housing Units | 722 | 100.0% |
Occupancy by Ownership by Household Size in West Baraboo
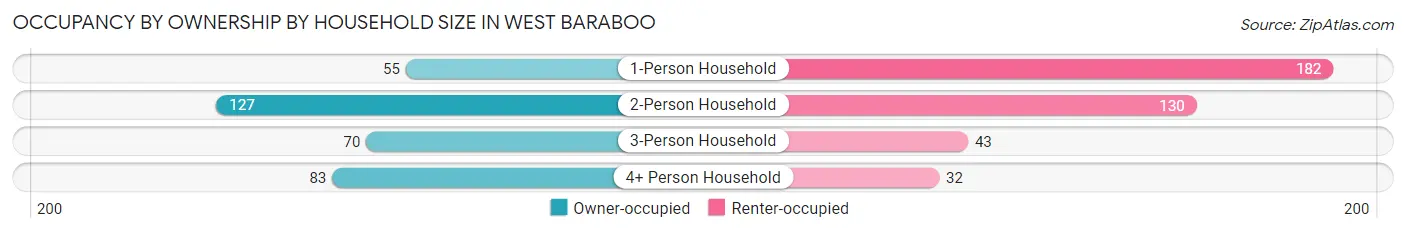
| Household Size | Owner-occupied | Renter-occupied |
| 1-Person Household | 55 (23.2%) | 182 (76.8%) |
| 2-Person Household | 127 (49.4%) | 130 (50.6%) |
| 3-Person Household | 70 (62.0%) | 43 (38.1%) |
| 4+ Person Household | 83 (72.2%) | 32 (27.8%) |
| Total Housing Units | 335 (46.4%) | 387 (53.6%) |
Occupancy by Educational Attainment in West Baraboo
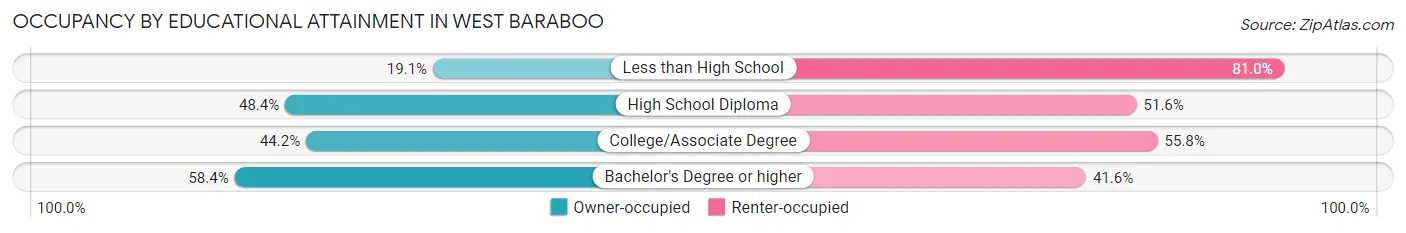
| Household Size | Owner-occupied | Renter-occupied |
| Less than High School | 12 (19.1%) | 51 (80.9%) |
| High School Diploma | 103 (48.4%) | 110 (51.6%) |
| College/Associate Degree | 126 (44.2%) | 159 (55.8%) |
| Bachelor's Degree or higher | 94 (58.4%) | 67 (41.6%) |
Occupancy by Age of Householder in West Baraboo
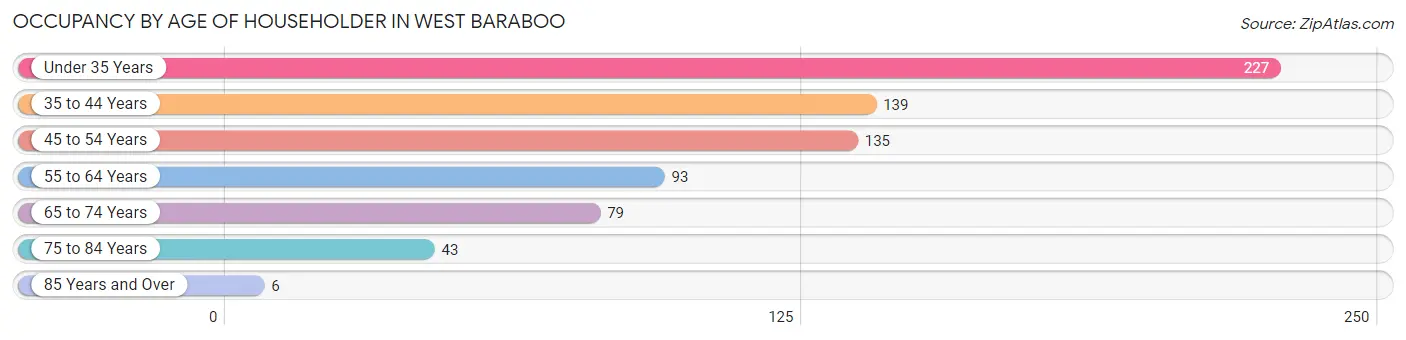
| Age Bracket | # Households | % Households |
| Under 35 Years | 227 | 31.4% |
| 35 to 44 Years | 139 | 19.3% |
| 45 to 54 Years | 135 | 18.7% |
| 55 to 64 Years | 93 | 12.9% |
| 65 to 74 Years | 79 | 10.9% |
| 75 to 84 Years | 43 | 6.0% |
| 85 Years and Over | 6 | 0.8% |
| Total | 722 | 100.0% |
Housing Finances in West Baraboo
Median Income by Occupancy in West Baraboo
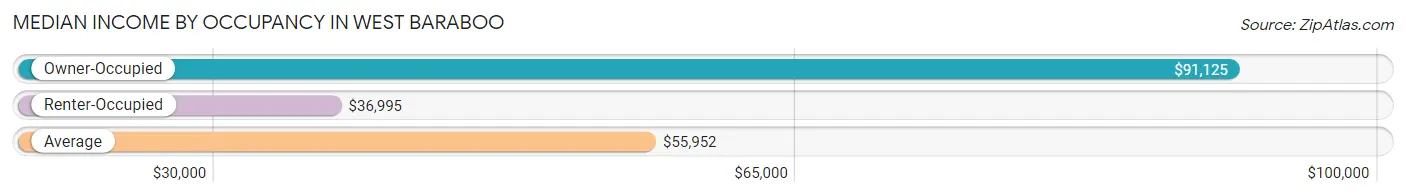
| Occupancy Type | # Households | Median Income |
| Owner-Occupied | 335 (46.4%) | $91,125 |
| Renter-Occupied | 387 (53.6%) | $36,995 |
| Average | 722 (100.0%) | $55,952 |
Occupancy by Householder Income Bracket in West Baraboo
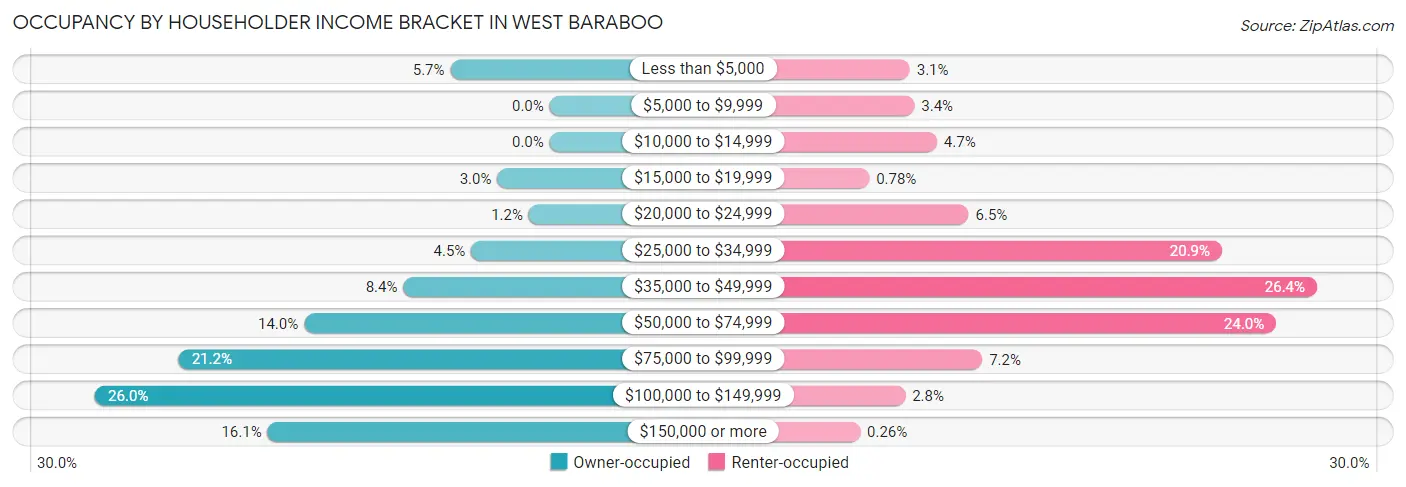
| Income Bracket | Owner-occupied | Renter-occupied |
| Less than $5,000 | 19 (5.7%) | 12 (3.1%) |
| $5,000 to $9,999 | 0 (0.0%) | 13 (3.4%) |
| $10,000 to $14,999 | 0 (0.0%) | 18 (4.6%) |
| $15,000 to $19,999 | 10 (3.0%) | 3 (0.8%) |
| $20,000 to $24,999 | 4 (1.2%) | 25 (6.5%) |
| $25,000 to $34,999 | 15 (4.5%) | 81 (20.9%) |
| $35,000 to $49,999 | 28 (8.4%) | 102 (26.4%) |
| $50,000 to $74,999 | 47 (14.0%) | 93 (24.0%) |
| $75,000 to $99,999 | 71 (21.2%) | 28 (7.2%) |
| $100,000 to $149,999 | 87 (26.0%) | 11 (2.8%) |
| $150,000 or more | 54 (16.1%) | 1 (0.3%) |
| Total | 335 (100.0%) | 387 (100.0%) |
Monthly Housing Cost Tiers in West Baraboo
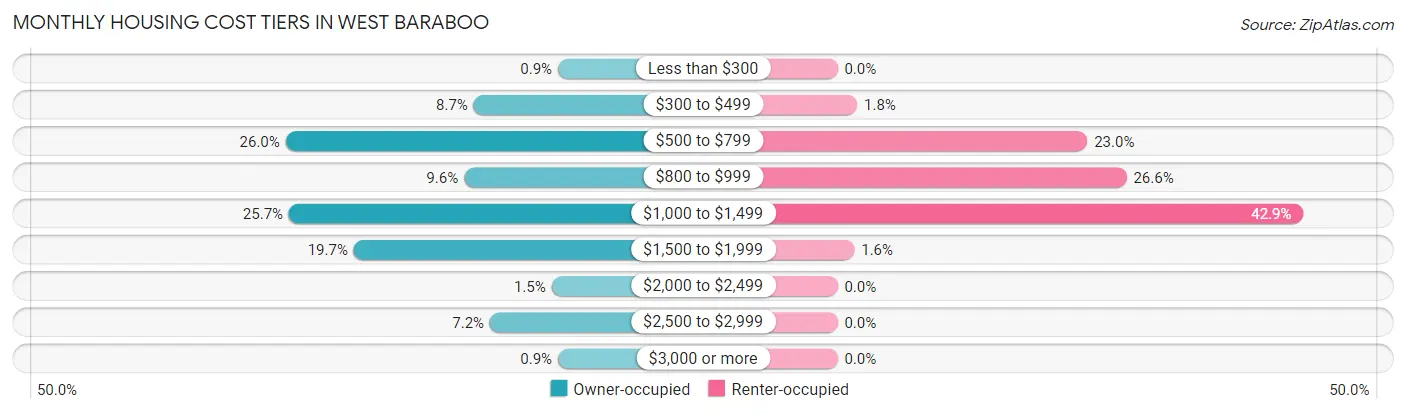
| Monthly Cost | Owner-occupied | Renter-occupied |
| Less than $300 | 3 (0.9%) | 0 (0.0%) |
| $300 to $499 | 29 (8.7%) | 7 (1.8%) |
| $500 to $799 | 87 (26.0%) | 89 (23.0%) |
| $800 to $999 | 32 (9.6%) | 103 (26.6%) |
| $1,000 to $1,499 | 86 (25.7%) | 166 (42.9%) |
| $1,500 to $1,999 | 66 (19.7%) | 6 (1.5%) |
| $2,000 to $2,499 | 5 (1.5%) | 0 (0.0%) |
| $2,500 to $2,999 | 24 (7.2%) | 0 (0.0%) |
| $3,000 or more | 3 (0.9%) | 0 (0.0%) |
| Total | 335 (100.0%) | 387 (100.0%) |
Physical Housing Characteristics in West Baraboo
Housing Structures in West Baraboo
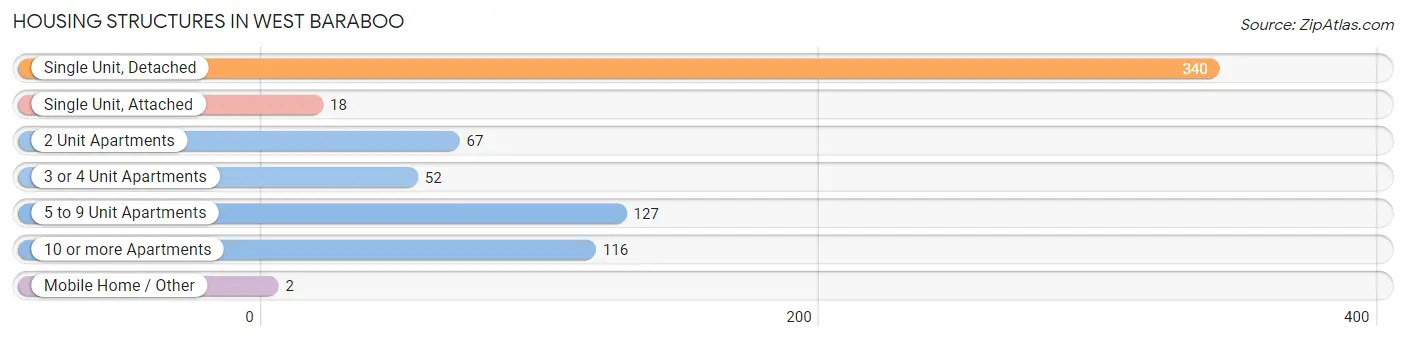
| Structure Type | # Housing Units | % Housing Units |
| Single Unit, Detached | 340 | 47.1% |
| Single Unit, Attached | 18 | 2.5% |
| 2 Unit Apartments | 67 | 9.3% |
| 3 or 4 Unit Apartments | 52 | 7.2% |
| 5 to 9 Unit Apartments | 127 | 17.6% |
| 10 or more Apartments | 116 | 16.1% |
| Mobile Home / Other | 2 | 0.3% |
| Total | 722 | 100.0% |
Housing Structures by Occupancy in West Baraboo
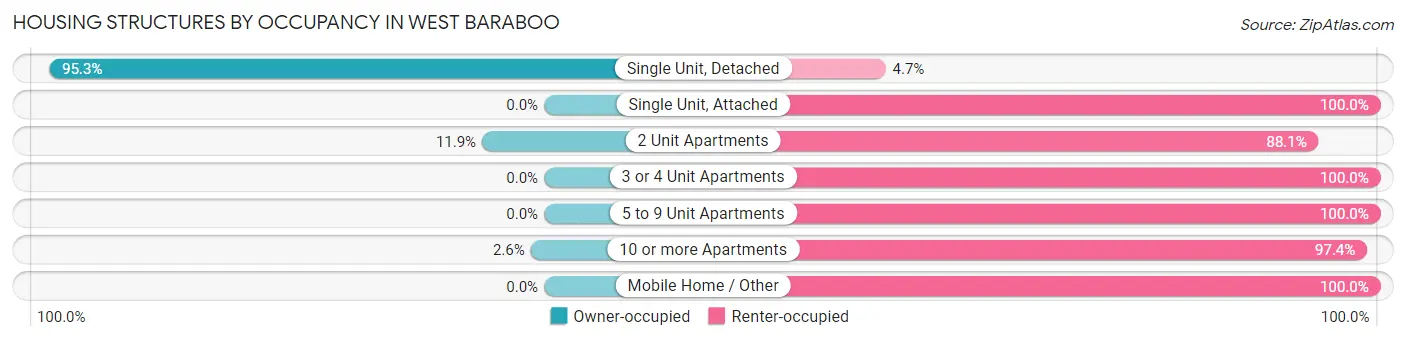
| Structure Type | Owner-occupied | Renter-occupied |
| Single Unit, Detached | 324 (95.3%) | 16 (4.7%) |
| Single Unit, Attached | 0 (0.0%) | 18 (100.0%) |
| 2 Unit Apartments | 8 (11.9%) | 59 (88.1%) |
| 3 or 4 Unit Apartments | 0 (0.0%) | 52 (100.0%) |
| 5 to 9 Unit Apartments | 0 (0.0%) | 127 (100.0%) |
| 10 or more Apartments | 3 (2.6%) | 113 (97.4%) |
| Mobile Home / Other | 0 (0.0%) | 2 (100.0%) |
| Total | 335 (46.4%) | 387 (53.6%) |
Housing Structures by Number of Rooms in West Baraboo
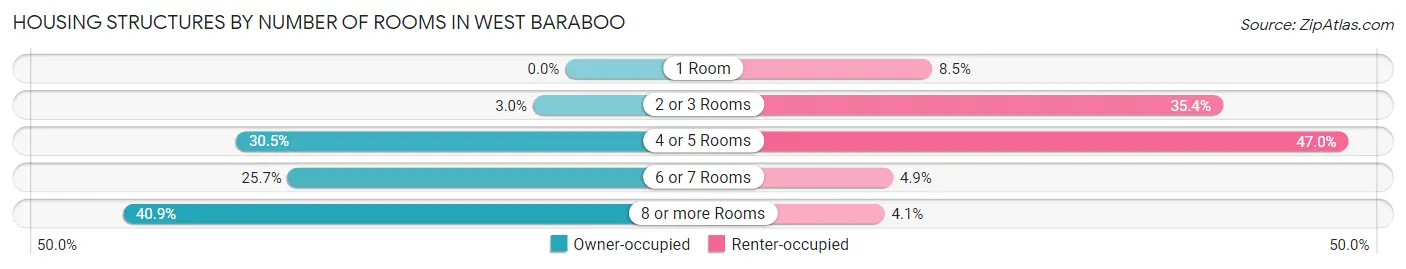
| Number of Rooms | Owner-occupied | Renter-occupied |
| 1 Room | 0 (0.0%) | 33 (8.5%) |
| 2 or 3 Rooms | 10 (3.0%) | 137 (35.4%) |
| 4 or 5 Rooms | 102 (30.4%) | 182 (47.0%) |
| 6 or 7 Rooms | 86 (25.7%) | 19 (4.9%) |
| 8 or more Rooms | 137 (40.9%) | 16 (4.1%) |
| Total | 335 (100.0%) | 387 (100.0%) |
Housing Structure by Heating Type in West Baraboo
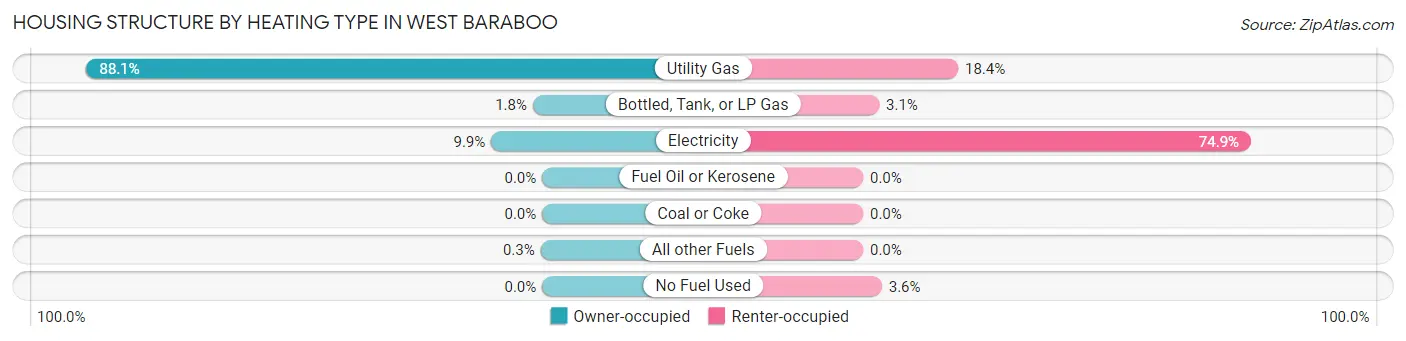
| Heating Type | Owner-occupied | Renter-occupied |
| Utility Gas | 295 (88.1%) | 71 (18.3%) |
| Bottled, Tank, or LP Gas | 6 (1.8%) | 12 (3.1%) |
| Electricity | 33 (9.9%) | 290 (74.9%) |
| Fuel Oil or Kerosene | 0 (0.0%) | 0 (0.0%) |
| Coal or Coke | 0 (0.0%) | 0 (0.0%) |
| All other Fuels | 1 (0.3%) | 0 (0.0%) |
| No Fuel Used | 0 (0.0%) | 14 (3.6%) |
| Total | 335 (100.0%) | 387 (100.0%) |
Household Vehicle Usage in West Baraboo
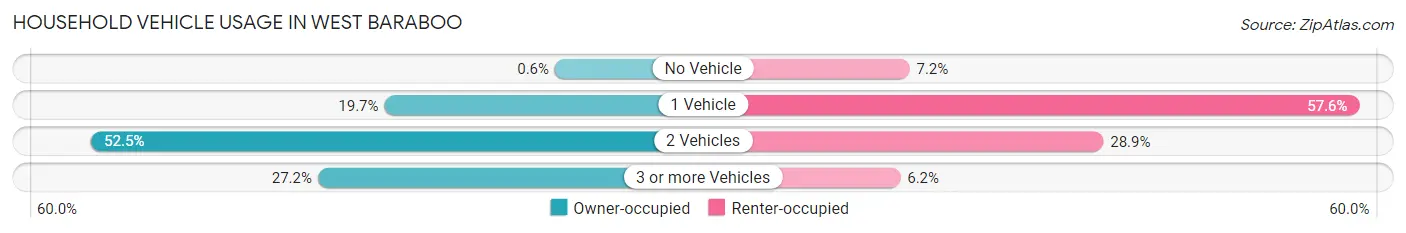
| Vehicles per Household | Owner-occupied | Renter-occupied |
| No Vehicle | 2 (0.6%) | 28 (7.2%) |
| 1 Vehicle | 66 (19.7%) | 223 (57.6%) |
| 2 Vehicles | 176 (52.5%) | 112 (28.9%) |
| 3 or more Vehicles | 91 (27.2%) | 24 (6.2%) |
| Total | 335 (100.0%) | 387 (100.0%) |
Real Estate & Mortgages in West Baraboo
Real Estate and Mortgage Overview in West Baraboo
| Characteristic | Without Mortgage | With Mortgage |
| Housing Units | 124 | 211 |
| Median Property Value | $225,500 | $185,300 |
| Median Household Income | $66,250 | $39 |
| Monthly Housing Costs | $632 | $3 |
| Real Estate Taxes | $3,682 | $3 |
Property Value by Mortgage Status in West Baraboo
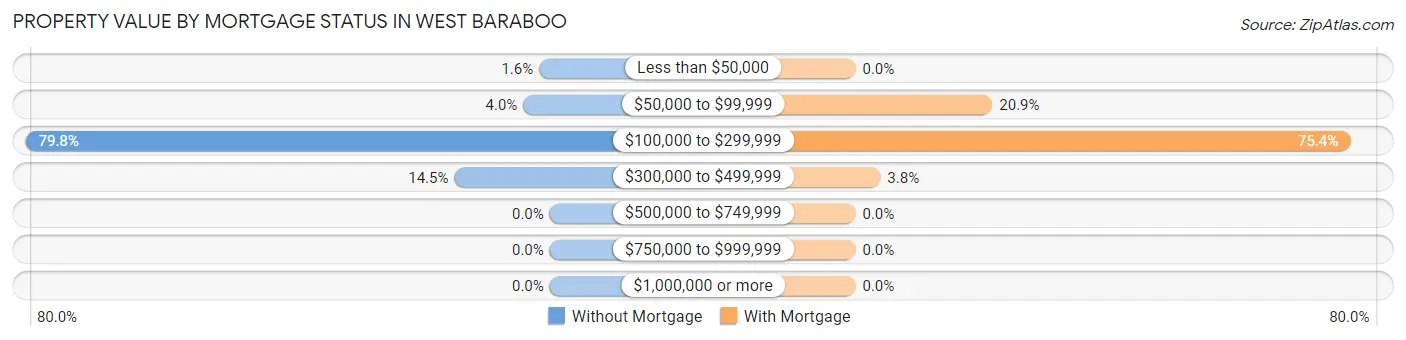
| Property Value | Without Mortgage | With Mortgage |
| Less than $50,000 | 2 (1.6%) | 0 (0.0%) |
| $50,000 to $99,999 | 5 (4.0%) | 44 (20.8%) |
| $100,000 to $299,999 | 99 (79.8%) | 159 (75.4%) |
| $300,000 to $499,999 | 18 (14.5%) | 8 (3.8%) |
| $500,000 to $749,999 | 0 (0.0%) | 0 (0.0%) |
| $750,000 to $999,999 | 0 (0.0%) | 0 (0.0%) |
| $1,000,000 or more | 0 (0.0%) | 0 (0.0%) |
| Total | 124 (100.0%) | 211 (100.0%) |
Household Income by Mortgage Status in West Baraboo
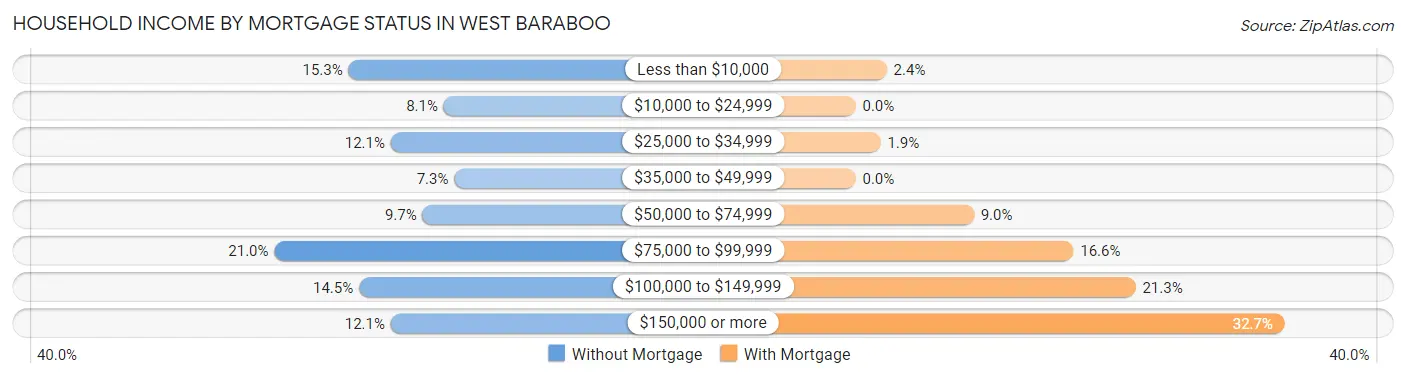
| Household Income | Without Mortgage | With Mortgage |
| Less than $10,000 | 19 (15.3%) | 5 (2.4%) |
| $10,000 to $24,999 | 10 (8.1%) | 0 (0.0%) |
| $25,000 to $34,999 | 15 (12.1%) | 4 (1.9%) |
| $35,000 to $49,999 | 9 (7.3%) | 0 (0.0%) |
| $50,000 to $74,999 | 12 (9.7%) | 19 (9.0%) |
| $75,000 to $99,999 | 26 (21.0%) | 35 (16.6%) |
| $100,000 to $149,999 | 18 (14.5%) | 45 (21.3%) |
| $150,000 or more | 15 (12.1%) | 69 (32.7%) |
| Total | 124 (100.0%) | 211 (100.0%) |
Property Value to Household Income Ratio in West Baraboo
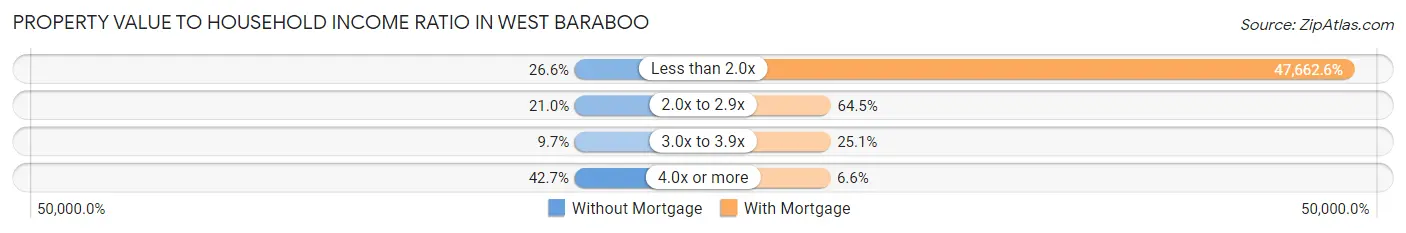
| Value-to-Income Ratio | Without Mortgage | With Mortgage |
| Less than 2.0x | 33 (26.6%) | 100,568 (47,662.6%) |
| 2.0x to 2.9x | 26 (21.0%) | 136 (64.4%) |
| 3.0x to 3.9x | 12 (9.7%) | 53 (25.1%) |
| 4.0x or more | 53 (42.7%) | 14 (6.6%) |
| Total | 124 (100.0%) | 211 (100.0%) |
Real Estate Taxes by Mortgage Status in West Baraboo
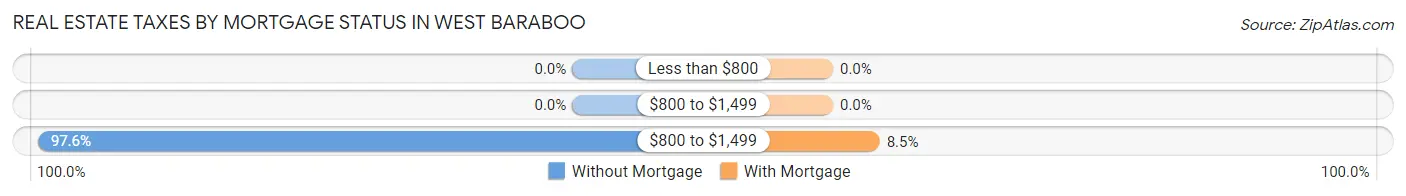
| Property Taxes | Without Mortgage | With Mortgage |
| Less than $800 | 0 (0.0%) | 0 (0.0%) |
| $800 to $1,499 | 0 (0.0%) | 0 (0.0%) |
| $800 to $1,499 | 121 (97.6%) | 18 (8.5%) |
| Total | 124 (100.0%) | 211 (100.0%) |
Health & Disability in West Baraboo
Health Insurance Coverage by Age in West Baraboo
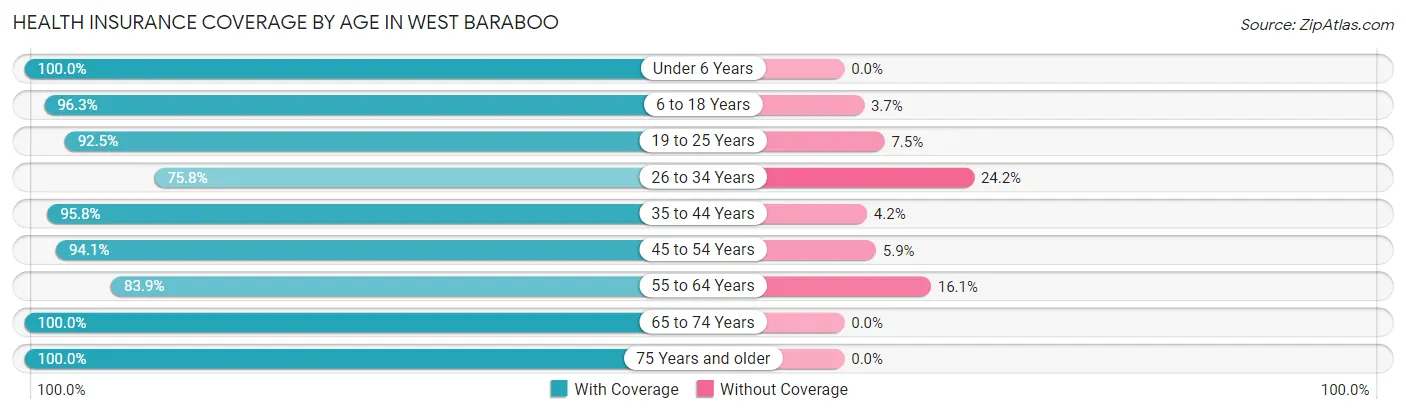
| Age Bracket | With Coverage | Without Coverage |
| Under 6 Years | 94 (100.0%) | 0 (0.0%) |
| 6 to 18 Years | 236 (96.3%) | 9 (3.7%) |
| 19 to 25 Years | 173 (92.5%) | 14 (7.5%) |
| 26 to 34 Years | 185 (75.8%) | 59 (24.2%) |
| 35 to 44 Years | 227 (95.8%) | 10 (4.2%) |
| 45 to 54 Years | 192 (94.1%) | 12 (5.9%) |
| 55 to 64 Years | 130 (83.9%) | 25 (16.1%) |
| 65 to 74 Years | 120 (100.0%) | 0 (0.0%) |
| 75 Years and older | 71 (100.0%) | 0 (0.0%) |
| Total | 1,428 (91.7%) | 129 (8.3%) |
Health Insurance Coverage by Citizenship Status in West Baraboo
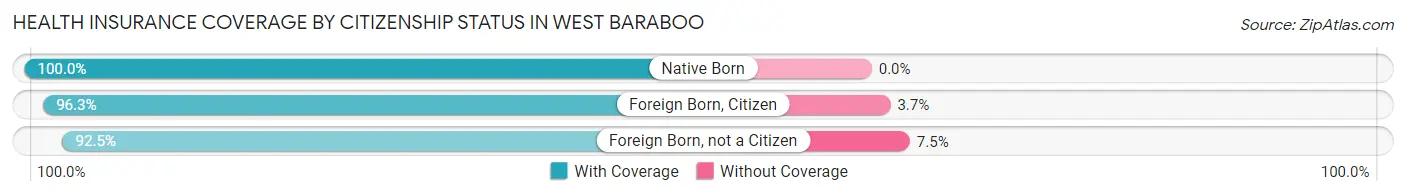
| Citizenship Status | With Coverage | Without Coverage |
| Native Born | 94 (100.0%) | 0 (0.0%) |
| Foreign Born, Citizen | 236 (96.3%) | 9 (3.7%) |
| Foreign Born, not a Citizen | 173 (92.5%) | 14 (7.5%) |
Health Insurance Coverage by Household Income in West Baraboo
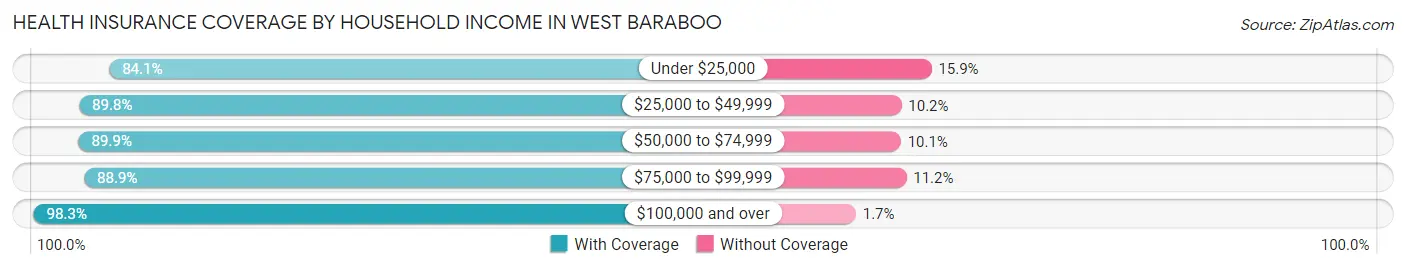
| Household Income | With Coverage | Without Coverage |
| Under $25,000 | 122 (84.1%) | 23 (15.9%) |
| $25,000 to $49,999 | 325 (89.8%) | 37 (10.2%) |
| $50,000 to $74,999 | 267 (89.9%) | 30 (10.1%) |
| $75,000 to $99,999 | 247 (88.8%) | 31 (11.2%) |
| $100,000 and over | 467 (98.3%) | 8 (1.7%) |
Public vs Private Health Insurance Coverage by Age in West Baraboo
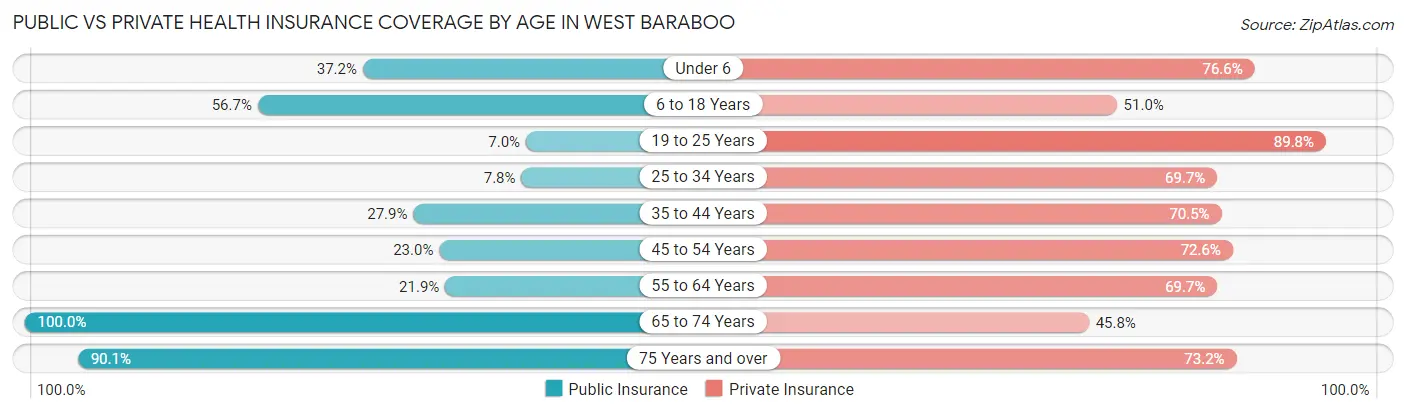
| Age Bracket | Public Insurance | Private Insurance |
| Under 6 | 35 (37.2%) | 72 (76.6%) |
| 6 to 18 Years | 139 (56.7%) | 125 (51.0%) |
| 19 to 25 Years | 13 (7.0%) | 168 (89.8%) |
| 25 to 34 Years | 19 (7.8%) | 170 (69.7%) |
| 35 to 44 Years | 66 (27.9%) | 167 (70.5%) |
| 45 to 54 Years | 47 (23.0%) | 148 (72.6%) |
| 55 to 64 Years | 34 (21.9%) | 108 (69.7%) |
| 65 to 74 Years | 120 (100.0%) | 55 (45.8%) |
| 75 Years and over | 64 (90.1%) | 52 (73.2%) |
| Total | 537 (34.5%) | 1,065 (68.4%) |
Disability Status by Sex by Age in West Baraboo
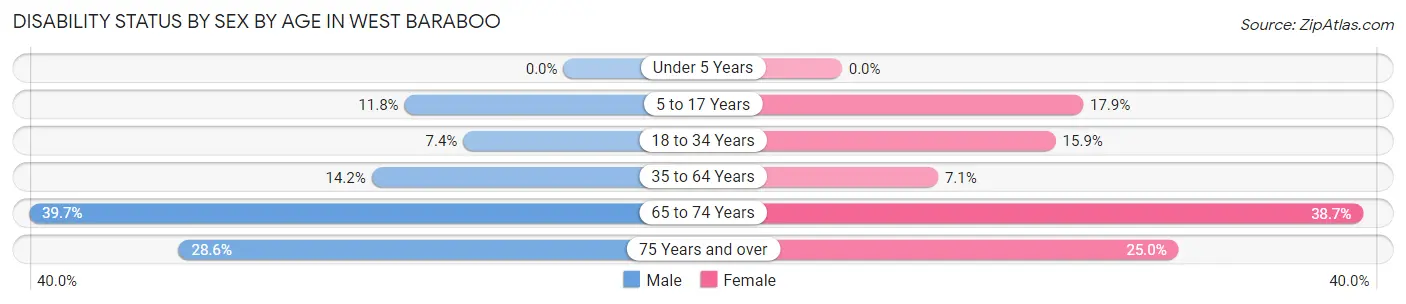
| Age Bracket | Male | Female |
| Under 5 Years | 0 (0.0%) | 0 (0.0%) |
| 5 to 17 Years | 21 (11.8%) | 12 (17.9%) |
| 18 to 34 Years | 16 (7.4%) | 37 (15.9%) |
| 35 to 64 Years | 45 (14.2%) | 20 (7.1%) |
| 65 to 74 Years | 23 (39.7%) | 24 (38.7%) |
| 75 Years and over | 10 (28.6%) | 9 (25.0%) |
Disability Class by Sex by Age in West Baraboo
Disability Class: Hearing Difficulty
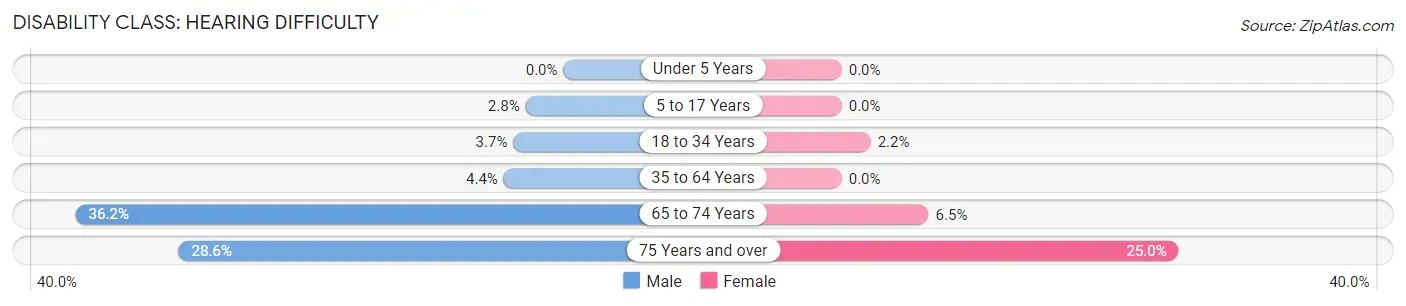
| Age Bracket | Male | Female |
| Under 5 Years | 0 (0.0%) | 0 (0.0%) |
| 5 to 17 Years | 5 (2.8%) | 0 (0.0%) |
| 18 to 34 Years | 8 (3.7%) | 5 (2.1%) |
| 35 to 64 Years | 14 (4.4%) | 0 (0.0%) |
| 65 to 74 Years | 21 (36.2%) | 4 (6.5%) |
| 75 Years and over | 10 (28.6%) | 9 (25.0%) |
Disability Class: Vision Difficulty
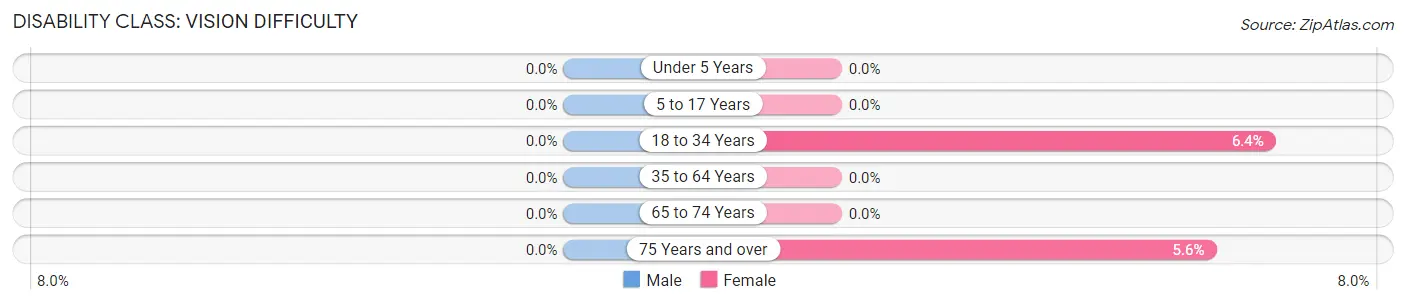
| Age Bracket | Male | Female |
| Under 5 Years | 0 (0.0%) | 0 (0.0%) |
| 5 to 17 Years | 0 (0.0%) | 0 (0.0%) |
| 18 to 34 Years | 0 (0.0%) | 15 (6.4%) |
| 35 to 64 Years | 0 (0.0%) | 0 (0.0%) |
| 65 to 74 Years | 0 (0.0%) | 0 (0.0%) |
| 75 Years and over | 0 (0.0%) | 2 (5.6%) |
Disability Class: Cognitive Difficulty
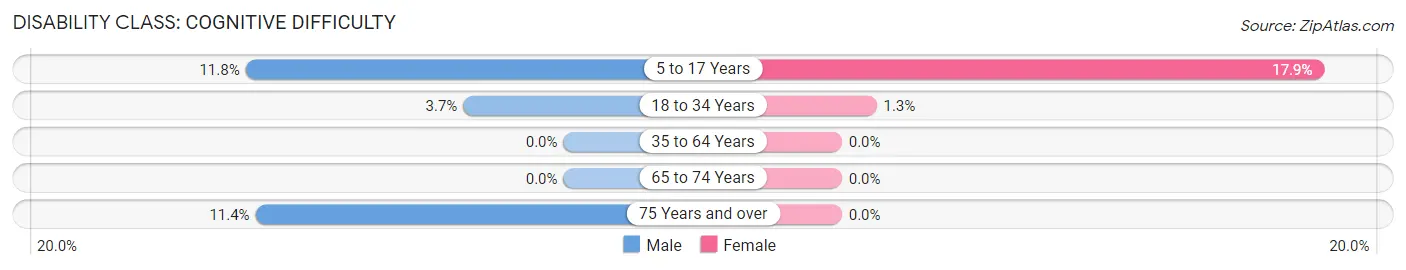
| Age Bracket | Male | Female |
| 5 to 17 Years | 21 (11.8%) | 12 (17.9%) |
| 18 to 34 Years | 8 (3.7%) | 3 (1.3%) |
| 35 to 64 Years | 0 (0.0%) | 0 (0.0%) |
| 65 to 74 Years | 0 (0.0%) | 0 (0.0%) |
| 75 Years and over | 4 (11.4%) | 0 (0.0%) |
Disability Class: Ambulatory Difficulty
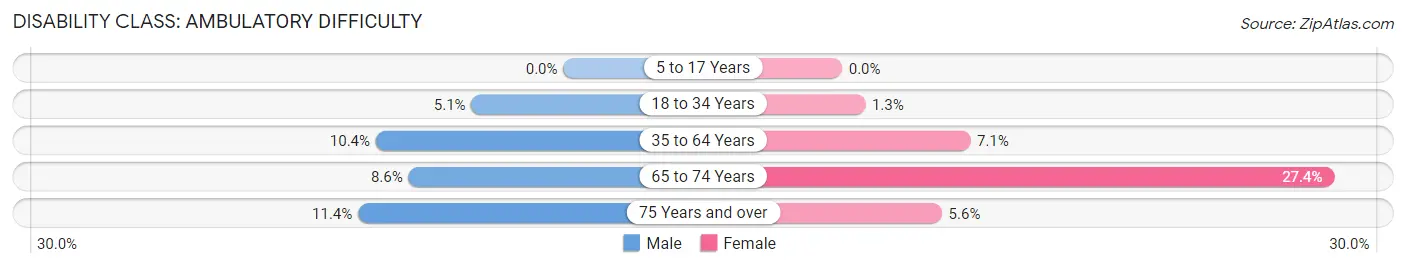
| Age Bracket | Male | Female |
| 5 to 17 Years | 0 (0.0%) | 0 (0.0%) |
| 18 to 34 Years | 11 (5.1%) | 3 (1.3%) |
| 35 to 64 Years | 33 (10.4%) | 20 (7.1%) |
| 65 to 74 Years | 5 (8.6%) | 17 (27.4%) |
| 75 Years and over | 4 (11.4%) | 2 (5.6%) |
Disability Class: Self-Care Difficulty
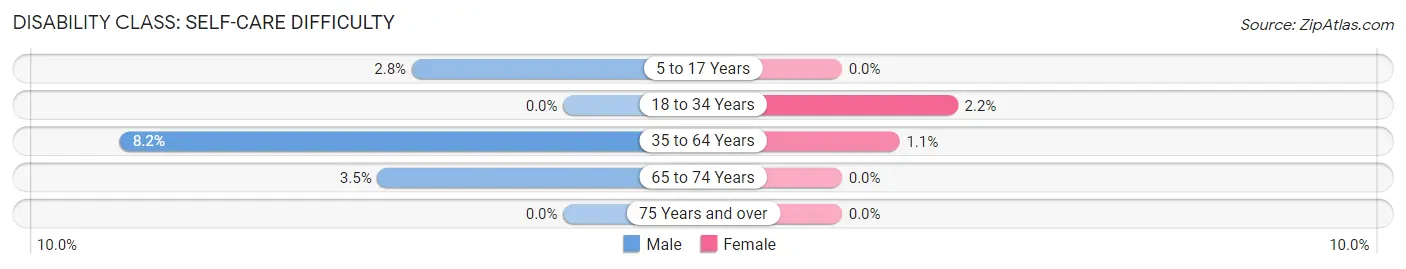
| Age Bracket | Male | Female |
| 5 to 17 Years | 5 (2.8%) | 0 (0.0%) |
| 18 to 34 Years | 0 (0.0%) | 5 (2.1%) |
| 35 to 64 Years | 26 (8.2%) | 3 (1.1%) |
| 65 to 74 Years | 2 (3.5%) | 0 (0.0%) |
| 75 Years and over | 0 (0.0%) | 0 (0.0%) |
Technology Access in West Baraboo
Computing Device Access in West Baraboo
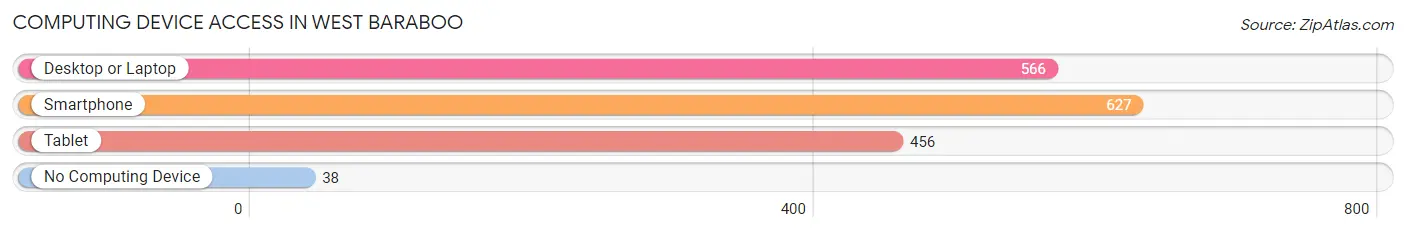
| Device Type | # Households | % Households |
| Desktop or Laptop | 566 | 78.4% |
| Smartphone | 627 | 86.8% |
| Tablet | 456 | 63.2% |
| No Computing Device | 38 | 5.3% |
| Total | 722 | 100.0% |
Internet Access in West Baraboo
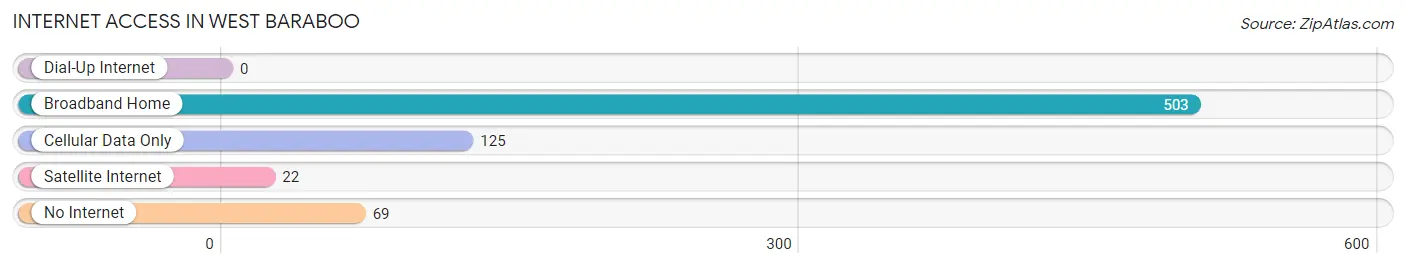
| Internet Type | # Households | % Households |
| Dial-Up Internet | 0 | 0.0% |
| Broadband Home | 503 | 69.7% |
| Cellular Data Only | 125 | 17.3% |
| Satellite Internet | 22 | 3.0% |
| No Internet | 69 | 9.6% |
| Total | 722 | 100.0% |
West Baraboo Summary
Baraboo, Wisconsin is a small city located in Sauk County, Wisconsin. It is situated on the Baraboo River, approximately 30 miles northwest of Madison, Wisconsin. The city has a population of approximately 12,000 people and is the county seat of Sauk County.
History
The area that is now Baraboo was first settled by European settlers in the early 1800s. The first settlers were mostly of German and Irish descent. The city was originally known as Adamsville, after the first settler, John Adams. In 1837, the city was renamed Baraboo, after the nearby Baraboo River.
The city was officially incorporated in 1882. During the late 19th century, Baraboo was a major center for the lumber industry. The city was also home to several large factories, including a paper mill, a woolen mill, and a foundry.
In the early 20th century, Baraboo became a popular tourist destination. The city was home to several amusement parks, including the Circus World Museum, which is now a National Historic Landmark.
Geography
Baraboo is located in south-central Wisconsin, approximately 30 miles northwest of Madison. The city is situated on the Baraboo River, which flows through the city. The city is surrounded by rolling hills and is located in the Driftless Area, which is characterized by its rugged terrain and steep valleys.
The city has a total area of 8.2 square miles, of which 8.1 square miles is land and 0.1 square miles is water. The city has a humid continental climate, with cold winters and hot, humid summers.
Economy
Baraboo’s economy is largely based on tourism and manufacturing. The city is home to several tourist attractions, including the Circus World Museum, the International Crane Foundation, and the Ho-Chunk Casino. The city is also home to several manufacturing companies, including a paper mill, a foundry, and a woolen mill.
Demographics
As of the 2010 census, Baraboo had a population of 12,048. The racial makeup of the city was 94.2% White, 0.7% African American, 0.4% Native American, 0.7% Asian, 0.1% Pacific Islander, 2.3% from other races, and 1.6% from two or more races. Hispanic or Latino of any race were 4.3% of the population.
The median income for a household in Baraboo was $41,945, and the median income for a family was $50,945. The per capita income for the city was $20,945. About 8.2% of families and 10.7% of the population were below the poverty line, including 14.2% of those under age 18 and 6.2% of those age 65 or over.
Common Questions
What is the Total Population of West Baraboo?
Total Population of West Baraboo is 1,557.
What is the Total Male Population of West Baraboo?
Total Male Population of West Baraboo is 830.
What is the Total Female Population of West Baraboo?
Total Female Population of West Baraboo is 727.
What is the Ratio of Males per 100 Females in West Baraboo?
There are 114.17 Males per 100 Females in West Baraboo.
What is the Ratio of Females per 100 Males in West Baraboo?
There are 87.59 Females per 100 Males in West Baraboo.
What is the Median Population Age in West Baraboo?
Median Population Age in West Baraboo is 35.3 Years.
What is the Average Family Size in West Baraboo
Average Family Size in West Baraboo is 2.7 People.
What is the Average Household Size in West Baraboo
Average Household Size in West Baraboo is 2.2 People.
What is Per Capita Income in West Baraboo?
Per Capita income in West Baraboo is $30,989.
What is the Median Family Income in West Baraboo?
Median Family Income in West Baraboo is $70,000.
What is the Median Household income in West Baraboo?
Median Household Income in West Baraboo is $55,952.
What is Income or Wage Gap in West Baraboo?
Income or Wage Gap in West Baraboo is 3.6%.
Women in West Baraboo earn 96.4 cents for every dollar earned by a man.
What is Inequality or Gini Index in West Baraboo?
Inequality or Gini Index in West Baraboo is 0.39.
How Large is the Labor Force in West Baraboo?
There are 969 People in the Labor Forcein in West Baraboo.
What is the Percentage of People in the Labor Force in West Baraboo?
76.0% of People are in the Labor Force in West Baraboo.
What is the Unemployment Rate in West Baraboo?
Unemployment Rate in West Baraboo is 3.8%.