Trego, WI
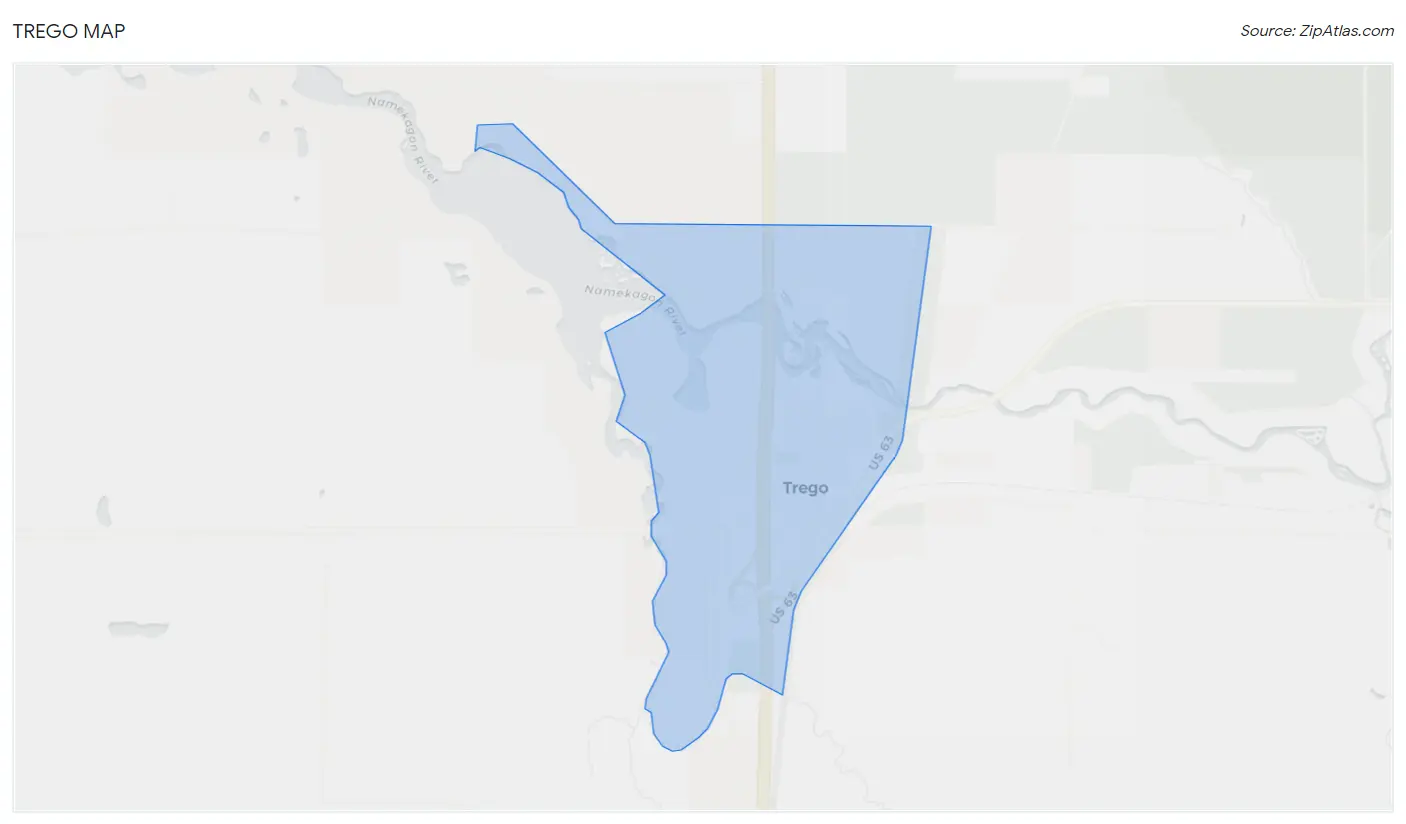
Trego Map
Trego Overview
93
TOTAL POPULATION
52
MALE POPULATION
41
FEMALE POPULATION
126.83
MALES / 100 FEMALES
78.85
FEMALES / 100 MALES
58.8
MEDIAN AGE
2.3
AVG FAMILY SIZE
1.9
AVG HOUSEHOLD SIZE
$32,131
PER CAPITA INCOME
$66,250
AVG FAMILY INCOME
$51,250
AVG HOUSEHOLD INCOME
15.6%
WAGE / INCOME GAP [ % ]
84.4¢/ $1
WAGE / INCOME GAP [ $ ]
0.35
INEQUALITY / GINI INDEX
48
LABOR FORCE [ PEOPLE ]
57.1%
PERCENT IN LABOR FORCE
Trego Zip Codes
Trego Area Codes
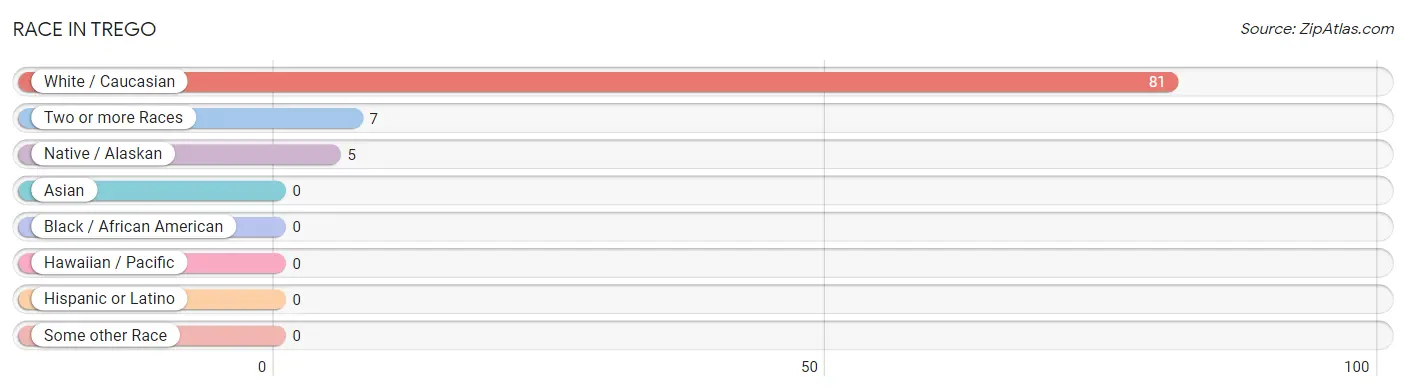
Race in Trego
The most populous races in Trego are White / Caucasian (81 | 87.1%), Two or more Races (7 | 7.5%), and Native / Alaskan (5 | 5.4%).
| Race | # Population | % Population |
| Asian | 0 | 0.0% |
| Black / African American | 0 | 0.0% |
| Hawaiian / Pacific | 0 | 0.0% |
| Hispanic or Latino | 0 | 0.0% |
| Native / Alaskan | 5 | 5.4% |
| White / Caucasian | 81 | 87.1% |
| Two or more Races | 7 | 7.5% |
| Some other Race | 0 | 0.0% |
| Total | 93 | 100.0% |
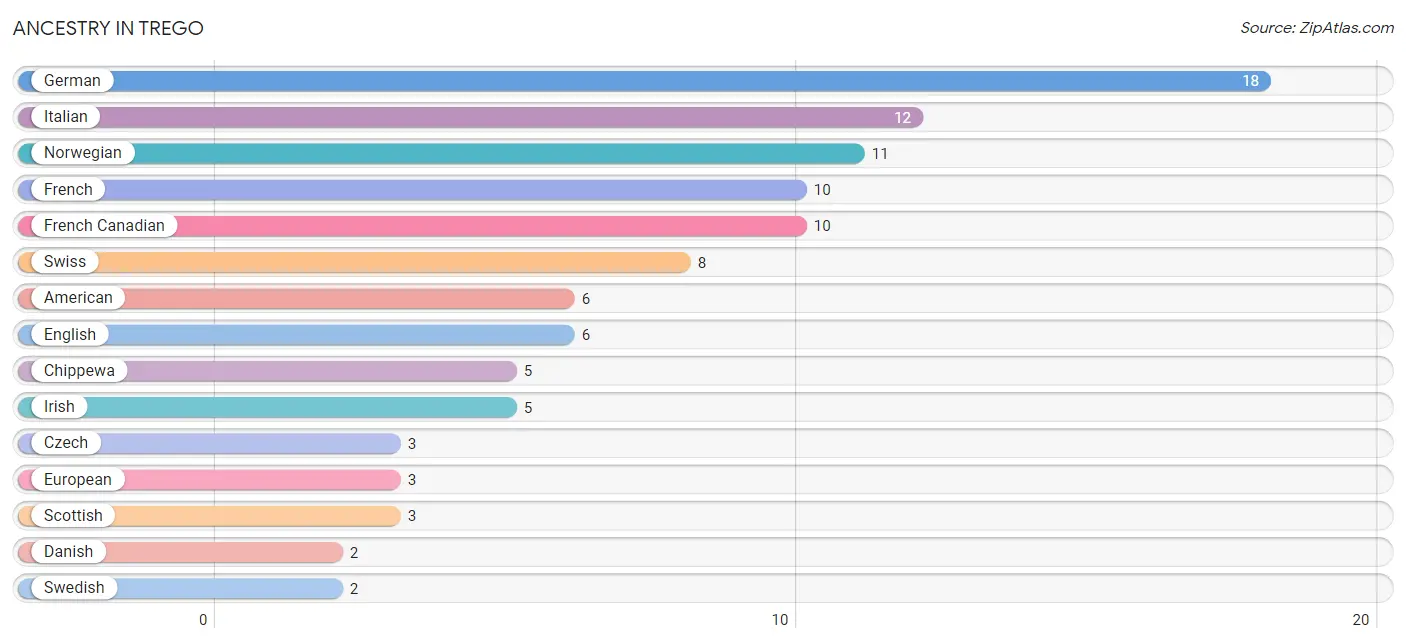
Ancestry in Trego
The most populous ancestries reported in Trego are German (18 | 19.4%), Italian (12 | 12.9%), Norwegian (11 | 11.8%), French (10 | 10.7%), and French Canadian (10 | 10.7%), together accounting for 65.6% of all Trego residents.
| Ancestry | # Population | % Population |
| American | 6 | 6.5% |
| Chippewa | 5 | 5.4% |
| Czech | 3 | 3.2% |
| Danish | 2 | 2.1% |
| English | 6 | 6.5% |
| European | 3 | 3.2% |
| French | 10 | 10.7% |
| French Canadian | 10 | 10.7% |
| German | 18 | 19.4% |
| Irish | 5 | 5.4% |
| Italian | 12 | 12.9% |
| Norwegian | 11 | 11.8% |
| Scottish | 3 | 3.2% |
| Swedish | 2 | 2.1% |
| Swiss | 8 | 8.6% | View All 15 Rows |
Immigrants in Trego

| Immigration Origin | # Population | % Population | View All 0 Rows |
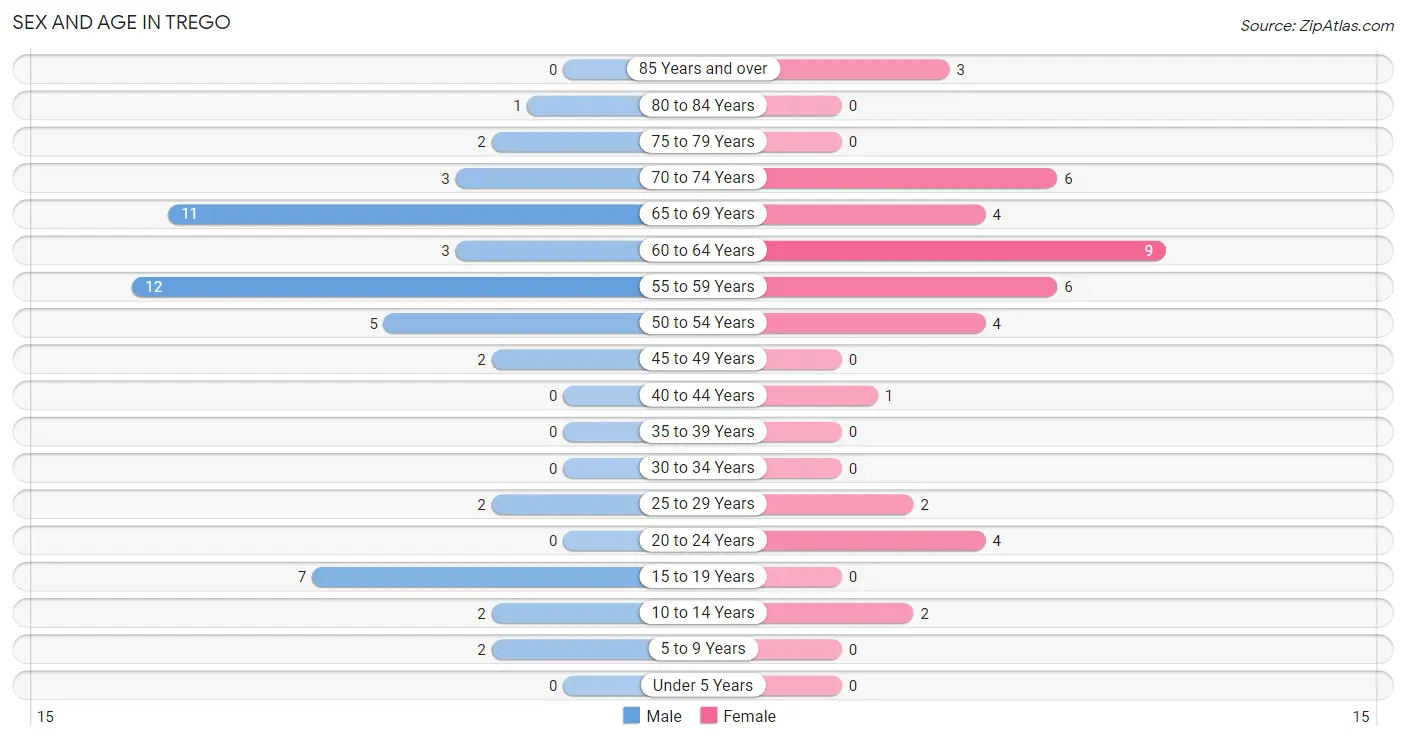
Sex and Age in Trego
Sex and Age in Trego
The most populous age groups in Trego are 55 to 59 Years (12 | 23.1%) for men and 60 to 64 Years (9 | 22.0%) for women.
| Age Bracket | Male | Female |
| Under 5 Years | 0 (0.0%) | 0 (0.0%) |
| 5 to 9 Years | 2 (3.8%) | 0 (0.0%) |
| 10 to 14 Years | 2 (3.8%) | 2 (4.9%) |
| 15 to 19 Years | 7 (13.5%) | 0 (0.0%) |
| 20 to 24 Years | 0 (0.0%) | 4 (9.8%) |
| 25 to 29 Years | 2 (3.8%) | 2 (4.9%) |
| 30 to 34 Years | 0 (0.0%) | 0 (0.0%) |
| 35 to 39 Years | 0 (0.0%) | 0 (0.0%) |
| 40 to 44 Years | 0 (0.0%) | 1 (2.4%) |
| 45 to 49 Years | 2 (3.8%) | 0 (0.0%) |
| 50 to 54 Years | 5 (9.6%) | 4 (9.8%) |
| 55 to 59 Years | 12 (23.1%) | 6 (14.6%) |
| 60 to 64 Years | 3 (5.8%) | 9 (22.0%) |
| 65 to 69 Years | 11 (21.1%) | 4 (9.8%) |
| 70 to 74 Years | 3 (5.8%) | 6 (14.6%) |
| 75 to 79 Years | 2 (3.8%) | 0 (0.0%) |
| 80 to 84 Years | 1 (1.9%) | 0 (0.0%) |
| 85 Years and over | 0 (0.0%) | 3 (7.3%) |
| Total | 52 (100.0%) | 41 (100.0%) |
Families and Households in Trego
Median Family Size in Trego
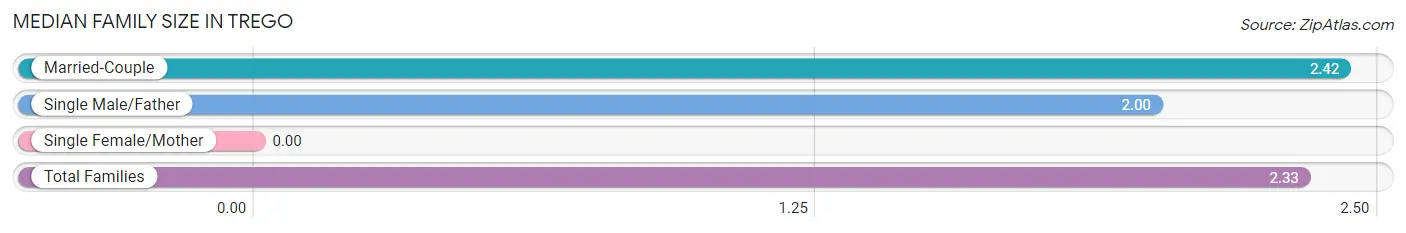
| Family Type | # Families | Family Size |
| Married-Couple | 26 (78.8%) | 2.42 |
| Single Male/Father | 7 (21.2%) | 2.00 |
| Single Female/Mother | 0 (0.0%) | - |
| Total Families | 33 (100.0%) | 2.33 |
Median Household Size in Trego
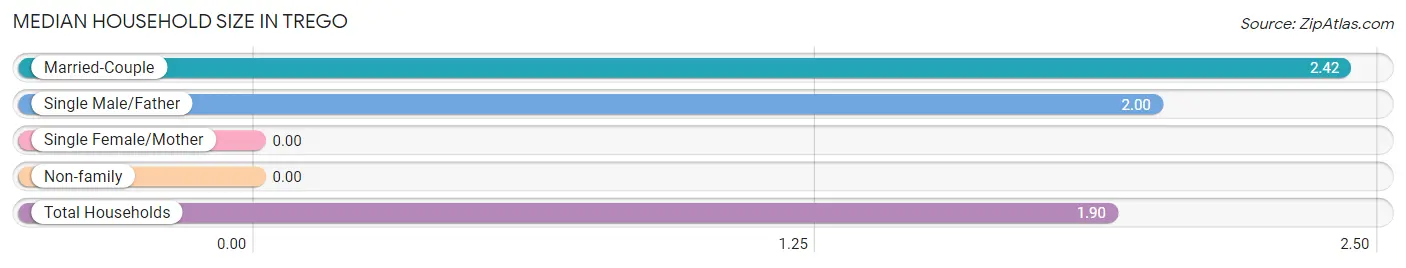
| Household Type | # Households | Household Size |
| Married-Couple | 26 (53.1%) | 2.42 |
| Single Male/Father | 7 (14.3%) | 2.00 |
| Single Female/Mother | 0 (0.0%) | - |
| Non-family | 16 (32.7%) | - |
| Total Households | 49 (100.0%) | 1.90 |
Household Size by Marriage Status in Trego
Out of a total of 49 households in Trego, 33 (67.3%) are family households, while 16 (32.7%) are nonfamily households. The most numerous type of family households are 2-person households, comprising 24, and the most common type of nonfamily households are 1-person households, comprising 16.

| Household Size | Family Households | Nonfamily Households |
| 1-Person Households | - | 16 (32.7%) |
| 2-Person Households | 24 (49.0%) | 0 (0.0%) |
| 3-Person Households | 7 (14.3%) | 0 (0.0%) |
| 4-Person Households | 2 (4.1%) | 0 (0.0%) |
| 5-Person Households | 0 (0.0%) | 0 (0.0%) |
| 6-Person Households | 0 (0.0%) | 0 (0.0%) |
| 7+ Person Households | 0 (0.0%) | 0 (0.0%) |
| Total | 33 (67.3%) | 16 (32.7%) |
Female Fertility in Trego
Fertility by Age in Trego
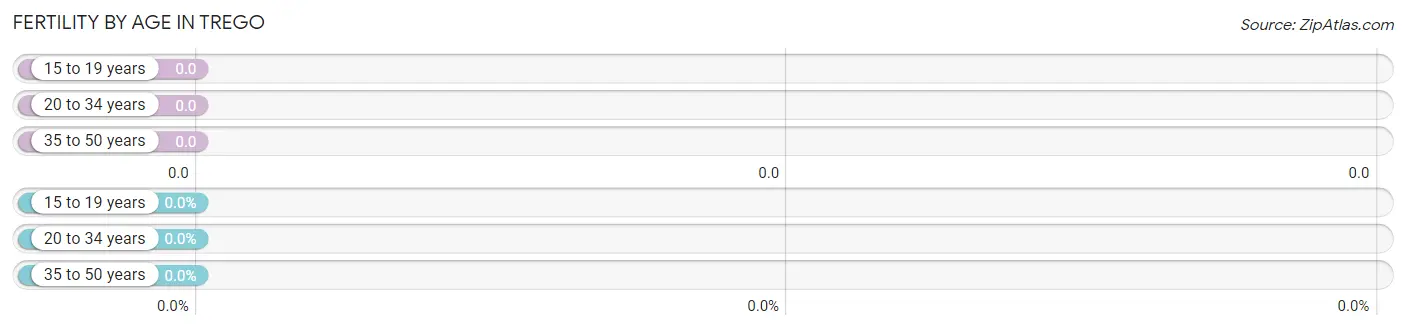
| Age Bracket | Women with Births | Births / 1,000 Women |
| 15 to 19 years | 0 (0.0%) | 0.0 |
| 20 to 34 years | 0 (0.0%) | 0.0 |
| 35 to 50 years | 0 (0.0%) | 0.0 |
| Total | 0 (0.0%) | 0.0 |
Fertility by Age by Marriage Status in Trego
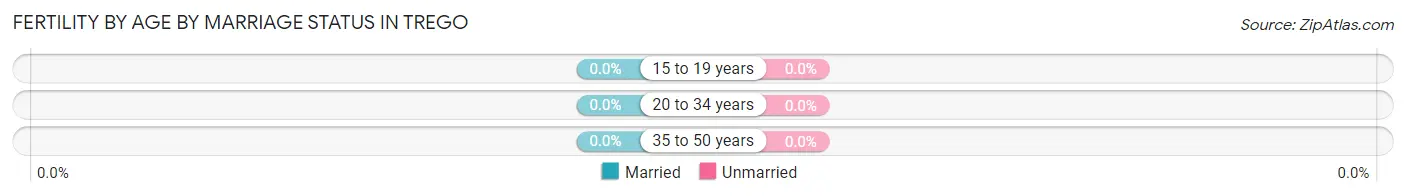
| Age Bracket | Married | Unmarried |
| 15 to 19 years | 0 (0.0%) | 0 (0.0%) |
| 20 to 34 years | 0 (0.0%) | 0 (0.0%) |
| 35 to 50 years | 0 (0.0%) | 0 (0.0%) |
| Total | 0 (0.0%) | 0 (0.0%) |
Fertility by Education in Trego
| Educational Attainment | Women with Births | Births / 1,000 Women |
| Less than High School | 0 (0.0%) | 0.0 |
| High School Diploma | 0 (0.0%) | 0.0 |
| College or Associate's Degree | 0 (0.0%) | 0.0 |
| Bachelor's Degree | 0 (0.0%) | 0.0 |
| Graduate Degree | 0 (0.0%) | 0.0 |
| Total | 0 (0.0%) | 0.0 |
Fertility by Education by Marriage Status in Trego
| Educational Attainment | Married | Unmarried |
| Less than High School | 0 (0.0%) | 0 (0.0%) |
| High School Diploma | 0 (0.0%) | 0 (0.0%) |
| College or Associate's Degree | 0 (0.0%) | 0 (0.0%) |
| Bachelor's Degree | 0 (0.0%) | 0 (0.0%) |
| Graduate Degree | 0 (0.0%) | 0 (0.0%) |
| Total | 0 (0.0%) | 0 (0.0%) |
Income in Trego
Income Overview in Trego
Per Capita Income in Trego is $32,131, while median incomes of families and households are $66,250 and $51,250 respectively.
| Characteristic | Number | Measure |
| Per Capita Income | 93 | $32,131 |
| Median Family Income | 33 | $66,250 |
| Mean Family Income | 33 | $69,691 |
| Median Household Income | 49 | $51,250 |
| Mean Household Income | 49 | $59,288 |
| Income Deficit | 33 | $0 |
| Wage / Income Gap (%) | 93 | 15.60% |
| Wage / Income Gap ($) | 93 | 84.40¢ per $1 |
| Gini / Inequality Index | 93 | 0.35 |
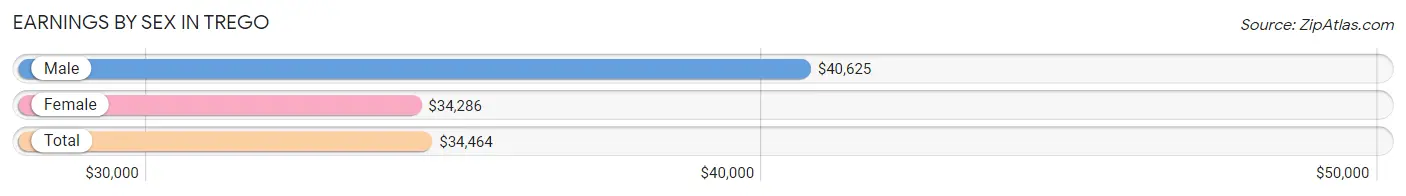
Earnings by Sex in Trego
Average Earnings in Trego are $34,464, $40,625 for men and $34,286 for women, a difference of 15.6%.
| Sex | Number | Average Earnings |
| Male | 33 (62.3%) | $40,625 |
| Female | 20 (37.7%) | $34,286 |
| Total | 53 (100.0%) | $34,464 |
Earnings by Sex by Income Bracket in Trego
The most common earnings brackets in Trego are $2,500 to $4,999 for men (7 | 21.2%) and $30,000 to $34,999 for women (7 | 35.0%).
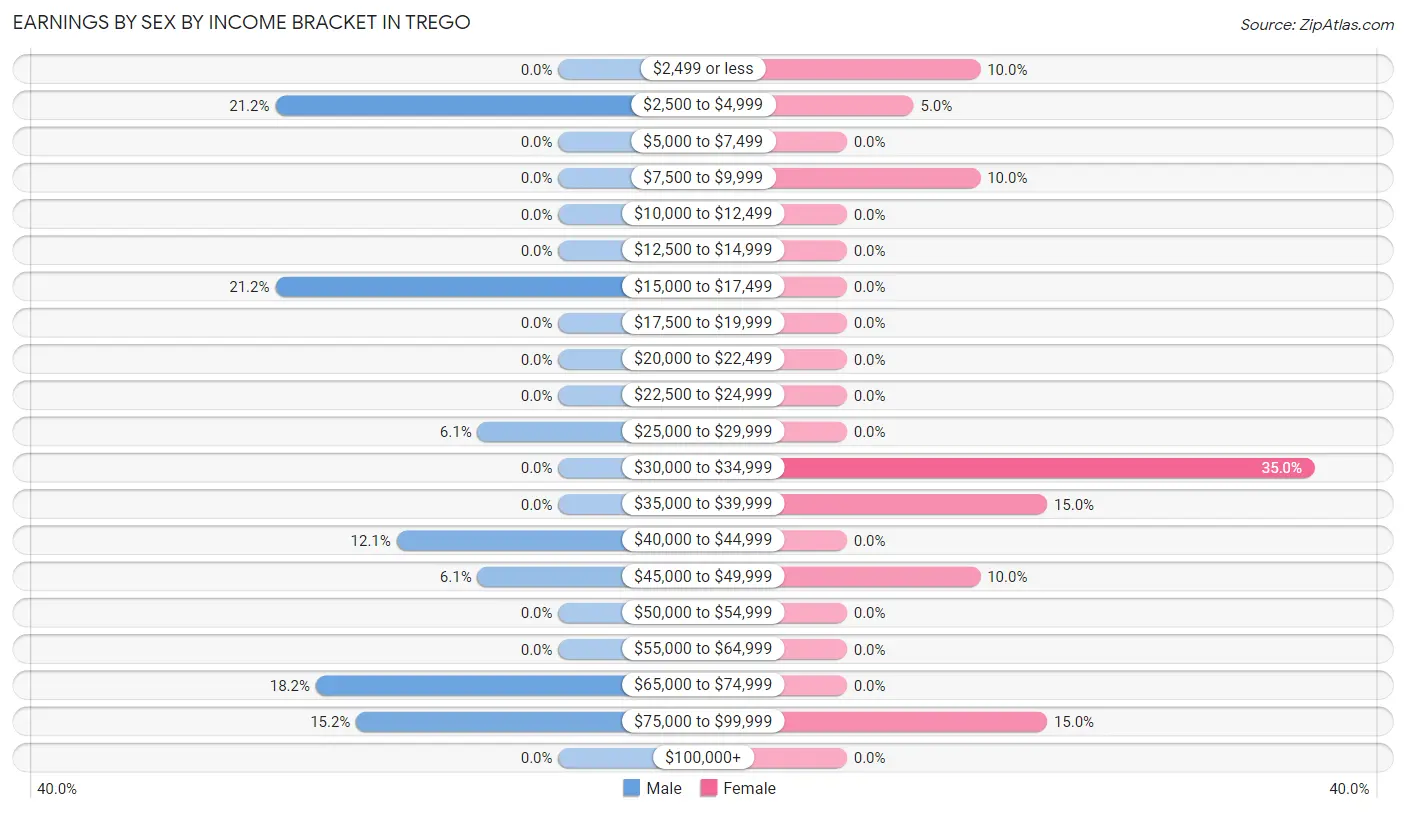
| Income | Male | Female |
| $2,499 or less | 0 (0.0%) | 2 (10.0%) |
| $2,500 to $4,999 | 7 (21.2%) | 1 (5.0%) |
| $5,000 to $7,499 | 0 (0.0%) | 0 (0.0%) |
| $7,500 to $9,999 | 0 (0.0%) | 2 (10.0%) |
| $10,000 to $12,499 | 0 (0.0%) | 0 (0.0%) |
| $12,500 to $14,999 | 0 (0.0%) | 0 (0.0%) |
| $15,000 to $17,499 | 7 (21.2%) | 0 (0.0%) |
| $17,500 to $19,999 | 0 (0.0%) | 0 (0.0%) |
| $20,000 to $22,499 | 0 (0.0%) | 0 (0.0%) |
| $22,500 to $24,999 | 0 (0.0%) | 0 (0.0%) |
| $25,000 to $29,999 | 2 (6.1%) | 0 (0.0%) |
| $30,000 to $34,999 | 0 (0.0%) | 7 (35.0%) |
| $35,000 to $39,999 | 0 (0.0%) | 3 (15.0%) |
| $40,000 to $44,999 | 4 (12.1%) | 0 (0.0%) |
| $45,000 to $49,999 | 2 (6.1%) | 2 (10.0%) |
| $50,000 to $54,999 | 0 (0.0%) | 0 (0.0%) |
| $55,000 to $64,999 | 0 (0.0%) | 0 (0.0%) |
| $65,000 to $74,999 | 6 (18.2%) | 0 (0.0%) |
| $75,000 to $99,999 | 5 (15.1%) | 3 (15.0%) |
| $100,000+ | 0 (0.0%) | 0 (0.0%) |
| Total | 33 (100.0%) | 20 (100.0%) |
Earnings by Sex by Educational Attainment in Trego
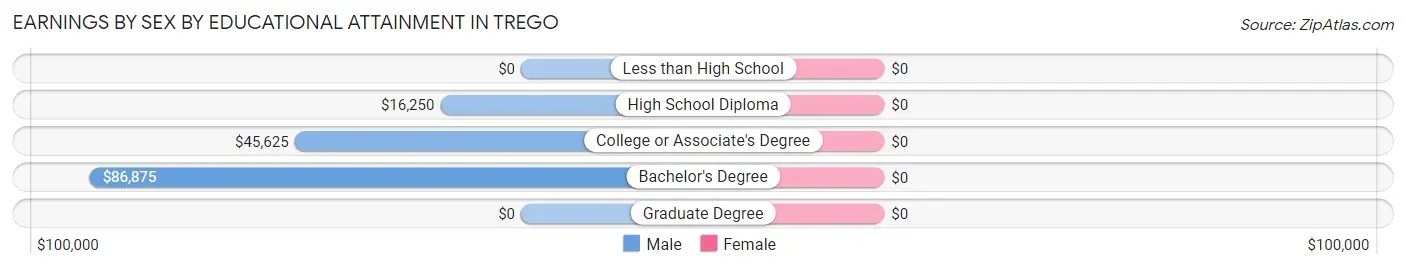
| Educational Attainment | Male Income | Female Income |
| Less than High School | - | - |
| High School Diploma | $16,250 | $0 |
| College or Associate's Degree | $45,625 | $0 |
| Bachelor's Degree | $86,875 | $0 |
| Graduate Degree | - | - |
| Total | $43,125 | $35,000 |
Family Income in Trego
Family Income Brackets in Trego
According to the Trego family income data, there are 10 families falling into the $50,000 to $74,999 income range, which is the most common income bracket and makes up 30.3% of all families.
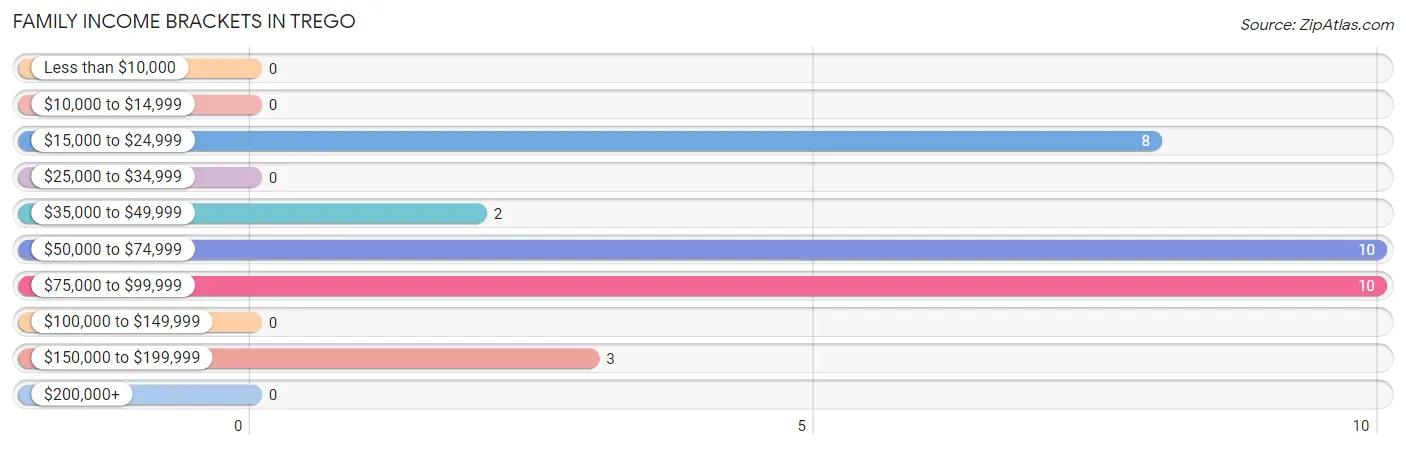
| Income Bracket | # Families | % Families |
| Less than $10,000 | 0 | 0.0% |
| $10,000 to $14,999 | 0 | 0.0% |
| $15,000 to $24,999 | 8 | 24.2% |
| $25,000 to $34,999 | 0 | 0.0% |
| $35,000 to $49,999 | 2 | 6.1% |
| $50,000 to $74,999 | 10 | 30.3% |
| $75,000 to $99,999 | 10 | 30.3% |
| $100,000 to $149,999 | 0 | 0.0% |
| $150,000 to $199,999 | 3 | 9.1% |
| $200,000+ | 0 | 0.0% |
Family Income by Famaliy Size in Trego
2-person families (24 | 72.7%) account for the highest median family income in Trego with $76,250 per family, while 2-person families (24 | 72.7%) have the highest median income of $38,125 per family member.
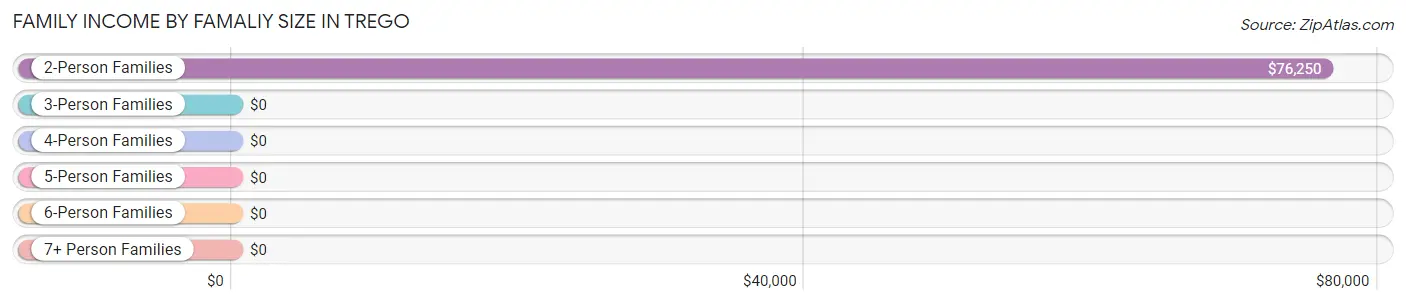
| Income Bracket | # Families | Median Income |
| 2-Person Families | 24 (72.7%) | $76,250 |
| 3-Person Families | 7 (21.2%) | $0 |
| 4-Person Families | 2 (6.1%) | $0 |
| 5-Person Families | 0 (0.0%) | $0 |
| 6-Person Families | 0 (0.0%) | $0 |
| 7+ Person Families | 0 (0.0%) | $0 |
| Total | 33 (100.0%) | $66,250 |
Family Income by Number of Earners in Trego
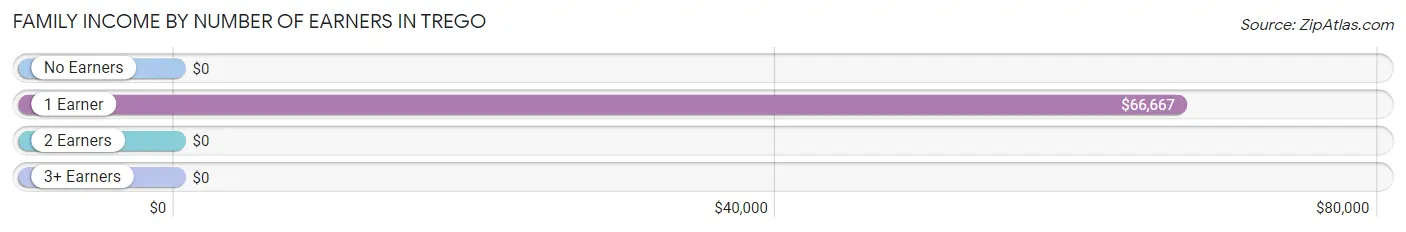
| Number of Earners | # Families | Median Income |
| No Earners | 4 (12.1%) | $0 |
| 1 Earner | 14 (42.4%) | $66,667 |
| 2 Earners | 15 (45.5%) | $0 |
| 3+ Earners | 0 (0.0%) | $0 |
| Total | 33 (100.0%) | $66,250 |
Household Income in Trego
Household Income Brackets in Trego
With 13 households falling in the category, the $50,000 to $74,999 income range is the most frequent in Trego, accounting for 26.5% of all households.
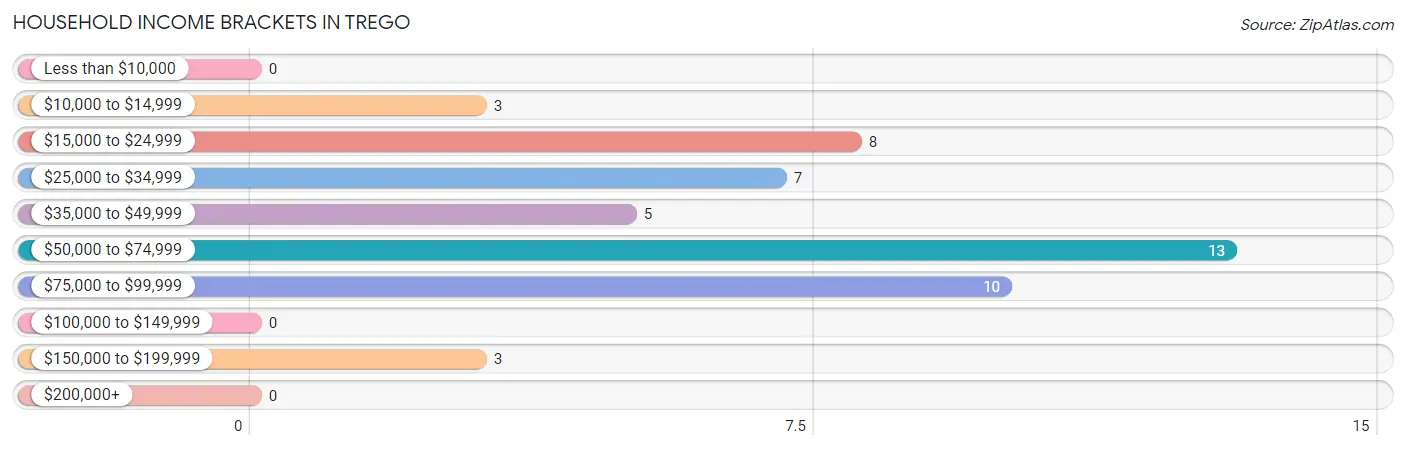
| Income Bracket | # Households | % Households |
| Less than $10,000 | 0 | 0.0% |
| $10,000 to $14,999 | 3 | 6.1% |
| $15,000 to $24,999 | 8 | 16.3% |
| $25,000 to $34,999 | 7 | 14.3% |
| $35,000 to $49,999 | 5 | 10.2% |
| $50,000 to $74,999 | 13 | 26.5% |
| $75,000 to $99,999 | 10 | 20.4% |
| $100,000 to $149,999 | 0 | 0.0% |
| $150,000 to $199,999 | 3 | 6.1% |
| $200,000+ | 0 | 0.0% |
Household Income by Householder Age in Trego
The median household income in Trego is $51,250, with the highest median household income of $67,500 found in the 65+ years age bracket for the primary householder. A total of 18 households (36.7%) fall into this category. Meanwhile, the 15 to 24 years age bracket for the primary householder has the lowest median household income of $0, with 4 households (8.2%) in this group.
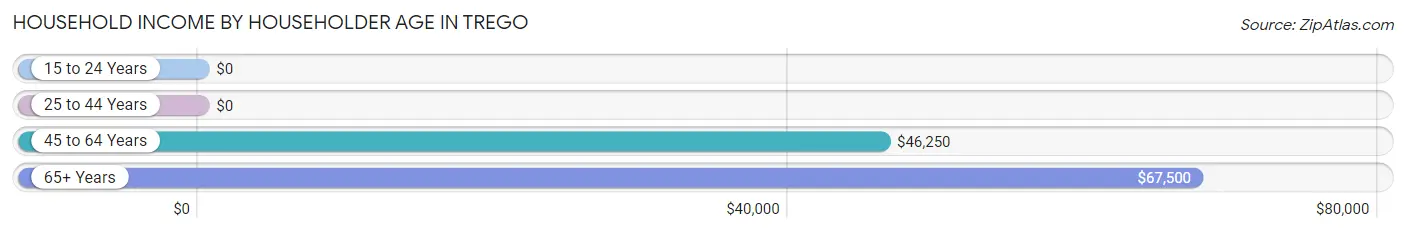
| Income Bracket | # Households | Median Income |
| 15 to 24 Years | 4 (8.2%) | $0 |
| 25 to 44 Years | 3 (6.1%) | $0 |
| 45 to 64 Years | 24 (49.0%) | $46,250 |
| 65+ Years | 18 (36.7%) | $67,500 |
| Total | 49 (100.0%) | $51,250 |
Poverty in Trego
Income Below Poverty by Sex and Age in Trego
With 34.6% poverty level for males and 17.1% for females among the residents of Trego, 5 year old males and 75 year old and over females are the most vulnerable to poverty, with 2 males (100.0%) and 3 females (100.0%) in their respective age groups living below the poverty level.
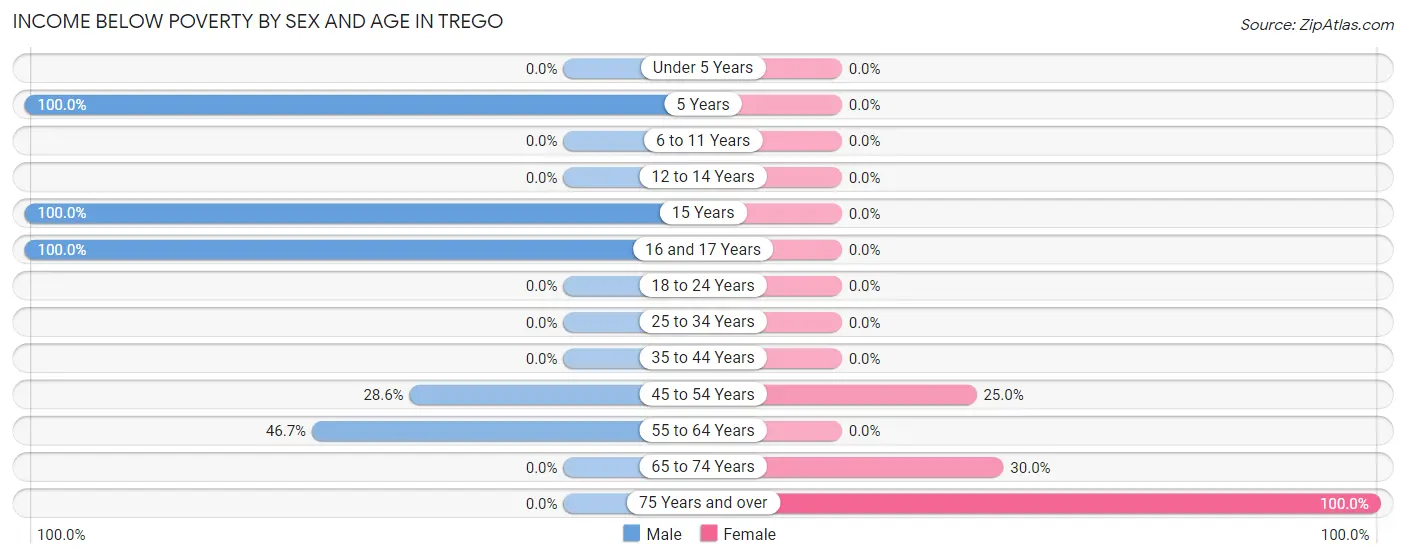
| Age Bracket | Male | Female |
| Under 5 Years | 0 (0.0%) | 0 (0.0%) |
| 5 Years | 2 (100.0%) | 0 (0.0%) |
| 6 to 11 Years | 0 (0.0%) | 0 (0.0%) |
| 12 to 14 Years | 0 (0.0%) | 0 (0.0%) |
| 15 Years | 3 (100.0%) | 0 (0.0%) |
| 16 and 17 Years | 4 (100.0%) | 0 (0.0%) |
| 18 to 24 Years | 0 (0.0%) | 0 (0.0%) |
| 25 to 34 Years | 0 (0.0%) | 0 (0.0%) |
| 35 to 44 Years | 0 (0.0%) | 0 (0.0%) |
| 45 to 54 Years | 2 (28.6%) | 1 (25.0%) |
| 55 to 64 Years | 7 (46.7%) | 0 (0.0%) |
| 65 to 74 Years | 0 (0.0%) | 3 (30.0%) |
| 75 Years and over | 0 (0.0%) | 3 (100.0%) |
| Total | 18 (34.6%) | 7 (17.1%) |
Income Above Poverty by Sex and Age in Trego
According to the poverty statistics in Trego, males aged 12 to 14 years and females aged 6 to 11 years are the age groups that are most secure financially, with 100.0% of males and 100.0% of females in these age groups living above the poverty line.
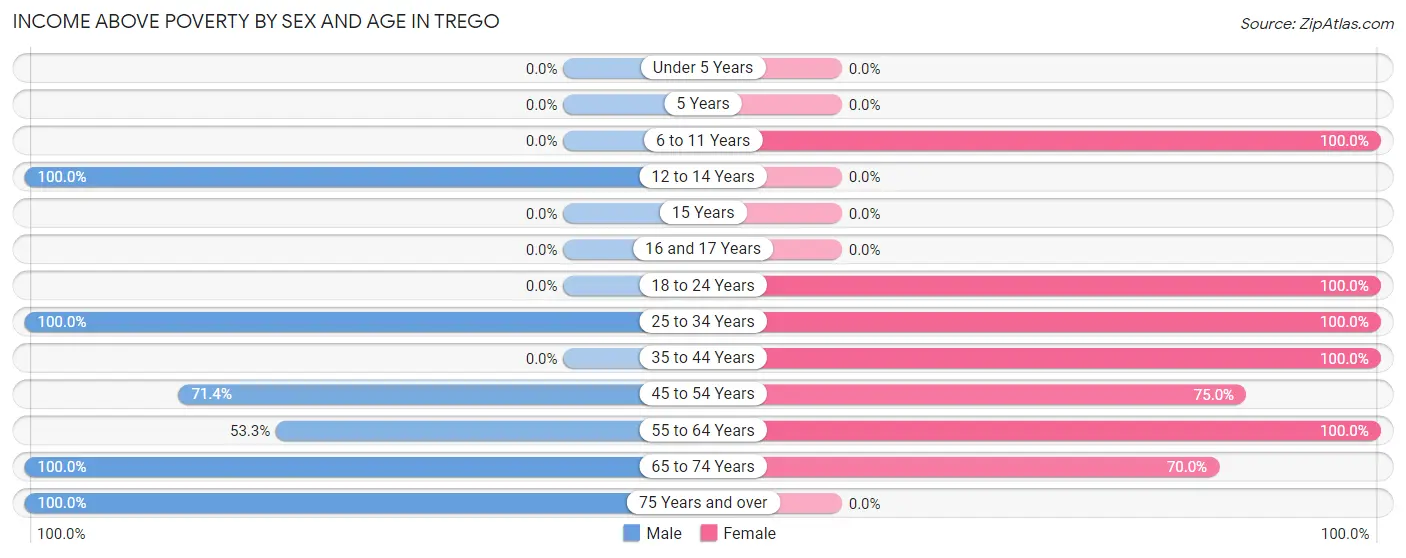
| Age Bracket | Male | Female |
| Under 5 Years | 0 (0.0%) | 0 (0.0%) |
| 5 Years | 0 (0.0%) | 0 (0.0%) |
| 6 to 11 Years | 0 (0.0%) | 2 (100.0%) |
| 12 to 14 Years | 2 (100.0%) | 0 (0.0%) |
| 15 Years | 0 (0.0%) | 0 (0.0%) |
| 16 and 17 Years | 0 (0.0%) | 0 (0.0%) |
| 18 to 24 Years | 0 (0.0%) | 4 (100.0%) |
| 25 to 34 Years | 2 (100.0%) | 2 (100.0%) |
| 35 to 44 Years | 0 (0.0%) | 1 (100.0%) |
| 45 to 54 Years | 5 (71.4%) | 3 (75.0%) |
| 55 to 64 Years | 8 (53.3%) | 15 (100.0%) |
| 65 to 74 Years | 14 (100.0%) | 7 (70.0%) |
| 75 Years and over | 3 (100.0%) | 0 (0.0%) |
| Total | 34 (65.4%) | 34 (82.9%) |
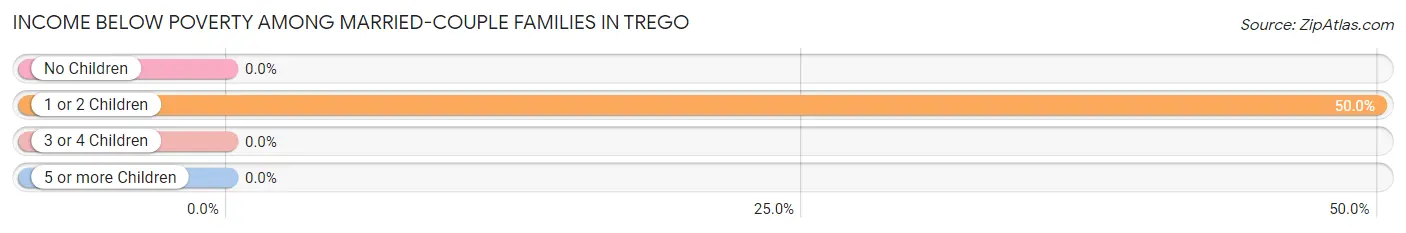
Income Below Poverty Among Married-Couple Families in Trego
The poverty statistics for married-couple families in Trego show that 3.8% or 1 of the total 26 families live below the poverty line. Families with 1 or 2 children have the highest poverty rate of 50.0%, comprising of 1 families. On the other hand, families with no children have the lowest poverty rate of 0.0%, which includes 0 families.
| Children | Above Poverty | Below Poverty |
| No Children | 24 (100.0%) | 0 (0.0%) |
| 1 or 2 Children | 1 (50.0%) | 1 (50.0%) |
| 3 or 4 Children | 0 (0.0%) | 0 (0.0%) |
| 5 or more Children | 0 (0.0%) | 0 (0.0%) |
| Total | 25 (96.2%) | 1 (3.8%) |
Income Below Poverty Among Single-Parent Households in Trego
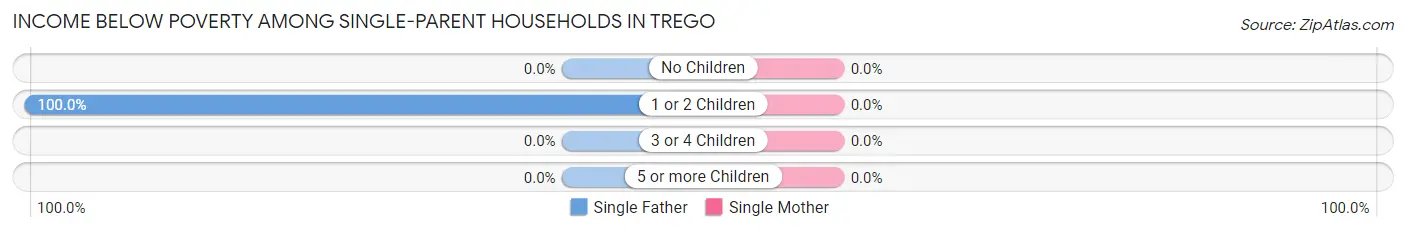
| Children | Single Father | Single Mother |
| No Children | 0 (0.0%) | 0 (0.0%) |
| 1 or 2 Children | 7 (100.0%) | 0 (0.0%) |
| 3 or 4 Children | 0 (0.0%) | 0 (0.0%) |
| 5 or more Children | 0 (0.0%) | 0 (0.0%) |
| Total | 7 (100.0%) | 0 (0.0%) |
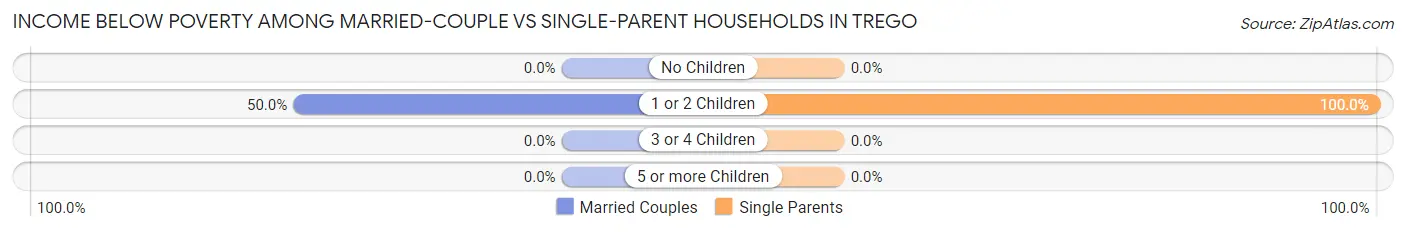
Income Below Poverty Among Married-Couple vs Single-Parent Households in Trego
The poverty data for Trego shows that 1 of the married-couple family households (3.8%) and 7 of the single-parent households (100.0%) are living below the poverty level. Within the married-couple family households, those with 1 or 2 children have the highest poverty rate, with 1 households (50.0%) falling below the poverty line. Among the single-parent households, those with 1 or 2 children have the highest poverty rate, with 7 household (100.0%) living below poverty.
| Children | Married-Couple Families | Single-Parent Households |
| No Children | 0 (0.0%) | 0 (0.0%) |
| 1 or 2 Children | 1 (50.0%) | 7 (100.0%) |
| 3 or 4 Children | 0 (0.0%) | 0 (0.0%) |
| 5 or more Children | 0 (0.0%) | 0 (0.0%) |
| Total | 1 (3.8%) | 7 (100.0%) |
Employment Characteristics in Trego
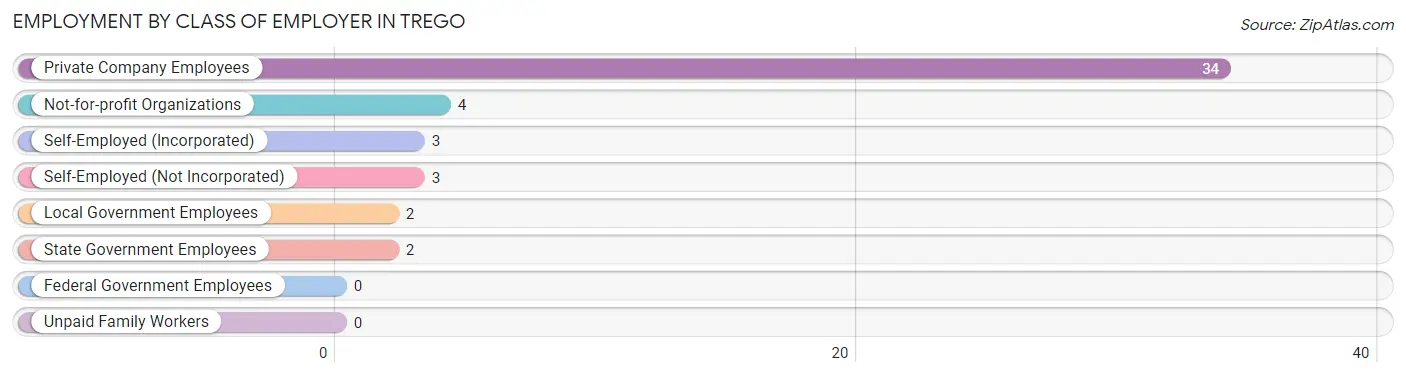
Employment by Class of Employer in Trego
Among the 48 employed individuals in Trego, private company employees (34 | 70.8%), not-for-profit organizations (4 | 8.3%), and self-employed (incorporated) (3 | 6.2%) make up the most common classes of employment.
| Employer Class | # Employees | % Employees |
| Private Company Employees | 34 | 70.8% |
| Self-Employed (Incorporated) | 3 | 6.2% |
| Self-Employed (Not Incorporated) | 3 | 6.2% |
| Not-for-profit Organizations | 4 | 8.3% |
| Local Government Employees | 2 | 4.2% |
| State Government Employees | 2 | 4.2% |
| Federal Government Employees | 0 | 0.0% |
| Unpaid Family Workers | 0 | 0.0% |
| Total | 48 | 100.0% |
Employment Status by Age in Trego
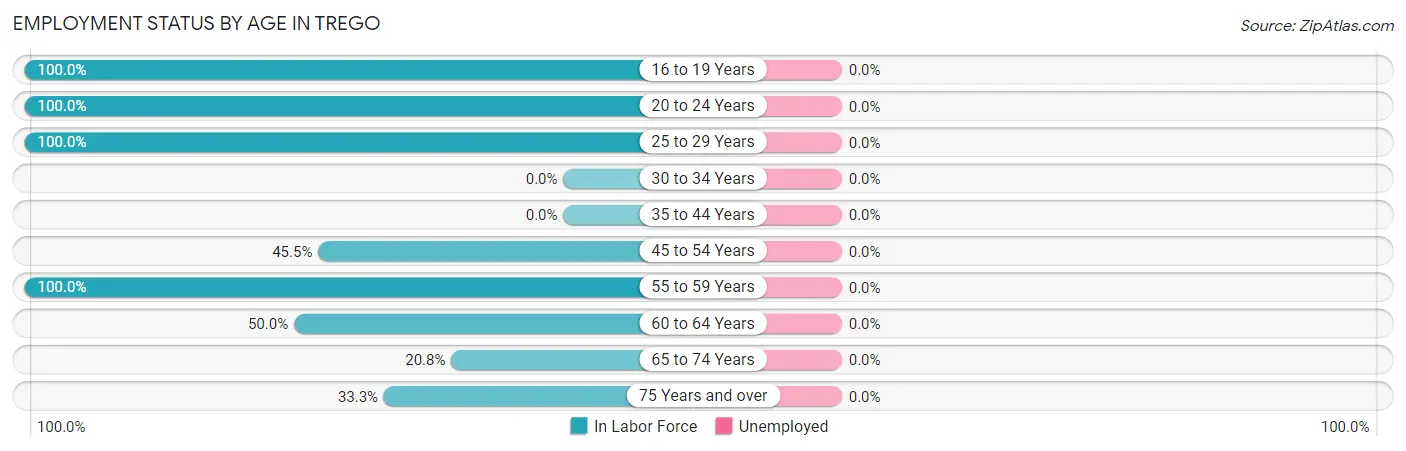
| Age Bracket | In Labor Force | Unemployed |
| 16 to 19 Years | 4 (100.0%) | 0 (0.0%) |
| 20 to 24 Years | 4 (100.0%) | 0 (0.0%) |
| 25 to 29 Years | 4 (100.0%) | 0 (0.0%) |
| 30 to 34 Years | 0 (0.0%) | 0 (0.0%) |
| 35 to 44 Years | 0 (0.0%) | 0 (0.0%) |
| 45 to 54 Years | 5 (45.5%) | 0 (0.0%) |
| 55 to 59 Years | 18 (100.0%) | 0 (0.0%) |
| 60 to 64 Years | 6 (50.0%) | 0 (0.0%) |
| 65 to 74 Years | 5 (20.8%) | 0 (0.0%) |
| 75 Years and over | 2 (33.3%) | 0 (0.0%) |
| Total | 48 (57.1%) | 0 (0.0%) |
Employment Status by Educational Attainment in Trego
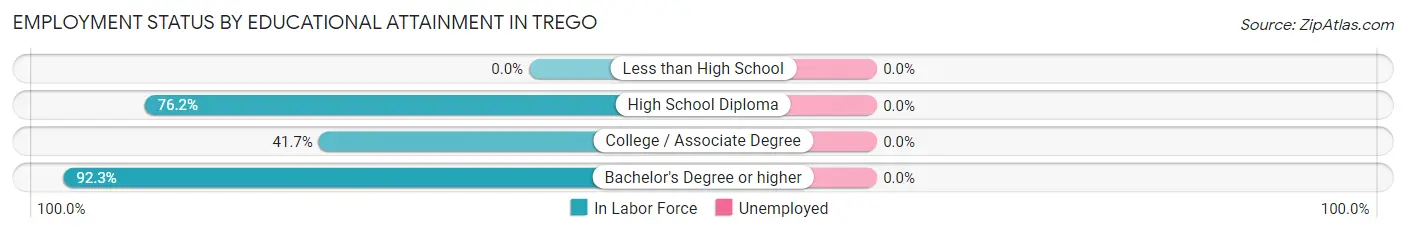
| Educational Attainment | In Labor Force | Unemployed |
| Less than High School | 0 (0.0%) | 0 (0.0%) |
| High School Diploma | 16 (76.2%) | 0 (0.0%) |
| College / Associate Degree | 5 (41.7%) | 0 (0.0%) |
| Bachelor's Degree or higher | 12 (92.3%) | 0 (0.0%) |
| Total | 33 (71.7%) | 0 (0.0%) |
Employment Occupations by Sex in Trego
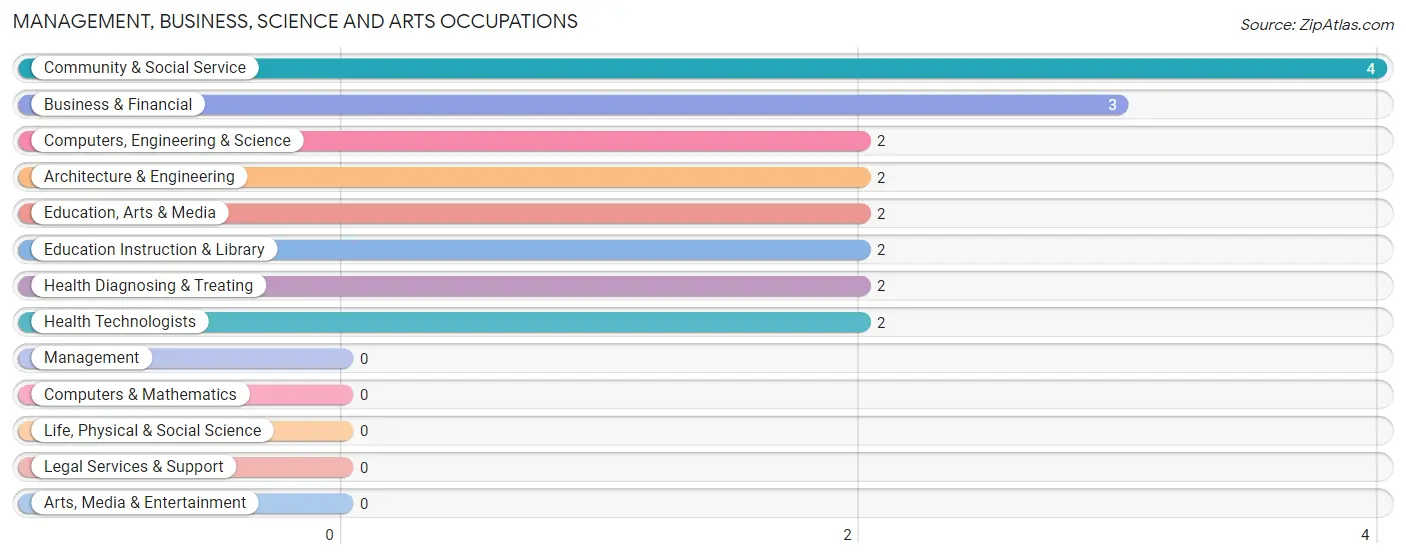
Management, Business, Science and Arts Occupations
The most common Management, Business, Science and Arts occupations in Trego are Community & Social Service (4 | 8.3%), Business & Financial (3 | 6.2%), Computers, Engineering & Science (2 | 4.2%), Architecture & Engineering (2 | 4.2%), and Education, Arts & Media (2 | 4.2%).
Management, Business, Science and Arts Occupations by Sex
Within the Management, Business, Science and Arts occupations in Trego, the most male-oriented occupations are Computers, Engineering & Science (100.0%), Architecture & Engineering (100.0%), and Community & Social Service (100.0%), while the most female-oriented occupations are Business & Financial (100.0%), Health Diagnosing & Treating (100.0%), and Health Technologists (100.0%).
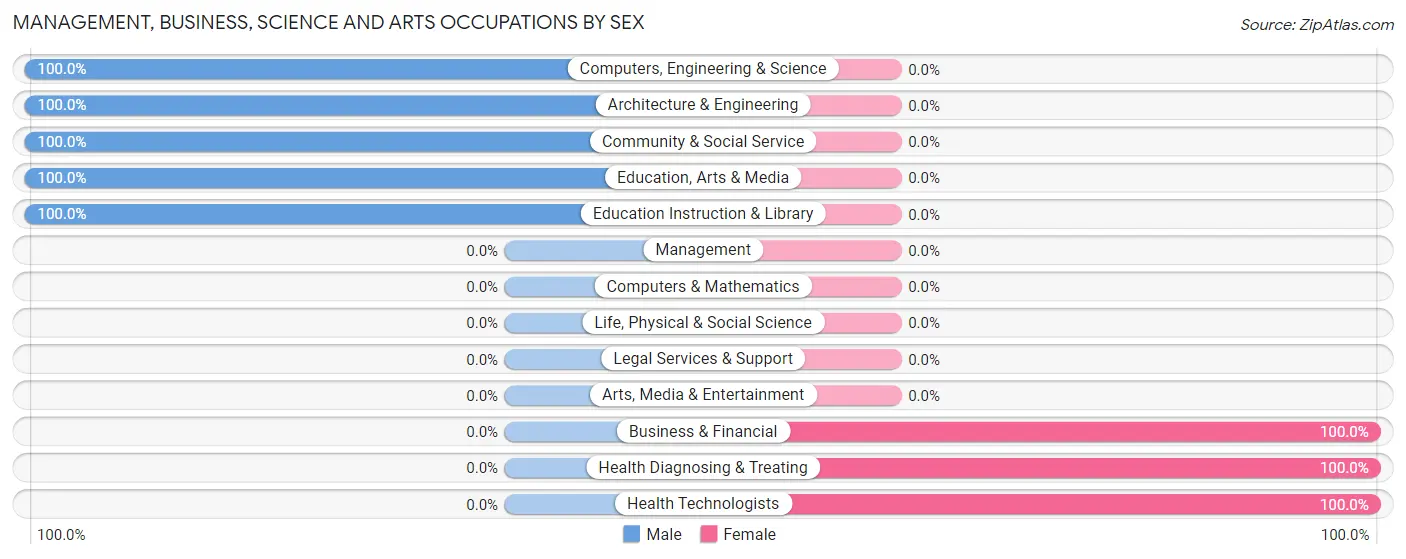
| Occupation | Male | Female |
| Management | 0 (0.0%) | 0 (0.0%) |
| Business & Financial | 0 (0.0%) | 3 (100.0%) |
| Computers, Engineering & Science | 2 (100.0%) | 0 (0.0%) |
| Computers & Mathematics | 0 (0.0%) | 0 (0.0%) |
| Architecture & Engineering | 2 (100.0%) | 0 (0.0%) |
| Life, Physical & Social Science | 0 (0.0%) | 0 (0.0%) |
| Community & Social Service | 4 (100.0%) | 0 (0.0%) |
| Education, Arts & Media | 2 (100.0%) | 0 (0.0%) |
| Legal Services & Support | 0 (0.0%) | 0 (0.0%) |
| Education Instruction & Library | 2 (100.0%) | 0 (0.0%) |
| Arts, Media & Entertainment | 0 (0.0%) | 0 (0.0%) |
| Health Diagnosing & Treating | 0 (0.0%) | 2 (100.0%) |
| Health Technologists | 0 (0.0%) | 2 (100.0%) |
| Total (Category) | 6 (54.5%) | 5 (45.5%) |
| Total (Overall) | 33 (68.8%) | 15 (31.2%) |
Services Occupations
The most common Services occupations in Trego are Food Preparation & Serving (3 | 6.2%), and Cleaning & Maintenance (3 | 6.2%).
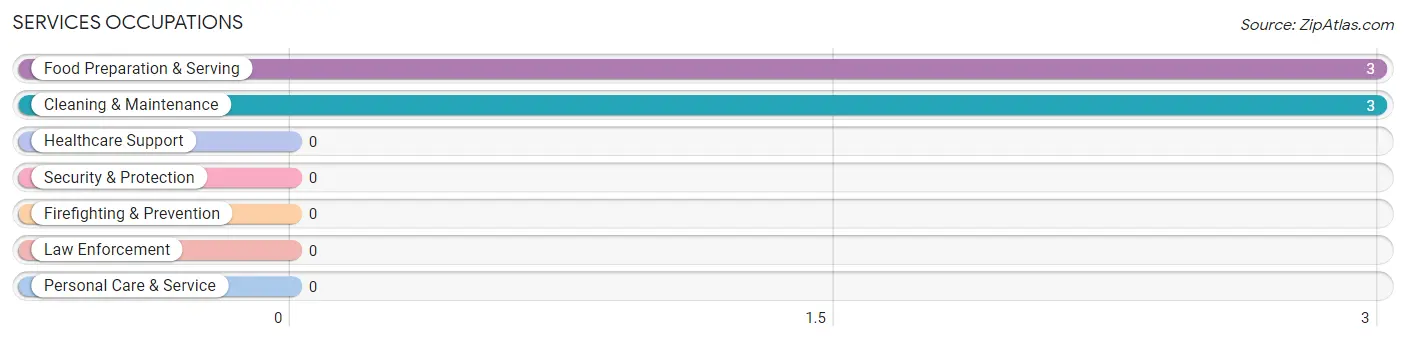
Services Occupations by Sex
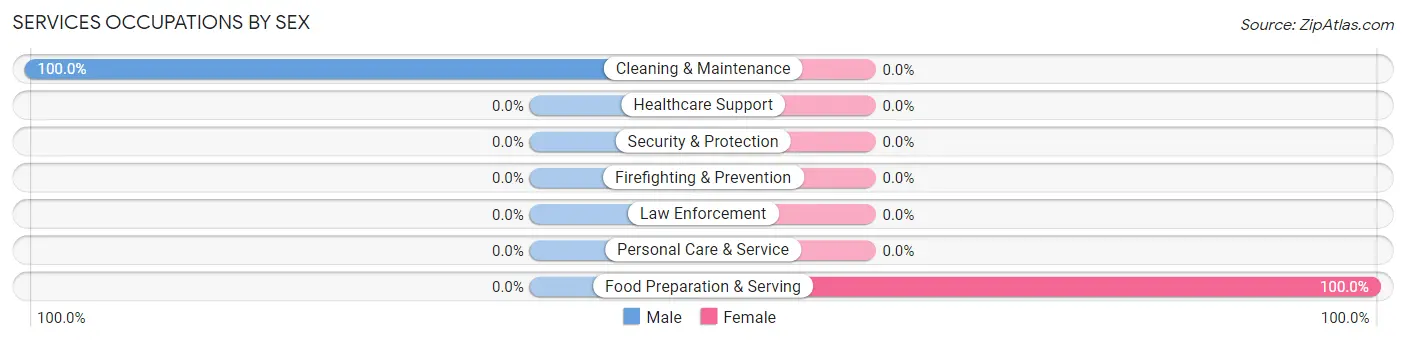
| Occupation | Male | Female |
| Healthcare Support | 0 (0.0%) | 0 (0.0%) |
| Security & Protection | 0 (0.0%) | 0 (0.0%) |
| Firefighting & Prevention | 0 (0.0%) | 0 (0.0%) |
| Law Enforcement | 0 (0.0%) | 0 (0.0%) |
| Food Preparation & Serving | 0 (0.0%) | 3 (100.0%) |
| Cleaning & Maintenance | 3 (100.0%) | 0 (0.0%) |
| Personal Care & Service | 0 (0.0%) | 0 (0.0%) |
| Total (Category) | 3 (50.0%) | 3 (50.0%) |
| Total (Overall) | 33 (68.8%) | 15 (31.2%) |
Sales and Office Occupations
The most common Sales and Office occupations in Trego are Office & Administration (9 | 18.8%), and Sales & Related (7 | 14.6%).
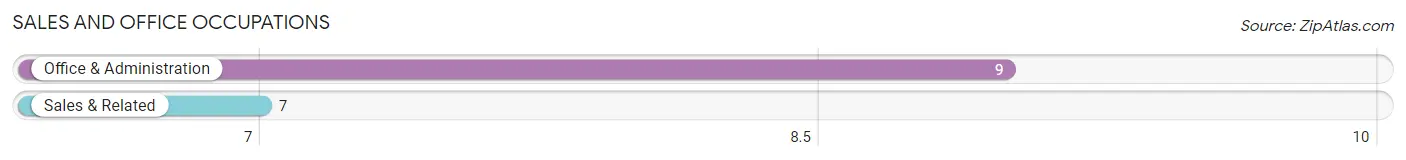
Sales and Office Occupations by Sex

| Occupation | Male | Female |
| Sales & Related | 7 (100.0%) | 0 (0.0%) |
| Office & Administration | 2 (22.2%) | 7 (77.8%) |
| Total (Category) | 9 (56.2%) | 7 (43.8%) |
| Total (Overall) | 33 (68.8%) | 15 (31.2%) |
Natural Resources, Construction and Maintenance Occupations
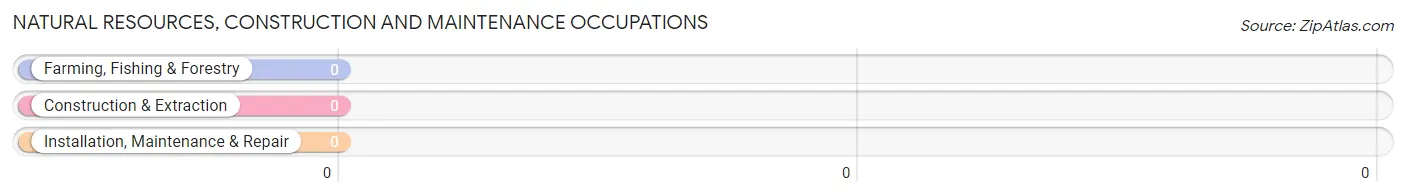
Natural Resources, Construction and Maintenance Occupations by Sex
| Occupation | Male | Female |
| Farming, Fishing & Forestry | 0 (0.0%) | 0 (0.0%) |
| Construction & Extraction | 0 (0.0%) | 0 (0.0%) |
| Installation, Maintenance & Repair | 0 (0.0%) | 0 (0.0%) |
| Total (Category) | 0 (0.0%) | 0 (0.0%) |
| Total (Overall) | 33 (68.8%) | 15 (31.2%) |
Production, Transportation and Moving Occupations
The most common Production, Transportation and Moving occupations in Trego are Production (12 | 25.0%), and Transportation (3 | 6.2%).
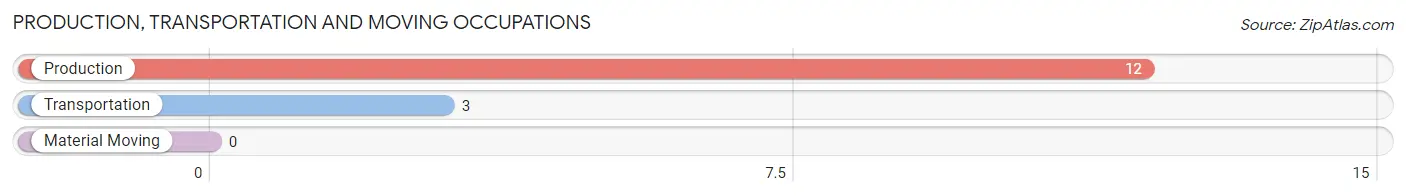
Production, Transportation and Moving Occupations by Sex
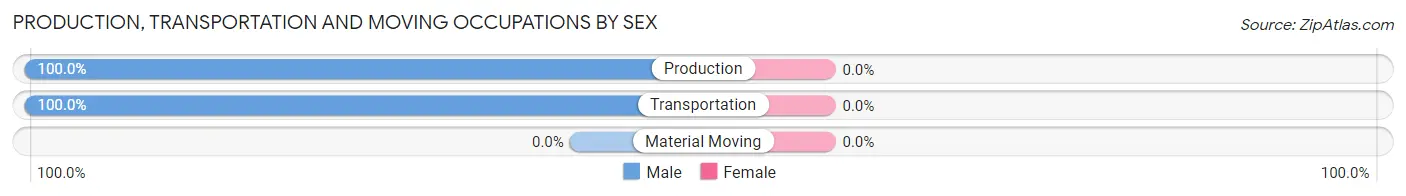
| Occupation | Male | Female |
| Production | 12 (100.0%) | 0 (0.0%) |
| Transportation | 3 (100.0%) | 0 (0.0%) |
| Material Moving | 0 (0.0%) | 0 (0.0%) |
| Total (Category) | 15 (100.0%) | 0 (0.0%) |
| Total (Overall) | 33 (68.8%) | 15 (31.2%) |
Employment Industries by Sex in Trego
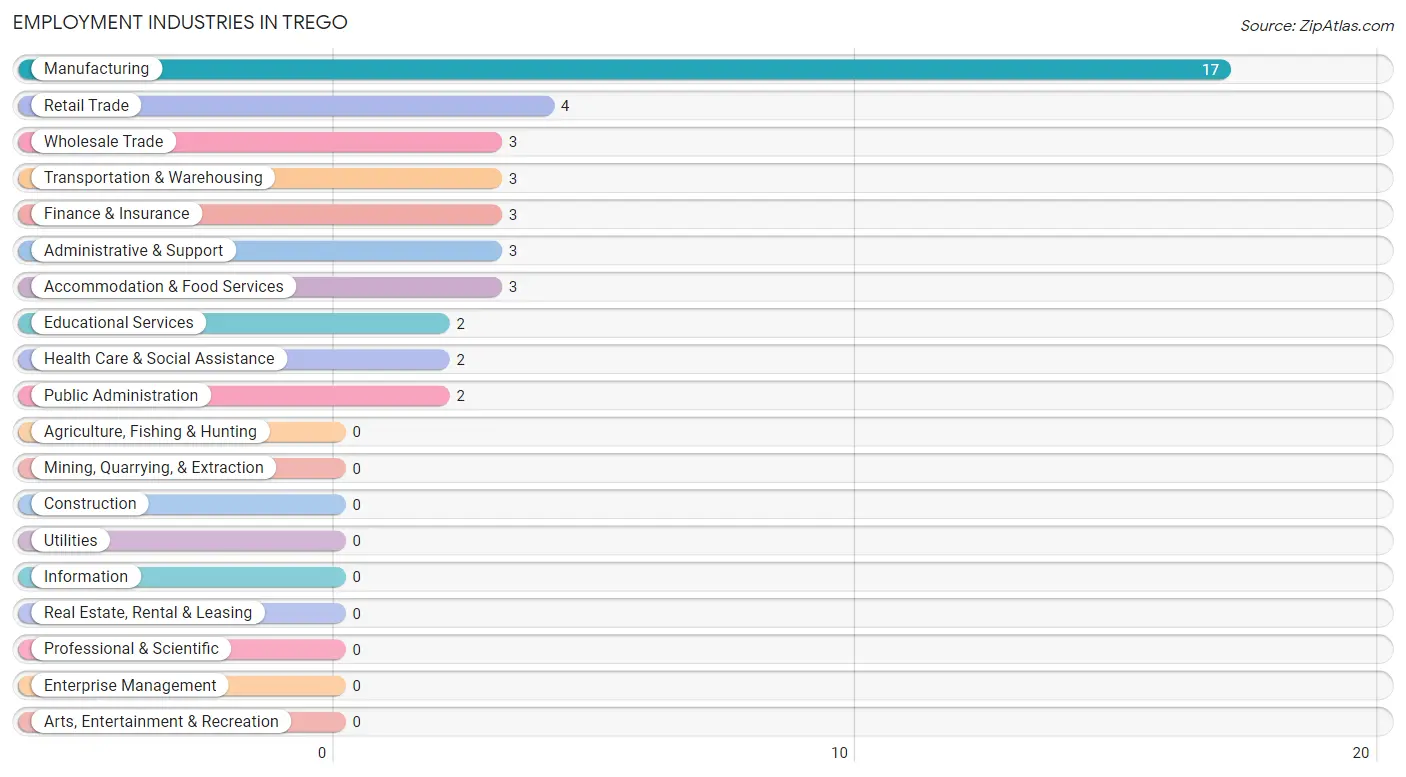
Employment Industries in Trego
The major employment industries in Trego include Manufacturing (17 | 35.4%), Retail Trade (4 | 8.3%), Wholesale Trade (3 | 6.2%), Transportation & Warehousing (3 | 6.2%), and Finance & Insurance (3 | 6.2%).
Employment Industries by Sex in Trego
The Trego industries that see more men than women are Manufacturing (100.0%), Retail Trade (100.0%), and Transportation & Warehousing (100.0%), whereas the industries that tend to have a higher number of women are Wholesale Trade (100.0%), Finance & Insurance (100.0%), and Health Care & Social Assistance (100.0%).
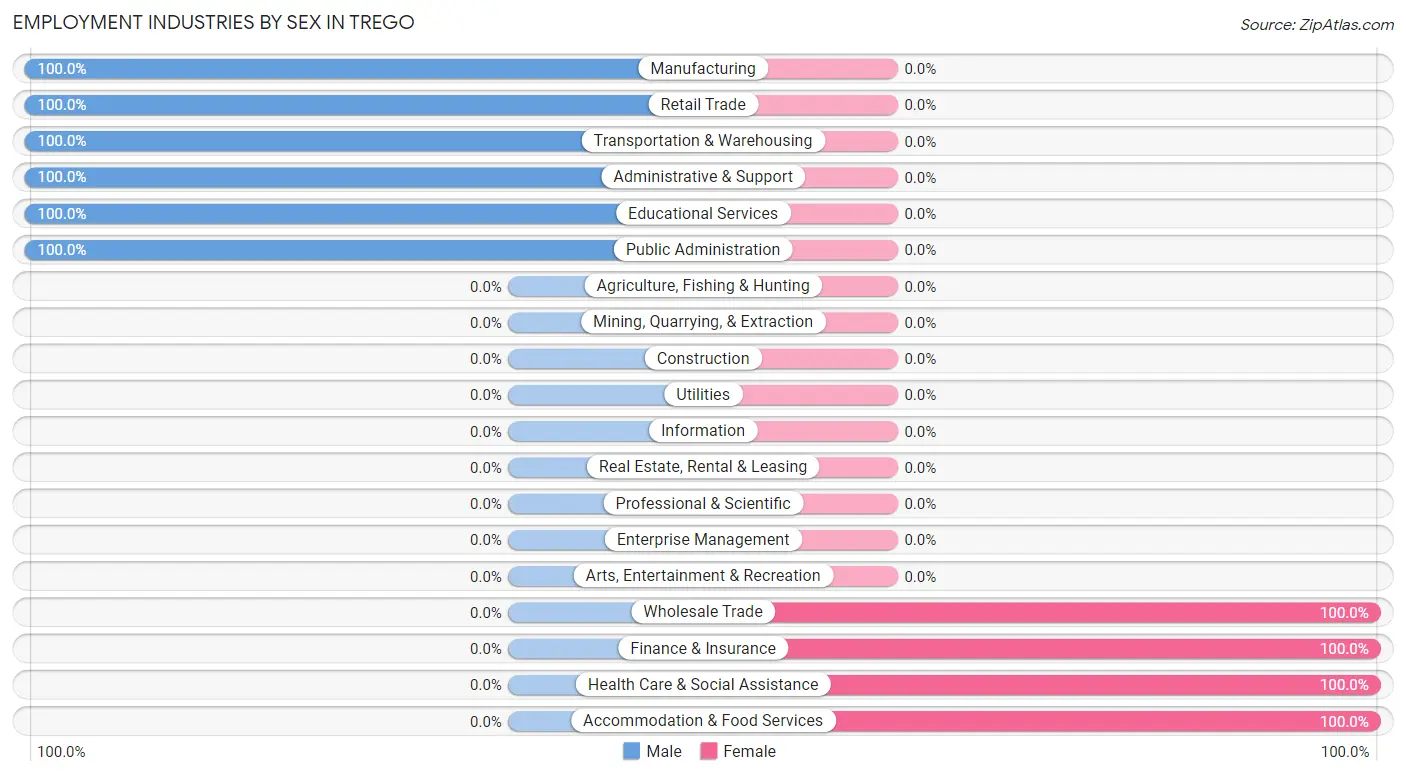
| Industry | Male | Female |
| Agriculture, Fishing & Hunting | 0 (0.0%) | 0 (0.0%) |
| Mining, Quarrying, & Extraction | 0 (0.0%) | 0 (0.0%) |
| Construction | 0 (0.0%) | 0 (0.0%) |
| Manufacturing | 17 (100.0%) | 0 (0.0%) |
| Wholesale Trade | 0 (0.0%) | 3 (100.0%) |
| Retail Trade | 4 (100.0%) | 0 (0.0%) |
| Transportation & Warehousing | 3 (100.0%) | 0 (0.0%) |
| Utilities | 0 (0.0%) | 0 (0.0%) |
| Information | 0 (0.0%) | 0 (0.0%) |
| Finance & Insurance | 0 (0.0%) | 3 (100.0%) |
| Real Estate, Rental & Leasing | 0 (0.0%) | 0 (0.0%) |
| Professional & Scientific | 0 (0.0%) | 0 (0.0%) |
| Enterprise Management | 0 (0.0%) | 0 (0.0%) |
| Administrative & Support | 3 (100.0%) | 0 (0.0%) |
| Educational Services | 2 (100.0%) | 0 (0.0%) |
| Health Care & Social Assistance | 0 (0.0%) | 2 (100.0%) |
| Arts, Entertainment & Recreation | 0 (0.0%) | 0 (0.0%) |
| Accommodation & Food Services | 0 (0.0%) | 3 (100.0%) |
| Public Administration | 2 (100.0%) | 0 (0.0%) |
| Total | 33 (68.8%) | 15 (31.2%) |
Education in Trego
School Enrollment in Trego
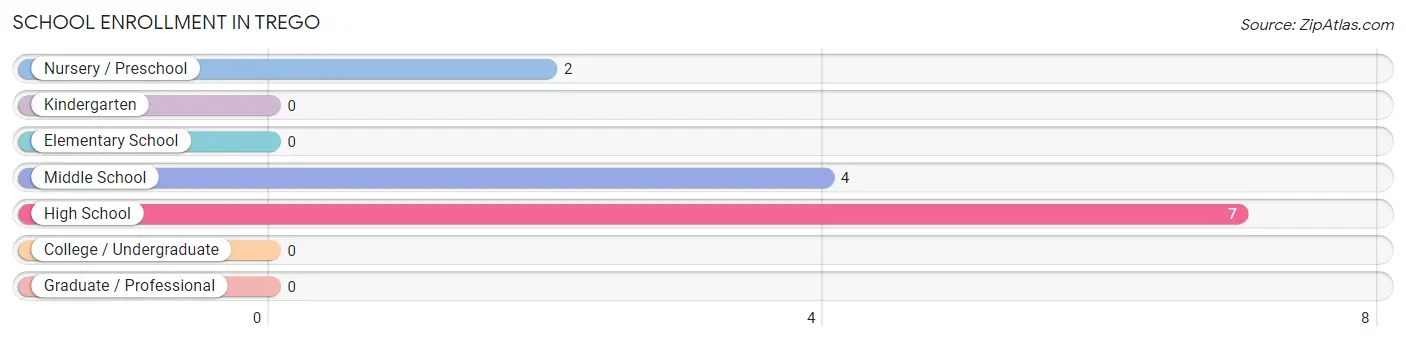
The most common levels of schooling among the 13 students in Trego are high school (7 | 53.8%), middle school (4 | 30.8%), and nursery / preschool (2 | 15.4%).
| School Level | # Students | % Students |
| Nursery / Preschool | 2 | 15.4% |
| Kindergarten | 0 | 0.0% |
| Elementary School | 0 | 0.0% |
| Middle School | 4 | 30.8% |
| High School | 7 | 53.8% |
| College / Undergraduate | 0 | 0.0% |
| Graduate / Professional | 0 | 0.0% |
| Total | 13 | 100.0% |
School Enrollment by Age by Funding Source in Trego
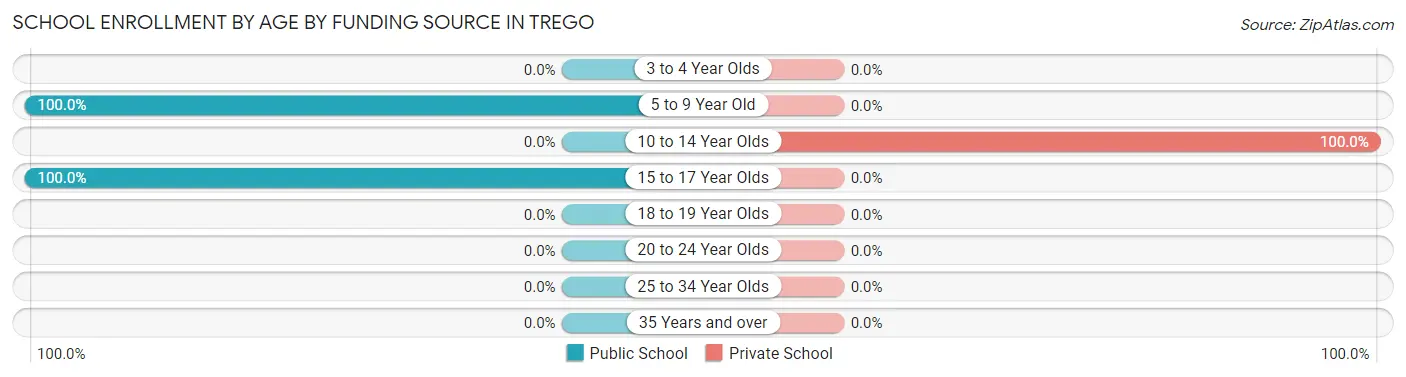
Out of a total of 13 students who are enrolled in schools in Trego, 4 (30.8%) attend a private institution, while the remaining 9 (69.2%) are enrolled in public schools. The age group of 10 to 14 year olds has the highest likelihood of being enrolled in private schools, with 4 (100.0% in the age bracket) enrolled. Conversely, the age group of 5 to 9 year old has the lowest likelihood of being enrolled in a private school, with 2 (100.0% in the age bracket) attending a public institution.
| Age Bracket | Public School | Private School |
| 3 to 4 Year Olds | 0 (0.0%) | 0 (0.0%) |
| 5 to 9 Year Old | 2 (100.0%) | 0 (0.0%) |
| 10 to 14 Year Olds | 0 (0.0%) | 4 (100.0%) |
| 15 to 17 Year Olds | 7 (100.0%) | 0 (0.0%) |
| 18 to 19 Year Olds | 0 (0.0%) | 0 (0.0%) |
| 20 to 24 Year Olds | 0 (0.0%) | 0 (0.0%) |
| 25 to 34 Year Olds | 0 (0.0%) | 0 (0.0%) |
| 35 Years and over | 0 (0.0%) | 0 (0.0%) |
| Total | 9 (69.2%) | 4 (30.8%) |
Educational Attainment by Field of Study in Trego
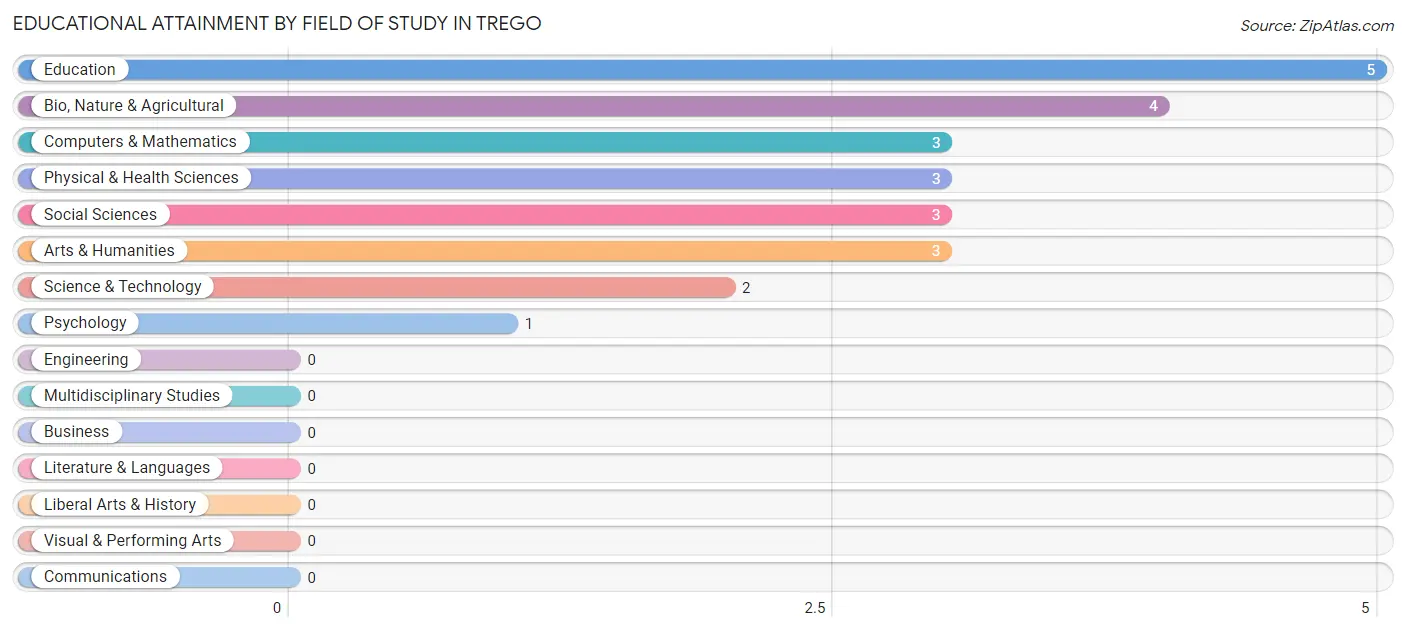
Education (5 | 20.8%), bio, nature & agricultural (4 | 16.7%), computers & mathematics (3 | 12.5%), physical & health sciences (3 | 12.5%), and social sciences (3 | 12.5%) are the most common fields of study among 24 individuals in Trego who have obtained a bachelor's degree or higher.
| Field of Study | # Graduates | % Graduates |
| Computers & Mathematics | 3 | 12.5% |
| Bio, Nature & Agricultural | 4 | 16.7% |
| Physical & Health Sciences | 3 | 12.5% |
| Psychology | 1 | 4.2% |
| Social Sciences | 3 | 12.5% |
| Engineering | 0 | 0.0% |
| Multidisciplinary Studies | 0 | 0.0% |
| Science & Technology | 2 | 8.3% |
| Business | 0 | 0.0% |
| Education | 5 | 20.8% |
| Literature & Languages | 0 | 0.0% |
| Liberal Arts & History | 0 | 0.0% |
| Visual & Performing Arts | 0 | 0.0% |
| Communications | 0 | 0.0% |
| Arts & Humanities | 3 | 12.5% |
| Total | 24 | 100.0% |
Transportation & Commute in Trego
Vehicle Availability by Sex in Trego
The most prevalent vehicle ownership categories in Trego are males with 2 vehicles (20, accounting for 60.6%) and females with 2 vehicles (8, making up 133.3%).
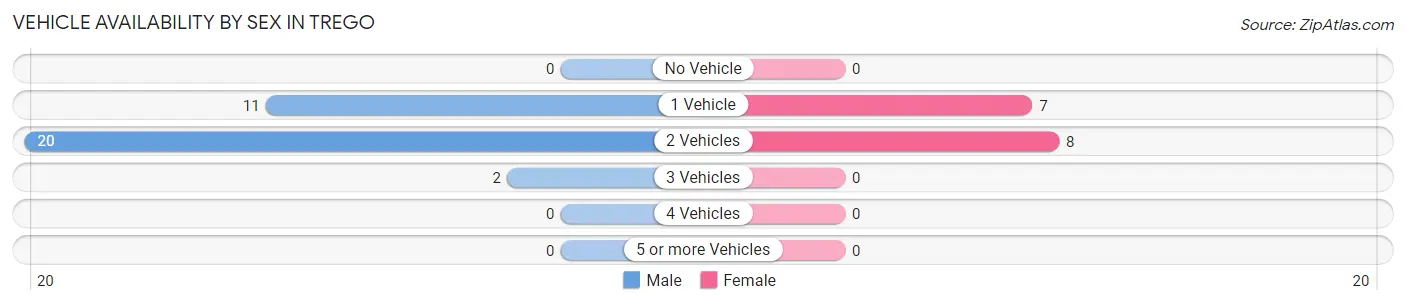
| Vehicles Available | Male | Female |
| No Vehicle | 0 (0.0%) | 0 (0.0%) |
| 1 Vehicle | 11 (33.3%) | 7 (46.7%) |
| 2 Vehicles | 20 (60.6%) | 8 (53.3%) |
| 3 Vehicles | 2 (6.1%) | 0 (0.0%) |
| 4 Vehicles | 0 (0.0%) | 0 (0.0%) |
| 5 or more Vehicles | 0 (0.0%) | 0 (0.0%) |
| Total | 33 (100.0%) | 15 (100.0%) |
Commute Time in Trego
The most frequently occuring commute durations in Trego are 5 to 9 minutes (10 commuters, 25.0%), 30 to 34 minutes (7 commuters, 17.5%), and 10 to 14 minutes (6 commuters, 15.0%).
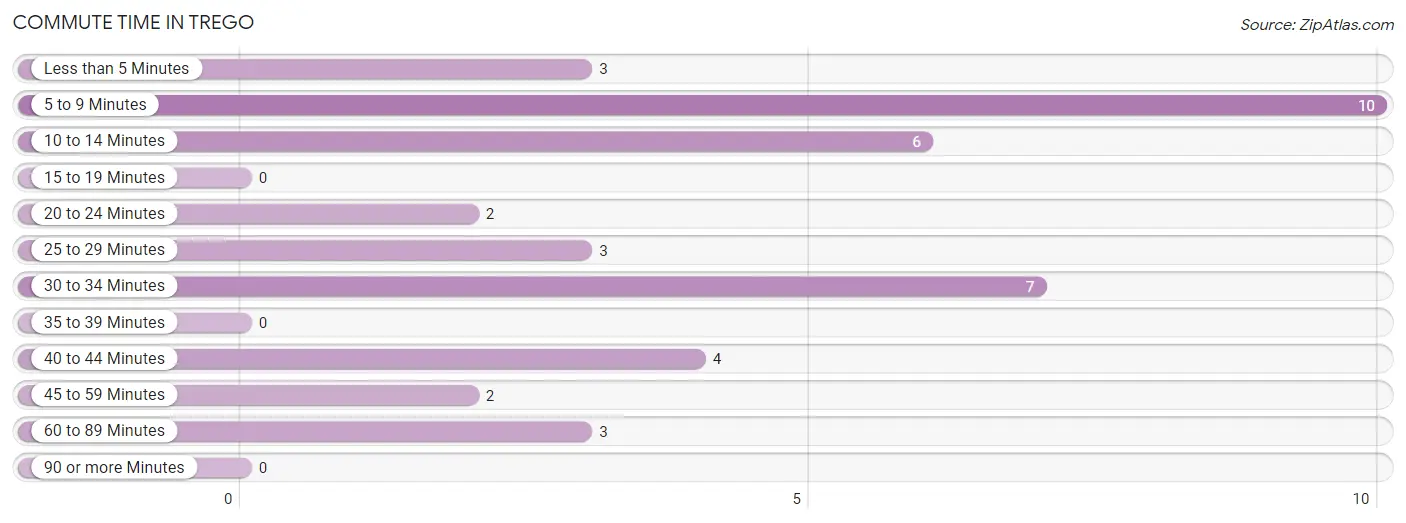
| Commute Time | # Commuters | % Commuters |
| Less than 5 Minutes | 3 | 7.5% |
| 5 to 9 Minutes | 10 | 25.0% |
| 10 to 14 Minutes | 6 | 15.0% |
| 15 to 19 Minutes | 0 | 0.0% |
| 20 to 24 Minutes | 2 | 5.0% |
| 25 to 29 Minutes | 3 | 7.5% |
| 30 to 34 Minutes | 7 | 17.5% |
| 35 to 39 Minutes | 0 | 0.0% |
| 40 to 44 Minutes | 4 | 10.0% |
| 45 to 59 Minutes | 2 | 5.0% |
| 60 to 89 Minutes | 3 | 7.5% |
| 90 or more Minutes | 0 | 0.0% |
Commute Time by Sex in Trego
The most common commute times in Trego are 30 to 34 minutes (7 commuters, 25.0%) for males and 5 to 9 minutes (10 commuters, 83.3%) for females.
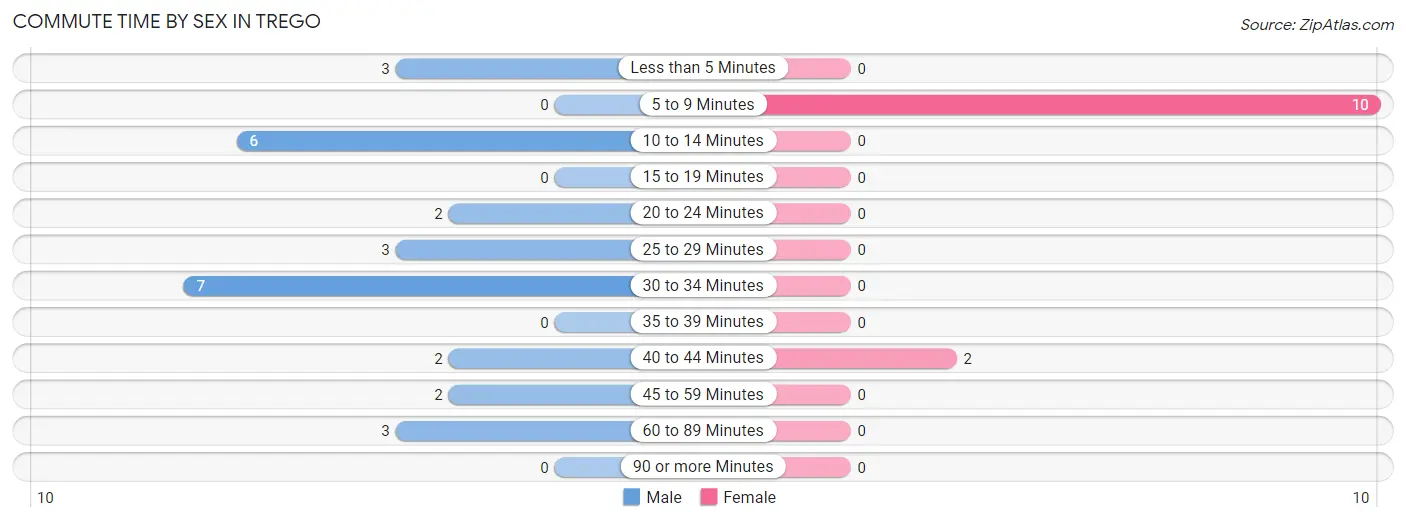
| Commute Time | Male | Female |
| Less than 5 Minutes | 3 (10.7%) | 0 (0.0%) |
| 5 to 9 Minutes | 0 (0.0%) | 10 (83.3%) |
| 10 to 14 Minutes | 6 (21.4%) | 0 (0.0%) |
| 15 to 19 Minutes | 0 (0.0%) | 0 (0.0%) |
| 20 to 24 Minutes | 2 (7.1%) | 0 (0.0%) |
| 25 to 29 Minutes | 3 (10.7%) | 0 (0.0%) |
| 30 to 34 Minutes | 7 (25.0%) | 0 (0.0%) |
| 35 to 39 Minutes | 0 (0.0%) | 0 (0.0%) |
| 40 to 44 Minutes | 2 (7.1%) | 2 (16.7%) |
| 45 to 59 Minutes | 2 (7.1%) | 0 (0.0%) |
| 60 to 89 Minutes | 3 (10.7%) | 0 (0.0%) |
| 90 or more Minutes | 0 (0.0%) | 0 (0.0%) |
Time of Departure to Work by Sex in Trego
The most frequent times of departure to work in Trego are 8:30 AM to 8:59 AM (9, 32.1%) for males and 7:30 AM to 7:59 AM (4, 33.3%) for females.
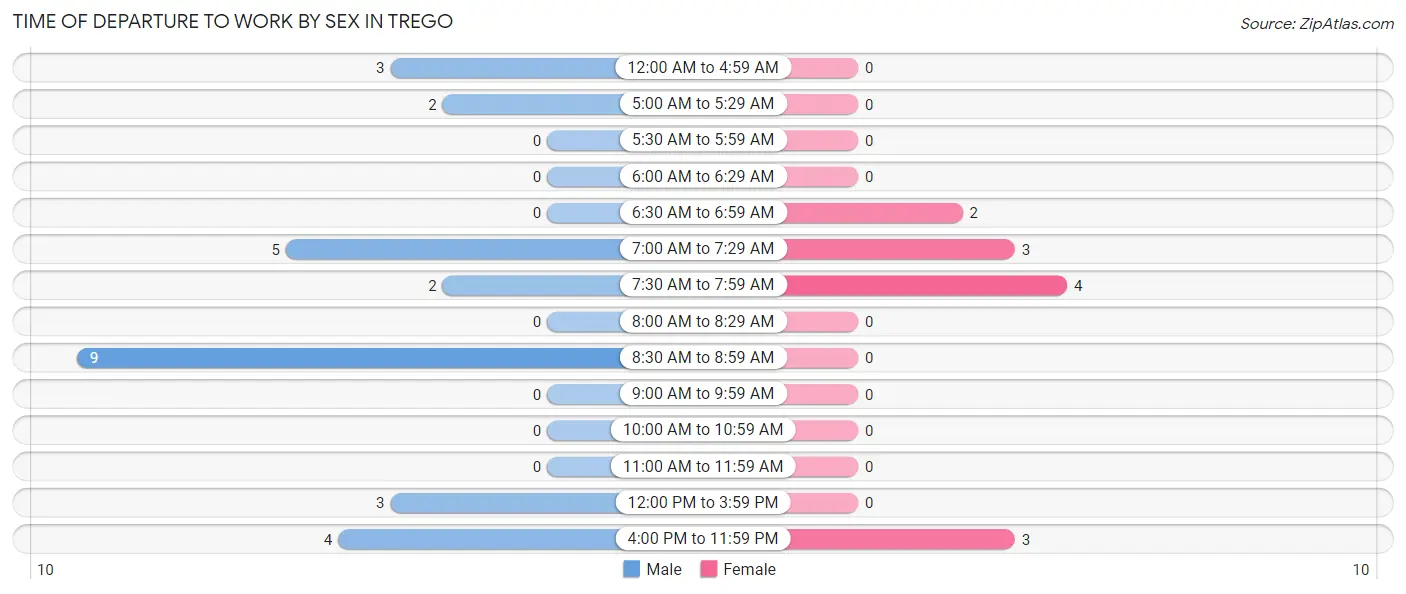
| Time of Departure | Male | Female |
| 12:00 AM to 4:59 AM | 3 (10.7%) | 0 (0.0%) |
| 5:00 AM to 5:29 AM | 2 (7.1%) | 0 (0.0%) |
| 5:30 AM to 5:59 AM | 0 (0.0%) | 0 (0.0%) |
| 6:00 AM to 6:29 AM | 0 (0.0%) | 0 (0.0%) |
| 6:30 AM to 6:59 AM | 0 (0.0%) | 2 (16.7%) |
| 7:00 AM to 7:29 AM | 5 (17.9%) | 3 (25.0%) |
| 7:30 AM to 7:59 AM | 2 (7.1%) | 4 (33.3%) |
| 8:00 AM to 8:29 AM | 0 (0.0%) | 0 (0.0%) |
| 8:30 AM to 8:59 AM | 9 (32.1%) | 0 (0.0%) |
| 9:00 AM to 9:59 AM | 0 (0.0%) | 0 (0.0%) |
| 10:00 AM to 10:59 AM | 0 (0.0%) | 0 (0.0%) |
| 11:00 AM to 11:59 AM | 0 (0.0%) | 0 (0.0%) |
| 12:00 PM to 3:59 PM | 3 (10.7%) | 0 (0.0%) |
| 4:00 PM to 11:59 PM | 4 (14.3%) | 3 (25.0%) |
| Total | 28 (100.0%) | 12 (100.0%) |
Housing Occupancy in Trego
Occupancy by Ownership in Trego
Of the total 49 dwellings in Trego, owner-occupied units account for 44 (89.8%), while renter-occupied units make up 5 (10.2%).
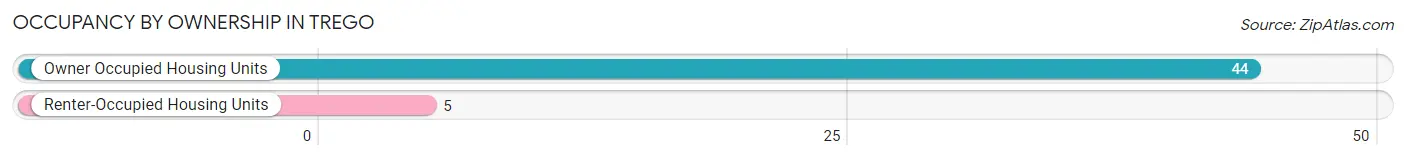
| Occupancy | # Housing Units | % Housing Units |
| Owner Occupied Housing Units | 44 | 89.8% |
| Renter-Occupied Housing Units | 5 | 10.2% |
| Total Occupied Housing Units | 49 | 100.0% |
Occupancy by Household Size in Trego

| Household Size | # Housing Units | % Housing Units |
| 1-Person Household | 16 | 32.7% |
| 2-Person Household | 24 | 49.0% |
| 3-Person Household | 7 | 14.3% |
| 4+ Person Household | 2 | 4.1% |
| Total Housing Units | 49 | 100.0% |
Occupancy by Ownership by Household Size in Trego
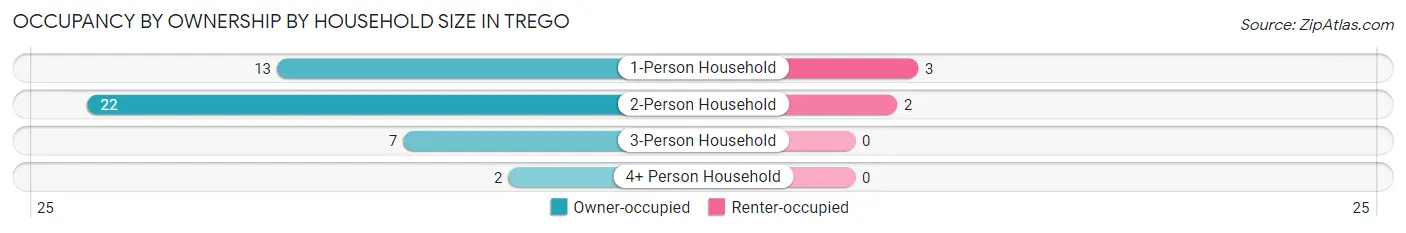
| Household Size | Owner-occupied | Renter-occupied |
| 1-Person Household | 13 (81.2%) | 3 (18.8%) |
| 2-Person Household | 22 (91.7%) | 2 (8.3%) |
| 3-Person Household | 7 (100.0%) | 0 (0.0%) |
| 4+ Person Household | 2 (100.0%) | 0 (0.0%) |
| Total Housing Units | 44 (89.8%) | 5 (10.2%) |
Occupancy by Educational Attainment in Trego
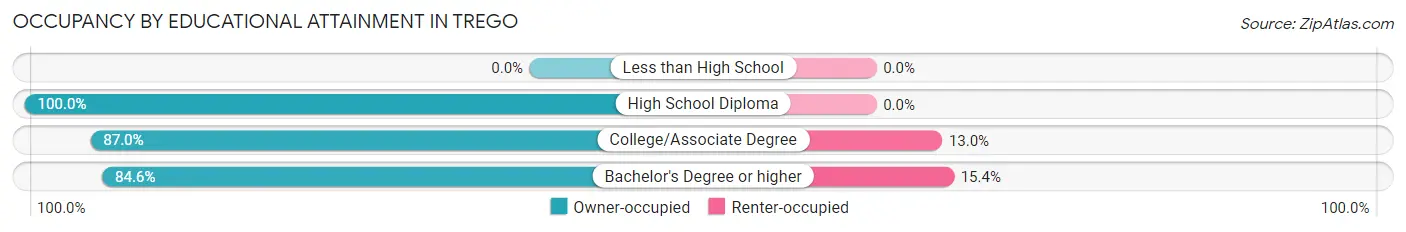
| Household Size | Owner-occupied | Renter-occupied |
| Less than High School | 0 (0.0%) | 0 (0.0%) |
| High School Diploma | 13 (100.0%) | 0 (0.0%) |
| College/Associate Degree | 20 (87.0%) | 3 (13.0%) |
| Bachelor's Degree or higher | 11 (84.6%) | 2 (15.4%) |
Occupancy by Age of Householder in Trego
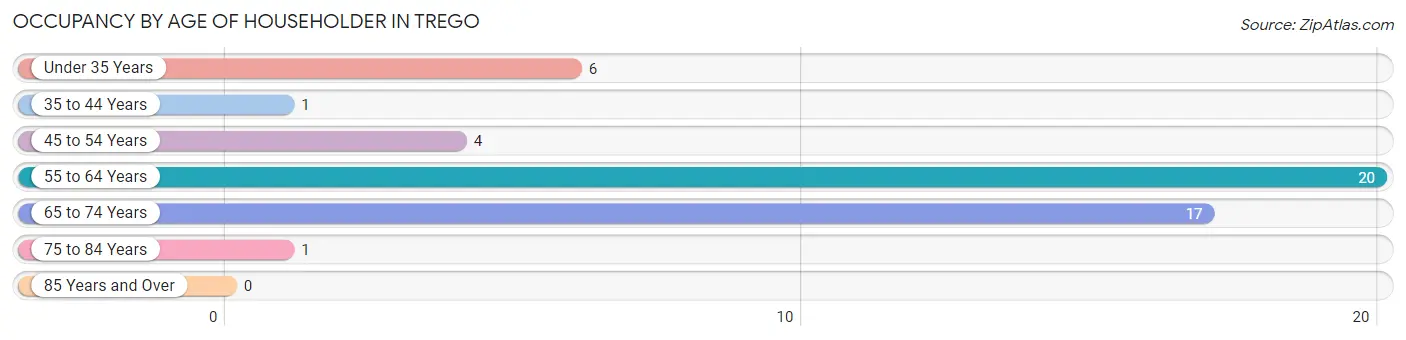
| Age Bracket | # Households | % Households |
| Under 35 Years | 6 | 12.2% |
| 35 to 44 Years | 1 | 2.0% |
| 45 to 54 Years | 4 | 8.2% |
| 55 to 64 Years | 20 | 40.8% |
| 65 to 74 Years | 17 | 34.7% |
| 75 to 84 Years | 1 | 2.0% |
| 85 Years and Over | 0 | 0.0% |
| Total | 49 | 100.0% |
Housing Finances in Trego
Median Income by Occupancy in Trego
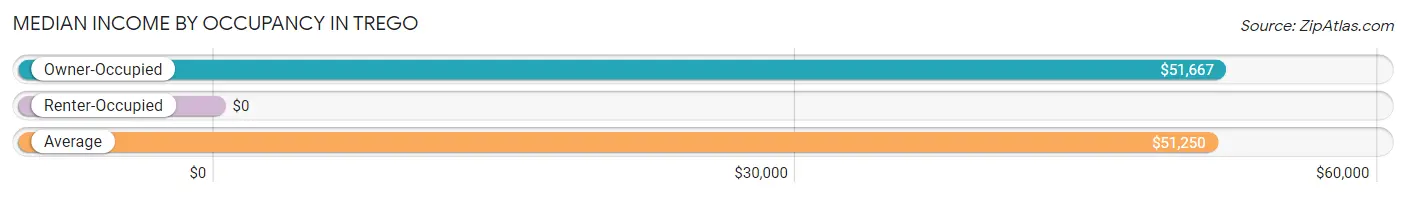
| Occupancy Type | # Households | Median Income |
| Owner-Occupied | 44 (89.8%) | $51,667 |
| Renter-Occupied | 5 (10.2%) | $0 |
| Average | 49 (100.0%) | $51,250 |
Occupancy by Householder Income Bracket in Trego
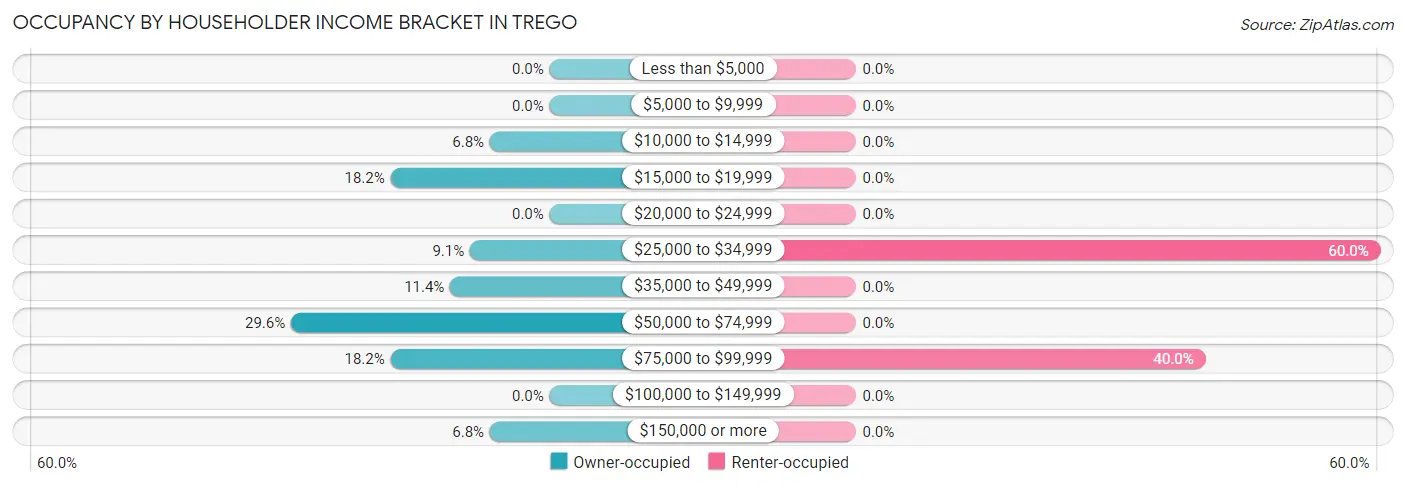
| Income Bracket | Owner-occupied | Renter-occupied |
| Less than $5,000 | 0 (0.0%) | 0 (0.0%) |
| $5,000 to $9,999 | 0 (0.0%) | 0 (0.0%) |
| $10,000 to $14,999 | 3 (6.8%) | 0 (0.0%) |
| $15,000 to $19,999 | 8 (18.2%) | 0 (0.0%) |
| $20,000 to $24,999 | 0 (0.0%) | 0 (0.0%) |
| $25,000 to $34,999 | 4 (9.1%) | 3 (60.0%) |
| $35,000 to $49,999 | 5 (11.4%) | 0 (0.0%) |
| $50,000 to $74,999 | 13 (29.5%) | 0 (0.0%) |
| $75,000 to $99,999 | 8 (18.2%) | 2 (40.0%) |
| $100,000 to $149,999 | 0 (0.0%) | 0 (0.0%) |
| $150,000 or more | 3 (6.8%) | 0 (0.0%) |
| Total | 44 (100.0%) | 5 (100.0%) |
Monthly Housing Cost Tiers in Trego
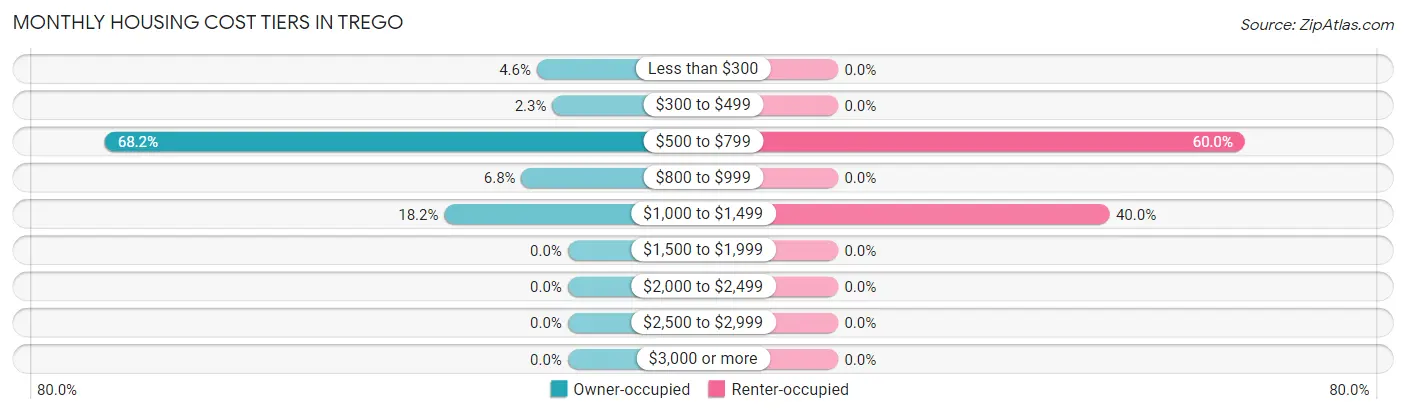
| Monthly Cost | Owner-occupied | Renter-occupied |
| Less than $300 | 2 (4.5%) | 0 (0.0%) |
| $300 to $499 | 1 (2.3%) | 0 (0.0%) |
| $500 to $799 | 30 (68.2%) | 3 (60.0%) |
| $800 to $999 | 3 (6.8%) | 0 (0.0%) |
| $1,000 to $1,499 | 8 (18.2%) | 2 (40.0%) |
| $1,500 to $1,999 | 0 (0.0%) | 0 (0.0%) |
| $2,000 to $2,499 | 0 (0.0%) | 0 (0.0%) |
| $2,500 to $2,999 | 0 (0.0%) | 0 (0.0%) |
| $3,000 or more | 0 (0.0%) | 0 (0.0%) |
| Total | 44 (100.0%) | 5 (100.0%) |
Physical Housing Characteristics in Trego
Housing Structures in Trego
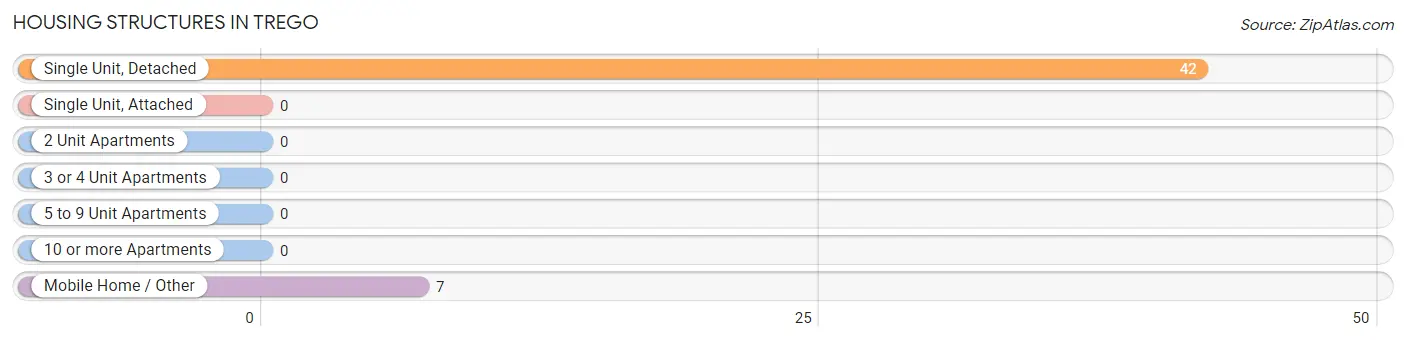
| Structure Type | # Housing Units | % Housing Units |
| Single Unit, Detached | 42 | 85.7% |
| Single Unit, Attached | 0 | 0.0% |
| 2 Unit Apartments | 0 | 0.0% |
| 3 or 4 Unit Apartments | 0 | 0.0% |
| 5 to 9 Unit Apartments | 0 | 0.0% |
| 10 or more Apartments | 0 | 0.0% |
| Mobile Home / Other | 7 | 14.3% |
| Total | 49 | 100.0% |
Housing Structures by Occupancy in Trego
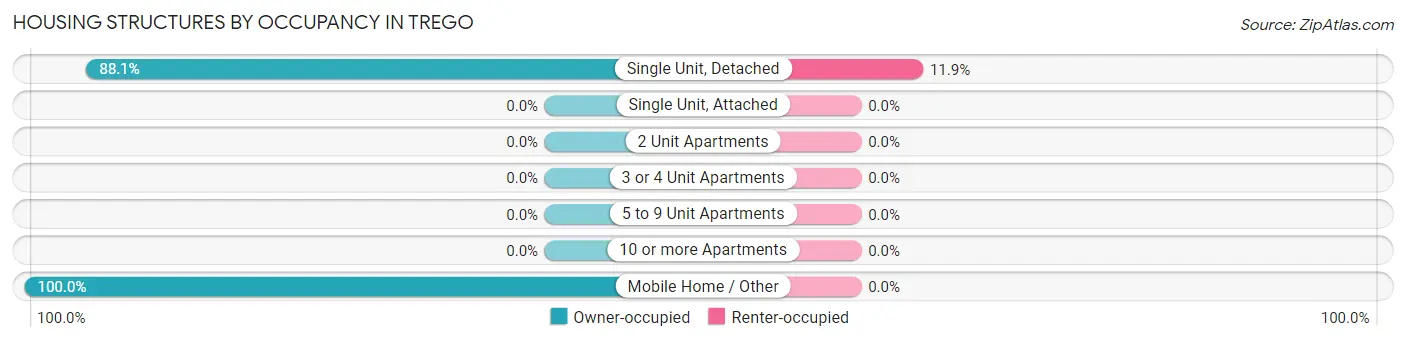
| Structure Type | Owner-occupied | Renter-occupied |
| Single Unit, Detached | 37 (88.1%) | 5 (11.9%) |
| Single Unit, Attached | 0 (0.0%) | 0 (0.0%) |
| 2 Unit Apartments | 0 (0.0%) | 0 (0.0%) |
| 3 or 4 Unit Apartments | 0 (0.0%) | 0 (0.0%) |
| 5 to 9 Unit Apartments | 0 (0.0%) | 0 (0.0%) |
| 10 or more Apartments | 0 (0.0%) | 0 (0.0%) |
| Mobile Home / Other | 7 (100.0%) | 0 (0.0%) |
| Total | 44 (89.8%) | 5 (10.2%) |
Housing Structures by Number of Rooms in Trego
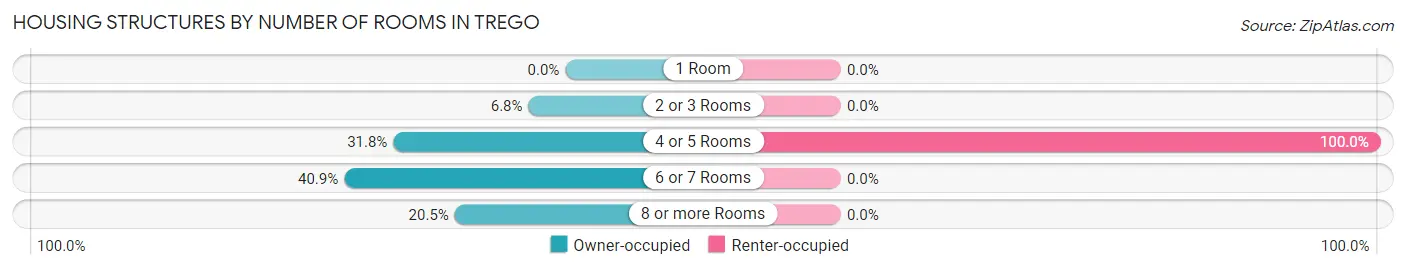
| Number of Rooms | Owner-occupied | Renter-occupied |
| 1 Room | 0 (0.0%) | 0 (0.0%) |
| 2 or 3 Rooms | 3 (6.8%) | 0 (0.0%) |
| 4 or 5 Rooms | 14 (31.8%) | 5 (100.0%) |
| 6 or 7 Rooms | 18 (40.9%) | 0 (0.0%) |
| 8 or more Rooms | 9 (20.4%) | 0 (0.0%) |
| Total | 44 (100.0%) | 5 (100.0%) |
Housing Structure by Heating Type in Trego
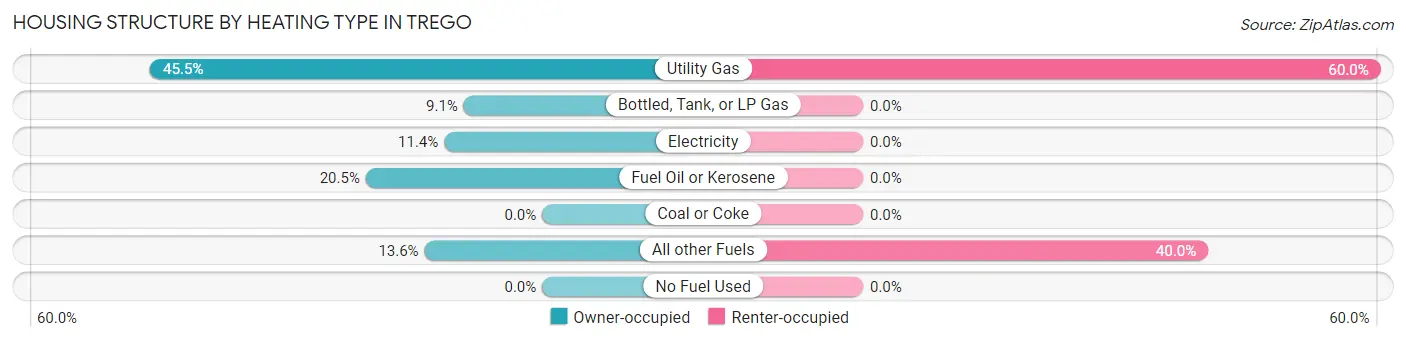
| Heating Type | Owner-occupied | Renter-occupied |
| Utility Gas | 20 (45.5%) | 3 (60.0%) |
| Bottled, Tank, or LP Gas | 4 (9.1%) | 0 (0.0%) |
| Electricity | 5 (11.4%) | 0 (0.0%) |
| Fuel Oil or Kerosene | 9 (20.4%) | 0 (0.0%) |
| Coal or Coke | 0 (0.0%) | 0 (0.0%) |
| All other Fuels | 6 (13.6%) | 2 (40.0%) |
| No Fuel Used | 0 (0.0%) | 0 (0.0%) |
| Total | 44 (100.0%) | 5 (100.0%) |
Household Vehicle Usage in Trego
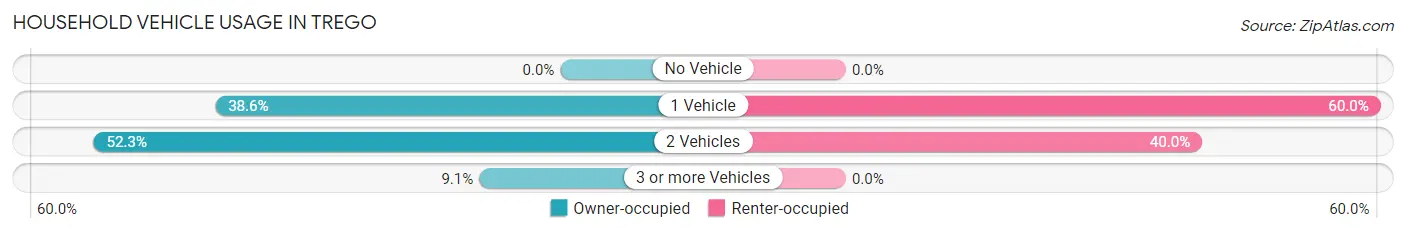
| Vehicles per Household | Owner-occupied | Renter-occupied |
| No Vehicle | 0 (0.0%) | 0 (0.0%) |
| 1 Vehicle | 17 (38.6%) | 3 (60.0%) |
| 2 Vehicles | 23 (52.3%) | 2 (40.0%) |
| 3 or more Vehicles | 4 (9.1%) | 0 (0.0%) |
| Total | 44 (100.0%) | 5 (100.0%) |
Real Estate & Mortgages in Trego
Real Estate and Mortgage Overview in Trego
| Characteristic | Without Mortgage | With Mortgage |
| Housing Units | 17 | 27 |
| Median Property Value | $305,600 | $119,600 |
| Median Household Income | $68,125 | $0 |
| Monthly Housing Costs | $554 | $0 |
| Real Estate Taxes | $2,750 | $0 |
Property Value by Mortgage Status in Trego
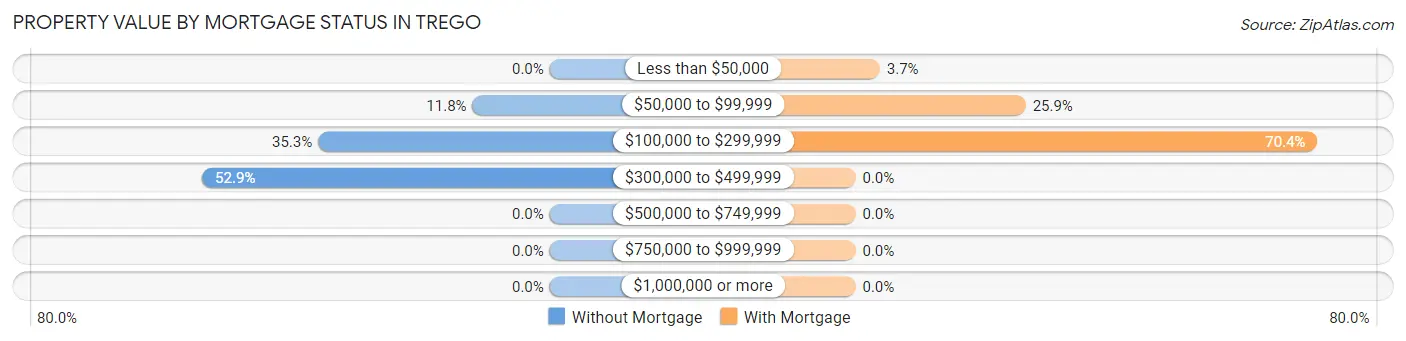
| Property Value | Without Mortgage | With Mortgage |
| Less than $50,000 | 0 (0.0%) | 1 (3.7%) |
| $50,000 to $99,999 | 2 (11.8%) | 7 (25.9%) |
| $100,000 to $299,999 | 6 (35.3%) | 19 (70.4%) |
| $300,000 to $499,999 | 9 (52.9%) | 0 (0.0%) |
| $500,000 to $749,999 | 0 (0.0%) | 0 (0.0%) |
| $750,000 to $999,999 | 0 (0.0%) | 0 (0.0%) |
| $1,000,000 or more | 0 (0.0%) | 0 (0.0%) |
| Total | 17 (100.0%) | 27 (100.0%) |
Household Income by Mortgage Status in Trego
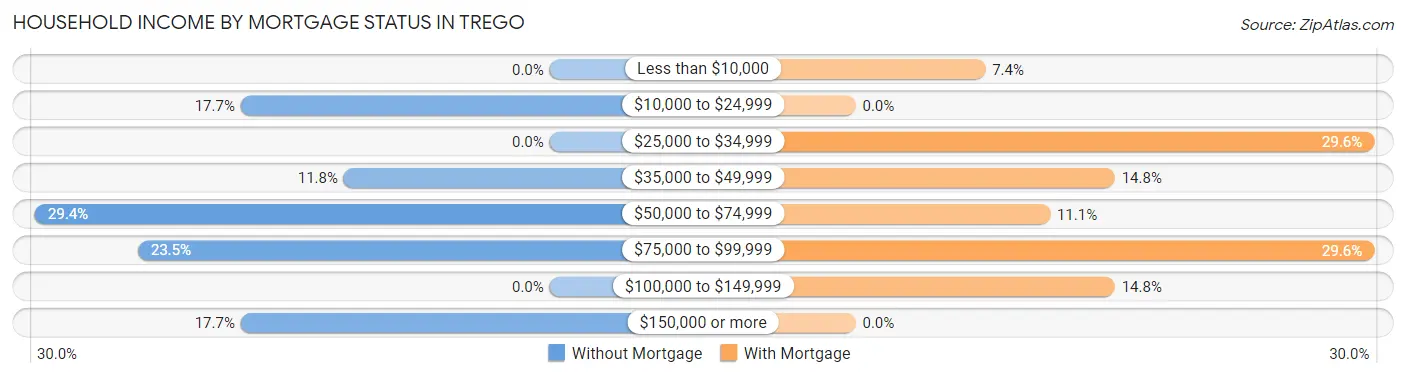
| Household Income | Without Mortgage | With Mortgage |
| Less than $10,000 | 0 (0.0%) | 2 (7.4%) |
| $10,000 to $24,999 | 3 (17.6%) | 0 (0.0%) |
| $25,000 to $34,999 | 0 (0.0%) | 8 (29.6%) |
| $35,000 to $49,999 | 2 (11.8%) | 4 (14.8%) |
| $50,000 to $74,999 | 5 (29.4%) | 3 (11.1%) |
| $75,000 to $99,999 | 4 (23.5%) | 8 (29.6%) |
| $100,000 to $149,999 | 0 (0.0%) | 4 (14.8%) |
| $150,000 or more | 3 (17.6%) | 0 (0.0%) |
| Total | 17 (100.0%) | 27 (100.0%) |
Property Value to Household Income Ratio in Trego
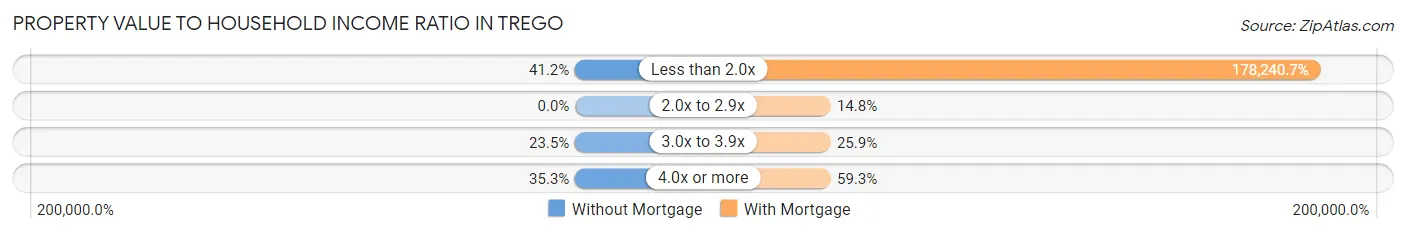
| Value-to-Income Ratio | Without Mortgage | With Mortgage |
| Less than 2.0x | 7 (41.2%) | 48,125 (178,240.7%) |
| 2.0x to 2.9x | 0 (0.0%) | 4 (14.8%) |
| 3.0x to 3.9x | 4 (23.5%) | 7 (25.9%) |
| 4.0x or more | 6 (35.3%) | 16 (59.3%) |
| Total | 17 (100.0%) | 27 (100.0%) |
Real Estate Taxes by Mortgage Status in Trego
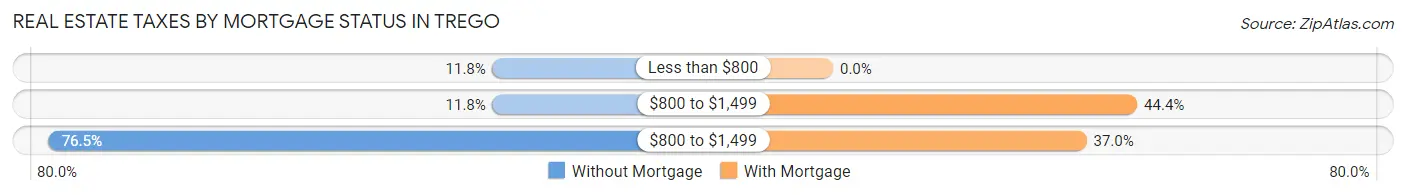
| Property Taxes | Without Mortgage | With Mortgage |
| Less than $800 | 2 (11.8%) | 0 (0.0%) |
| $800 to $1,499 | 2 (11.8%) | 12 (44.4%) |
| $800 to $1,499 | 13 (76.5%) | 10 (37.0%) |
| Total | 17 (100.0%) | 27 (100.0%) |
Health & Disability in Trego
Health Insurance Coverage by Age in Trego

| Age Bracket | With Coverage | Without Coverage |
| Under 6 Years | 2 (100.0%) | 0 (0.0%) |
| 6 to 18 Years | 11 (100.0%) | 0 (0.0%) |
| 19 to 25 Years | 0 (0.0%) | 4 (100.0%) |
| 26 to 34 Years | 4 (100.0%) | 0 (0.0%) |
| 35 to 44 Years | 1 (100.0%) | 0 (0.0%) |
| 45 to 54 Years | 11 (100.0%) | 0 (0.0%) |
| 55 to 64 Years | 30 (100.0%) | 0 (0.0%) |
| 65 to 74 Years | 24 (100.0%) | 0 (0.0%) |
| 75 Years and older | 6 (100.0%) | 0 (0.0%) |
| Total | 89 (95.7%) | 4 (4.3%) |
Health Insurance Coverage by Citizenship Status in Trego
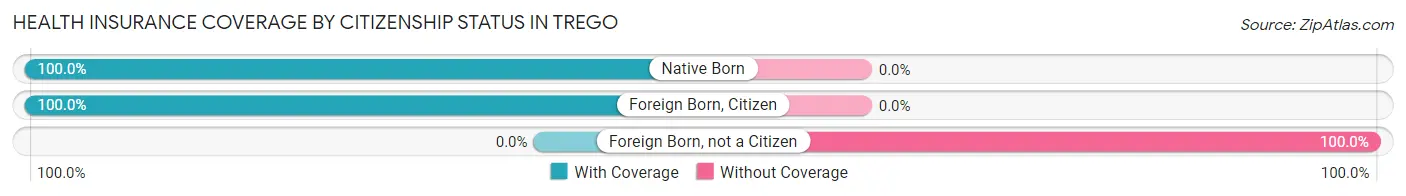
| Citizenship Status | With Coverage | Without Coverage |
| Native Born | 2 (100.0%) | 0 (0.0%) |
| Foreign Born, Citizen | 11 (100.0%) | 0 (0.0%) |
| Foreign Born, not a Citizen | 0 (0.0%) | 4 (100.0%) |
Health Insurance Coverage by Household Income in Trego
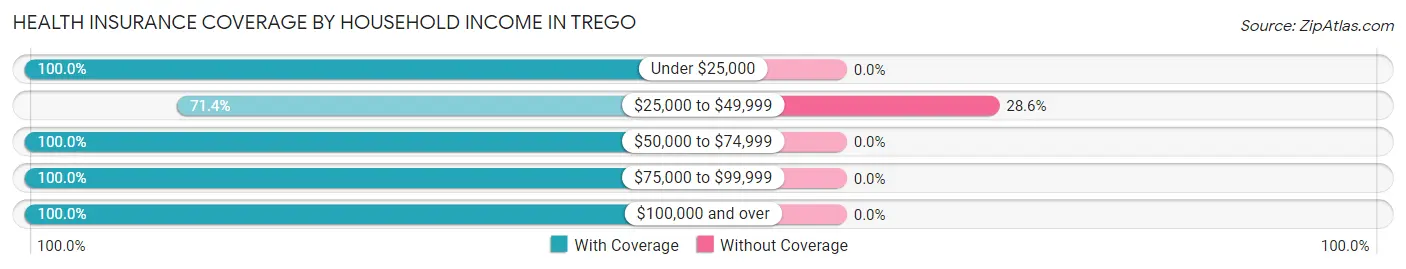
| Household Income | With Coverage | Without Coverage |
| Under $25,000 | 25 (100.0%) | 0 (0.0%) |
| $25,000 to $49,999 | 10 (71.4%) | 4 (28.6%) |
| $50,000 to $74,999 | 23 (100.0%) | 0 (0.0%) |
| $75,000 to $99,999 | 25 (100.0%) | 0 (0.0%) |
| $100,000 and over | 6 (100.0%) | 0 (0.0%) |
Public vs Private Health Insurance Coverage by Age in Trego
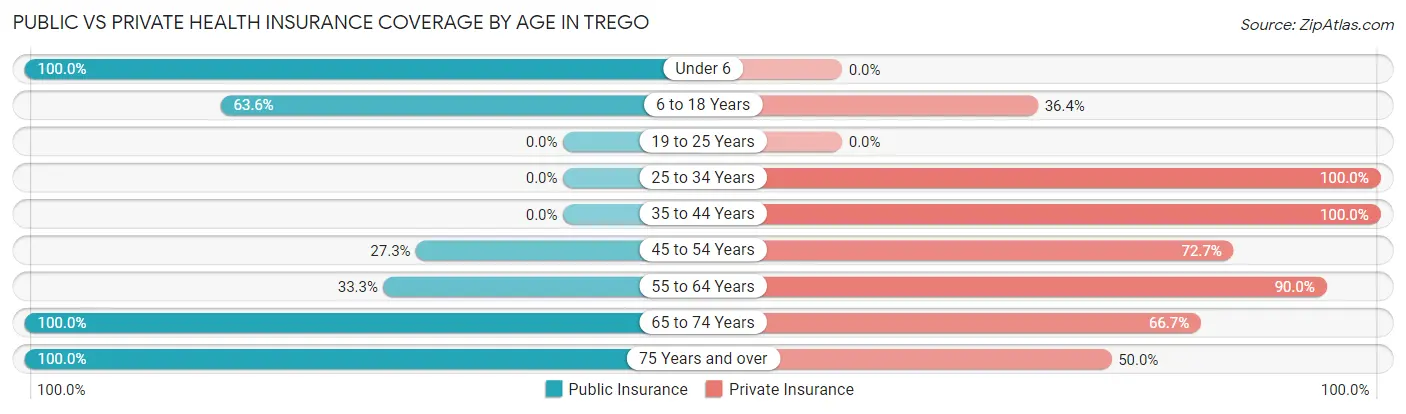
| Age Bracket | Public Insurance | Private Insurance |
| Under 6 | 2 (100.0%) | 0 (0.0%) |
| 6 to 18 Years | 7 (63.6%) | 4 (36.4%) |
| 19 to 25 Years | 0 (0.0%) | 0 (0.0%) |
| 25 to 34 Years | 0 (0.0%) | 4 (100.0%) |
| 35 to 44 Years | 0 (0.0%) | 1 (100.0%) |
| 45 to 54 Years | 3 (27.3%) | 8 (72.7%) |
| 55 to 64 Years | 10 (33.3%) | 27 (90.0%) |
| 65 to 74 Years | 24 (100.0%) | 16 (66.7%) |
| 75 Years and over | 6 (100.0%) | 3 (50.0%) |
| Total | 52 (55.9%) | 63 (67.7%) |
Disability Status by Sex by Age in Trego
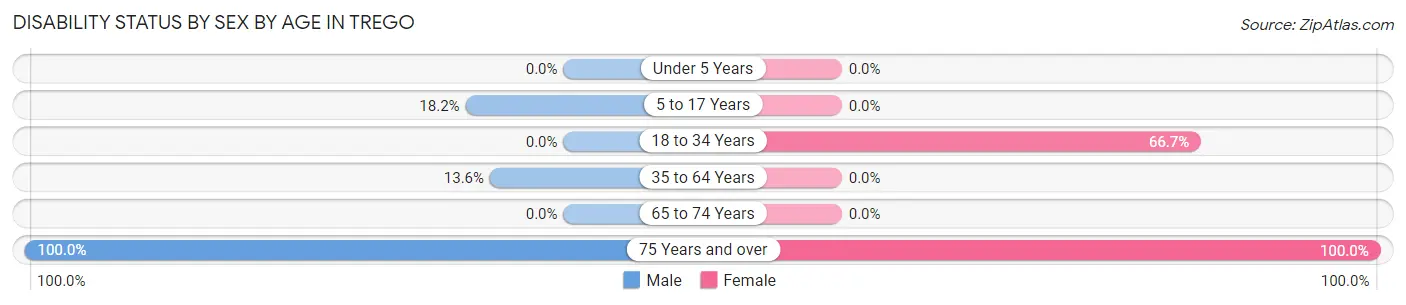
| Age Bracket | Male | Female |
| Under 5 Years | 0 (0.0%) | 0 (0.0%) |
| 5 to 17 Years | 2 (18.2%) | 0 (0.0%) |
| 18 to 34 Years | 0 (0.0%) | 4 (66.7%) |
| 35 to 64 Years | 3 (13.6%) | 0 (0.0%) |
| 65 to 74 Years | 0 (0.0%) | 0 (0.0%) |
| 75 Years and over | 3 (100.0%) | 3 (100.0%) |
Disability Class by Sex by Age in Trego
Disability Class: Hearing Difficulty
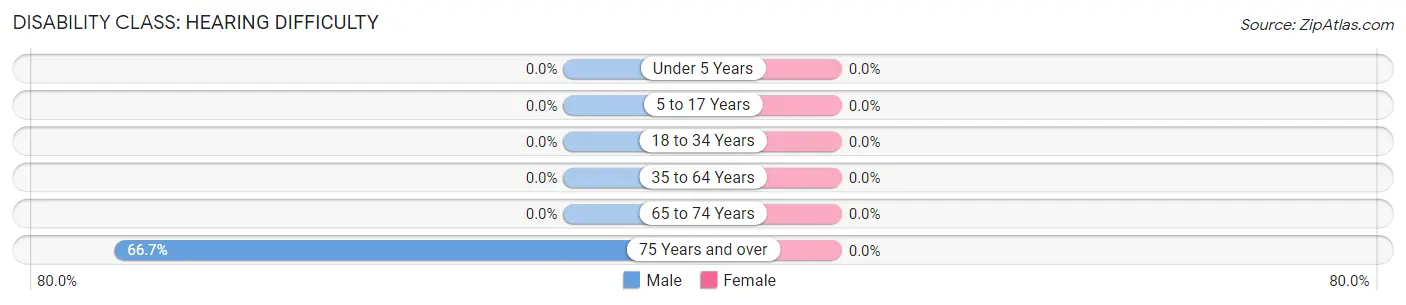
| Age Bracket | Male | Female |
| Under 5 Years | 0 (0.0%) | 0 (0.0%) |
| 5 to 17 Years | 0 (0.0%) | 0 (0.0%) |
| 18 to 34 Years | 0 (0.0%) | 0 (0.0%) |
| 35 to 64 Years | 0 (0.0%) | 0 (0.0%) |
| 65 to 74 Years | 0 (0.0%) | 0 (0.0%) |
| 75 Years and over | 2 (66.7%) | 0 (0.0%) |
Disability Class: Vision Difficulty

| Age Bracket | Male | Female |
| Under 5 Years | 0 (0.0%) | 0 (0.0%) |
| 5 to 17 Years | 0 (0.0%) | 0 (0.0%) |
| 18 to 34 Years | 0 (0.0%) | 0 (0.0%) |
| 35 to 64 Years | 0 (0.0%) | 0 (0.0%) |
| 65 to 74 Years | 0 (0.0%) | 0 (0.0%) |
| 75 Years and over | 1 (33.3%) | 0 (0.0%) |
Disability Class: Cognitive Difficulty
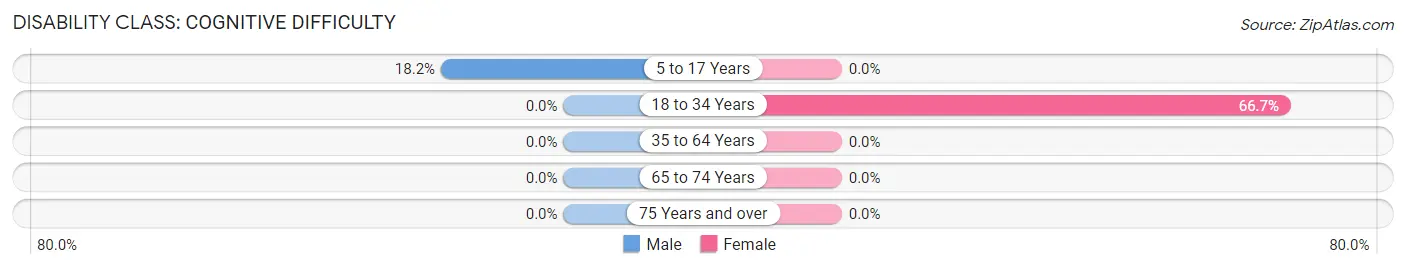
| Age Bracket | Male | Female |
| 5 to 17 Years | 2 (18.2%) | 0 (0.0%) |
| 18 to 34 Years | 0 (0.0%) | 4 (66.7%) |
| 35 to 64 Years | 0 (0.0%) | 0 (0.0%) |
| 65 to 74 Years | 0 (0.0%) | 0 (0.0%) |
| 75 Years and over | 0 (0.0%) | 0 (0.0%) |
Disability Class: Ambulatory Difficulty
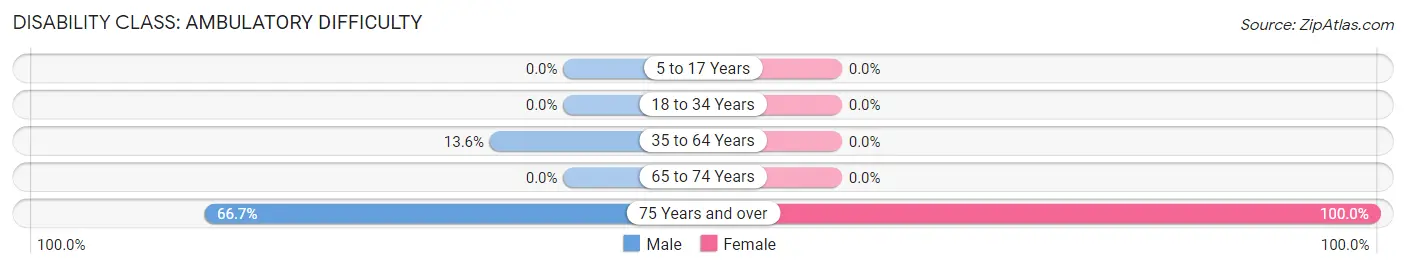
| Age Bracket | Male | Female |
| 5 to 17 Years | 0 (0.0%) | 0 (0.0%) |
| 18 to 34 Years | 0 (0.0%) | 0 (0.0%) |
| 35 to 64 Years | 3 (13.6%) | 0 (0.0%) |
| 65 to 74 Years | 0 (0.0%) | 0 (0.0%) |
| 75 Years and over | 2 (66.7%) | 3 (100.0%) |
Disability Class: Self-Care Difficulty
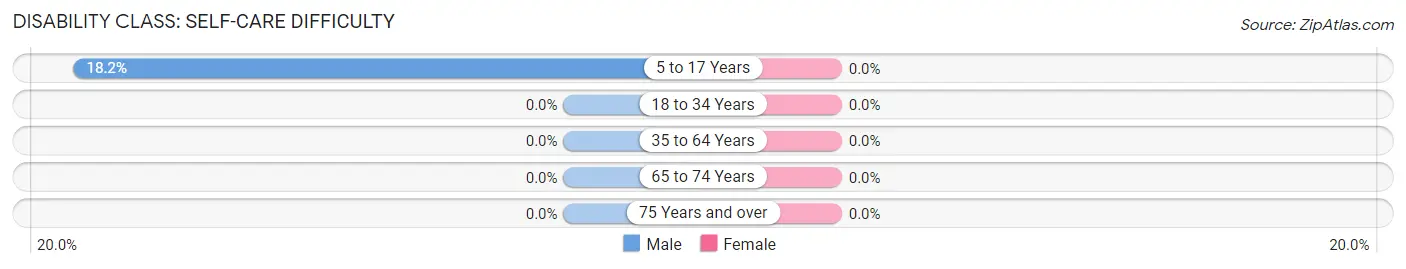
| Age Bracket | Male | Female |
| 5 to 17 Years | 2 (18.2%) | 0 (0.0%) |
| 18 to 34 Years | 0 (0.0%) | 0 (0.0%) |
| 35 to 64 Years | 0 (0.0%) | 0 (0.0%) |
| 65 to 74 Years | 0 (0.0%) | 0 (0.0%) |
| 75 Years and over | 0 (0.0%) | 0 (0.0%) |
Technology Access in Trego
Computing Device Access in Trego
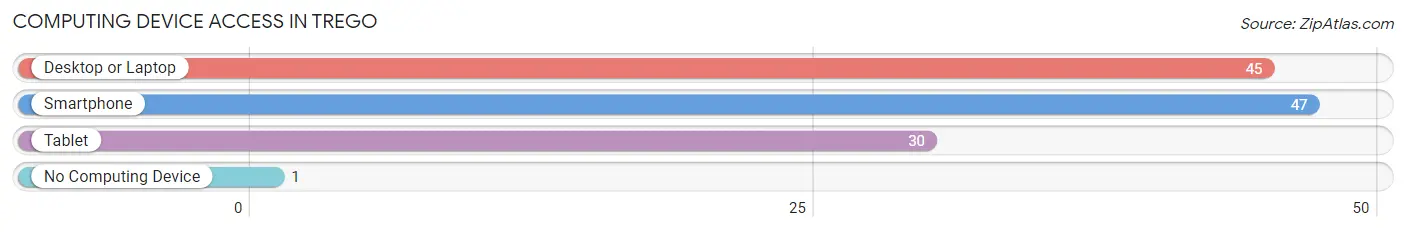
| Device Type | # Households | % Households |
| Desktop or Laptop | 45 | 91.8% |
| Smartphone | 47 | 95.9% |
| Tablet | 30 | 61.2% |
| No Computing Device | 1 | 2.0% |
| Total | 49 | 100.0% |
Internet Access in Trego
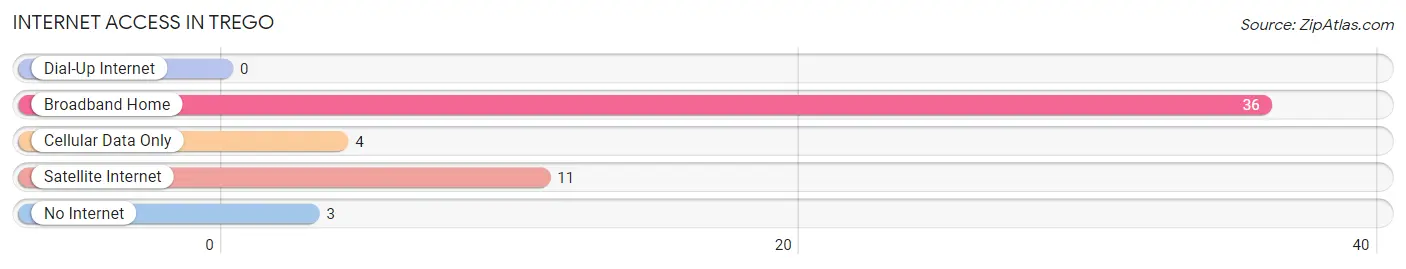
| Internet Type | # Households | % Households |
| Dial-Up Internet | 0 | 0.0% |
| Broadband Home | 36 | 73.5% |
| Cellular Data Only | 4 | 8.2% |
| Satellite Internet | 11 | 22.5% |
| No Internet | 3 | 6.1% |
| Total | 49 | 100.0% |
Trego Summary
Trego, Wisconsin is a small town located in Washburn County in the northwestern part of the state. It is situated on the banks of the Namekagon River, and is surrounded by the Chequamegon-Nicolet National Forest. The town has a population of just over 500 people, and is known for its rural charm and natural beauty.
History
Trego was first settled in the late 1800s by a group of Norwegian immigrants. The town was originally called “Nordland”, but was later changed to “Trego” in honor of the first settler, John Trego. The town was officially incorporated in 1891.
In the early 1900s, Trego was a thriving logging and farming community. The town was home to several sawmills, a grist mill, and a cheese factory. The town also had a hotel, a general store, and a post office.
In the 1950s, Trego began to experience a decline in population as people moved away to larger cities. The sawmills and grist mill closed, and the cheese factory moved to a larger town. The hotel and general store also closed.
Geography
Trego is located in the northwest corner of Wisconsin, in Washburn County. It is situated on the banks of the Namekagon River, and is surrounded by the Chequamegon-Nicolet National Forest. The town is located about 30 miles from the city of Superior, and about 50 miles from Duluth, Minnesota.
The town is situated on a flat plain, with rolling hills to the north and east. The terrain is mostly wooded, with some open fields and meadows. The climate is typical of the northern Midwest, with cold winters and warm summers.
Economy
Trego’s economy is largely based on tourism. The town is a popular destination for outdoor enthusiasts, who come to enjoy the area’s natural beauty and recreational activities. The town is also home to several small businesses, including a grocery store, a hardware store, and a restaurant.
Demographics
As of the 2010 census, Trego had a population of 517 people. The racial makeup of the town was 97.3% White, 0.6% Native American, 0.2% Asian, 0.2% from other races, and 1.7% from two or more races. Hispanic or Latino of any race were 0.6% of the population.
The median household income in Trego was $37,500, and the median family income was $45,000. The per capita income for the town was $19,000. About 11.3% of families and 14.2% of the population were below the poverty line, including 18.2% of those under age 18 and 8.3% of those age 65 or over.
Trego is a small town with a rich history and a unique culture. It is a popular destination for outdoor enthusiasts, and is home to several small businesses. The town has a population of just over 500 people, and is known for its rural charm and natural beauty.
Common Questions
What is the Total Population of Trego?
Total Population of Trego is 93.
What is the Total Male Population of Trego?
Total Male Population of Trego is 52.
What is the Total Female Population of Trego?
Total Female Population of Trego is 41.
What is the Ratio of Males per 100 Females in Trego?
There are 126.83 Males per 100 Females in Trego.
What is the Ratio of Females per 100 Males in Trego?
There are 78.85 Females per 100 Males in Trego.
What is the Median Population Age in Trego?
Median Population Age in Trego is 58.8 Years.
What is the Average Family Size in Trego
Average Family Size in Trego is 2.3 People.
What is the Average Household Size in Trego
Average Household Size in Trego is 1.9 People.
What is Per Capita Income in Trego?
Per Capita income in Trego is $32,131.
What is the Median Family Income in Trego?
Median Family Income in Trego is $66,250.
What is the Median Household income in Trego?
Median Household Income in Trego is $51,250.
What is Income or Wage Gap in Trego?
Income or Wage Gap in Trego is 15.6%.
Women in Trego earn 84.4 cents for every dollar earned by a man.
What is Inequality or Gini Index in Trego?
Inequality or Gini Index in Trego is 0.35.
How Large is the Labor Force in Trego?
There are 48 People in the Labor Forcein in Trego.
What is the Percentage of People in the Labor Force in Trego?
57.1% of People are in the Labor Force in Trego.