Rock Springs, WI
Rock Springs Map
Rock Springs Overview
330
TOTAL POPULATION
177
MALE POPULATION
153
FEMALE POPULATION
115.69
MALES / 100 FEMALES
86.44
FEMALES / 100 MALES
37.0
MEDIAN AGE
2.8
AVG FAMILY SIZE
2.3
AVG HOUSEHOLD SIZE
$30,516
PER CAPITA INCOME
$83,125
AVG FAMILY INCOME
$75,625
AVG HOUSEHOLD INCOME
20.8%
WAGE / INCOME GAP [ % ]
79.2¢/ $1
WAGE / INCOME GAP [ $ ]
$7,167
FAMILY INCOME DEFICIT
0.29
INEQUALITY / GINI INDEX
200
LABOR FORCE [ PEOPLE ]
76.0%
PERCENT IN LABOR FORCE
3.0%
UNEMPLOYMENT RATE
Rock Springs Zip Codes
Rock Springs Area Codes
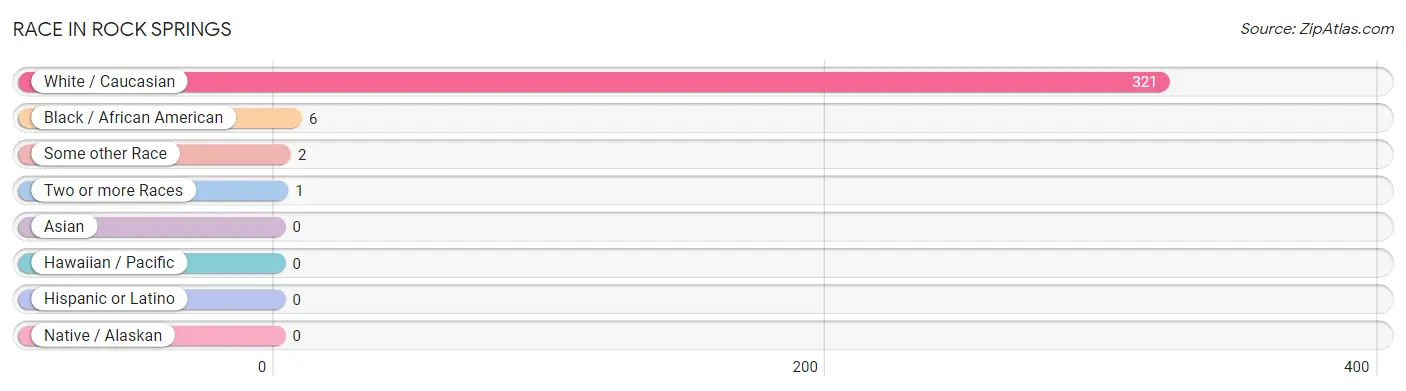
Race in Rock Springs
The most populous races in Rock Springs are White / Caucasian (321 | 97.3%), Black / African American (6 | 1.8%), and Some other Race (2 | 0.6%).
| Race | # Population | % Population |
| Asian | 0 | 0.0% |
| Black / African American | 6 | 1.8% |
| Hawaiian / Pacific | 0 | 0.0% |
| Hispanic or Latino | 0 | 0.0% |
| Native / Alaskan | 0 | 0.0% |
| White / Caucasian | 321 | 97.3% |
| Two or more Races | 1 | 0.3% |
| Some other Race | 2 | 0.6% |
| Total | 330 | 100.0% |
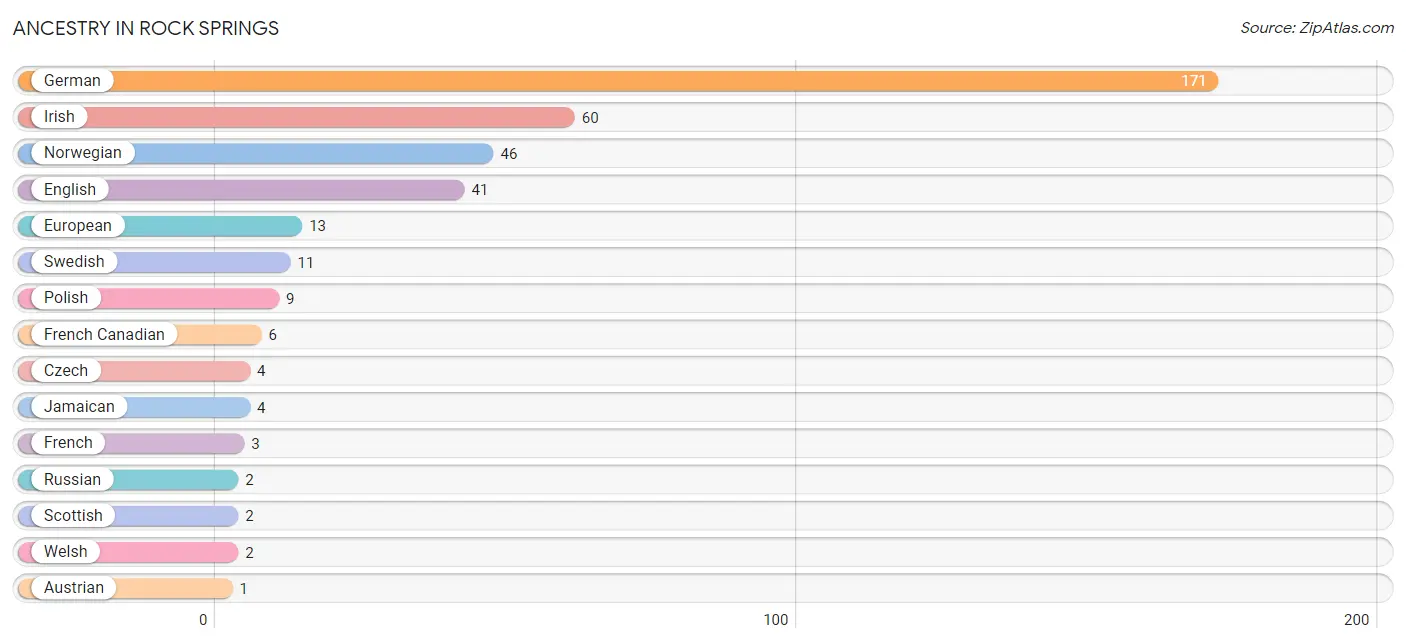
Ancestry in Rock Springs
The most populous ancestries reported in Rock Springs are German (171 | 51.8%), Irish (60 | 18.2%), Norwegian (46 | 13.9%), English (41 | 12.4%), and European (13 | 3.9%), together accounting for 100.3% of all Rock Springs residents.
| Ancestry | # Population | % Population |
| Austrian | 1 | 0.3% |
| Czech | 4 | 1.2% |
| English | 41 | 12.4% |
| European | 13 | 3.9% |
| French | 3 | 0.9% |
| French Canadian | 6 | 1.8% |
| German | 171 | 51.8% |
| Irish | 60 | 18.2% |
| Italian | 1 | 0.3% |
| Jamaican | 4 | 1.2% |
| Norwegian | 46 | 13.9% |
| Polish | 9 | 2.7% |
| Russian | 2 | 0.6% |
| Scandinavian | 1 | 0.3% |
| Scotch-Irish | 1 | 0.3% |
| Scottish | 2 | 0.6% |
| Swedish | 11 | 3.3% |
| Ukrainian | 1 | 0.3% |
| Welsh | 2 | 0.6% | View All 19 Rows |
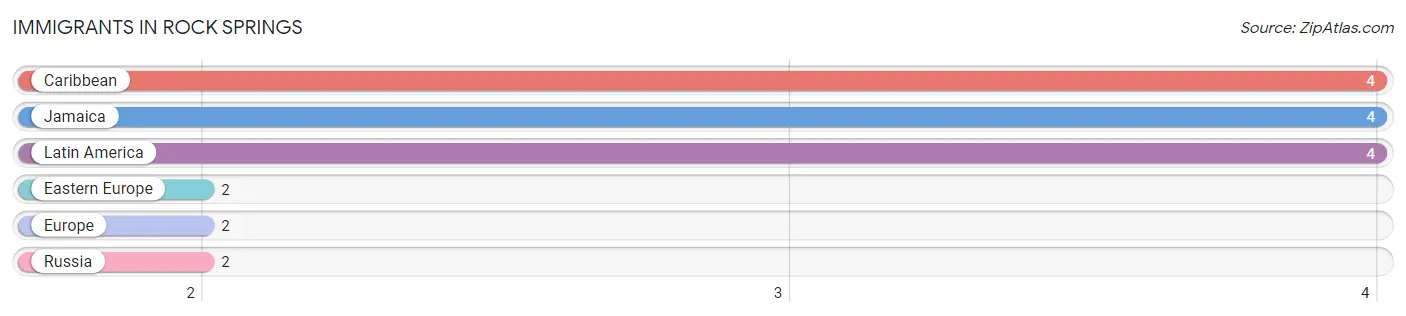
Immigrants in Rock Springs
The most numerous immigrant groups reported in Rock Springs came from Caribbean (4 | 1.2%), Jamaica (4 | 1.2%), Latin America (4 | 1.2%), Eastern Europe (2 | 0.6%), and Europe (2 | 0.6%), together accounting for 4.9% of all Rock Springs residents.
| Immigration Origin | # Population | % Population |
| Caribbean | 4 | 1.2% |
| Eastern Europe | 2 | 0.6% |
| Europe | 2 | 0.6% |
| Jamaica | 4 | 1.2% |
| Latin America | 4 | 1.2% |
| Russia | 2 | 0.6% | View All 6 Rows |
Sex and Age in Rock Springs
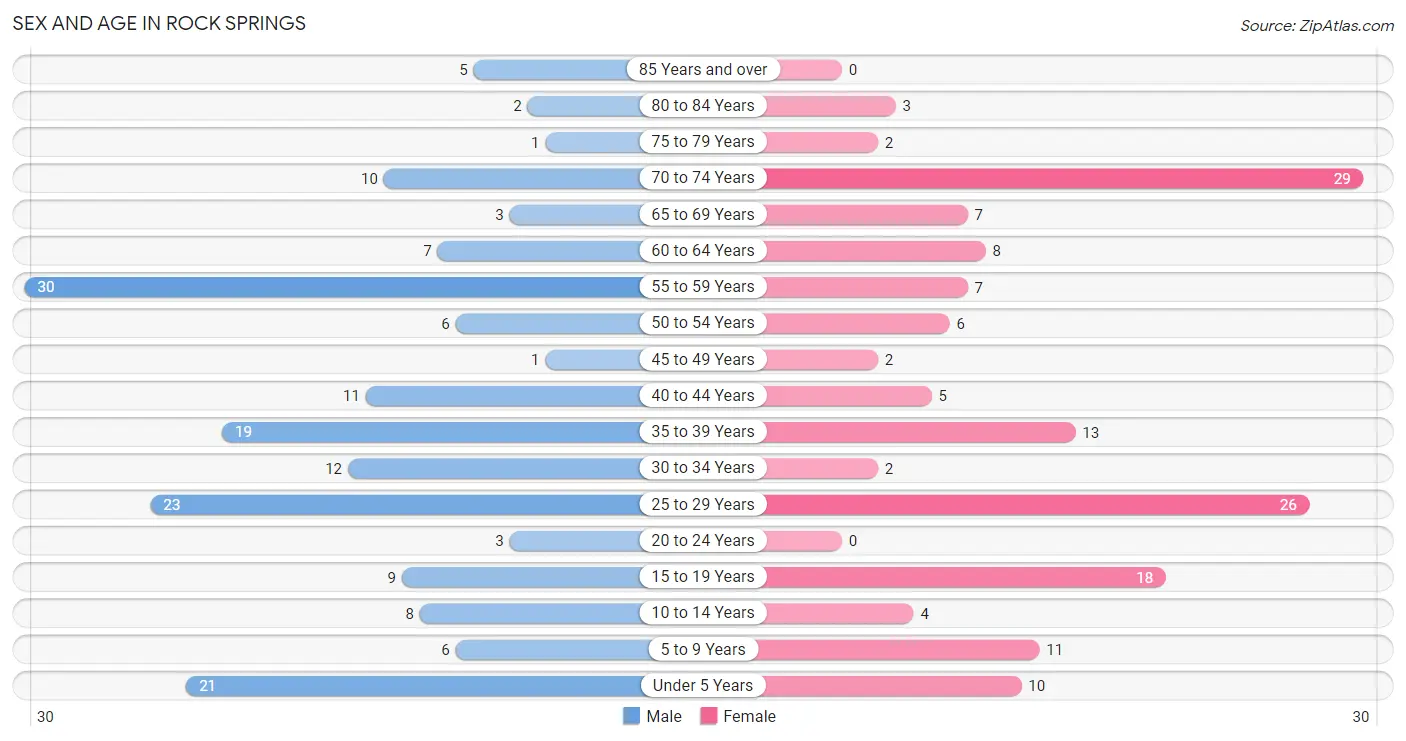
Sex and Age in Rock Springs
The most populous age groups in Rock Springs are 55 to 59 Years (30 | 17.0%) for men and 70 to 74 Years (29 | 19.0%) for women.
| Age Bracket | Male | Female |
| Under 5 Years | 21 (11.9%) | 10 (6.5%) |
| 5 to 9 Years | 6 (3.4%) | 11 (7.2%) |
| 10 to 14 Years | 8 (4.5%) | 4 (2.6%) |
| 15 to 19 Years | 9 (5.1%) | 18 (11.8%) |
| 20 to 24 Years | 3 (1.7%) | 0 (0.0%) |
| 25 to 29 Years | 23 (13.0%) | 26 (17.0%) |
| 30 to 34 Years | 12 (6.8%) | 2 (1.3%) |
| 35 to 39 Years | 19 (10.7%) | 13 (8.5%) |
| 40 to 44 Years | 11 (6.2%) | 5 (3.3%) |
| 45 to 49 Years | 1 (0.6%) | 2 (1.3%) |
| 50 to 54 Years | 6 (3.4%) | 6 (3.9%) |
| 55 to 59 Years | 30 (17.0%) | 7 (4.6%) |
| 60 to 64 Years | 7 (4.0%) | 8 (5.2%) |
| 65 to 69 Years | 3 (1.7%) | 7 (4.6%) |
| 70 to 74 Years | 10 (5.7%) | 29 (19.0%) |
| 75 to 79 Years | 1 (0.6%) | 2 (1.3%) |
| 80 to 84 Years | 2 (1.1%) | 3 (2.0%) |
| 85 Years and over | 5 (2.8%) | 0 (0.0%) |
| Total | 177 (100.0%) | 153 (100.0%) |
Families and Households in Rock Springs
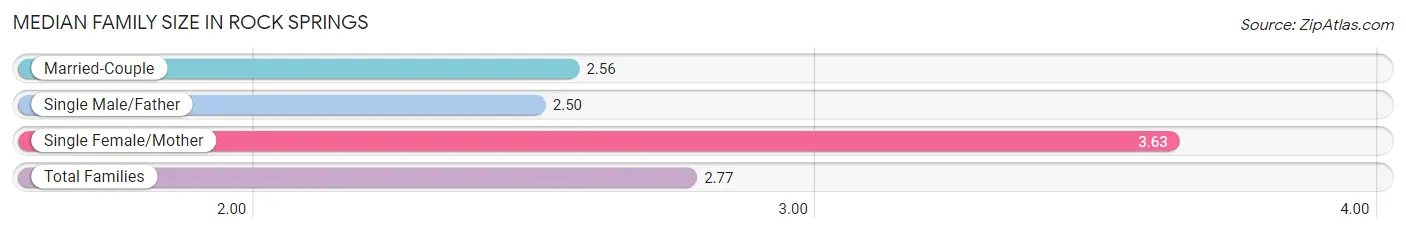
Median Family Size in Rock Springs
The median family size in Rock Springs is 2.77 persons per family, with single female/mother families (19 | 20.0%) accounting for the largest median family size of 3.63 persons per family. On the other hand, single male/father families (10 | 10.5%) represent the smallest median family size with 2.50 persons per family.
| Family Type | # Families | Family Size |
| Married-Couple | 66 (69.5%) | 2.56 |
| Single Male/Father | 10 (10.5%) | 2.50 |
| Single Female/Mother | 19 (20.0%) | 3.63 |
| Total Families | 95 (100.0%) | 2.77 |
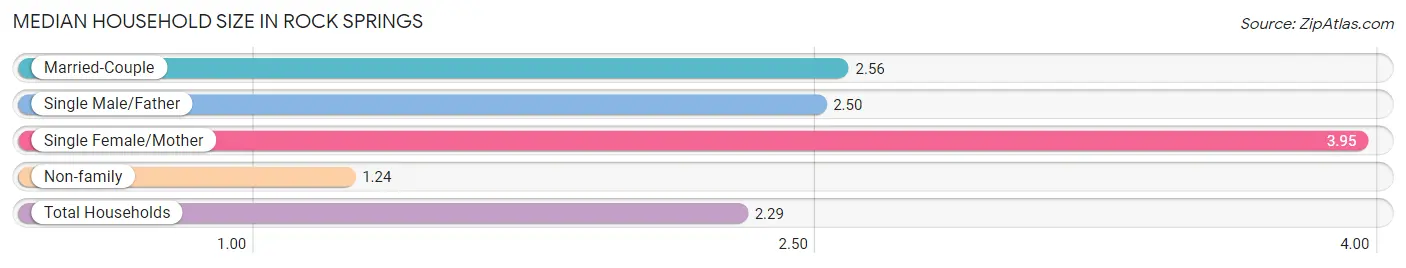
Median Household Size in Rock Springs
The median household size in Rock Springs is 2.29 persons per household, with single female/mother households (19 | 13.2%) accounting for the largest median household size of 3.95 persons per household. non-family households (49 | 34.0%) represent the smallest median household size with 1.24 persons per household.
| Household Type | # Households | Household Size |
| Married-Couple | 66 (45.8%) | 2.56 |
| Single Male/Father | 10 (6.9%) | 2.50 |
| Single Female/Mother | 19 (13.2%) | 3.95 |
| Non-family | 49 (34.0%) | 1.24 |
| Total Households | 144 (100.0%) | 2.29 |
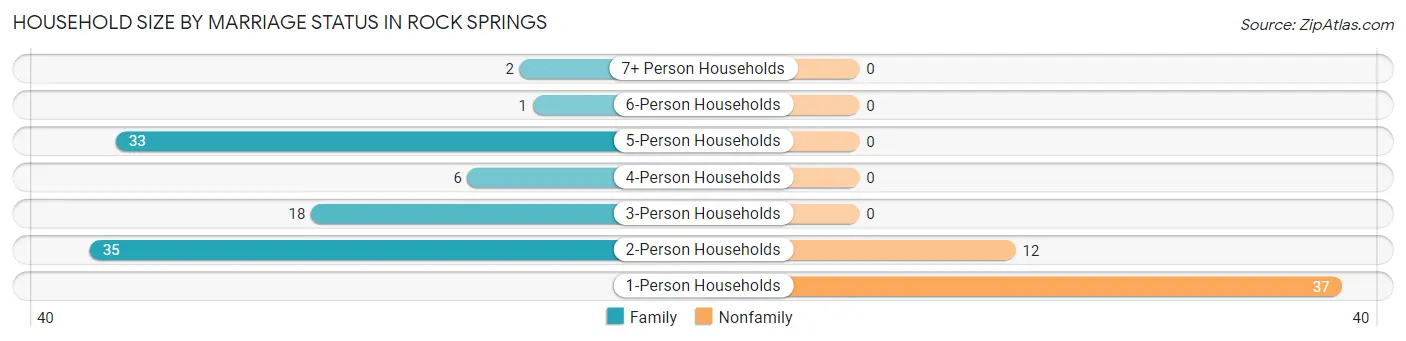
Household Size by Marriage Status in Rock Springs
Out of a total of 144 households in Rock Springs, 95 (66.0%) are family households, while 49 (34.0%) are nonfamily households. The most numerous type of family households are 2-person households, comprising 35, and the most common type of nonfamily households are 1-person households, comprising 37.
| Household Size | Family Households | Nonfamily Households |
| 1-Person Households | - | 37 (25.7%) |
| 2-Person Households | 35 (24.3%) | 12 (8.3%) |
| 3-Person Households | 18 (12.5%) | 0 (0.0%) |
| 4-Person Households | 6 (4.2%) | 0 (0.0%) |
| 5-Person Households | 33 (22.9%) | 0 (0.0%) |
| 6-Person Households | 1 (0.7%) | 0 (0.0%) |
| 7+ Person Households | 2 (1.4%) | 0 (0.0%) |
| Total | 95 (66.0%) | 49 (34.0%) |
Female Fertility in Rock Springs
Fertility by Age in Rock Springs
Average fertility rate in Rock Springs is 162.0 births per 1,000 women. Women in the age bracket of 20 to 34 years have the highest fertility rate with 250.0 births per 1,000 women. Women in the age bracket of 20 to 34 years acount for 63.6% of all women with births.
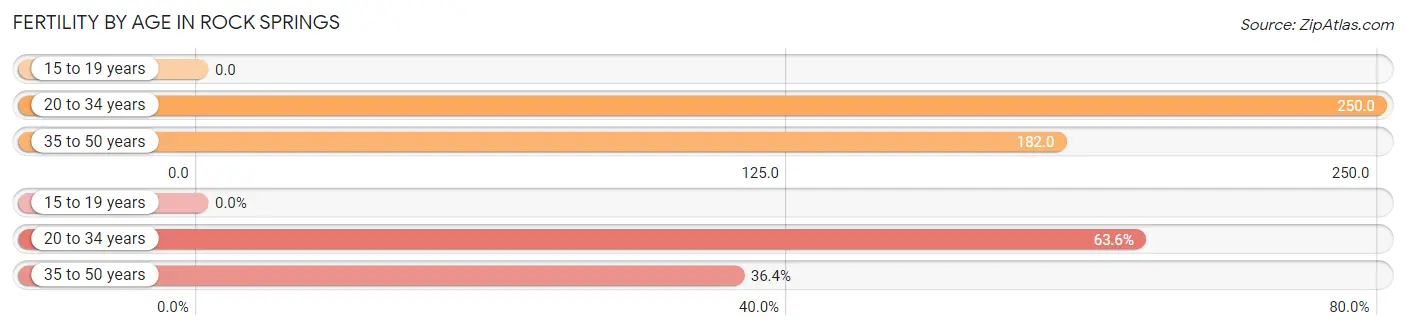
| Age Bracket | Women with Births | Births / 1,000 Women |
| 15 to 19 years | 0 (0.0%) | 0.0 |
| 20 to 34 years | 7 (63.6%) | 250.0 |
| 35 to 50 years | 4 (36.4%) | 182.0 |
| Total | 11 (100.0%) | 162.0 |
Fertility by Age by Marriage Status in Rock Springs
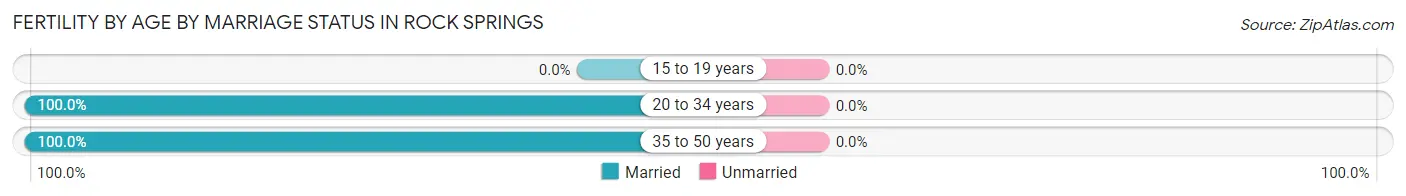
| Age Bracket | Married | Unmarried |
| 15 to 19 years | 0 (0.0%) | 0 (0.0%) |
| 20 to 34 years | 7 (100.0%) | 0 (0.0%) |
| 35 to 50 years | 4 (100.0%) | 0 (0.0%) |
| Total | 11 (100.0%) | 0 (0.0%) |
Fertility by Education in Rock Springs
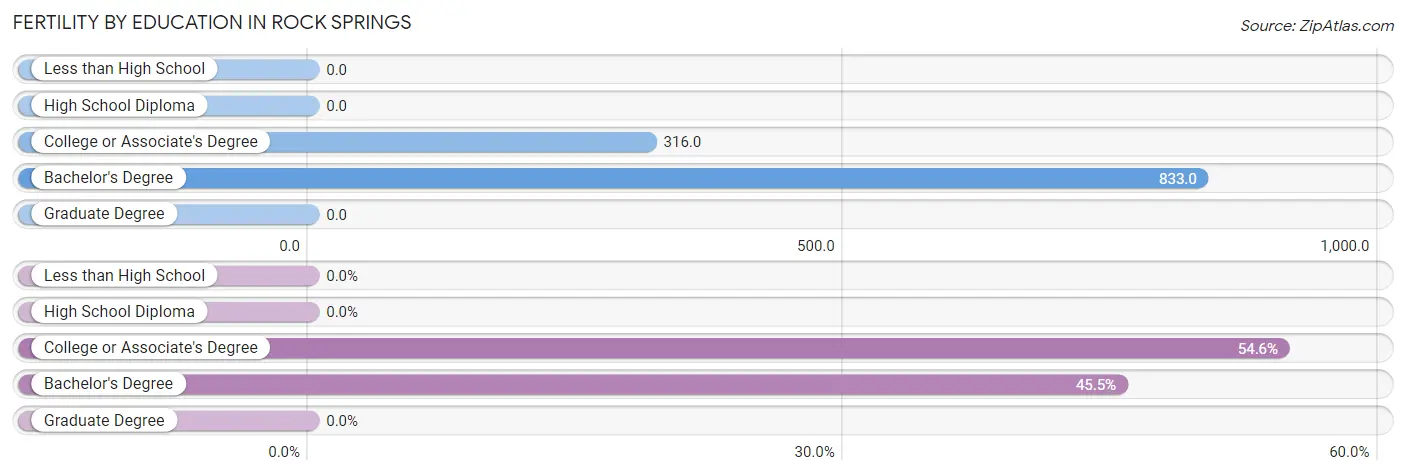
| Educational Attainment | Women with Births | Births / 1,000 Women |
| Less than High School | 0 (0.0%) | 0.0 |
| High School Diploma | 0 (0.0%) | 0.0 |
| College or Associate's Degree | 6 (54.5%) | 316.0 |
| Bachelor's Degree | 5 (45.5%) | 833.0 |
| Graduate Degree | 0 (0.0%) | 0.0 |
| Total | 11 (100.0%) | 162.0 |
Fertility by Education by Marriage Status in Rock Springs
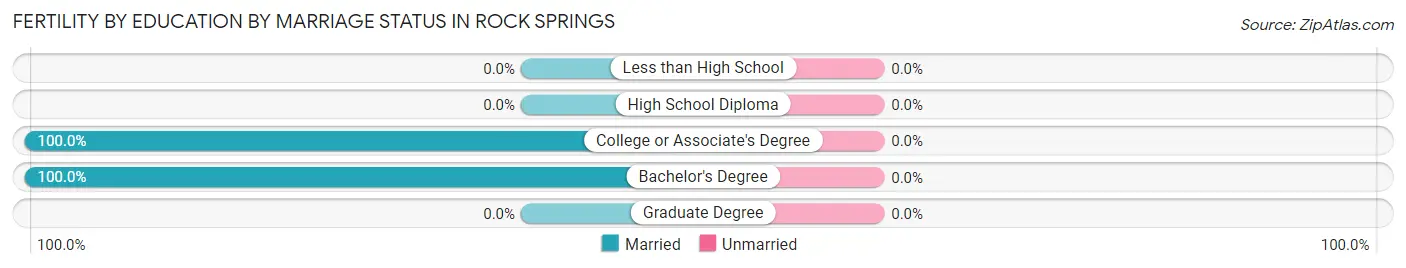
| Educational Attainment | Married | Unmarried |
| Less than High School | 0 (0.0%) | 0 (0.0%) |
| High School Diploma | 0 (0.0%) | 0 (0.0%) |
| College or Associate's Degree | 6 (100.0%) | 0 (0.0%) |
| Bachelor's Degree | 5 (100.0%) | 0 (0.0%) |
| Graduate Degree | 0 (0.0%) | 0 (0.0%) |
| Total | 11 (100.0%) | 0 (0.0%) |
Income in Rock Springs
Income Overview in Rock Springs
Per Capita Income in Rock Springs is $30,516, while median incomes of families and households are $83,125 and $75,625 respectively.
| Characteristic | Number | Measure |
| Per Capita Income | 330 | $30,516 |
| Median Family Income | 95 | $83,125 |
| Mean Family Income | 95 | $80,755 |
| Median Household Income | 144 | $75,625 |
| Mean Household Income | 144 | $74,106 |
| Income Deficit | 95 | $7,167 |
| Wage / Income Gap (%) | 330 | 20.79% |
| Wage / Income Gap ($) | 330 | 79.21¢ per $1 |
| Gini / Inequality Index | 330 | 0.29 |
Earnings by Sex in Rock Springs
Average Earnings in Rock Springs are $41,429, $43,472 for men and $34,432 for women, a difference of 20.8%.
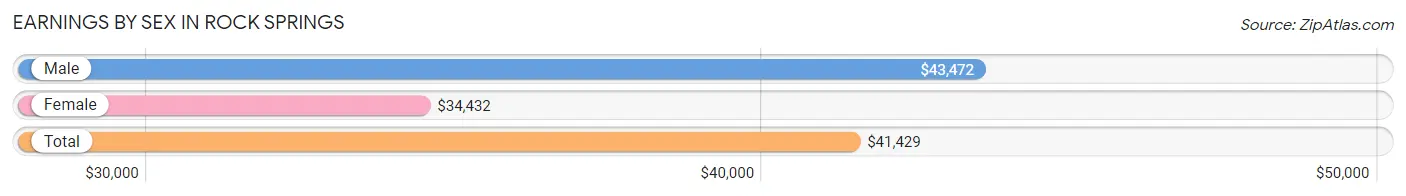
| Sex | Number | Average Earnings |
| Male | 119 (57.2%) | $43,472 |
| Female | 89 (42.8%) | $34,432 |
| Total | 208 (100.0%) | $41,429 |
Earnings by Sex by Income Bracket in Rock Springs
The most common earnings brackets in Rock Springs are $2,499 or less for men (22 | 18.5%) and $55,000 to $64,999 for women (23 | 25.8%).
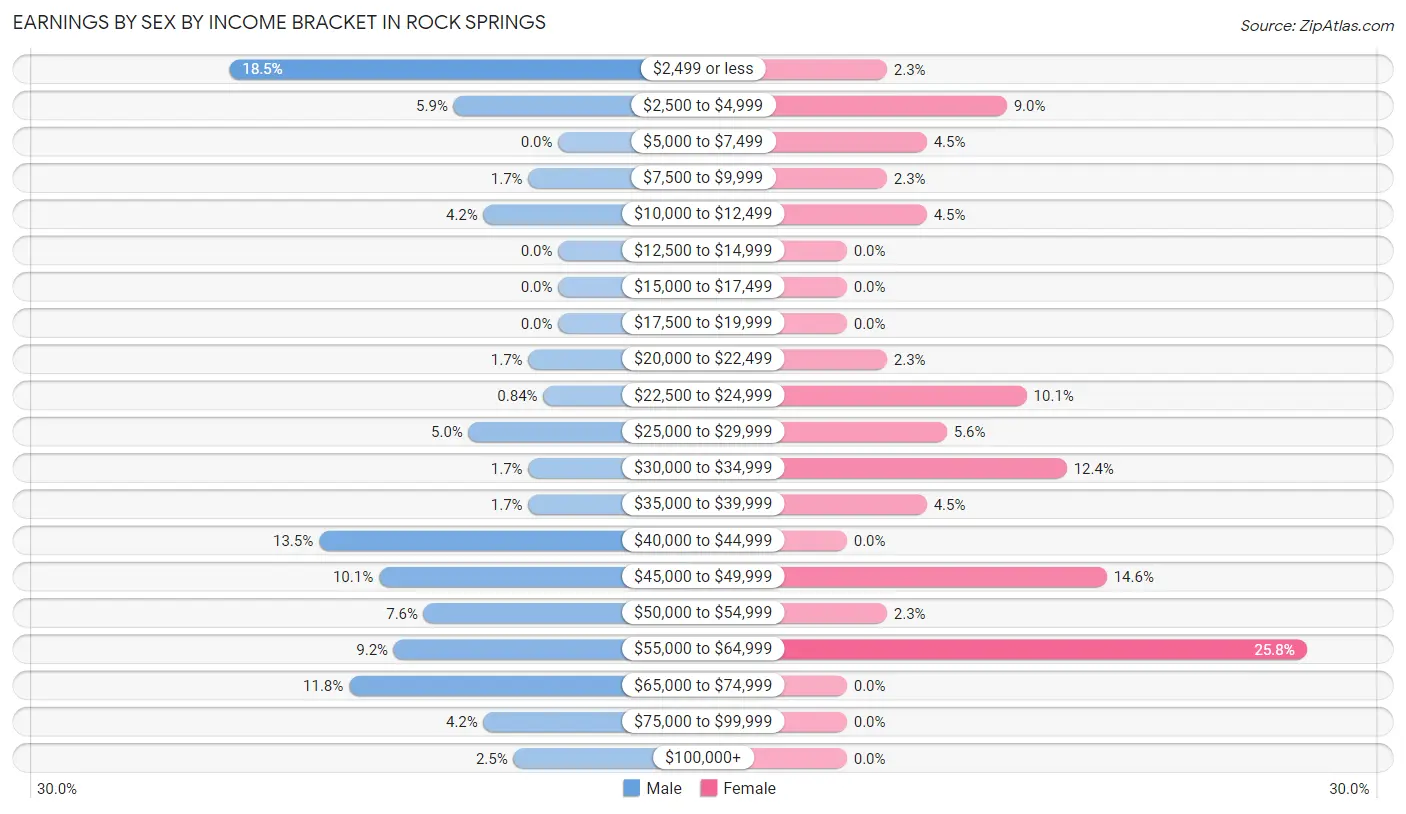
| Income | Male | Female |
| $2,499 or less | 22 (18.5%) | 2 (2.2%) |
| $2,500 to $4,999 | 7 (5.9%) | 8 (9.0%) |
| $5,000 to $7,499 | 0 (0.0%) | 4 (4.5%) |
| $7,500 to $9,999 | 2 (1.7%) | 2 (2.2%) |
| $10,000 to $12,499 | 5 (4.2%) | 4 (4.5%) |
| $12,500 to $14,999 | 0 (0.0%) | 0 (0.0%) |
| $15,000 to $17,499 | 0 (0.0%) | 0 (0.0%) |
| $17,500 to $19,999 | 0 (0.0%) | 0 (0.0%) |
| $20,000 to $22,499 | 2 (1.7%) | 2 (2.2%) |
| $22,500 to $24,999 | 1 (0.8%) | 9 (10.1%) |
| $25,000 to $29,999 | 6 (5.0%) | 5 (5.6%) |
| $30,000 to $34,999 | 2 (1.7%) | 11 (12.4%) |
| $35,000 to $39,999 | 2 (1.7%) | 4 (4.5%) |
| $40,000 to $44,999 | 16 (13.5%) | 0 (0.0%) |
| $45,000 to $49,999 | 12 (10.1%) | 13 (14.6%) |
| $50,000 to $54,999 | 9 (7.6%) | 2 (2.2%) |
| $55,000 to $64,999 | 11 (9.2%) | 23 (25.8%) |
| $65,000 to $74,999 | 14 (11.8%) | 0 (0.0%) |
| $75,000 to $99,999 | 5 (4.2%) | 0 (0.0%) |
| $100,000+ | 3 (2.5%) | 0 (0.0%) |
| Total | 119 (100.0%) | 89 (100.0%) |
Earnings by Sex by Educational Attainment in Rock Springs
Average earnings in Rock Springs are $44,722 for men and $39,063 for women, a difference of 12.7%. Men with an educational attainment of high school diploma enjoy the highest average annual earnings of $45,000, while those with less than high school education earn the least with $42,500. Women with an educational attainment of college or associate's degree earn the most with the average annual earnings of $31,250, while those with college or associate's degree education have the smallest earnings of $31,250.
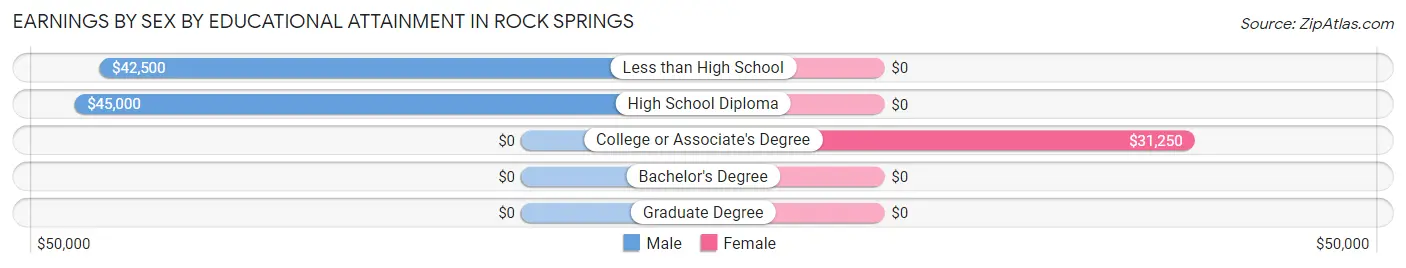
| Educational Attainment | Male Income | Female Income |
| Less than High School | $42,500 | $0 |
| High School Diploma | $45,000 | $0 |
| College or Associate's Degree | - | - |
| Bachelor's Degree | - | - |
| Graduate Degree | - | - |
| Total | $44,722 | $39,063 |
Family Income in Rock Springs
Family Income Brackets in Rock Springs
According to the Rock Springs family income data, there are 38 families falling into the $75,000 to $99,999 income range, which is the most common income bracket and makes up 40.0% of all families.
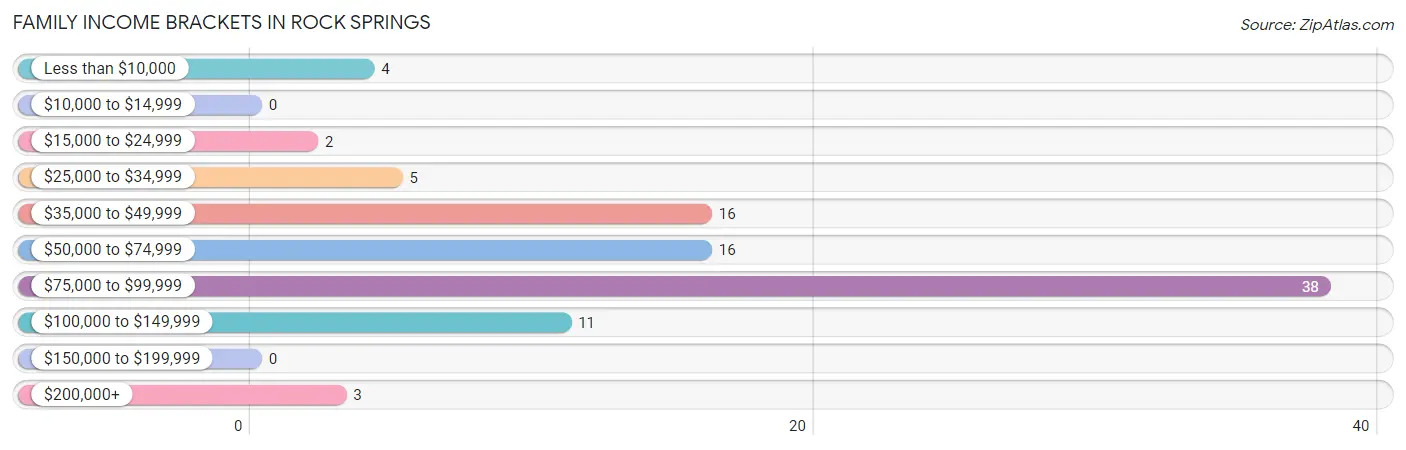
| Income Bracket | # Families | % Families |
| Less than $10,000 | 4 | 4.2% |
| $10,000 to $14,999 | 0 | 0.0% |
| $15,000 to $24,999 | 2 | 2.1% |
| $25,000 to $34,999 | 5 | 5.3% |
| $35,000 to $49,999 | 16 | 16.8% |
| $50,000 to $74,999 | 16 | 16.8% |
| $75,000 to $99,999 | 38 | 40.0% |
| $100,000 to $149,999 | 11 | 11.6% |
| $150,000 to $199,999 | 0 | 0.0% |
| $200,000+ | 3 | 3.2% |
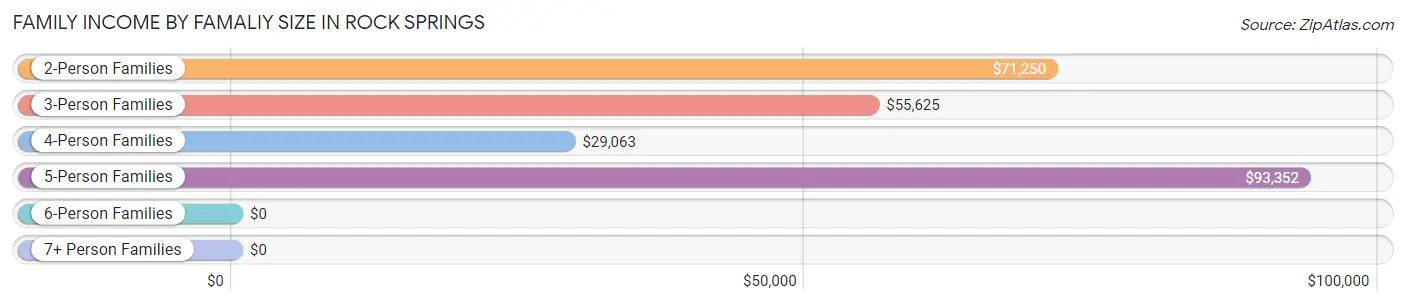
Family Income by Famaliy Size in Rock Springs
5-person families (29 | 30.5%) account for the highest median family income in Rock Springs with $93,352 per family, while 2-person families (35 | 36.8%) have the highest median income of $35,625 per family member.
| Income Bracket | # Families | Median Income |
| 2-Person Families | 35 (36.8%) | $71,250 |
| 3-Person Families | 19 (20.0%) | $55,625 |
| 4-Person Families | 9 (9.5%) | $29,063 |
| 5-Person Families | 29 (30.5%) | $93,352 |
| 6-Person Families | 1 (1.1%) | $0 |
| 7+ Person Families | 2 (2.1%) | $0 |
| Total | 95 (100.0%) | $83,125 |
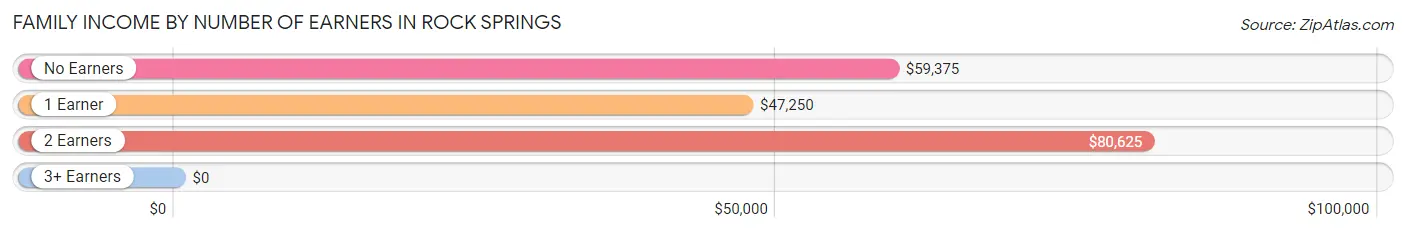
Family Income by Number of Earners in Rock Springs
| Number of Earners | # Families | Median Income |
| No Earners | 11 (11.6%) | $59,375 |
| 1 Earner | 23 (24.2%) | $47,250 |
| 2 Earners | 37 (39.0%) | $80,625 |
| 3+ Earners | 24 (25.3%) | $0 |
| Total | 95 (100.0%) | $83,125 |
Household Income in Rock Springs
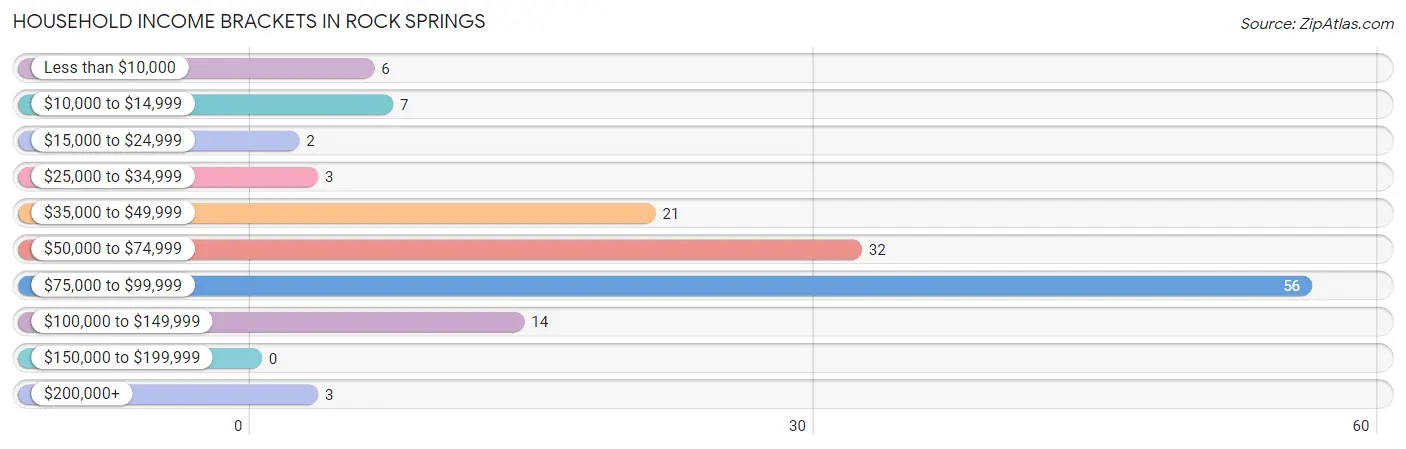
Household Income Brackets in Rock Springs
With 56 households falling in the category, the $75,000 to $99,999 income range is the most frequent in Rock Springs, accounting for 38.9% of all households.
| Income Bracket | # Households | % Households |
| Less than $10,000 | 6 | 4.2% |
| $10,000 to $14,999 | 7 | 4.9% |
| $15,000 to $24,999 | 2 | 1.4% |
| $25,000 to $34,999 | 3 | 2.1% |
| $35,000 to $49,999 | 21 | 14.6% |
| $50,000 to $74,999 | 32 | 22.2% |
| $75,000 to $99,999 | 56 | 38.9% |
| $100,000 to $149,999 | 14 | 9.7% |
| $150,000 to $199,999 | 0 | 0.0% |
| $200,000+ | 3 | 2.1% |
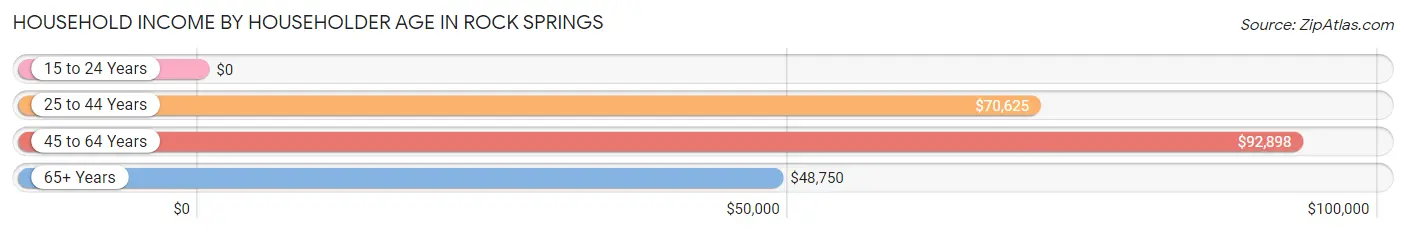
Household Income by Householder Age in Rock Springs
The median household income in Rock Springs is $75,625, with the highest median household income of $92,898 found in the 45 to 64 years age bracket for the primary householder. A total of 49 households (34.0%) fall into this category.
| Income Bracket | # Households | Median Income |
| 15 to 24 Years | 0 (0.0%) | $0 |
| 25 to 44 Years | 67 (46.5%) | $70,625 |
| 45 to 64 Years | 49 (34.0%) | $92,898 |
| 65+ Years | 28 (19.4%) | $48,750 |
| Total | 144 (100.0%) | $75,625 |
Poverty in Rock Springs
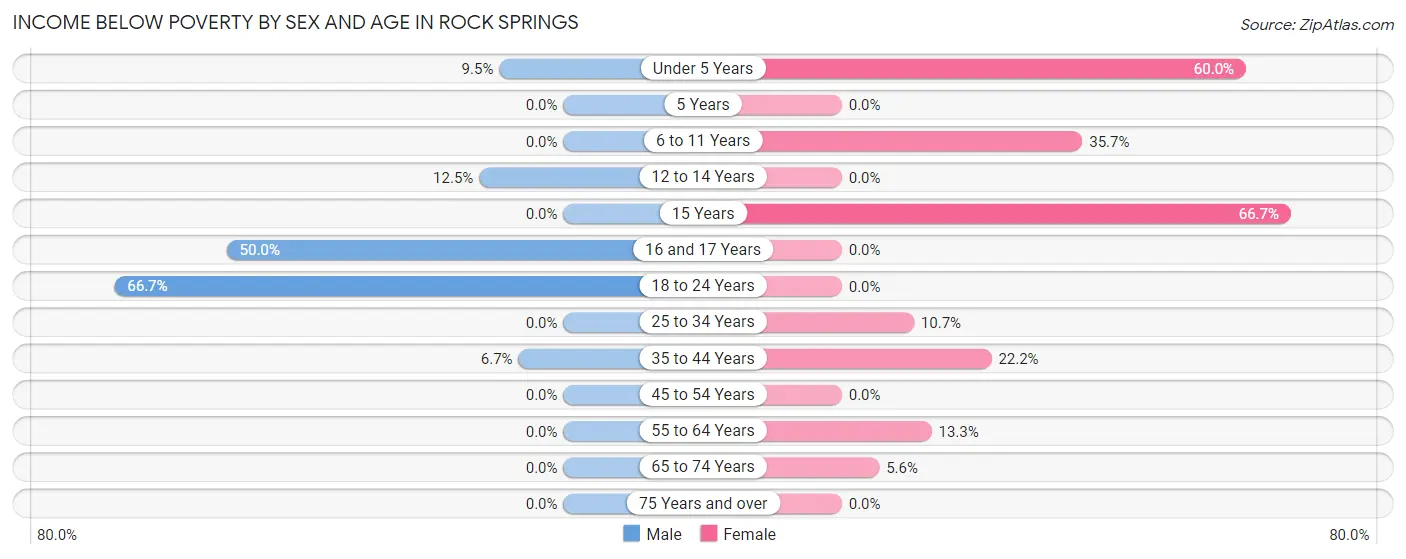
Income Below Poverty by Sex and Age in Rock Springs
With 6.2% poverty level for males and 17.0% for females among the residents of Rock Springs, 18 to 24 year old males and 15 year old females are the most vulnerable to poverty, with 2 males (66.7%) and 4 females (66.7%) in their respective age groups living below the poverty level.
| Age Bracket | Male | Female |
| Under 5 Years | 2 (9.5%) | 6 (60.0%) |
| 5 Years | 0 (0.0%) | 0 (0.0%) |
| 6 to 11 Years | 0 (0.0%) | 5 (35.7%) |
| 12 to 14 Years | 1 (12.5%) | 0 (0.0%) |
| 15 Years | 0 (0.0%) | 4 (66.7%) |
| 16 and 17 Years | 4 (50.0%) | 0 (0.0%) |
| 18 to 24 Years | 2 (66.7%) | 0 (0.0%) |
| 25 to 34 Years | 0 (0.0%) | 3 (10.7%) |
| 35 to 44 Years | 2 (6.7%) | 4 (22.2%) |
| 45 to 54 Years | 0 (0.0%) | 0 (0.0%) |
| 55 to 64 Years | 0 (0.0%) | 2 (13.3%) |
| 65 to 74 Years | 0 (0.0%) | 2 (5.6%) |
| 75 Years and over | 0 (0.0%) | 0 (0.0%) |
| Total | 11 (6.2%) | 26 (17.0%) |
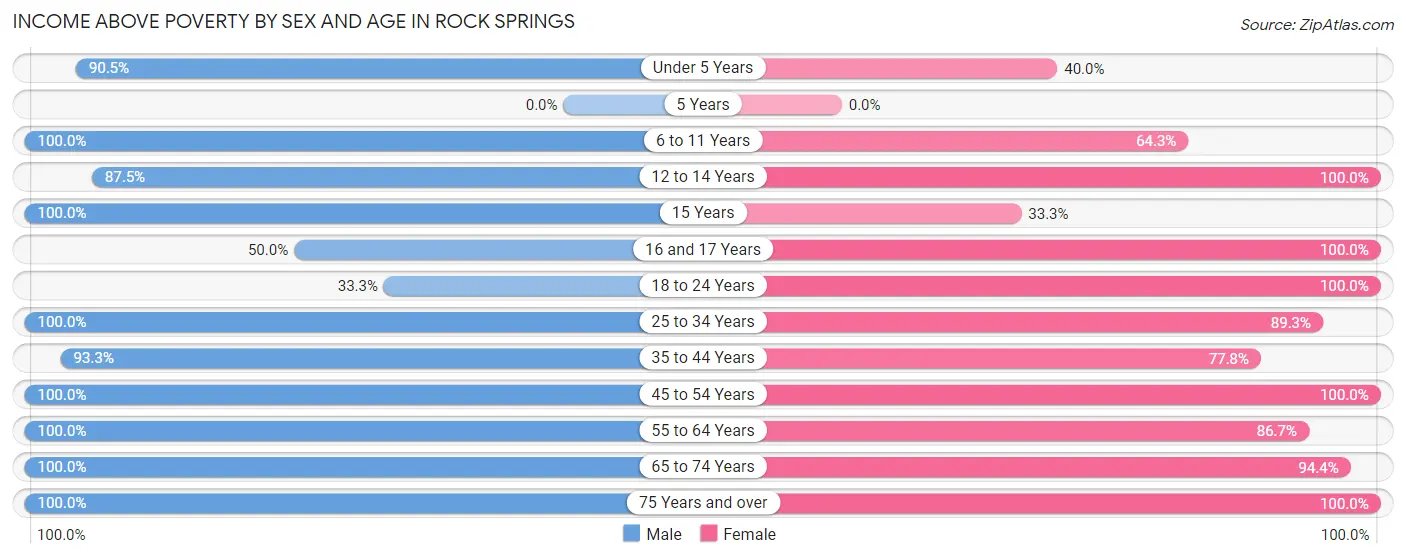
Income Above Poverty by Sex and Age in Rock Springs
According to the poverty statistics in Rock Springs, males aged 6 to 11 years and females aged 12 to 14 years are the age groups that are most secure financially, with 100.0% of males and 100.0% of females in these age groups living above the poverty line.
| Age Bracket | Male | Female |
| Under 5 Years | 19 (90.5%) | 4 (40.0%) |
| 5 Years | 0 (0.0%) | 0 (0.0%) |
| 6 to 11 Years | 6 (100.0%) | 9 (64.3%) |
| 12 to 14 Years | 7 (87.5%) | 1 (100.0%) |
| 15 Years | 1 (100.0%) | 2 (33.3%) |
| 16 and 17 Years | 4 (50.0%) | 2 (100.0%) |
| 18 to 24 Years | 1 (33.3%) | 10 (100.0%) |
| 25 to 34 Years | 35 (100.0%) | 25 (89.3%) |
| 35 to 44 Years | 28 (93.3%) | 14 (77.8%) |
| 45 to 54 Years | 7 (100.0%) | 8 (100.0%) |
| 55 to 64 Years | 37 (100.0%) | 13 (86.7%) |
| 65 to 74 Years | 13 (100.0%) | 34 (94.4%) |
| 75 Years and over | 8 (100.0%) | 5 (100.0%) |
| Total | 166 (93.8%) | 127 (83.0%) |
Income Below Poverty Among Married-Couple Families in Rock Springs
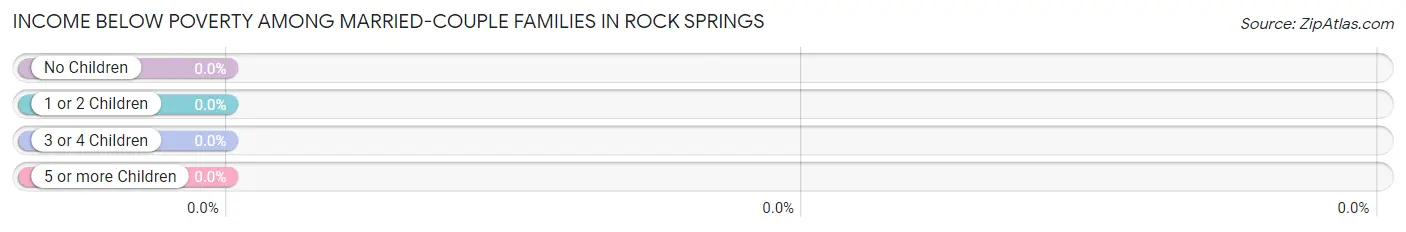
| Children | Above Poverty | Below Poverty |
| No Children | 29 (100.0%) | 0 (0.0%) |
| 1 or 2 Children | 32 (100.0%) | 0 (0.0%) |
| 3 or 4 Children | 5 (100.0%) | 0 (0.0%) |
| 5 or more Children | 0 (0.0%) | 0 (0.0%) |
| Total | 66 (100.0%) | 0 (0.0%) |
Income Below Poverty Among Single-Parent Households in Rock Springs
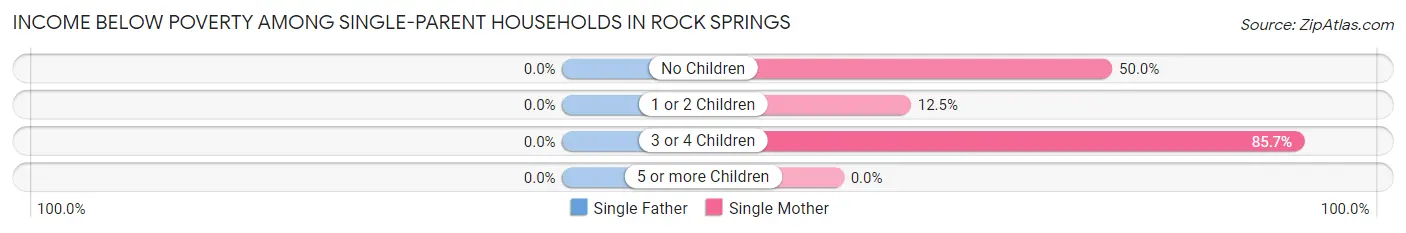
| Children | Single Father | Single Mother |
| No Children | 0 (0.0%) | 2 (50.0%) |
| 1 or 2 Children | 0 (0.0%) | 1 (12.5%) |
| 3 or 4 Children | 0 (0.0%) | 6 (85.7%) |
| 5 or more Children | 0 (0.0%) | 0 (0.0%) |
| Total | 0 (0.0%) | 9 (47.4%) |
Income Below Poverty Among Married-Couple vs Single-Parent Households in Rock Springs
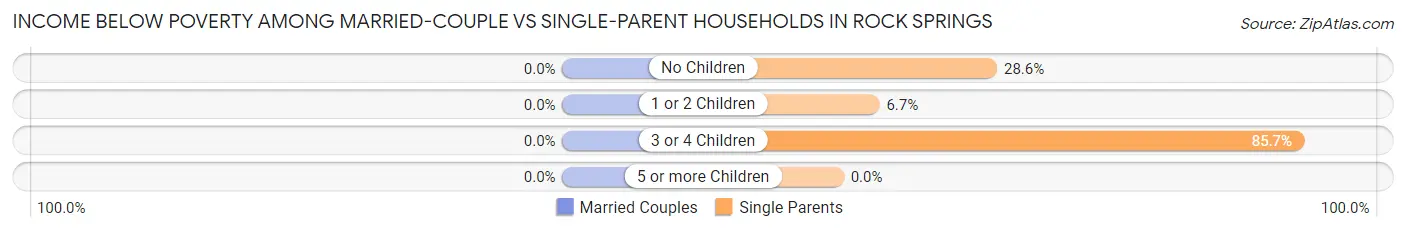
| Children | Married-Couple Families | Single-Parent Households |
| No Children | 0 (0.0%) | 2 (28.6%) |
| 1 or 2 Children | 0 (0.0%) | 1 (6.7%) |
| 3 or 4 Children | 0 (0.0%) | 6 (85.7%) |
| 5 or more Children | 0 (0.0%) | 0 (0.0%) |
| Total | 0 (0.0%) | 9 (31.0%) |
Employment Characteristics in Rock Springs
Employment by Class of Employer in Rock Springs
Among the 187 employed individuals in Rock Springs, private company employees (150 | 80.2%), self-employed (not incorporated) (30 | 16.0%), and local government employees (7 | 3.7%) make up the most common classes of employment.
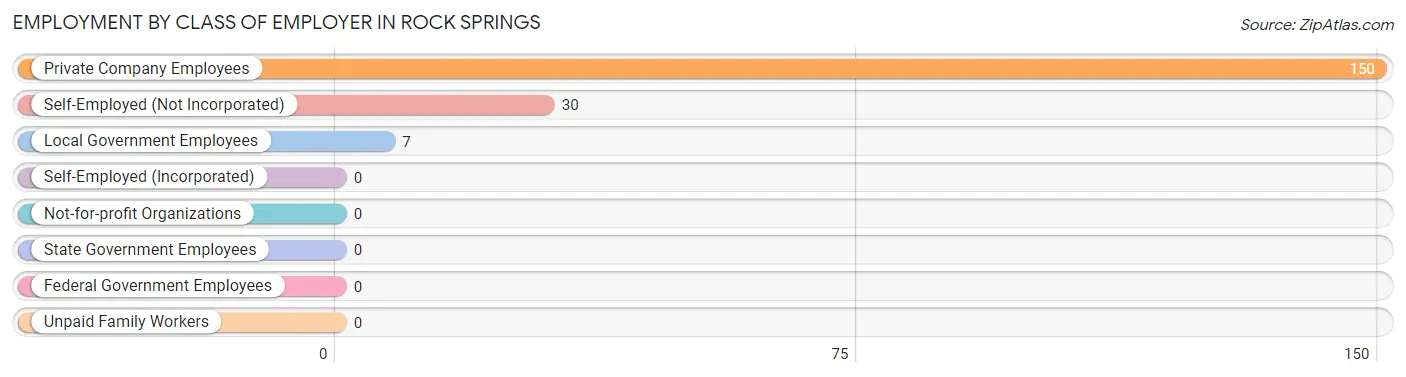
| Employer Class | # Employees | % Employees |
| Private Company Employees | 150 | 80.2% |
| Self-Employed (Incorporated) | 0 | 0.0% |
| Self-Employed (Not Incorporated) | 30 | 16.0% |
| Not-for-profit Organizations | 0 | 0.0% |
| Local Government Employees | 7 | 3.7% |
| State Government Employees | 0 | 0.0% |
| Federal Government Employees | 0 | 0.0% |
| Unpaid Family Workers | 0 | 0.0% |
| Total | 187 | 100.0% |
Employment Status by Age in Rock Springs
According to the labor force statistics for Rock Springs, out of the total population over 16 years of age (263), 76.0% or 200 individuals are in the labor force, with 3.0% or 6 of them unemployed. The age group with the highest labor force participation rate is 25 to 29 years, with 98.0% or 48 individuals in the labor force. Within the labor force, the 20 to 24 years age range has the highest percentage of unemployed individuals, with 100.0% or 1 of them being unemployed.
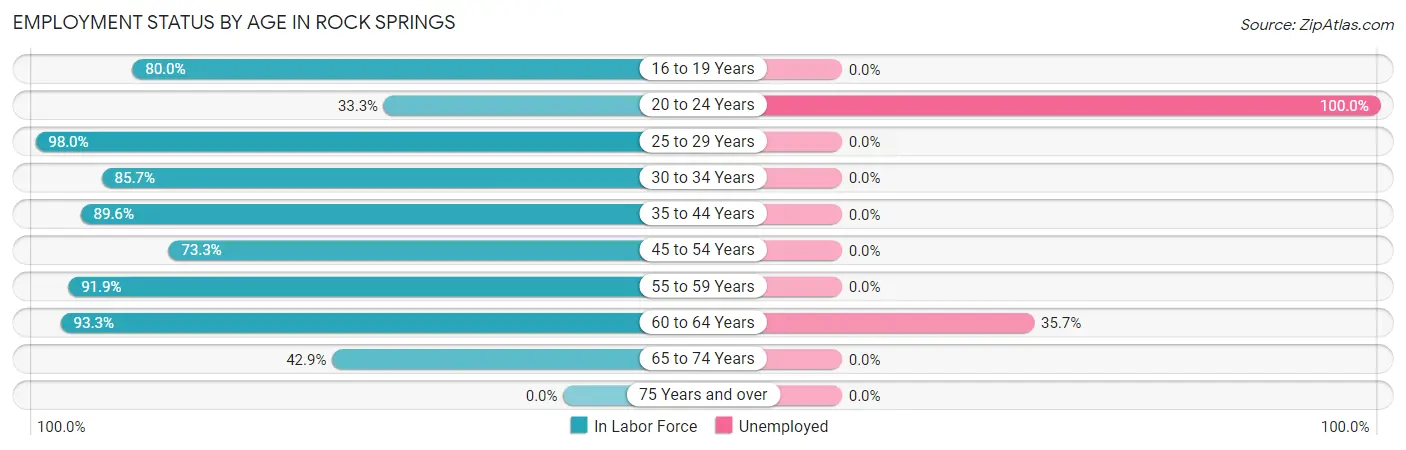
| Age Bracket | In Labor Force | Unemployed |
| 16 to 19 Years | 16 (80.0%) | 0 (0.0%) |
| 20 to 24 Years | 1 (33.3%) | 1 (100.0%) |
| 25 to 29 Years | 48 (98.0%) | 0 (0.0%) |
| 30 to 34 Years | 12 (85.7%) | 0 (0.0%) |
| 35 to 44 Years | 43 (89.6%) | 0 (0.0%) |
| 45 to 54 Years | 11 (73.3%) | 0 (0.0%) |
| 55 to 59 Years | 34 (91.9%) | 0 (0.0%) |
| 60 to 64 Years | 14 (93.3%) | 5 (35.7%) |
| 65 to 74 Years | 21 (42.9%) | 0 (0.0%) |
| 75 Years and over | 0 (0.0%) | 0 (0.0%) |
| Total | 200 (76.0%) | 6 (3.0%) |
Employment Status by Educational Attainment in Rock Springs
According to labor force statistics for Rock Springs, 91.0% of individuals (162) out of the total population between 25 and 64 years of age (178) are in the labor force, with 3.1% or 5 of them being unemployed. The group with the highest labor force participation rate are those with the educational attainment of high school diploma, with 92.6% or 63 individuals in the labor force. Within the labor force, individuals with high school diploma education have the highest percentage of unemployment, with 7.9% or 5 of them being unemployed.
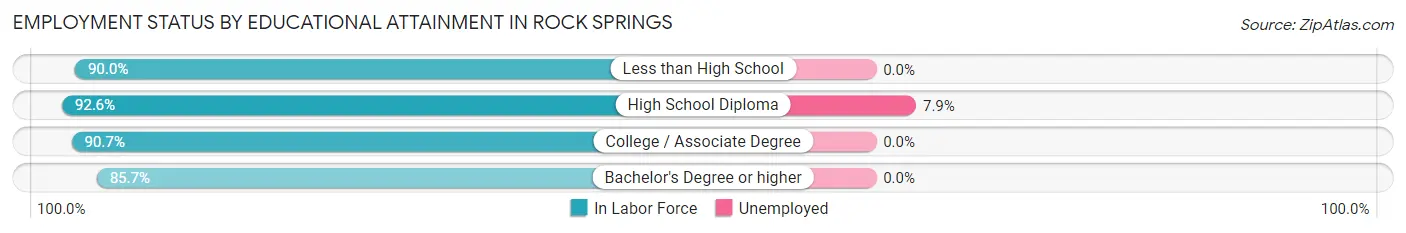
| Educational Attainment | In Labor Force | Unemployed |
| Less than High School | 9 (90.0%) | 0 (0.0%) |
| High School Diploma | 63 (92.6%) | 5 (7.9%) |
| College / Associate Degree | 78 (90.7%) | 0 (0.0%) |
| Bachelor's Degree or higher | 12 (85.7%) | 0 (0.0%) |
| Total | 162 (91.0%) | 6 (3.1%) |
Employment Occupations by Sex in Rock Springs
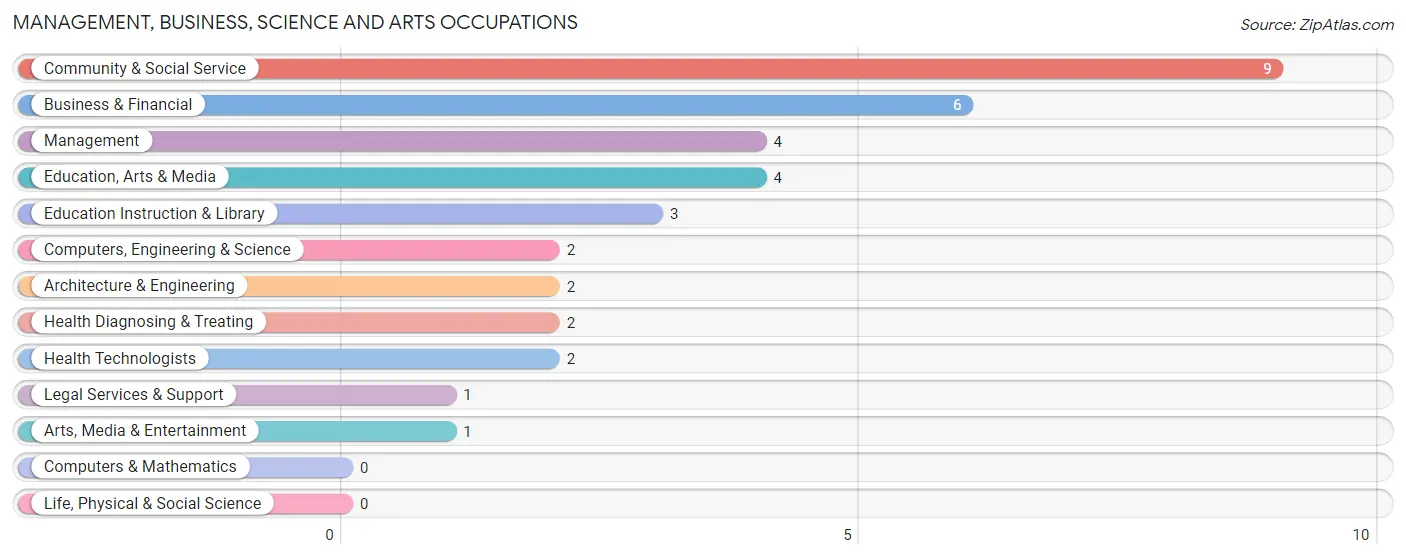
Management, Business, Science and Arts Occupations
The most common Management, Business, Science and Arts occupations in Rock Springs are Community & Social Service (9 | 4.6%), Business & Financial (6 | 3.1%), Management (4 | 2.1%), Education, Arts & Media (4 | 2.1%), and Education Instruction & Library (3 | 1.5%).
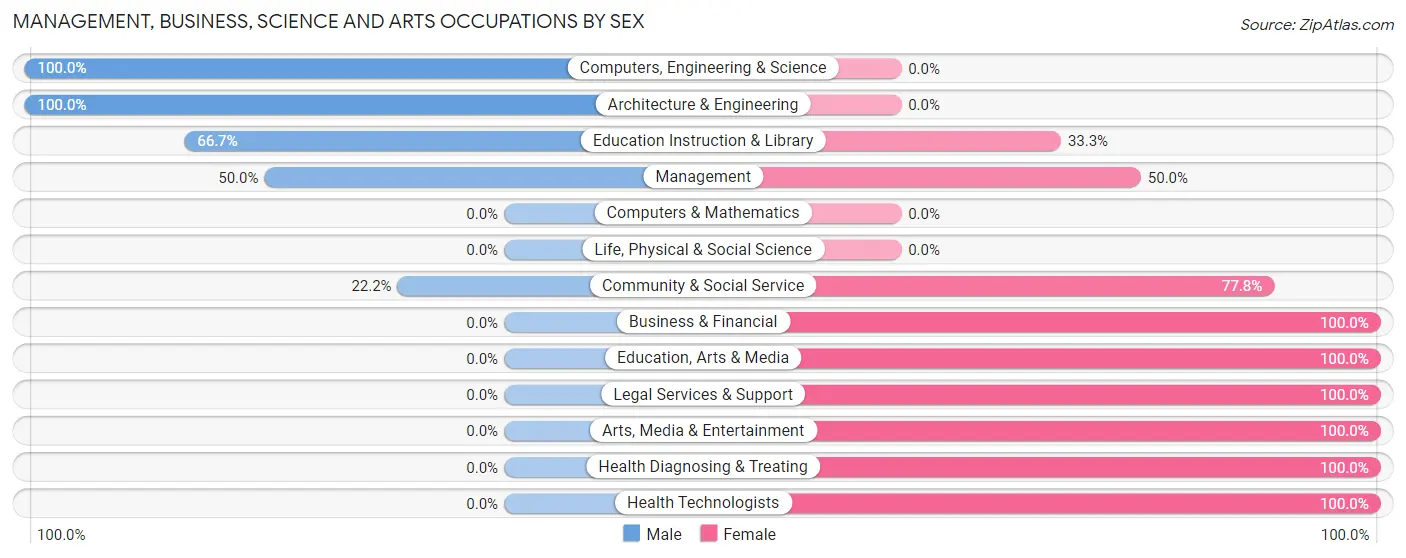
Management, Business, Science and Arts Occupations by Sex
Within the Management, Business, Science and Arts occupations in Rock Springs, the most male-oriented occupations are Computers, Engineering & Science (100.0%), Architecture & Engineering (100.0%), and Education Instruction & Library (66.7%), while the most female-oriented occupations are Business & Financial (100.0%), Education, Arts & Media (100.0%), and Legal Services & Support (100.0%).
| Occupation | Male | Female |
| Management | 2 (50.0%) | 2 (50.0%) |
| Business & Financial | 0 (0.0%) | 6 (100.0%) |
| Computers, Engineering & Science | 2 (100.0%) | 0 (0.0%) |
| Computers & Mathematics | 0 (0.0%) | 0 (0.0%) |
| Architecture & Engineering | 2 (100.0%) | 0 (0.0%) |
| Life, Physical & Social Science | 0 (0.0%) | 0 (0.0%) |
| Community & Social Service | 2 (22.2%) | 7 (77.8%) |
| Education, Arts & Media | 0 (0.0%) | 4 (100.0%) |
| Legal Services & Support | 0 (0.0%) | 1 (100.0%) |
| Education Instruction & Library | 2 (66.7%) | 1 (33.3%) |
| Arts, Media & Entertainment | 0 (0.0%) | 1 (100.0%) |
| Health Diagnosing & Treating | 0 (0.0%) | 2 (100.0%) |
| Health Technologists | 0 (0.0%) | 2 (100.0%) |
| Total (Category) | 6 (26.1%) | 17 (73.9%) |
| Total (Overall) | 109 (56.2%) | 85 (43.8%) |
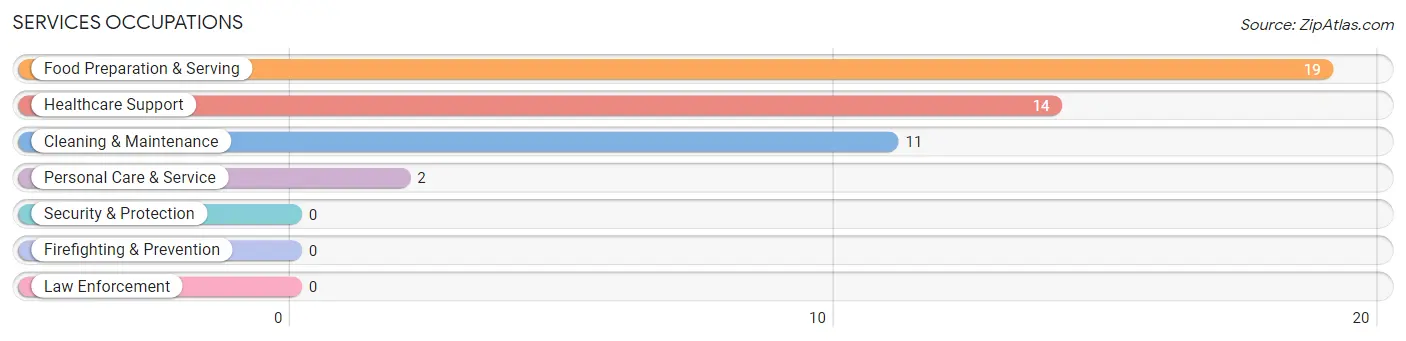
Services Occupations
The most common Services occupations in Rock Springs are Food Preparation & Serving (19 | 9.8%), Healthcare Support (14 | 7.2%), Cleaning & Maintenance (11 | 5.7%), and Personal Care & Service (2 | 1.0%).
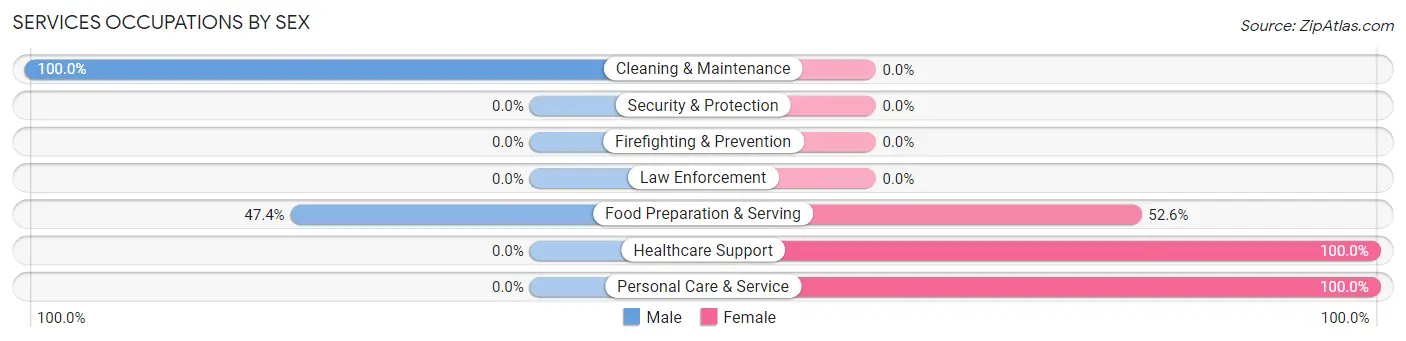
Services Occupations by Sex
Within the Services occupations in Rock Springs, the most male-oriented occupations are Cleaning & Maintenance (100.0%), and Food Preparation & Serving (47.4%), while the most female-oriented occupations are Healthcare Support (100.0%), Personal Care & Service (100.0%), and Food Preparation & Serving (52.6%).
| Occupation | Male | Female |
| Healthcare Support | 0 (0.0%) | 14 (100.0%) |
| Security & Protection | 0 (0.0%) | 0 (0.0%) |
| Firefighting & Prevention | 0 (0.0%) | 0 (0.0%) |
| Law Enforcement | 0 (0.0%) | 0 (0.0%) |
| Food Preparation & Serving | 9 (47.4%) | 10 (52.6%) |
| Cleaning & Maintenance | 11 (100.0%) | 0 (0.0%) |
| Personal Care & Service | 0 (0.0%) | 2 (100.0%) |
| Total (Category) | 20 (43.5%) | 26 (56.5%) |
| Total (Overall) | 109 (56.2%) | 85 (43.8%) |
Sales and Office Occupations
The most common Sales and Office occupations in Rock Springs are Sales & Related (36 | 18.6%), and Office & Administration (5 | 2.6%).
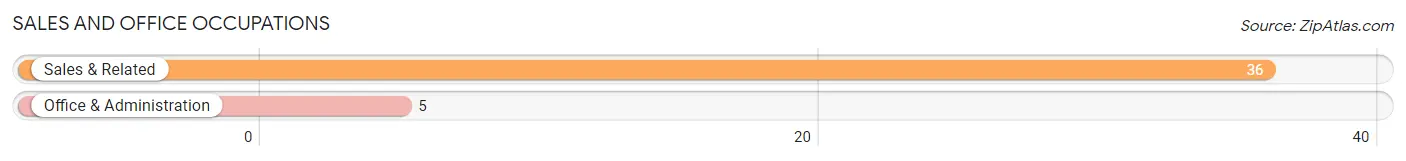
Sales and Office Occupations by Sex
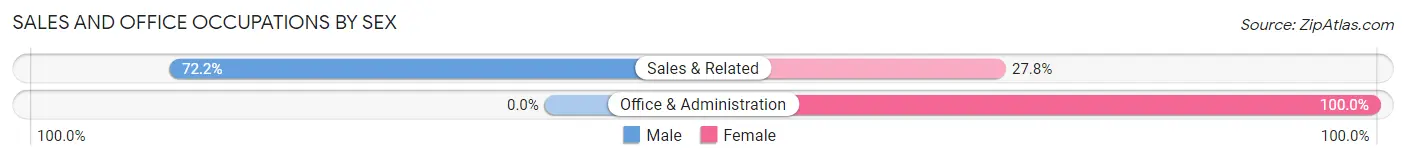
| Occupation | Male | Female |
| Sales & Related | 26 (72.2%) | 10 (27.8%) |
| Office & Administration | 0 (0.0%) | 5 (100.0%) |
| Total (Category) | 26 (63.4%) | 15 (36.6%) |
| Total (Overall) | 109 (56.2%) | 85 (43.8%) |
Natural Resources, Construction and Maintenance Occupations
The most common Natural Resources, Construction and Maintenance occupations in Rock Springs are Construction & Extraction (16 | 8.3%), and Installation, Maintenance & Repair (12 | 6.2%).
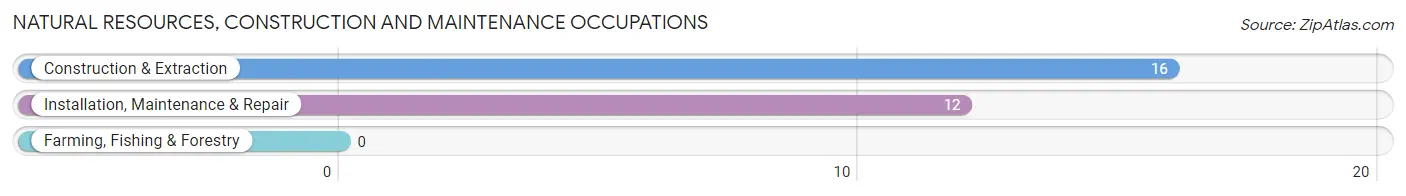
Natural Resources, Construction and Maintenance Occupations by Sex
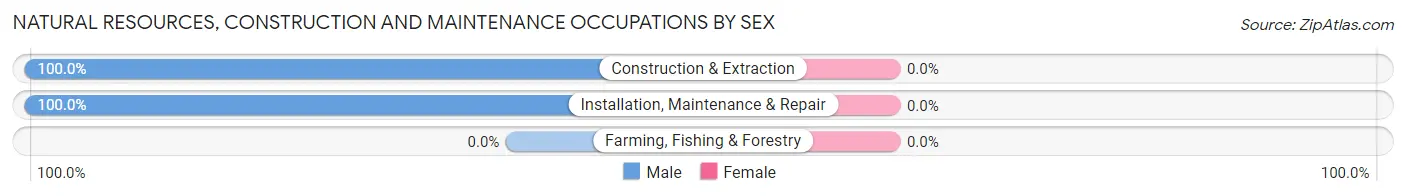
| Occupation | Male | Female |
| Farming, Fishing & Forestry | 0 (0.0%) | 0 (0.0%) |
| Construction & Extraction | 16 (100.0%) | 0 (0.0%) |
| Installation, Maintenance & Repair | 12 (100.0%) | 0 (0.0%) |
| Total (Category) | 28 (100.0%) | 0 (0.0%) |
| Total (Overall) | 109 (56.2%) | 85 (43.8%) |
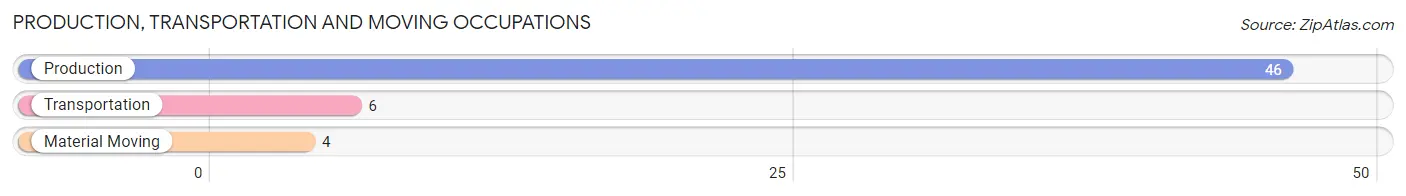
Production, Transportation and Moving Occupations
The most common Production, Transportation and Moving occupations in Rock Springs are Production (46 | 23.7%), Transportation (6 | 3.1%), and Material Moving (4 | 2.1%).
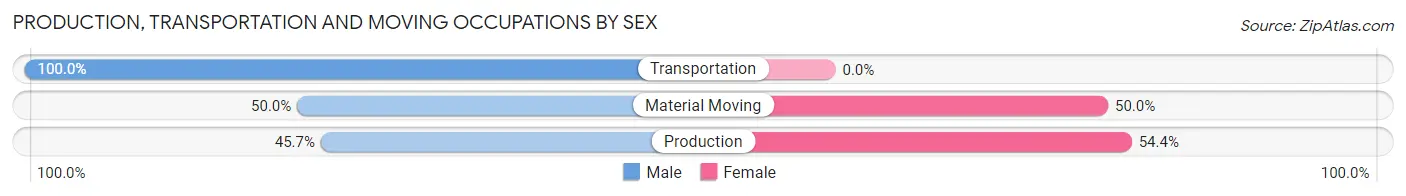
Production, Transportation and Moving Occupations by Sex
| Occupation | Male | Female |
| Production | 21 (45.7%) | 25 (54.3%) |
| Transportation | 6 (100.0%) | 0 (0.0%) |
| Material Moving | 2 (50.0%) | 2 (50.0%) |
| Total (Category) | 29 (51.8%) | 27 (48.2%) |
| Total (Overall) | 109 (56.2%) | 85 (43.8%) |
Employment Industries by Sex in Rock Springs
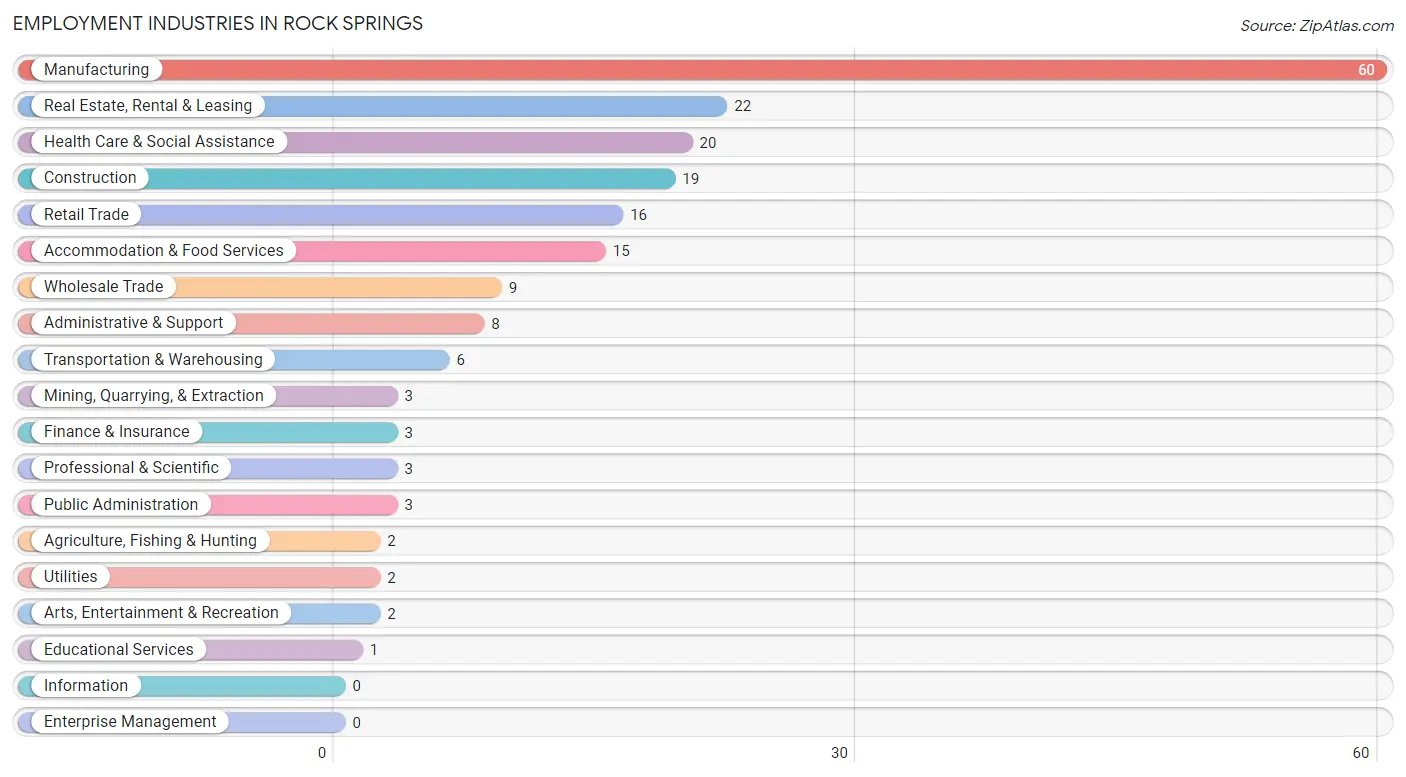
Employment Industries in Rock Springs
The major employment industries in Rock Springs include Manufacturing (60 | 30.9%), Real Estate, Rental & Leasing (22 | 11.3%), Health Care & Social Assistance (20 | 10.3%), Construction (19 | 9.8%), and Retail Trade (16 | 8.3%).
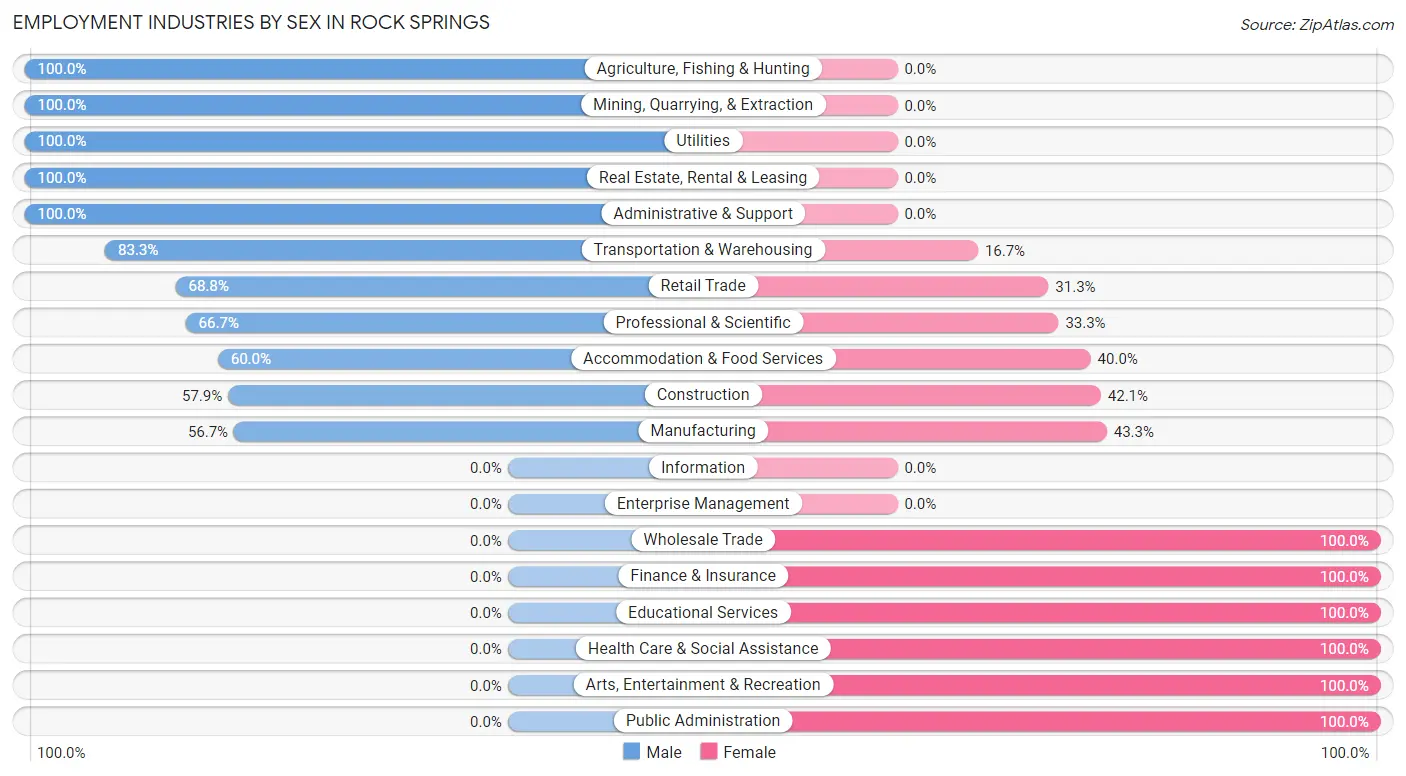
Employment Industries by Sex in Rock Springs
The Rock Springs industries that see more men than women are Agriculture, Fishing & Hunting (100.0%), Mining, Quarrying, & Extraction (100.0%), and Utilities (100.0%), whereas the industries that tend to have a higher number of women are Wholesale Trade (100.0%), Finance & Insurance (100.0%), and Educational Services (100.0%).
| Industry | Male | Female |
| Agriculture, Fishing & Hunting | 2 (100.0%) | 0 (0.0%) |
| Mining, Quarrying, & Extraction | 3 (100.0%) | 0 (0.0%) |
| Construction | 11 (57.9%) | 8 (42.1%) |
| Manufacturing | 34 (56.7%) | 26 (43.3%) |
| Wholesale Trade | 0 (0.0%) | 9 (100.0%) |
| Retail Trade | 11 (68.8%) | 5 (31.2%) |
| Transportation & Warehousing | 5 (83.3%) | 1 (16.7%) |
| Utilities | 2 (100.0%) | 0 (0.0%) |
| Information | 0 (0.0%) | 0 (0.0%) |
| Finance & Insurance | 0 (0.0%) | 3 (100.0%) |
| Real Estate, Rental & Leasing | 22 (100.0%) | 0 (0.0%) |
| Professional & Scientific | 2 (66.7%) | 1 (33.3%) |
| Enterprise Management | 0 (0.0%) | 0 (0.0%) |
| Administrative & Support | 8 (100.0%) | 0 (0.0%) |
| Educational Services | 0 (0.0%) | 1 (100.0%) |
| Health Care & Social Assistance | 0 (0.0%) | 20 (100.0%) |
| Arts, Entertainment & Recreation | 0 (0.0%) | 2 (100.0%) |
| Accommodation & Food Services | 9 (60.0%) | 6 (40.0%) |
| Public Administration | 0 (0.0%) | 3 (100.0%) |
| Total | 109 (56.2%) | 85 (43.8%) |
Education in Rock Springs
School Enrollment in Rock Springs
The most common levels of schooling among the 56 students in Rock Springs are high school (24 | 42.9%), elementary school (15 | 26.8%), and middle school (9 | 16.1%).
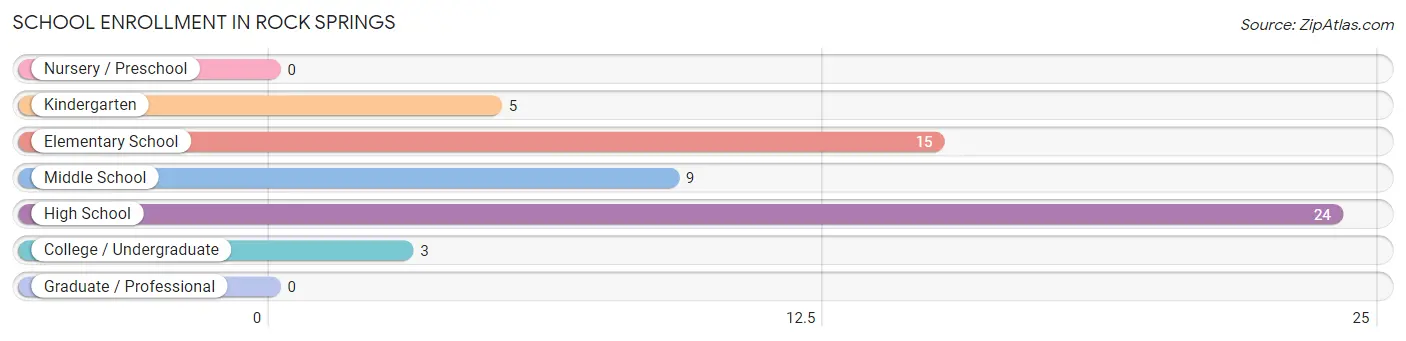
| School Level | # Students | % Students |
| Nursery / Preschool | 0 | 0.0% |
| Kindergarten | 5 | 8.9% |
| Elementary School | 15 | 26.8% |
| Middle School | 9 | 16.1% |
| High School | 24 | 42.9% |
| College / Undergraduate | 3 | 5.4% |
| Graduate / Professional | 0 | 0.0% |
| Total | 56 | 100.0% |
School Enrollment by Age by Funding Source in Rock Springs
Out of a total of 56 students who are enrolled in schools in Rock Springs, 10 (17.9%) attend a private institution, while the remaining 46 (82.1%) are enrolled in public schools. The age group of 5 to 9 year old has the highest likelihood of being enrolled in private schools, with 9 (52.9% in the age bracket) enrolled. Conversely, the age group of 15 to 17 year olds has the lowest likelihood of being enrolled in a private school, with 17 (100.0% in the age bracket) attending a public institution.
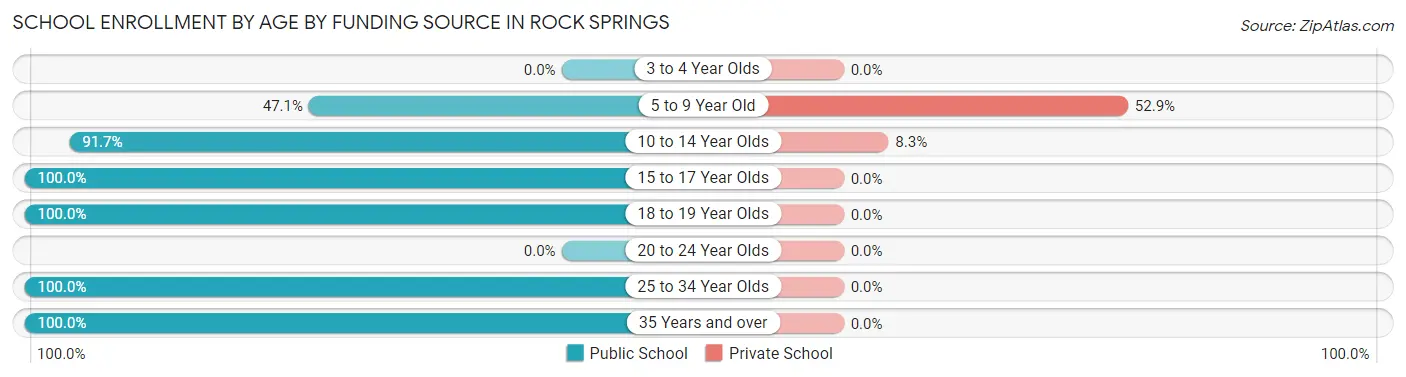
| Age Bracket | Public School | Private School |
| 3 to 4 Year Olds | 0 (0.0%) | 0 (0.0%) |
| 5 to 9 Year Old | 8 (47.1%) | 9 (52.9%) |
| 10 to 14 Year Olds | 11 (91.7%) | 1 (8.3%) |
| 15 to 17 Year Olds | 17 (100.0%) | 0 (0.0%) |
| 18 to 19 Year Olds | 7 (100.0%) | 0 (0.0%) |
| 20 to 24 Year Olds | 0 (0.0%) | 0 (0.0%) |
| 25 to 34 Year Olds | 1 (100.0%) | 0 (0.0%) |
| 35 Years and over | 2 (100.0%) | 0 (0.0%) |
| Total | 46 (82.1%) | 10 (17.9%) |
Educational Attainment by Field of Study in Rock Springs
Business (6 | 33.3%), psychology (4 | 22.2%), liberal arts & history (3 | 16.7%), arts & humanities (3 | 16.7%), and computers & mathematics (1 | 5.6%) are the most common fields of study among 18 individuals in Rock Springs who have obtained a bachelor's degree or higher.
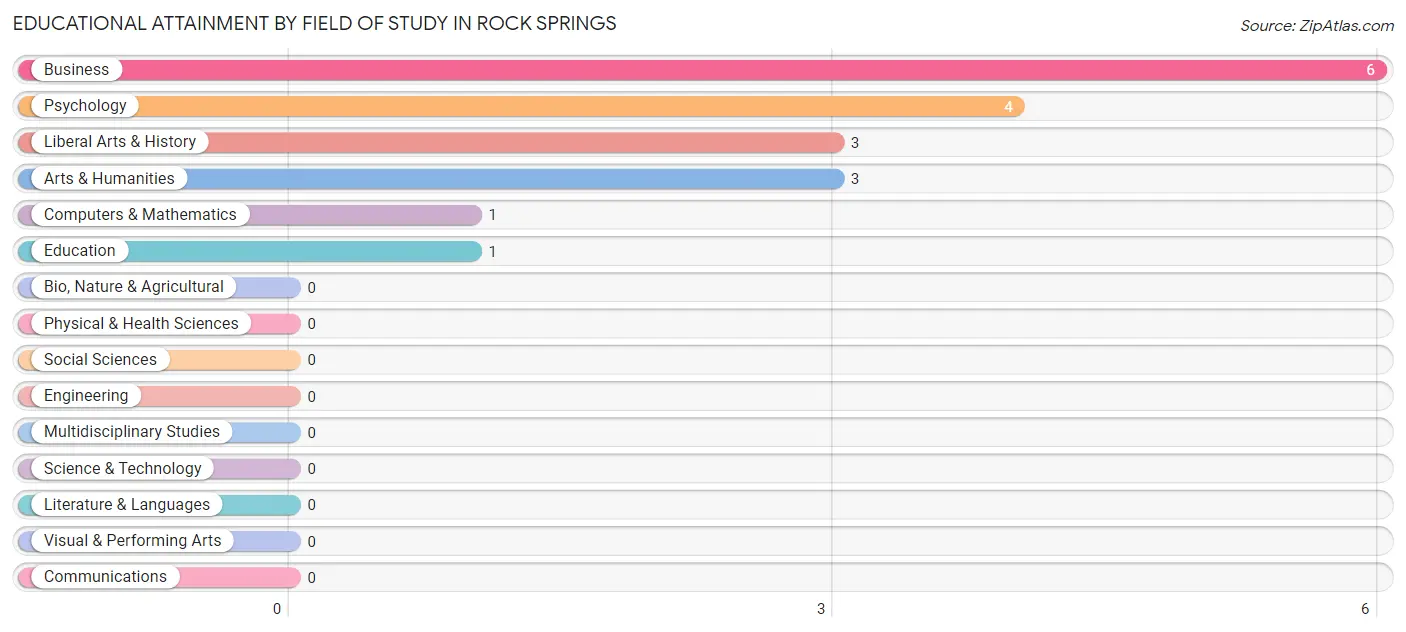
| Field of Study | # Graduates | % Graduates |
| Computers & Mathematics | 1 | 5.6% |
| Bio, Nature & Agricultural | 0 | 0.0% |
| Physical & Health Sciences | 0 | 0.0% |
| Psychology | 4 | 22.2% |
| Social Sciences | 0 | 0.0% |
| Engineering | 0 | 0.0% |
| Multidisciplinary Studies | 0 | 0.0% |
| Science & Technology | 0 | 0.0% |
| Business | 6 | 33.3% |
| Education | 1 | 5.6% |
| Literature & Languages | 0 | 0.0% |
| Liberal Arts & History | 3 | 16.7% |
| Visual & Performing Arts | 0 | 0.0% |
| Communications | 0 | 0.0% |
| Arts & Humanities | 3 | 16.7% |
| Total | 18 | 100.0% |
Transportation & Commute in Rock Springs
Vehicle Availability by Sex in Rock Springs
The most prevalent vehicle ownership categories in Rock Springs are males with 2 vehicles (44, accounting for 41.5%) and females with 2 vehicles (26, making up 54.3%).
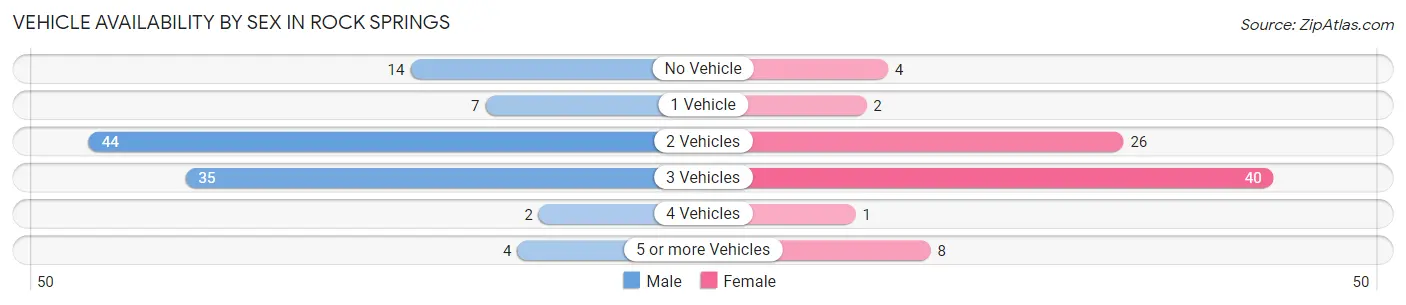
| Vehicles Available | Male | Female |
| No Vehicle | 14 (13.2%) | 4 (4.9%) |
| 1 Vehicle | 7 (6.6%) | 2 (2.5%) |
| 2 Vehicles | 44 (41.5%) | 26 (32.1%) |
| 3 Vehicles | 35 (33.0%) | 40 (49.4%) |
| 4 Vehicles | 2 (1.9%) | 1 (1.2%) |
| 5 or more Vehicles | 4 (3.8%) | 8 (9.9%) |
| Total | 106 (100.0%) | 81 (100.0%) |
Commute Time in Rock Springs
The most frequently occuring commute durations in Rock Springs are 15 to 19 minutes (68 commuters, 37.2%), 25 to 29 minutes (22 commuters, 12.0%), and 35 to 39 minutes (21 commuters, 11.5%).
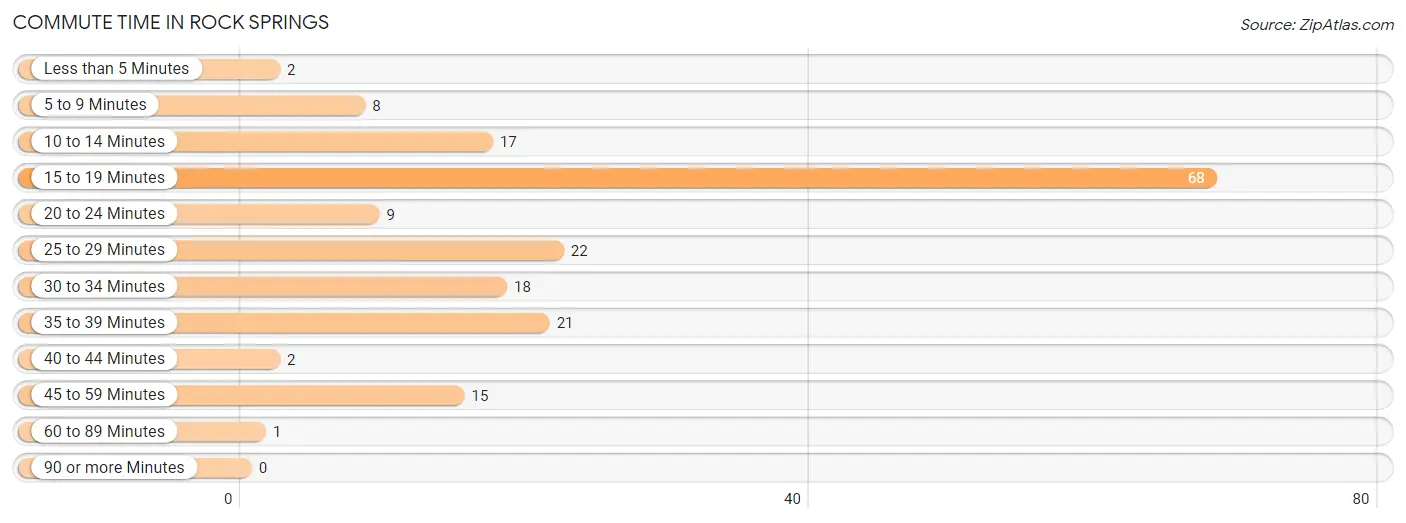
| Commute Time | # Commuters | % Commuters |
| Less than 5 Minutes | 2 | 1.1% |
| 5 to 9 Minutes | 8 | 4.4% |
| 10 to 14 Minutes | 17 | 9.3% |
| 15 to 19 Minutes | 68 | 37.2% |
| 20 to 24 Minutes | 9 | 4.9% |
| 25 to 29 Minutes | 22 | 12.0% |
| 30 to 34 Minutes | 18 | 9.8% |
| 35 to 39 Minutes | 21 | 11.5% |
| 40 to 44 Minutes | 2 | 1.1% |
| 45 to 59 Minutes | 15 | 8.2% |
| 60 to 89 Minutes | 1 | 0.5% |
| 90 or more Minutes | 0 | 0.0% |
Commute Time by Sex in Rock Springs
The most common commute times in Rock Springs are 15 to 19 minutes (44 commuters, 42.7%) for males and 15 to 19 minutes (24 commuters, 30.0%) for females.
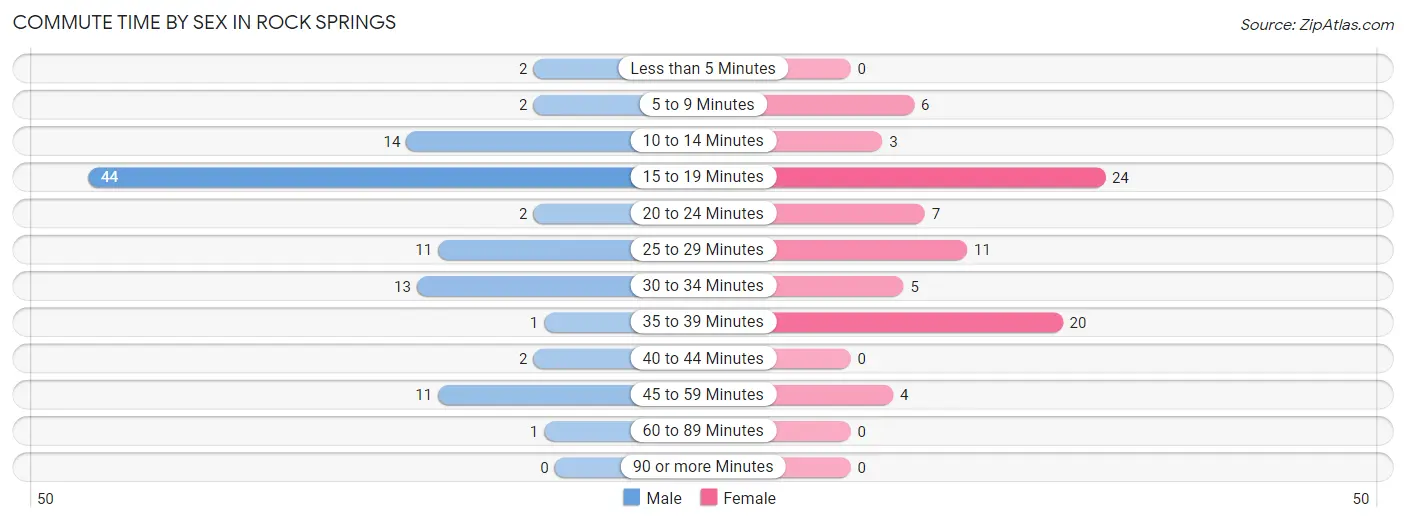
| Commute Time | Male | Female |
| Less than 5 Minutes | 2 (1.9%) | 0 (0.0%) |
| 5 to 9 Minutes | 2 (1.9%) | 6 (7.5%) |
| 10 to 14 Minutes | 14 (13.6%) | 3 (3.7%) |
| 15 to 19 Minutes | 44 (42.7%) | 24 (30.0%) |
| 20 to 24 Minutes | 2 (1.9%) | 7 (8.7%) |
| 25 to 29 Minutes | 11 (10.7%) | 11 (13.8%) |
| 30 to 34 Minutes | 13 (12.6%) | 5 (6.2%) |
| 35 to 39 Minutes | 1 (1.0%) | 20 (25.0%) |
| 40 to 44 Minutes | 2 (1.9%) | 0 (0.0%) |
| 45 to 59 Minutes | 11 (10.7%) | 4 (5.0%) |
| 60 to 89 Minutes | 1 (1.0%) | 0 (0.0%) |
| 90 or more Minutes | 0 (0.0%) | 0 (0.0%) |
Time of Departure to Work by Sex in Rock Springs
The most frequent times of departure to work in Rock Springs are 8:30 AM to 8:59 AM (22, 21.4%) for males and 6:30 AM to 6:59 AM (24, 30.0%) for females.
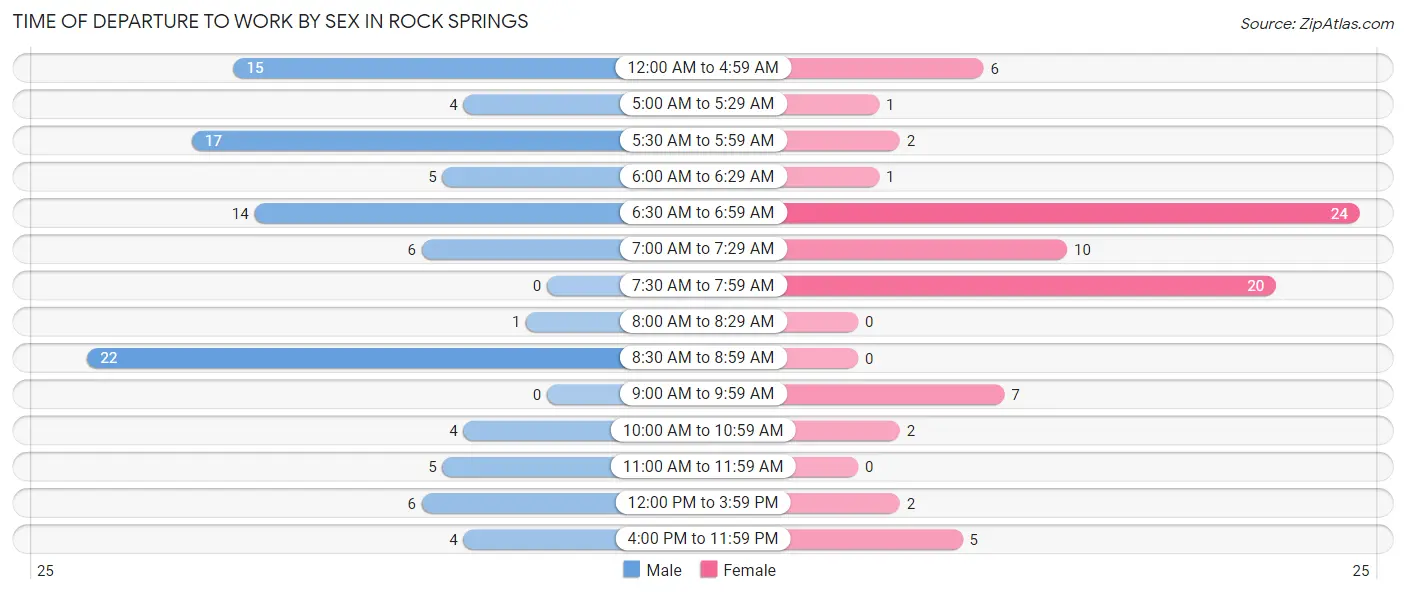
| Time of Departure | Male | Female |
| 12:00 AM to 4:59 AM | 15 (14.6%) | 6 (7.5%) |
| 5:00 AM to 5:29 AM | 4 (3.9%) | 1 (1.3%) |
| 5:30 AM to 5:59 AM | 17 (16.5%) | 2 (2.5%) |
| 6:00 AM to 6:29 AM | 5 (4.9%) | 1 (1.3%) |
| 6:30 AM to 6:59 AM | 14 (13.6%) | 24 (30.0%) |
| 7:00 AM to 7:29 AM | 6 (5.8%) | 10 (12.5%) |
| 7:30 AM to 7:59 AM | 0 (0.0%) | 20 (25.0%) |
| 8:00 AM to 8:29 AM | 1 (1.0%) | 0 (0.0%) |
| 8:30 AM to 8:59 AM | 22 (21.4%) | 0 (0.0%) |
| 9:00 AM to 9:59 AM | 0 (0.0%) | 7 (8.7%) |
| 10:00 AM to 10:59 AM | 4 (3.9%) | 2 (2.5%) |
| 11:00 AM to 11:59 AM | 5 (4.9%) | 0 (0.0%) |
| 12:00 PM to 3:59 PM | 6 (5.8%) | 2 (2.5%) |
| 4:00 PM to 11:59 PM | 4 (3.9%) | 5 (6.2%) |
| Total | 103 (100.0%) | 80 (100.0%) |
Housing Occupancy in Rock Springs
Occupancy by Ownership in Rock Springs
Of the total 144 dwellings in Rock Springs, owner-occupied units account for 118 (81.9%), while renter-occupied units make up 26 (18.1%).
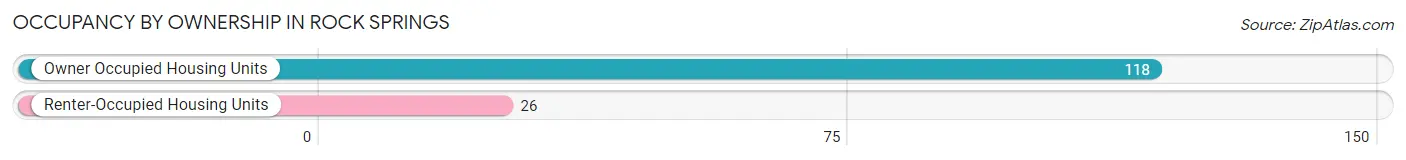
| Occupancy | # Housing Units | % Housing Units |
| Owner Occupied Housing Units | 118 | 81.9% |
| Renter-Occupied Housing Units | 26 | 18.1% |
| Total Occupied Housing Units | 144 | 100.0% |
Occupancy by Household Size in Rock Springs
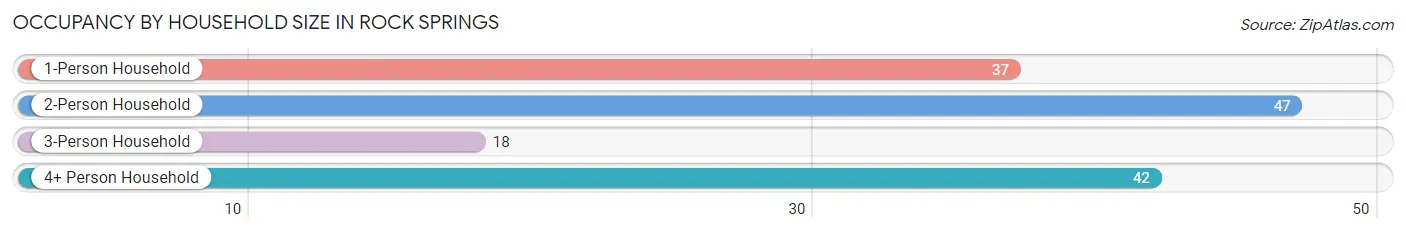
| Household Size | # Housing Units | % Housing Units |
| 1-Person Household | 37 | 25.7% |
| 2-Person Household | 47 | 32.6% |
| 3-Person Household | 18 | 12.5% |
| 4+ Person Household | 42 | 29.2% |
| Total Housing Units | 144 | 100.0% |
Occupancy by Ownership by Household Size in Rock Springs
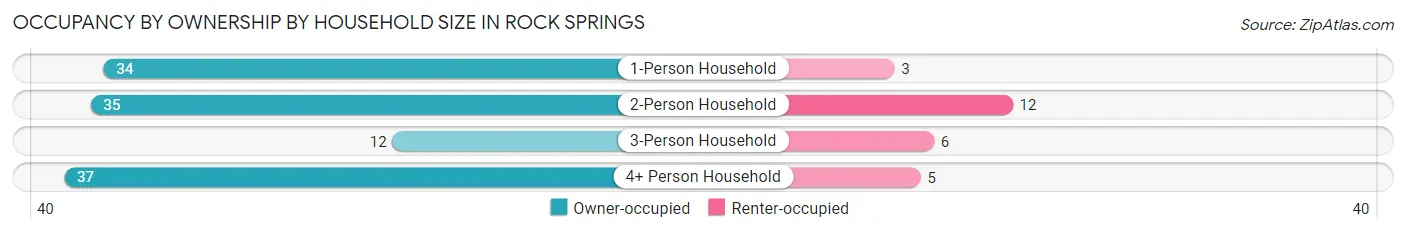
| Household Size | Owner-occupied | Renter-occupied |
| 1-Person Household | 34 (91.9%) | 3 (8.1%) |
| 2-Person Household | 35 (74.5%) | 12 (25.5%) |
| 3-Person Household | 12 (66.7%) | 6 (33.3%) |
| 4+ Person Household | 37 (88.1%) | 5 (11.9%) |
| Total Housing Units | 118 (81.9%) | 26 (18.1%) |
Occupancy by Educational Attainment in Rock Springs
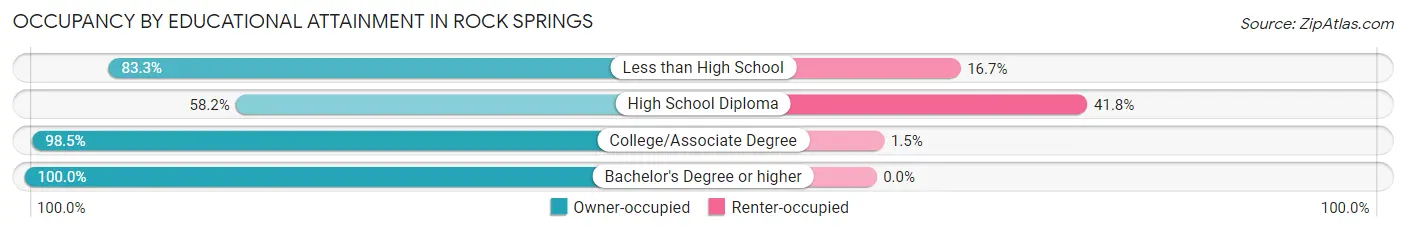
| Household Size | Owner-occupied | Renter-occupied |
| Less than High School | 10 (83.3%) | 2 (16.7%) |
| High School Diploma | 32 (58.2%) | 23 (41.8%) |
| College/Associate Degree | 64 (98.5%) | 1 (1.5%) |
| Bachelor's Degree or higher | 12 (100.0%) | 0 (0.0%) |
Occupancy by Age of Householder in Rock Springs
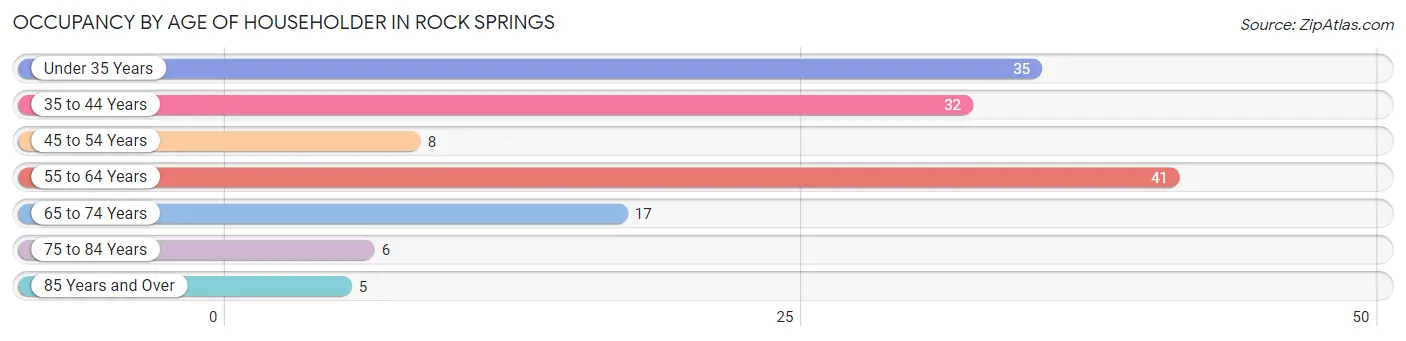
| Age Bracket | # Households | % Households |
| Under 35 Years | 35 | 24.3% |
| 35 to 44 Years | 32 | 22.2% |
| 45 to 54 Years | 8 | 5.6% |
| 55 to 64 Years | 41 | 28.5% |
| 65 to 74 Years | 17 | 11.8% |
| 75 to 84 Years | 6 | 4.2% |
| 85 Years and Over | 5 | 3.5% |
| Total | 144 | 100.0% |
Housing Finances in Rock Springs
Median Income by Occupancy in Rock Springs
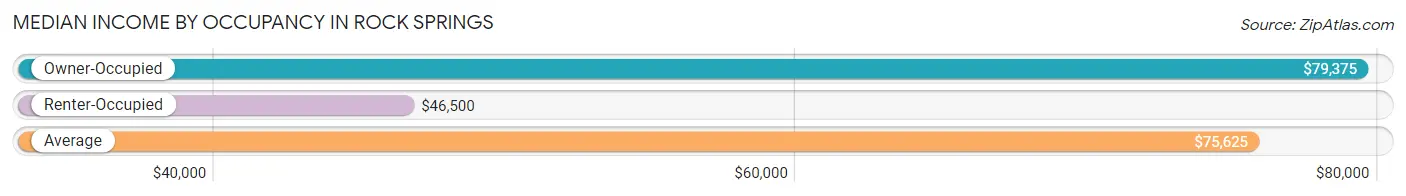
| Occupancy Type | # Households | Median Income |
| Owner-Occupied | 118 (81.9%) | $79,375 |
| Renter-Occupied | 26 (18.1%) | $46,500 |
| Average | 144 (100.0%) | $75,625 |
Occupancy by Householder Income Bracket in Rock Springs
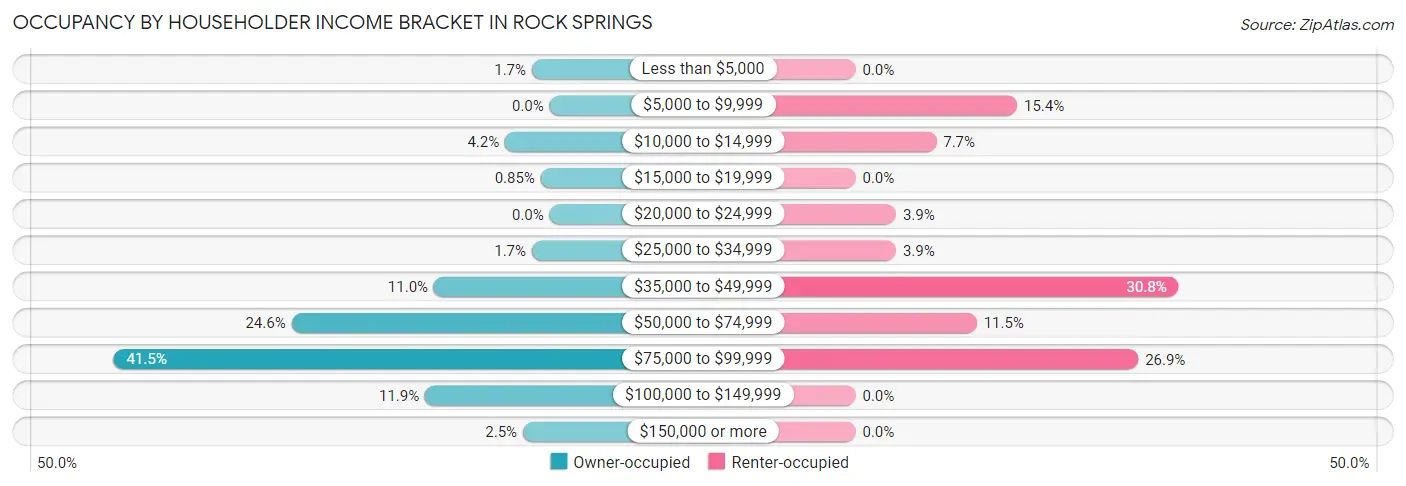
| Income Bracket | Owner-occupied | Renter-occupied |
| Less than $5,000 | 2 (1.7%) | 0 (0.0%) |
| $5,000 to $9,999 | 0 (0.0%) | 4 (15.4%) |
| $10,000 to $14,999 | 5 (4.2%) | 2 (7.7%) |
| $15,000 to $19,999 | 1 (0.9%) | 0 (0.0%) |
| $20,000 to $24,999 | 0 (0.0%) | 1 (3.8%) |
| $25,000 to $34,999 | 2 (1.7%) | 1 (3.8%) |
| $35,000 to $49,999 | 13 (11.0%) | 8 (30.8%) |
| $50,000 to $74,999 | 29 (24.6%) | 3 (11.5%) |
| $75,000 to $99,999 | 49 (41.5%) | 7 (26.9%) |
| $100,000 to $149,999 | 14 (11.9%) | 0 (0.0%) |
| $150,000 or more | 3 (2.5%) | 0 (0.0%) |
| Total | 118 (100.0%) | 26 (100.0%) |
Monthly Housing Cost Tiers in Rock Springs
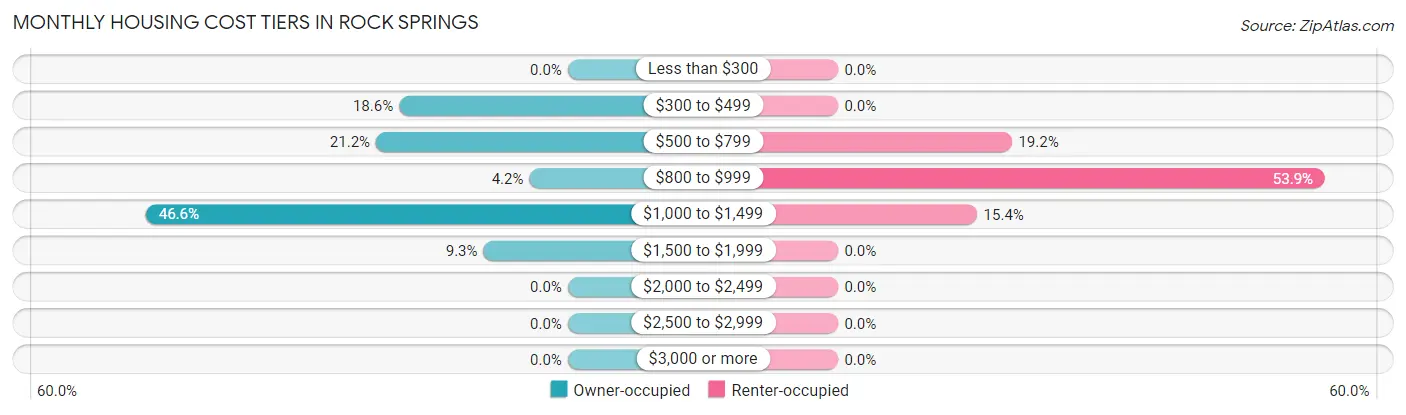
| Monthly Cost | Owner-occupied | Renter-occupied |
| Less than $300 | 0 (0.0%) | 0 (0.0%) |
| $300 to $499 | 22 (18.6%) | 0 (0.0%) |
| $500 to $799 | 25 (21.2%) | 5 (19.2%) |
| $800 to $999 | 5 (4.2%) | 14 (53.8%) |
| $1,000 to $1,499 | 55 (46.6%) | 4 (15.4%) |
| $1,500 to $1,999 | 11 (9.3%) | 0 (0.0%) |
| $2,000 to $2,499 | 0 (0.0%) | 0 (0.0%) |
| $2,500 to $2,999 | 0 (0.0%) | 0 (0.0%) |
| $3,000 or more | 0 (0.0%) | 0 (0.0%) |
| Total | 118 (100.0%) | 26 (100.0%) |
Physical Housing Characteristics in Rock Springs
Housing Structures in Rock Springs
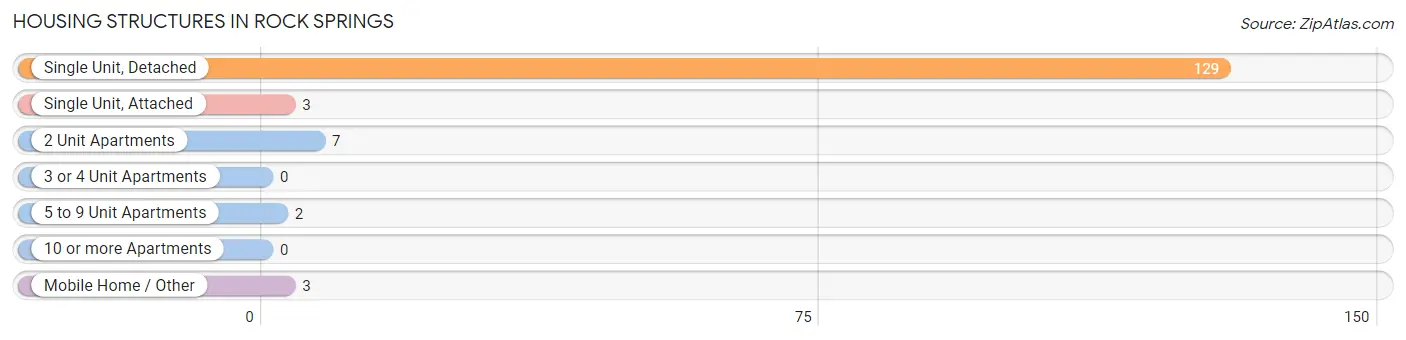
| Structure Type | # Housing Units | % Housing Units |
| Single Unit, Detached | 129 | 89.6% |
| Single Unit, Attached | 3 | 2.1% |
| 2 Unit Apartments | 7 | 4.9% |
| 3 or 4 Unit Apartments | 0 | 0.0% |
| 5 to 9 Unit Apartments | 2 | 1.4% |
| 10 or more Apartments | 0 | 0.0% |
| Mobile Home / Other | 3 | 2.1% |
| Total | 144 | 100.0% |
Housing Structures by Occupancy in Rock Springs
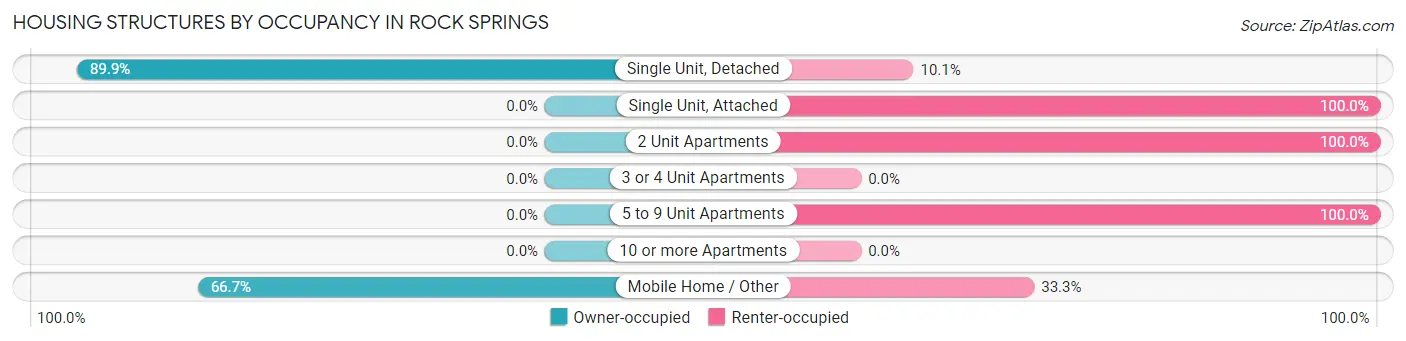
| Structure Type | Owner-occupied | Renter-occupied |
| Single Unit, Detached | 116 (89.9%) | 13 (10.1%) |
| Single Unit, Attached | 0 (0.0%) | 3 (100.0%) |
| 2 Unit Apartments | 0 (0.0%) | 7 (100.0%) |
| 3 or 4 Unit Apartments | 0 (0.0%) | 0 (0.0%) |
| 5 to 9 Unit Apartments | 0 (0.0%) | 2 (100.0%) |
| 10 or more Apartments | 0 (0.0%) | 0 (0.0%) |
| Mobile Home / Other | 2 (66.7%) | 1 (33.3%) |
| Total | 118 (81.9%) | 26 (18.1%) |
Housing Structures by Number of Rooms in Rock Springs
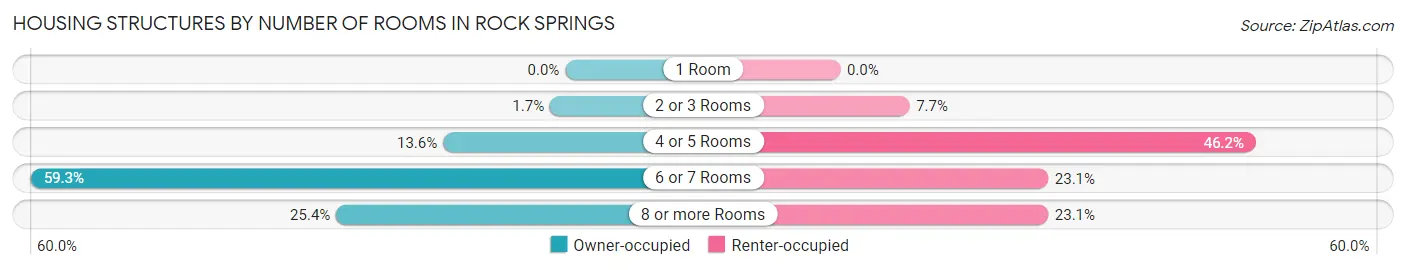
| Number of Rooms | Owner-occupied | Renter-occupied |
| 1 Room | 0 (0.0%) | 0 (0.0%) |
| 2 or 3 Rooms | 2 (1.7%) | 2 (7.7%) |
| 4 or 5 Rooms | 16 (13.6%) | 12 (46.2%) |
| 6 or 7 Rooms | 70 (59.3%) | 6 (23.1%) |
| 8 or more Rooms | 30 (25.4%) | 6 (23.1%) |
| Total | 118 (100.0%) | 26 (100.0%) |
Housing Structure by Heating Type in Rock Springs
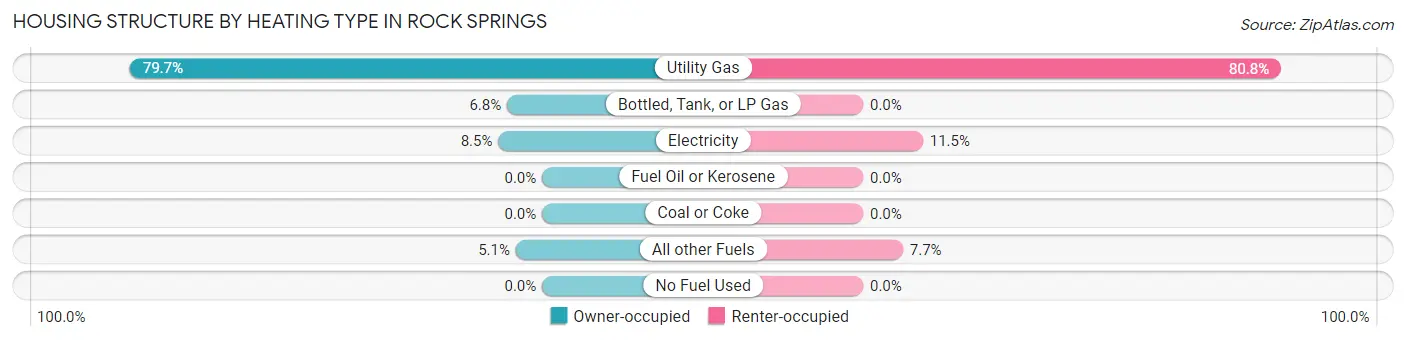
| Heating Type | Owner-occupied | Renter-occupied |
| Utility Gas | 94 (79.7%) | 21 (80.8%) |
| Bottled, Tank, or LP Gas | 8 (6.8%) | 0 (0.0%) |
| Electricity | 10 (8.5%) | 3 (11.5%) |
| Fuel Oil or Kerosene | 0 (0.0%) | 0 (0.0%) |
| Coal or Coke | 0 (0.0%) | 0 (0.0%) |
| All other Fuels | 6 (5.1%) | 2 (7.7%) |
| No Fuel Used | 0 (0.0%) | 0 (0.0%) |
| Total | 118 (100.0%) | 26 (100.0%) |
Household Vehicle Usage in Rock Springs
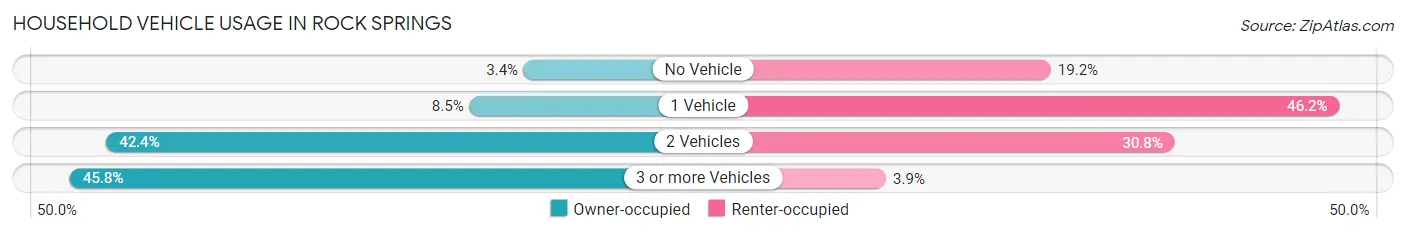
| Vehicles per Household | Owner-occupied | Renter-occupied |
| No Vehicle | 4 (3.4%) | 5 (19.2%) |
| 1 Vehicle | 10 (8.5%) | 12 (46.2%) |
| 2 Vehicles | 50 (42.4%) | 8 (30.8%) |
| 3 or more Vehicles | 54 (45.8%) | 1 (3.8%) |
| Total | 118 (100.0%) | 26 (100.0%) |
Real Estate & Mortgages in Rock Springs
Real Estate and Mortgage Overview in Rock Springs
| Characteristic | Without Mortgage | With Mortgage |
| Housing Units | 33 | 85 |
| Median Property Value | $133,900 | $158,700 |
| Median Household Income | $58,750 | $2 |
| Monthly Housing Costs | $495 | $0 |
| Real Estate Taxes | $2,042 | $0 |
Property Value by Mortgage Status in Rock Springs
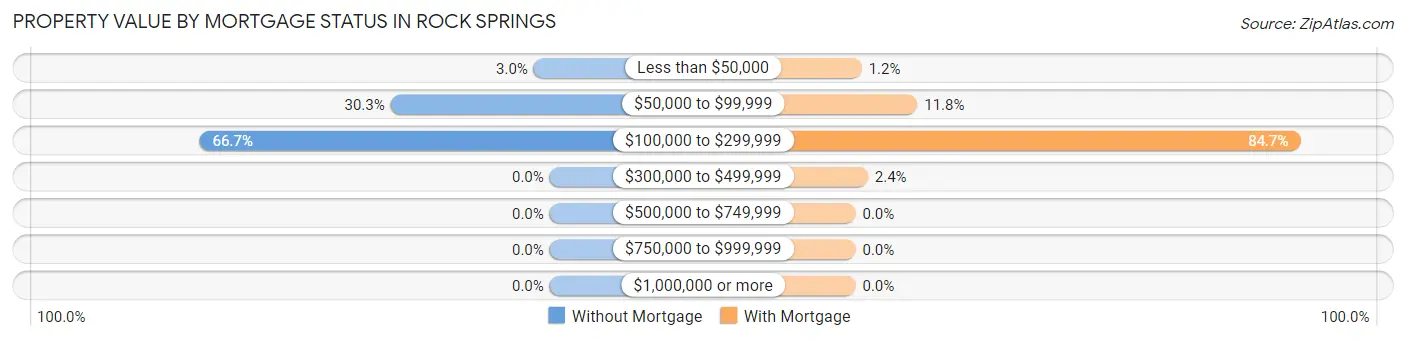
| Property Value | Without Mortgage | With Mortgage |
| Less than $50,000 | 1 (3.0%) | 1 (1.2%) |
| $50,000 to $99,999 | 10 (30.3%) | 10 (11.8%) |
| $100,000 to $299,999 | 22 (66.7%) | 72 (84.7%) |
| $300,000 to $499,999 | 0 (0.0%) | 2 (2.4%) |
| $500,000 to $749,999 | 0 (0.0%) | 0 (0.0%) |
| $750,000 to $999,999 | 0 (0.0%) | 0 (0.0%) |
| $1,000,000 or more | 0 (0.0%) | 0 (0.0%) |
| Total | 33 (100.0%) | 85 (100.0%) |
Household Income by Mortgage Status in Rock Springs
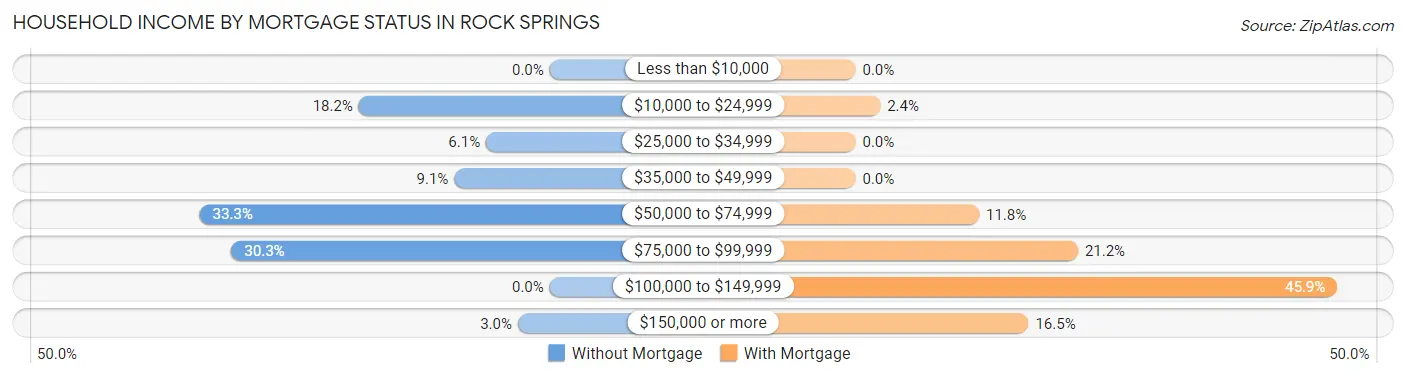
| Household Income | Without Mortgage | With Mortgage |
| Less than $10,000 | 0 (0.0%) | 0 (0.0%) |
| $10,000 to $24,999 | 6 (18.2%) | 2 (2.4%) |
| $25,000 to $34,999 | 2 (6.1%) | 0 (0.0%) |
| $35,000 to $49,999 | 3 (9.1%) | 0 (0.0%) |
| $50,000 to $74,999 | 11 (33.3%) | 10 (11.8%) |
| $75,000 to $99,999 | 10 (30.3%) | 18 (21.2%) |
| $100,000 to $149,999 | 0 (0.0%) | 39 (45.9%) |
| $150,000 or more | 1 (3.0%) | 14 (16.5%) |
| Total | 33 (100.0%) | 85 (100.0%) |
Property Value to Household Income Ratio in Rock Springs
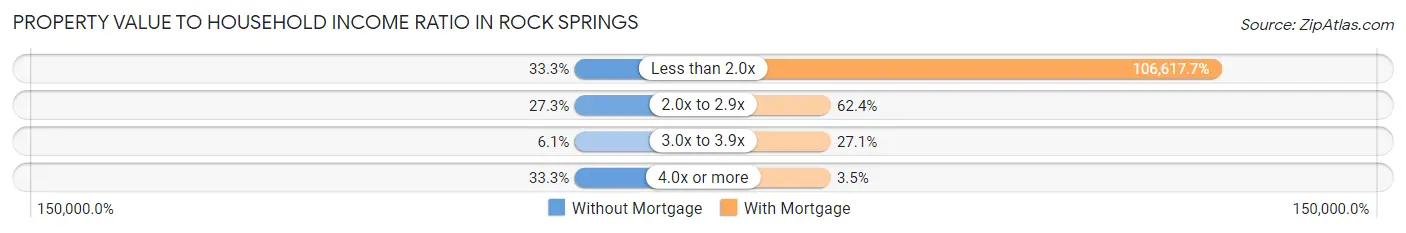
| Value-to-Income Ratio | Without Mortgage | With Mortgage |
| Less than 2.0x | 11 (33.3%) | 90,625 (106,617.7%) |
| 2.0x to 2.9x | 9 (27.3%) | 53 (62.4%) |
| 3.0x to 3.9x | 2 (6.1%) | 23 (27.1%) |
| 4.0x or more | 11 (33.3%) | 3 (3.5%) |
| Total | 33 (100.0%) | 85 (100.0%) |
Real Estate Taxes by Mortgage Status in Rock Springs
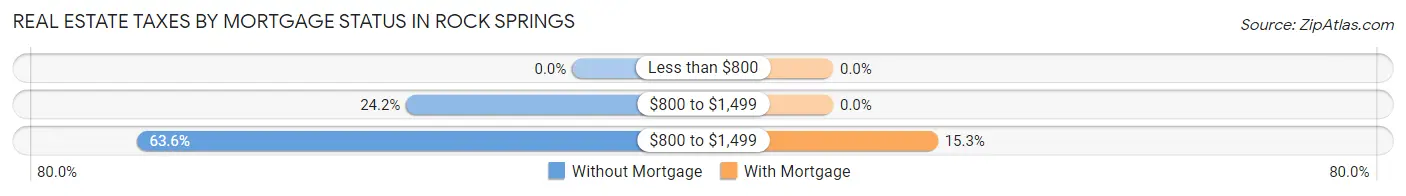
| Property Taxes | Without Mortgage | With Mortgage |
| Less than $800 | 0 (0.0%) | 0 (0.0%) |
| $800 to $1,499 | 8 (24.2%) | 0 (0.0%) |
| $800 to $1,499 | 21 (63.6%) | 13 (15.3%) |
| Total | 33 (100.0%) | 85 (100.0%) |
Health & Disability in Rock Springs
Health Insurance Coverage by Age in Rock Springs
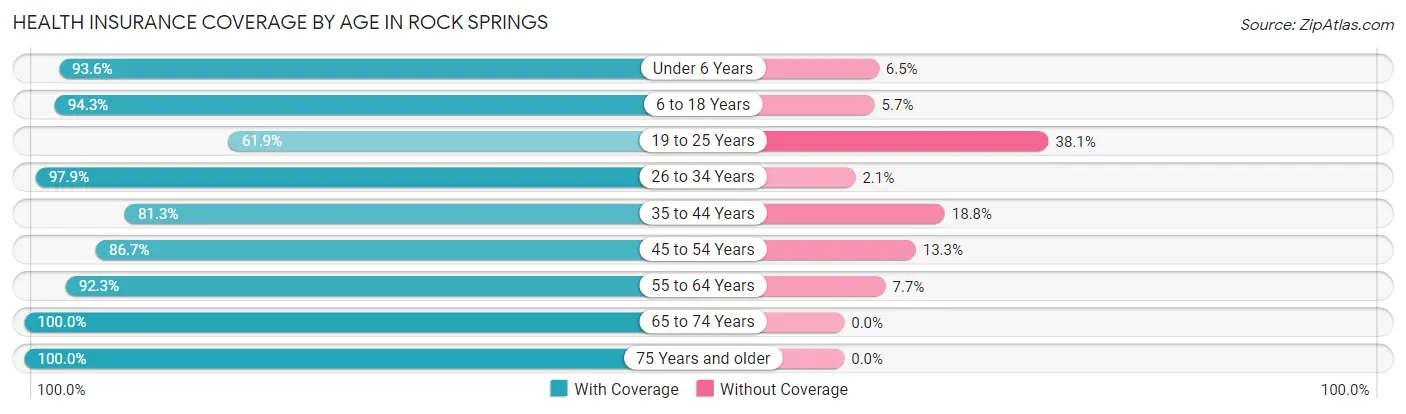
| Age Bracket | With Coverage | Without Coverage |
| Under 6 Years | 29 (93.5%) | 2 (6.5%) |
| 6 to 18 Years | 50 (94.3%) | 3 (5.7%) |
| 19 to 25 Years | 13 (61.9%) | 8 (38.1%) |
| 26 to 34 Years | 47 (97.9%) | 1 (2.1%) |
| 35 to 44 Years | 39 (81.2%) | 9 (18.8%) |
| 45 to 54 Years | 13 (86.7%) | 2 (13.3%) |
| 55 to 64 Years | 48 (92.3%) | 4 (7.7%) |
| 65 to 74 Years | 49 (100.0%) | 0 (0.0%) |
| 75 Years and older | 13 (100.0%) | 0 (0.0%) |
| Total | 301 (91.2%) | 29 (8.8%) |
Health Insurance Coverage by Citizenship Status in Rock Springs
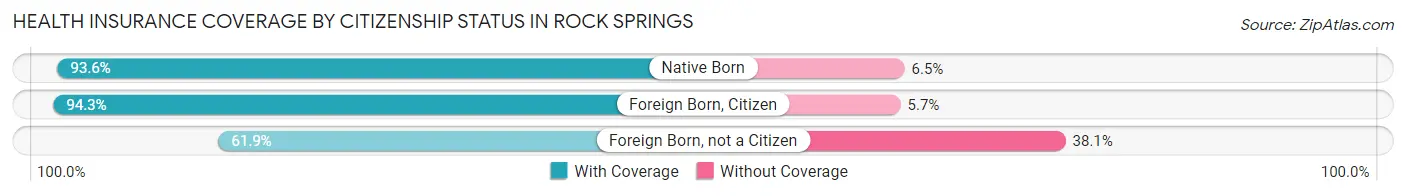
| Citizenship Status | With Coverage | Without Coverage |
| Native Born | 29 (93.5%) | 2 (6.5%) |
| Foreign Born, Citizen | 50 (94.3%) | 3 (5.7%) |
| Foreign Born, not a Citizen | 13 (61.9%) | 8 (38.1%) |
Health Insurance Coverage by Household Income in Rock Springs
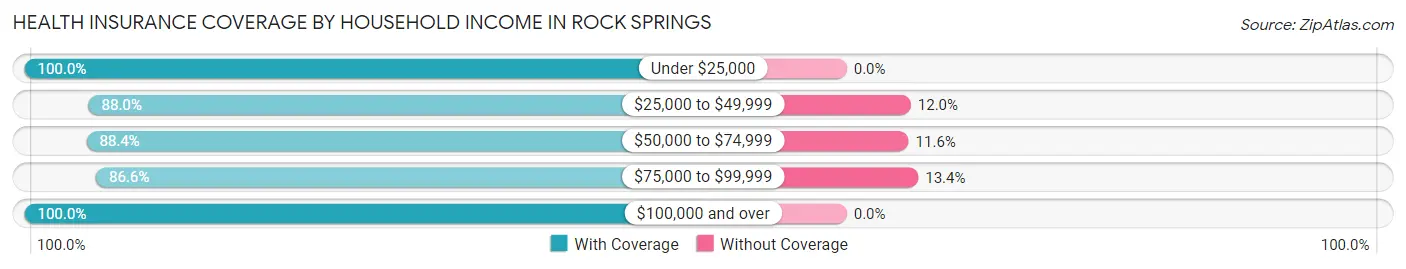
| Household Income | With Coverage | Without Coverage |
| Under $25,000 | 24 (100.0%) | 0 (0.0%) |
| $25,000 to $49,999 | 44 (88.0%) | 6 (12.0%) |
| $50,000 to $74,999 | 61 (88.4%) | 8 (11.6%) |
| $75,000 to $99,999 | 97 (86.6%) | 15 (13.4%) |
| $100,000 and over | 75 (100.0%) | 0 (0.0%) |
Public vs Private Health Insurance Coverage by Age in Rock Springs
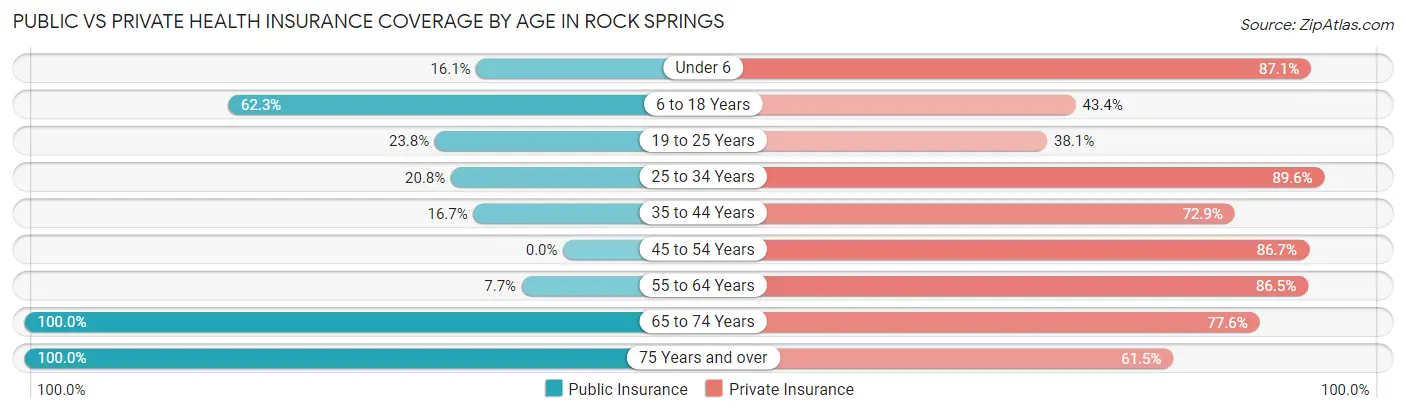
| Age Bracket | Public Insurance | Private Insurance |
| Under 6 | 5 (16.1%) | 27 (87.1%) |
| 6 to 18 Years | 33 (62.3%) | 23 (43.4%) |
| 19 to 25 Years | 5 (23.8%) | 8 (38.1%) |
| 25 to 34 Years | 10 (20.8%) | 43 (89.6%) |
| 35 to 44 Years | 8 (16.7%) | 35 (72.9%) |
| 45 to 54 Years | 0 (0.0%) | 13 (86.7%) |
| 55 to 64 Years | 4 (7.7%) | 45 (86.5%) |
| 65 to 74 Years | 49 (100.0%) | 38 (77.5%) |
| 75 Years and over | 13 (100.0%) | 8 (61.5%) |
| Total | 127 (38.5%) | 240 (72.7%) |
Disability Status by Sex by Age in Rock Springs
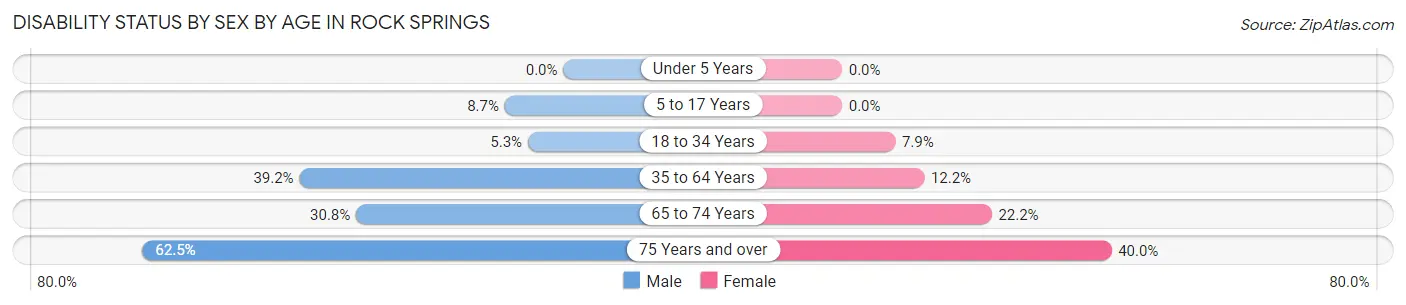
| Age Bracket | Male | Female |
| Under 5 Years | 0 (0.0%) | 0 (0.0%) |
| 5 to 17 Years | 2 (8.7%) | 0 (0.0%) |
| 18 to 34 Years | 2 (5.3%) | 3 (7.9%) |
| 35 to 64 Years | 29 (39.2%) | 5 (12.2%) |
| 65 to 74 Years | 4 (30.8%) | 8 (22.2%) |
| 75 Years and over | 5 (62.5%) | 2 (40.0%) |
Disability Class by Sex by Age in Rock Springs
Disability Class: Hearing Difficulty
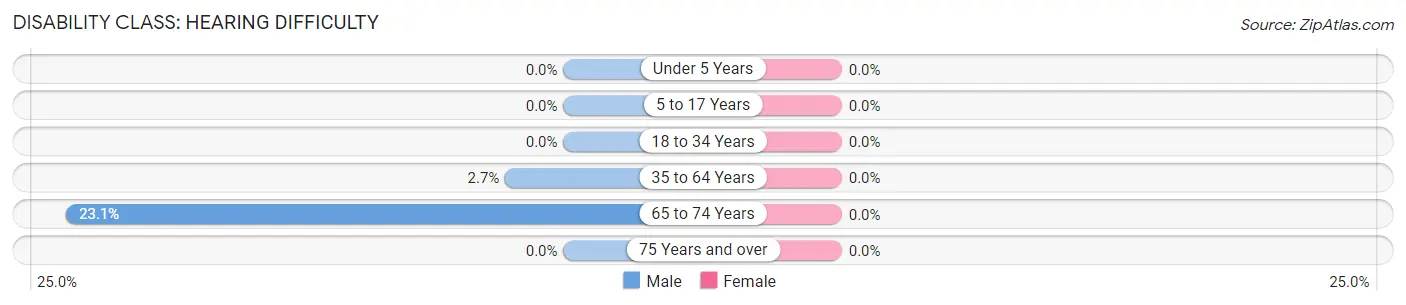
| Age Bracket | Male | Female |
| Under 5 Years | 0 (0.0%) | 0 (0.0%) |
| 5 to 17 Years | 0 (0.0%) | 0 (0.0%) |
| 18 to 34 Years | 0 (0.0%) | 0 (0.0%) |
| 35 to 64 Years | 2 (2.7%) | 0 (0.0%) |
| 65 to 74 Years | 3 (23.1%) | 0 (0.0%) |
| 75 Years and over | 0 (0.0%) | 0 (0.0%) |
Disability Class: Vision Difficulty
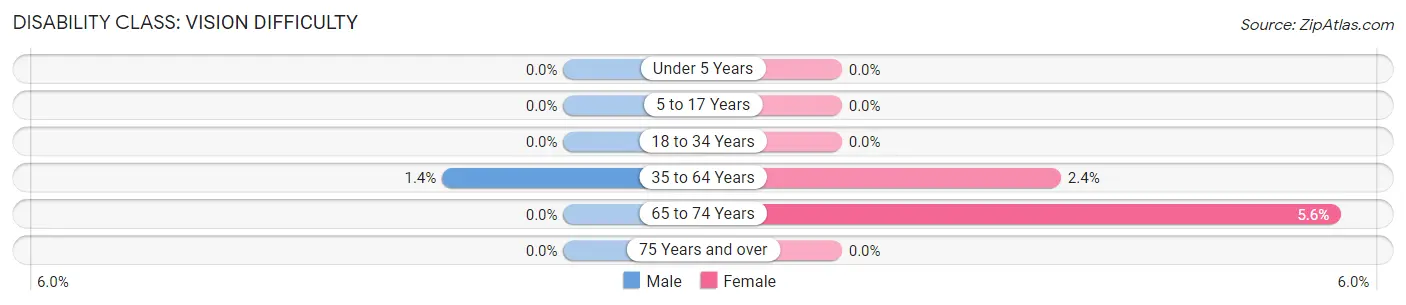
| Age Bracket | Male | Female |
| Under 5 Years | 0 (0.0%) | 0 (0.0%) |
| 5 to 17 Years | 0 (0.0%) | 0 (0.0%) |
| 18 to 34 Years | 0 (0.0%) | 0 (0.0%) |
| 35 to 64 Years | 1 (1.3%) | 1 (2.4%) |
| 65 to 74 Years | 0 (0.0%) | 2 (5.6%) |
| 75 Years and over | 0 (0.0%) | 0 (0.0%) |
Disability Class: Cognitive Difficulty
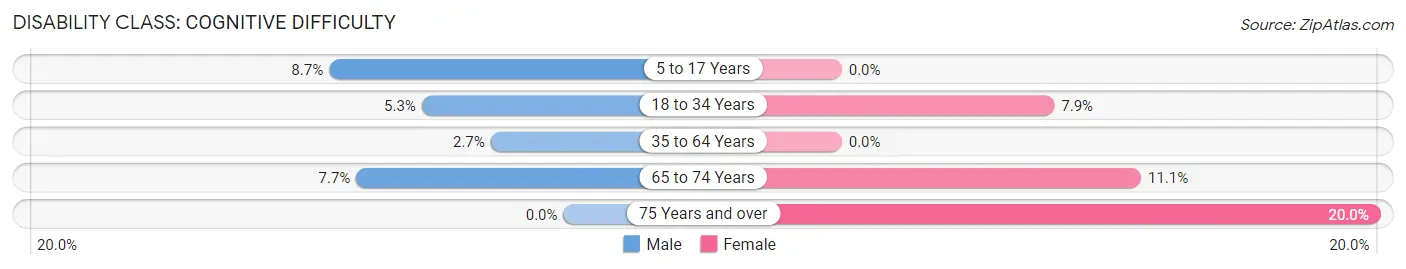
| Age Bracket | Male | Female |
| 5 to 17 Years | 2 (8.7%) | 0 (0.0%) |
| 18 to 34 Years | 2 (5.3%) | 3 (7.9%) |
| 35 to 64 Years | 2 (2.7%) | 0 (0.0%) |
| 65 to 74 Years | 1 (7.7%) | 4 (11.1%) |
| 75 Years and over | 0 (0.0%) | 1 (20.0%) |
Disability Class: Ambulatory Difficulty
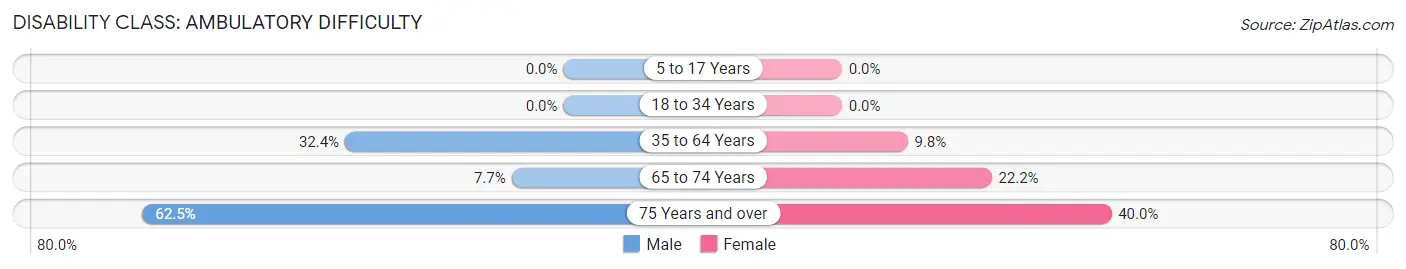
| Age Bracket | Male | Female |
| 5 to 17 Years | 0 (0.0%) | 0 (0.0%) |
| 18 to 34 Years | 0 (0.0%) | 0 (0.0%) |
| 35 to 64 Years | 24 (32.4%) | 4 (9.8%) |
| 65 to 74 Years | 1 (7.7%) | 8 (22.2%) |
| 75 Years and over | 5 (62.5%) | 2 (40.0%) |
Disability Class: Self-Care Difficulty
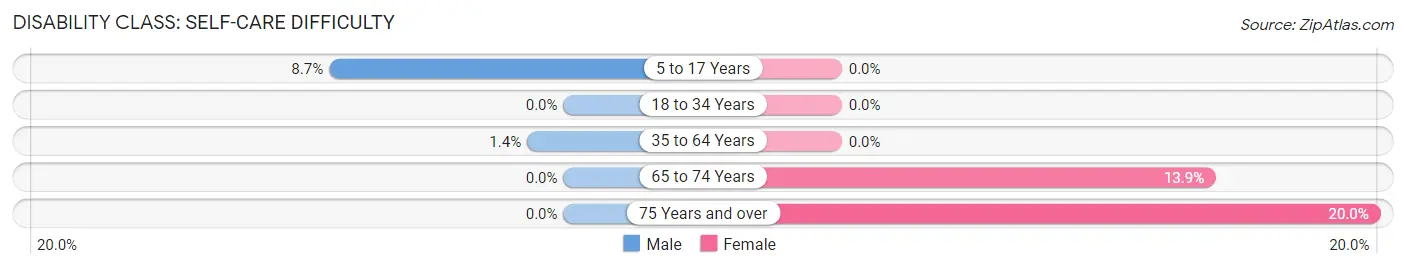
| Age Bracket | Male | Female |
| 5 to 17 Years | 2 (8.7%) | 0 (0.0%) |
| 18 to 34 Years | 0 (0.0%) | 0 (0.0%) |
| 35 to 64 Years | 1 (1.3%) | 0 (0.0%) |
| 65 to 74 Years | 0 (0.0%) | 5 (13.9%) |
| 75 Years and over | 0 (0.0%) | 1 (20.0%) |
Technology Access in Rock Springs
Computing Device Access in Rock Springs
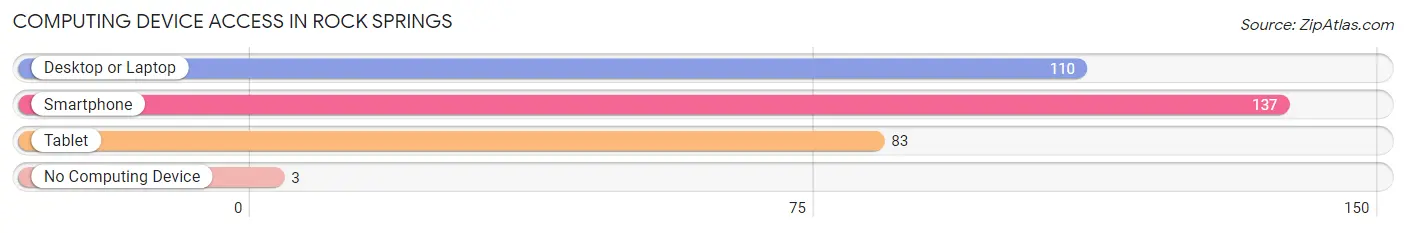
| Device Type | # Households | % Households |
| Desktop or Laptop | 110 | 76.4% |
| Smartphone | 137 | 95.1% |
| Tablet | 83 | 57.6% |
| No Computing Device | 3 | 2.1% |
| Total | 144 | 100.0% |
Internet Access in Rock Springs
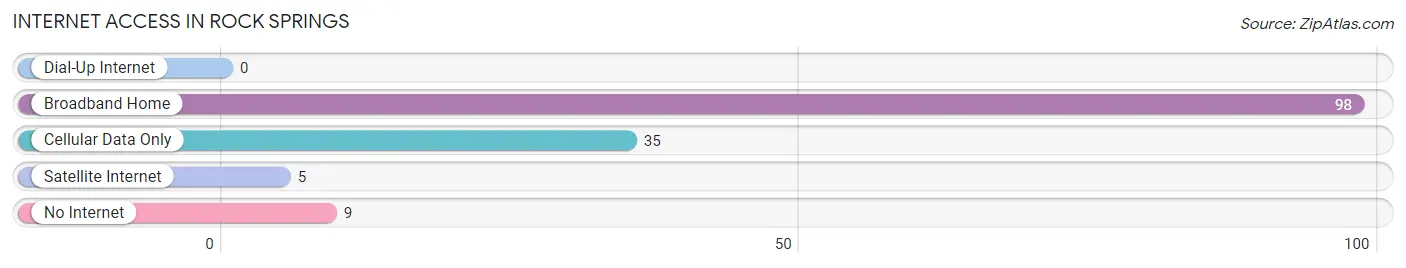
| Internet Type | # Households | % Households |
| Dial-Up Internet | 0 | 0.0% |
| Broadband Home | 98 | 68.1% |
| Cellular Data Only | 35 | 24.3% |
| Satellite Internet | 5 | 3.5% |
| No Internet | 9 | 6.2% |
| Total | 144 | 100.0% |
Rock Springs Summary
History
Rock Springs is a small village located in Sauk County, Wisconsin. It is situated on the banks of the Wisconsin River, about 20 miles north of Madison. The village was first settled in the early 1800s by a group of settlers from New York. The settlers were attracted to the area due to its abundant natural resources, including timber, water, and fertile soil. The village was originally known as “Rock Spring”, but the name was changed to “Rock Springs” in 1845.
The village was incorporated in 1856 and quickly grew to become a thriving community. The village was home to a variety of businesses, including a sawmill, a grist mill, a blacksmith shop, and a general store. The village also had a post office, a school, and a church.
In the late 1800s, the village began to decline due to the depletion of natural resources and the lack of economic opportunities. The village was nearly abandoned by the early 1900s, but was revived in the 1920s when a hydroelectric dam was built on the Wisconsin River. The dam provided electricity to the village and the surrounding area, and the village began to grow again.
Geography
Rock Springs is located in Sauk County, Wisconsin, about 20 miles north of Madison. The village is situated on the banks of the Wisconsin River, and is surrounded by rolling hills and forests. The village is located in the Central Plain region of Wisconsin, which is characterized by flat terrain and fertile soil.
The village has a total area of 0.7 square miles, all of which is land. The village is located at an elevation of 845 feet above sea level. The climate in Rock Springs is humid continental, with cold winters and warm summers.
Economy
The economy of Rock Springs is largely based on tourism and agriculture. The village is home to several tourist attractions, including the Rock Springs Historical Museum, the Rock Springs Nature Center, and the Rock Springs Nature Preserve. The village also hosts several annual festivals, including the Rock Springs Summer Festival and the Rock Springs Fall Festival.
Agriculture is also an important part of the local economy. The village is home to several farms, which produce a variety of crops, including corn, soybeans, and hay. The village also has several dairy farms, which produce milk and other dairy products.
Demographics
As of the 2010 census, the population of Rock Springs was 1,093. The population is predominantly white (97.2%), with small percentages of African American (0.9%), Asian (0.3%), and Native American (0.2%) residents. The median household income in the village is $50,938, and the median age is 43.
The village is served by the Sauk Prairie School District, which includes two elementary schools, one middle school, and one high school. The village is also home to several churches, including the Rock Springs United Methodist Church and the Rock Springs Lutheran Church.
Common Questions
What is the Total Population of Rock Springs?
Total Population of Rock Springs is 330.
What is the Total Male Population of Rock Springs?
Total Male Population of Rock Springs is 177.
What is the Total Female Population of Rock Springs?
Total Female Population of Rock Springs is 153.
What is the Ratio of Males per 100 Females in Rock Springs?
There are 115.69 Males per 100 Females in Rock Springs.
What is the Ratio of Females per 100 Males in Rock Springs?
There are 86.44 Females per 100 Males in Rock Springs.
What is the Median Population Age in Rock Springs?
Median Population Age in Rock Springs is 37.0 Years.
What is the Average Family Size in Rock Springs
Average Family Size in Rock Springs is 2.8 People.
What is the Average Household Size in Rock Springs
Average Household Size in Rock Springs is 2.3 People.
What is Per Capita Income in Rock Springs?
Per Capita income in Rock Springs is $30,516.
What is the Median Family Income in Rock Springs?
Median Family Income in Rock Springs is $83,125.
What is the Median Household income in Rock Springs?
Median Household Income in Rock Springs is $75,625.
What is Income or Wage Gap in Rock Springs?
Income or Wage Gap in Rock Springs is 20.8%.
Women in Rock Springs earn 79.2 cents for every dollar earned by a man.
What is Family Income Deficit in Rock Springs?
Family Income Deficit in Rock Springs is $7,167.
Families that are below poverty line in Rock Springs earn $7,167 less on average than the poverty threshold level.
What is Inequality or Gini Index in Rock Springs?
Inequality or Gini Index in Rock Springs is 0.29.
How Large is the Labor Force in Rock Springs?
There are 200 People in the Labor Forcein in Rock Springs.
What is the Percentage of People in the Labor Force in Rock Springs?
76.0% of People are in the Labor Force in Rock Springs.
What is the Unemployment Rate in Rock Springs?
Unemployment Rate in Rock Springs is 3.0%.