Prairie Du Sac, WI
Prairie Du Sac Map
Prairie Du Sac Overview
4,392
TOTAL POPULATION
2,196
MALE POPULATION
2,196
FEMALE POPULATION
100.00
MALES / 100 FEMALES
100.00
FEMALES / 100 MALES
35.9
MEDIAN AGE
3.0
AVG FAMILY SIZE
2.4
AVG HOUSEHOLD SIZE
$41,027
PER CAPITA INCOME
$104,734
AVG FAMILY INCOME
$81,818
AVG HOUSEHOLD INCOME
34.6%
WAGE / INCOME GAP [ % ]
65.4¢/ $1
WAGE / INCOME GAP [ $ ]
0.37
INEQUALITY / GINI INDEX
2,476
LABOR FORCE [ PEOPLE ]
72.6%
PERCENT IN LABOR FORCE
1.4%
UNEMPLOYMENT RATE
Prairie Du Sac Zip Codes
Prairie Du Sac Area Codes
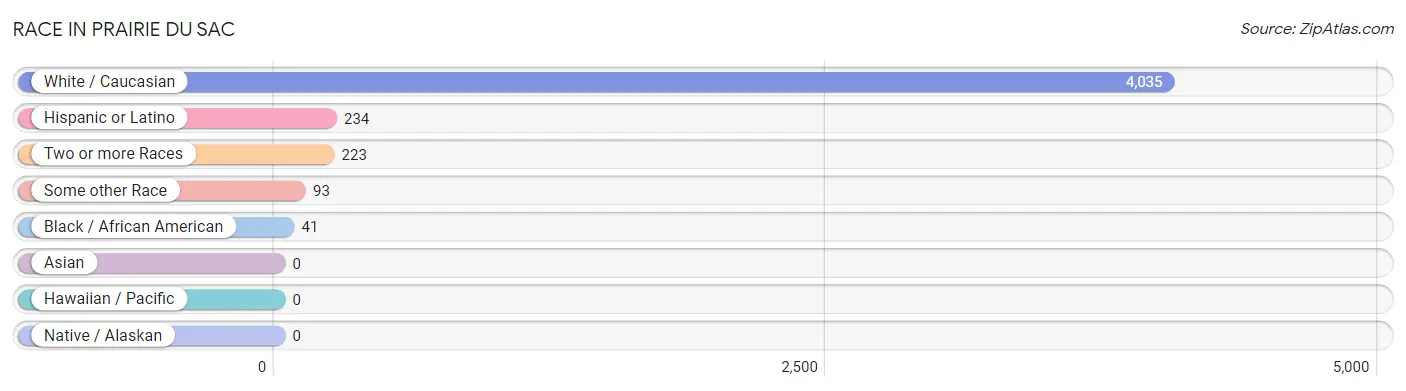
Race in Prairie Du Sac
The most populous races in Prairie Du Sac are White / Caucasian (4,035 | 91.9%), Hispanic or Latino (234 | 5.3%), and Two or more Races (223 | 5.1%).
| Race | # Population | % Population |
| Asian | 0 | 0.0% |
| Black / African American | 41 | 0.9% |
| Hawaiian / Pacific | 0 | 0.0% |
| Hispanic or Latino | 234 | 5.3% |
| Native / Alaskan | 0 | 0.0% |
| White / Caucasian | 4,035 | 91.9% |
| Two or more Races | 223 | 5.1% |
| Some other Race | 93 | 2.1% |
| Total | 4,392 | 100.0% |
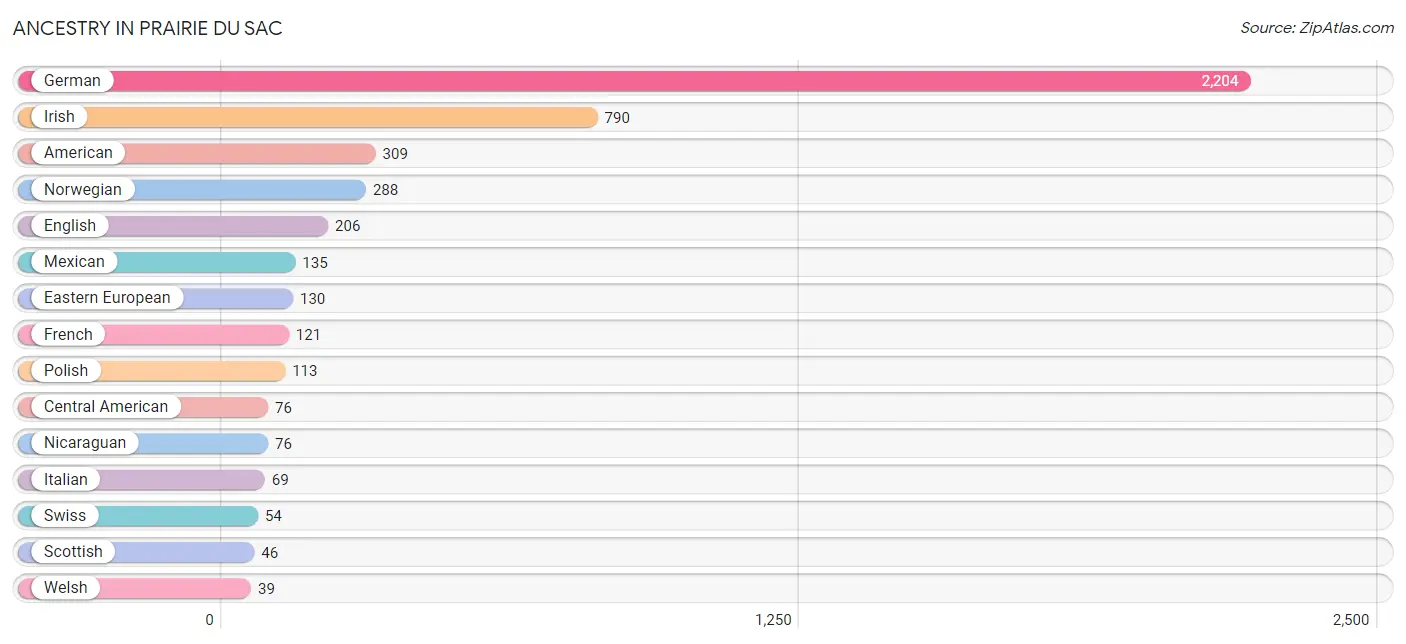
Ancestry in Prairie Du Sac
The most populous ancestries reported in Prairie Du Sac are German (2,204 | 50.2%), Irish (790 | 18.0%), American (309 | 7.0%), Norwegian (288 | 6.6%), and English (206 | 4.7%), together accounting for 86.5% of all Prairie Du Sac residents.
| Ancestry | # Population | % Population |
| American | 309 | 7.0% |
| Belgian | 14 | 0.3% |
| Blackfeet | 15 | 0.3% |
| British | 37 | 0.8% |
| Central American | 76 | 1.7% |
| Cherokee | 10 | 0.2% |
| Czech | 35 | 0.8% |
| Danish | 27 | 0.6% |
| Eastern European | 130 | 3.0% |
| English | 206 | 4.7% |
| European | 30 | 0.7% |
| French | 121 | 2.8% |
| German | 2,204 | 50.2% |
| Greek | 28 | 0.6% |
| Irish | 790 | 18.0% |
| Italian | 69 | 1.6% |
| Luxembourger | 13 | 0.3% |
| Mexican | 135 | 3.1% |
| Nicaraguan | 76 | 1.7% |
| Norwegian | 288 | 6.6% |
| Polish | 113 | 2.6% |
| Russian | 14 | 0.3% |
| Scottish | 46 | 1.1% |
| Swedish | 33 | 0.7% |
| Swiss | 54 | 1.2% |
| Welsh | 39 | 0.9% | View All 26 Rows |
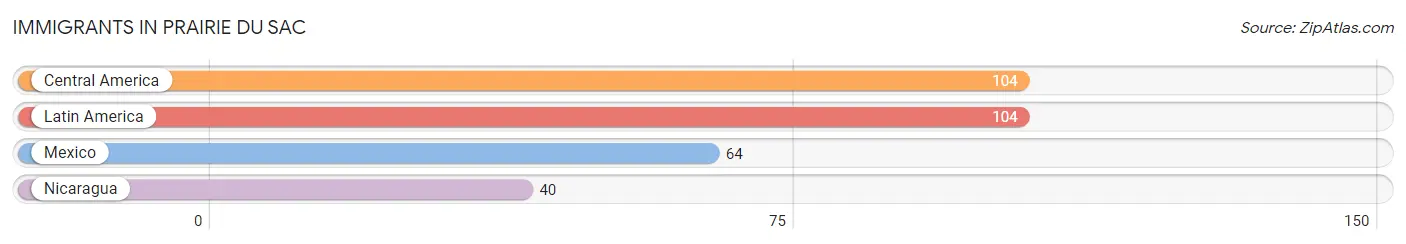
Immigrants in Prairie Du Sac
The most numerous immigrant groups reported in Prairie Du Sac came from Central America (104 | 2.4%), Latin America (104 | 2.4%), Mexico (64 | 1.5%), and Nicaragua (40 | 0.9%), together accounting for 7.1% of all Prairie Du Sac residents.
| Immigration Origin | # Population | % Population |
| Central America | 104 | 2.4% |
| Latin America | 104 | 2.4% |
| Mexico | 64 | 1.5% |
| Nicaragua | 40 | 0.9% | View All 4 Rows |
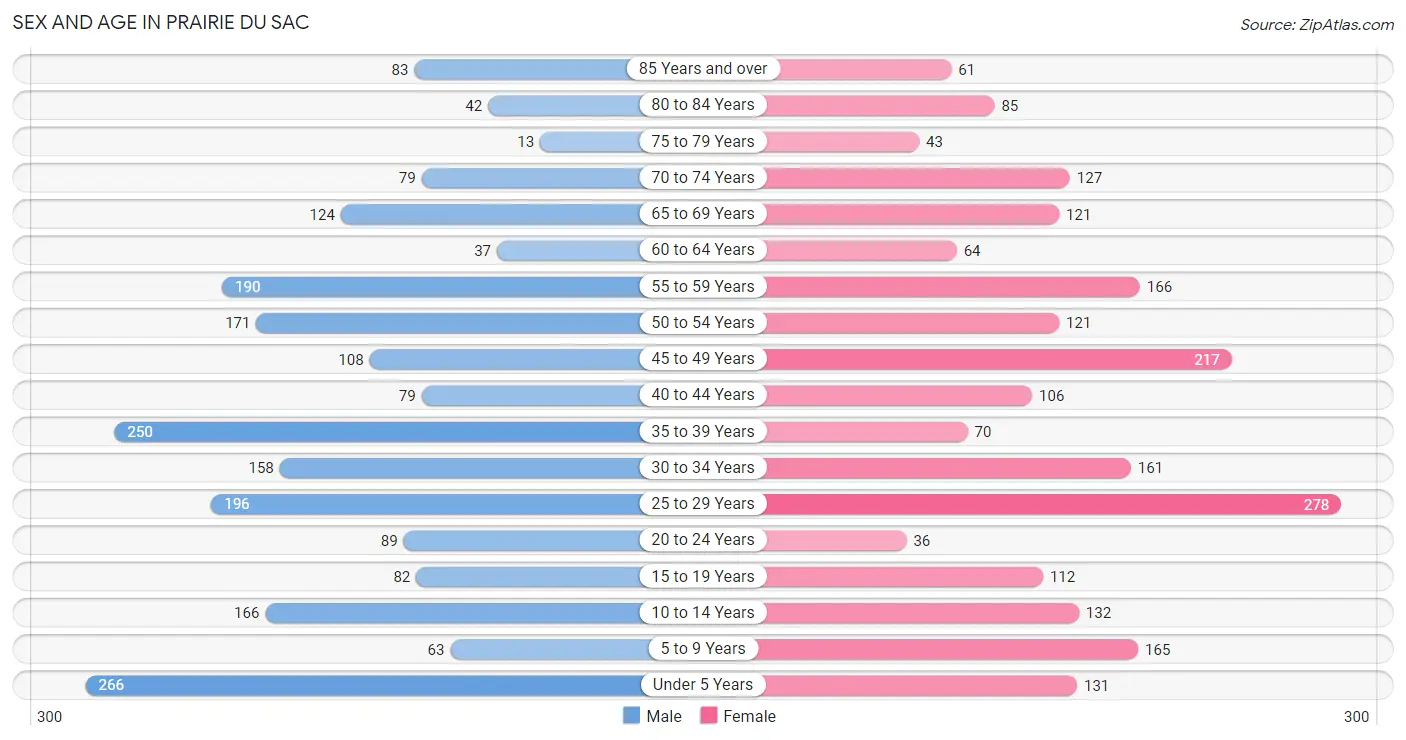
Sex and Age in Prairie Du Sac
Sex and Age in Prairie Du Sac
The most populous age groups in Prairie Du Sac are Under 5 Years (266 | 12.1%) for men and 25 to 29 Years (278 | 12.7%) for women.
| Age Bracket | Male | Female |
| Under 5 Years | 266 (12.1%) | 131 (6.0%) |
| 5 to 9 Years | 63 (2.9%) | 165 (7.5%) |
| 10 to 14 Years | 166 (7.6%) | 132 (6.0%) |
| 15 to 19 Years | 82 (3.7%) | 112 (5.1%) |
| 20 to 24 Years | 89 (4.1%) | 36 (1.6%) |
| 25 to 29 Years | 196 (8.9%) | 278 (12.7%) |
| 30 to 34 Years | 158 (7.2%) | 161 (7.3%) |
| 35 to 39 Years | 250 (11.4%) | 70 (3.2%) |
| 40 to 44 Years | 79 (3.6%) | 106 (4.8%) |
| 45 to 49 Years | 108 (4.9%) | 217 (9.9%) |
| 50 to 54 Years | 171 (7.8%) | 121 (5.5%) |
| 55 to 59 Years | 190 (8.6%) | 166 (7.6%) |
| 60 to 64 Years | 37 (1.7%) | 64 (2.9%) |
| 65 to 69 Years | 124 (5.7%) | 121 (5.5%) |
| 70 to 74 Years | 79 (3.6%) | 127 (5.8%) |
| 75 to 79 Years | 13 (0.6%) | 43 (2.0%) |
| 80 to 84 Years | 42 (1.9%) | 85 (3.9%) |
| 85 Years and over | 83 (3.8%) | 61 (2.8%) |
| Total | 2,196 (100.0%) | 2,196 (100.0%) |
Families and Households in Prairie Du Sac
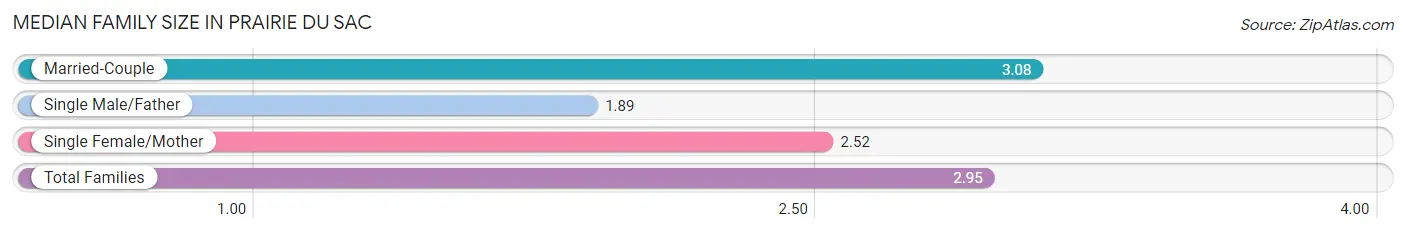
Median Family Size in Prairie Du Sac
The median family size in Prairie Du Sac is 2.95 persons per family, with married-couple families (988 | 82.1%) accounting for the largest median family size of 3.08 persons per family. On the other hand, single male/father families (54 | 4.5%) represent the smallest median family size with 1.89 persons per family.
| Family Type | # Families | Family Size |
| Married-Couple | 988 (82.1%) | 3.08 |
| Single Male/Father | 54 (4.5%) | 1.89 |
| Single Female/Mother | 162 (13.5%) | 2.52 |
| Total Families | 1,204 (100.0%) | 2.95 |
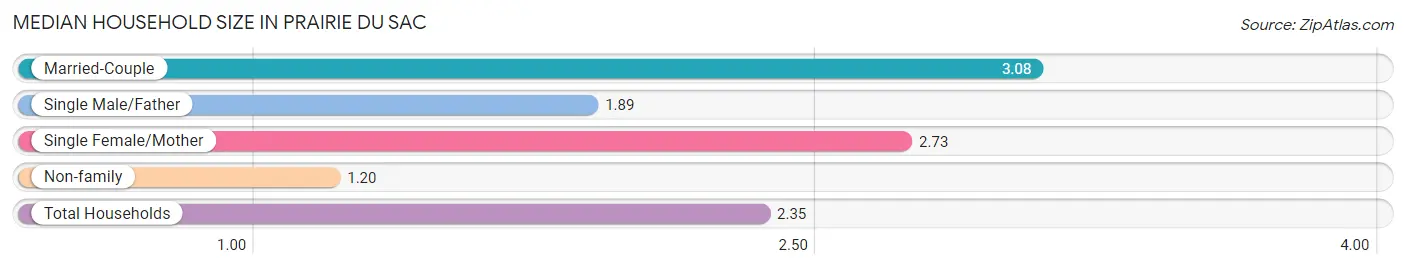
Median Household Size in Prairie Du Sac
The median household size in Prairie Du Sac is 2.35 persons per household, with married-couple households (988 | 53.1%) accounting for the largest median household size of 3.08 persons per household. non-family households (656 | 35.3%) represent the smallest median household size with 1.20 persons per household.
| Household Type | # Households | Household Size |
| Married-Couple | 988 (53.1%) | 3.08 |
| Single Male/Father | 54 (2.9%) | 1.89 |
| Single Female/Mother | 162 (8.7%) | 2.73 |
| Non-family | 656 (35.3%) | 1.20 |
| Total Households | 1,860 (100.0%) | 2.35 |
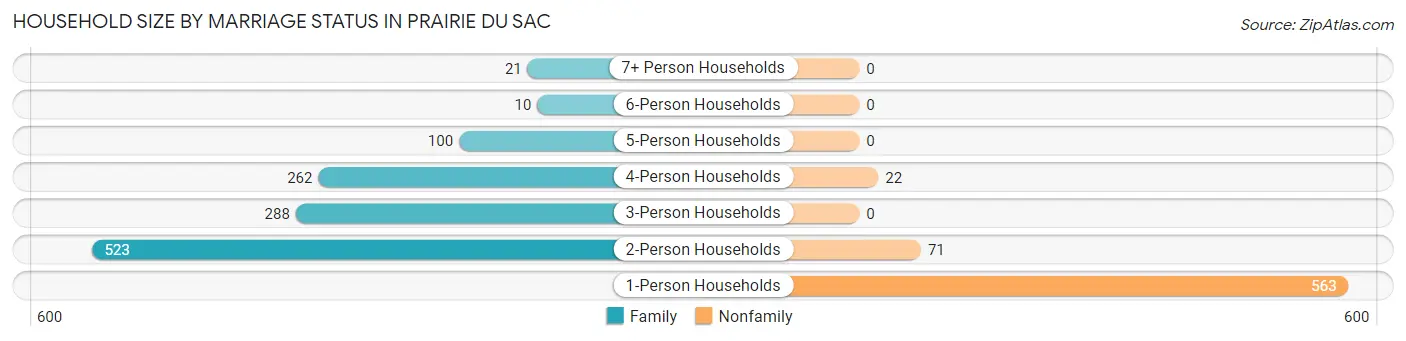
Household Size by Marriage Status in Prairie Du Sac
Out of a total of 1,860 households in Prairie Du Sac, 1,204 (64.7%) are family households, while 656 (35.3%) are nonfamily households. The most numerous type of family households are 2-person households, comprising 523, and the most common type of nonfamily households are 1-person households, comprising 563.
| Household Size | Family Households | Nonfamily Households |
| 1-Person Households | - | 563 (30.3%) |
| 2-Person Households | 523 (28.1%) | 71 (3.8%) |
| 3-Person Households | 288 (15.5%) | 0 (0.0%) |
| 4-Person Households | 262 (14.1%) | 22 (1.2%) |
| 5-Person Households | 100 (5.4%) | 0 (0.0%) |
| 6-Person Households | 10 (0.5%) | 0 (0.0%) |
| 7+ Person Households | 21 (1.1%) | 0 (0.0%) |
| Total | 1,204 (64.7%) | 656 (35.3%) |
Female Fertility in Prairie Du Sac
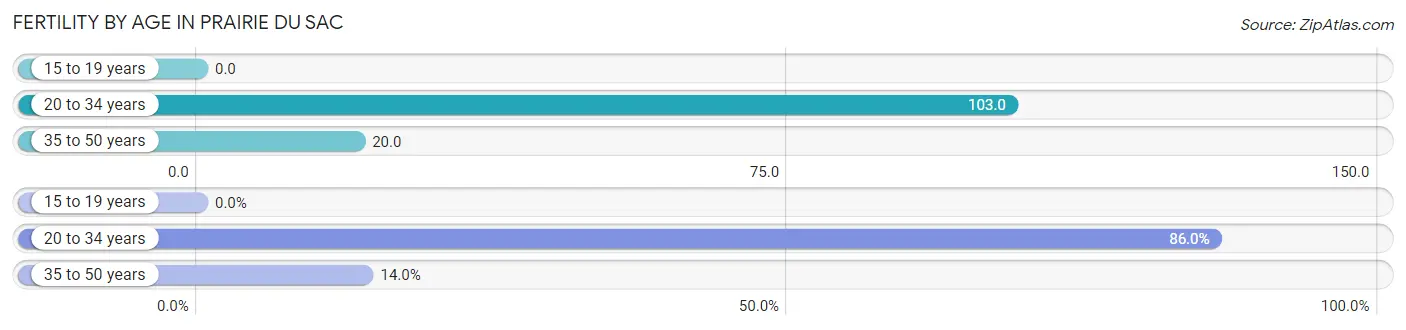
Fertility by Age in Prairie Du Sac
Average fertility rate in Prairie Du Sac is 58.0 births per 1,000 women. Women in the age bracket of 20 to 34 years have the highest fertility rate with 103.0 births per 1,000 women. Women in the age bracket of 20 to 34 years acount for 86.0% of all women with births.
| Age Bracket | Women with Births | Births / 1,000 Women |
| 15 to 19 years | 0 (0.0%) | 0.0 |
| 20 to 34 years | 49 (86.0%) | 103.0 |
| 35 to 50 years | 8 (14.0%) | 20.0 |
| Total | 57 (100.0%) | 58.0 |
Fertility by Age by Marriage Status in Prairie Du Sac
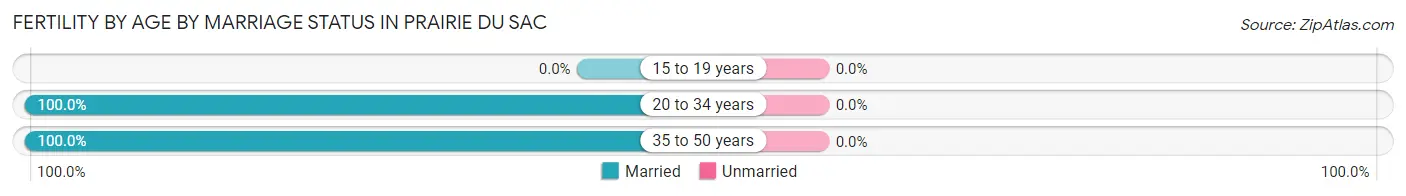
| Age Bracket | Married | Unmarried |
| 15 to 19 years | 0 (0.0%) | 0 (0.0%) |
| 20 to 34 years | 49 (100.0%) | 0 (0.0%) |
| 35 to 50 years | 8 (100.0%) | 0 (0.0%) |
| Total | 57 (100.0%) | 0 (0.0%) |
Fertility by Education in Prairie Du Sac
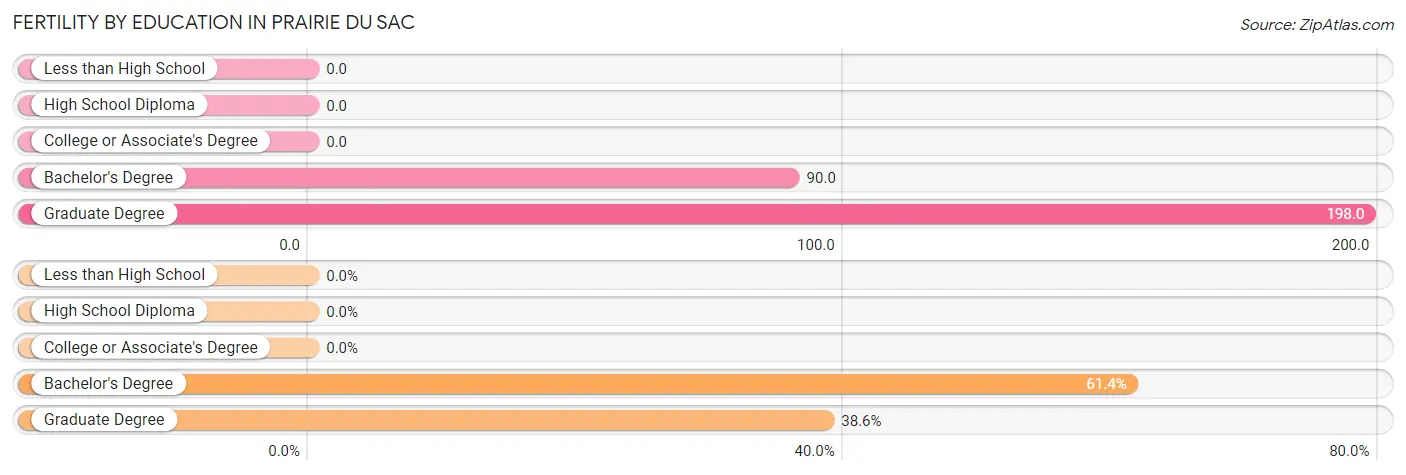
| Educational Attainment | Women with Births | Births / 1,000 Women |
| Less than High School | 0 (0.0%) | 0.0 |
| High School Diploma | 0 (0.0%) | 0.0 |
| College or Associate's Degree | 0 (0.0%) | 0.0 |
| Bachelor's Degree | 35 (61.4%) | 90.0 |
| Graduate Degree | 22 (38.6%) | 198.0 |
| Total | 57 (100.0%) | 58.0 |
Fertility by Education by Marriage Status in Prairie Du Sac
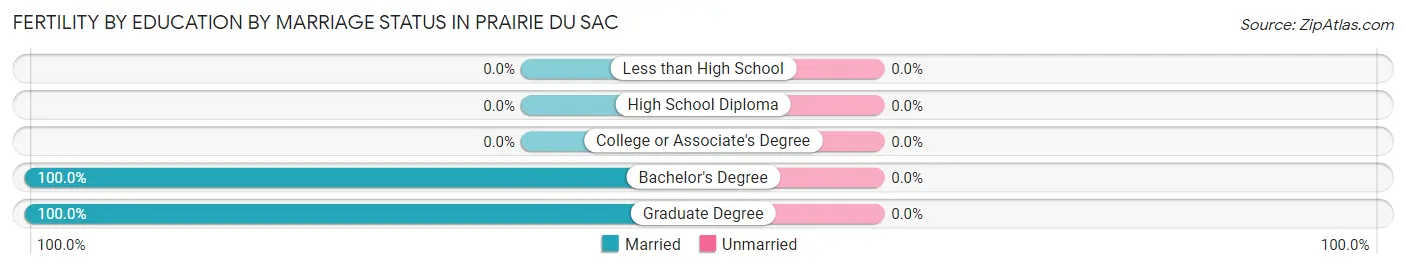
| Educational Attainment | Married | Unmarried |
| Less than High School | 0 (0.0%) | 0 (0.0%) |
| High School Diploma | 0 (0.0%) | 0 (0.0%) |
| College or Associate's Degree | 0 (0.0%) | 0 (0.0%) |
| Bachelor's Degree | 35 (100.0%) | 0 (0.0%) |
| Graduate Degree | 22 (100.0%) | 0 (0.0%) |
| Total | 57 (100.0%) | 0 (0.0%) |
Income in Prairie Du Sac
Income Overview in Prairie Du Sac
Per Capita Income in Prairie Du Sac is $41,027, while median incomes of families and households are $104,734 and $81,818 respectively.
| Characteristic | Number | Measure |
| Per Capita Income | 4,392 | $41,027 |
| Median Family Income | 1,204 | $104,734 |
| Mean Family Income | 1,204 | $114,896 |
| Median Household Income | 1,860 | $81,818 |
| Mean Household Income | 1,860 | $97,021 |
| Income Deficit | 1,204 | $0 |
| Wage / Income Gap (%) | 4,392 | 34.61% |
| Wage / Income Gap ($) | 4,392 | 65.39¢ per $1 |
| Gini / Inequality Index | 4,392 | 0.37 |
Earnings by Sex in Prairie Du Sac
Average Earnings in Prairie Du Sac are $50,024, $61,338 for men and $40,107 for women, a difference of 34.6%.
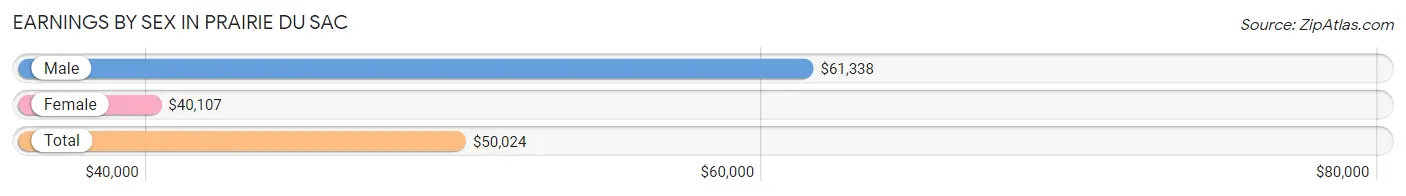
| Sex | Number | Average Earnings |
| Male | 1,277 (49.0%) | $61,338 |
| Female | 1,327 (51.0%) | $40,107 |
| Total | 2,604 (100.0%) | $50,024 |
Earnings by Sex by Income Bracket in Prairie Du Sac
The most common earnings brackets in Prairie Du Sac are $100,000+ for men (244 | 19.1%) and $100,000+ for women (172 | 13.0%).
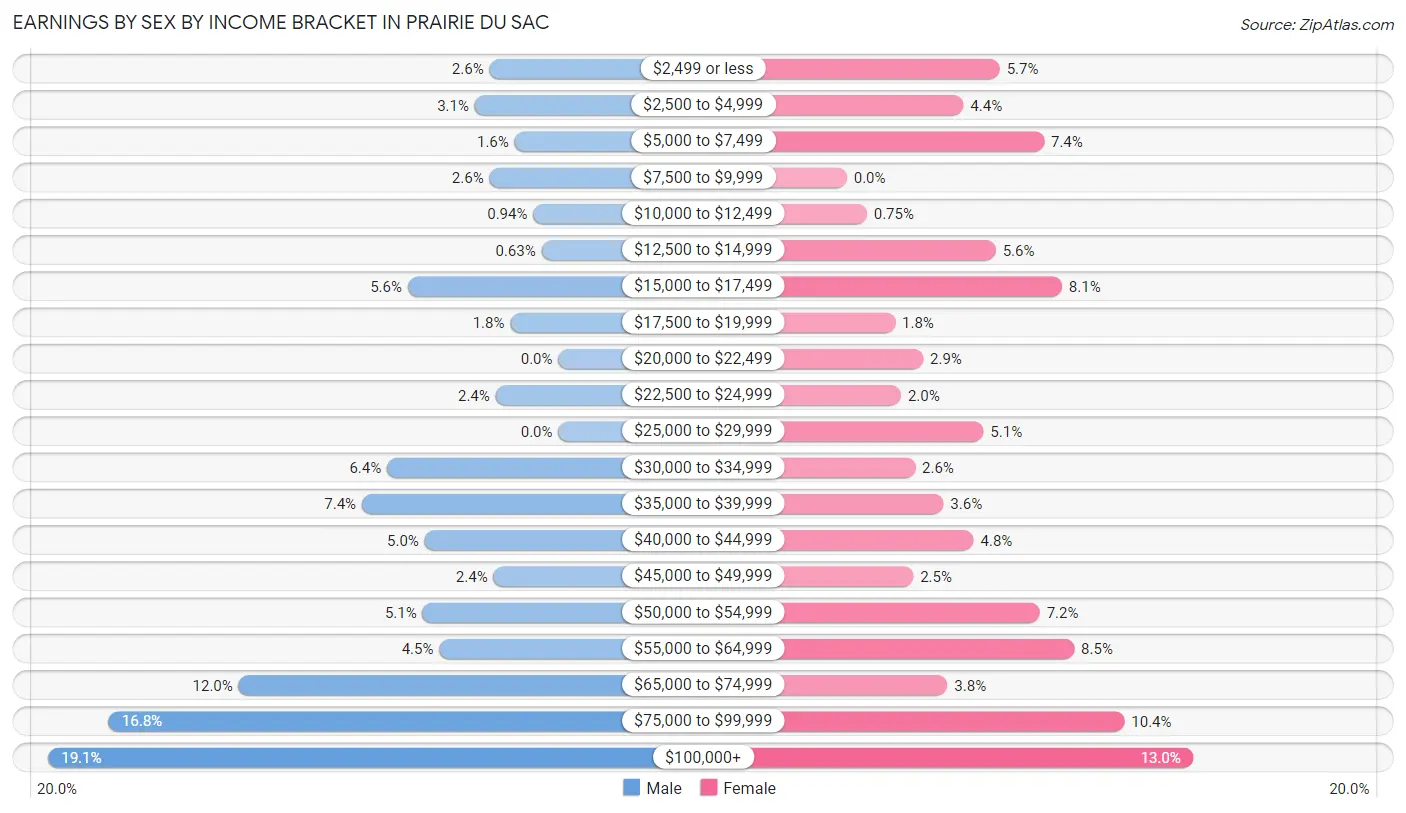
| Income | Male | Female |
| $2,499 or less | 33 (2.6%) | 76 (5.7%) |
| $2,500 to $4,999 | 40 (3.1%) | 58 (4.4%) |
| $5,000 to $7,499 | 21 (1.6%) | 98 (7.4%) |
| $7,500 to $9,999 | 33 (2.6%) | 0 (0.0%) |
| $10,000 to $12,499 | 12 (0.9%) | 10 (0.7%) |
| $12,500 to $14,999 | 8 (0.6%) | 74 (5.6%) |
| $15,000 to $17,499 | 72 (5.6%) | 107 (8.1%) |
| $17,500 to $19,999 | 23 (1.8%) | 24 (1.8%) |
| $20,000 to $22,499 | 0 (0.0%) | 38 (2.9%) |
| $22,500 to $24,999 | 30 (2.4%) | 27 (2.0%) |
| $25,000 to $29,999 | 0 (0.0%) | 68 (5.1%) |
| $30,000 to $34,999 | 82 (6.4%) | 34 (2.6%) |
| $35,000 to $39,999 | 94 (7.4%) | 48 (3.6%) |
| $40,000 to $44,999 | 64 (5.0%) | 63 (4.8%) |
| $45,000 to $49,999 | 31 (2.4%) | 33 (2.5%) |
| $50,000 to $54,999 | 65 (5.1%) | 96 (7.2%) |
| $55,000 to $64,999 | 57 (4.5%) | 113 (8.5%) |
| $65,000 to $74,999 | 153 (12.0%) | 50 (3.8%) |
| $75,000 to $99,999 | 215 (16.8%) | 138 (10.4%) |
| $100,000+ | 244 (19.1%) | 172 (13.0%) |
| Total | 1,277 (100.0%) | 1,327 (100.0%) |
Earnings by Sex by Educational Attainment in Prairie Du Sac
Average earnings in Prairie Du Sac are $67,765 for men and $44,598 for women, a difference of 34.2%. Men with an educational attainment of bachelor's degree enjoy the highest average annual earnings of $107,671, while those with high school diploma education earn the least with $39,879. Women with an educational attainment of graduate degree earn the most with the average annual earnings of $83,750, while those with high school diploma education have the smallest earnings of $14,938.
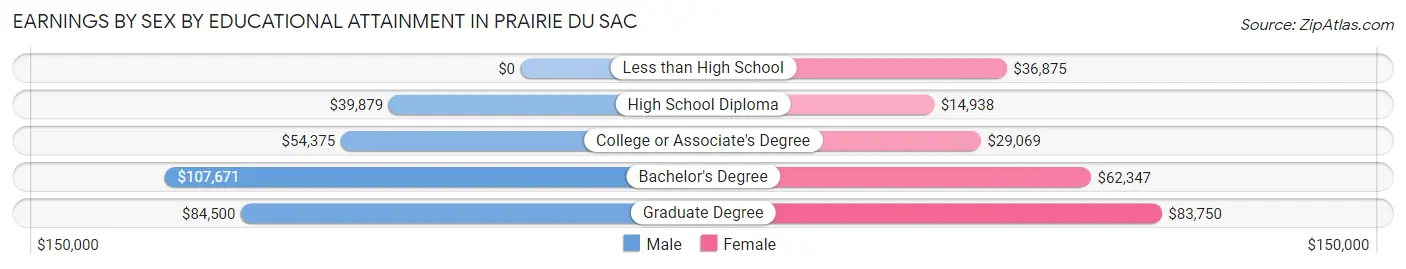
| Educational Attainment | Male Income | Female Income |
| Less than High School | - | - |
| High School Diploma | $39,879 | $14,938 |
| College or Associate's Degree | $54,375 | $29,069 |
| Bachelor's Degree | $107,671 | $62,347 |
| Graduate Degree | $84,500 | $83,750 |
| Total | $67,765 | $44,598 |
Family Income in Prairie Du Sac
Family Income Brackets in Prairie Du Sac
According to the Prairie Du Sac family income data, there are 300 families falling into the $100,000 to $149,999 income range, which is the most common income bracket and makes up 24.9% of all families.
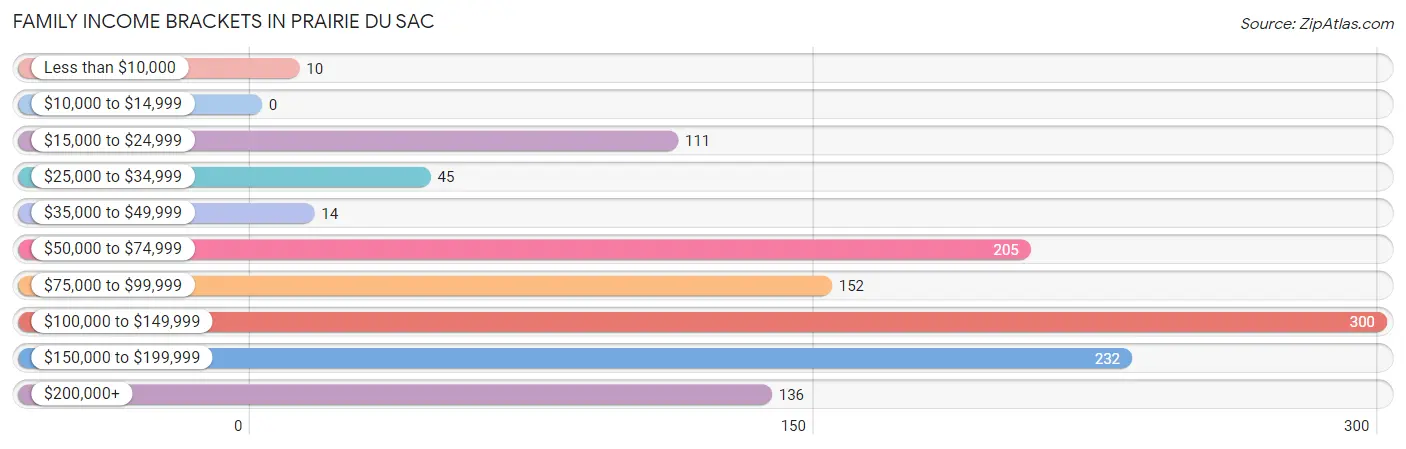
| Income Bracket | # Families | % Families |
| Less than $10,000 | 10 | 0.8% |
| $10,000 to $14,999 | 0 | 0.0% |
| $15,000 to $24,999 | 111 | 9.2% |
| $25,000 to $34,999 | 45 | 3.7% |
| $35,000 to $49,999 | 14 | 1.2% |
| $50,000 to $74,999 | 205 | 17.0% |
| $75,000 to $99,999 | 152 | 12.6% |
| $100,000 to $149,999 | 300 | 24.9% |
| $150,000 to $199,999 | 232 | 19.3% |
| $200,000+ | 136 | 11.3% |
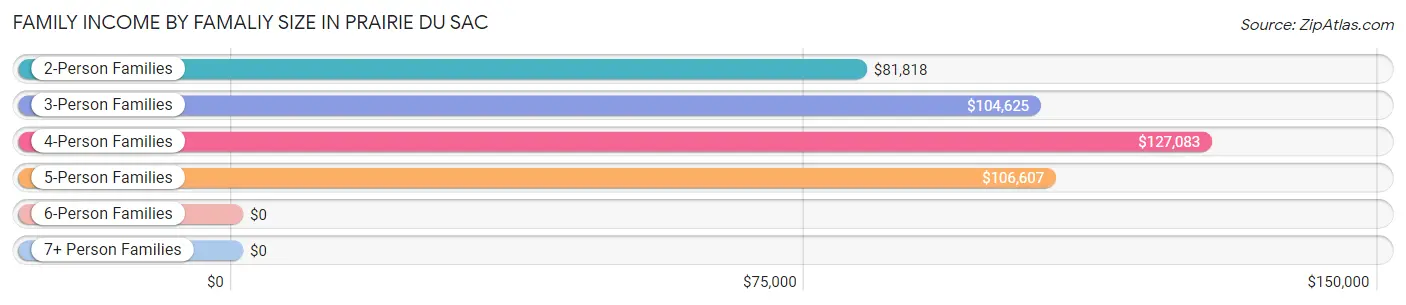
Family Income by Famaliy Size in Prairie Du Sac
4-person families (262 | 21.8%) account for the highest median family income in Prairie Du Sac with $127,083 per family, while 2-person families (590 | 49.0%) have the highest median income of $40,909 per family member.
| Income Bracket | # Families | Median Income |
| 2-Person Families | 590 (49.0%) | $81,818 |
| 3-Person Families | 221 (18.4%) | $104,625 |
| 4-Person Families | 262 (21.8%) | $127,083 |
| 5-Person Families | 110 (9.1%) | $106,607 |
| 6-Person Families | 0 (0.0%) | $0 |
| 7+ Person Families | 21 (1.7%) | $0 |
| Total | 1,204 (100.0%) | $104,734 |
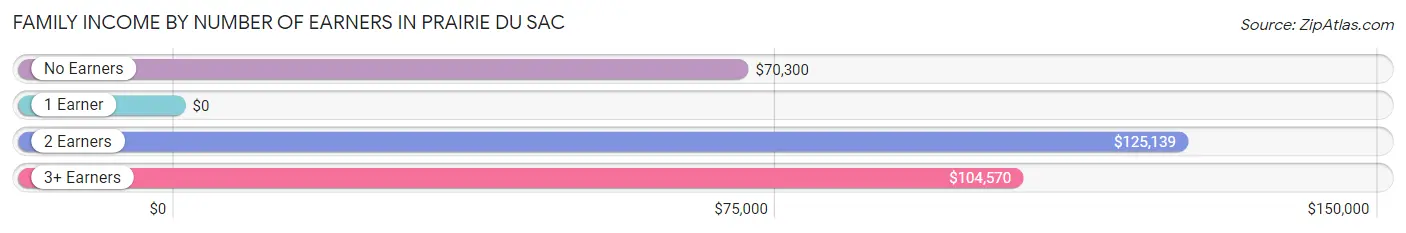
Family Income by Number of Earners in Prairie Du Sac
| Number of Earners | # Families | Median Income |
| No Earners | 146 (12.1%) | $70,300 |
| 1 Earner | 207 (17.2%) | $0 |
| 2 Earners | 688 (57.1%) | $125,139 |
| 3+ Earners | 163 (13.5%) | $104,570 |
| Total | 1,204 (100.0%) | $104,734 |
Household Income in Prairie Du Sac
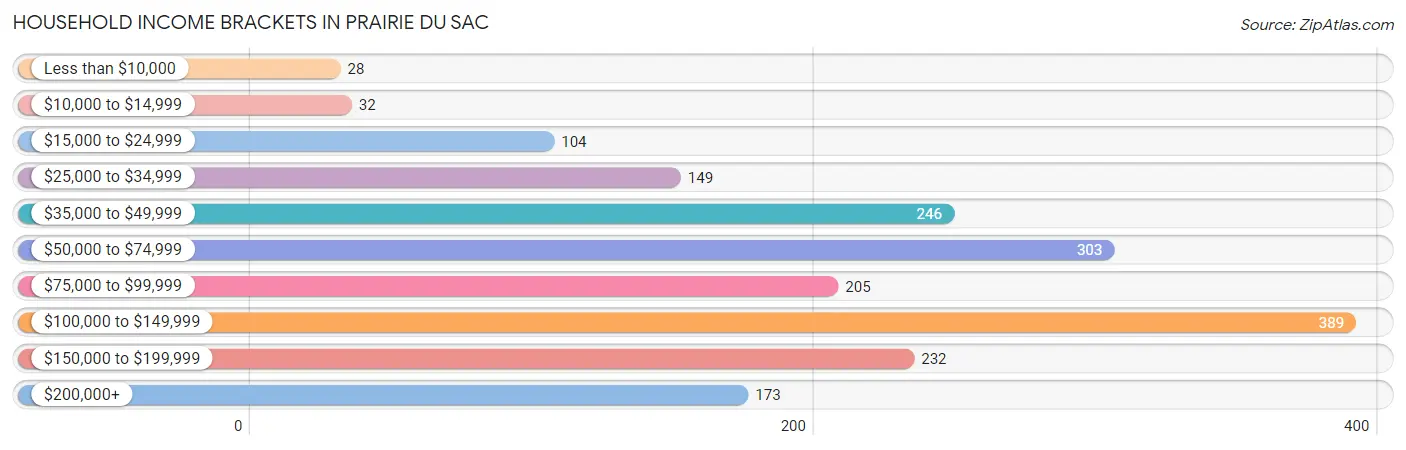
Household Income Brackets in Prairie Du Sac
With 389 households falling in the category, the $100,000 to $149,999 income range is the most frequent in Prairie Du Sac, accounting for 20.9% of all households. In contrast, only 28 households (1.5%) fall into the less than $10,000 income bracket, making it the least populous group.
| Income Bracket | # Households | % Households |
| Less than $10,000 | 28 | 1.5% |
| $10,000 to $14,999 | 32 | 1.7% |
| $15,000 to $24,999 | 104 | 5.6% |
| $25,000 to $34,999 | 149 | 8.0% |
| $35,000 to $49,999 | 246 | 13.2% |
| $50,000 to $74,999 | 303 | 16.3% |
| $75,000 to $99,999 | 205 | 11.0% |
| $100,000 to $149,999 | 389 | 20.9% |
| $150,000 to $199,999 | 232 | 12.5% |
| $200,000+ | 173 | 9.3% |
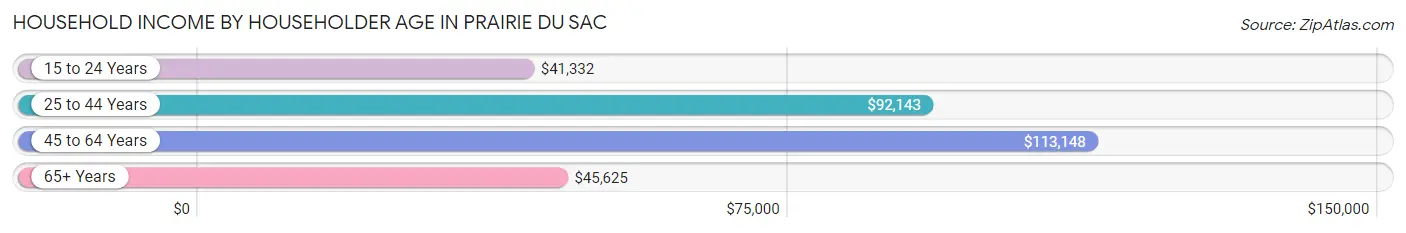
Household Income by Householder Age in Prairie Du Sac
The median household income in Prairie Du Sac is $81,818, with the highest median household income of $113,148 found in the 45 to 64 years age bracket for the primary householder. A total of 566 households (30.4%) fall into this category. Meanwhile, the 15 to 24 years age bracket for the primary householder has the lowest median household income of $41,332, with 77 households (4.1%) in this group.
| Income Bracket | # Households | Median Income |
| 15 to 24 Years | 77 (4.1%) | $41,332 |
| 25 to 44 Years | 706 (38.0%) | $92,143 |
| 45 to 64 Years | 566 (30.4%) | $113,148 |
| 65+ Years | 511 (27.5%) | $45,625 |
| Total | 1,860 (100.0%) | $81,818 |
Poverty in Prairie Du Sac
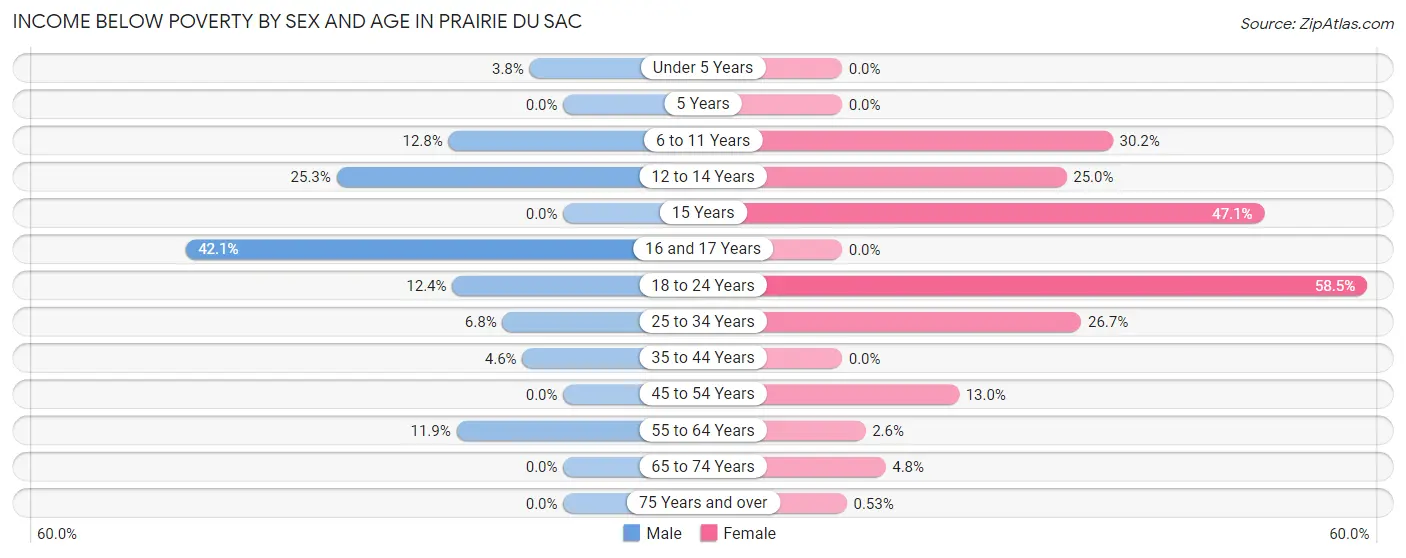
Income Below Poverty by Sex and Age in Prairie Du Sac
With 6.7% poverty level for males and 13.9% for females among the residents of Prairie Du Sac, 16 and 17 year old males and 18 to 24 year old females are the most vulnerable to poverty, with 24 males (42.1%) and 31 females (58.5%) in their respective age groups living below the poverty level.
| Age Bracket | Male | Female |
| Under 5 Years | 10 (3.8%) | 0 (0.0%) |
| 5 Years | 0 (0.0%) | 0 (0.0%) |
| 6 to 11 Years | 11 (12.8%) | 57 (30.2%) |
| 12 to 14 Years | 25 (25.3%) | 21 (25.0%) |
| 15 Years | 0 (0.0%) | 16 (47.1%) |
| 16 and 17 Years | 24 (42.1%) | 0 (0.0%) |
| 18 to 24 Years | 11 (12.4%) | 31 (58.5%) |
| 25 to 34 Years | 24 (6.8%) | 117 (26.7%) |
| 35 to 44 Years | 15 (4.6%) | 0 (0.0%) |
| 45 to 54 Years | 0 (0.0%) | 44 (13.0%) |
| 55 to 64 Years | 27 (11.9%) | 6 (2.6%) |
| 65 to 74 Years | 0 (0.0%) | 12 (4.8%) |
| 75 Years and over | 0 (0.0%) | 1 (0.5%) |
| Total | 147 (6.7%) | 305 (13.9%) |
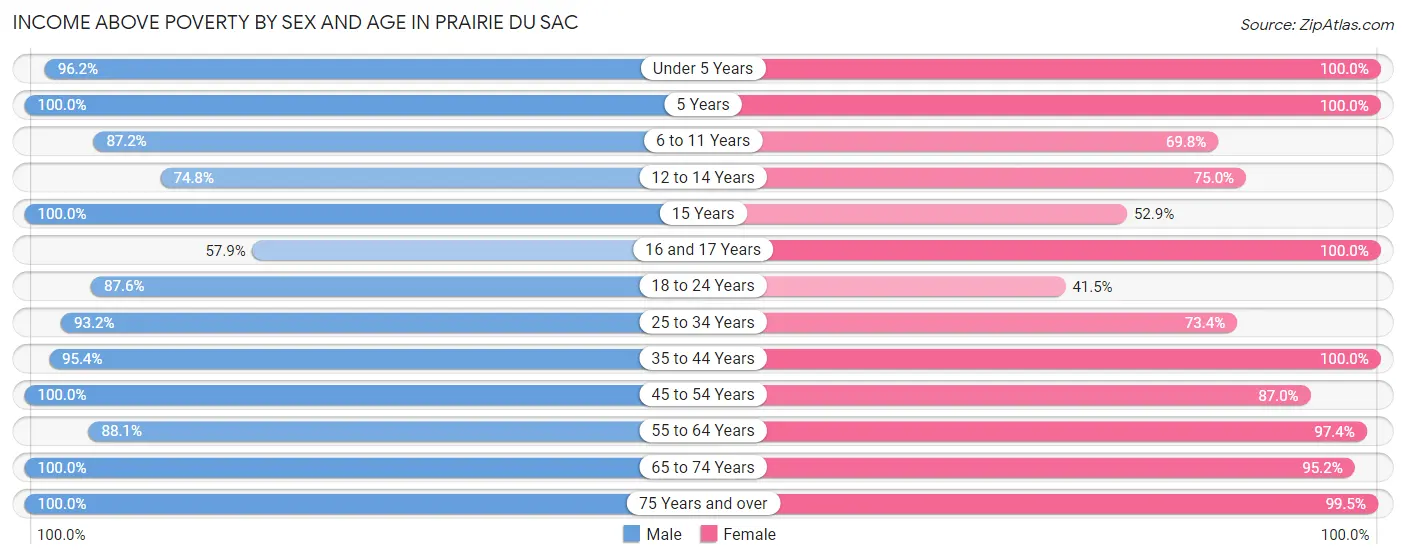
Income Above Poverty by Sex and Age in Prairie Du Sac
According to the poverty statistics in Prairie Du Sac, males aged 5 years and females aged under 5 years are the age groups that are most secure financially, with 100.0% of males and 100.0% of females in these age groups living above the poverty line.
| Age Bracket | Male | Female |
| Under 5 Years | 256 (96.2%) | 131 (100.0%) |
| 5 Years | 44 (100.0%) | 24 (100.0%) |
| 6 to 11 Years | 75 (87.2%) | 132 (69.8%) |
| 12 to 14 Years | 74 (74.8%) | 63 (75.0%) |
| 15 Years | 25 (100.0%) | 18 (52.9%) |
| 16 and 17 Years | 33 (57.9%) | 61 (100.0%) |
| 18 to 24 Years | 78 (87.6%) | 22 (41.5%) |
| 25 to 34 Years | 330 (93.2%) | 322 (73.4%) |
| 35 to 44 Years | 314 (95.4%) | 176 (100.0%) |
| 45 to 54 Years | 279 (100.0%) | 294 (87.0%) |
| 55 to 64 Years | 200 (88.1%) | 224 (97.4%) |
| 65 to 74 Years | 203 (100.0%) | 236 (95.2%) |
| 75 Years and over | 138 (100.0%) | 188 (99.5%) |
| Total | 2,049 (93.3%) | 1,891 (86.1%) |
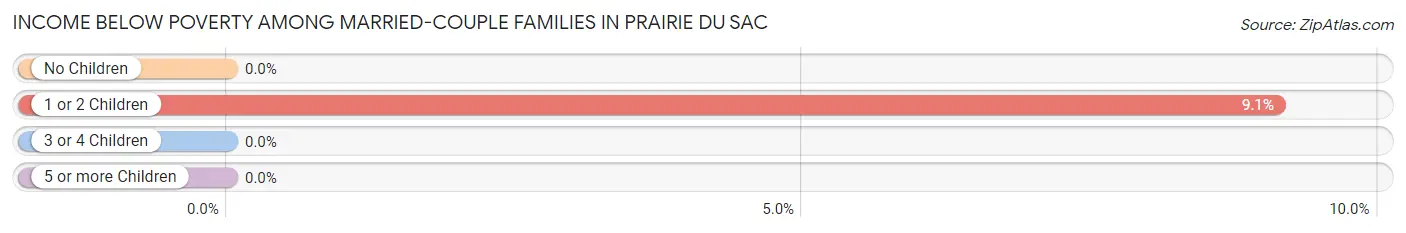
Income Below Poverty Among Married-Couple Families in Prairie Du Sac
The poverty statistics for married-couple families in Prairie Du Sac show that 2.9% or 29 of the total 988 families live below the poverty line. Families with 1 or 2 children have the highest poverty rate of 9.1%, comprising of 29 families. On the other hand, families with no children have the lowest poverty rate of 0.0%, which includes 0 families.
| Children | Above Poverty | Below Poverty |
| No Children | 549 (100.0%) | 0 (0.0%) |
| 1 or 2 Children | 289 (90.9%) | 29 (9.1%) |
| 3 or 4 Children | 100 (100.0%) | 0 (0.0%) |
| 5 or more Children | 21 (100.0%) | 0 (0.0%) |
| Total | 959 (97.1%) | 29 (2.9%) |
Income Below Poverty Among Single-Parent Households in Prairie Du Sac
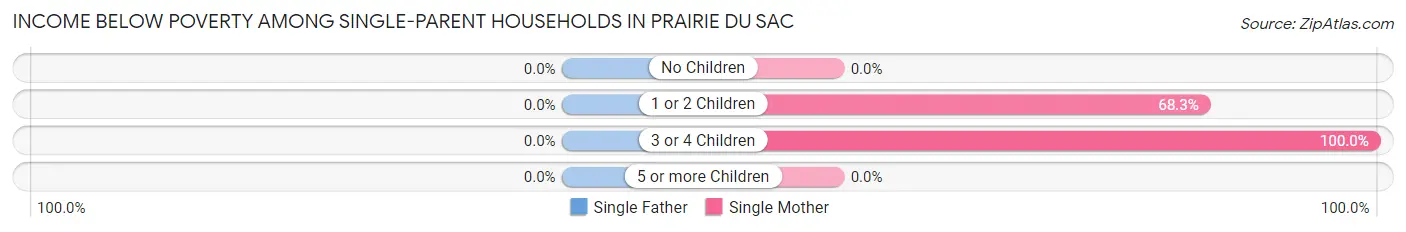
| Children | Single Father | Single Mother |
| No Children | 0 (0.0%) | 0 (0.0%) |
| 1 or 2 Children | 0 (0.0%) | 82 (68.3%) |
| 3 or 4 Children | 0 (0.0%) | 10 (100.0%) |
| 5 or more Children | 0 (0.0%) | 0 (0.0%) |
| Total | 0 (0.0%) | 92 (56.8%) |
Income Below Poverty Among Married-Couple vs Single-Parent Households in Prairie Du Sac
The poverty data for Prairie Du Sac shows that 29 of the married-couple family households (2.9%) and 92 of the single-parent households (42.6%) are living below the poverty level. Within the married-couple family households, those with 1 or 2 children have the highest poverty rate, with 29 households (9.1%) falling below the poverty line. Among the single-parent households, those with 3 or 4 children have the highest poverty rate, with 10 household (100.0%) living below poverty.
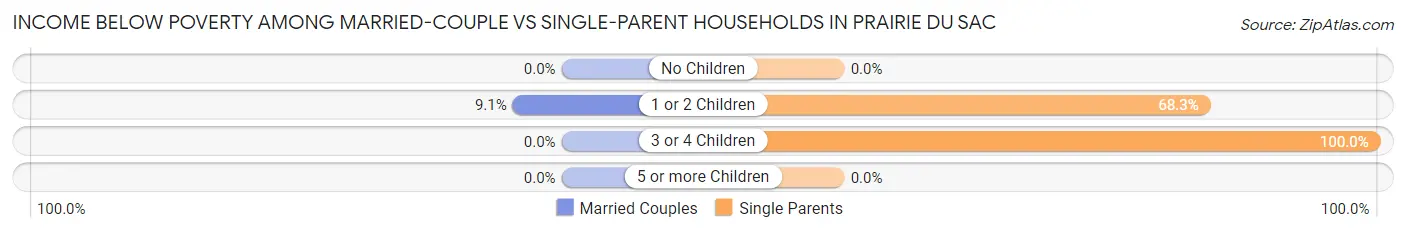
| Children | Married-Couple Families | Single-Parent Households |
| No Children | 0 (0.0%) | 0 (0.0%) |
| 1 or 2 Children | 29 (9.1%) | 82 (68.3%) |
| 3 or 4 Children | 0 (0.0%) | 10 (100.0%) |
| 5 or more Children | 0 (0.0%) | 0 (0.0%) |
| Total | 29 (2.9%) | 92 (42.6%) |
Employment Characteristics in Prairie Du Sac
Employment by Class of Employer in Prairie Du Sac
Among the 2,406 employed individuals in Prairie Du Sac, private company employees (1,668 | 69.3%), not-for-profit organizations (346 | 14.4%), and local government employees (123 | 5.1%) make up the most common classes of employment.
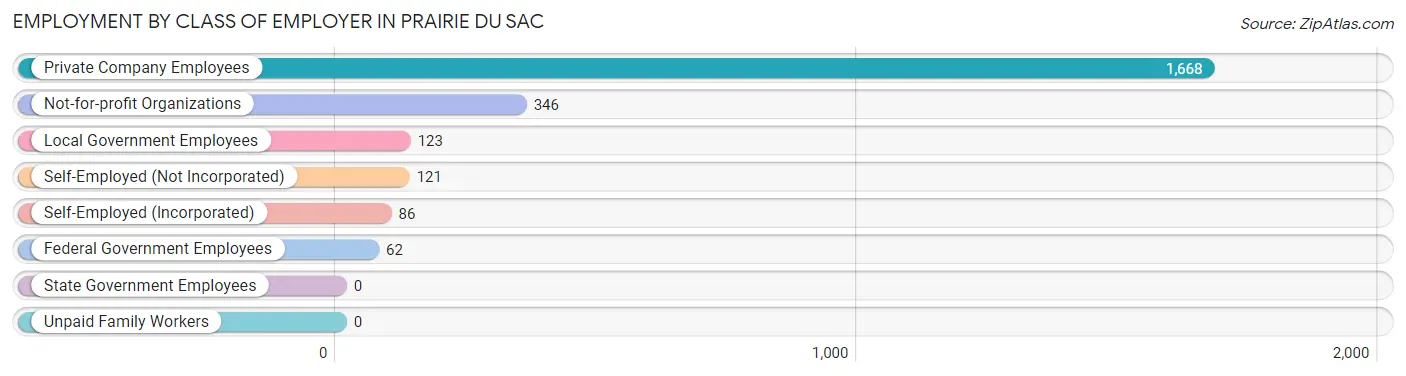
| Employer Class | # Employees | % Employees |
| Private Company Employees | 1,668 | 69.3% |
| Self-Employed (Incorporated) | 86 | 3.6% |
| Self-Employed (Not Incorporated) | 121 | 5.0% |
| Not-for-profit Organizations | 346 | 14.4% |
| Local Government Employees | 123 | 5.1% |
| State Government Employees | 0 | 0.0% |
| Federal Government Employees | 62 | 2.6% |
| Unpaid Family Workers | 0 | 0.0% |
| Total | 2,406 | 100.0% |
Employment Status by Age in Prairie Du Sac
According to the labor force statistics for Prairie Du Sac, out of the total population over 16 years of age (3,410), 72.6% or 2,476 individuals are in the labor force, with 1.4% or 35 of them unemployed. The age group with the highest labor force participation rate is 30 to 34 years, with 100.0% or 319 individuals in the labor force. Within the labor force, the 65 to 74 years age range has the highest percentage of unemployed individuals, with 16.5% or 14 of them being unemployed.
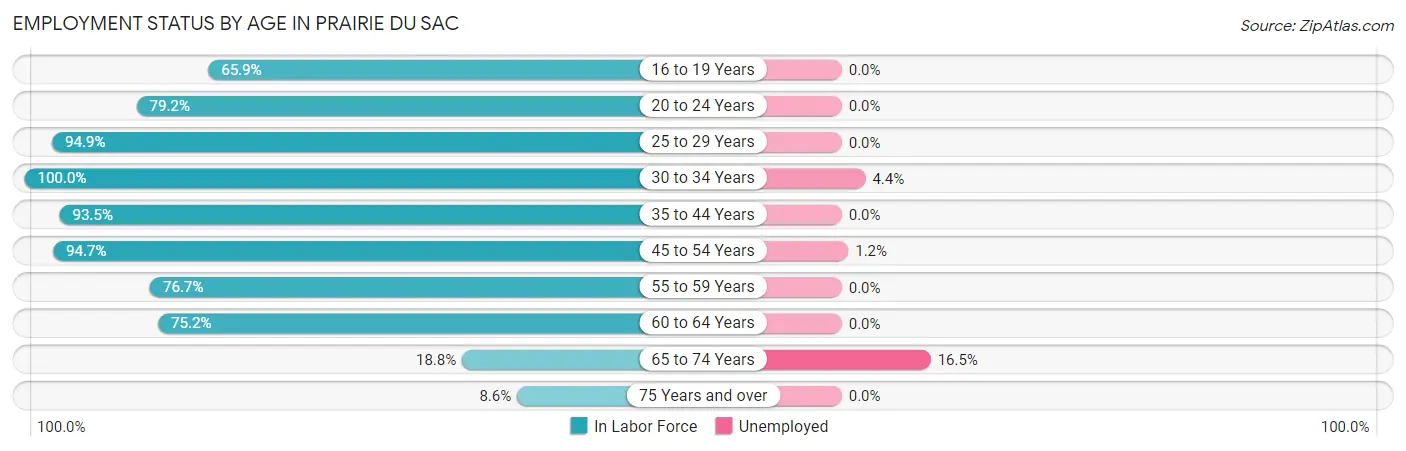
| Age Bracket | In Labor Force | Unemployed |
| 16 to 19 Years | 89 (65.9%) | 0 (0.0%) |
| 20 to 24 Years | 99 (79.2%) | 0 (0.0%) |
| 25 to 29 Years | 450 (94.9%) | 0 (0.0%) |
| 30 to 34 Years | 319 (100.0%) | 14 (4.4%) |
| 35 to 44 Years | 472 (93.5%) | 0 (0.0%) |
| 45 to 54 Years | 584 (94.7%) | 7 (1.2%) |
| 55 to 59 Years | 273 (76.7%) | 0 (0.0%) |
| 60 to 64 Years | 76 (75.2%) | 0 (0.0%) |
| 65 to 74 Years | 85 (18.8%) | 14 (16.5%) |
| 75 Years and over | 28 (8.6%) | 0 (0.0%) |
| Total | 2,476 (72.6%) | 35 (1.4%) |
Employment Status by Educational Attainment in Prairie Du Sac
According to labor force statistics for Prairie Du Sac, 91.7% of individuals (2,175) out of the total population between 25 and 64 years of age (2,372) are in the labor force, with 1.0% or 22 of them being unemployed. The group with the highest labor force participation rate are those with the educational attainment of high school diploma, with 95.6% or 518 individuals in the labor force. Within the labor force, individuals with high school diploma education have the highest percentage of unemployment, with 2.7% or 14 of them being unemployed.
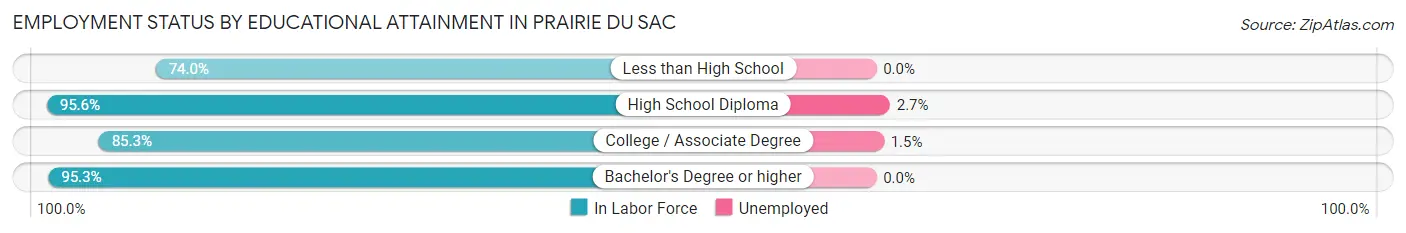
| Educational Attainment | In Labor Force | Unemployed |
| Less than High School | 111 (74.0%) | 0 (0.0%) |
| High School Diploma | 518 (95.6%) | 15 (2.7%) |
| College / Associate Degree | 480 (85.3%) | 8 (1.5%) |
| Bachelor's Degree or higher | 1,065 (95.3%) | 0 (0.0%) |
| Total | 2,175 (91.7%) | 24 (1.0%) |
Employment Occupations by Sex in Prairie Du Sac
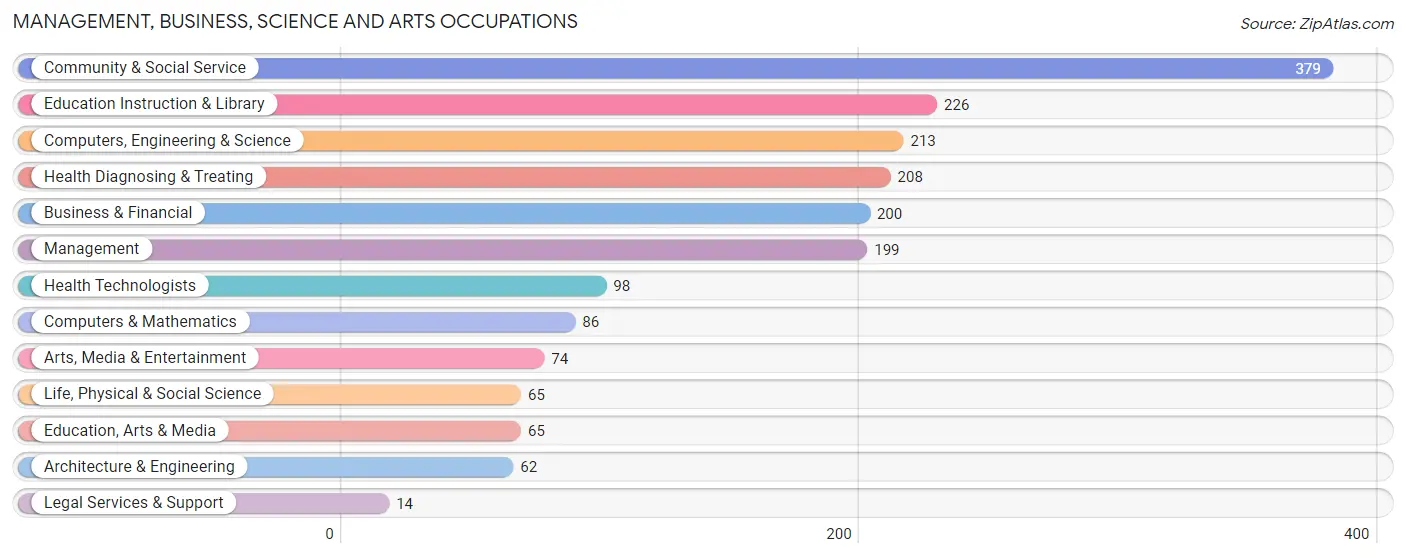
Management, Business, Science and Arts Occupations
The most common Management, Business, Science and Arts occupations in Prairie Du Sac are Community & Social Service (379 | 15.5%), Education Instruction & Library (226 | 9.3%), Computers, Engineering & Science (213 | 8.7%), Health Diagnosing & Treating (208 | 8.5%), and Business & Financial (200 | 8.2%).
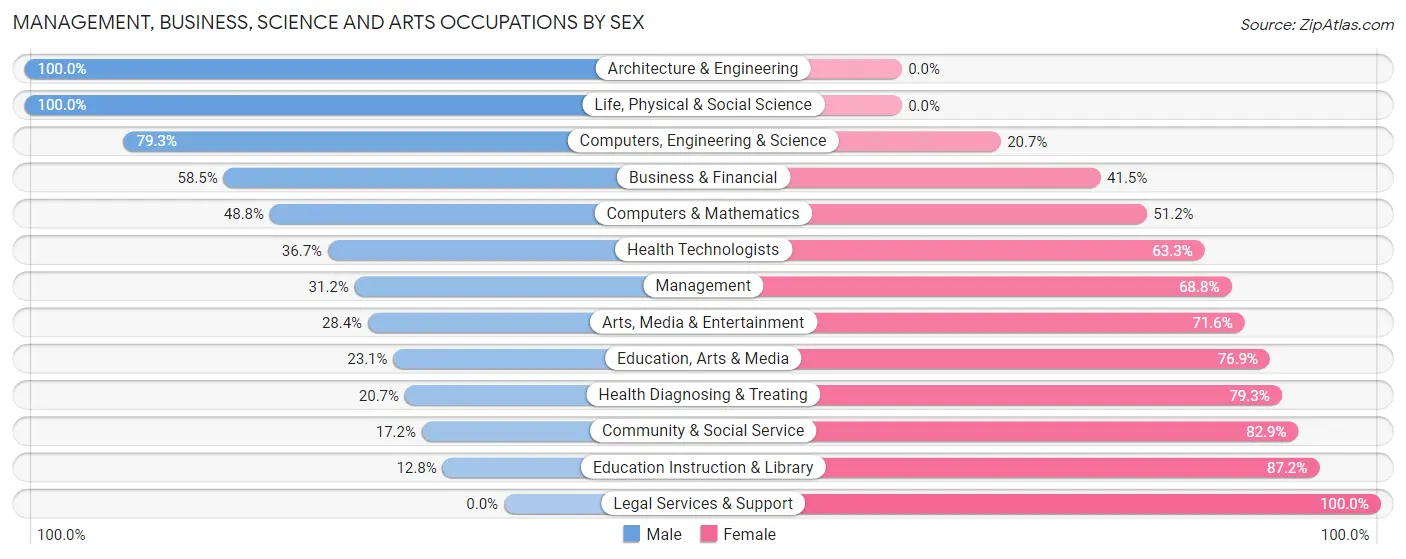
Management, Business, Science and Arts Occupations by Sex
Within the Management, Business, Science and Arts occupations in Prairie Du Sac, the most male-oriented occupations are Architecture & Engineering (100.0%), Life, Physical & Social Science (100.0%), and Computers, Engineering & Science (79.3%), while the most female-oriented occupations are Legal Services & Support (100.0%), Education Instruction & Library (87.2%), and Community & Social Service (82.9%).
| Occupation | Male | Female |
| Management | 62 (31.2%) | 137 (68.8%) |
| Business & Financial | 117 (58.5%) | 83 (41.5%) |
| Computers, Engineering & Science | 169 (79.3%) | 44 (20.7%) |
| Computers & Mathematics | 42 (48.8%) | 44 (51.2%) |
| Architecture & Engineering | 62 (100.0%) | 0 (0.0%) |
| Life, Physical & Social Science | 65 (100.0%) | 0 (0.0%) |
| Community & Social Service | 65 (17.2%) | 314 (82.9%) |
| Education, Arts & Media | 15 (23.1%) | 50 (76.9%) |
| Legal Services & Support | 0 (0.0%) | 14 (100.0%) |
| Education Instruction & Library | 29 (12.8%) | 197 (87.2%) |
| Arts, Media & Entertainment | 21 (28.4%) | 53 (71.6%) |
| Health Diagnosing & Treating | 43 (20.7%) | 165 (79.3%) |
| Health Technologists | 36 (36.7%) | 62 (63.3%) |
| Total (Category) | 456 (38.0%) | 743 (62.0%) |
| Total (Overall) | 1,226 (50.2%) | 1,214 (49.7%) |
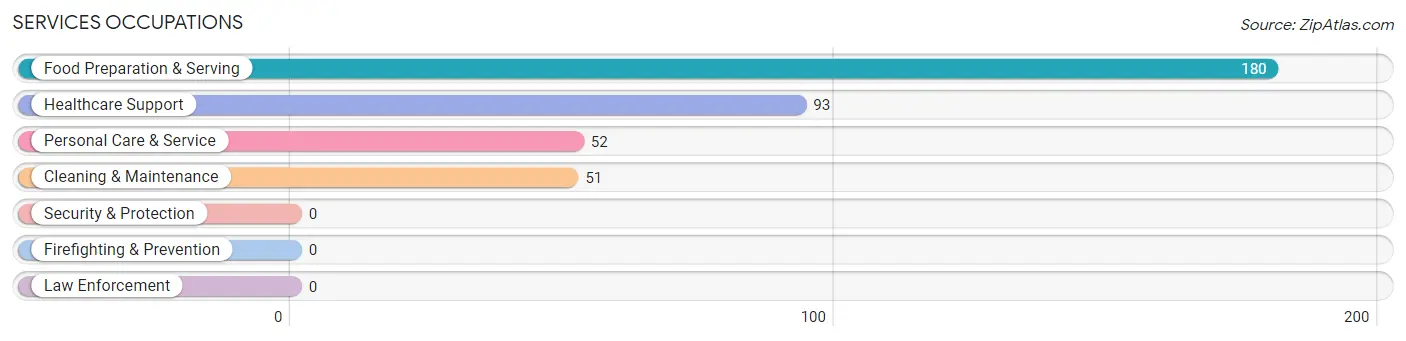
Services Occupations
The most common Services occupations in Prairie Du Sac are Food Preparation & Serving (180 | 7.4%), Healthcare Support (93 | 3.8%), Personal Care & Service (52 | 2.1%), and Cleaning & Maintenance (51 | 2.1%).
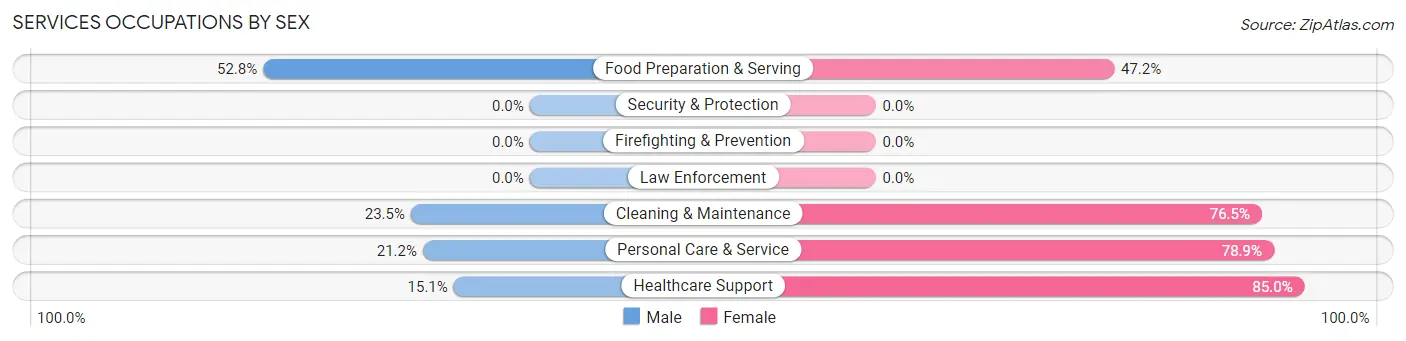
Services Occupations by Sex
Within the Services occupations in Prairie Du Sac, the most male-oriented occupations are Food Preparation & Serving (52.8%), Cleaning & Maintenance (23.5%), and Personal Care & Service (21.1%), while the most female-oriented occupations are Healthcare Support (85.0%), Personal Care & Service (78.8%), and Cleaning & Maintenance (76.5%).
| Occupation | Male | Female |
| Healthcare Support | 14 (15.0%) | 79 (85.0%) |
| Security & Protection | 0 (0.0%) | 0 (0.0%) |
| Firefighting & Prevention | 0 (0.0%) | 0 (0.0%) |
| Law Enforcement | 0 (0.0%) | 0 (0.0%) |
| Food Preparation & Serving | 95 (52.8%) | 85 (47.2%) |
| Cleaning & Maintenance | 12 (23.5%) | 39 (76.5%) |
| Personal Care & Service | 11 (21.1%) | 41 (78.8%) |
| Total (Category) | 132 (35.1%) | 244 (64.9%) |
| Total (Overall) | 1,226 (50.2%) | 1,214 (49.7%) |
Sales and Office Occupations
The most common Sales and Office occupations in Prairie Du Sac are Office & Administration (153 | 6.3%), and Sales & Related (143 | 5.9%).

Sales and Office Occupations by Sex

| Occupation | Male | Female |
| Sales & Related | 86 (60.1%) | 57 (39.9%) |
| Office & Administration | 31 (20.3%) | 122 (79.7%) |
| Total (Category) | 117 (39.5%) | 179 (60.5%) |
| Total (Overall) | 1,226 (50.2%) | 1,214 (49.7%) |
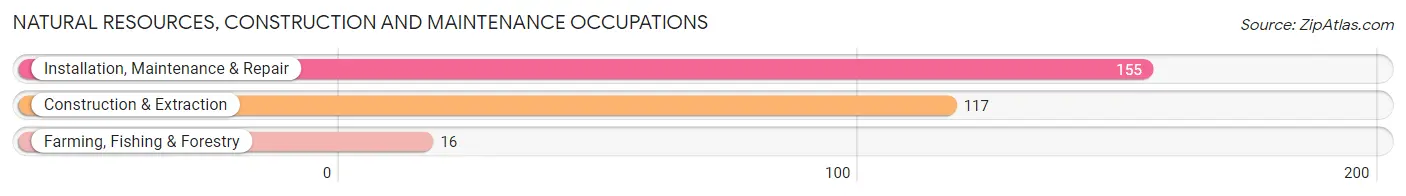
Natural Resources, Construction and Maintenance Occupations
The most common Natural Resources, Construction and Maintenance occupations in Prairie Du Sac are Installation, Maintenance & Repair (155 | 6.4%), Construction & Extraction (117 | 4.8%), and Farming, Fishing & Forestry (16 | 0.7%).
Natural Resources, Construction and Maintenance Occupations by Sex
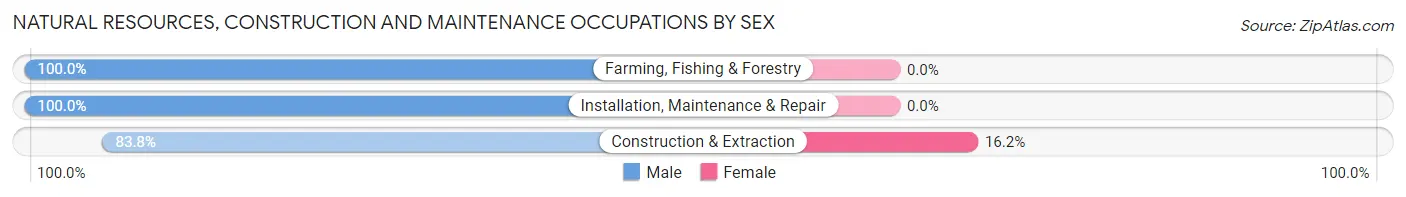
| Occupation | Male | Female |
| Farming, Fishing & Forestry | 16 (100.0%) | 0 (0.0%) |
| Construction & Extraction | 98 (83.8%) | 19 (16.2%) |
| Installation, Maintenance & Repair | 155 (100.0%) | 0 (0.0%) |
| Total (Category) | 269 (93.4%) | 19 (6.6%) |
| Total (Overall) | 1,226 (50.2%) | 1,214 (49.7%) |
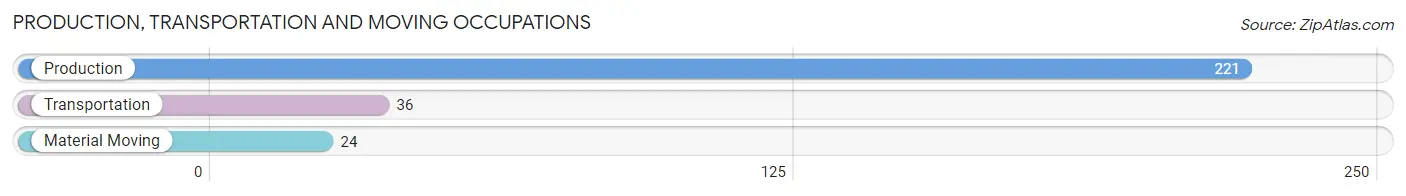
Production, Transportation and Moving Occupations
The most common Production, Transportation and Moving occupations in Prairie Du Sac are Production (221 | 9.1%), Transportation (36 | 1.5%), and Material Moving (24 | 1.0%).
Production, Transportation and Moving Occupations by Sex
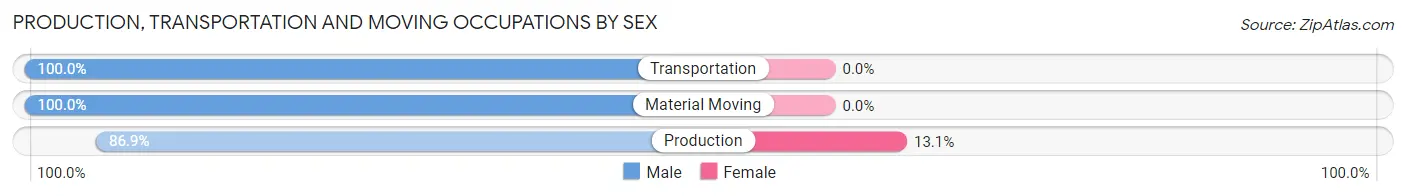
| Occupation | Male | Female |
| Production | 192 (86.9%) | 29 (13.1%) |
| Transportation | 36 (100.0%) | 0 (0.0%) |
| Material Moving | 24 (100.0%) | 0 (0.0%) |
| Total (Category) | 252 (89.7%) | 29 (10.3%) |
| Total (Overall) | 1,226 (50.2%) | 1,214 (49.7%) |
Employment Industries by Sex in Prairie Du Sac
Employment Industries in Prairie Du Sac
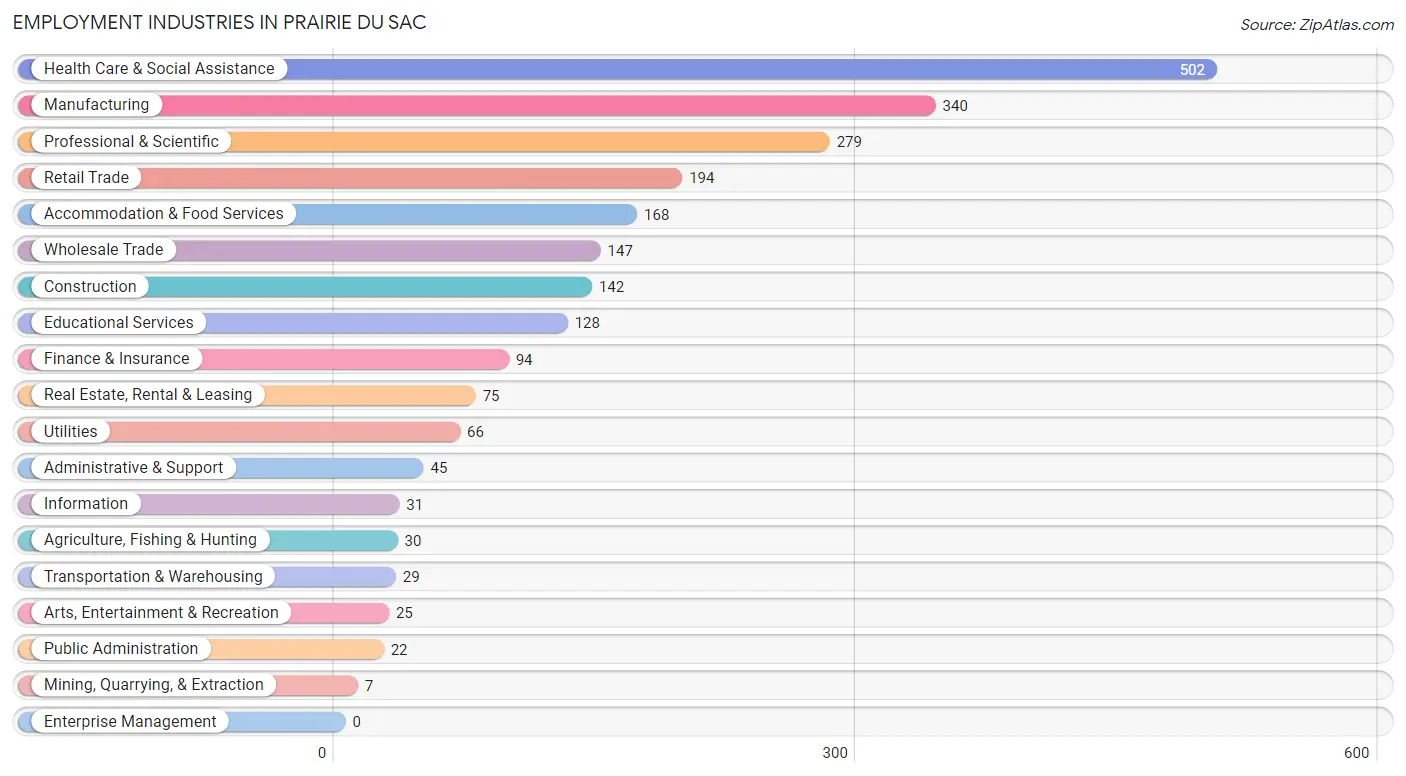
The major employment industries in Prairie Du Sac include Health Care & Social Assistance (502 | 20.6%), Manufacturing (340 | 13.9%), Professional & Scientific (279 | 11.4%), Retail Trade (194 | 8.0%), and Accommodation & Food Services (168 | 6.9%).
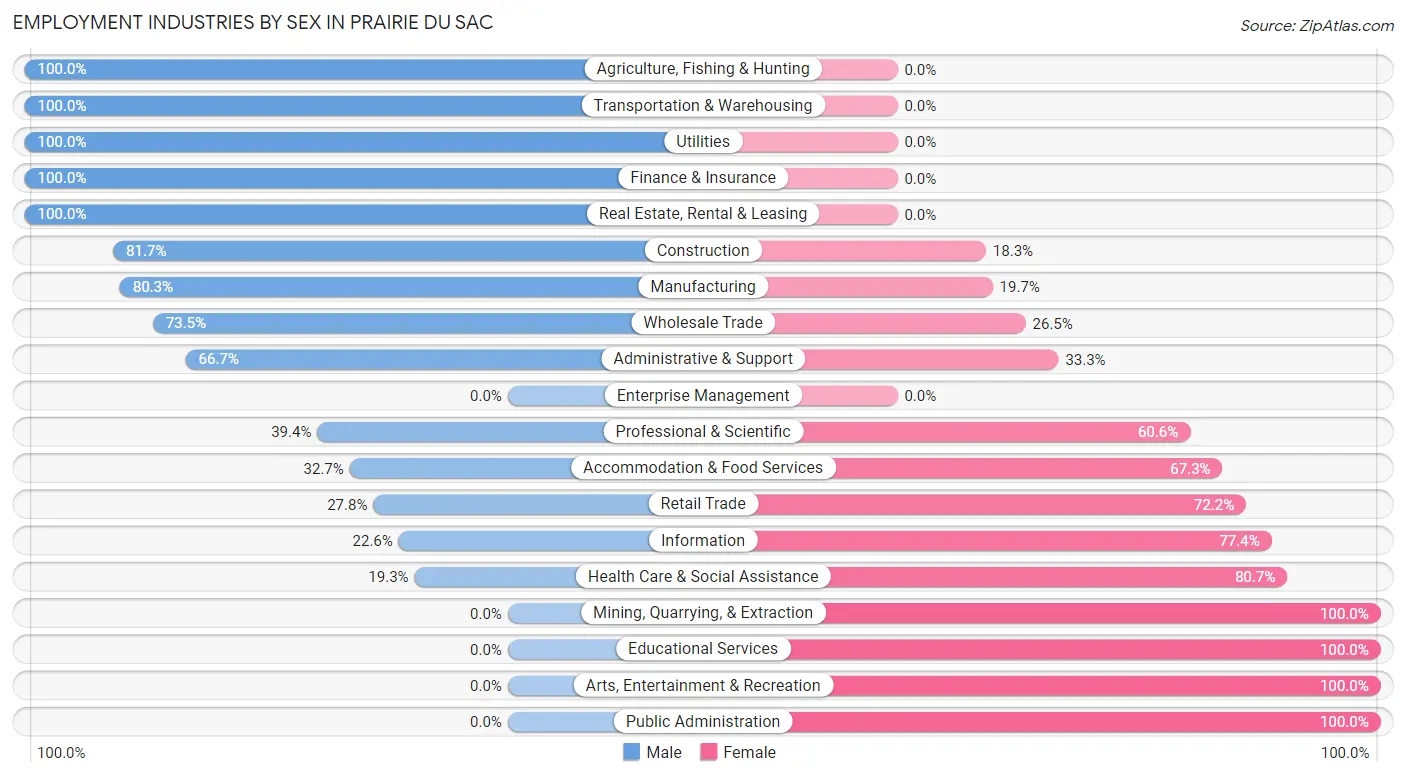
Employment Industries by Sex in Prairie Du Sac
The Prairie Du Sac industries that see more men than women are Agriculture, Fishing & Hunting (100.0%), Transportation & Warehousing (100.0%), and Utilities (100.0%), whereas the industries that tend to have a higher number of women are Mining, Quarrying, & Extraction (100.0%), Educational Services (100.0%), and Arts, Entertainment & Recreation (100.0%).
| Industry | Male | Female |
| Agriculture, Fishing & Hunting | 30 (100.0%) | 0 (0.0%) |
| Mining, Quarrying, & Extraction | 0 (0.0%) | 7 (100.0%) |
| Construction | 116 (81.7%) | 26 (18.3%) |
| Manufacturing | 273 (80.3%) | 67 (19.7%) |
| Wholesale Trade | 108 (73.5%) | 39 (26.5%) |
| Retail Trade | 54 (27.8%) | 140 (72.2%) |
| Transportation & Warehousing | 29 (100.0%) | 0 (0.0%) |
| Utilities | 66 (100.0%) | 0 (0.0%) |
| Information | 7 (22.6%) | 24 (77.4%) |
| Finance & Insurance | 94 (100.0%) | 0 (0.0%) |
| Real Estate, Rental & Leasing | 75 (100.0%) | 0 (0.0%) |
| Professional & Scientific | 110 (39.4%) | 169 (60.6%) |
| Enterprise Management | 0 (0.0%) | 0 (0.0%) |
| Administrative & Support | 30 (66.7%) | 15 (33.3%) |
| Educational Services | 0 (0.0%) | 128 (100.0%) |
| Health Care & Social Assistance | 97 (19.3%) | 405 (80.7%) |
| Arts, Entertainment & Recreation | 0 (0.0%) | 25 (100.0%) |
| Accommodation & Food Services | 55 (32.7%) | 113 (67.3%) |
| Public Administration | 0 (0.0%) | 22 (100.0%) |
| Total | 1,226 (50.2%) | 1,214 (49.7%) |
Education in Prairie Du Sac
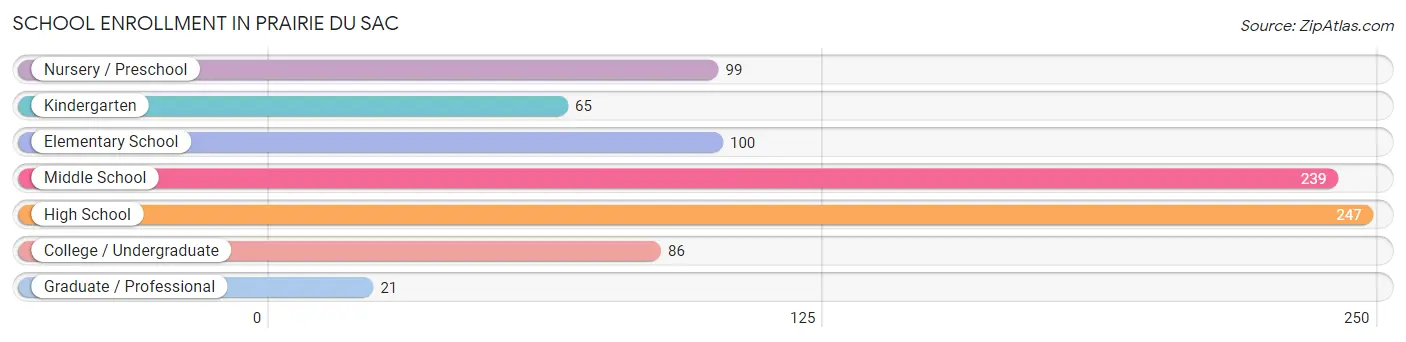
School Enrollment in Prairie Du Sac
The most common levels of schooling among the 857 students in Prairie Du Sac are high school (247 | 28.8%), middle school (239 | 27.9%), and elementary school (100 | 11.7%).
| School Level | # Students | % Students |
| Nursery / Preschool | 99 | 11.6% |
| Kindergarten | 65 | 7.6% |
| Elementary School | 100 | 11.7% |
| Middle School | 239 | 27.9% |
| High School | 247 | 28.8% |
| College / Undergraduate | 86 | 10.0% |
| Graduate / Professional | 21 | 2.5% |
| Total | 857 | 100.0% |
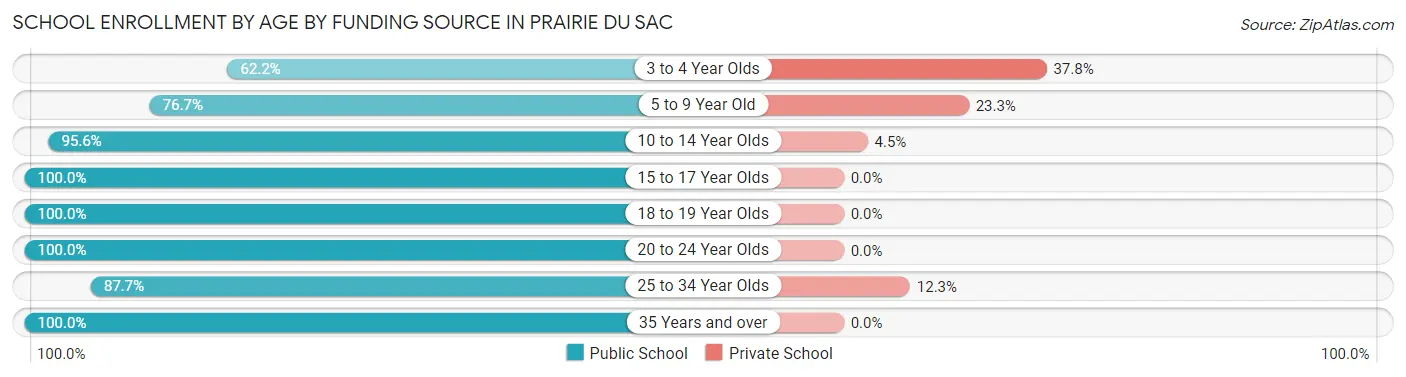
School Enrollment by Age by Funding Source in Prairie Du Sac
Out of a total of 857 students who are enrolled in schools in Prairie Du Sac, 90 (10.5%) attend a private institution, while the remaining 767 (89.5%) are enrolled in public schools. The age group of 3 to 4 year olds has the highest likelihood of being enrolled in private schools, with 17 (37.8% in the age bracket) enrolled. Conversely, the age group of 15 to 17 year olds has the lowest likelihood of being enrolled in a private school, with 177 (100.0% in the age bracket) attending a public institution.
| Age Bracket | Public School | Private School |
| 3 to 4 Year Olds | 28 (62.2%) | 17 (37.8%) |
| 5 to 9 Year Old | 168 (76.7%) | 51 (23.3%) |
| 10 to 14 Year Olds | 279 (95.6%) | 13 (4.4%) |
| 15 to 17 Year Olds | 177 (100.0%) | 0 (0.0%) |
| 18 to 19 Year Olds | 17 (100.0%) | 0 (0.0%) |
| 20 to 24 Year Olds | 22 (100.0%) | 0 (0.0%) |
| 25 to 34 Year Olds | 64 (87.7%) | 9 (12.3%) |
| 35 Years and over | 12 (100.0%) | 0 (0.0%) |
| Total | 767 (89.5%) | 90 (10.5%) |
Educational Attainment by Field of Study in Prairie Du Sac
Business (251 | 19.2%), bio, nature & agricultural (236 | 18.0%), education (160 | 12.2%), science & technology (153 | 11.7%), and visual & performing arts (108 | 8.2%) are the most common fields of study among 1,310 individuals in Prairie Du Sac who have obtained a bachelor's degree or higher.
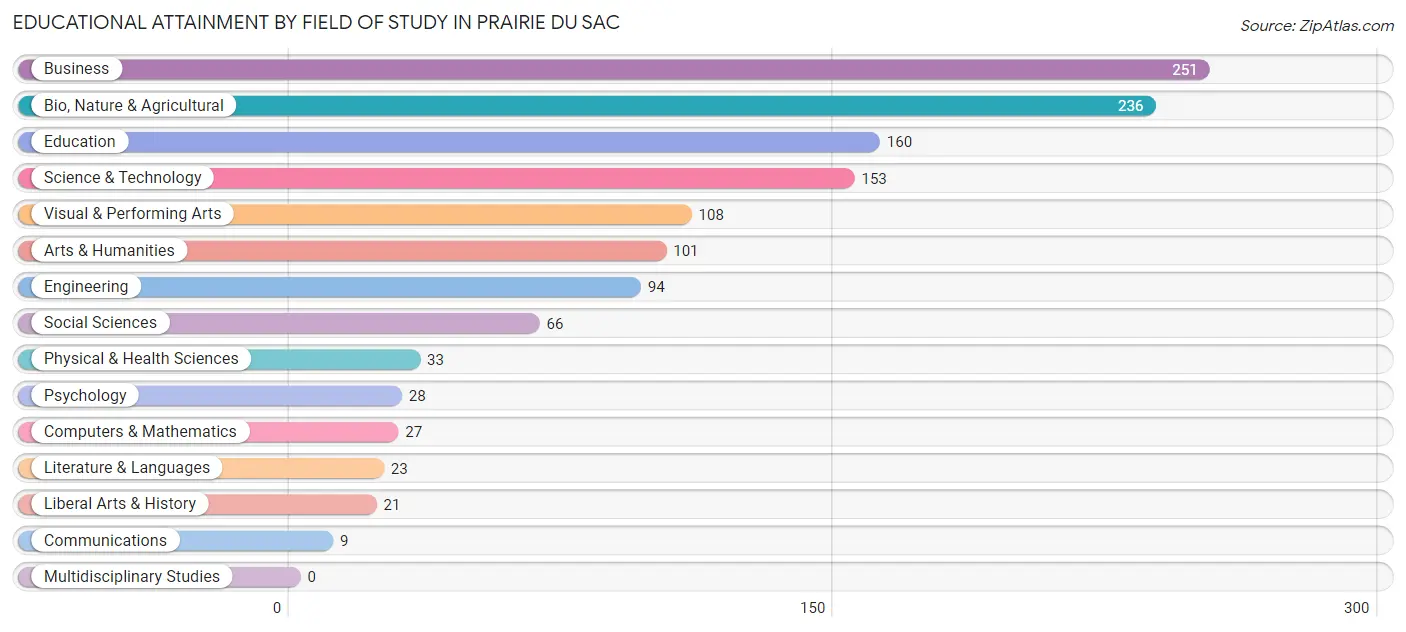
| Field of Study | # Graduates | % Graduates |
| Computers & Mathematics | 27 | 2.1% |
| Bio, Nature & Agricultural | 236 | 18.0% |
| Physical & Health Sciences | 33 | 2.5% |
| Psychology | 28 | 2.1% |
| Social Sciences | 66 | 5.0% |
| Engineering | 94 | 7.2% |
| Multidisciplinary Studies | 0 | 0.0% |
| Science & Technology | 153 | 11.7% |
| Business | 251 | 19.2% |
| Education | 160 | 12.2% |
| Literature & Languages | 23 | 1.8% |
| Liberal Arts & History | 21 | 1.6% |
| Visual & Performing Arts | 108 | 8.2% |
| Communications | 9 | 0.7% |
| Arts & Humanities | 101 | 7.7% |
| Total | 1,310 | 100.0% |
Transportation & Commute in Prairie Du Sac
Vehicle Availability by Sex in Prairie Du Sac
The most prevalent vehicle ownership categories in Prairie Du Sac are males with 2 vehicles (638, accounting for 52.2%) and females with 2 vehicles (652, making up 53.8%).
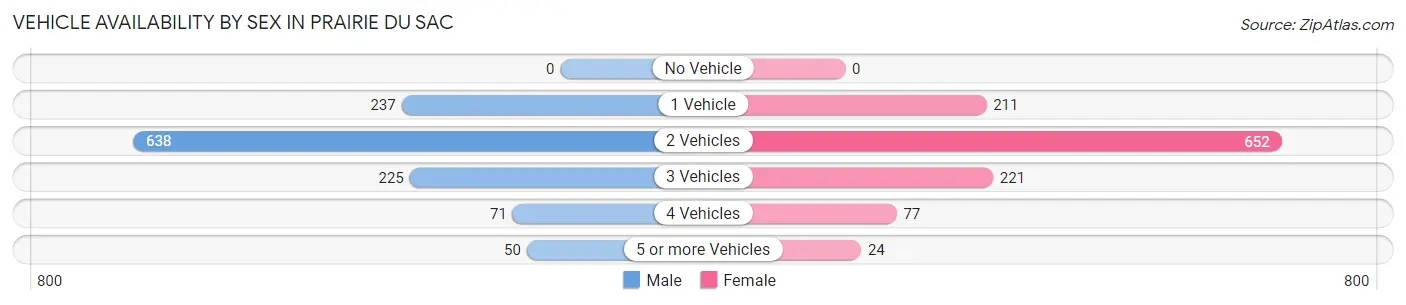
| Vehicles Available | Male | Female |
| No Vehicle | 0 (0.0%) | 0 (0.0%) |
| 1 Vehicle | 237 (19.4%) | 211 (17.8%) |
| 2 Vehicles | 638 (52.2%) | 652 (55.0%) |
| 3 Vehicles | 225 (18.4%) | 221 (18.6%) |
| 4 Vehicles | 71 (5.8%) | 77 (6.5%) |
| 5 or more Vehicles | 50 (4.1%) | 24 (2.0%) |
| Total | 1,221 (100.0%) | 1,185 (100.0%) |
Commute Time in Prairie Du Sac
The most frequently occuring commute durations in Prairie Du Sac are 5 to 9 minutes (472 commuters, 21.8%), 20 to 24 minutes (277 commuters, 12.8%), and less than 5 minutes (236 commuters, 10.9%).
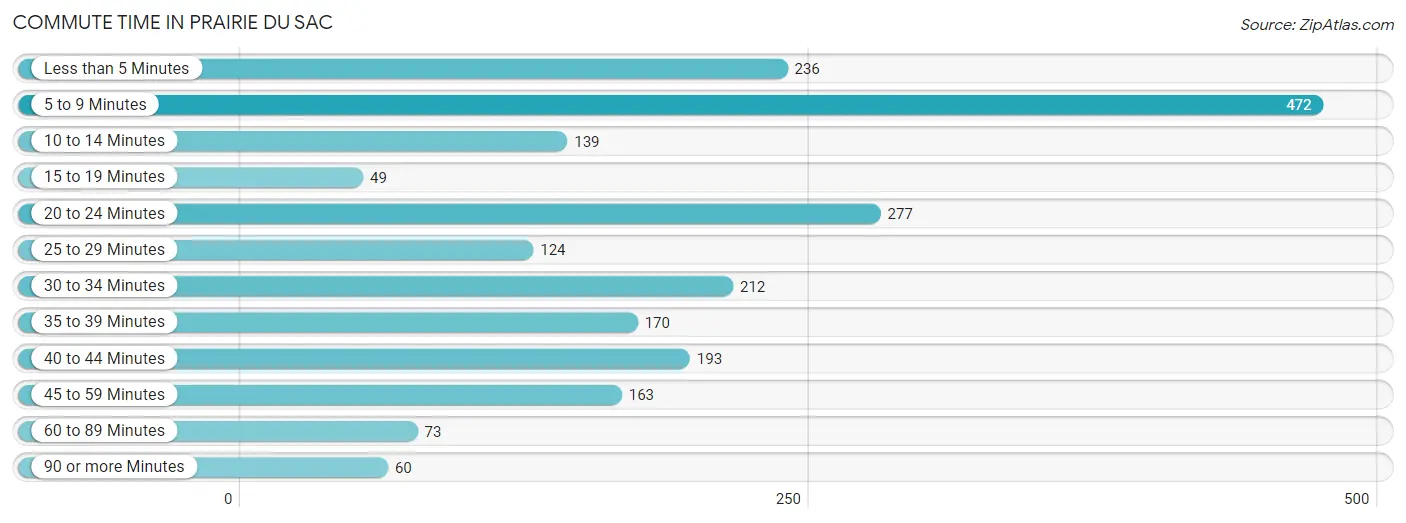
| Commute Time | # Commuters | % Commuters |
| Less than 5 Minutes | 236 | 10.9% |
| 5 to 9 Minutes | 472 | 21.8% |
| 10 to 14 Minutes | 139 | 6.4% |
| 15 to 19 Minutes | 49 | 2.3% |
| 20 to 24 Minutes | 277 | 12.8% |
| 25 to 29 Minutes | 124 | 5.7% |
| 30 to 34 Minutes | 212 | 9.8% |
| 35 to 39 Minutes | 170 | 7.8% |
| 40 to 44 Minutes | 193 | 8.9% |
| 45 to 59 Minutes | 163 | 7.5% |
| 60 to 89 Minutes | 73 | 3.4% |
| 90 or more Minutes | 60 | 2.8% |
Commute Time by Sex in Prairie Du Sac
The most common commute times in Prairie Du Sac are 5 to 9 minutes (250 commuters, 23.0%) for males and 5 to 9 minutes (222 commuters, 20.5%) for females.
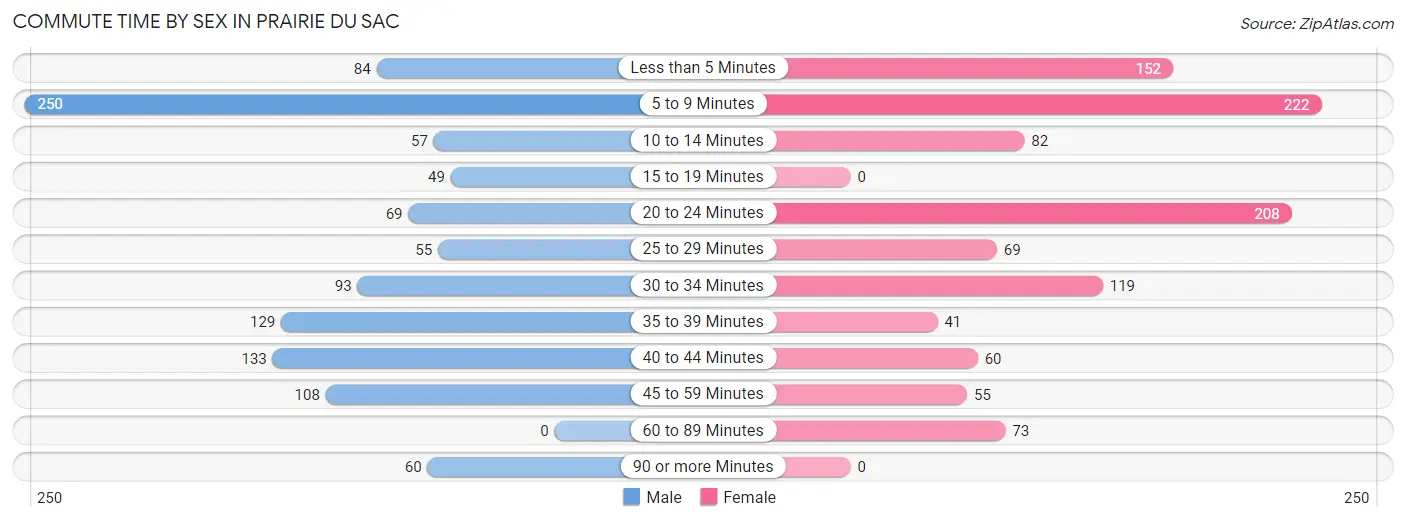
| Commute Time | Male | Female |
| Less than 5 Minutes | 84 (7.7%) | 152 (14.1%) |
| 5 to 9 Minutes | 250 (23.0%) | 222 (20.5%) |
| 10 to 14 Minutes | 57 (5.2%) | 82 (7.6%) |
| 15 to 19 Minutes | 49 (4.5%) | 0 (0.0%) |
| 20 to 24 Minutes | 69 (6.4%) | 208 (19.2%) |
| 25 to 29 Minutes | 55 (5.1%) | 69 (6.4%) |
| 30 to 34 Minutes | 93 (8.6%) | 119 (11.0%) |
| 35 to 39 Minutes | 129 (11.9%) | 41 (3.8%) |
| 40 to 44 Minutes | 133 (12.2%) | 60 (5.6%) |
| 45 to 59 Minutes | 108 (9.9%) | 55 (5.1%) |
| 60 to 89 Minutes | 0 (0.0%) | 73 (6.8%) |
| 90 or more Minutes | 60 (5.5%) | 0 (0.0%) |
Time of Departure to Work by Sex in Prairie Du Sac
The most frequent times of departure to work in Prairie Du Sac are 12:00 AM to 4:59 AM (186, 17.1%) for males and 12:00 PM to 3:59 PM (234, 21.6%) for females.
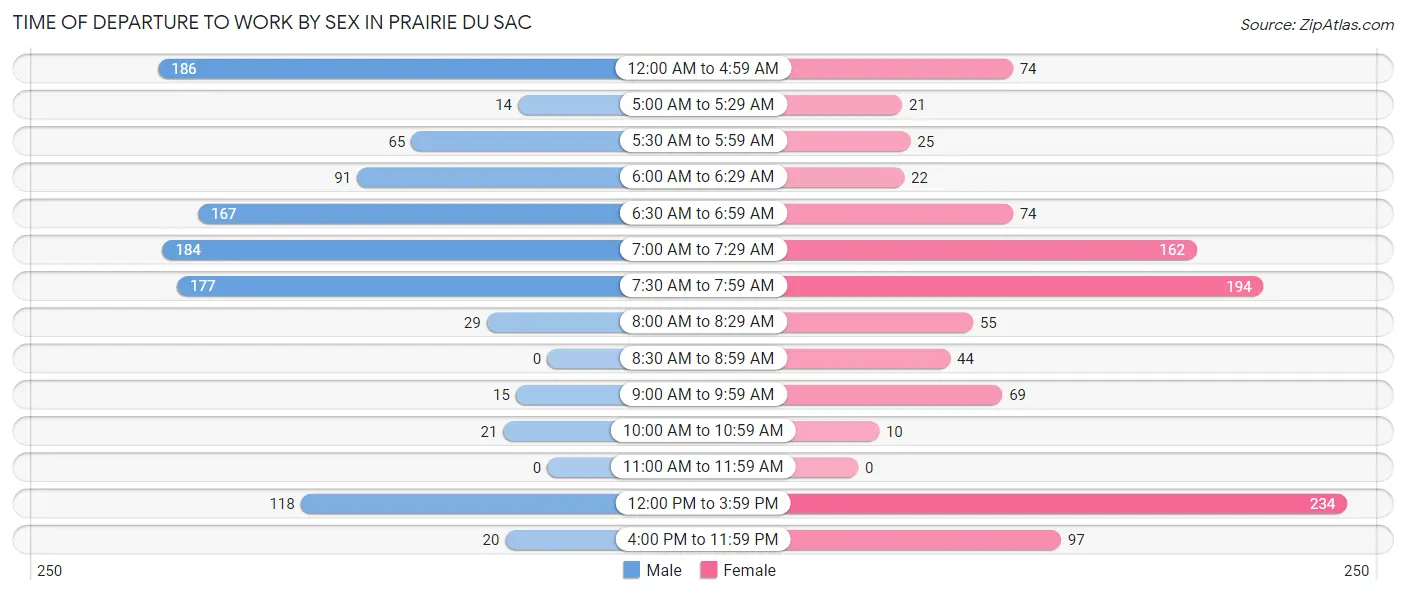
| Time of Departure | Male | Female |
| 12:00 AM to 4:59 AM | 186 (17.1%) | 74 (6.9%) |
| 5:00 AM to 5:29 AM | 14 (1.3%) | 21 (1.9%) |
| 5:30 AM to 5:59 AM | 65 (6.0%) | 25 (2.3%) |
| 6:00 AM to 6:29 AM | 91 (8.4%) | 22 (2.0%) |
| 6:30 AM to 6:59 AM | 167 (15.4%) | 74 (6.9%) |
| 7:00 AM to 7:29 AM | 184 (16.9%) | 162 (15.0%) |
| 7:30 AM to 7:59 AM | 177 (16.3%) | 194 (17.9%) |
| 8:00 AM to 8:29 AM | 29 (2.7%) | 55 (5.1%) |
| 8:30 AM to 8:59 AM | 0 (0.0%) | 44 (4.1%) |
| 9:00 AM to 9:59 AM | 15 (1.4%) | 69 (6.4%) |
| 10:00 AM to 10:59 AM | 21 (1.9%) | 10 (0.9%) |
| 11:00 AM to 11:59 AM | 0 (0.0%) | 0 (0.0%) |
| 12:00 PM to 3:59 PM | 118 (10.9%) | 234 (21.6%) |
| 4:00 PM to 11:59 PM | 20 (1.8%) | 97 (9.0%) |
| Total | 1,087 (100.0%) | 1,081 (100.0%) |
Housing Occupancy in Prairie Du Sac
Occupancy by Ownership in Prairie Du Sac
Of the total 1,860 dwellings in Prairie Du Sac, owner-occupied units account for 1,205 (64.8%), while renter-occupied units make up 655 (35.2%).
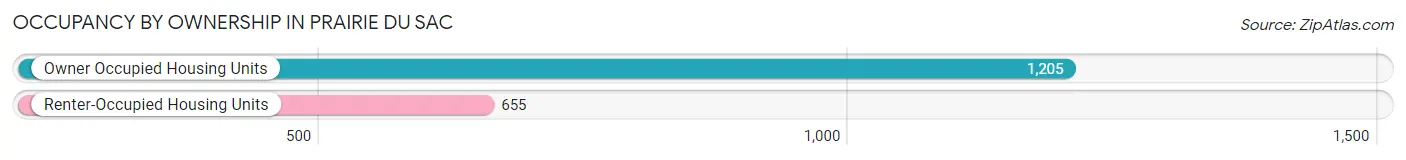
| Occupancy | # Housing Units | % Housing Units |
| Owner Occupied Housing Units | 1,205 | 64.8% |
| Renter-Occupied Housing Units | 655 | 35.2% |
| Total Occupied Housing Units | 1,860 | 100.0% |
Occupancy by Household Size in Prairie Du Sac
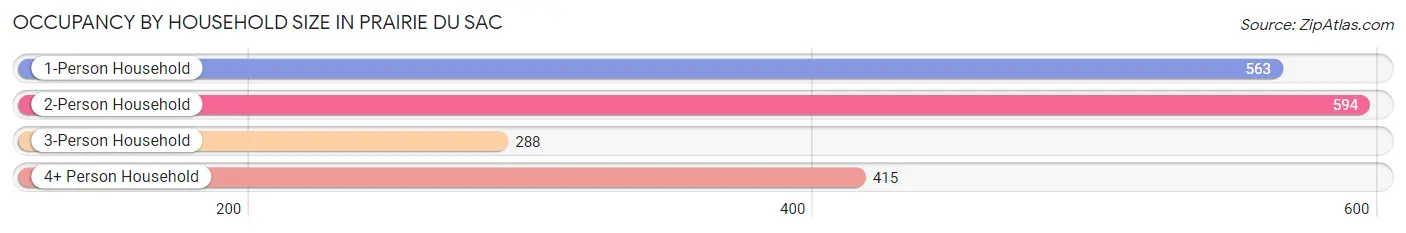
| Household Size | # Housing Units | % Housing Units |
| 1-Person Household | 563 | 30.3% |
| 2-Person Household | 594 | 31.9% |
| 3-Person Household | 288 | 15.5% |
| 4+ Person Household | 415 | 22.3% |
| Total Housing Units | 1,860 | 100.0% |
Occupancy by Ownership by Household Size in Prairie Du Sac
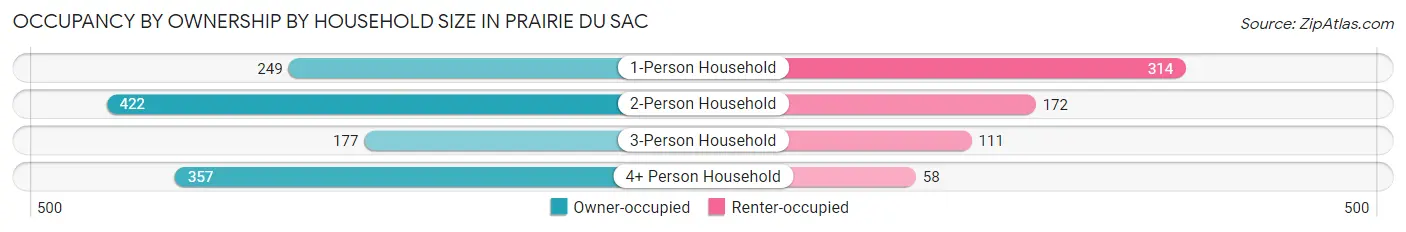
| Household Size | Owner-occupied | Renter-occupied |
| 1-Person Household | 249 (44.2%) | 314 (55.8%) |
| 2-Person Household | 422 (71.0%) | 172 (29.0%) |
| 3-Person Household | 177 (61.5%) | 111 (38.5%) |
| 4+ Person Household | 357 (86.0%) | 58 (14.0%) |
| Total Housing Units | 1,205 (64.8%) | 655 (35.2%) |
Occupancy by Educational Attainment in Prairie Du Sac
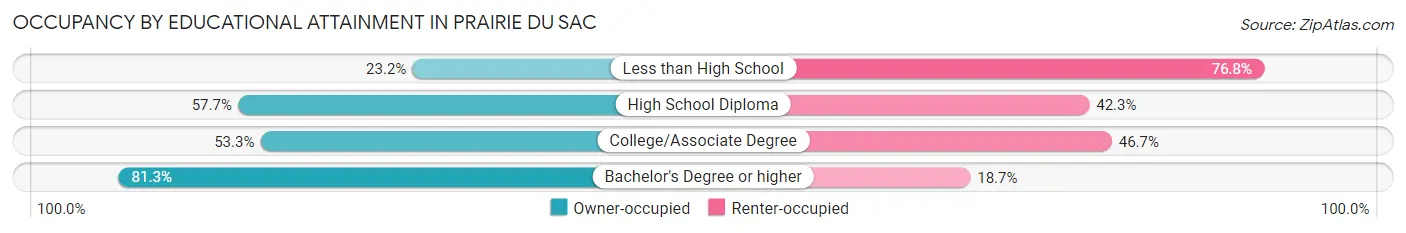
| Household Size | Owner-occupied | Renter-occupied |
| Less than High School | 22 (23.2%) | 73 (76.8%) |
| High School Diploma | 220 (57.7%) | 161 (42.3%) |
| College/Associate Degree | 309 (53.3%) | 271 (46.7%) |
| Bachelor's Degree or higher | 654 (81.3%) | 150 (18.7%) |
Occupancy by Age of Householder in Prairie Du Sac
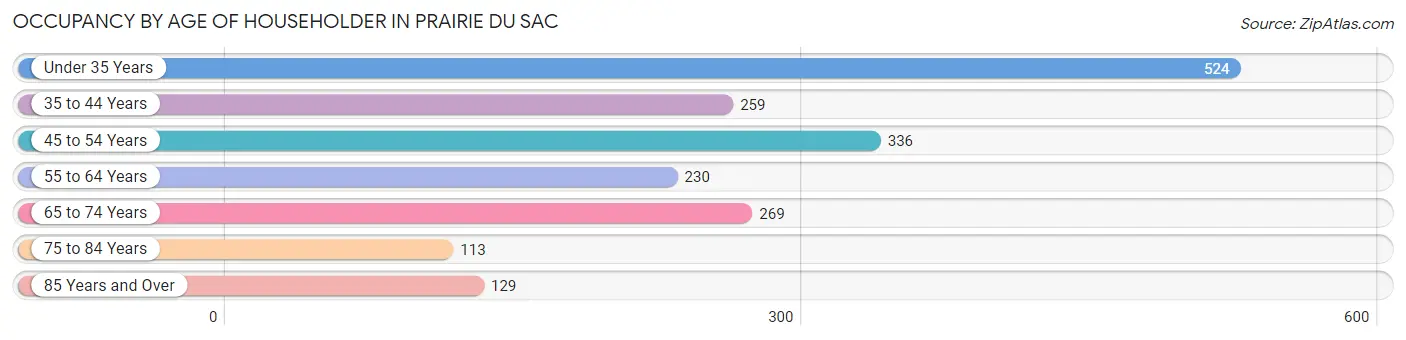
| Age Bracket | # Households | % Households |
| Under 35 Years | 524 | 28.2% |
| 35 to 44 Years | 259 | 13.9% |
| 45 to 54 Years | 336 | 18.1% |
| 55 to 64 Years | 230 | 12.4% |
| 65 to 74 Years | 269 | 14.5% |
| 75 to 84 Years | 113 | 6.1% |
| 85 Years and Over | 129 | 6.9% |
| Total | 1,860 | 100.0% |
Housing Finances in Prairie Du Sac
Median Income by Occupancy in Prairie Du Sac
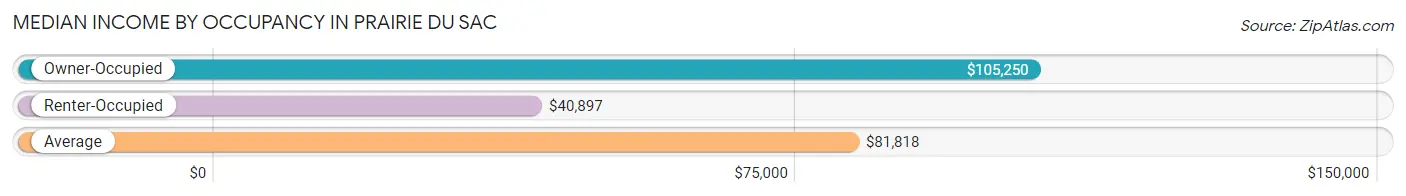
| Occupancy Type | # Households | Median Income |
| Owner-Occupied | 1,205 (64.8%) | $105,250 |
| Renter-Occupied | 655 (35.2%) | $40,897 |
| Average | 1,860 (100.0%) | $81,818 |
Occupancy by Householder Income Bracket in Prairie Du Sac
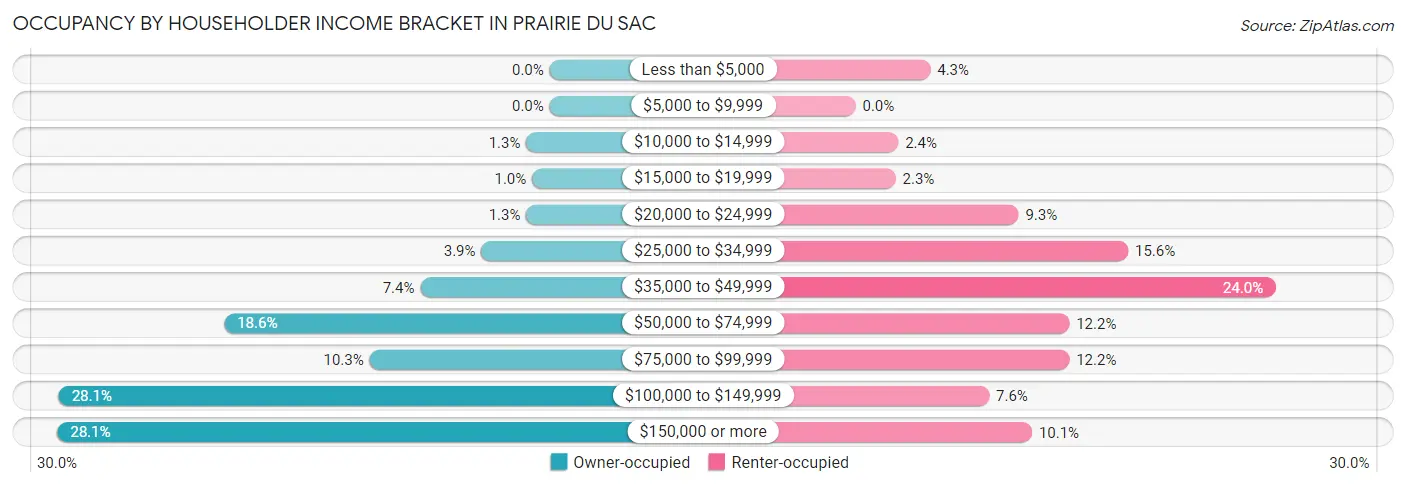
| Income Bracket | Owner-occupied | Renter-occupied |
| Less than $5,000 | 0 (0.0%) | 28 (4.3%) |
| $5,000 to $9,999 | 0 (0.0%) | 0 (0.0%) |
| $10,000 to $14,999 | 16 (1.3%) | 16 (2.4%) |
| $15,000 to $19,999 | 12 (1.0%) | 15 (2.3%) |
| $20,000 to $24,999 | 16 (1.3%) | 61 (9.3%) |
| $25,000 to $34,999 | 47 (3.9%) | 102 (15.6%) |
| $35,000 to $49,999 | 89 (7.4%) | 157 (24.0%) |
| $50,000 to $74,999 | 224 (18.6%) | 80 (12.2%) |
| $75,000 to $99,999 | 124 (10.3%) | 80 (12.2%) |
| $100,000 to $149,999 | 338 (28.1%) | 50 (7.6%) |
| $150,000 or more | 339 (28.1%) | 66 (10.1%) |
| Total | 1,205 (100.0%) | 655 (100.0%) |
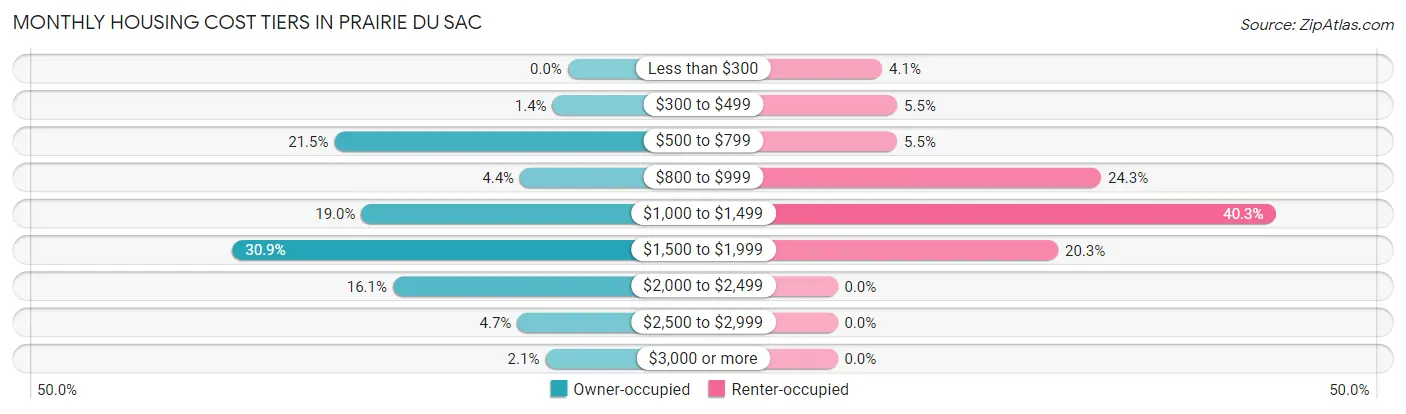
Monthly Housing Cost Tiers in Prairie Du Sac
| Monthly Cost | Owner-occupied | Renter-occupied |
| Less than $300 | 0 (0.0%) | 27 (4.1%) |
| $300 to $499 | 17 (1.4%) | 36 (5.5%) |
| $500 to $799 | 259 (21.5%) | 36 (5.5%) |
| $800 to $999 | 53 (4.4%) | 159 (24.3%) |
| $1,000 to $1,499 | 229 (19.0%) | 264 (40.3%) |
| $1,500 to $1,999 | 372 (30.9%) | 133 (20.3%) |
| $2,000 to $2,499 | 194 (16.1%) | 0 (0.0%) |
| $2,500 to $2,999 | 56 (4.6%) | 0 (0.0%) |
| $3,000 or more | 25 (2.1%) | 0 (0.0%) |
| Total | 1,205 (100.0%) | 655 (100.0%) |
Physical Housing Characteristics in Prairie Du Sac
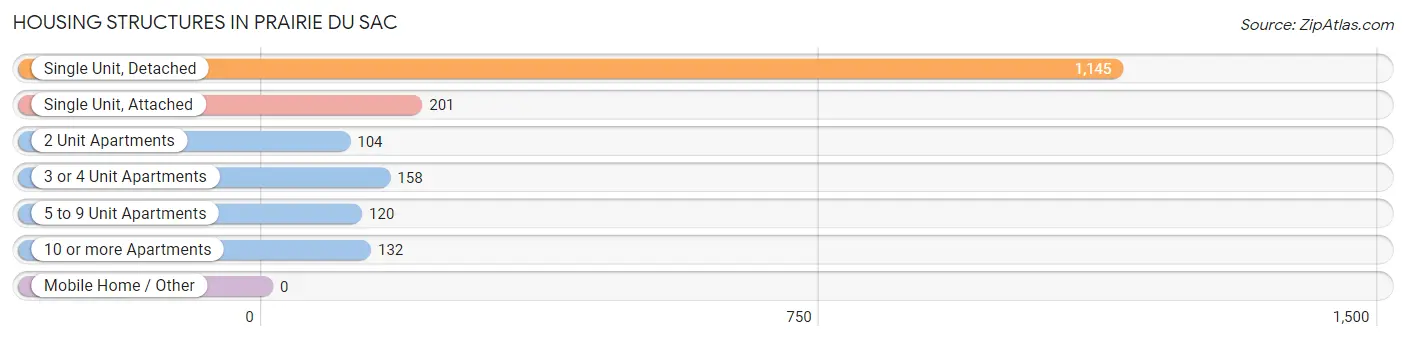
Housing Structures in Prairie Du Sac
| Structure Type | # Housing Units | % Housing Units |
| Single Unit, Detached | 1,145 | 61.6% |
| Single Unit, Attached | 201 | 10.8% |
| 2 Unit Apartments | 104 | 5.6% |
| 3 or 4 Unit Apartments | 158 | 8.5% |
| 5 to 9 Unit Apartments | 120 | 6.5% |
| 10 or more Apartments | 132 | 7.1% |
| Mobile Home / Other | 0 | 0.0% |
| Total | 1,860 | 100.0% |
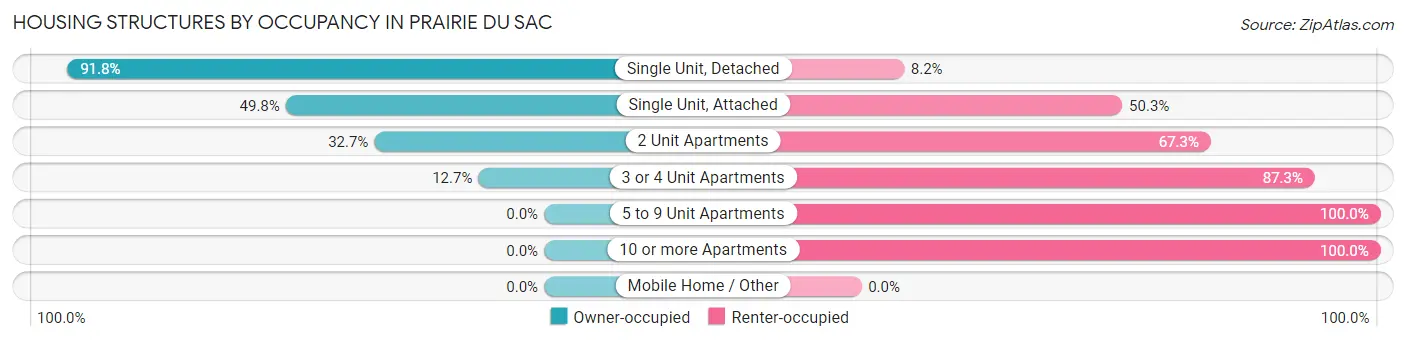
Housing Structures by Occupancy in Prairie Du Sac
| Structure Type | Owner-occupied | Renter-occupied |
| Single Unit, Detached | 1,051 (91.8%) | 94 (8.2%) |
| Single Unit, Attached | 100 (49.7%) | 101 (50.2%) |
| 2 Unit Apartments | 34 (32.7%) | 70 (67.3%) |
| 3 or 4 Unit Apartments | 20 (12.7%) | 138 (87.3%) |
| 5 to 9 Unit Apartments | 0 (0.0%) | 120 (100.0%) |
| 10 or more Apartments | 0 (0.0%) | 132 (100.0%) |
| Mobile Home / Other | 0 (0.0%) | 0 (0.0%) |
| Total | 1,205 (64.8%) | 655 (35.2%) |
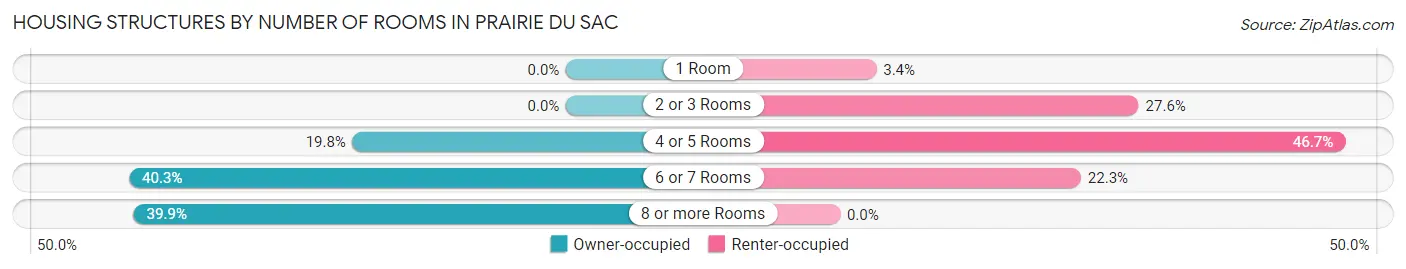
Housing Structures by Number of Rooms in Prairie Du Sac
| Number of Rooms | Owner-occupied | Renter-occupied |
| 1 Room | 0 (0.0%) | 22 (3.4%) |
| 2 or 3 Rooms | 0 (0.0%) | 181 (27.6%) |
| 4 or 5 Rooms | 238 (19.8%) | 306 (46.7%) |
| 6 or 7 Rooms | 486 (40.3%) | 146 (22.3%) |
| 8 or more Rooms | 481 (39.9%) | 0 (0.0%) |
| Total | 1,205 (100.0%) | 655 (100.0%) |
Housing Structure by Heating Type in Prairie Du Sac
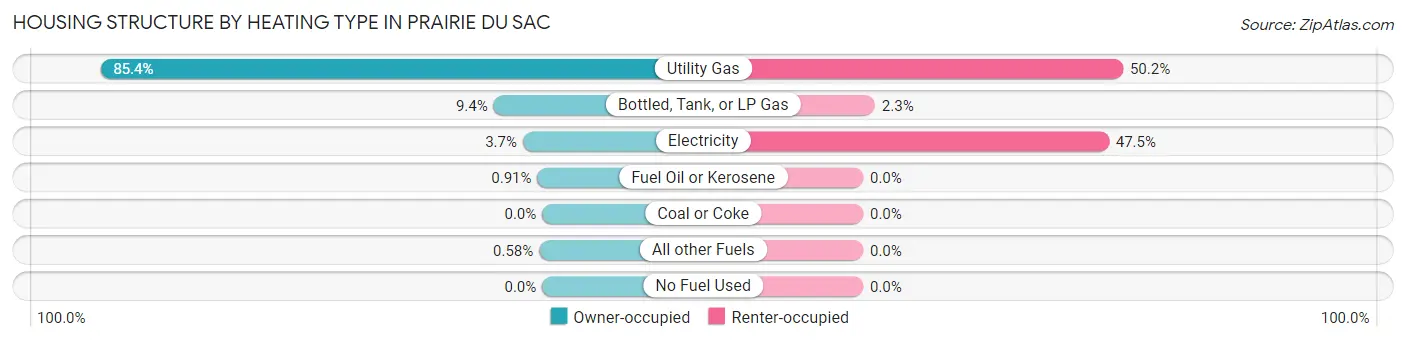
| Heating Type | Owner-occupied | Renter-occupied |
| Utility Gas | 1,029 (85.4%) | 329 (50.2%) |
| Bottled, Tank, or LP Gas | 113 (9.4%) | 15 (2.3%) |
| Electricity | 45 (3.7%) | 311 (47.5%) |
| Fuel Oil or Kerosene | 11 (0.9%) | 0 (0.0%) |
| Coal or Coke | 0 (0.0%) | 0 (0.0%) |
| All other Fuels | 7 (0.6%) | 0 (0.0%) |
| No Fuel Used | 0 (0.0%) | 0 (0.0%) |
| Total | 1,205 (100.0%) | 655 (100.0%) |
Household Vehicle Usage in Prairie Du Sac
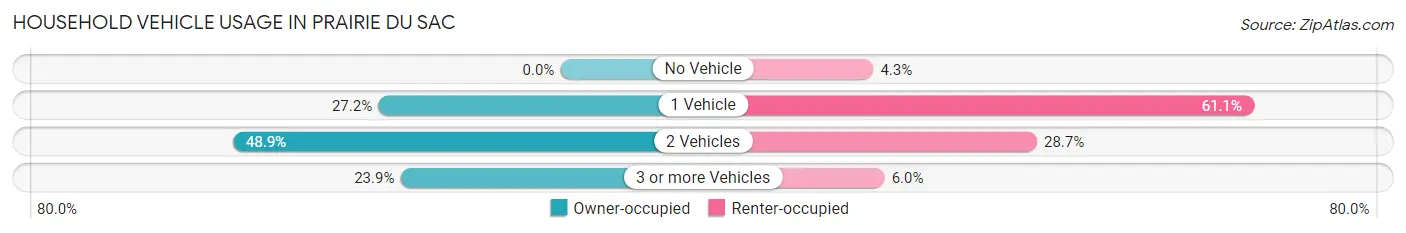
| Vehicles per Household | Owner-occupied | Renter-occupied |
| No Vehicle | 0 (0.0%) | 28 (4.3%) |
| 1 Vehicle | 328 (27.2%) | 400 (61.1%) |
| 2 Vehicles | 589 (48.9%) | 188 (28.7%) |
| 3 or more Vehicles | 288 (23.9%) | 39 (5.9%) |
| Total | 1,205 (100.0%) | 655 (100.0%) |
Real Estate & Mortgages in Prairie Du Sac
Real Estate and Mortgage Overview in Prairie Du Sac
| Characteristic | Without Mortgage | With Mortgage |
| Housing Units | 307 | 898 |
| Median Property Value | $263,000 | $321,000 |
| Median Household Income | $71,198 | $303 |
| Monthly Housing Costs | $635 | $25 |
| Real Estate Taxes | $4,594 | $0 |
Property Value by Mortgage Status in Prairie Du Sac
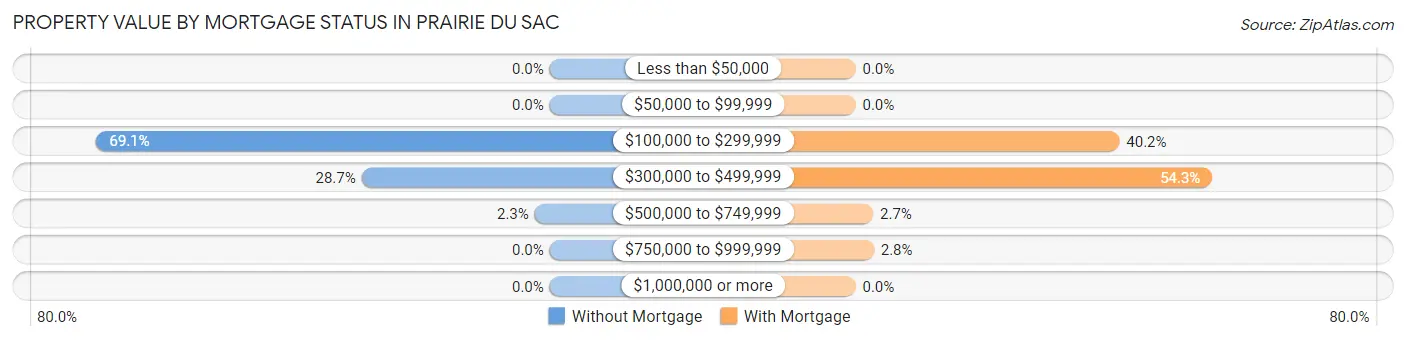
| Property Value | Without Mortgage | With Mortgage |
| Less than $50,000 | 0 (0.0%) | 0 (0.0%) |
| $50,000 to $99,999 | 0 (0.0%) | 0 (0.0%) |
| $100,000 to $299,999 | 212 (69.1%) | 361 (40.2%) |
| $300,000 to $499,999 | 88 (28.7%) | 488 (54.3%) |
| $500,000 to $749,999 | 7 (2.3%) | 24 (2.7%) |
| $750,000 to $999,999 | 0 (0.0%) | 25 (2.8%) |
| $1,000,000 or more | 0 (0.0%) | 0 (0.0%) |
| Total | 307 (100.0%) | 898 (100.0%) |
Household Income by Mortgage Status in Prairie Du Sac
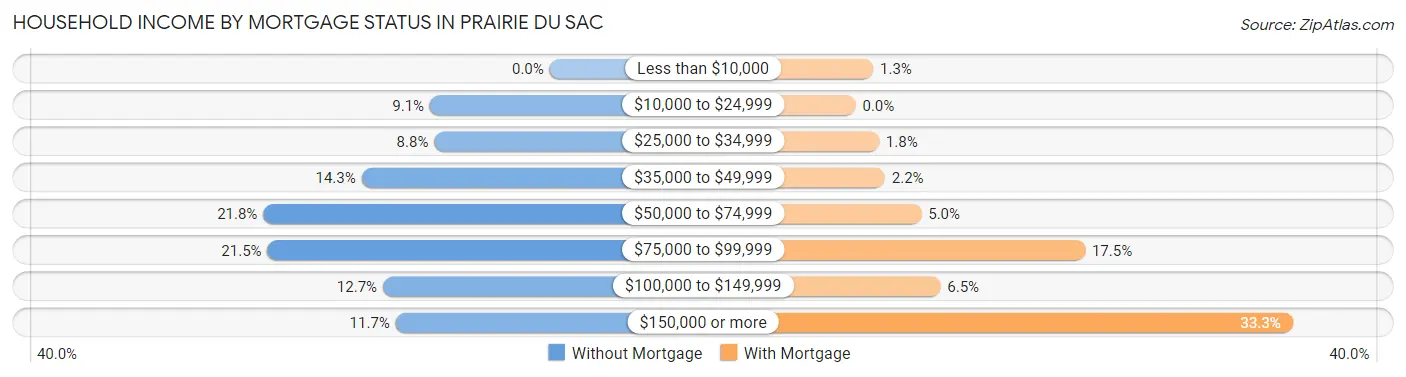
| Household Income | Without Mortgage | With Mortgage |
| Less than $10,000 | 0 (0.0%) | 12 (1.3%) |
| $10,000 to $24,999 | 28 (9.1%) | 0 (0.0%) |
| $25,000 to $34,999 | 27 (8.8%) | 16 (1.8%) |
| $35,000 to $49,999 | 44 (14.3%) | 20 (2.2%) |
| $50,000 to $74,999 | 67 (21.8%) | 45 (5.0%) |
| $75,000 to $99,999 | 66 (21.5%) | 157 (17.5%) |
| $100,000 to $149,999 | 39 (12.7%) | 58 (6.5%) |
| $150,000 or more | 36 (11.7%) | 299 (33.3%) |
| Total | 307 (100.0%) | 898 (100.0%) |
Property Value to Household Income Ratio in Prairie Du Sac
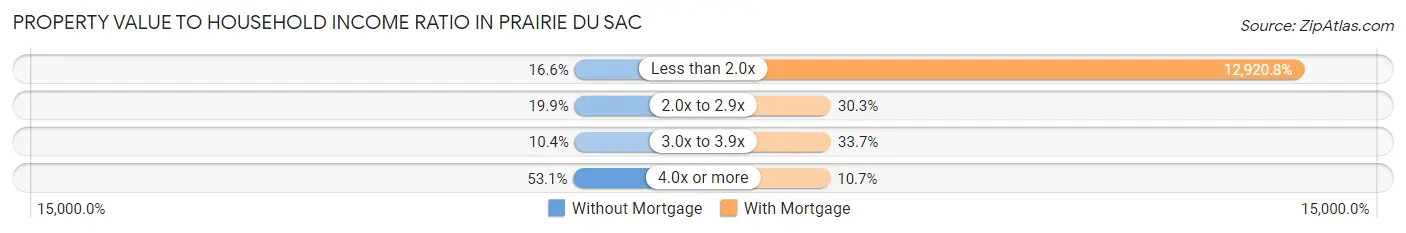
| Value-to-Income Ratio | Without Mortgage | With Mortgage |
| Less than 2.0x | 51 (16.6%) | 116,029 (12,920.8%) |
| 2.0x to 2.9x | 61 (19.9%) | 272 (30.3%) |
| 3.0x to 3.9x | 32 (10.4%) | 303 (33.7%) |
| 4.0x or more | 163 (53.1%) | 96 (10.7%) |
| Total | 307 (100.0%) | 898 (100.0%) |
Real Estate Taxes by Mortgage Status in Prairie Du Sac
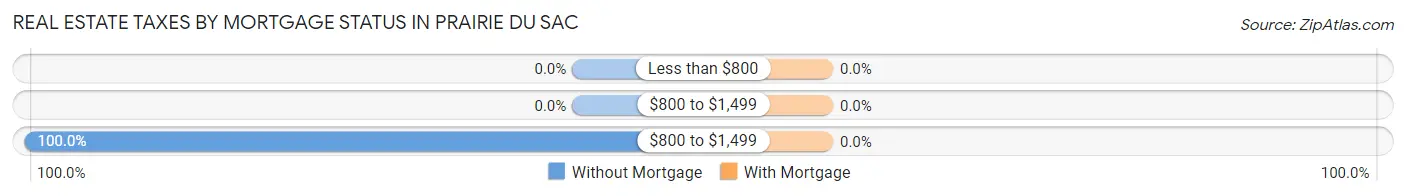
| Property Taxes | Without Mortgage | With Mortgage |
| Less than $800 | 0 (0.0%) | 0 (0.0%) |
| $800 to $1,499 | 0 (0.0%) | 0 (0.0%) |
| $800 to $1,499 | 307 (100.0%) | 0 (0.0%) |
| Total | 307 (100.0%) | 898 (100.0%) |
Health & Disability in Prairie Du Sac
Health Insurance Coverage by Age in Prairie Du Sac
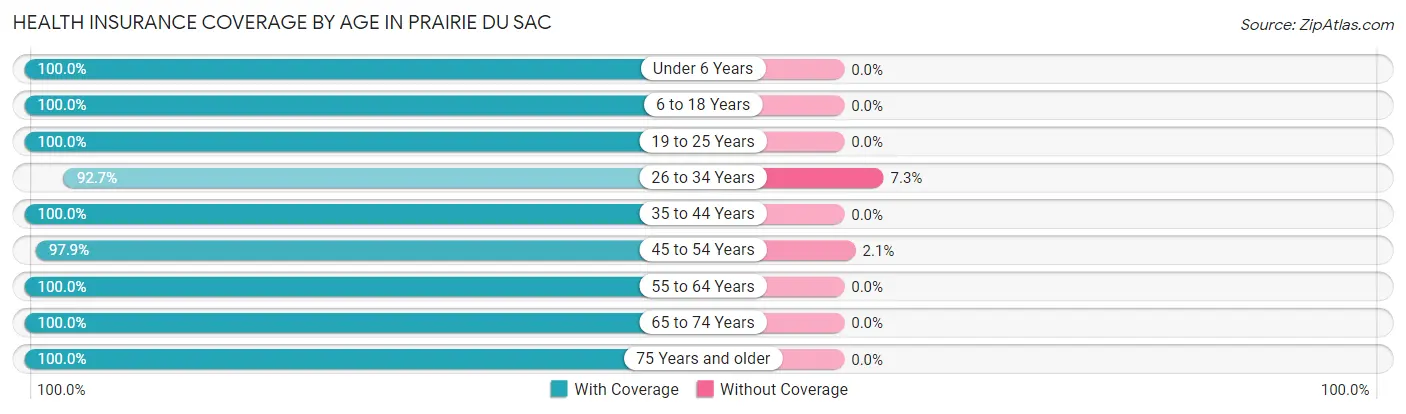
| Age Bracket | With Coverage | Without Coverage |
| Under 6 Years | 465 (100.0%) | 0 (0.0%) |
| 6 to 18 Years | 652 (100.0%) | 0 (0.0%) |
| 19 to 25 Years | 181 (100.0%) | 0 (0.0%) |
| 26 to 34 Years | 683 (92.7%) | 54 (7.3%) |
| 35 to 44 Years | 505 (100.0%) | 0 (0.0%) |
| 45 to 54 Years | 604 (97.9%) | 13 (2.1%) |
| 55 to 64 Years | 457 (100.0%) | 0 (0.0%) |
| 65 to 74 Years | 451 (100.0%) | 0 (0.0%) |
| 75 Years and older | 327 (100.0%) | 0 (0.0%) |
| Total | 4,325 (98.5%) | 67 (1.5%) |
Health Insurance Coverage by Citizenship Status in Prairie Du Sac
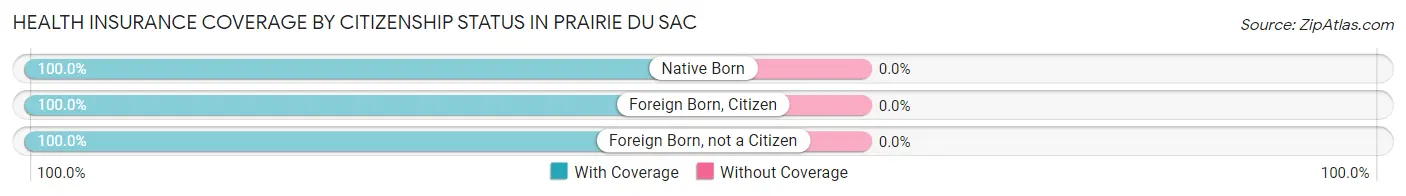
| Citizenship Status | With Coverage | Without Coverage |
| Native Born | 465 (100.0%) | 0 (0.0%) |
| Foreign Born, Citizen | 652 (100.0%) | 0 (0.0%) |
| Foreign Born, not a Citizen | 181 (100.0%) | 0 (0.0%) |
Health Insurance Coverage by Household Income in Prairie Du Sac
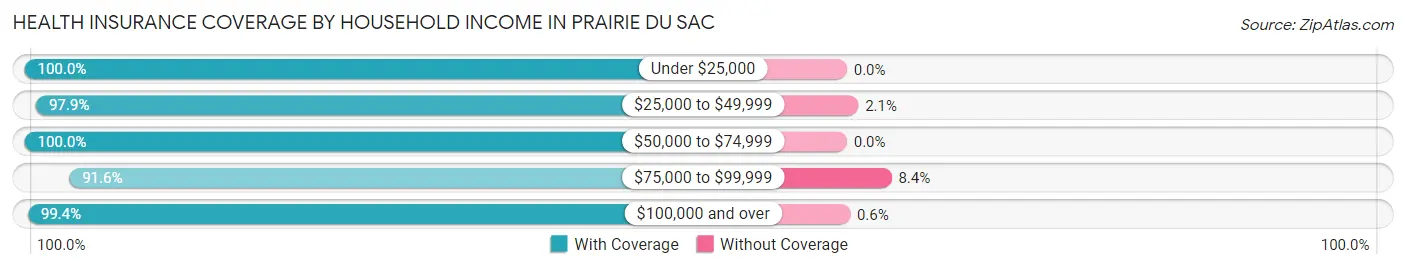
| Household Income | With Coverage | Without Coverage |
| Under $25,000 | 277 (100.0%) | 0 (0.0%) |
| $25,000 to $49,999 | 595 (97.9%) | 13 (2.1%) |
| $50,000 to $74,999 | 674 (100.0%) | 0 (0.0%) |
| $75,000 to $99,999 | 438 (91.6%) | 40 (8.4%) |
| $100,000 and over | 2,329 (99.4%) | 14 (0.6%) |
Public vs Private Health Insurance Coverage by Age in Prairie Du Sac
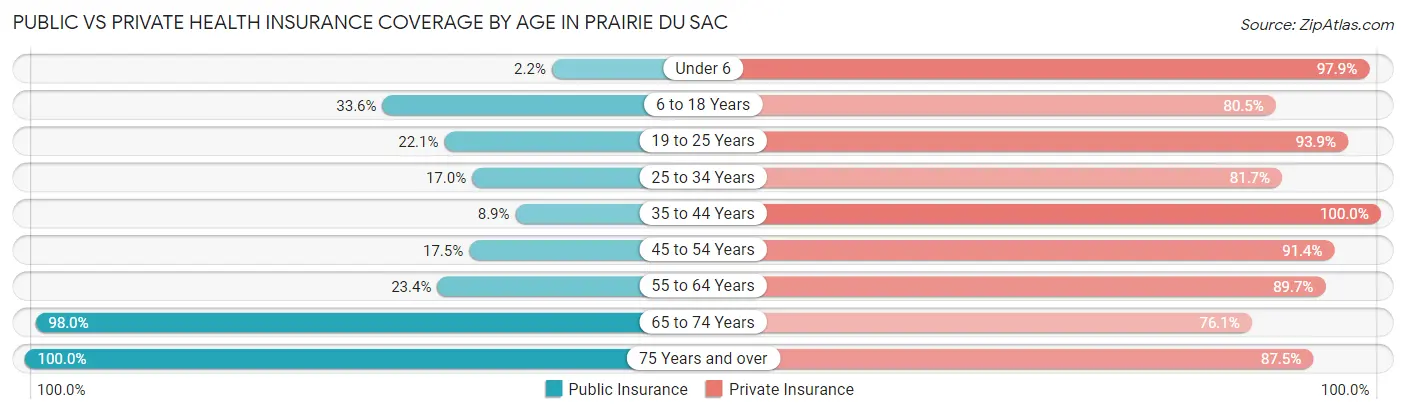
| Age Bracket | Public Insurance | Private Insurance |
| Under 6 | 10 (2.1%) | 455 (97.9%) |
| 6 to 18 Years | 219 (33.6%) | 525 (80.5%) |
| 19 to 25 Years | 40 (22.1%) | 170 (93.9%) |
| 25 to 34 Years | 125 (17.0%) | 602 (81.7%) |
| 35 to 44 Years | 45 (8.9%) | 505 (100.0%) |
| 45 to 54 Years | 108 (17.5%) | 564 (91.4%) |
| 55 to 64 Years | 107 (23.4%) | 410 (89.7%) |
| 65 to 74 Years | 442 (98.0%) | 343 (76.0%) |
| 75 Years and over | 327 (100.0%) | 286 (87.5%) |
| Total | 1,423 (32.4%) | 3,860 (87.9%) |
Disability Status by Sex by Age in Prairie Du Sac
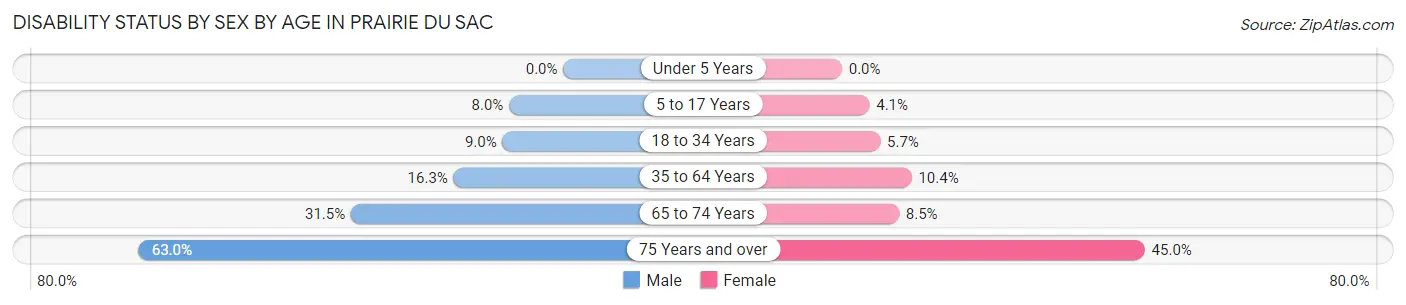
| Age Bracket | Male | Female |
| Under 5 Years | 0 (0.0%) | 0 (0.0%) |
| 5 to 17 Years | 25 (8.0%) | 16 (4.1%) |
| 18 to 34 Years | 40 (9.0%) | 28 (5.7%) |
| 35 to 64 Years | 136 (16.3%) | 77 (10.3%) |
| 65 to 74 Years | 64 (31.5%) | 21 (8.5%) |
| 75 Years and over | 87 (63.0%) | 85 (45.0%) |
Disability Class by Sex by Age in Prairie Du Sac
Disability Class: Hearing Difficulty
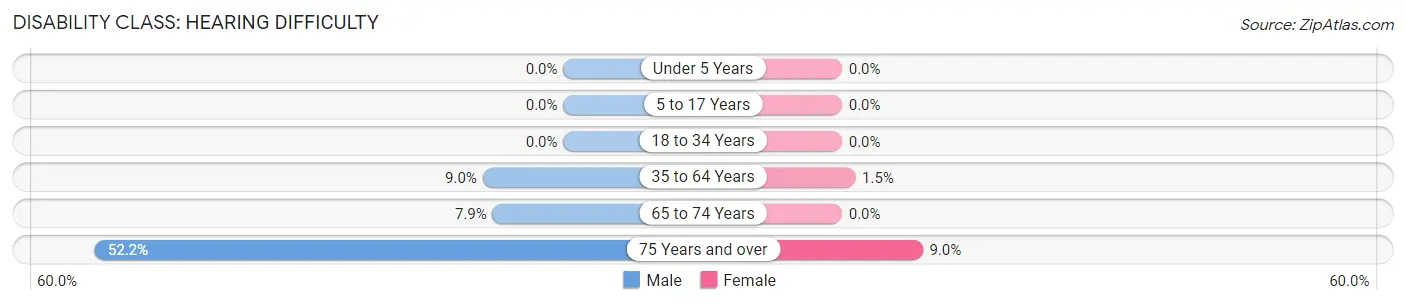
| Age Bracket | Male | Female |
| Under 5 Years | 0 (0.0%) | 0 (0.0%) |
| 5 to 17 Years | 0 (0.0%) | 0 (0.0%) |
| 18 to 34 Years | 0 (0.0%) | 0 (0.0%) |
| 35 to 64 Years | 75 (9.0%) | 11 (1.5%) |
| 65 to 74 Years | 16 (7.9%) | 0 (0.0%) |
| 75 Years and over | 72 (52.2%) | 17 (9.0%) |
Disability Class: Vision Difficulty
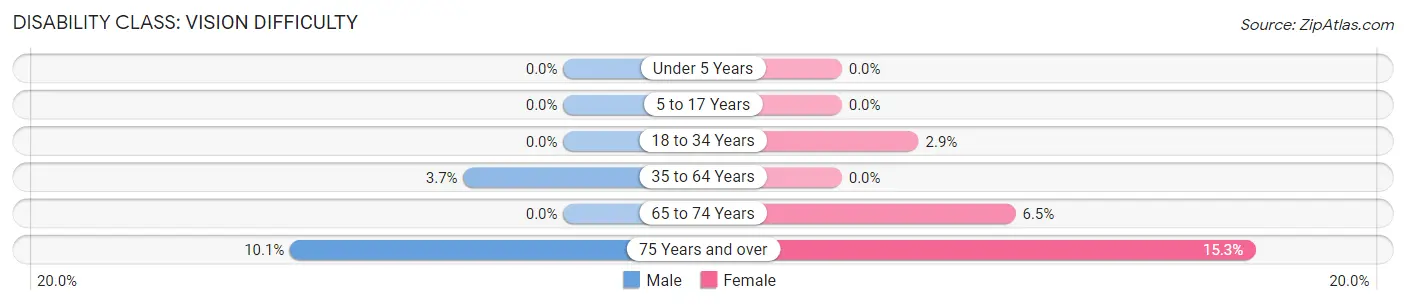
| Age Bracket | Male | Female |
| Under 5 Years | 0 (0.0%) | 0 (0.0%) |
| 5 to 17 Years | 0 (0.0%) | 0 (0.0%) |
| 18 to 34 Years | 0 (0.0%) | 14 (2.9%) |
| 35 to 64 Years | 31 (3.7%) | 0 (0.0%) |
| 65 to 74 Years | 0 (0.0%) | 16 (6.5%) |
| 75 Years and over | 14 (10.1%) | 29 (15.3%) |
Disability Class: Cognitive Difficulty
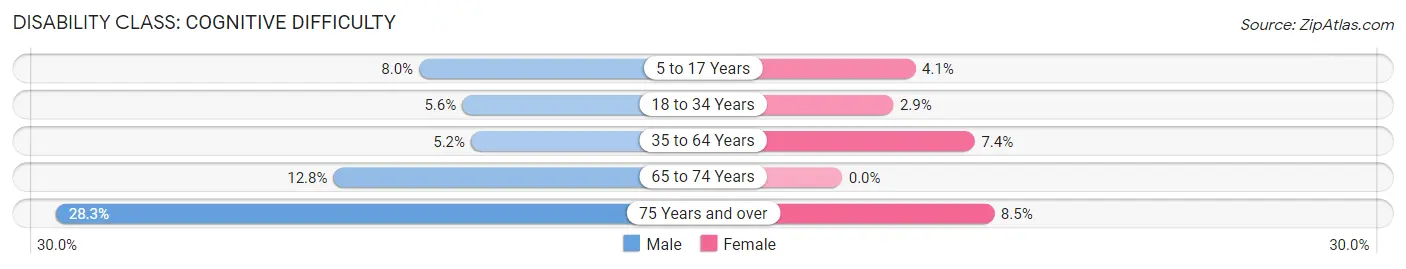
| Age Bracket | Male | Female |
| 5 to 17 Years | 25 (8.0%) | 16 (4.1%) |
| 18 to 34 Years | 25 (5.6%) | 14 (2.9%) |
| 35 to 64 Years | 43 (5.1%) | 55 (7.4%) |
| 65 to 74 Years | 26 (12.8%) | 0 (0.0%) |
| 75 Years and over | 39 (28.3%) | 16 (8.5%) |
Disability Class: Ambulatory Difficulty
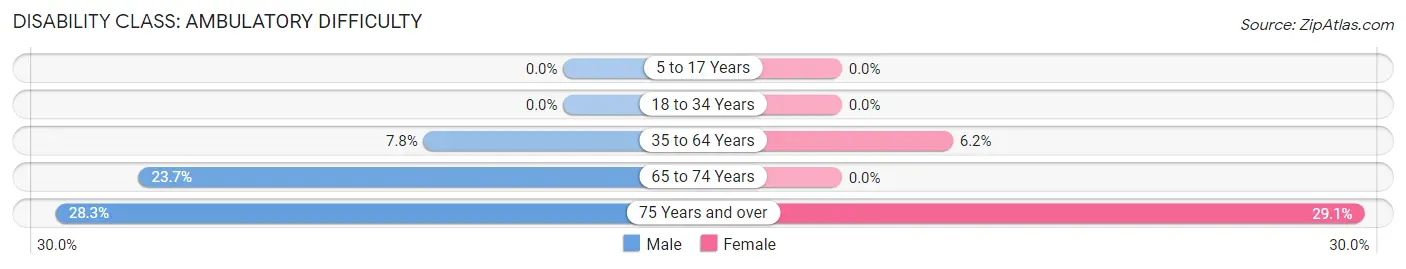
| Age Bracket | Male | Female |
| 5 to 17 Years | 0 (0.0%) | 0 (0.0%) |
| 18 to 34 Years | 0 (0.0%) | 0 (0.0%) |
| 35 to 64 Years | 65 (7.8%) | 46 (6.2%) |
| 65 to 74 Years | 48 (23.6%) | 0 (0.0%) |
| 75 Years and over | 39 (28.3%) | 55 (29.1%) |
Disability Class: Self-Care Difficulty
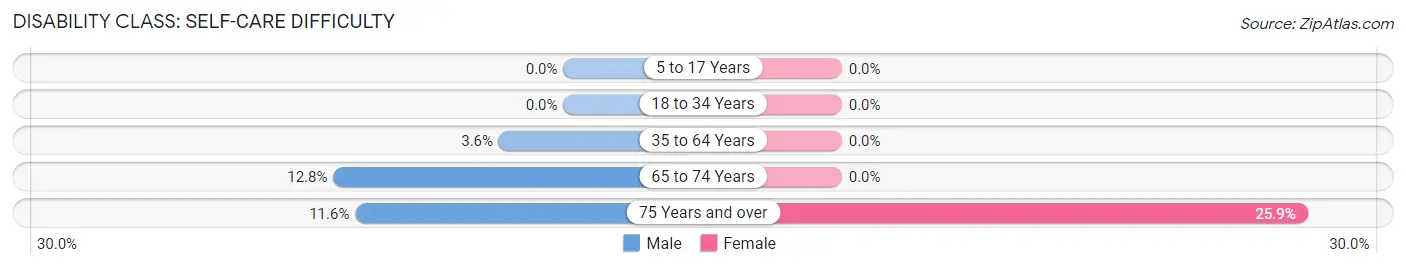
| Age Bracket | Male | Female |
| 5 to 17 Years | 0 (0.0%) | 0 (0.0%) |
| 18 to 34 Years | 0 (0.0%) | 0 (0.0%) |
| 35 to 64 Years | 30 (3.6%) | 0 (0.0%) |
| 65 to 74 Years | 26 (12.8%) | 0 (0.0%) |
| 75 Years and over | 16 (11.6%) | 49 (25.9%) |
Technology Access in Prairie Du Sac
Computing Device Access in Prairie Du Sac
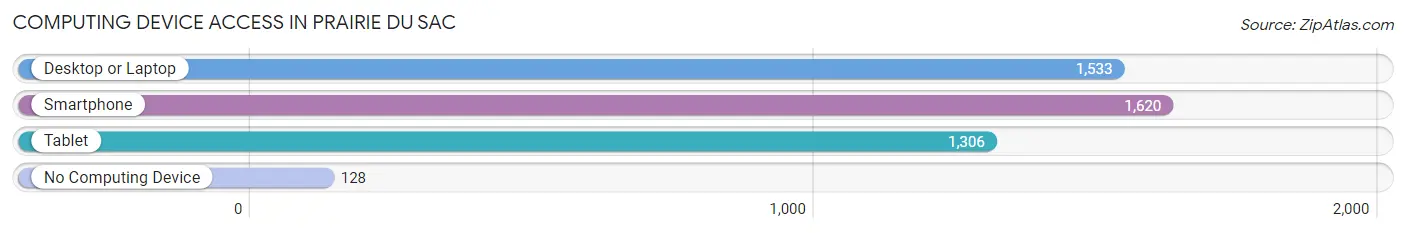
| Device Type | # Households | % Households |
| Desktop or Laptop | 1,533 | 82.4% |
| Smartphone | 1,620 | 87.1% |
| Tablet | 1,306 | 70.2% |
| No Computing Device | 128 | 6.9% |
| Total | 1,860 | 100.0% |
Internet Access in Prairie Du Sac
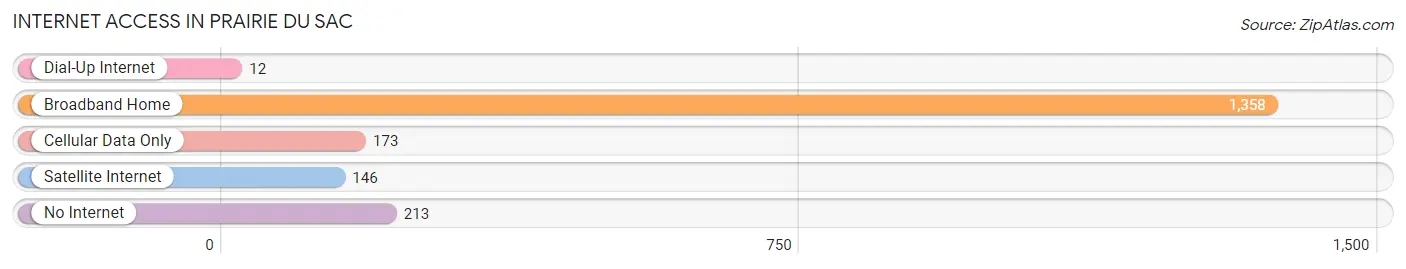
| Internet Type | # Households | % Households |
| Dial-Up Internet | 12 | 0.6% |
| Broadband Home | 1,358 | 73.0% |
| Cellular Data Only | 173 | 9.3% |
| Satellite Internet | 146 | 7.9% |
| No Internet | 213 | 11.5% |
| Total | 1,860 | 100.0% |
Prairie Du Sac Summary
Prairie Du Sac, Wisconsin is a small village located in Sauk County, Wisconsin. It is situated on the Wisconsin River, just south of the city of Madison. The village has a population of approximately 2,500 people and is part of the Madison Metropolitan Statistical Area.
History
Prairie Du Sac was first settled in 1845 by a group of French-Canadian immigrants. The village was originally known as “Prairie du Sac”, which translates to “Prairie of the Sac” in French. The name was chosen to honor the Sauk Native American tribe, who had inhabited the area for centuries prior to the arrival of the French-Canadian settlers.
The village was officially incorporated in 1856 and was home to a variety of industries, including a flour mill, a sawmill, and a woolen mill. The village also had a number of stores, a post office, and a school.
In the late 19th century, the village experienced a period of growth and prosperity. The Sauk County Courthouse was built in Prairie Du Sac in 1891, and the village was connected to the rest of the state by the Wisconsin Central Railroad in 1895.
Geography
Prairie Du Sac is located in Sauk County, Wisconsin, approximately 25 miles north of Madison. The village is situated on the Wisconsin River, and is surrounded by rolling hills and farmland. The village is located in the Central Plain region of Wisconsin, and has a humid continental climate.
The village covers an area of 1.3 square miles, and has a population density of 1,890 people per square mile. The village is home to a variety of parks and recreational areas, including the Sauk County Park, the Prairie Du Sac Dam, and the Sauk Prairie Recreation Area.
Economy
Prairie Du Sac is home to a variety of businesses and industries. The village is home to a number of manufacturing companies, including a cheese factory, a paper mill, and a plastics factory. The village is also home to a number of retail stores, restaurants, and other businesses.
The village is home to a number of educational institutions, including the University of Wisconsin-Platteville, the University of Wisconsin-Baraboo/Sauk County, and the Sauk County Technical College. The village is also home to a number of healthcare facilities, including the Sauk Prairie Memorial Hospital.
Demographics
As of the 2010 census, the population of Prairie Du Sac was 2,521. The racial makeup of the village was 97.2% White, 0.7% African American, 0.3% Native American, 0.4% Asian, 0.1% Pacific Islander, 0.3% from other races, and 1.0% from two or more races. Hispanic or Latino of any race were 1.3% of the population.
The median household income in Prairie Du Sac was $50,972, and the median family income was $60,972. The per capita income for the village was $25,972. About 5.2% of families and 7.2% of the population were below the poverty line, including 8.3% of those under age 18 and 5.2% of those age 65 or over.
Common Questions
What is the Total Population of Prairie Du Sac?
Total Population of Prairie Du Sac is 4,392.
What is the Total Male Population of Prairie Du Sac?
Total Male Population of Prairie Du Sac is 2,196.
What is the Total Female Population of Prairie Du Sac?
Total Female Population of Prairie Du Sac is 2,196.
What is the Ratio of Males per 100 Females in Prairie Du Sac?
There are 100.00 Males per 100 Females in Prairie Du Sac.
What is the Ratio of Females per 100 Males in Prairie Du Sac?
There are 100.00 Females per 100 Males in Prairie Du Sac.
What is the Median Population Age in Prairie Du Sac?
Median Population Age in Prairie Du Sac is 35.9 Years.
What is the Average Family Size in Prairie Du Sac
Average Family Size in Prairie Du Sac is 3.0 People.
What is the Average Household Size in Prairie Du Sac
Average Household Size in Prairie Du Sac is 2.4 People.
What is Per Capita Income in Prairie Du Sac?
Per Capita income in Prairie Du Sac is $41,027.
What is the Median Family Income in Prairie Du Sac?
Median Family Income in Prairie Du Sac is $104,734.
What is the Median Household income in Prairie Du Sac?
Median Household Income in Prairie Du Sac is $81,818.
What is Income or Wage Gap in Prairie Du Sac?
Income or Wage Gap in Prairie Du Sac is 34.6%.
Women in Prairie Du Sac earn 65.4 cents for every dollar earned by a man.
What is Inequality or Gini Index in Prairie Du Sac?
Inequality or Gini Index in Prairie Du Sac is 0.37.
How Large is the Labor Force in Prairie Du Sac?
There are 2,476 People in the Labor Forcein in Prairie Du Sac.
What is the Percentage of People in the Labor Force in Prairie Du Sac?
72.6% of People are in the Labor Force in Prairie Du Sac.
What is the Unemployment Rate in Prairie Du Sac?
Unemployment Rate in Prairie Du Sac is 1.4%.