New Odanah, WI
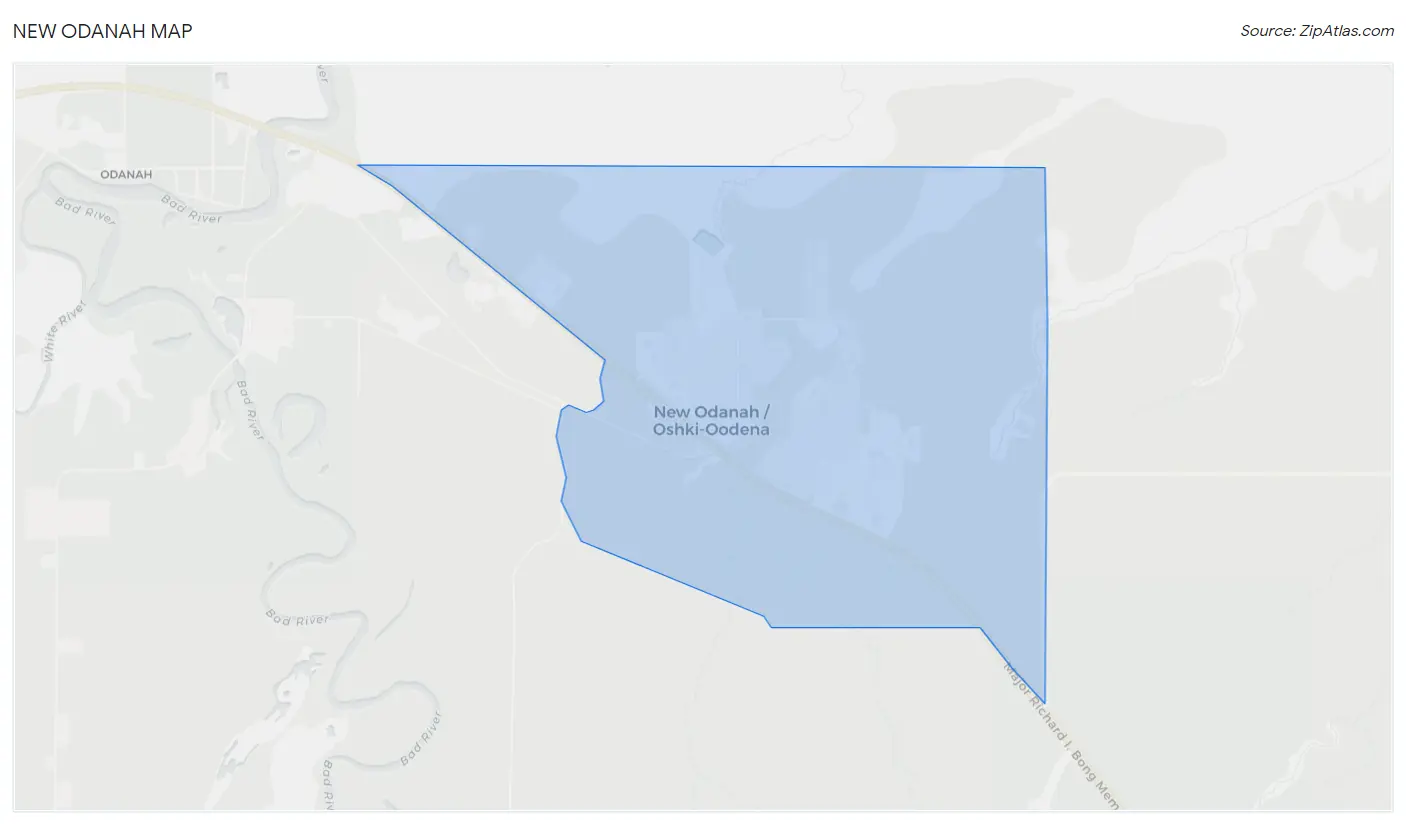
New Odanah Map
New Odanah Overview
362
TOTAL POPULATION
178
MALE POPULATION
184
FEMALE POPULATION
96.74
MALES / 100 FEMALES
103.37
FEMALES / 100 MALES
43.6
MEDIAN AGE
2.9
AVG FAMILY SIZE
2.7
AVG HOUSEHOLD SIZE
$25,395
PER CAPITA INCOME
$68,571
AVG FAMILY INCOME
$68,214
AVG HOUSEHOLD INCOME
9.4%
WAGE / INCOME GAP [ % ]
90.6¢/ $1
WAGE / INCOME GAP [ $ ]
0.35
INEQUALITY / GINI INDEX
207
LABOR FORCE [ PEOPLE ]
72.6%
PERCENT IN LABOR FORCE
13.0%
UNEMPLOYMENT RATE
Race in New Odanah
The most populous races in New Odanah are Native / Alaskan (258 | 71.3%), Two or more Races (51 | 14.1%), and Black / African American (38 | 10.5%).
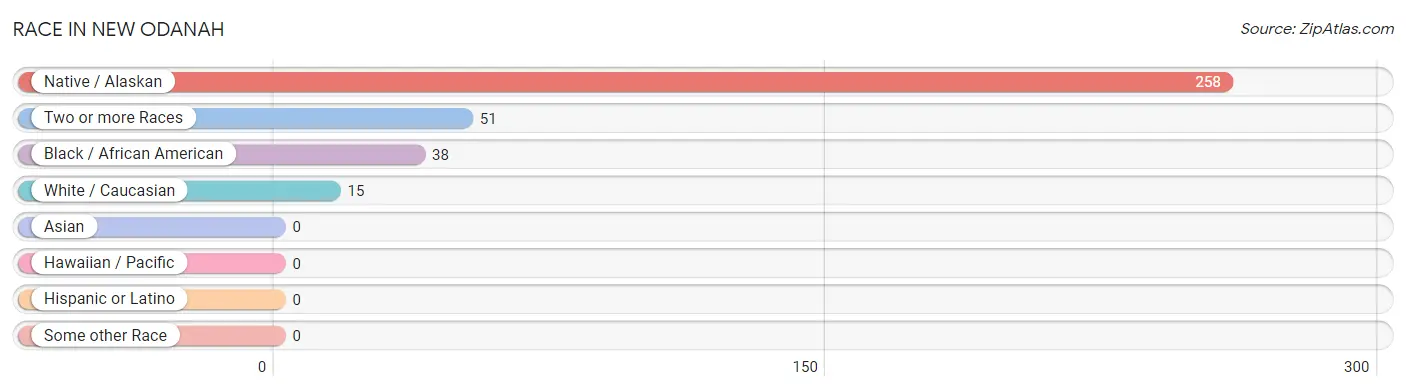
| Race | # Population | % Population |
| Asian | 0 | 0.0% |
| Black / African American | 38 | 10.5% |
| Hawaiian / Pacific | 0 | 0.0% |
| Hispanic or Latino | 0 | 0.0% |
| Native / Alaskan | 258 | 71.3% |
| White / Caucasian | 15 | 4.1% |
| Two or more Races | 51 | 14.1% |
| Some other Race | 0 | 0.0% |
| Total | 362 | 100.0% |
Ancestry in New Odanah
The most populous ancestries reported in New Odanah are Chippewa (281 | 77.6%), Swedish (13 | 3.6%), French (11 | 3.0%), German (11 | 3.0%), and French Canadian (7 | 1.9%), together accounting for 89.2% of all New Odanah residents.
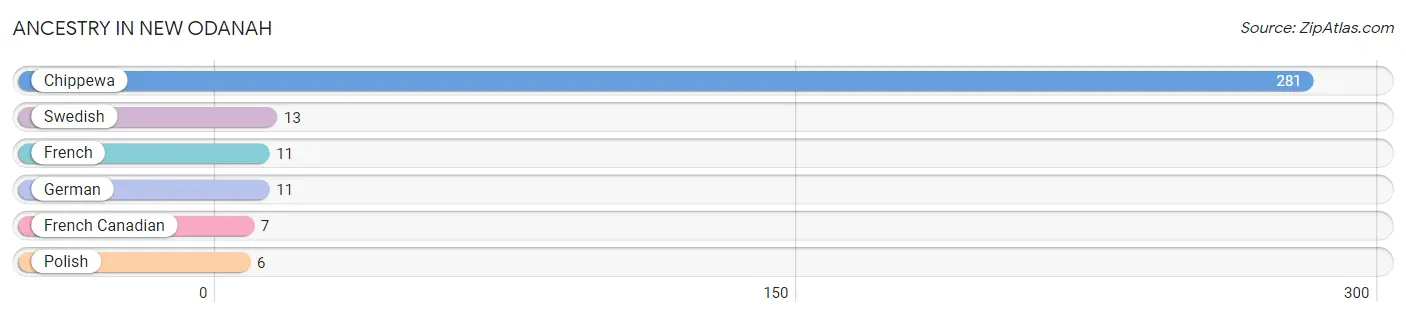
| Ancestry | # Population | % Population |
| Chippewa | 281 | 77.6% |
| French | 11 | 3.0% |
| French Canadian | 7 | 1.9% |
| German | 11 | 3.0% |
| Polish | 6 | 1.7% |
| Swedish | 13 | 3.6% | View All 6 Rows |
Immigrants in New Odanah

| Immigration Origin | # Population | % Population | View All 0 Rows |
Sex and Age in New Odanah
Sex and Age in New Odanah
The most populous age groups in New Odanah are 60 to 64 Years (20 | 11.2%) for men and 65 to 69 Years (27 | 14.7%) for women.
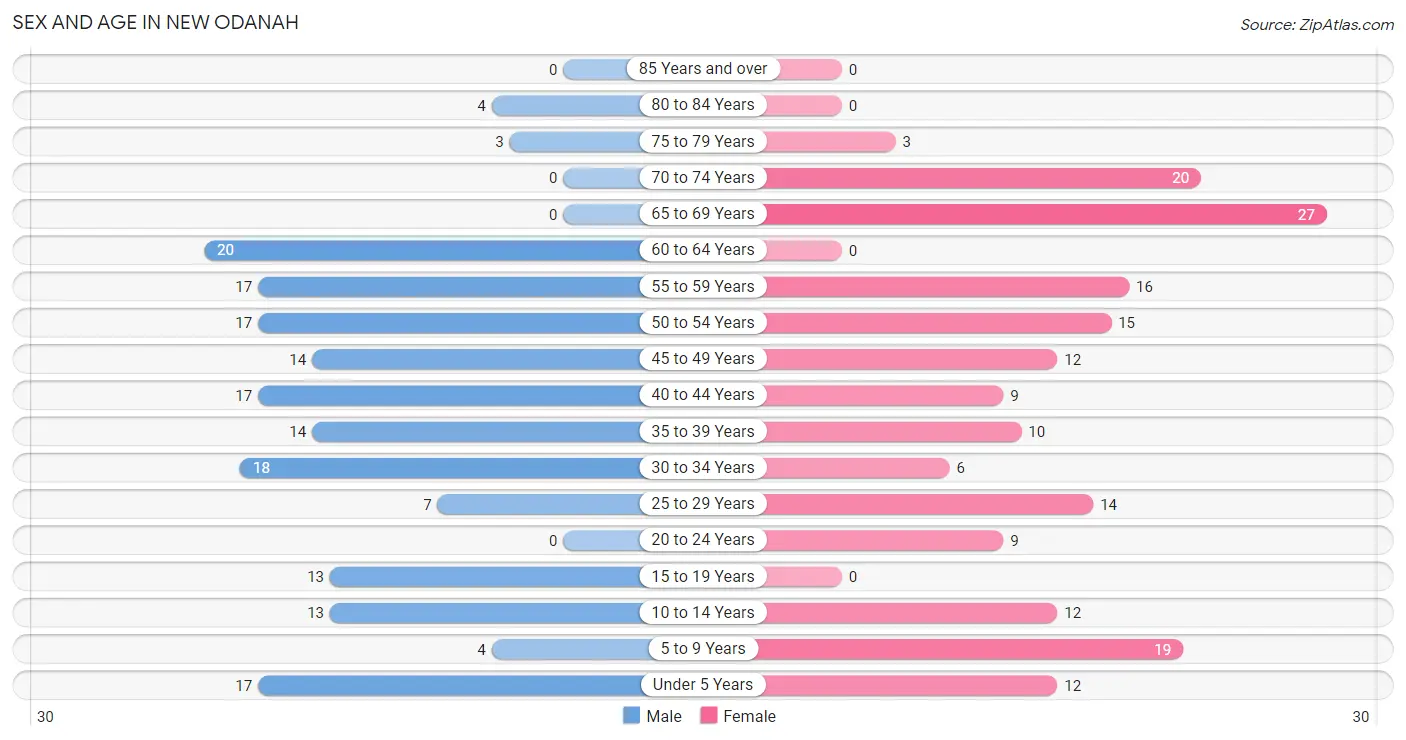
| Age Bracket | Male | Female |
| Under 5 Years | 17 (9.6%) | 12 (6.5%) |
| 5 to 9 Years | 4 (2.2%) | 19 (10.3%) |
| 10 to 14 Years | 13 (7.3%) | 12 (6.5%) |
| 15 to 19 Years | 13 (7.3%) | 0 (0.0%) |
| 20 to 24 Years | 0 (0.0%) | 9 (4.9%) |
| 25 to 29 Years | 7 (3.9%) | 14 (7.6%) |
| 30 to 34 Years | 18 (10.1%) | 6 (3.3%) |
| 35 to 39 Years | 14 (7.9%) | 10 (5.4%) |
| 40 to 44 Years | 17 (9.6%) | 9 (4.9%) |
| 45 to 49 Years | 14 (7.9%) | 12 (6.5%) |
| 50 to 54 Years | 17 (9.6%) | 15 (8.2%) |
| 55 to 59 Years | 17 (9.6%) | 16 (8.7%) |
| 60 to 64 Years | 20 (11.2%) | 0 (0.0%) |
| 65 to 69 Years | 0 (0.0%) | 27 (14.7%) |
| 70 to 74 Years | 0 (0.0%) | 20 (10.9%) |
| 75 to 79 Years | 3 (1.7%) | 3 (1.6%) |
| 80 to 84 Years | 4 (2.2%) | 0 (0.0%) |
| 85 Years and over | 0 (0.0%) | 0 (0.0%) |
| Total | 178 (100.0%) | 184 (100.0%) |
Families and Households in New Odanah
Median Family Size in New Odanah
The median family size in New Odanah is 2.91 persons per family, with single female/mother families (46 | 44.2%) accounting for the largest median family size of 3.67 persons per family. On the other hand, single male/father families (12 | 11.5%) represent the smallest median family size with 1.92 persons per family.
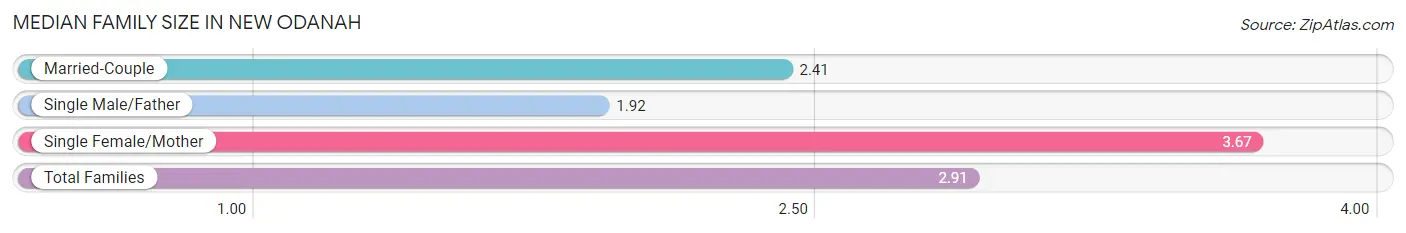
| Family Type | # Families | Family Size |
| Married-Couple | 46 (44.2%) | 2.41 |
| Single Male/Father | 12 (11.5%) | 1.92 |
| Single Female/Mother | 46 (44.2%) | 3.67 |
| Total Families | 104 (100.0%) | 2.91 |
Median Household Size in New Odanah
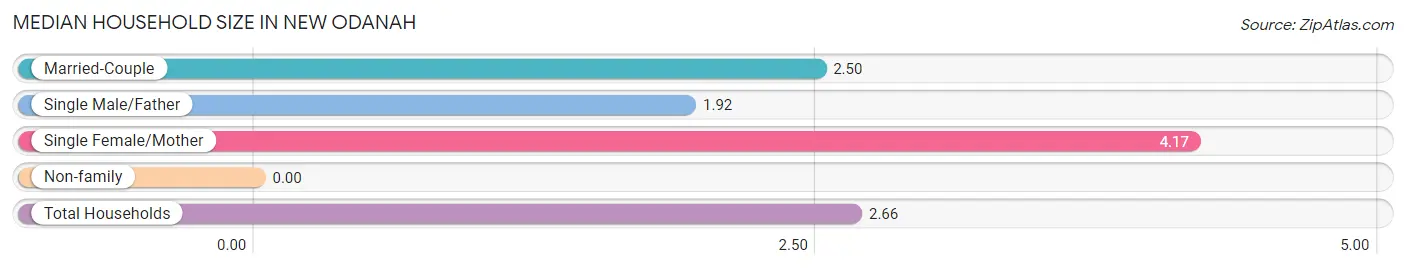
| Household Type | # Households | Household Size |
| Married-Couple | 46 (33.8%) | 2.50 |
| Single Male/Father | 12 (8.8%) | 1.92 |
| Single Female/Mother | 46 (33.8%) | 4.17 |
| Non-family | 32 (23.5%) | - |
| Total Households | 136 (100.0%) | 2.66 |
Household Size by Marriage Status in New Odanah
Out of a total of 136 households in New Odanah, 104 (76.5%) are family households, while 32 (23.5%) are nonfamily households. The most numerous type of family households are 2-person households, comprising 47, and the most common type of nonfamily households are 1-person households, comprising 32.
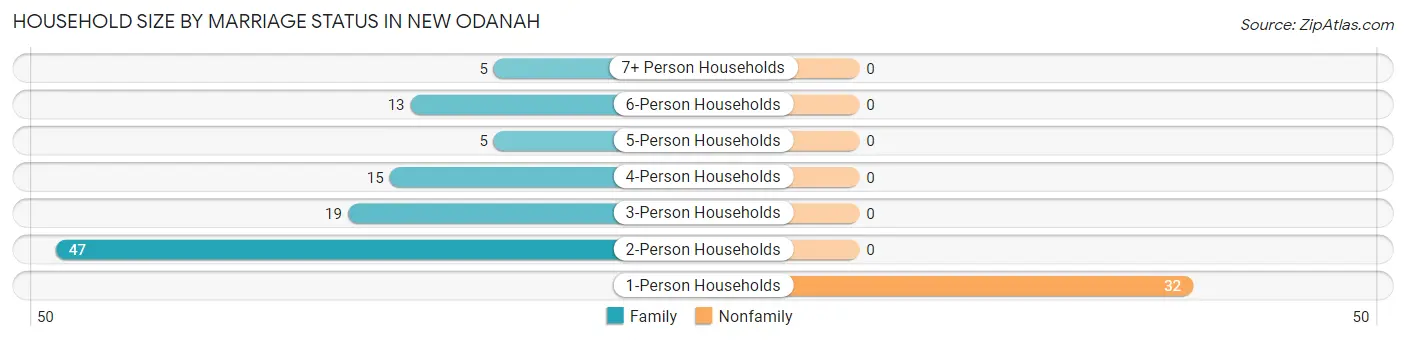
| Household Size | Family Households | Nonfamily Households |
| 1-Person Households | - | 32 (23.5%) |
| 2-Person Households | 47 (34.6%) | 0 (0.0%) |
| 3-Person Households | 19 (14.0%) | 0 (0.0%) |
| 4-Person Households | 15 (11.0%) | 0 (0.0%) |
| 5-Person Households | 5 (3.7%) | 0 (0.0%) |
| 6-Person Households | 13 (9.6%) | 0 (0.0%) |
| 7+ Person Households | 5 (3.7%) | 0 (0.0%) |
| Total | 104 (76.5%) | 32 (23.5%) |
Female Fertility in New Odanah
Fertility by Age in New Odanah
Average fertility rate in New Odanah is 143.0 births per 1,000 women. Women in the age bracket of 35 to 50 years have the highest fertility rate with 244.0 births per 1,000 women. Women in the age bracket of 35 to 50 years acount for 100.0% of all women with births.
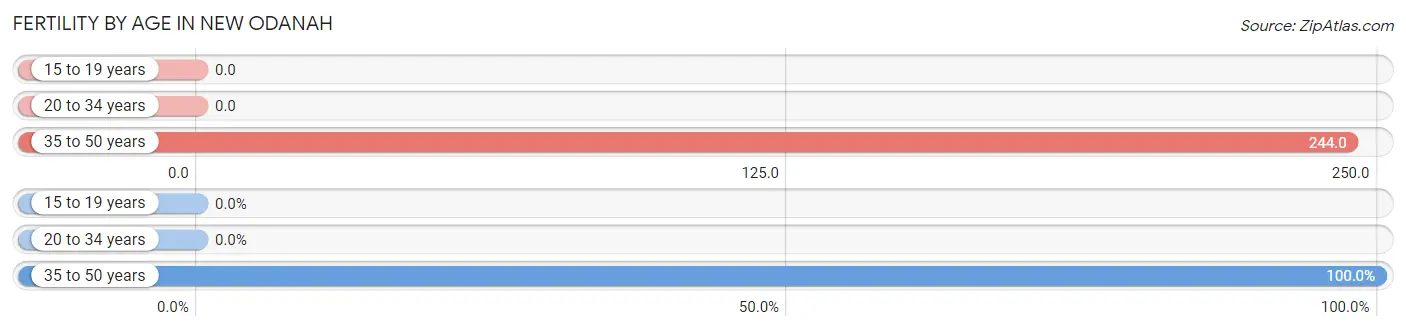
| Age Bracket | Women with Births | Births / 1,000 Women |
| 15 to 19 years | 0 (0.0%) | 0.0 |
| 20 to 34 years | 0 (0.0%) | 0.0 |
| 35 to 50 years | 10 (100.0%) | 244.0 |
| Total | 10 (100.0%) | 143.0 |
Fertility by Age by Marriage Status in New Odanah
| Age Bracket | Married | Unmarried |
| 15 to 19 years | 0 (0.0%) | 0 (0.0%) |
| 20 to 34 years | 0 (0.0%) | 0 (0.0%) |
| 35 to 50 years | 0 (0.0%) | 10 (100.0%) |
| Total | 0 (0.0%) | 10 (100.0%) |
Fertility by Education in New Odanah
| Educational Attainment | Women with Births | Births / 1,000 Women |
| Less than High School | 0 (0.0%) | 0.0 |
| High School Diploma | 5 (50.0%) | 179.0 |
| College or Associate's Degree | 5 (50.0%) | 333.0 |
| Bachelor's Degree | 0 (0.0%) | 0.0 |
| Graduate Degree | 0 (0.0%) | 0.0 |
| Total | 10 (100.0%) | 143.0 |
Fertility by Education by Marriage Status in New Odanah
| Educational Attainment | Married | Unmarried |
| Less than High School | 0 (0.0%) | 0 (0.0%) |
| High School Diploma | 0 (0.0%) | 5 (100.0%) |
| College or Associate's Degree | 0 (0.0%) | 5 (100.0%) |
| Bachelor's Degree | 0 (0.0%) | 0 (0.0%) |
| Graduate Degree | 0 (0.0%) | 0 (0.0%) |
| Total | 0 (0.0%) | 10 (100.0%) |
Income in New Odanah
Income Overview in New Odanah
Per Capita Income in New Odanah is $25,395, while median incomes of families and households are $68,571 and $68,214 respectively.
| Characteristic | Number | Measure |
| Per Capita Income | 362 | $25,395 |
| Median Family Income | 104 | $68,571 |
| Mean Family Income | 104 | $73,090 |
| Median Household Income | 136 | $68,214 |
| Mean Household Income | 136 | $67,484 |
| Income Deficit | 104 | $0 |
| Wage / Income Gap (%) | 362 | 9.40% |
| Wage / Income Gap ($) | 362 | 90.60¢ per $1 |
| Gini / Inequality Index | 362 | 0.35 |
Earnings by Sex in New Odanah
Average Earnings in New Odanah are $29,423, $26,875 for men and $29,663 for women, a difference of 9.4%.
| Sex | Number | Average Earnings |
| Male | 111 (48.7%) | $26,875 |
| Female | 117 (51.3%) | $29,663 |
| Total | 228 (100.0%) | $29,423 |
Earnings by Sex by Income Bracket in New Odanah
The most common earnings brackets in New Odanah are $15,000 to $17,499 for men (14 | 12.6%) and $25,000 to $29,999 for women (26 | 22.2%).
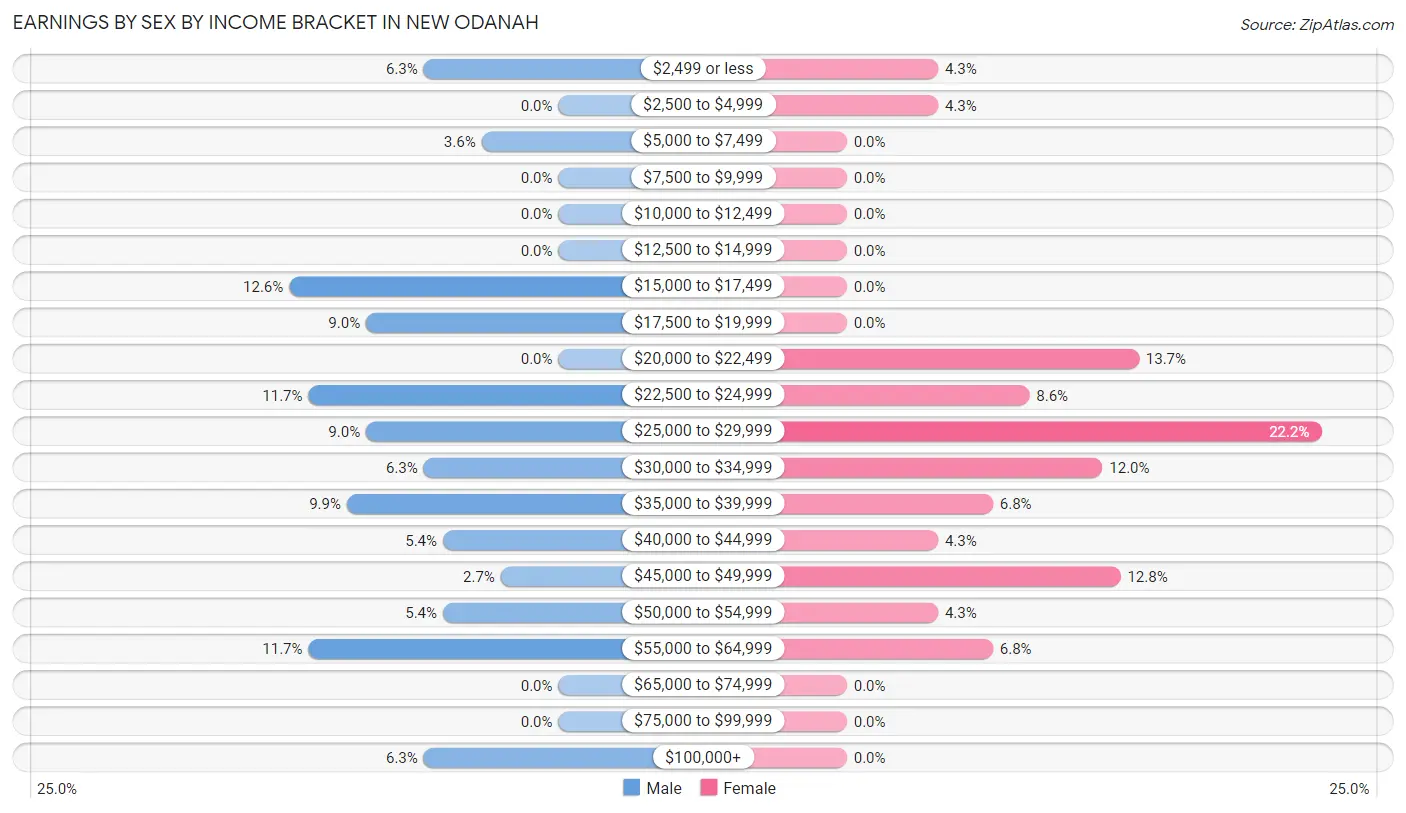
| Income | Male | Female |
| $2,499 or less | 7 (6.3%) | 5 (4.3%) |
| $2,500 to $4,999 | 0 (0.0%) | 5 (4.3%) |
| $5,000 to $7,499 | 4 (3.6%) | 0 (0.0%) |
| $7,500 to $9,999 | 0 (0.0%) | 0 (0.0%) |
| $10,000 to $12,499 | 0 (0.0%) | 0 (0.0%) |
| $12,500 to $14,999 | 0 (0.0%) | 0 (0.0%) |
| $15,000 to $17,499 | 14 (12.6%) | 0 (0.0%) |
| $17,500 to $19,999 | 10 (9.0%) | 0 (0.0%) |
| $20,000 to $22,499 | 0 (0.0%) | 16 (13.7%) |
| $22,500 to $24,999 | 13 (11.7%) | 10 (8.6%) |
| $25,000 to $29,999 | 10 (9.0%) | 26 (22.2%) |
| $30,000 to $34,999 | 7 (6.3%) | 14 (12.0%) |
| $35,000 to $39,999 | 11 (9.9%) | 8 (6.8%) |
| $40,000 to $44,999 | 6 (5.4%) | 5 (4.3%) |
| $45,000 to $49,999 | 3 (2.7%) | 15 (12.8%) |
| $50,000 to $54,999 | 6 (5.4%) | 5 (4.3%) |
| $55,000 to $64,999 | 13 (11.7%) | 8 (6.8%) |
| $65,000 to $74,999 | 0 (0.0%) | 0 (0.0%) |
| $75,000 to $99,999 | 0 (0.0%) | 0 (0.0%) |
| $100,000+ | 7 (6.3%) | 0 (0.0%) |
| Total | 111 (100.0%) | 117 (100.0%) |
Earnings by Sex by Educational Attainment in New Odanah
Average earnings in New Odanah are $30,357 for men and $30,417 for women, a difference of 0.2%. Men with an educational attainment of college or associate's degree enjoy the highest average annual earnings of $41,458, while those with high school diploma education earn the least with $25,208. Women with an educational attainment of bachelor's degree earn the most with the average annual earnings of $44,250, while those with high school diploma education have the smallest earnings of $28,864.
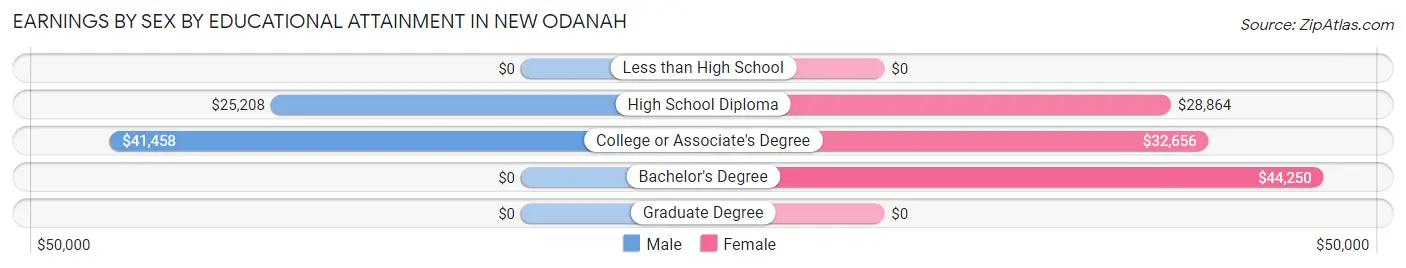
| Educational Attainment | Male Income | Female Income |
| Less than High School | - | - |
| High School Diploma | $25,208 | $28,864 |
| College or Associate's Degree | $41,458 | $32,656 |
| Bachelor's Degree | - | - |
| Graduate Degree | - | - |
| Total | $30,357 | $30,417 |
Family Income in New Odanah
Family Income Brackets in New Odanah
According to the New Odanah family income data, there are 29 families falling into the $50,000 to $74,999 income range, which is the most common income bracket and makes up 27.9% of all families.
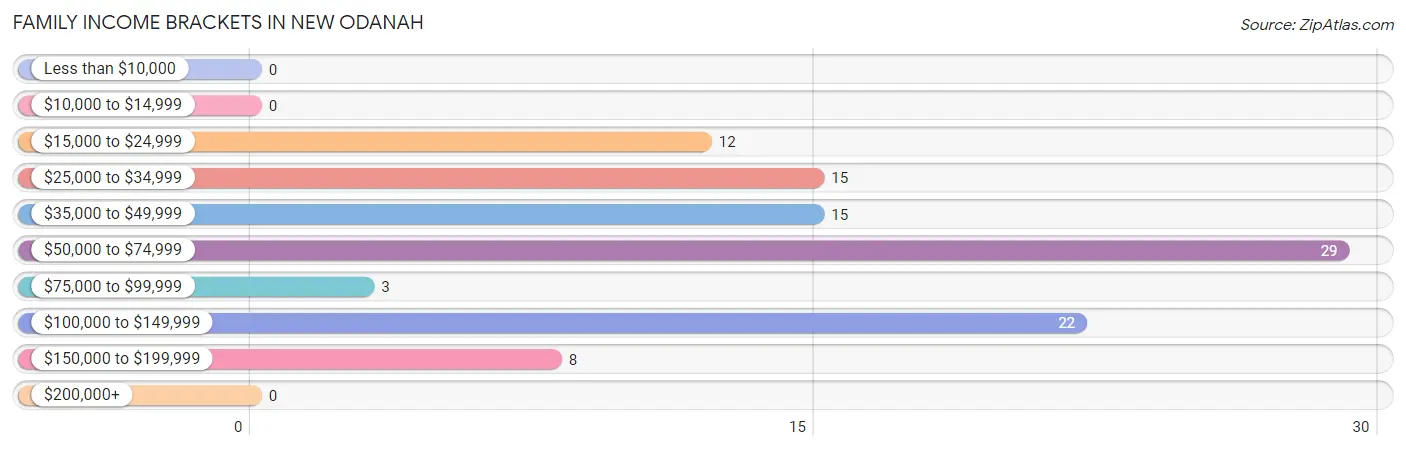
| Income Bracket | # Families | % Families |
| Less than $10,000 | 0 | 0.0% |
| $10,000 to $14,999 | 0 | 0.0% |
| $15,000 to $24,999 | 12 | 11.5% |
| $25,000 to $34,999 | 15 | 14.4% |
| $35,000 to $49,999 | 15 | 14.4% |
| $50,000 to $74,999 | 29 | 27.9% |
| $75,000 to $99,999 | 3 | 2.9% |
| $100,000 to $149,999 | 22 | 21.2% |
| $150,000 to $199,999 | 8 | 7.7% |
| $200,000+ | 0 | 0.0% |
Family Income by Famaliy Size in New Odanah
2-person families (47 | 45.2%) account for the highest median family income in New Odanah with $70,208 per family, while 2-person families (47 | 45.2%) have the highest median income of $35,104 per family member.
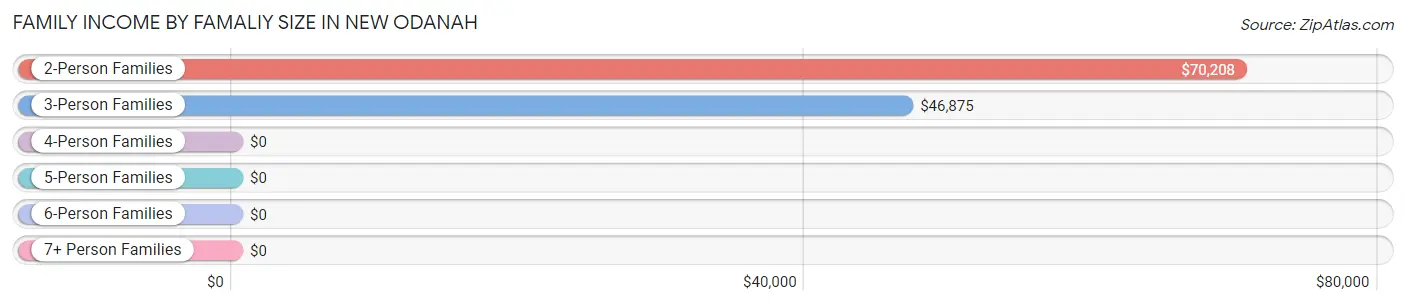
| Income Bracket | # Families | Median Income |
| 2-Person Families | 47 (45.2%) | $70,208 |
| 3-Person Families | 29 (27.9%) | $46,875 |
| 4-Person Families | 16 (15.4%) | $0 |
| 5-Person Families | 7 (6.7%) | $0 |
| 6-Person Families | 0 (0.0%) | $0 |
| 7+ Person Families | 5 (4.8%) | $0 |
| Total | 104 (100.0%) | $68,571 |
Family Income by Number of Earners in New Odanah
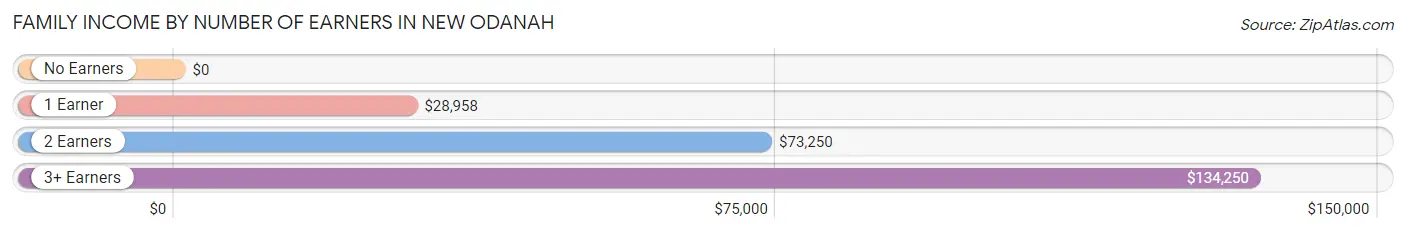
| Number of Earners | # Families | Median Income |
| No Earners | 7 (6.7%) | $0 |
| 1 Earner | 31 (29.8%) | $28,958 |
| 2 Earners | 49 (47.1%) | $73,250 |
| 3+ Earners | 17 (16.4%) | $134,250 |
| Total | 104 (100.0%) | $68,571 |
Household Income in New Odanah
Household Income Brackets in New Odanah
With 43 households falling in the category, the $50,000 to $74,999 income range is the most frequent in New Odanah, accounting for 31.6% of all households.
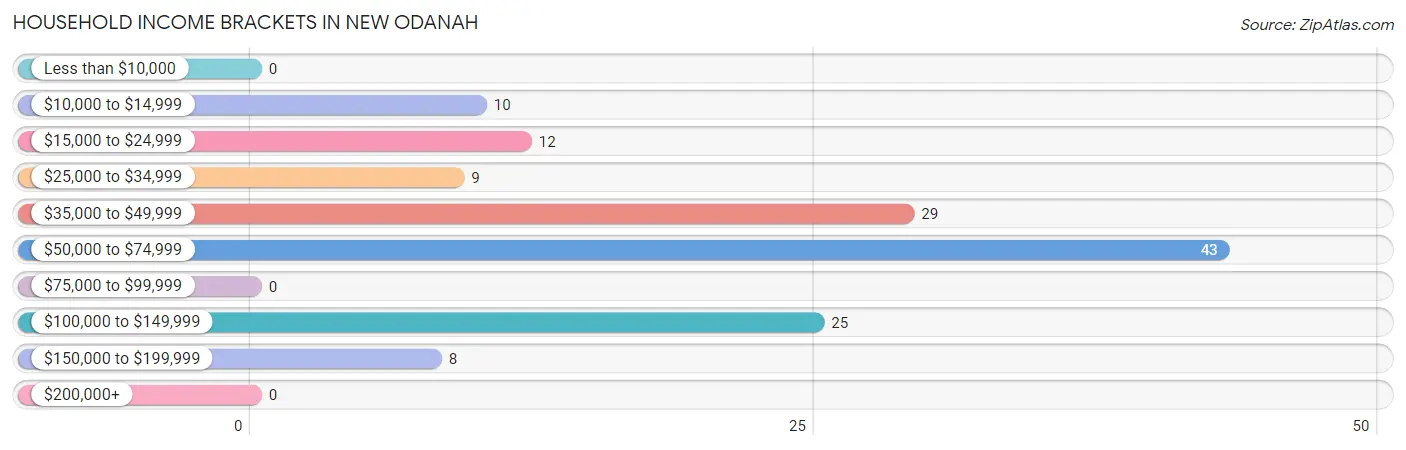
| Income Bracket | # Households | % Households |
| Less than $10,000 | 0 | 0.0% |
| $10,000 to $14,999 | 10 | 7.4% |
| $15,000 to $24,999 | 12 | 8.8% |
| $25,000 to $34,999 | 9 | 6.6% |
| $35,000 to $49,999 | 29 | 21.3% |
| $50,000 to $74,999 | 43 | 31.6% |
| $75,000 to $99,999 | 0 | 0.0% |
| $100,000 to $149,999 | 25 | 18.4% |
| $150,000 to $199,999 | 8 | 5.9% |
| $200,000+ | 0 | 0.0% |
Household Income by Householder Age in New Odanah
The median household income in New Odanah is $68,214, with the highest median household income of $71,250 found in the 45 to 64 years age bracket for the primary householder. A total of 49 households (36.0%) fall into this category.
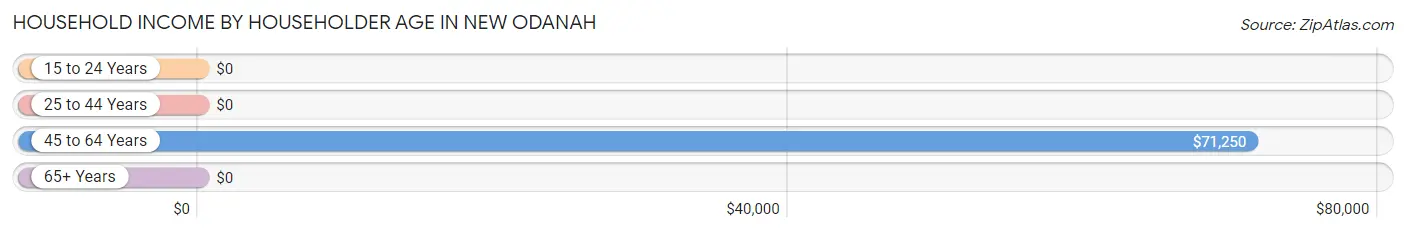
| Income Bracket | # Households | Median Income |
| 15 to 24 Years | 0 (0.0%) | $0 |
| 25 to 44 Years | 34 (25.0%) | $0 |
| 45 to 64 Years | 49 (36.0%) | $71,250 |
| 65+ Years | 53 (39.0%) | $0 |
| Total | 136 (100.0%) | $68,214 |
Poverty in New Odanah
Income Below Poverty by Sex and Age in New Odanah
With 20.7% poverty level for males and 25.4% for females among the residents of New Odanah, under 5 year old males and 6 to 11 year old females are the most vulnerable to poverty, with 11 males (64.7%) and 16 females (100.0%) in their respective age groups living below the poverty level.
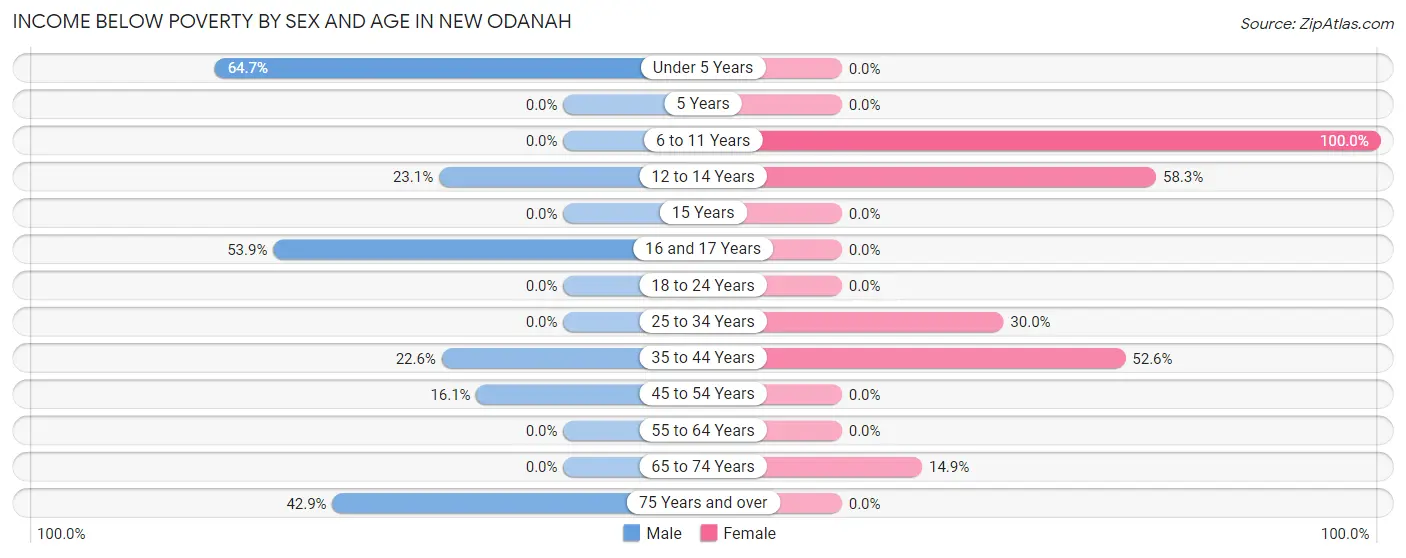
| Age Bracket | Male | Female |
| Under 5 Years | 11 (64.7%) | 0 (0.0%) |
| 5 Years | 0 (0.0%) | 0 (0.0%) |
| 6 to 11 Years | 0 (0.0%) | 16 (100.0%) |
| 12 to 14 Years | 3 (23.1%) | 7 (58.3%) |
| 15 Years | 0 (0.0%) | 0 (0.0%) |
| 16 and 17 Years | 7 (53.8%) | 0 (0.0%) |
| 18 to 24 Years | 0 (0.0%) | 0 (0.0%) |
| 25 to 34 Years | 0 (0.0%) | 6 (30.0%) |
| 35 to 44 Years | 7 (22.6%) | 10 (52.6%) |
| 45 to 54 Years | 5 (16.1%) | 0 (0.0%) |
| 55 to 64 Years | 0 (0.0%) | 0 (0.0%) |
| 65 to 74 Years | 0 (0.0%) | 7 (14.9%) |
| 75 Years and over | 3 (42.9%) | 0 (0.0%) |
| Total | 36 (20.7%) | 46 (25.4%) |
Income Above Poverty by Sex and Age in New Odanah
According to the poverty statistics in New Odanah, males aged 25 to 34 years and females aged under 5 years are the age groups that are most secure financially, with 100.0% of males and 100.0% of females in these age groups living above the poverty line.
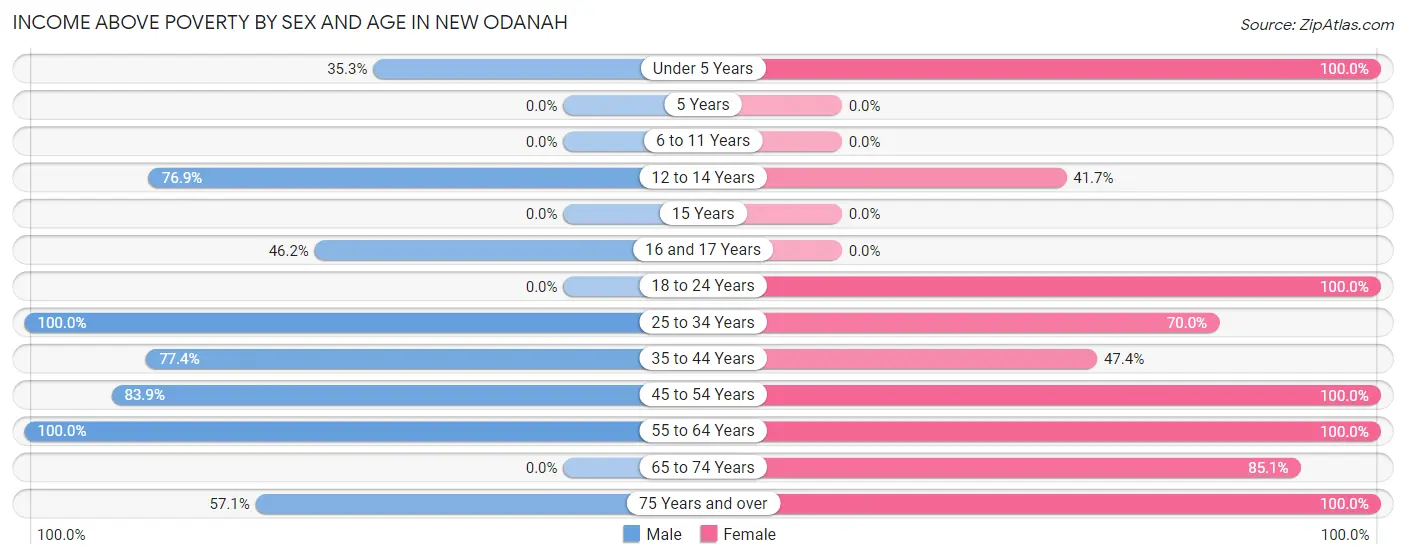
| Age Bracket | Male | Female |
| Under 5 Years | 6 (35.3%) | 12 (100.0%) |
| 5 Years | 0 (0.0%) | 0 (0.0%) |
| 6 to 11 Years | 0 (0.0%) | 0 (0.0%) |
| 12 to 14 Years | 10 (76.9%) | 5 (41.7%) |
| 15 Years | 0 (0.0%) | 0 (0.0%) |
| 16 and 17 Years | 6 (46.2%) | 0 (0.0%) |
| 18 to 24 Years | 0 (0.0%) | 9 (100.0%) |
| 25 to 34 Years | 25 (100.0%) | 14 (70.0%) |
| 35 to 44 Years | 24 (77.4%) | 9 (47.4%) |
| 45 to 54 Years | 26 (83.9%) | 27 (100.0%) |
| 55 to 64 Years | 37 (100.0%) | 16 (100.0%) |
| 65 to 74 Years | 0 (0.0%) | 40 (85.1%) |
| 75 Years and over | 4 (57.1%) | 3 (100.0%) |
| Total | 138 (79.3%) | 135 (74.6%) |
Income Below Poverty Among Married-Couple Families in New Odanah
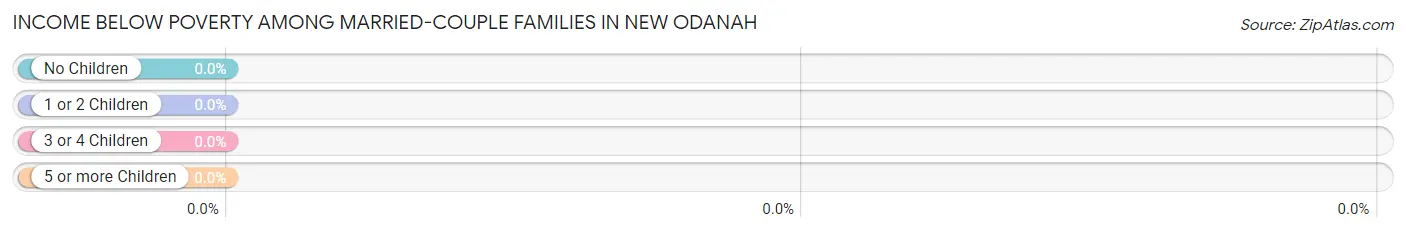
| Children | Above Poverty | Below Poverty |
| No Children | 42 (100.0%) | 0 (0.0%) |
| 1 or 2 Children | 4 (100.0%) | 0 (0.0%) |
| 3 or 4 Children | 0 (0.0%) | 0 (0.0%) |
| 5 or more Children | 0 (0.0%) | 0 (0.0%) |
| Total | 46 (100.0%) | 0 (0.0%) |
Income Below Poverty Among Single-Parent Households in New Odanah
According to the poverty data in New Odanah, 100.0% or 12 single-father households and 23.9% or 11 single-mother households are living below the poverty line. Among single-father households, those with 1 or 2 children have the highest poverty rate, with 12 households (100.0%) experiencing poverty. Likewise, among single-mother households, those with 5 or more children have the highest poverty rate, with 5 households (100.0%) falling below the poverty line.
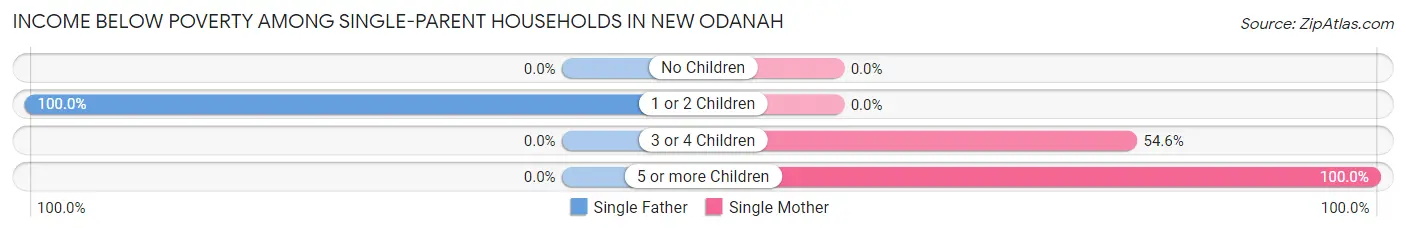
| Children | Single Father | Single Mother |
| No Children | 0 (0.0%) | 0 (0.0%) |
| 1 or 2 Children | 12 (100.0%) | 0 (0.0%) |
| 3 or 4 Children | 0 (0.0%) | 6 (54.5%) |
| 5 or more Children | 0 (0.0%) | 5 (100.0%) |
| Total | 12 (100.0%) | 11 (23.9%) |
Income Below Poverty Among Married-Couple vs Single-Parent Households in New Odanah
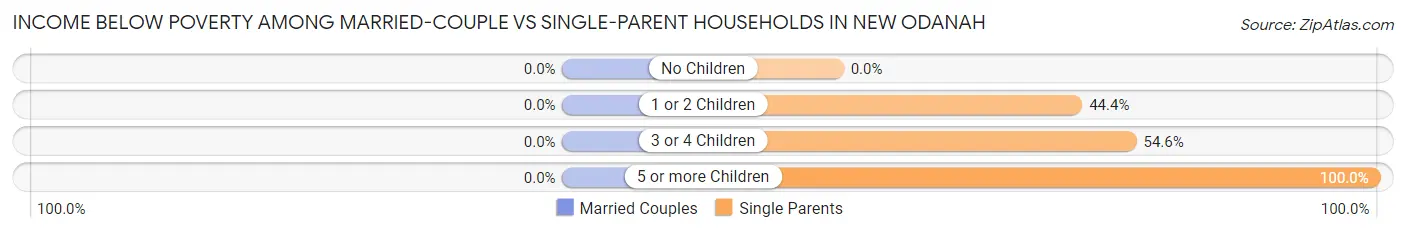
| Children | Married-Couple Families | Single-Parent Households |
| No Children | 0 (0.0%) | 0 (0.0%) |
| 1 or 2 Children | 0 (0.0%) | 12 (44.4%) |
| 3 or 4 Children | 0 (0.0%) | 6 (54.5%) |
| 5 or more Children | 0 (0.0%) | 5 (100.0%) |
| Total | 0 (0.0%) | 23 (39.7%) |
Employment Characteristics in New Odanah
Employment by Class of Employer in New Odanah
Among the 175 employed individuals in New Odanah, private company employees (79 | 45.1%), local government employees (58 | 33.1%), and federal government employees (15 | 8.6%) make up the most common classes of employment.
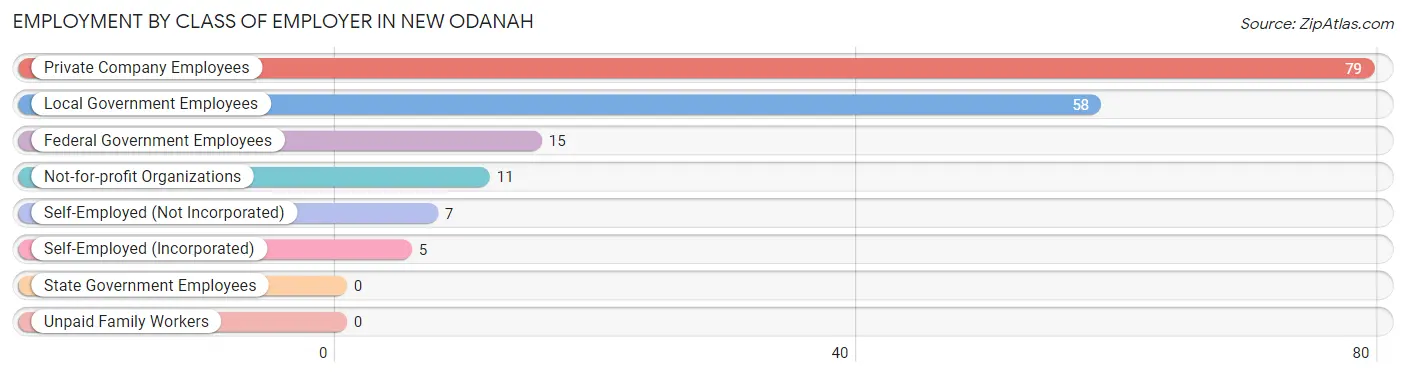
| Employer Class | # Employees | % Employees |
| Private Company Employees | 79 | 45.1% |
| Self-Employed (Incorporated) | 5 | 2.9% |
| Self-Employed (Not Incorporated) | 7 | 4.0% |
| Not-for-profit Organizations | 11 | 6.3% |
| Local Government Employees | 58 | 33.1% |
| State Government Employees | 0 | 0.0% |
| Federal Government Employees | 15 | 8.6% |
| Unpaid Family Workers | 0 | 0.0% |
| Total | 175 | 100.0% |
Employment Status by Age in New Odanah
According to the labor force statistics for New Odanah, out of the total population over 16 years of age (285), 72.6% or 207 individuals are in the labor force, with 13.0% or 27 of them unemployed. The age group with the highest labor force participation rate is 20 to 24 years, with 100.0% or 9 individuals in the labor force. Within the labor force, the 20 to 24 years age range has the highest percentage of unemployed individuals, with 100.0% or 9 of them being unemployed.
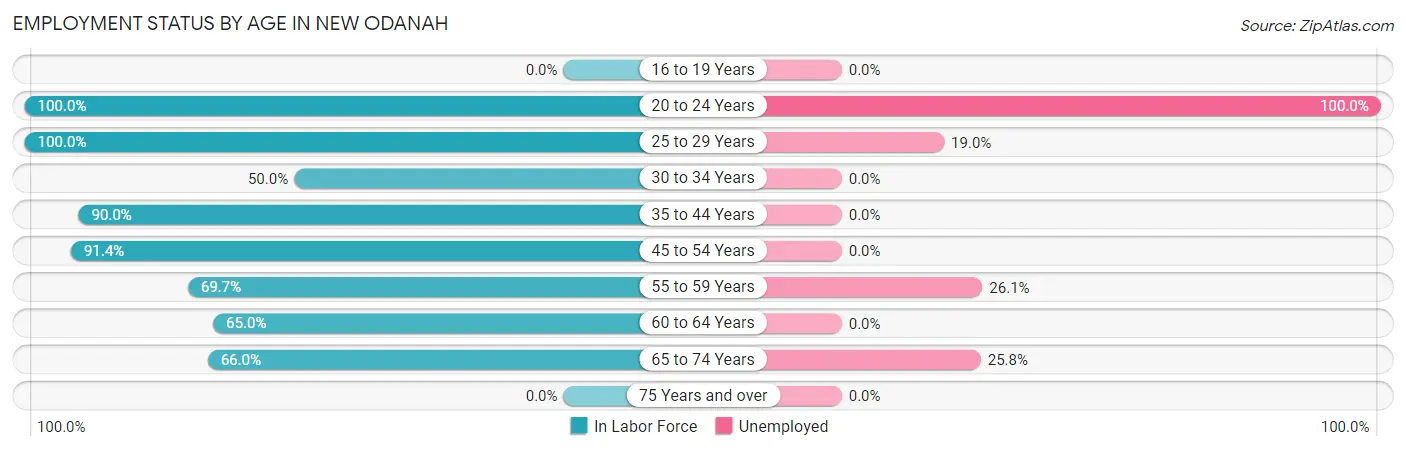
| Age Bracket | In Labor Force | Unemployed |
| 16 to 19 Years | 0 (0.0%) | 0 (0.0%) |
| 20 to 24 Years | 9 (100.0%) | 9 (100.0%) |
| 25 to 29 Years | 21 (100.0%) | 4 (19.0%) |
| 30 to 34 Years | 12 (50.0%) | 0 (0.0%) |
| 35 to 44 Years | 45 (90.0%) | 0 (0.0%) |
| 45 to 54 Years | 53 (91.4%) | 0 (0.0%) |
| 55 to 59 Years | 23 (69.7%) | 6 (26.1%) |
| 60 to 64 Years | 13 (65.0%) | 0 (0.0%) |
| 65 to 74 Years | 31 (66.0%) | 8 (25.8%) |
| 75 Years and over | 0 (0.0%) | 0 (0.0%) |
| Total | 207 (72.6%) | 27 (13.0%) |
Employment Status by Educational Attainment in New Odanah
According to labor force statistics for New Odanah, 81.1% of individuals (167) out of the total population between 25 and 64 years of age (206) are in the labor force, with 6.0% or 10 of them being unemployed. The group with the highest labor force participation rate are those with the educational attainment of less than high school, with 100.0% or 8 individuals in the labor force. Within the labor force, individuals with bachelor's degree or higher education have the highest percentage of unemployment, with 24.0% or 6 of them being unemployed.
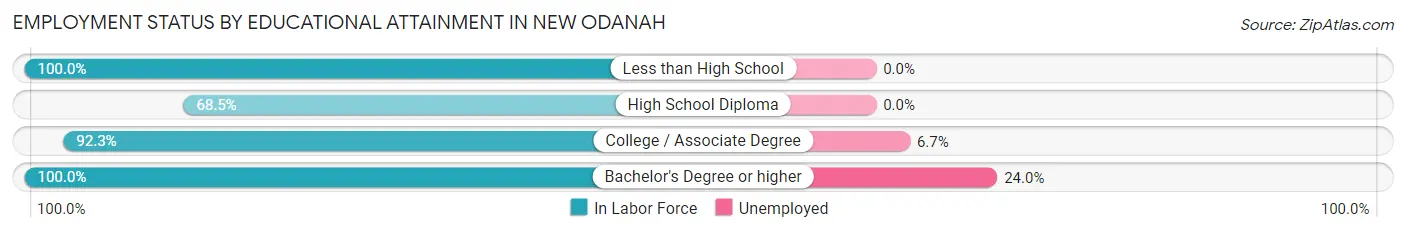
| Educational Attainment | In Labor Force | Unemployed |
| Less than High School | 8 (100.0%) | 0 (0.0%) |
| High School Diploma | 74 (68.5%) | 0 (0.0%) |
| College / Associate Degree | 60 (92.3%) | 4 (6.7%) |
| Bachelor's Degree or higher | 25 (100.0%) | 6 (24.0%) |
| Total | 167 (81.1%) | 12 (6.0%) |
Employment Occupations by Sex in New Odanah
Management, Business, Science and Arts Occupations
The most common Management, Business, Science and Arts occupations in New Odanah are Business & Financial (18 | 10.0%), and Management (17 | 9.4%).
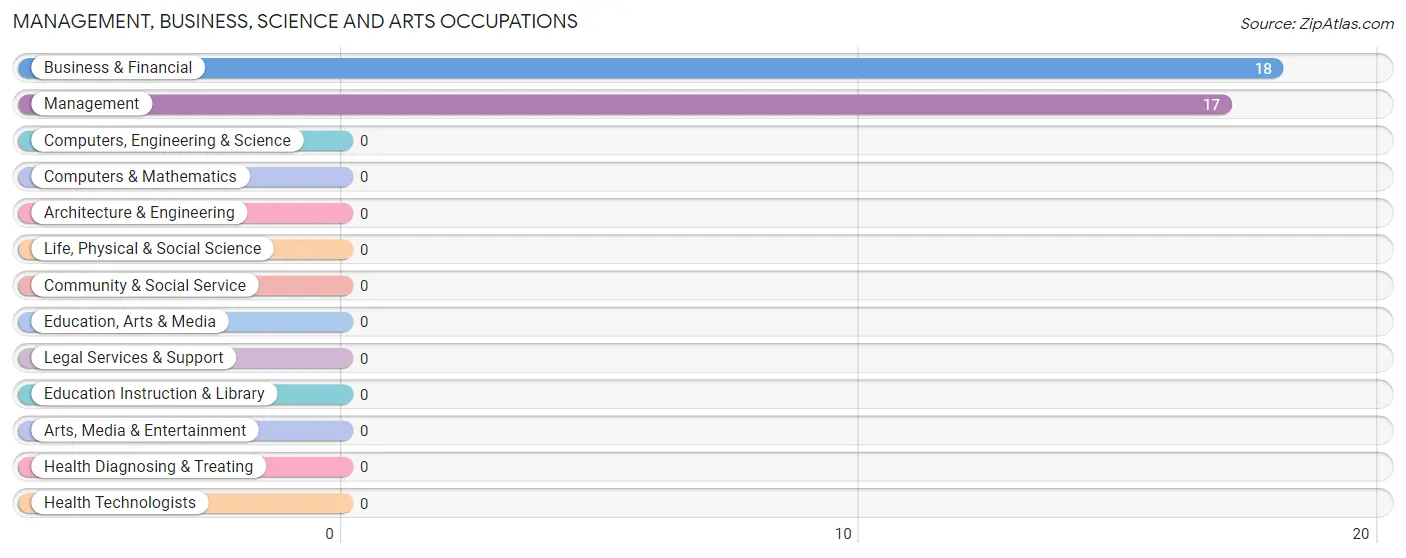
Management, Business, Science and Arts Occupations by Sex
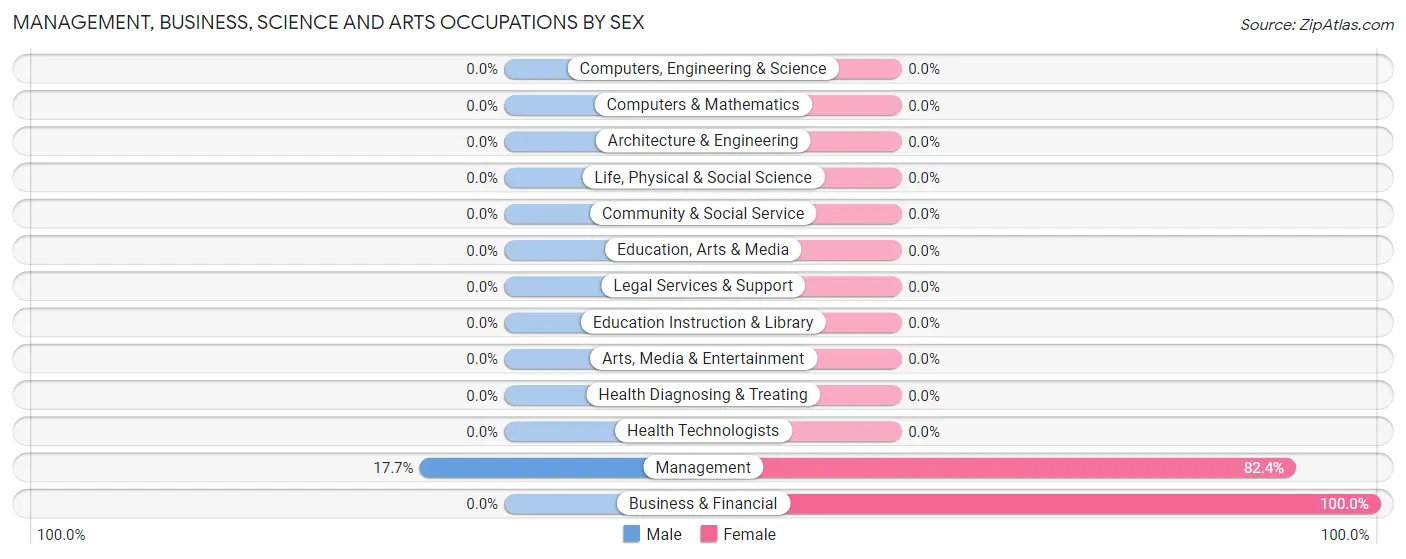
| Occupation | Male | Female |
| Management | 3 (17.6%) | 14 (82.4%) |
| Business & Financial | 0 (0.0%) | 18 (100.0%) |
| Computers, Engineering & Science | 0 (0.0%) | 0 (0.0%) |
| Computers & Mathematics | 0 (0.0%) | 0 (0.0%) |
| Architecture & Engineering | 0 (0.0%) | 0 (0.0%) |
| Life, Physical & Social Science | 0 (0.0%) | 0 (0.0%) |
| Community & Social Service | 0 (0.0%) | 0 (0.0%) |
| Education, Arts & Media | 0 (0.0%) | 0 (0.0%) |
| Legal Services & Support | 0 (0.0%) | 0 (0.0%) |
| Education Instruction & Library | 0 (0.0%) | 0 (0.0%) |
| Arts, Media & Entertainment | 0 (0.0%) | 0 (0.0%) |
| Health Diagnosing & Treating | 0 (0.0%) | 0 (0.0%) |
| Health Technologists | 0 (0.0%) | 0 (0.0%) |
| Total (Category) | 3 (8.6%) | 32 (91.4%) |
| Total (Overall) | 90 (50.0%) | 90 (50.0%) |
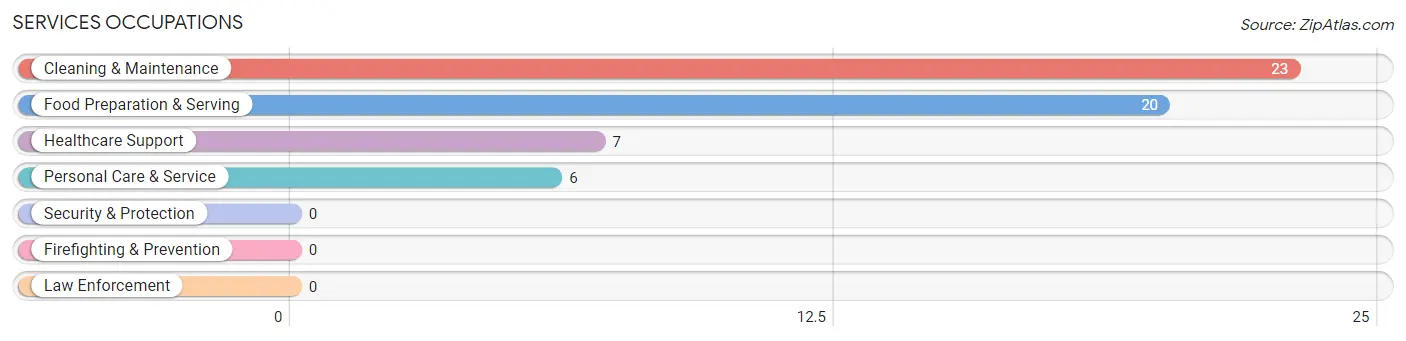
Services Occupations
The most common Services occupations in New Odanah are Cleaning & Maintenance (23 | 12.8%), Food Preparation & Serving (20 | 11.1%), Healthcare Support (7 | 3.9%), and Personal Care & Service (6 | 3.3%).
Services Occupations by Sex
Within the Services occupations in New Odanah, the most male-oriented occupations are Cleaning & Maintenance (78.3%), and Food Preparation & Serving (35.0%), while the most female-oriented occupations are Healthcare Support (100.0%), Personal Care & Service (100.0%), and Food Preparation & Serving (65.0%).
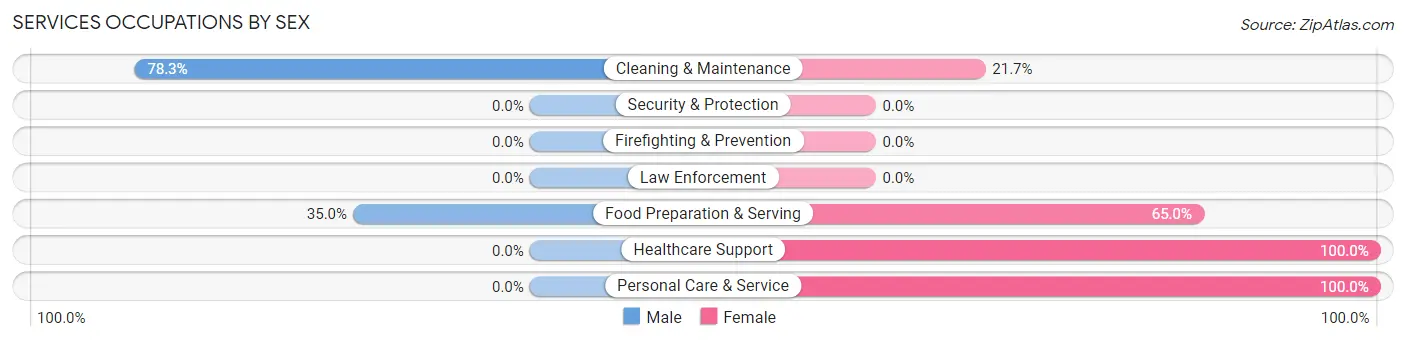
| Occupation | Male | Female |
| Healthcare Support | 0 (0.0%) | 7 (100.0%) |
| Security & Protection | 0 (0.0%) | 0 (0.0%) |
| Firefighting & Prevention | 0 (0.0%) | 0 (0.0%) |
| Law Enforcement | 0 (0.0%) | 0 (0.0%) |
| Food Preparation & Serving | 7 (35.0%) | 13 (65.0%) |
| Cleaning & Maintenance | 18 (78.3%) | 5 (21.7%) |
| Personal Care & Service | 0 (0.0%) | 6 (100.0%) |
| Total (Category) | 25 (44.6%) | 31 (55.4%) |
| Total (Overall) | 90 (50.0%) | 90 (50.0%) |
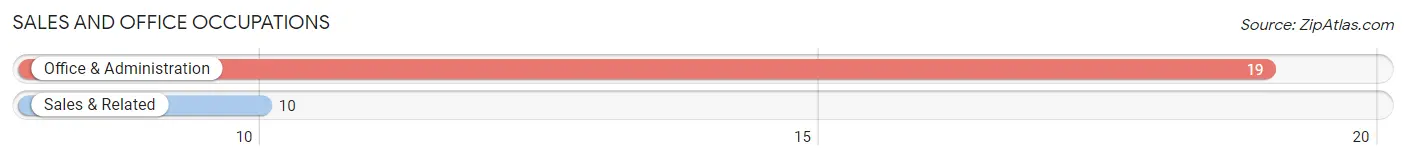
Sales and Office Occupations
The most common Sales and Office occupations in New Odanah are Office & Administration (19 | 10.6%), and Sales & Related (10 | 5.6%).
Sales and Office Occupations by Sex
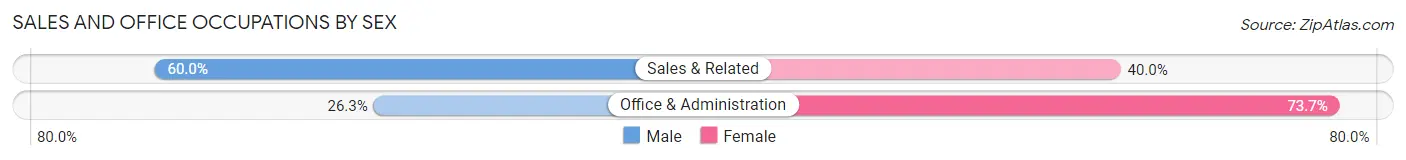
| Occupation | Male | Female |
| Sales & Related | 6 (60.0%) | 4 (40.0%) |
| Office & Administration | 5 (26.3%) | 14 (73.7%) |
| Total (Category) | 11 (37.9%) | 18 (62.1%) |
| Total (Overall) | 90 (50.0%) | 90 (50.0%) |
Natural Resources, Construction and Maintenance Occupations
The most common Natural Resources, Construction and Maintenance occupations in New Odanah are Construction & Extraction (19 | 10.6%), Installation, Maintenance & Repair (6 | 3.3%), and Farming, Fishing & Forestry (5 | 2.8%).
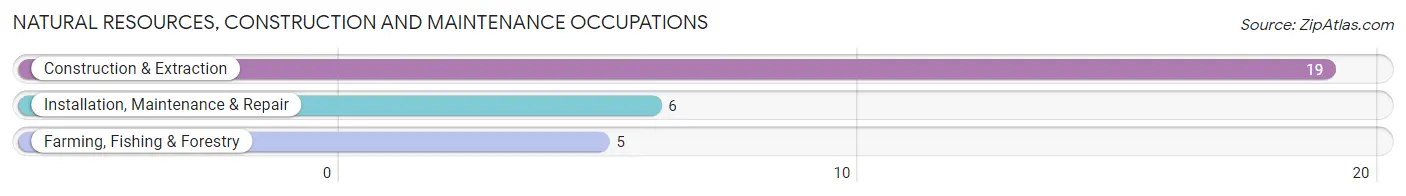
Natural Resources, Construction and Maintenance Occupations by Sex
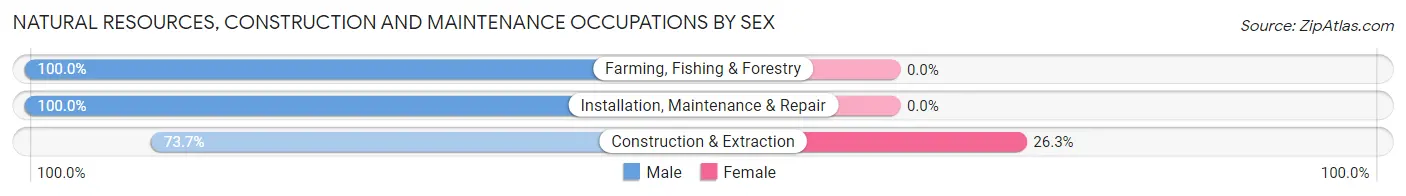
| Occupation | Male | Female |
| Farming, Fishing & Forestry | 5 (100.0%) | 0 (0.0%) |
| Construction & Extraction | 14 (73.7%) | 5 (26.3%) |
| Installation, Maintenance & Repair | 6 (100.0%) | 0 (0.0%) |
| Total (Category) | 25 (83.3%) | 5 (16.7%) |
| Total (Overall) | 90 (50.0%) | 90 (50.0%) |
Production, Transportation and Moving Occupations
The most common Production, Transportation and Moving occupations in New Odanah are , and Production (30 | 16.7%).
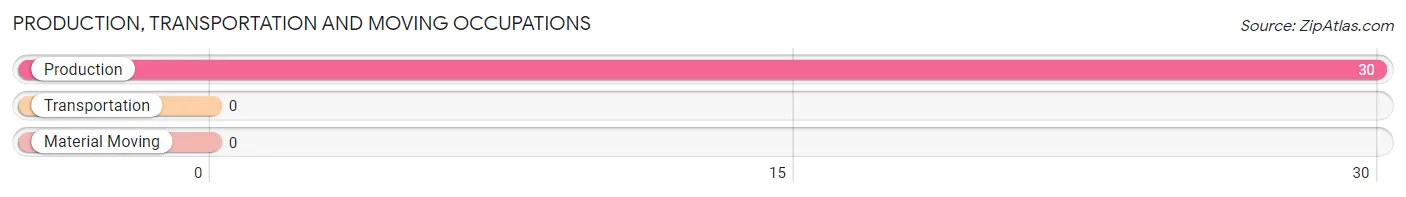
Production, Transportation and Moving Occupations by Sex
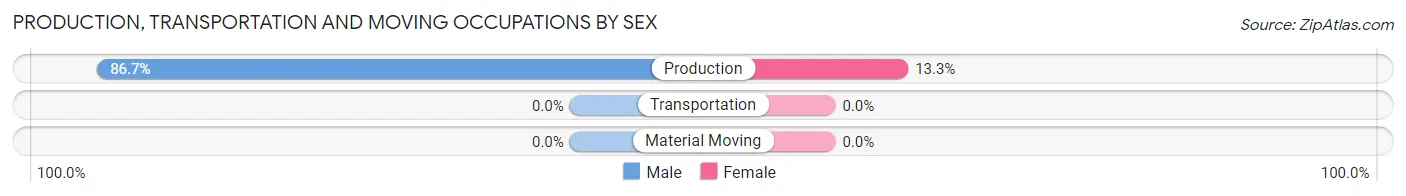
| Occupation | Male | Female |
| Production | 26 (86.7%) | 4 (13.3%) |
| Transportation | 0 (0.0%) | 0 (0.0%) |
| Material Moving | 0 (0.0%) | 0 (0.0%) |
| Total (Category) | 26 (86.7%) | 4 (13.3%) |
| Total (Overall) | 90 (50.0%) | 90 (50.0%) |
Employment Industries by Sex in New Odanah
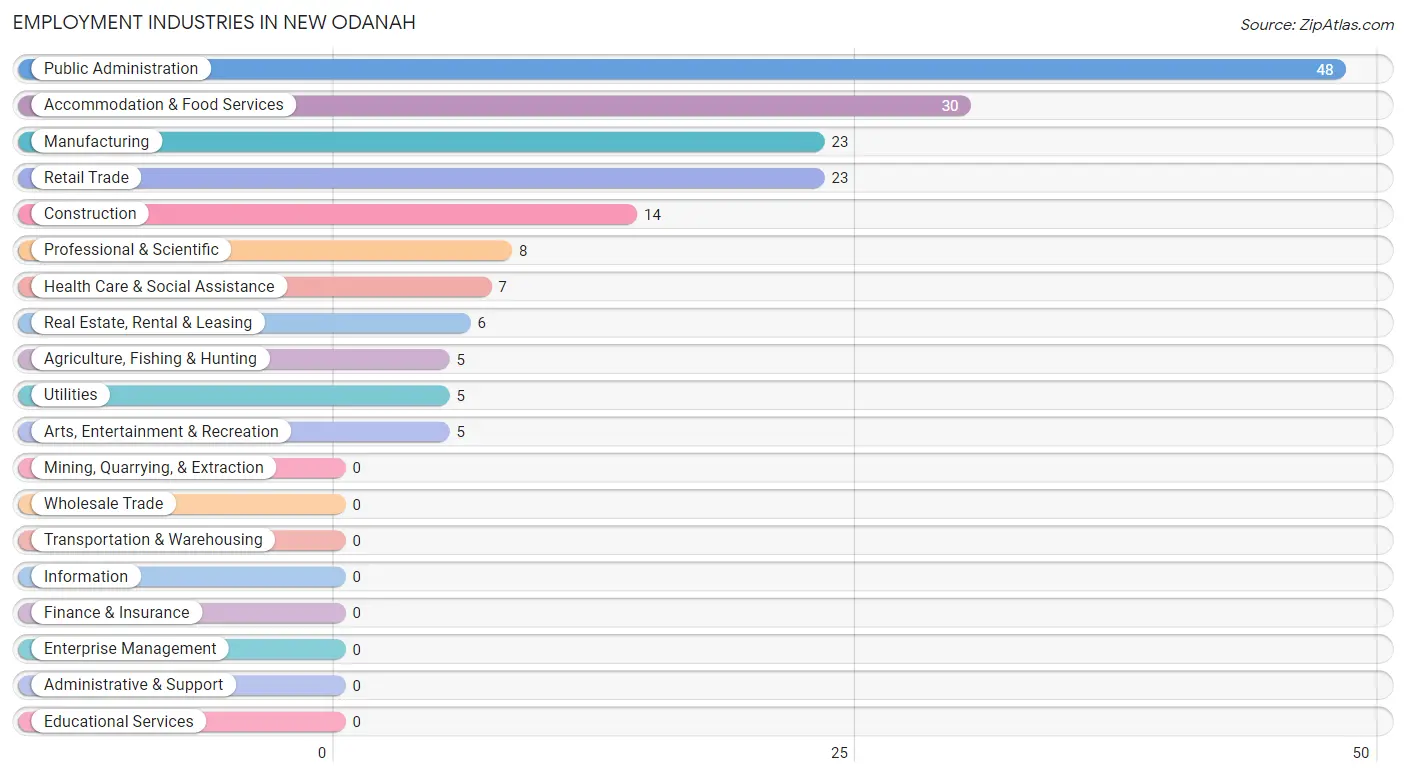
Employment Industries in New Odanah
The major employment industries in New Odanah include Public Administration (48 | 26.7%), Accommodation & Food Services (30 | 16.7%), Manufacturing (23 | 12.8%), Retail Trade (23 | 12.8%), and Construction (14 | 7.8%).
Employment Industries by Sex in New Odanah
The New Odanah industries that see more men than women are Agriculture, Fishing & Hunting (100.0%), Construction (100.0%), and Real Estate, Rental & Leasing (100.0%), whereas the industries that tend to have a higher number of women are Utilities (100.0%), Professional & Scientific (100.0%), and Health Care & Social Assistance (100.0%).
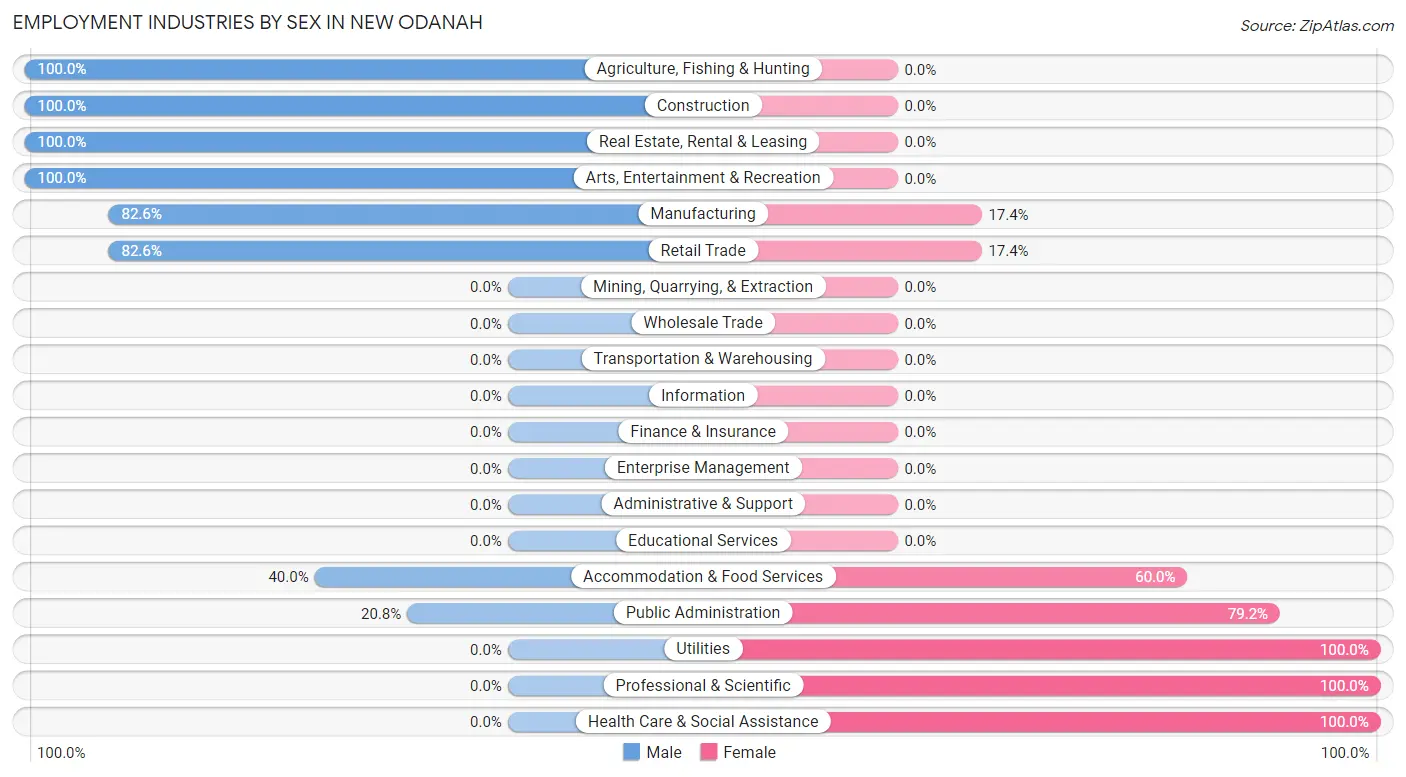
| Industry | Male | Female |
| Agriculture, Fishing & Hunting | 5 (100.0%) | 0 (0.0%) |
| Mining, Quarrying, & Extraction | 0 (0.0%) | 0 (0.0%) |
| Construction | 14 (100.0%) | 0 (0.0%) |
| Manufacturing | 19 (82.6%) | 4 (17.4%) |
| Wholesale Trade | 0 (0.0%) | 0 (0.0%) |
| Retail Trade | 19 (82.6%) | 4 (17.4%) |
| Transportation & Warehousing | 0 (0.0%) | 0 (0.0%) |
| Utilities | 0 (0.0%) | 5 (100.0%) |
| Information | 0 (0.0%) | 0 (0.0%) |
| Finance & Insurance | 0 (0.0%) | 0 (0.0%) |
| Real Estate, Rental & Leasing | 6 (100.0%) | 0 (0.0%) |
| Professional & Scientific | 0 (0.0%) | 8 (100.0%) |
| Enterprise Management | 0 (0.0%) | 0 (0.0%) |
| Administrative & Support | 0 (0.0%) | 0 (0.0%) |
| Educational Services | 0 (0.0%) | 0 (0.0%) |
| Health Care & Social Assistance | 0 (0.0%) | 7 (100.0%) |
| Arts, Entertainment & Recreation | 5 (100.0%) | 0 (0.0%) |
| Accommodation & Food Services | 12 (40.0%) | 18 (60.0%) |
| Public Administration | 10 (20.8%) | 38 (79.2%) |
| Total | 90 (50.0%) | 90 (50.0%) |
Education in New Odanah
School Enrollment in New Odanah
The most common levels of schooling among the 92 students in New Odanah are high school (28 | 30.4%), elementary school (17 | 18.5%), and college / undergraduate (13 | 14.1%).
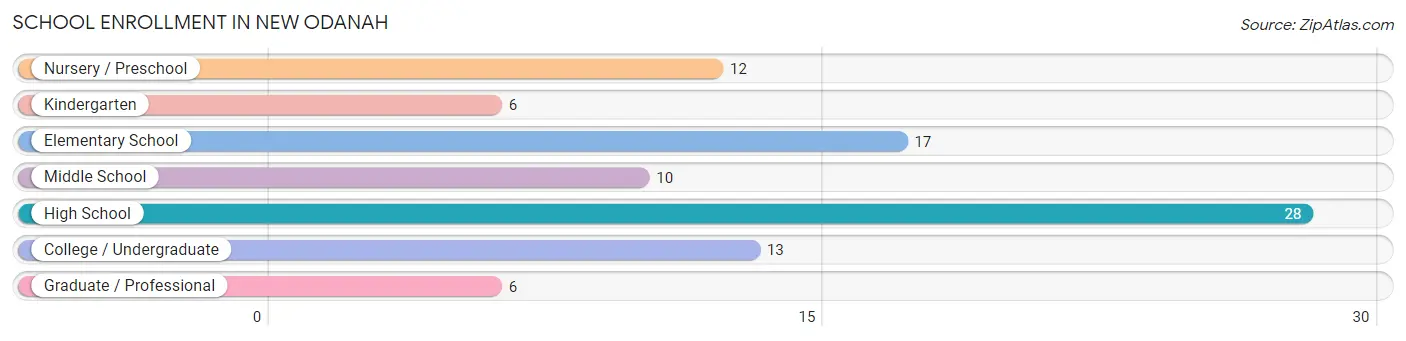
| School Level | # Students | % Students |
| Nursery / Preschool | 12 | 13.0% |
| Kindergarten | 6 | 6.5% |
| Elementary School | 17 | 18.5% |
| Middle School | 10 | 10.9% |
| High School | 28 | 30.4% |
| College / Undergraduate | 13 | 14.1% |
| Graduate / Professional | 6 | 6.5% |
| Total | 92 | 100.0% |
School Enrollment by Age by Funding Source in New Odanah
Out of a total of 92 students who are enrolled in schools in New Odanah, 16 (17.4%) attend a private institution, while the remaining 76 (82.6%) are enrolled in public schools. The age group of 5 to 9 year old has the highest likelihood of being enrolled in private schools, with 9 (39.1% in the age bracket) enrolled. Conversely, the age group of 3 to 4 year olds has the lowest likelihood of being enrolled in a private school, with 12 (100.0% in the age bracket) attending a public institution.
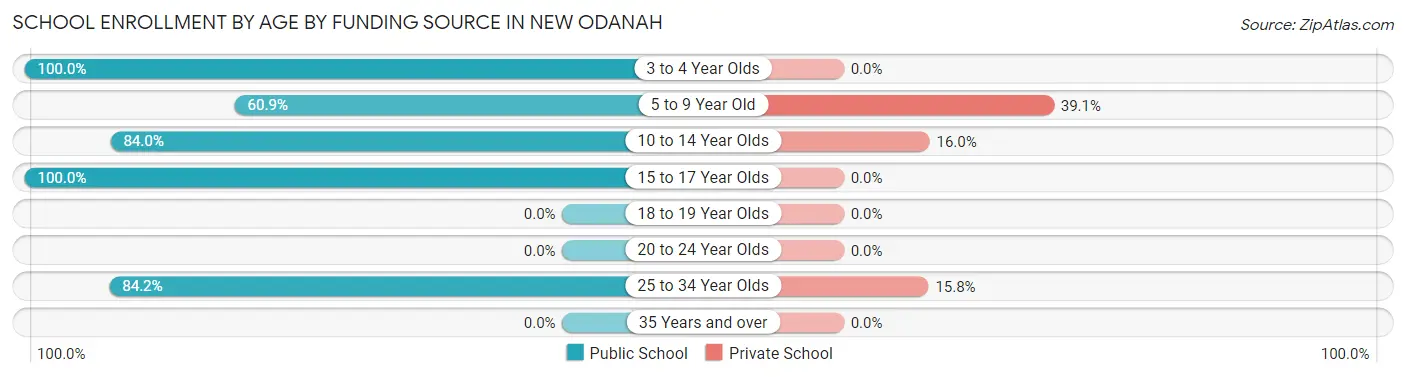
| Age Bracket | Public School | Private School |
| 3 to 4 Year Olds | 12 (100.0%) | 0 (0.0%) |
| 5 to 9 Year Old | 14 (60.9%) | 9 (39.1%) |
| 10 to 14 Year Olds | 21 (84.0%) | 4 (16.0%) |
| 15 to 17 Year Olds | 13 (100.0%) | 0 (0.0%) |
| 18 to 19 Year Olds | 0 (0.0%) | 0 (0.0%) |
| 20 to 24 Year Olds | 0 (0.0%) | 0 (0.0%) |
| 25 to 34 Year Olds | 16 (84.2%) | 3 (15.8%) |
| 35 Years and over | 0 (0.0%) | 0 (0.0%) |
| Total | 76 (82.6%) | 16 (17.4%) |
Educational Attainment by Field of Study in New Odanah
Education (11 | 44.0%), communications (6 | 24.0%), business (5 | 20.0%), and psychology (3 | 12.0%) are the most common fields of study among 25 individuals in New Odanah who have obtained a bachelor's degree or higher.
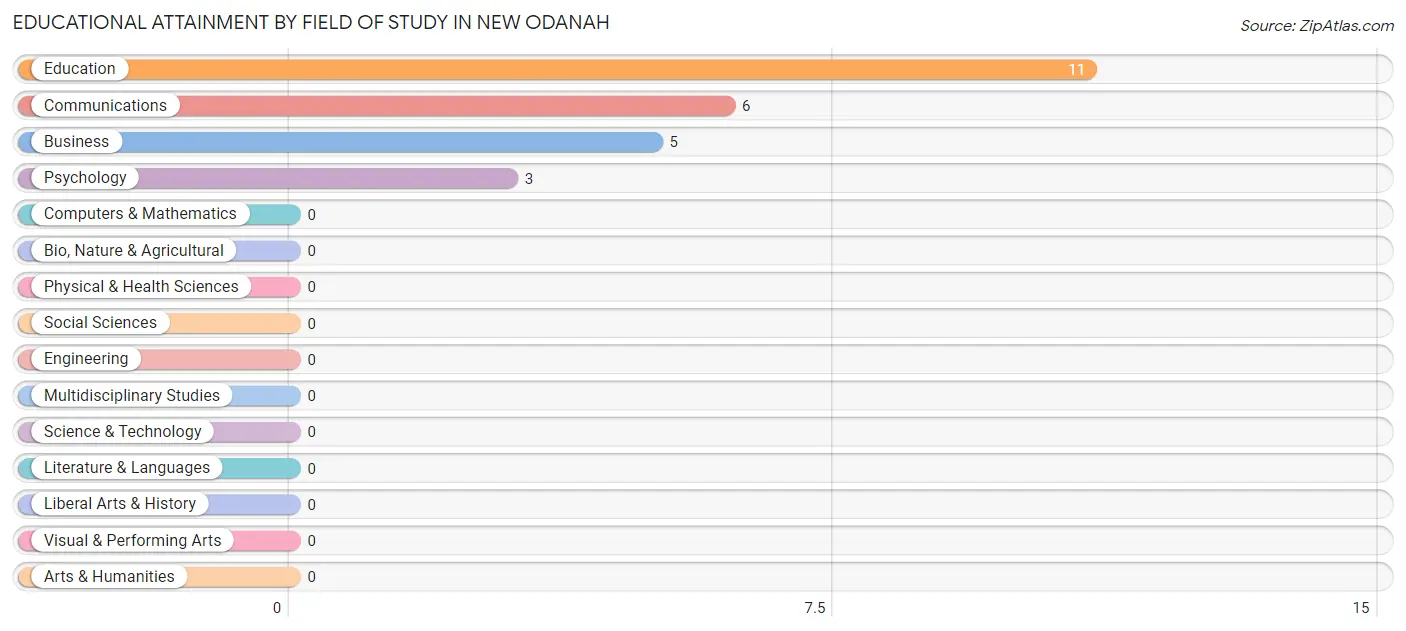
| Field of Study | # Graduates | % Graduates |
| Computers & Mathematics | 0 | 0.0% |
| Bio, Nature & Agricultural | 0 | 0.0% |
| Physical & Health Sciences | 0 | 0.0% |
| Psychology | 3 | 12.0% |
| Social Sciences | 0 | 0.0% |
| Engineering | 0 | 0.0% |
| Multidisciplinary Studies | 0 | 0.0% |
| Science & Technology | 0 | 0.0% |
| Business | 5 | 20.0% |
| Education | 11 | 44.0% |
| Literature & Languages | 0 | 0.0% |
| Liberal Arts & History | 0 | 0.0% |
| Visual & Performing Arts | 0 | 0.0% |
| Communications | 6 | 24.0% |
| Arts & Humanities | 0 | 0.0% |
| Total | 25 | 100.0% |
Transportation & Commute in New Odanah
Vehicle Availability by Sex in New Odanah
The most prevalent vehicle ownership categories in New Odanah are males with 2 vehicles (32, accounting for 35.6%) and females with 2 vehicles (51, making up 37.7%).
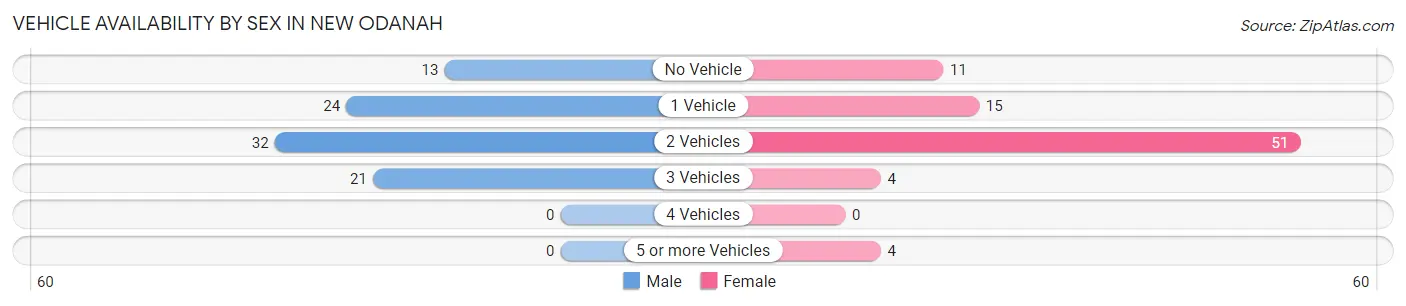
| Vehicles Available | Male | Female |
| No Vehicle | 13 (14.4%) | 11 (12.9%) |
| 1 Vehicle | 24 (26.7%) | 15 (17.6%) |
| 2 Vehicles | 32 (35.6%) | 51 (60.0%) |
| 3 Vehicles | 21 (23.3%) | 4 (4.7%) |
| 4 Vehicles | 0 (0.0%) | 0 (0.0%) |
| 5 or more Vehicles | 0 (0.0%) | 4 (4.7%) |
| Total | 90 (100.0%) | 85 (100.0%) |
Commute Time in New Odanah
The most frequently occuring commute durations in New Odanah are 5 to 9 minutes (66 commuters, 41.2%), less than 5 minutes (29 commuters, 18.1%), and 20 to 24 minutes (18 commuters, 11.3%).
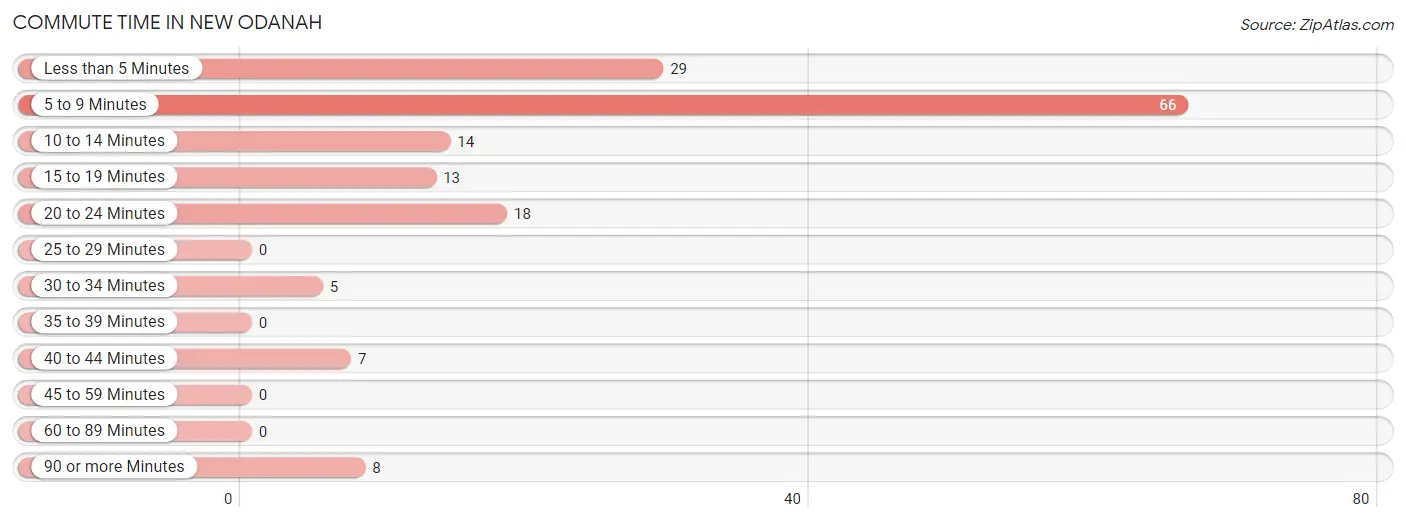
| Commute Time | # Commuters | % Commuters |
| Less than 5 Minutes | 29 | 18.1% |
| 5 to 9 Minutes | 66 | 41.2% |
| 10 to 14 Minutes | 14 | 8.7% |
| 15 to 19 Minutes | 13 | 8.1% |
| 20 to 24 Minutes | 18 | 11.3% |
| 25 to 29 Minutes | 0 | 0.0% |
| 30 to 34 Minutes | 5 | 3.1% |
| 35 to 39 Minutes | 0 | 0.0% |
| 40 to 44 Minutes | 7 | 4.4% |
| 45 to 59 Minutes | 0 | 0.0% |
| 60 to 89 Minutes | 0 | 0.0% |
| 90 or more Minutes | 8 | 5.0% |
Commute Time by Sex in New Odanah
The most common commute times in New Odanah are 5 to 9 minutes (29 commuters, 34.9%) for males and 5 to 9 minutes (37 commuters, 48.0%) for females.
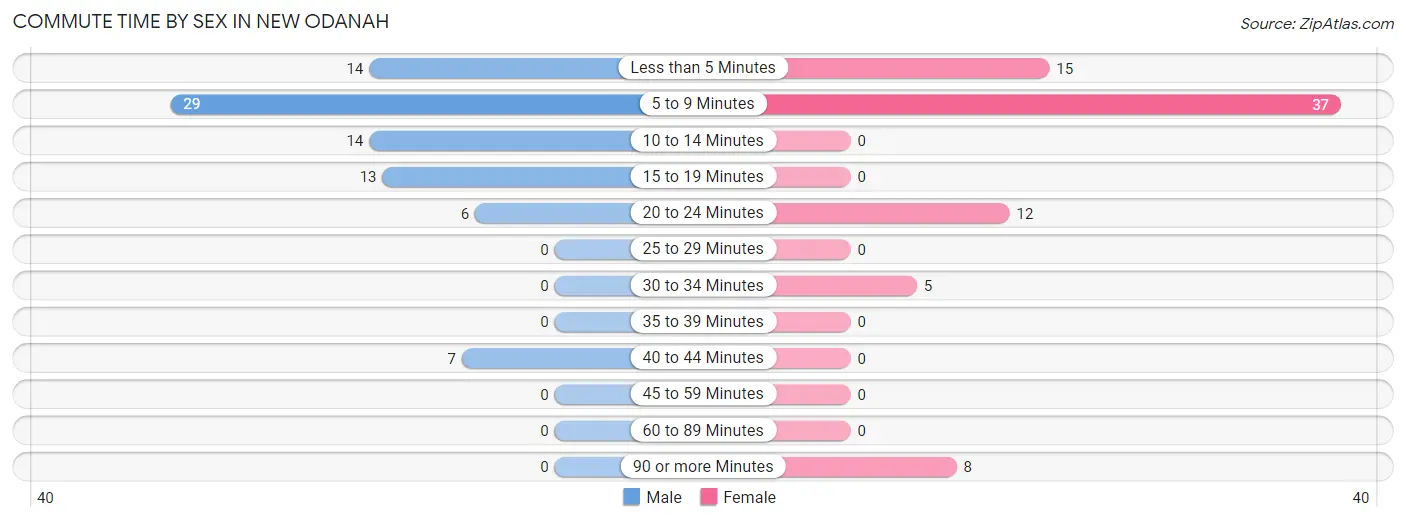
| Commute Time | Male | Female |
| Less than 5 Minutes | 14 (16.9%) | 15 (19.5%) |
| 5 to 9 Minutes | 29 (34.9%) | 37 (48.0%) |
| 10 to 14 Minutes | 14 (16.9%) | 0 (0.0%) |
| 15 to 19 Minutes | 13 (15.7%) | 0 (0.0%) |
| 20 to 24 Minutes | 6 (7.2%) | 12 (15.6%) |
| 25 to 29 Minutes | 0 (0.0%) | 0 (0.0%) |
| 30 to 34 Minutes | 0 (0.0%) | 5 (6.5%) |
| 35 to 39 Minutes | 0 (0.0%) | 0 (0.0%) |
| 40 to 44 Minutes | 7 (8.4%) | 0 (0.0%) |
| 45 to 59 Minutes | 0 (0.0%) | 0 (0.0%) |
| 60 to 89 Minutes | 0 (0.0%) | 0 (0.0%) |
| 90 or more Minutes | 0 (0.0%) | 8 (10.4%) |
Time of Departure to Work by Sex in New Odanah
The most frequent times of departure to work in New Odanah are 6:00 AM to 6:29 AM (25, 30.1%) for males and 7:30 AM to 7:59 AM (22, 28.6%) for females.
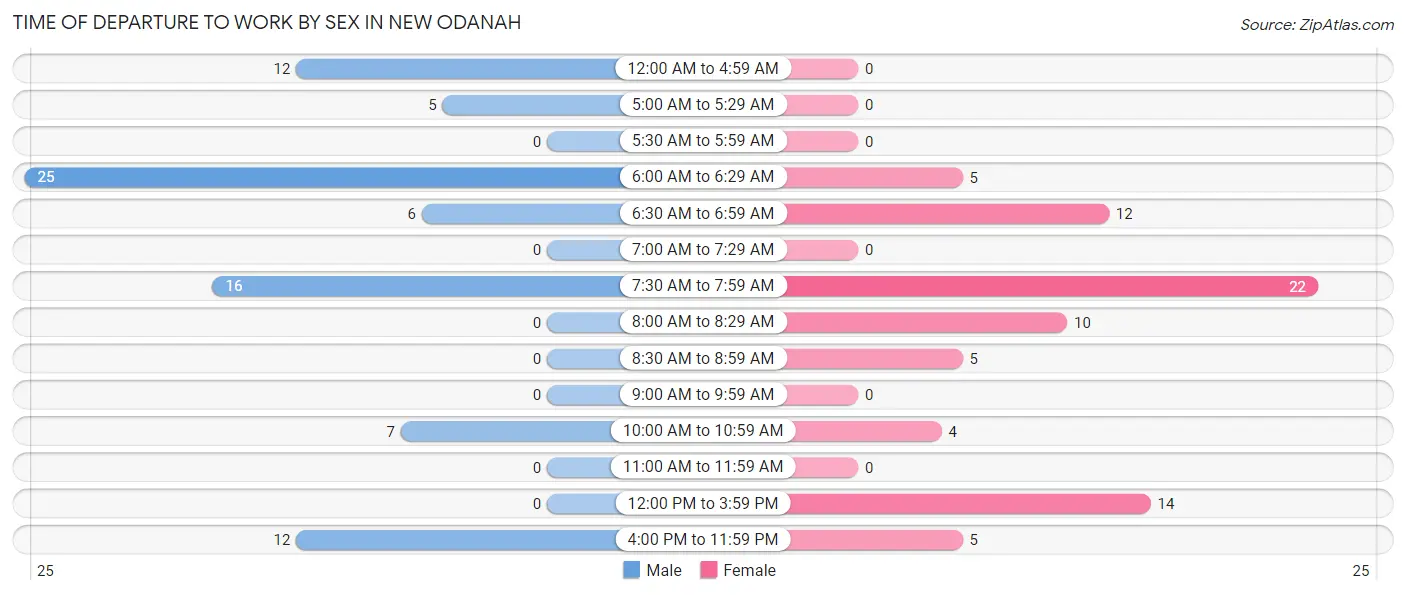
| Time of Departure | Male | Female |
| 12:00 AM to 4:59 AM | 12 (14.5%) | 0 (0.0%) |
| 5:00 AM to 5:29 AM | 5 (6.0%) | 0 (0.0%) |
| 5:30 AM to 5:59 AM | 0 (0.0%) | 0 (0.0%) |
| 6:00 AM to 6:29 AM | 25 (30.1%) | 5 (6.5%) |
| 6:30 AM to 6:59 AM | 6 (7.2%) | 12 (15.6%) |
| 7:00 AM to 7:29 AM | 0 (0.0%) | 0 (0.0%) |
| 7:30 AM to 7:59 AM | 16 (19.3%) | 22 (28.6%) |
| 8:00 AM to 8:29 AM | 0 (0.0%) | 10 (13.0%) |
| 8:30 AM to 8:59 AM | 0 (0.0%) | 5 (6.5%) |
| 9:00 AM to 9:59 AM | 0 (0.0%) | 0 (0.0%) |
| 10:00 AM to 10:59 AM | 7 (8.4%) | 4 (5.2%) |
| 11:00 AM to 11:59 AM | 0 (0.0%) | 0 (0.0%) |
| 12:00 PM to 3:59 PM | 0 (0.0%) | 14 (18.2%) |
| 4:00 PM to 11:59 PM | 12 (14.5%) | 5 (6.5%) |
| Total | 83 (100.0%) | 77 (100.0%) |
Housing Occupancy in New Odanah
Occupancy by Ownership in New Odanah
Of the total 136 dwellings in New Odanah, owner-occupied units account for 60 (44.1%), while renter-occupied units make up 76 (55.9%).
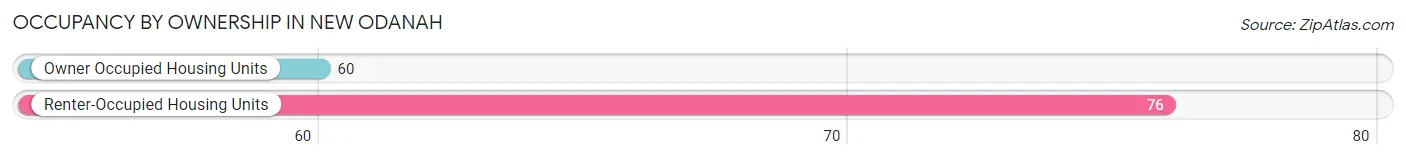
| Occupancy | # Housing Units | % Housing Units |
| Owner Occupied Housing Units | 60 | 44.1% |
| Renter-Occupied Housing Units | 76 | 55.9% |
| Total Occupied Housing Units | 136 | 100.0% |
Occupancy by Household Size in New Odanah
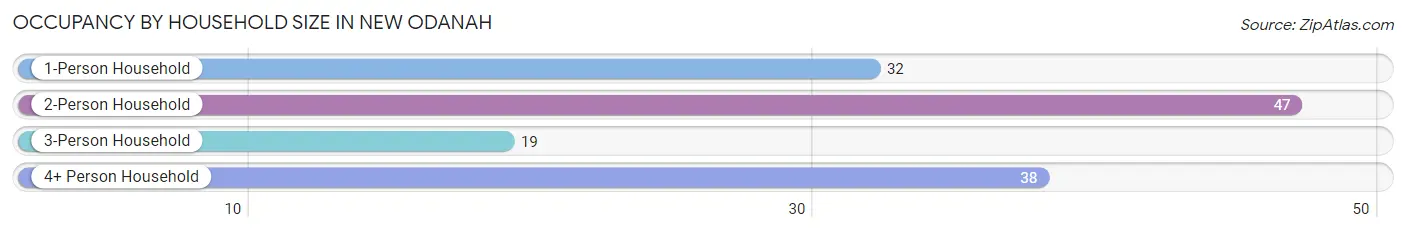
| Household Size | # Housing Units | % Housing Units |
| 1-Person Household | 32 | 23.5% |
| 2-Person Household | 47 | 34.6% |
| 3-Person Household | 19 | 14.0% |
| 4+ Person Household | 38 | 27.9% |
| Total Housing Units | 136 | 100.0% |
Occupancy by Ownership by Household Size in New Odanah
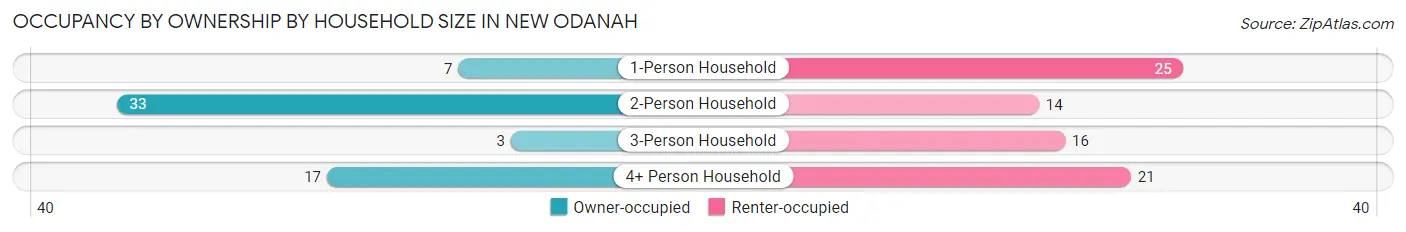
| Household Size | Owner-occupied | Renter-occupied |
| 1-Person Household | 7 (21.9%) | 25 (78.1%) |
| 2-Person Household | 33 (70.2%) | 14 (29.8%) |
| 3-Person Household | 3 (15.8%) | 16 (84.2%) |
| 4+ Person Household | 17 (44.7%) | 21 (55.3%) |
| Total Housing Units | 60 (44.1%) | 76 (55.9%) |
Occupancy by Educational Attainment in New Odanah
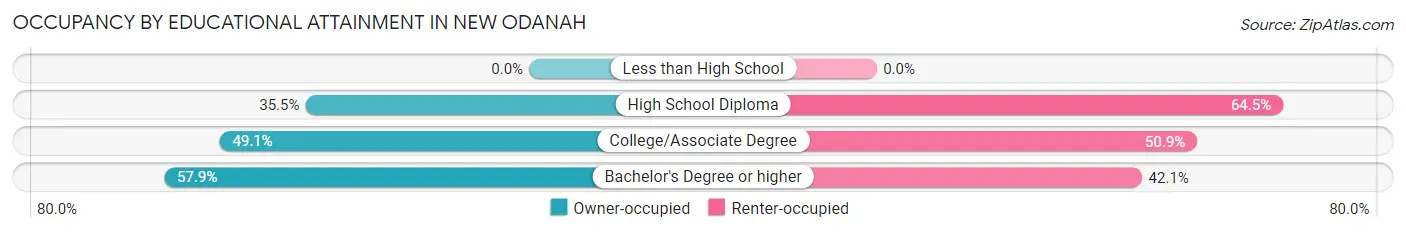
| Household Size | Owner-occupied | Renter-occupied |
| Less than High School | 0 (0.0%) | 0 (0.0%) |
| High School Diploma | 22 (35.5%) | 40 (64.5%) |
| College/Associate Degree | 27 (49.1%) | 28 (50.9%) |
| Bachelor's Degree or higher | 11 (57.9%) | 8 (42.1%) |
Occupancy by Age of Householder in New Odanah
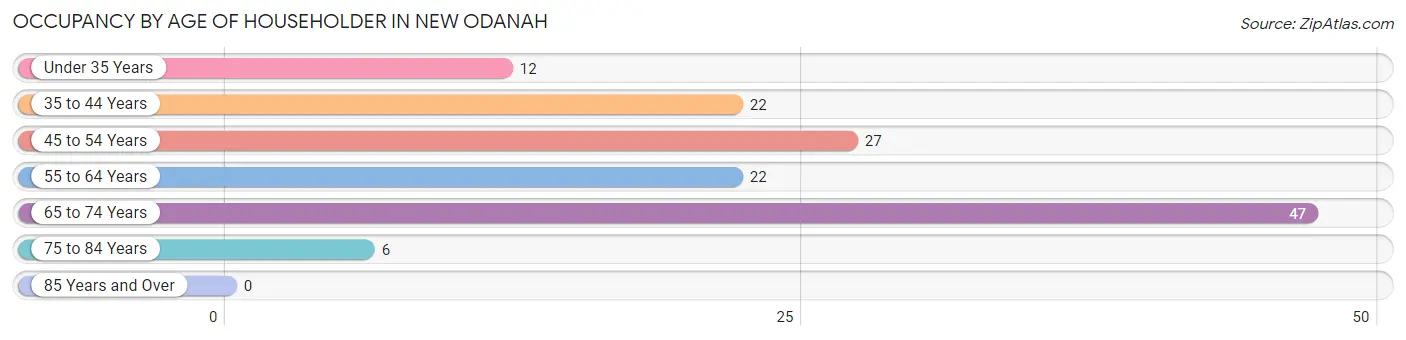
| Age Bracket | # Households | % Households |
| Under 35 Years | 12 | 8.8% |
| 35 to 44 Years | 22 | 16.2% |
| 45 to 54 Years | 27 | 19.9% |
| 55 to 64 Years | 22 | 16.2% |
| 65 to 74 Years | 47 | 34.6% |
| 75 to 84 Years | 6 | 4.4% |
| 85 Years and Over | 0 | 0.0% |
| Total | 136 | 100.0% |
Housing Finances in New Odanah
Median Income by Occupancy in New Odanah
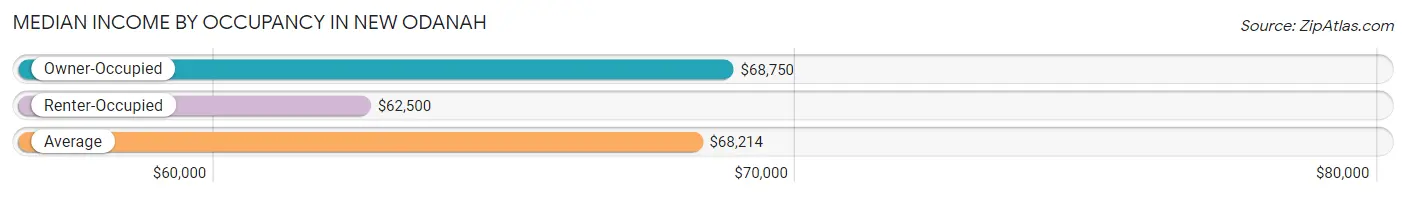
| Occupancy Type | # Households | Median Income |
| Owner-Occupied | 60 (44.1%) | $68,750 |
| Renter-Occupied | 76 (55.9%) | $62,500 |
| Average | 136 (100.0%) | $68,214 |
Occupancy by Householder Income Bracket in New Odanah
| Income Bracket | Owner-occupied | Renter-occupied |
| Less than $5,000 | 0 (0.0%) | 0 (0.0%) |
| $5,000 to $9,999 | 0 (0.0%) | 0 (0.0%) |
| $10,000 to $14,999 | 7 (11.7%) | 3 (4.0%) |
| $15,000 to $19,999 | 5 (8.3%) | 0 (0.0%) |
| $20,000 to $24,999 | 0 (0.0%) | 7 (9.2%) |
| $25,000 to $34,999 | 4 (6.7%) | 5 (6.6%) |
| $35,000 to $49,999 | 10 (16.7%) | 19 (25.0%) |
| $50,000 to $74,999 | 19 (31.7%) | 24 (31.6%) |
| $75,000 to $99,999 | 0 (0.0%) | 0 (0.0%) |
| $100,000 to $149,999 | 15 (25.0%) | 10 (13.2%) |
| $150,000 or more | 0 (0.0%) | 8 (10.5%) |
| Total | 60 (100.0%) | 76 (100.0%) |
Monthly Housing Cost Tiers in New Odanah
| Monthly Cost | Owner-occupied | Renter-occupied |
| Less than $300 | 20 (33.3%) | 26 (34.2%) |
| $300 to $499 | 13 (21.7%) | 17 (22.4%) |
| $500 to $799 | 11 (18.3%) | 10 (13.2%) |
| $800 to $999 | 0 (0.0%) | 6 (7.9%) |
| $1,000 to $1,499 | 16 (26.7%) | 0 (0.0%) |
| $1,500 to $1,999 | 0 (0.0%) | 6 (7.9%) |
| $2,000 to $2,499 | 0 (0.0%) | 0 (0.0%) |
| $2,500 to $2,999 | 0 (0.0%) | 0 (0.0%) |
| $3,000 or more | 0 (0.0%) | 0 (0.0%) |
| Total | 60 (100.0%) | 76 (100.0%) |
Physical Housing Characteristics in New Odanah
Housing Structures in New Odanah
| Structure Type | # Housing Units | % Housing Units |
| Single Unit, Detached | 80 | 58.8% |
| Single Unit, Attached | 16 | 11.8% |
| 2 Unit Apartments | 7 | 5.1% |
| 3 or 4 Unit Apartments | 0 | 0.0% |
| 5 to 9 Unit Apartments | 6 | 4.4% |
| 10 or more Apartments | 13 | 9.6% |
| Mobile Home / Other | 14 | 10.3% |
| Total | 136 | 100.0% |
Housing Structures by Occupancy in New Odanah
| Structure Type | Owner-occupied | Renter-occupied |
| Single Unit, Detached | 46 (57.5%) | 34 (42.5%) |
| Single Unit, Attached | 0 (0.0%) | 16 (100.0%) |
| 2 Unit Apartments | 0 (0.0%) | 7 (100.0%) |
| 3 or 4 Unit Apartments | 0 (0.0%) | 0 (0.0%) |
| 5 to 9 Unit Apartments | 0 (0.0%) | 6 (100.0%) |
| 10 or more Apartments | 0 (0.0%) | 13 (100.0%) |
| Mobile Home / Other | 14 (100.0%) | 0 (0.0%) |
| Total | 60 (44.1%) | 76 (55.9%) |
Housing Structures by Number of Rooms in New Odanah
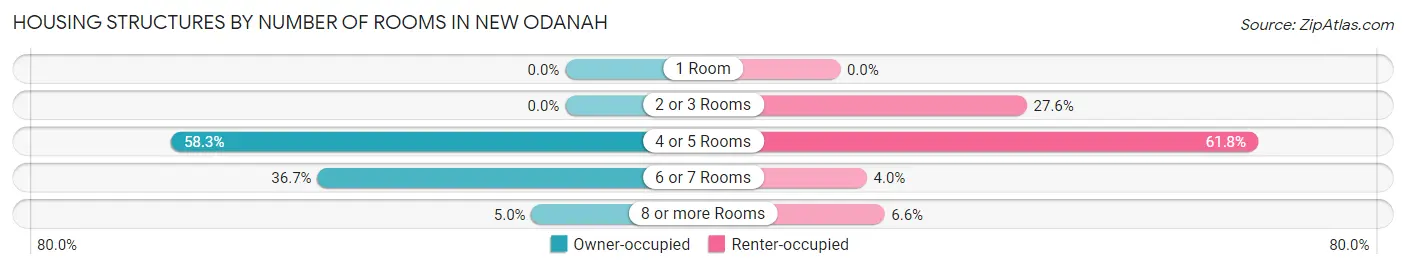
| Number of Rooms | Owner-occupied | Renter-occupied |
| 1 Room | 0 (0.0%) | 0 (0.0%) |
| 2 or 3 Rooms | 0 (0.0%) | 21 (27.6%) |
| 4 or 5 Rooms | 35 (58.3%) | 47 (61.8%) |
| 6 or 7 Rooms | 22 (36.7%) | 3 (4.0%) |
| 8 or more Rooms | 3 (5.0%) | 5 (6.6%) |
| Total | 60 (100.0%) | 76 (100.0%) |
Housing Structure by Heating Type in New Odanah
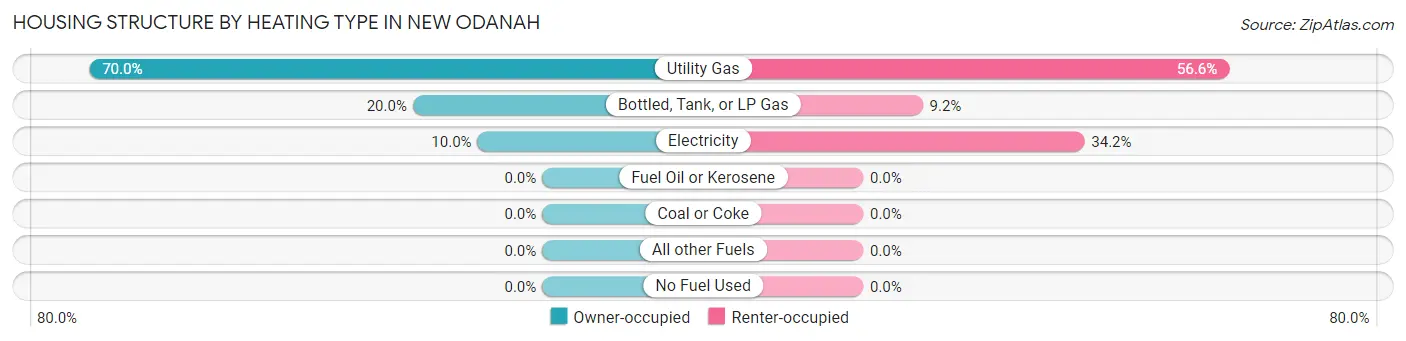
| Heating Type | Owner-occupied | Renter-occupied |
| Utility Gas | 42 (70.0%) | 43 (56.6%) |
| Bottled, Tank, or LP Gas | 12 (20.0%) | 7 (9.2%) |
| Electricity | 6 (10.0%) | 26 (34.2%) |
| Fuel Oil or Kerosene | 0 (0.0%) | 0 (0.0%) |
| Coal or Coke | 0 (0.0%) | 0 (0.0%) |
| All other Fuels | 0 (0.0%) | 0 (0.0%) |
| No Fuel Used | 0 (0.0%) | 0 (0.0%) |
| Total | 60 (100.0%) | 76 (100.0%) |
Household Vehicle Usage in New Odanah
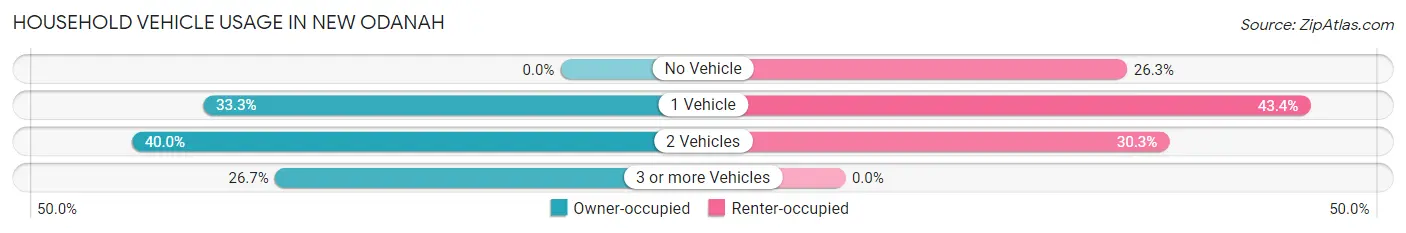
| Vehicles per Household | Owner-occupied | Renter-occupied |
| No Vehicle | 0 (0.0%) | 20 (26.3%) |
| 1 Vehicle | 20 (33.3%) | 33 (43.4%) |
| 2 Vehicles | 24 (40.0%) | 23 (30.3%) |
| 3 or more Vehicles | 16 (26.7%) | 0 (0.0%) |
| Total | 60 (100.0%) | 76 (100.0%) |
Real Estate & Mortgages in New Odanah
Real Estate and Mortgage Overview in New Odanah
| Characteristic | Without Mortgage | With Mortgage |
| Housing Units | 37 | 23 |
| Median Property Value | $75,000 | $0 |
| Median Household Income | $45,625 | $0 |
| Monthly Housing Costs | $281 | $0 |
| Real Estate Taxes | - | - |
Property Value by Mortgage Status in New Odanah
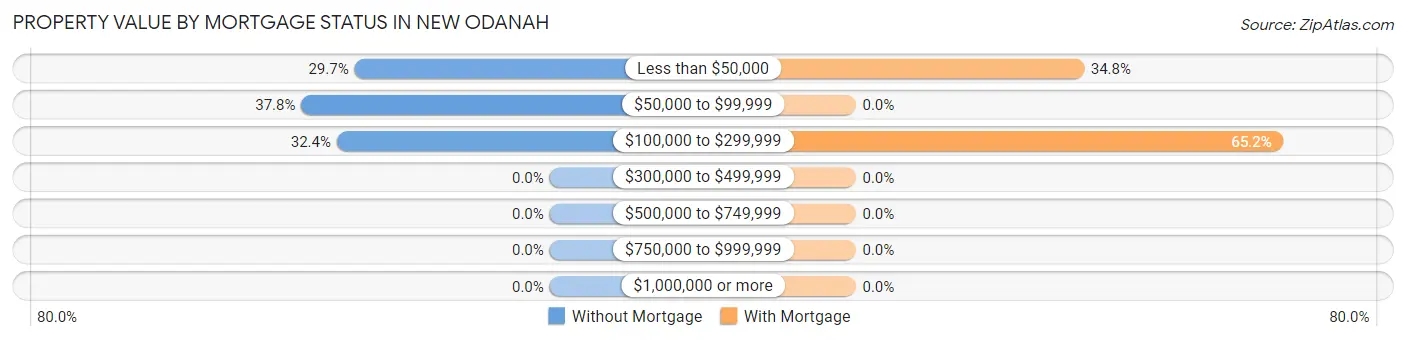
| Property Value | Without Mortgage | With Mortgage |
| Less than $50,000 | 11 (29.7%) | 8 (34.8%) |
| $50,000 to $99,999 | 14 (37.8%) | 0 (0.0%) |
| $100,000 to $299,999 | 12 (32.4%) | 15 (65.2%) |
| $300,000 to $499,999 | 0 (0.0%) | 0 (0.0%) |
| $500,000 to $749,999 | 0 (0.0%) | 0 (0.0%) |
| $750,000 to $999,999 | 0 (0.0%) | 0 (0.0%) |
| $1,000,000 or more | 0 (0.0%) | 0 (0.0%) |
| Total | 37 (100.0%) | 23 (100.0%) |
Household Income by Mortgage Status in New Odanah
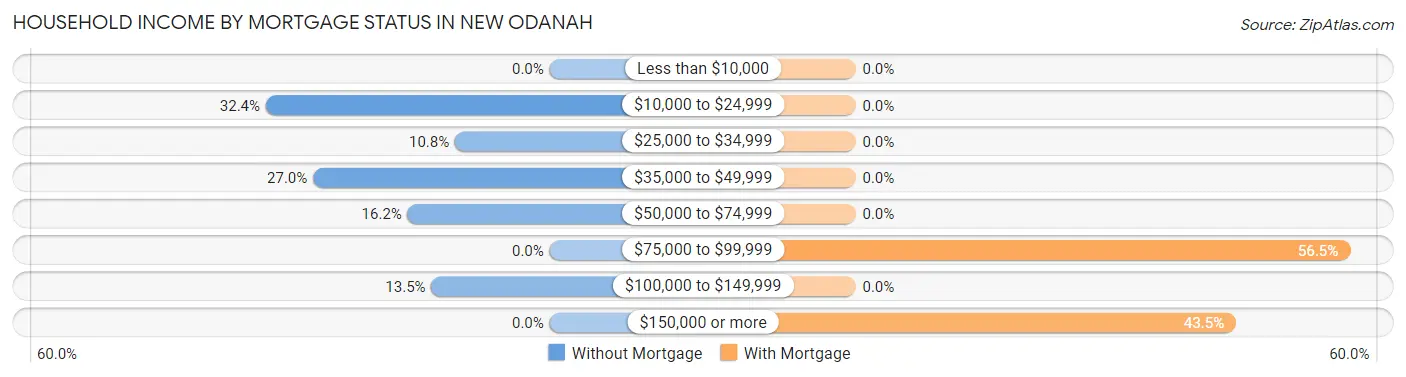
| Household Income | Without Mortgage | With Mortgage |
| Less than $10,000 | 0 (0.0%) | 0 (0.0%) |
| $10,000 to $24,999 | 12 (32.4%) | 0 (0.0%) |
| $25,000 to $34,999 | 4 (10.8%) | 0 (0.0%) |
| $35,000 to $49,999 | 10 (27.0%) | 0 (0.0%) |
| $50,000 to $74,999 | 6 (16.2%) | 0 (0.0%) |
| $75,000 to $99,999 | 0 (0.0%) | 13 (56.5%) |
| $100,000 to $149,999 | 5 (13.5%) | 0 (0.0%) |
| $150,000 or more | 0 (0.0%) | 10 (43.5%) |
| Total | 37 (100.0%) | 23 (100.0%) |
Property Value to Household Income Ratio in New Odanah
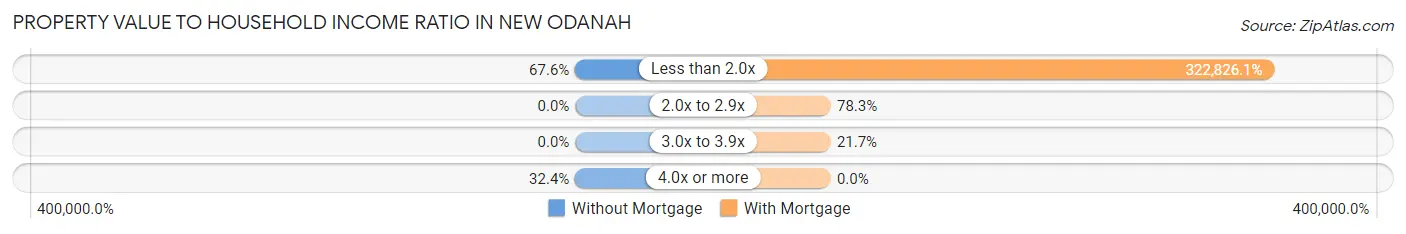
| Value-to-Income Ratio | Without Mortgage | With Mortgage |
| Less than 2.0x | 25 (67.6%) | 74,250 (322,826.1%) |
| 2.0x to 2.9x | 0 (0.0%) | 18 (78.3%) |
| 3.0x to 3.9x | 0 (0.0%) | 5 (21.7%) |
| 4.0x or more | 12 (32.4%) | 0 (0.0%) |
| Total | 37 (100.0%) | 23 (100.0%) |
Real Estate Taxes by Mortgage Status in New Odanah
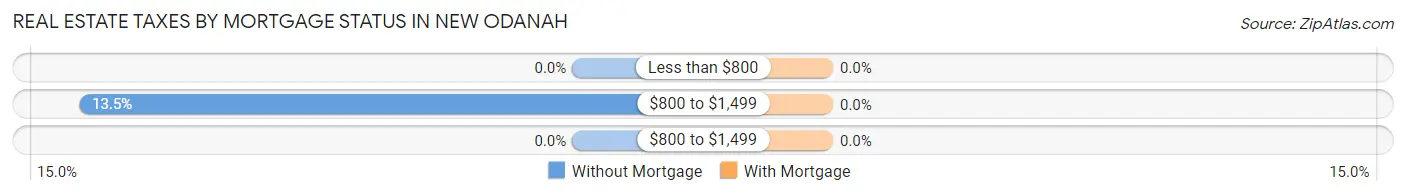
| Property Taxes | Without Mortgage | With Mortgage |
| Less than $800 | 0 (0.0%) | 0 (0.0%) |
| $800 to $1,499 | 5 (13.5%) | 0 (0.0%) |
| $800 to $1,499 | 0 (0.0%) | 0 (0.0%) |
| Total | 37 (100.0%) | 23 (100.0%) |
Health & Disability in New Odanah
Health Insurance Coverage by Age in New Odanah
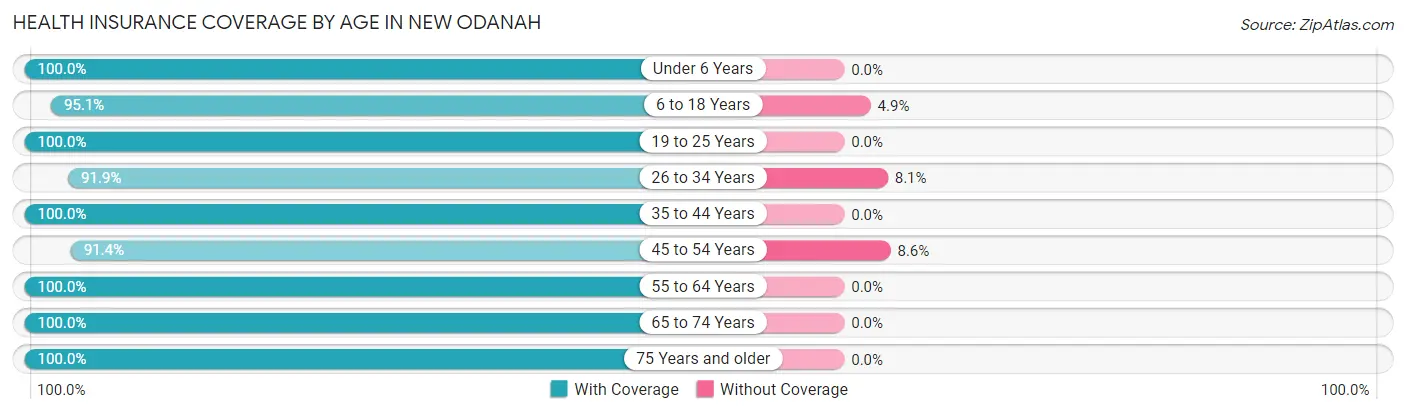
| Age Bracket | With Coverage | Without Coverage |
| Under 6 Years | 29 (100.0%) | 0 (0.0%) |
| 6 to 18 Years | 58 (95.1%) | 3 (4.9%) |
| 19 to 25 Years | 17 (100.0%) | 0 (0.0%) |
| 26 to 34 Years | 34 (91.9%) | 3 (8.1%) |
| 35 to 44 Years | 50 (100.0%) | 0 (0.0%) |
| 45 to 54 Years | 53 (91.4%) | 5 (8.6%) |
| 55 to 64 Years | 53 (100.0%) | 0 (0.0%) |
| 65 to 74 Years | 47 (100.0%) | 0 (0.0%) |
| 75 Years and older | 10 (100.0%) | 0 (0.0%) |
| Total | 351 (97.0%) | 11 (3.0%) |
Health Insurance Coverage by Citizenship Status in New Odanah
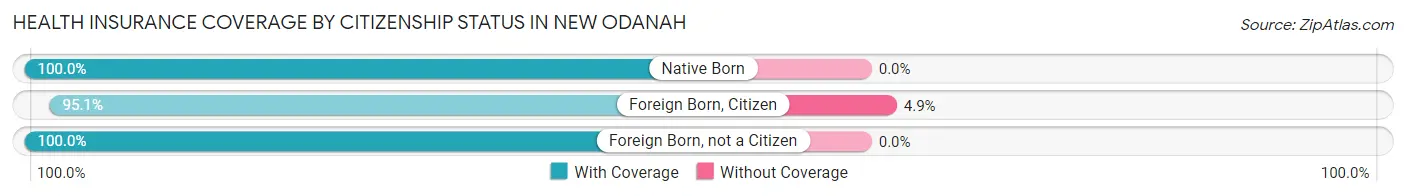
| Citizenship Status | With Coverage | Without Coverage |
| Native Born | 29 (100.0%) | 0 (0.0%) |
| Foreign Born, Citizen | 58 (95.1%) | 3 (4.9%) |
| Foreign Born, not a Citizen | 17 (100.0%) | 0 (0.0%) |
Health Insurance Coverage by Household Income in New Odanah
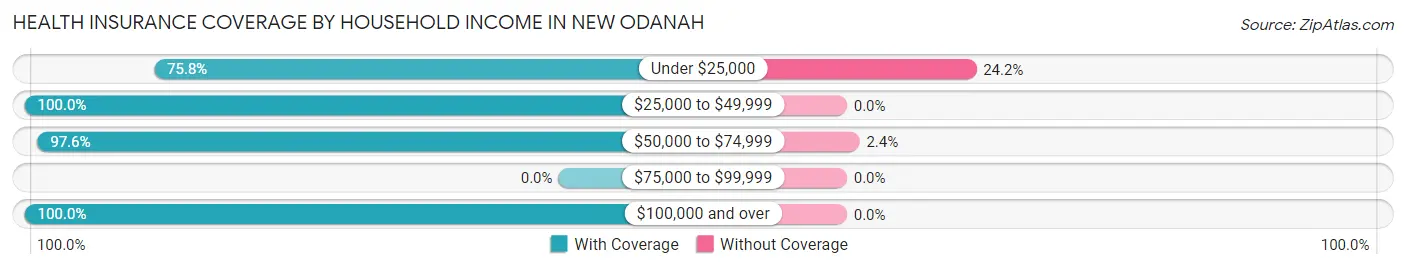
| Household Income | With Coverage | Without Coverage |
| Under $25,000 | 25 (75.8%) | 8 (24.2%) |
| $25,000 to $49,999 | 93 (100.0%) | 0 (0.0%) |
| $50,000 to $74,999 | 123 (97.6%) | 3 (2.4%) |
| $75,000 to $99,999 | 0 (0.0%) | 0 (0.0%) |
| $100,000 and over | 110 (100.0%) | 0 (0.0%) |
Public vs Private Health Insurance Coverage by Age in New Odanah
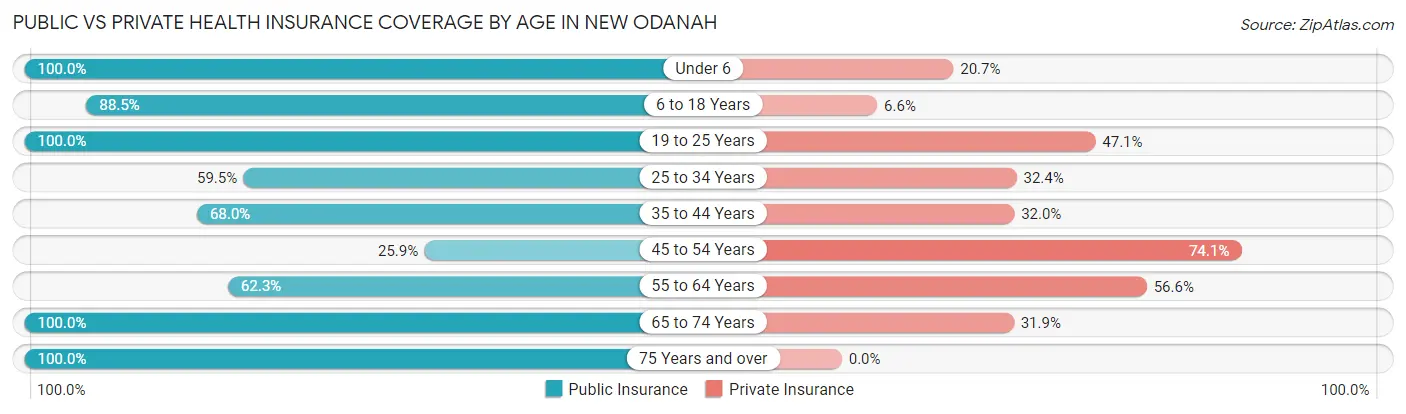
| Age Bracket | Public Insurance | Private Insurance |
| Under 6 | 29 (100.0%) | 6 (20.7%) |
| 6 to 18 Years | 54 (88.5%) | 4 (6.6%) |
| 19 to 25 Years | 17 (100.0%) | 8 (47.1%) |
| 25 to 34 Years | 22 (59.5%) | 12 (32.4%) |
| 35 to 44 Years | 34 (68.0%) | 16 (32.0%) |
| 45 to 54 Years | 15 (25.9%) | 43 (74.1%) |
| 55 to 64 Years | 33 (62.3%) | 30 (56.6%) |
| 65 to 74 Years | 47 (100.0%) | 15 (31.9%) |
| 75 Years and over | 10 (100.0%) | 0 (0.0%) |
| Total | 261 (72.1%) | 134 (37.0%) |
Disability Status by Sex by Age in New Odanah
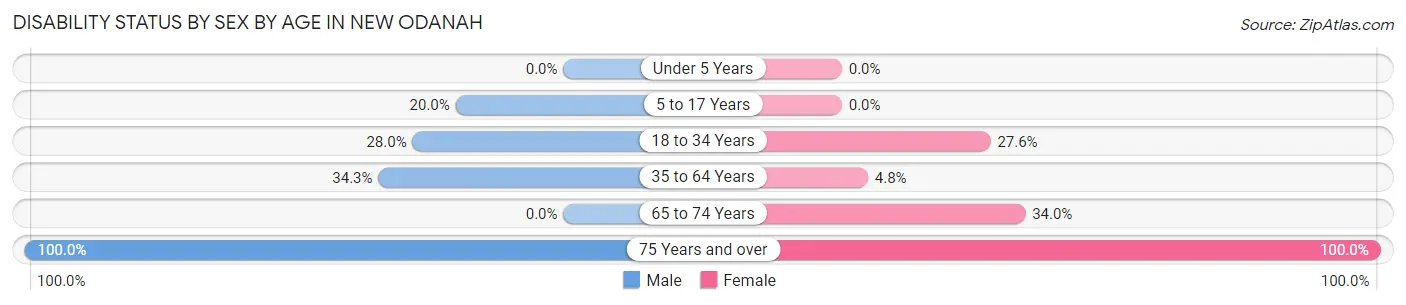
| Age Bracket | Male | Female |
| Under 5 Years | 0 (0.0%) | 0 (0.0%) |
| 5 to 17 Years | 6 (20.0%) | 0 (0.0%) |
| 18 to 34 Years | 7 (28.0%) | 8 (27.6%) |
| 35 to 64 Years | 34 (34.3%) | 3 (4.8%) |
| 65 to 74 Years | 0 (0.0%) | 16 (34.0%) |
| 75 Years and over | 7 (100.0%) | 3 (100.0%) |
Disability Class by Sex by Age in New Odanah
Disability Class: Hearing Difficulty
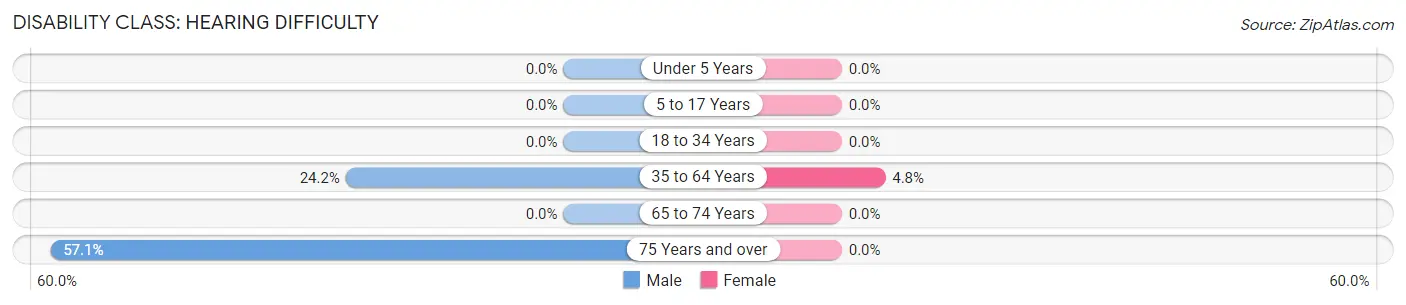
| Age Bracket | Male | Female |
| Under 5 Years | 0 (0.0%) | 0 (0.0%) |
| 5 to 17 Years | 0 (0.0%) | 0 (0.0%) |
| 18 to 34 Years | 0 (0.0%) | 0 (0.0%) |
| 35 to 64 Years | 24 (24.2%) | 3 (4.8%) |
| 65 to 74 Years | 0 (0.0%) | 0 (0.0%) |
| 75 Years and over | 4 (57.1%) | 0 (0.0%) |
Disability Class: Vision Difficulty
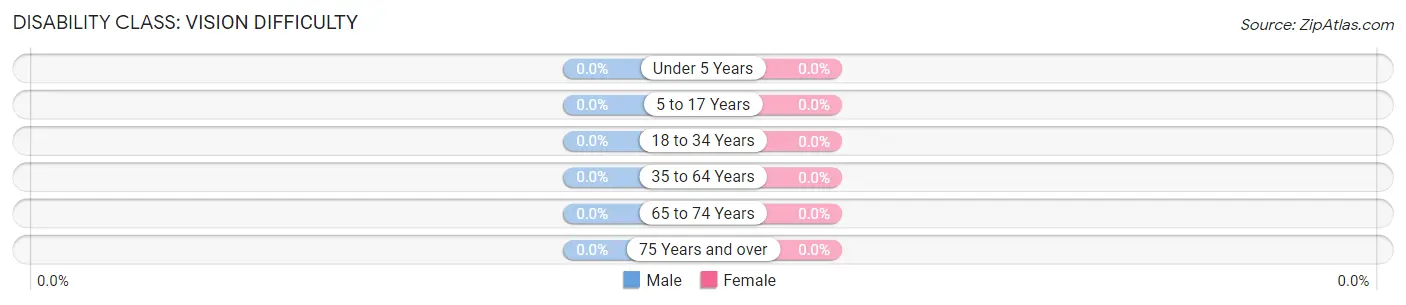
| Age Bracket | Male | Female |
| Under 5 Years | 0 (0.0%) | 0 (0.0%) |
| 5 to 17 Years | 0 (0.0%) | 0 (0.0%) |
| 18 to 34 Years | 0 (0.0%) | 0 (0.0%) |
| 35 to 64 Years | 0 (0.0%) | 0 (0.0%) |
| 65 to 74 Years | 0 (0.0%) | 0 (0.0%) |
| 75 Years and over | 0 (0.0%) | 0 (0.0%) |
Disability Class: Cognitive Difficulty
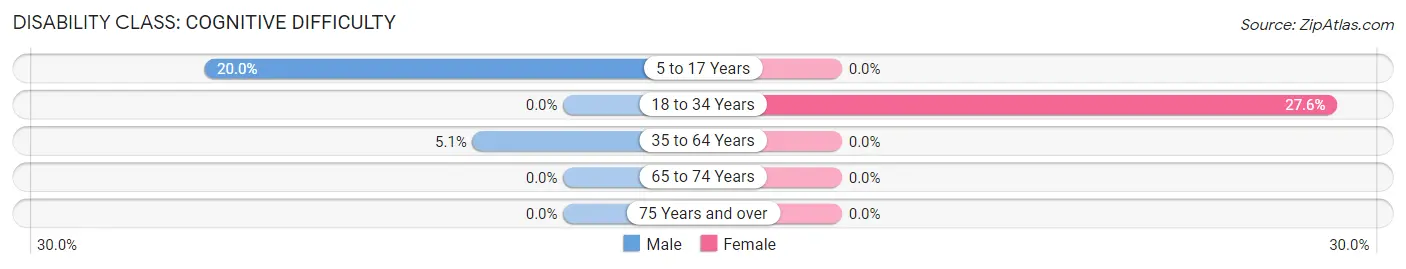
| Age Bracket | Male | Female |
| 5 to 17 Years | 6 (20.0%) | 0 (0.0%) |
| 18 to 34 Years | 0 (0.0%) | 8 (27.6%) |
| 35 to 64 Years | 5 (5.1%) | 0 (0.0%) |
| 65 to 74 Years | 0 (0.0%) | 0 (0.0%) |
| 75 Years and over | 0 (0.0%) | 0 (0.0%) |
Disability Class: Ambulatory Difficulty
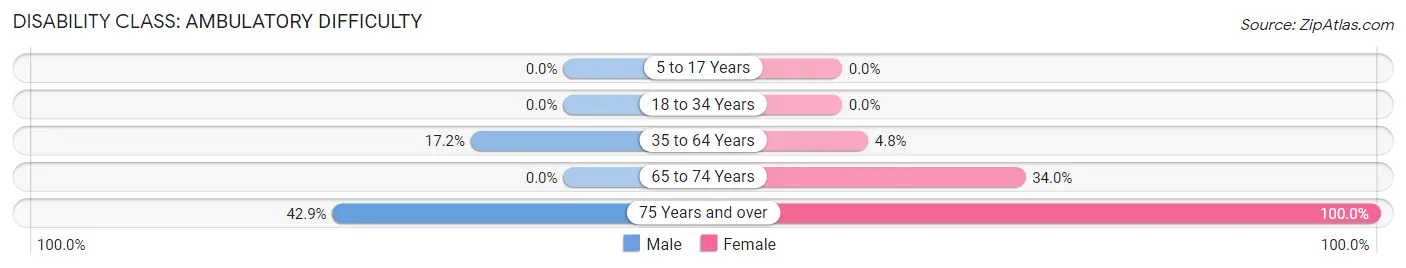
| Age Bracket | Male | Female |
| 5 to 17 Years | 0 (0.0%) | 0 (0.0%) |
| 18 to 34 Years | 0 (0.0%) | 0 (0.0%) |
| 35 to 64 Years | 17 (17.2%) | 3 (4.8%) |
| 65 to 74 Years | 0 (0.0%) | 16 (34.0%) |
| 75 Years and over | 3 (42.9%) | 3 (100.0%) |
Disability Class: Self-Care Difficulty
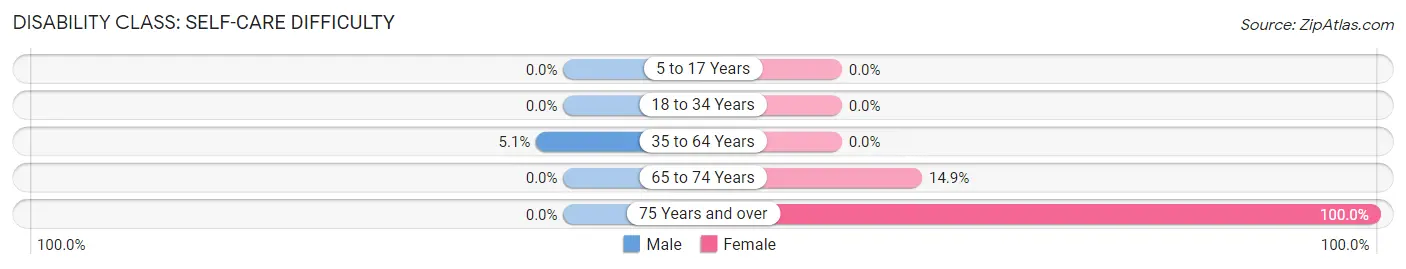
| Age Bracket | Male | Female |
| 5 to 17 Years | 0 (0.0%) | 0 (0.0%) |
| 18 to 34 Years | 0 (0.0%) | 0 (0.0%) |
| 35 to 64 Years | 5 (5.1%) | 0 (0.0%) |
| 65 to 74 Years | 0 (0.0%) | 7 (14.9%) |
| 75 Years and over | 0 (0.0%) | 3 (100.0%) |
Technology Access in New Odanah
Computing Device Access in New Odanah
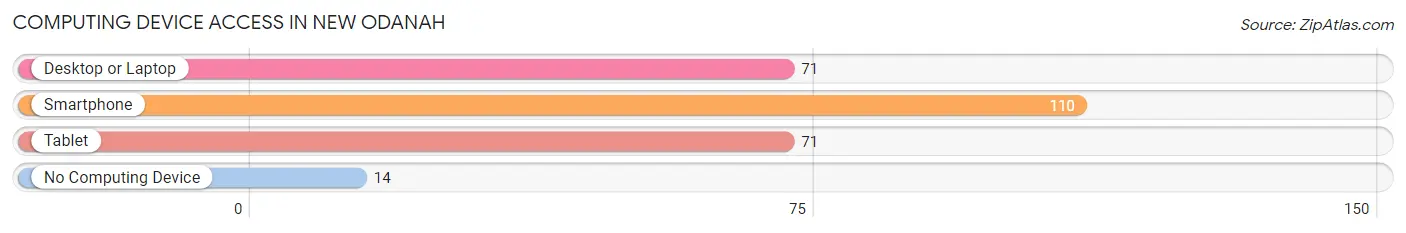
| Device Type | # Households | % Households |
| Desktop or Laptop | 71 | 52.2% |
| Smartphone | 110 | 80.9% |
| Tablet | 71 | 52.2% |
| No Computing Device | 14 | 10.3% |
| Total | 136 | 100.0% |
Internet Access in New Odanah
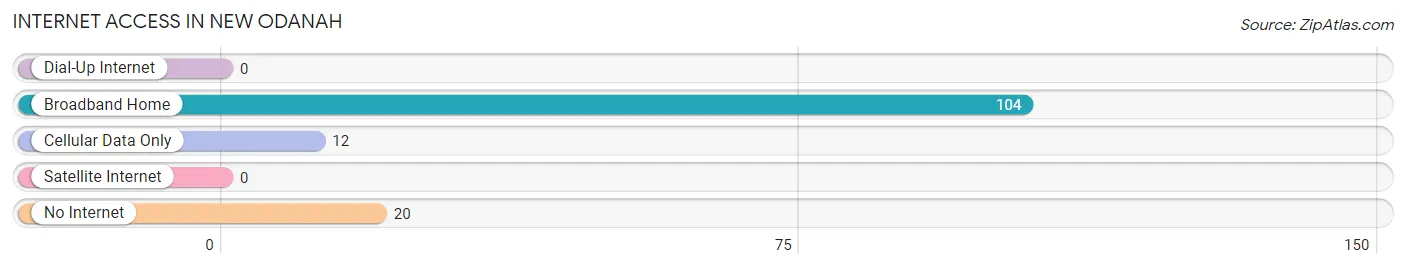
| Internet Type | # Households | % Households |
| Dial-Up Internet | 0 | 0.0% |
| Broadband Home | 104 | 76.5% |
| Cellular Data Only | 12 | 8.8% |
| Satellite Internet | 0 | 0.0% |
| No Internet | 20 | 14.7% |
| Total | 136 | 100.0% |
New Odanah Summary
Odanah is a small unincorporated community located in Ashland County, Wisconsin, United States. It is situated on the Bad River Indian Reservation, which is home to the Bad River Band of the Lake Superior Chippewa Tribe. The population of Odanah was estimated to be around 200 in 2000.
History
The area that is now Odanah was originally inhabited by the Ojibwe people, who had lived in the area for centuries before the arrival of European settlers. The Ojibwe were forced to cede much of their land to the United States government in the 19th century, and the Bad River Reservation was established in 1854. The town of Odanah was founded in 1876, and was named after the Ojibwe word for “town”.
The town was originally a trading post, and it quickly became a hub for the local Ojibwe people. In the late 19th century, the town was home to a number of businesses, including a hotel, a general store, a blacksmith, and a sawmill. The town also had a post office, which opened in 1877.
In the early 20th century, the town began to decline as the local economy shifted away from the lumber industry. The town’s population decreased, and by the 1950s, the town was largely abandoned. In the late 20th century, the town began to experience a resurgence as the Bad River Band of the Lake Superior Chippewa Tribe began to invest in the area.
Geography
Odanah is located in Ashland County, Wisconsin, in the northwest corner of the state. It is situated on the Bad River Indian Reservation, which is home to the Bad River Band of the Lake Superior Chippewa Tribe. The town is located on the south shore of Lake Superior, and is surrounded by forests and wetlands.
The town is located near the Bad River, which flows through the reservation and into Lake Superior. The town is also located near the Kakagon Sloughs, a wetland area that is home to a variety of wildlife.
Economy
The economy of Odanah is largely based on tourism and the service industry. The town is home to a number of businesses, including restaurants, hotels, and retail stores. The town is also home to a casino, which is owned and operated by the Bad River Band of the Lake Superior Chippewa Tribe.
The town is also home to a number of manufacturing businesses, including a wood products company and a metal fabrication company. The town is also home to a number of small businesses, including a grocery store, a hardware store, and a gas station.
Demographics
The population of Odanah was estimated to be around 200 in 2000. The town is predominantly Native American, with the majority of the population being members of the Bad River Band of the Lake Superior Chippewa Tribe. The town also has a small population of non-Native Americans, including African Americans, Hispanics, and Asians.
The town has a median household income of $25,000, and the poverty rate is around 40%. The town has a high rate of unemployment, with around 25% of the population being unemployed. The town also has a high rate of crime, with the majority of the crime being property-related.
Common Questions
What is the Total Population of New Odanah?
Total Population of New Odanah is 362.
What is the Total Male Population of New Odanah?
Total Male Population of New Odanah is 178.
What is the Total Female Population of New Odanah?
Total Female Population of New Odanah is 184.
What is the Ratio of Males per 100 Females in New Odanah?
There are 96.74 Males per 100 Females in New Odanah.
What is the Ratio of Females per 100 Males in New Odanah?
There are 103.37 Females per 100 Males in New Odanah.
What is the Median Population Age in New Odanah?
Median Population Age in New Odanah is 43.6 Years.
What is the Average Family Size in New Odanah
Average Family Size in New Odanah is 2.9 People.
What is the Average Household Size in New Odanah
Average Household Size in New Odanah is 2.7 People.
What is Per Capita Income in New Odanah?
Per Capita income in New Odanah is $25,395.
What is the Median Family Income in New Odanah?
Median Family Income in New Odanah is $68,571.
What is the Median Household income in New Odanah?
Median Household Income in New Odanah is $68,214.
What is Income or Wage Gap in New Odanah?
Income or Wage Gap in New Odanah is 9.4%.
Women in New Odanah earn 90.6 cents for every dollar earned by a man.
What is Inequality or Gini Index in New Odanah?
Inequality or Gini Index in New Odanah is 0.35.
How Large is the Labor Force in New Odanah?
There are 207 People in the Labor Forcein in New Odanah.
What is the Percentage of People in the Labor Force in New Odanah?
72.6% of People are in the Labor Force in New Odanah.
What is the Unemployment Rate in New Odanah?
Unemployment Rate in New Odanah is 13.0%.