Marquette, WI
Marquette Map
Marquette Overview
357
TOTAL POPULATION
188
MALE POPULATION
169
FEMALE POPULATION
111.24
MALES / 100 FEMALES
89.89
FEMALES / 100 MALES
37.5
MEDIAN AGE
3.8
AVG FAMILY SIZE
2.9
AVG HOUSEHOLD SIZE
$29,354
PER CAPITA INCOME
$58,393
AVG FAMILY INCOME
$47,750
AVG HOUSEHOLD INCOME
36.5%
WAGE / INCOME GAP [ % ]
63.5¢/ $1
WAGE / INCOME GAP [ $ ]
0.68
INEQUALITY / GINI INDEX
96
LABOR FORCE [ PEOPLE ]
42.9%
PERCENT IN LABOR FORCE
6.3%
UNEMPLOYMENT RATE
Marquette Zip Codes
Marquette Area Codes
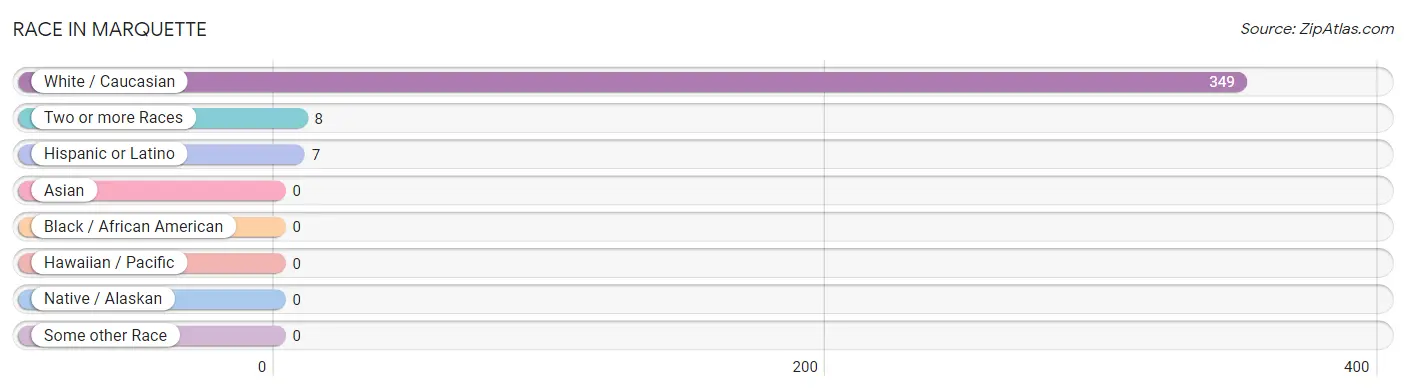
Race in Marquette
The most populous races in Marquette are White / Caucasian (349 | 97.8%), Two or more Races (8 | 2.2%), and Hispanic or Latino (7 | 2.0%).
| Race | # Population | % Population |
| Asian | 0 | 0.0% |
| Black / African American | 0 | 0.0% |
| Hawaiian / Pacific | 0 | 0.0% |
| Hispanic or Latino | 7 | 2.0% |
| Native / Alaskan | 0 | 0.0% |
| White / Caucasian | 349 | 97.8% |
| Two or more Races | 8 | 2.2% |
| Some other Race | 0 | 0.0% |
| Total | 357 | 100.0% |
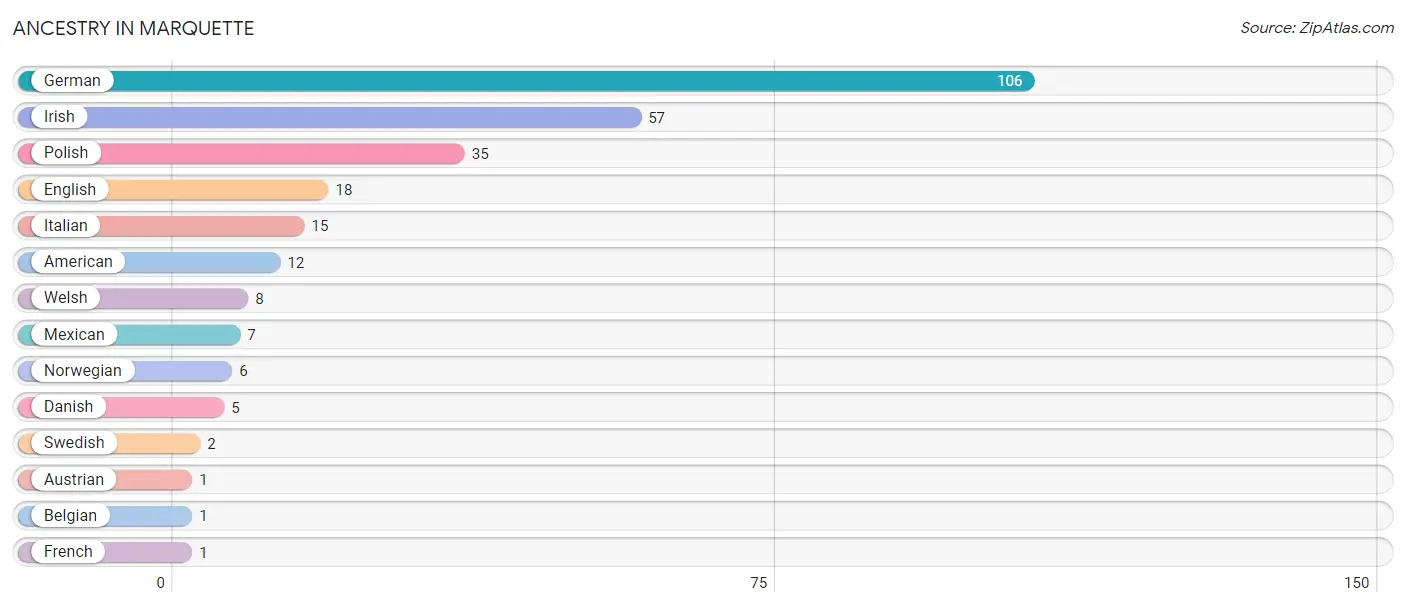
Ancestry in Marquette
The most populous ancestries reported in Marquette are German (106 | 29.7%), Irish (57 | 16.0%), Polish (35 | 9.8%), English (18 | 5.0%), and Italian (15 | 4.2%), together accounting for 64.7% of all Marquette residents.
| Ancestry | # Population | % Population |
| American | 12 | 3.4% |
| Austrian | 1 | 0.3% |
| Belgian | 1 | 0.3% |
| Danish | 5 | 1.4% |
| English | 18 | 5.0% |
| French | 1 | 0.3% |
| German | 106 | 29.7% |
| Irish | 57 | 16.0% |
| Italian | 15 | 4.2% |
| Mexican | 7 | 2.0% |
| Norwegian | 6 | 1.7% |
| Polish | 35 | 9.8% |
| Swedish | 2 | 0.6% |
| Welsh | 8 | 2.2% | View All 14 Rows |
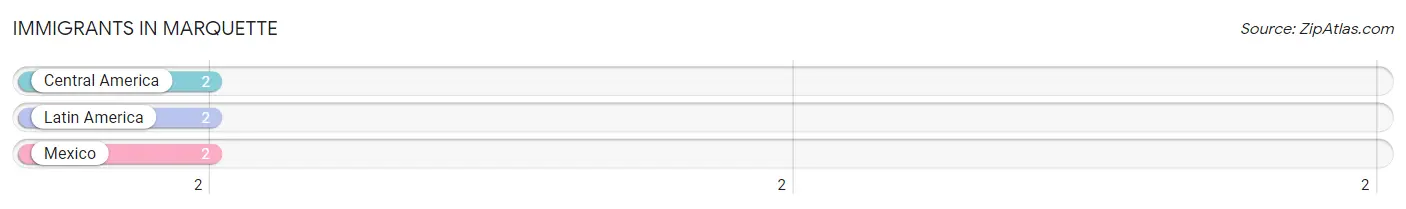
Immigrants in Marquette
The most numerous immigrant groups reported in Marquette came from Central America (2 | 0.6%), Latin America (2 | 0.6%), and Mexico (2 | 0.6%), together accounting for 1.7% of all Marquette residents.
| Immigration Origin | # Population | % Population |
| Central America | 2 | 0.6% |
| Latin America | 2 | 0.6% |
| Mexico | 2 | 0.6% | View All 3 Rows |
Sex and Age in Marquette
Sex and Age in Marquette
The most populous age groups in Marquette are 5 to 9 Years (39 | 20.7%) for men and Under 5 Years (37 | 21.9%) for women.
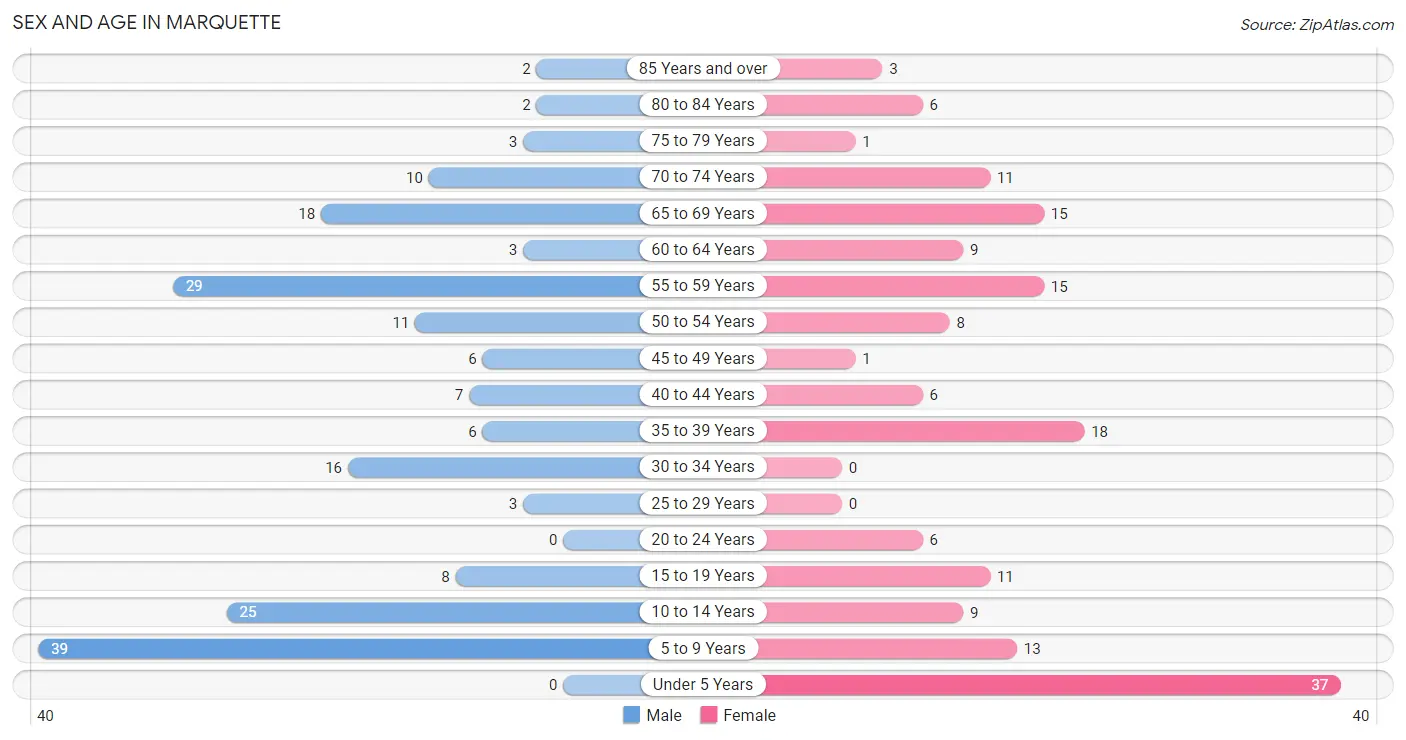
| Age Bracket | Male | Female |
| Under 5 Years | 0 (0.0%) | 37 (21.9%) |
| 5 to 9 Years | 39 (20.7%) | 13 (7.7%) |
| 10 to 14 Years | 25 (13.3%) | 9 (5.3%) |
| 15 to 19 Years | 8 (4.3%) | 11 (6.5%) |
| 20 to 24 Years | 0 (0.0%) | 6 (3.5%) |
| 25 to 29 Years | 3 (1.6%) | 0 (0.0%) |
| 30 to 34 Years | 16 (8.5%) | 0 (0.0%) |
| 35 to 39 Years | 6 (3.2%) | 18 (10.6%) |
| 40 to 44 Years | 7 (3.7%) | 6 (3.5%) |
| 45 to 49 Years | 6 (3.2%) | 1 (0.6%) |
| 50 to 54 Years | 11 (5.9%) | 8 (4.7%) |
| 55 to 59 Years | 29 (15.4%) | 15 (8.9%) |
| 60 to 64 Years | 3 (1.6%) | 9 (5.3%) |
| 65 to 69 Years | 18 (9.6%) | 15 (8.9%) |
| 70 to 74 Years | 10 (5.3%) | 11 (6.5%) |
| 75 to 79 Years | 3 (1.6%) | 1 (0.6%) |
| 80 to 84 Years | 2 (1.1%) | 6 (3.5%) |
| 85 Years and over | 2 (1.1%) | 3 (1.8%) |
| Total | 188 (100.0%) | 169 (100.0%) |
Families and Households in Marquette
Median Family Size in Marquette
The median family size in Marquette is 3.80 persons per family, with married-couple families (66 | 81.5%) accounting for the largest median family size of 3.97 persons per family. On the other hand, single male/father families (6 | 7.4%) represent the smallest median family size with 2.17 persons per family.
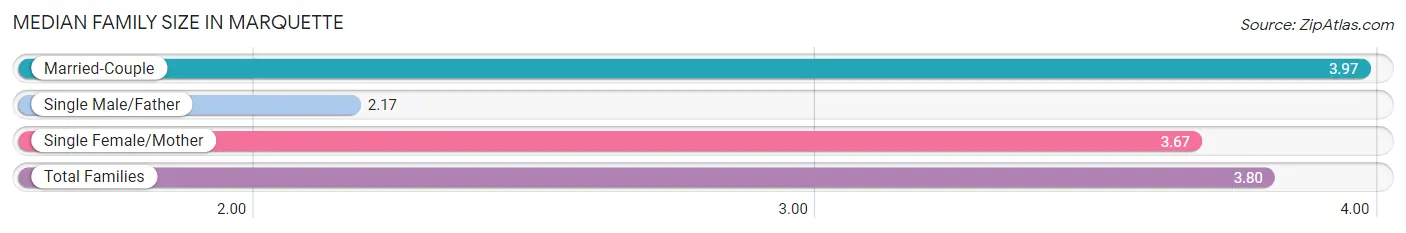
| Family Type | # Families | Family Size |
| Married-Couple | 66 (81.5%) | 3.97 |
| Single Male/Father | 6 (7.4%) | 2.17 |
| Single Female/Mother | 9 (11.1%) | 3.67 |
| Total Families | 81 (100.0%) | 3.80 |
Median Household Size in Marquette
The median household size in Marquette is 2.86 persons per household, with married-couple households (66 | 52.8%) accounting for the largest median household size of 4 persons per household. non-family households (44 | 35.2%) represent the smallest median household size with 1.05 persons per household.
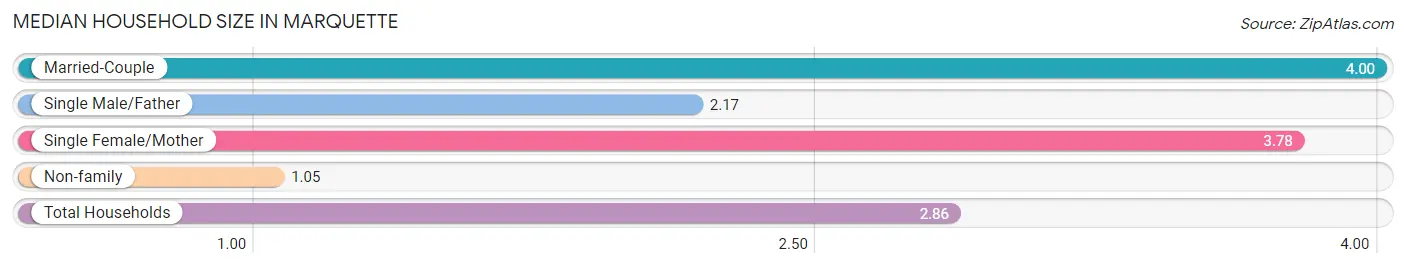
| Household Type | # Households | Household Size |
| Married-Couple | 66 (52.8%) | 4.00 |
| Single Male/Father | 6 (4.8%) | 2.17 |
| Single Female/Mother | 9 (7.2%) | 3.78 |
| Non-family | 44 (35.2%) | 1.05 |
| Total Households | 125 (100.0%) | 2.86 |
Household Size by Marriage Status in Marquette
Out of a total of 125 households in Marquette, 81 (64.8%) are family households, while 44 (35.2%) are nonfamily households. The most numerous type of family households are 2-person households, comprising 41, and the most common type of nonfamily households are 1-person households, comprising 40.
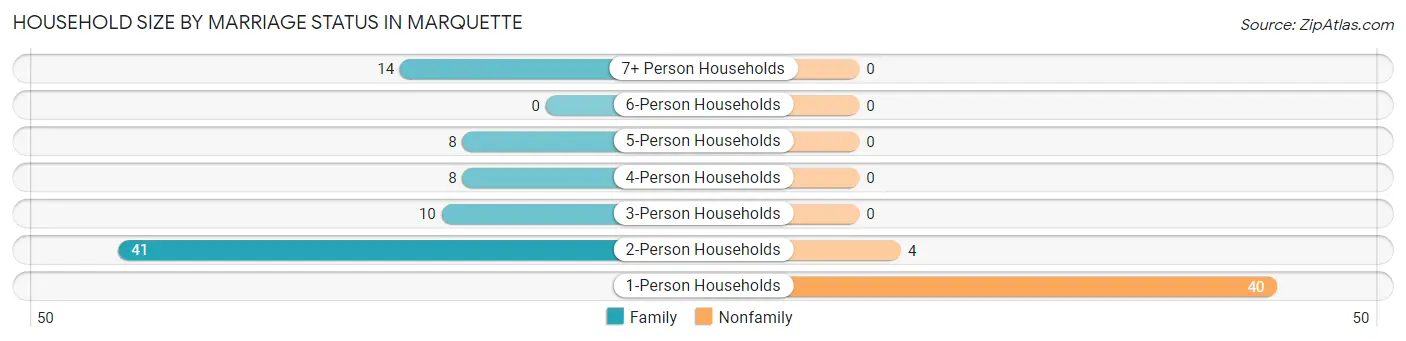
| Household Size | Family Households | Nonfamily Households |
| 1-Person Households | - | 40 (32.0%) |
| 2-Person Households | 41 (32.8%) | 4 (3.2%) |
| 3-Person Households | 10 (8.0%) | 0 (0.0%) |
| 4-Person Households | 8 (6.4%) | 0 (0.0%) |
| 5-Person Households | 8 (6.4%) | 0 (0.0%) |
| 6-Person Households | 0 (0.0%) | 0 (0.0%) |
| 7+ Person Households | 14 (11.2%) | 0 (0.0%) |
| Total | 81 (64.8%) | 44 (35.2%) |
Female Fertility in Marquette
Fertility by Age in Marquette
| Age Bracket | Women with Births | Births / 1,000 Women |
| 15 to 19 years | 0 (0.0%) | 0.0 |
| 20 to 34 years | 0 (0.0%) | 0.0 |
| 35 to 50 years | 0 (0.0%) | 0.0 |
| Total | 0 (0.0%) | 0.0 |
Fertility by Age by Marriage Status in Marquette
| Age Bracket | Married | Unmarried |
| 15 to 19 years | 0 (0.0%) | 0 (0.0%) |
| 20 to 34 years | 0 (0.0%) | 0 (0.0%) |
| 35 to 50 years | 0 (0.0%) | 0 (0.0%) |
| Total | 0 (0.0%) | 0 (0.0%) |
Fertility by Education in Marquette
| Educational Attainment | Women with Births | Births / 1,000 Women |
| Less than High School | 0 (0.0%) | 0.0 |
| High School Diploma | 0 (0.0%) | 0.0 |
| College or Associate's Degree | 0 (0.0%) | 0.0 |
| Bachelor's Degree | 0 (0.0%) | 0.0 |
| Graduate Degree | 0 (0.0%) | 0.0 |
| Total | 0 (0.0%) | 0.0 |
Fertility by Education by Marriage Status in Marquette
| Educational Attainment | Married | Unmarried |
| Less than High School | 0 (0.0%) | 0 (0.0%) |
| High School Diploma | 0 (0.0%) | 0 (0.0%) |
| College or Associate's Degree | 0 (0.0%) | 0 (0.0%) |
| Bachelor's Degree | 0 (0.0%) | 0 (0.0%) |
| Graduate Degree | 0 (0.0%) | 0 (0.0%) |
| Total | 0 (0.0%) | 0 (0.0%) |
Income in Marquette
Income Overview in Marquette
Per Capita Income in Marquette is $29,354, while median incomes of families and households are $58,393 and $47,750 respectively.
| Characteristic | Number | Measure |
| Per Capita Income | 357 | $29,354 |
| Median Family Income | 81 | $58,393 |
| Mean Family Income | 81 | $128,952 |
| Median Household Income | 125 | $47,750 |
| Mean Household Income | 125 | $92,758 |
| Income Deficit | 81 | $0 |
| Wage / Income Gap (%) | 357 | 36.46% |
| Wage / Income Gap ($) | 357 | 63.54¢ per $1 |
| Gini / Inequality Index | 357 | 0.68 |
Earnings by Sex in Marquette
Average Earnings in Marquette are $48,750, $53,611 for men and $34,063 for women, a difference of 36.5%.
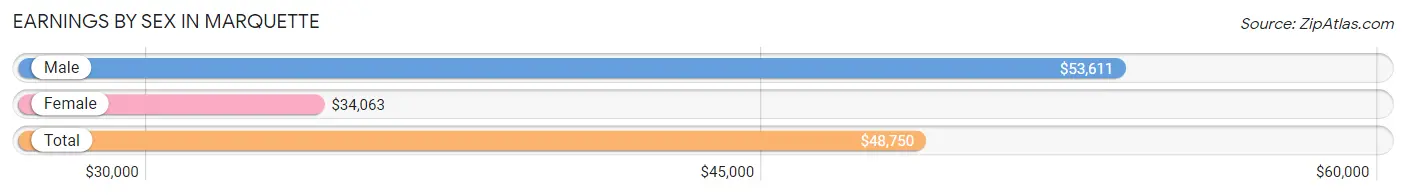
| Sex | Number | Average Earnings |
| Male | 50 (49.5%) | $53,611 |
| Female | 51 (50.5%) | $34,063 |
| Total | 101 (100.0%) | $48,750 |
Earnings by Sex by Income Bracket in Marquette
The most common earnings brackets in Marquette are $50,000 to $54,999 for men (13 | 26.0%) and $15,000 to $17,499 for women (8 | 15.7%).
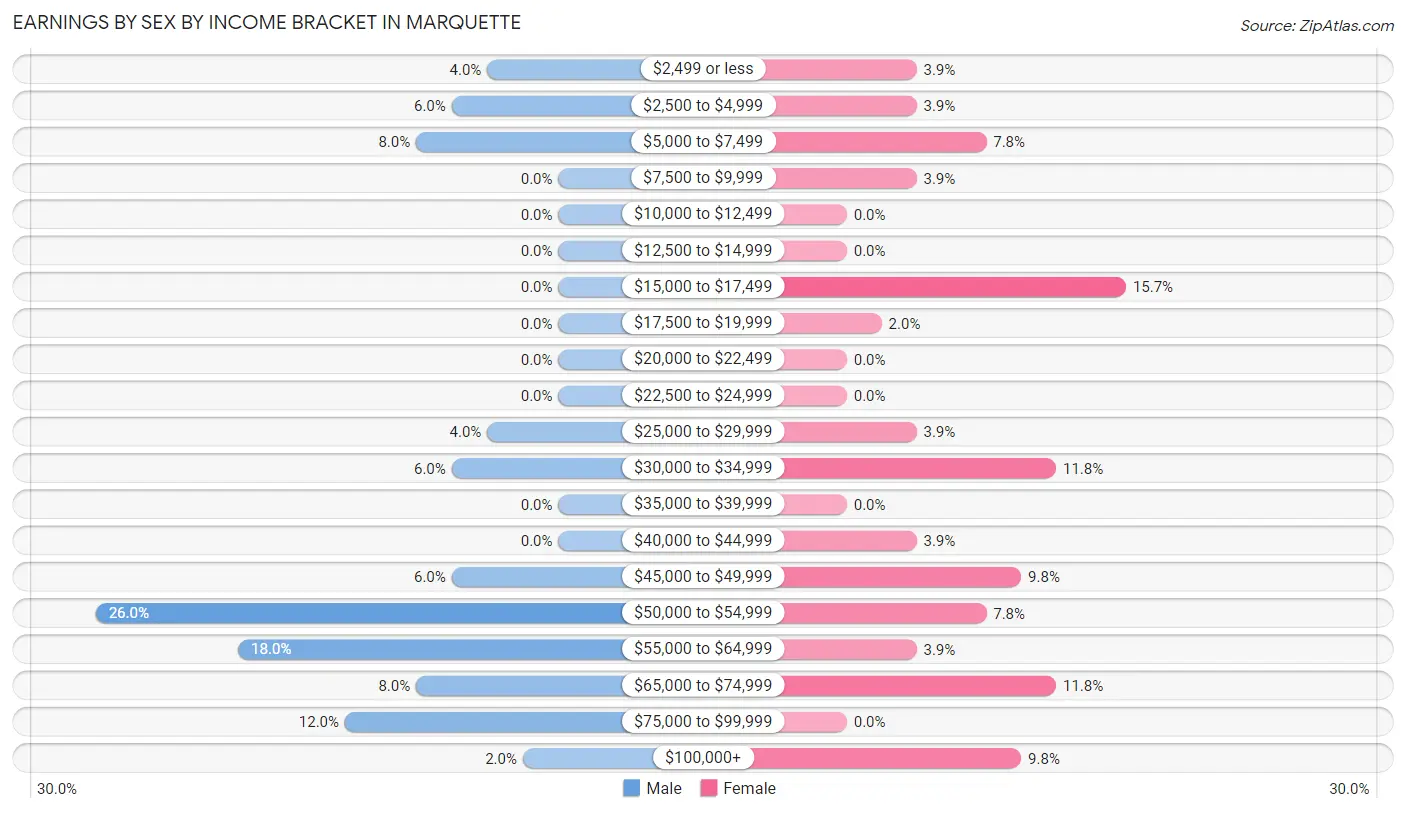
| Income | Male | Female |
| $2,499 or less | 2 (4.0%) | 2 (3.9%) |
| $2,500 to $4,999 | 3 (6.0%) | 2 (3.9%) |
| $5,000 to $7,499 | 4 (8.0%) | 4 (7.8%) |
| $7,500 to $9,999 | 0 (0.0%) | 2 (3.9%) |
| $10,000 to $12,499 | 0 (0.0%) | 0 (0.0%) |
| $12,500 to $14,999 | 0 (0.0%) | 0 (0.0%) |
| $15,000 to $17,499 | 0 (0.0%) | 8 (15.7%) |
| $17,500 to $19,999 | 0 (0.0%) | 1 (2.0%) |
| $20,000 to $22,499 | 0 (0.0%) | 0 (0.0%) |
| $22,500 to $24,999 | 0 (0.0%) | 0 (0.0%) |
| $25,000 to $29,999 | 2 (4.0%) | 2 (3.9%) |
| $30,000 to $34,999 | 3 (6.0%) | 6 (11.8%) |
| $35,000 to $39,999 | 0 (0.0%) | 0 (0.0%) |
| $40,000 to $44,999 | 0 (0.0%) | 2 (3.9%) |
| $45,000 to $49,999 | 3 (6.0%) | 5 (9.8%) |
| $50,000 to $54,999 | 13 (26.0%) | 4 (7.8%) |
| $55,000 to $64,999 | 9 (18.0%) | 2 (3.9%) |
| $65,000 to $74,999 | 4 (8.0%) | 6 (11.8%) |
| $75,000 to $99,999 | 6 (12.0%) | 0 (0.0%) |
| $100,000+ | 1 (2.0%) | 5 (9.8%) |
| Total | 50 (100.0%) | 51 (100.0%) |
Earnings by Sex by Educational Attainment in Marquette
Average earnings in Marquette are $53,611 for men and $45,500 for women, a difference of 15.1%. Men with an educational attainment of college or associate's degree enjoy the highest average annual earnings of $70,625, while those with high school diploma education earn the least with $52,500. Women with an educational attainment of high school diploma earn the most with the average annual earnings of $51,250, while those with college or associate's degree education have the smallest earnings of $45,938.
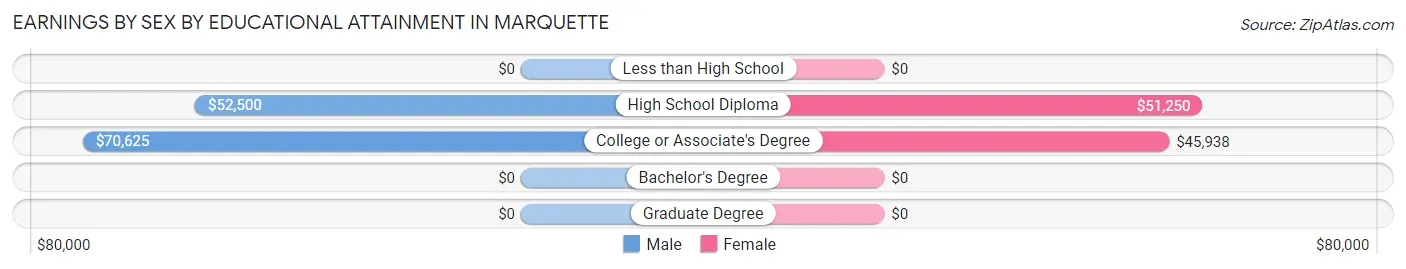
| Educational Attainment | Male Income | Female Income |
| Less than High School | - | - |
| High School Diploma | $52,500 | $51,250 |
| College or Associate's Degree | $70,625 | $45,938 |
| Bachelor's Degree | - | - |
| Graduate Degree | - | - |
| Total | $53,611 | $45,500 |
Family Income in Marquette
Family Income Brackets in Marquette
According to the Marquette family income data, there are 21 families falling into the $100,000 to $149,999 income range, which is the most common income bracket and makes up 25.9% of all families.
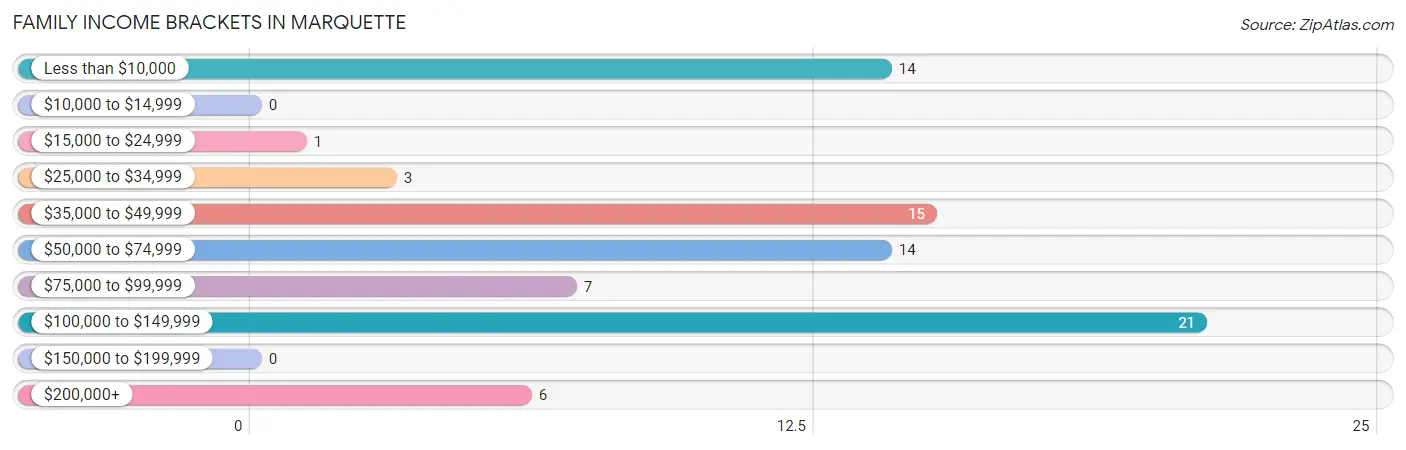
| Income Bracket | # Families | % Families |
| Less than $10,000 | 14 | 17.3% |
| $10,000 to $14,999 | 0 | 0.0% |
| $15,000 to $24,999 | 1 | 1.2% |
| $25,000 to $34,999 | 3 | 3.7% |
| $35,000 to $49,999 | 15 | 18.5% |
| $50,000 to $74,999 | 14 | 17.3% |
| $75,000 to $99,999 | 7 | 8.6% |
| $100,000 to $149,999 | 21 | 25.9% |
| $150,000 to $199,999 | 0 | 0.0% |
| $200,000+ | 6 | 7.4% |
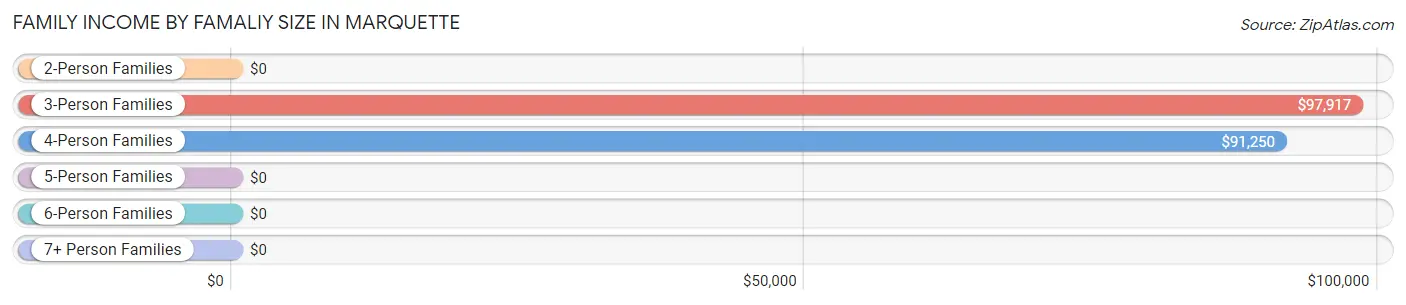
Family Income by Famaliy Size in Marquette
3-person families (13 | 16.1%) account for the highest median family income in Marquette with $97,917 per family, while 3-person families (13 | 16.1%) have the highest median income of $32,639 per family member.
| Income Bracket | # Families | Median Income |
| 2-Person Families | 41 (50.6%) | $0 |
| 3-Person Families | 13 (16.1%) | $97,917 |
| 4-Person Families | 7 (8.6%) | $91,250 |
| 5-Person Families | 6 (7.4%) | $0 |
| 6-Person Families | 0 (0.0%) | $0 |
| 7+ Person Families | 14 (17.3%) | $0 |
| Total | 81 (100.0%) | $58,393 |
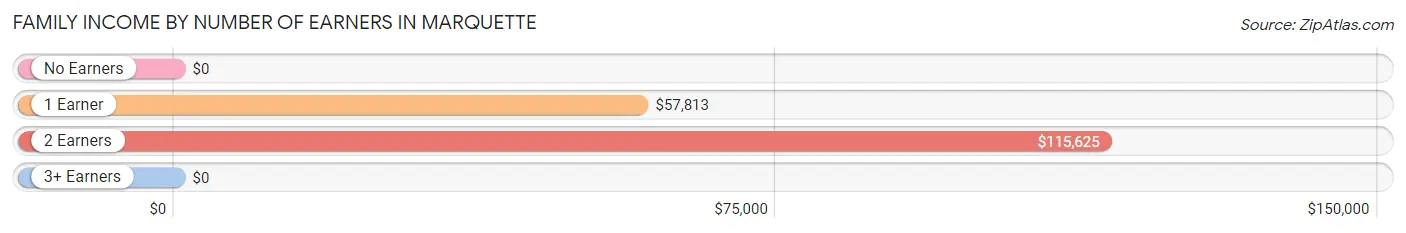
Family Income by Number of Earners in Marquette
| Number of Earners | # Families | Median Income |
| No Earners | 33 (40.7%) | $0 |
| 1 Earner | 19 (23.5%) | $57,813 |
| 2 Earners | 27 (33.3%) | $115,625 |
| 3+ Earners | 2 (2.5%) | $0 |
| Total | 81 (100.0%) | $58,393 |
Household Income in Marquette
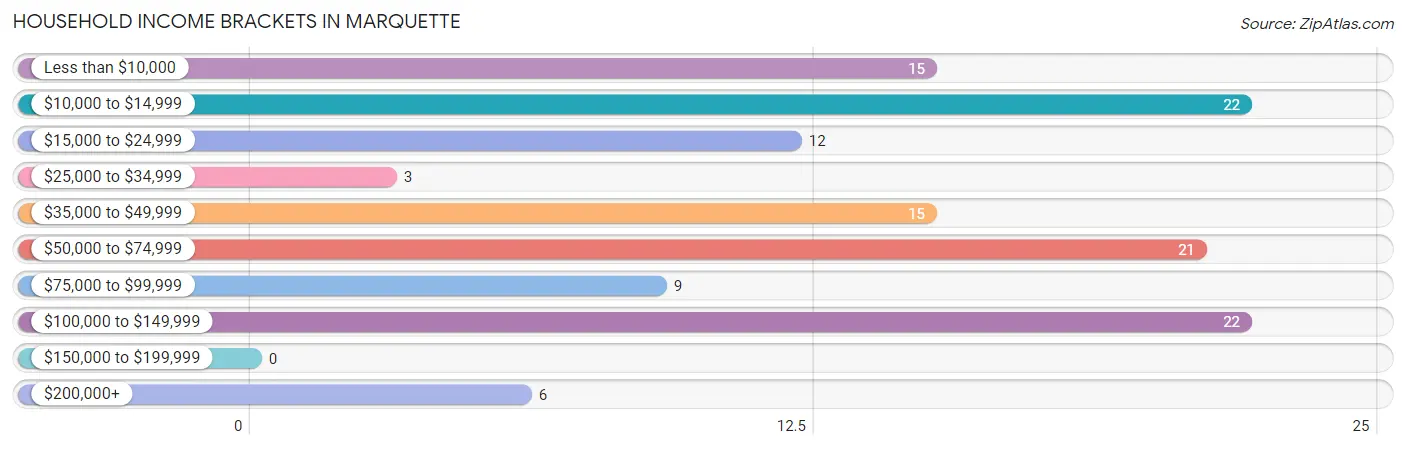
Household Income Brackets in Marquette
With 22 households falling in the category, the $10,000 to $14,999 income range is the most frequent in Marquette, accounting for 17.6% of all households.
| Income Bracket | # Households | % Households |
| Less than $10,000 | 15 | 12.0% |
| $10,000 to $14,999 | 22 | 17.6% |
| $15,000 to $24,999 | 12 | 9.6% |
| $25,000 to $34,999 | 3 | 2.4% |
| $35,000 to $49,999 | 15 | 12.0% |
| $50,000 to $74,999 | 21 | 16.8% |
| $75,000 to $99,999 | 9 | 7.2% |
| $100,000 to $149,999 | 22 | 17.6% |
| $150,000 to $199,999 | 0 | 0.0% |
| $200,000+ | 6 | 4.8% |
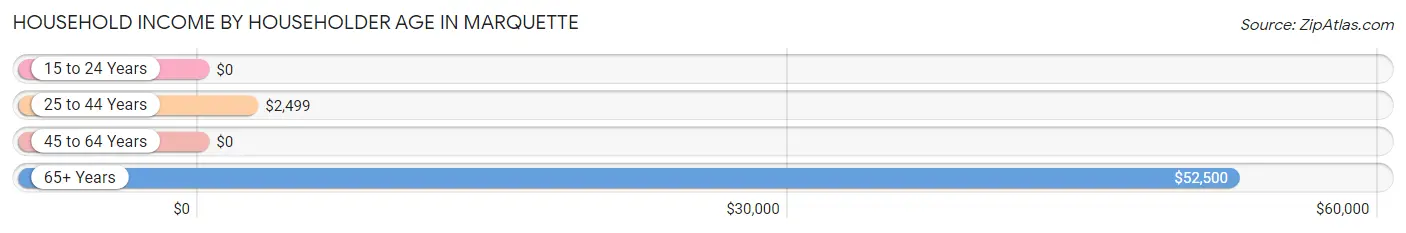
Household Income by Householder Age in Marquette
The median household income in Marquette is $47,750, with the highest median household income of $52,500 found in the 65+ years age bracket for the primary householder. A total of 44 households (35.2%) fall into this category. Meanwhile, the 15 to 24 years age bracket for the primary householder has the lowest median household income of $0, with 6 households (4.8%) in this group.
| Income Bracket | # Households | Median Income |
| 15 to 24 Years | 6 (4.8%) | $0 |
| 25 to 44 Years | 24 (19.2%) | $2,499 |
| 45 to 64 Years | 51 (40.8%) | $0 |
| 65+ Years | 44 (35.2%) | $52,500 |
| Total | 125 (100.0%) | $47,750 |
Poverty in Marquette
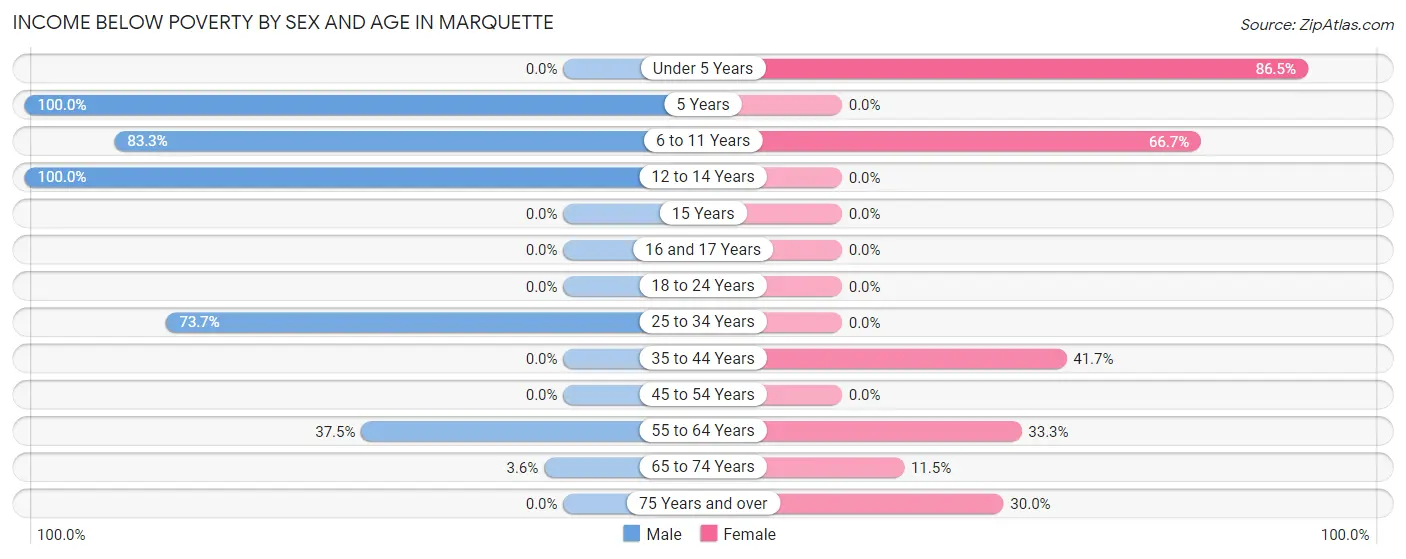
Income Below Poverty by Sex and Age in Marquette
With 44.7% poverty level for males and 39.1% for females among the residents of Marquette, 5 year old males and under 5 year old females are the most vulnerable to poverty, with 11 males (100.0%) and 32 females (86.5%) in their respective age groups living below the poverty level.
| Age Bracket | Male | Female |
| Under 5 Years | 0 (0.0%) | 32 (86.5%) |
| 5 Years | 11 (100.0%) | 0 (0.0%) |
| 6 to 11 Years | 35 (83.3%) | 10 (66.7%) |
| 12 to 14 Years | 11 (100.0%) | 0 (0.0%) |
| 15 Years | 0 (0.0%) | 0 (0.0%) |
| 16 and 17 Years | 0 (0.0%) | 0 (0.0%) |
| 18 to 24 Years | 0 (0.0%) | 0 (0.0%) |
| 25 to 34 Years | 14 (73.7%) | 0 (0.0%) |
| 35 to 44 Years | 0 (0.0%) | 10 (41.7%) |
| 45 to 54 Years | 0 (0.0%) | 0 (0.0%) |
| 55 to 64 Years | 12 (37.5%) | 8 (33.3%) |
| 65 to 74 Years | 1 (3.6%) | 3 (11.5%) |
| 75 Years and over | 0 (0.0%) | 3 (30.0%) |
| Total | 84 (44.7%) | 66 (39.1%) |
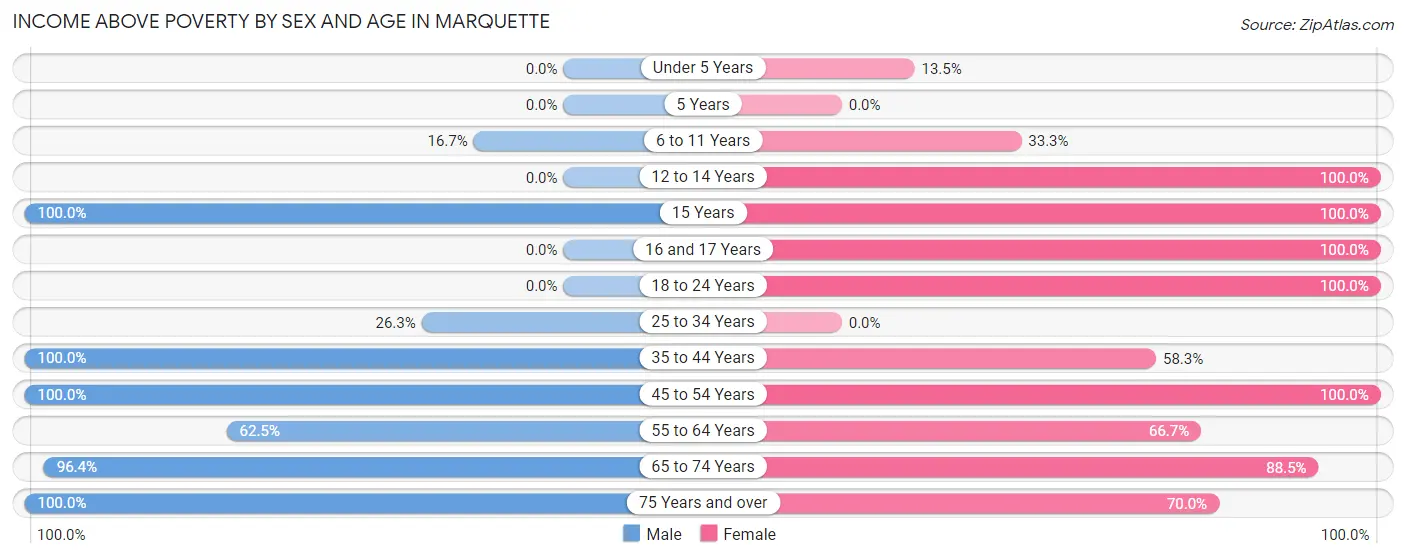
Income Above Poverty by Sex and Age in Marquette
According to the poverty statistics in Marquette, males aged 15 years and females aged 12 to 14 years are the age groups that are most secure financially, with 100.0% of males and 100.0% of females in these age groups living above the poverty line.
| Age Bracket | Male | Female |
| Under 5 Years | 0 (0.0%) | 5 (13.5%) |
| 5 Years | 0 (0.0%) | 0 (0.0%) |
| 6 to 11 Years | 7 (16.7%) | 5 (33.3%) |
| 12 to 14 Years | 0 (0.0%) | 7 (100.0%) |
| 15 Years | 8 (100.0%) | 2 (100.0%) |
| 16 and 17 Years | 0 (0.0%) | 7 (100.0%) |
| 18 to 24 Years | 0 (0.0%) | 8 (100.0%) |
| 25 to 34 Years | 5 (26.3%) | 0 (0.0%) |
| 35 to 44 Years | 13 (100.0%) | 14 (58.3%) |
| 45 to 54 Years | 17 (100.0%) | 9 (100.0%) |
| 55 to 64 Years | 20 (62.5%) | 16 (66.7%) |
| 65 to 74 Years | 27 (96.4%) | 23 (88.5%) |
| 75 Years and over | 7 (100.0%) | 7 (70.0%) |
| Total | 104 (55.3%) | 103 (61.0%) |
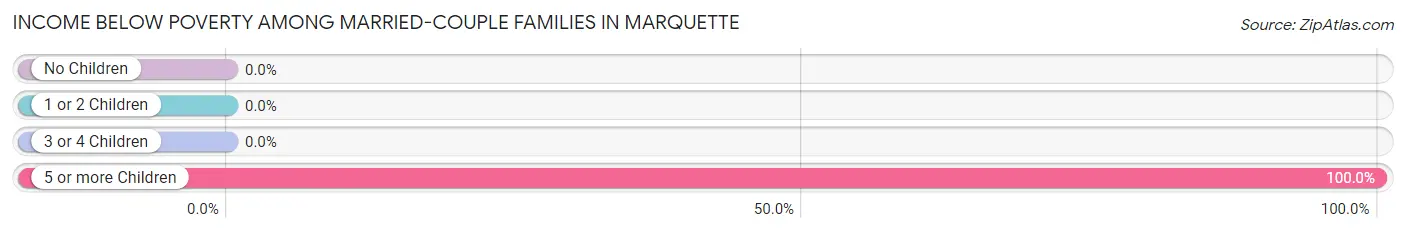
Income Below Poverty Among Married-Couple Families in Marquette
The poverty statistics for married-couple families in Marquette show that 21.2% or 14 of the total 66 families live below the poverty line. Families with 5 or more children have the highest poverty rate of 100.0%, comprising of 14 families. On the other hand, families with no children have the lowest poverty rate of 0.0%, which includes 0 families.
| Children | Above Poverty | Below Poverty |
| No Children | 40 (100.0%) | 0 (0.0%) |
| 1 or 2 Children | 10 (100.0%) | 0 (0.0%) |
| 3 or 4 Children | 2 (100.0%) | 0 (0.0%) |
| 5 or more Children | 0 (0.0%) | 14 (100.0%) |
| Total | 52 (78.8%) | 14 (21.2%) |
Income Below Poverty Among Single-Parent Households in Marquette
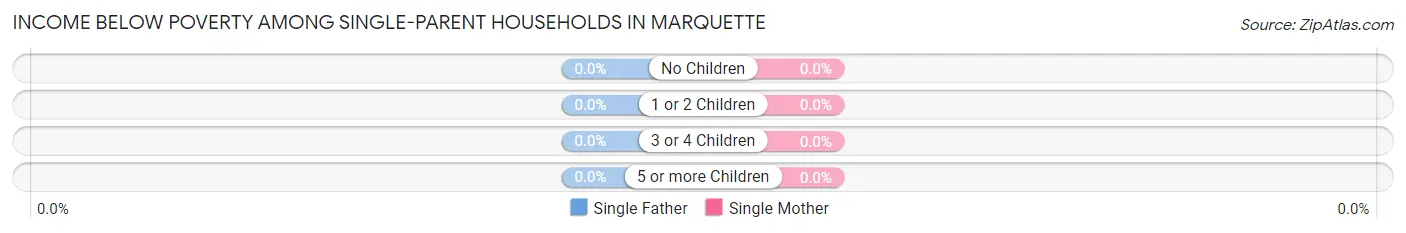
| Children | Single Father | Single Mother |
| No Children | 0 (0.0%) | 0 (0.0%) |
| 1 or 2 Children | 0 (0.0%) | 0 (0.0%) |
| 3 or 4 Children | 0 (0.0%) | 0 (0.0%) |
| 5 or more Children | 0 (0.0%) | 0 (0.0%) |
| Total | 0 (0.0%) | 0 (0.0%) |
Income Below Poverty Among Married-Couple vs Single-Parent Households in Marquette
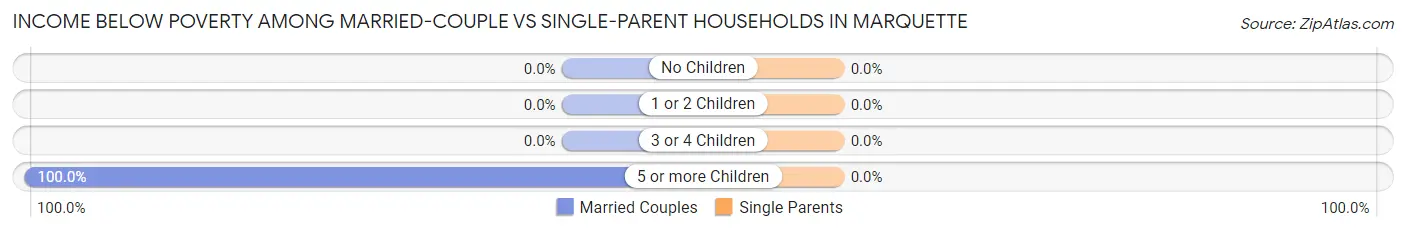
| Children | Married-Couple Families | Single-Parent Households |
| No Children | 0 (0.0%) | 0 (0.0%) |
| 1 or 2 Children | 0 (0.0%) | 0 (0.0%) |
| 3 or 4 Children | 0 (0.0%) | 0 (0.0%) |
| 5 or more Children | 14 (100.0%) | 0 (0.0%) |
| Total | 14 (21.2%) | 0 (0.0%) |
Employment Characteristics in Marquette
Employment by Class of Employer in Marquette
Among the 85 employed individuals in Marquette, private company employees (69 | 81.2%), not-for-profit organizations (4 | 4.7%), and federal government employees (3 | 3.5%) make up the most common classes of employment.
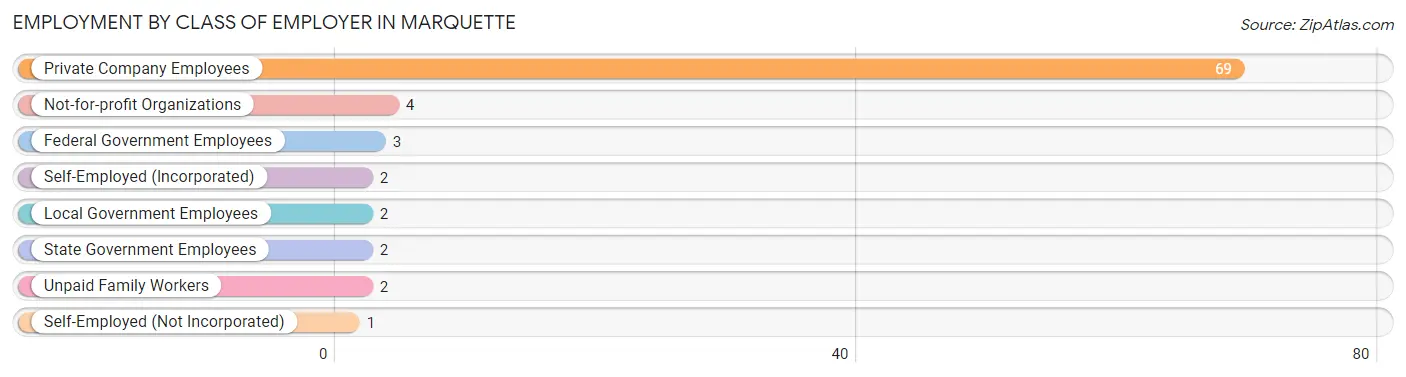
| Employer Class | # Employees | % Employees |
| Private Company Employees | 69 | 81.2% |
| Self-Employed (Incorporated) | 2 | 2.4% |
| Self-Employed (Not Incorporated) | 1 | 1.2% |
| Not-for-profit Organizations | 4 | 4.7% |
| Local Government Employees | 2 | 2.4% |
| State Government Employees | 2 | 2.4% |
| Federal Government Employees | 3 | 3.5% |
| Unpaid Family Workers | 2 | 2.4% |
| Total | 85 | 100.0% |
Employment Status by Age in Marquette
According to the labor force statistics for Marquette, out of the total population over 16 years of age (224), 42.9% or 96 individuals are in the labor force, with 6.3% or 6 of them unemployed. The age group with the highest labor force participation rate is 20 to 24 years, with 100.0% or 6 individuals in the labor force. Within the labor force, the 16 to 19 years age range has the highest percentage of unemployed individuals, with 66.7% or 4 of them being unemployed.
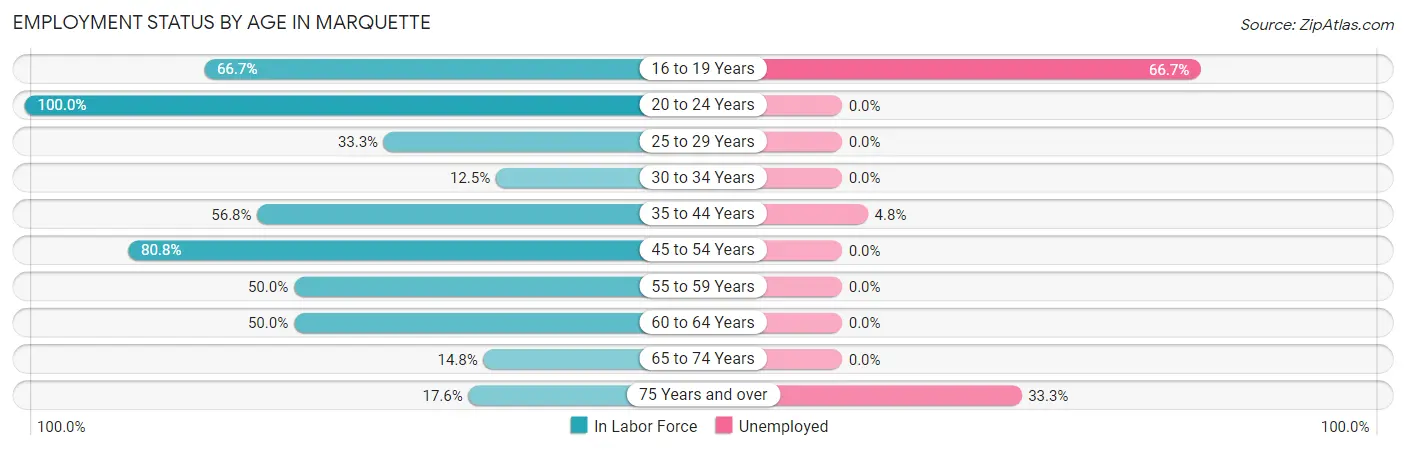
| Age Bracket | In Labor Force | Unemployed |
| 16 to 19 Years | 6 (66.7%) | 4 (66.7%) |
| 20 to 24 Years | 6 (100.0%) | 0 (0.0%) |
| 25 to 29 Years | 1 (33.3%) | 0 (0.0%) |
| 30 to 34 Years | 2 (12.5%) | 0 (0.0%) |
| 35 to 44 Years | 21 (56.8%) | 1 (4.8%) |
| 45 to 54 Years | 21 (80.8%) | 0 (0.0%) |
| 55 to 59 Years | 22 (50.0%) | 0 (0.0%) |
| 60 to 64 Years | 6 (50.0%) | 0 (0.0%) |
| 65 to 74 Years | 8 (14.8%) | 0 (0.0%) |
| 75 Years and over | 3 (17.6%) | 1 (33.3%) |
| Total | 96 (42.9%) | 6 (6.3%) |
Employment Status by Educational Attainment in Marquette
According to labor force statistics for Marquette, 52.9% of individuals (73) out of the total population between 25 and 64 years of age (138) are in the labor force, with 1.4% or 1 of them being unemployed. The group with the highest labor force participation rate are those with the educational attainment of college / associate degree, with 73.0% or 27 individuals in the labor force. Within the labor force, individuals with college / associate degree education have the highest percentage of unemployment, with 3.7% or 1 of them being unemployed.
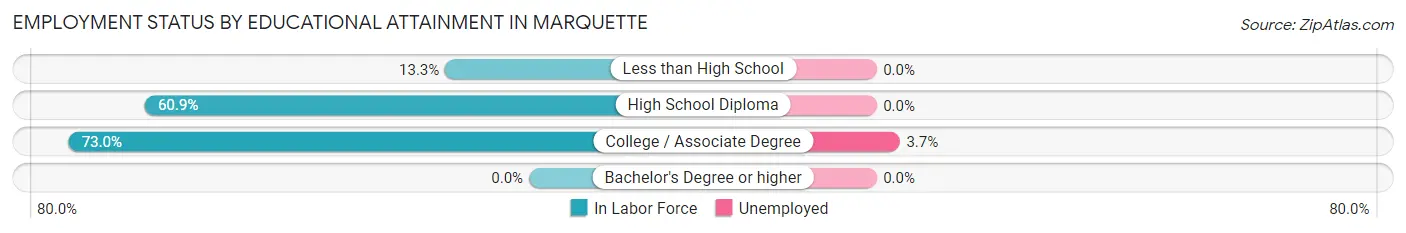
| Educational Attainment | In Labor Force | Unemployed |
| Less than High School | 4 (13.3%) | 0 (0.0%) |
| High School Diploma | 42 (60.9%) | 0 (0.0%) |
| College / Associate Degree | 27 (73.0%) | 1 (3.7%) |
| Bachelor's Degree or higher | 0 (0.0%) | 0 (0.0%) |
| Total | 73 (52.9%) | 2 (1.4%) |
Employment Occupations by Sex in Marquette
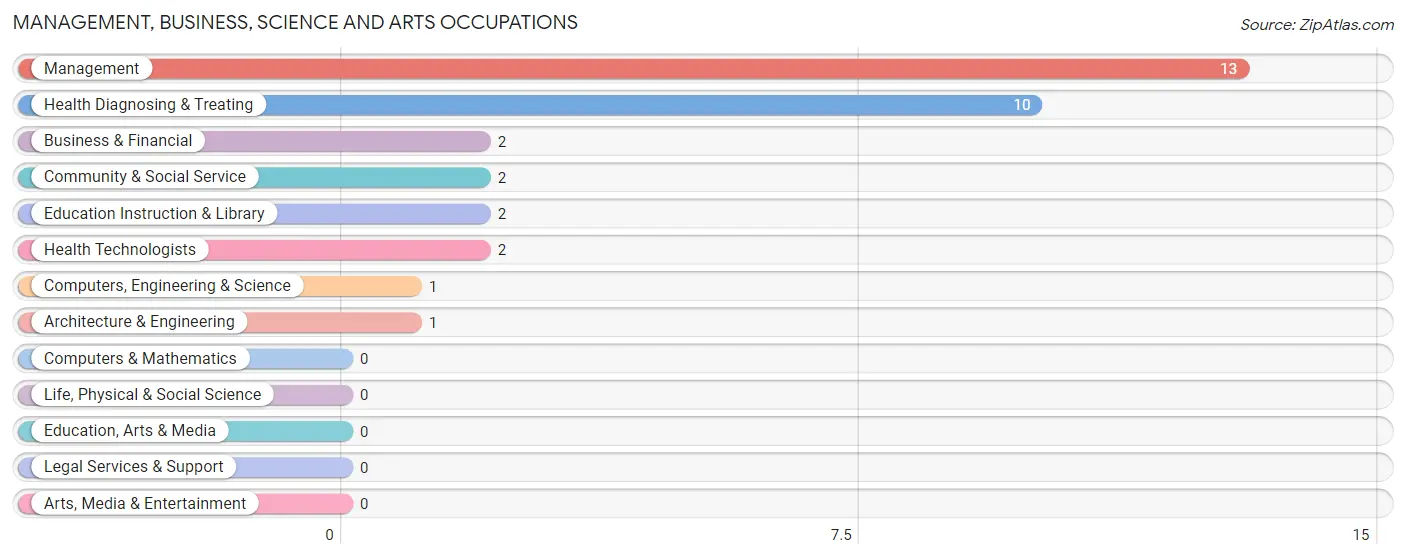
Management, Business, Science and Arts Occupations
The most common Management, Business, Science and Arts occupations in Marquette are Management (13 | 14.4%), Health Diagnosing & Treating (10 | 11.1%), Business & Financial (2 | 2.2%), Community & Social Service (2 | 2.2%), and Education Instruction & Library (2 | 2.2%).
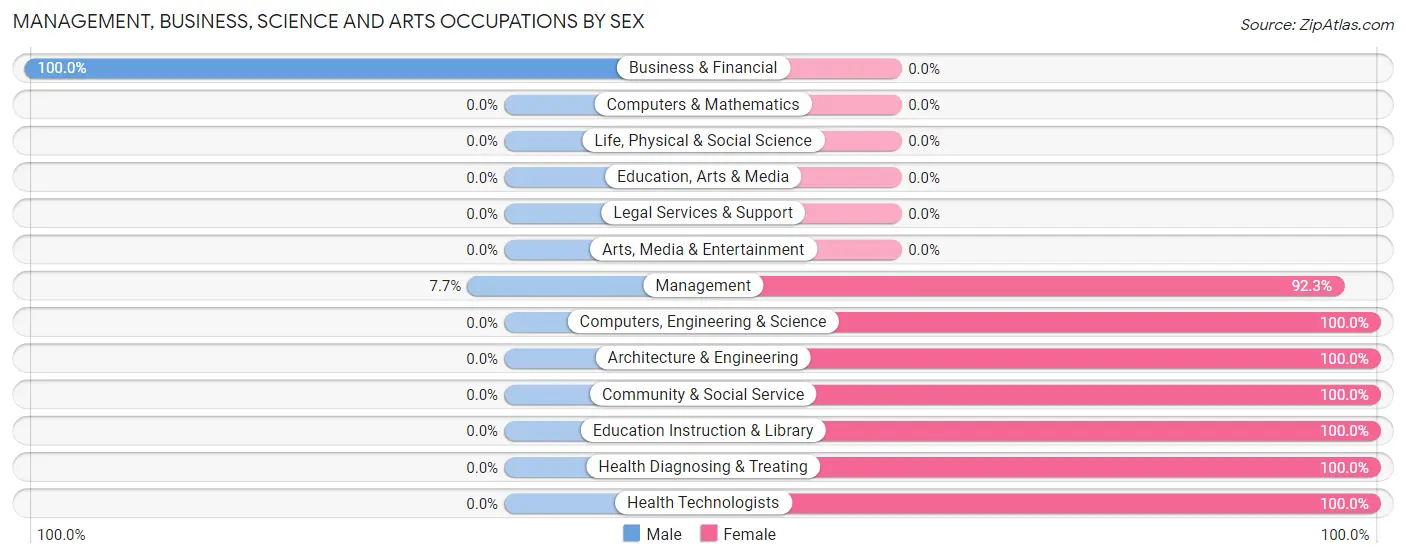
Management, Business, Science and Arts Occupations by Sex
Within the Management, Business, Science and Arts occupations in Marquette, the most male-oriented occupations are Business & Financial (100.0%), and Management (7.7%), while the most female-oriented occupations are Computers, Engineering & Science (100.0%), Architecture & Engineering (100.0%), and Community & Social Service (100.0%).
| Occupation | Male | Female |
| Management | 1 (7.7%) | 12 (92.3%) |
| Business & Financial | 2 (100.0%) | 0 (0.0%) |
| Computers, Engineering & Science | 0 (0.0%) | 1 (100.0%) |
| Computers & Mathematics | 0 (0.0%) | 0 (0.0%) |
| Architecture & Engineering | 0 (0.0%) | 1 (100.0%) |
| Life, Physical & Social Science | 0 (0.0%) | 0 (0.0%) |
| Community & Social Service | 0 (0.0%) | 2 (100.0%) |
| Education, Arts & Media | 0 (0.0%) | 0 (0.0%) |
| Legal Services & Support | 0 (0.0%) | 0 (0.0%) |
| Education Instruction & Library | 0 (0.0%) | 2 (100.0%) |
| Arts, Media & Entertainment | 0 (0.0%) | 0 (0.0%) |
| Health Diagnosing & Treating | 0 (0.0%) | 10 (100.0%) |
| Health Technologists | 0 (0.0%) | 2 (100.0%) |
| Total (Category) | 3 (10.7%) | 25 (89.3%) |
| Total (Overall) | 43 (47.8%) | 47 (52.2%) |
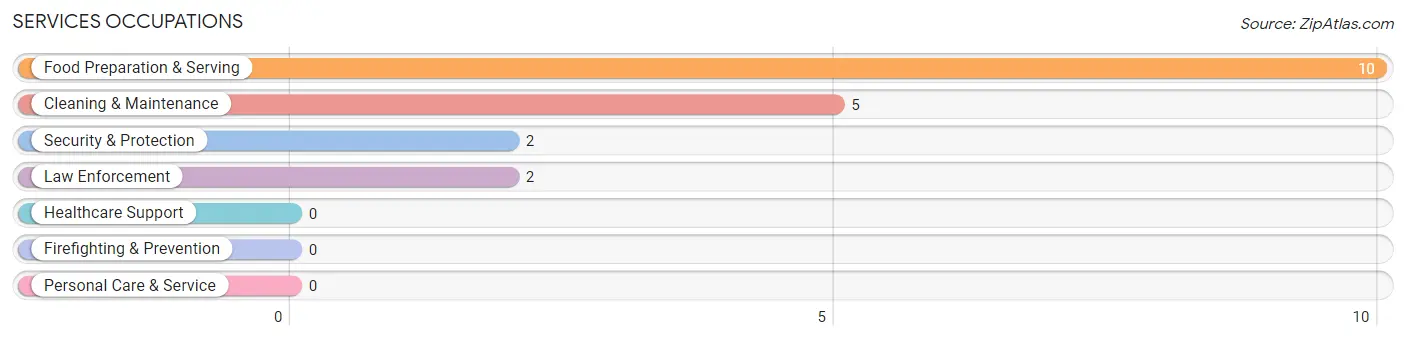
Services Occupations
The most common Services occupations in Marquette are Food Preparation & Serving (10 | 11.1%), Cleaning & Maintenance (5 | 5.6%), Security & Protection (2 | 2.2%), and Law Enforcement (2 | 2.2%).
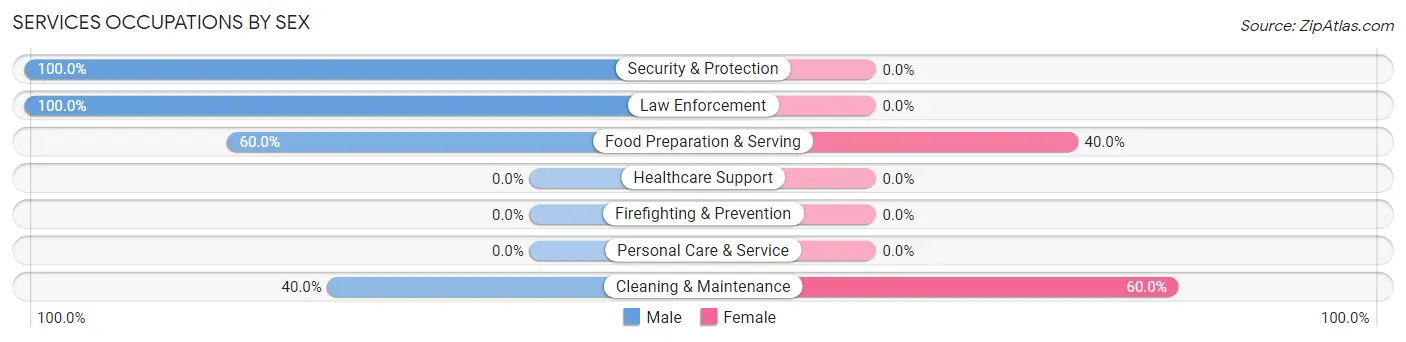
Services Occupations by Sex
Within the Services occupations in Marquette, the most male-oriented occupations are Security & Protection (100.0%), Law Enforcement (100.0%), and Food Preparation & Serving (60.0%), while the most female-oriented occupations are Cleaning & Maintenance (60.0%), and Food Preparation & Serving (40.0%).
| Occupation | Male | Female |
| Healthcare Support | 0 (0.0%) | 0 (0.0%) |
| Security & Protection | 2 (100.0%) | 0 (0.0%) |
| Firefighting & Prevention | 0 (0.0%) | 0 (0.0%) |
| Law Enforcement | 2 (100.0%) | 0 (0.0%) |
| Food Preparation & Serving | 6 (60.0%) | 4 (40.0%) |
| Cleaning & Maintenance | 2 (40.0%) | 3 (60.0%) |
| Personal Care & Service | 0 (0.0%) | 0 (0.0%) |
| Total (Category) | 10 (58.8%) | 7 (41.2%) |
| Total (Overall) | 43 (47.8%) | 47 (52.2%) |
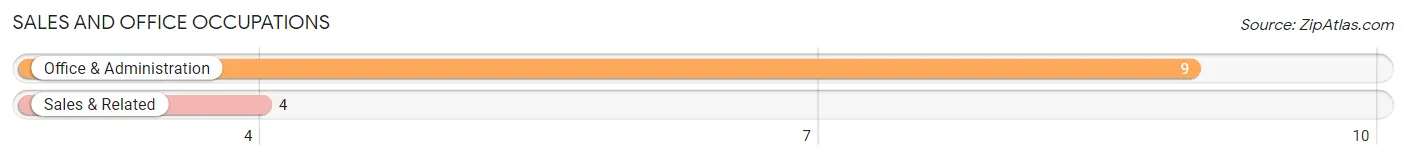
Sales and Office Occupations
The most common Sales and Office occupations in Marquette are Office & Administration (9 | 10.0%), and Sales & Related (4 | 4.4%).
Sales and Office Occupations by Sex
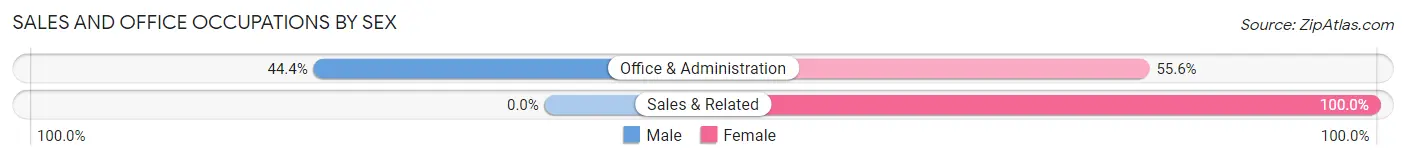
| Occupation | Male | Female |
| Sales & Related | 0 (0.0%) | 4 (100.0%) |
| Office & Administration | 4 (44.4%) | 5 (55.6%) |
| Total (Category) | 4 (30.8%) | 9 (69.2%) |
| Total (Overall) | 43 (47.8%) | 47 (52.2%) |
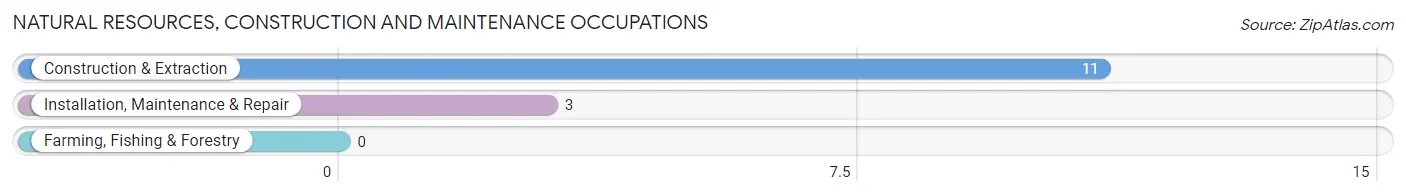
Natural Resources, Construction and Maintenance Occupations
The most common Natural Resources, Construction and Maintenance occupations in Marquette are Construction & Extraction (11 | 12.2%), and Installation, Maintenance & Repair (3 | 3.3%).
Natural Resources, Construction and Maintenance Occupations by Sex
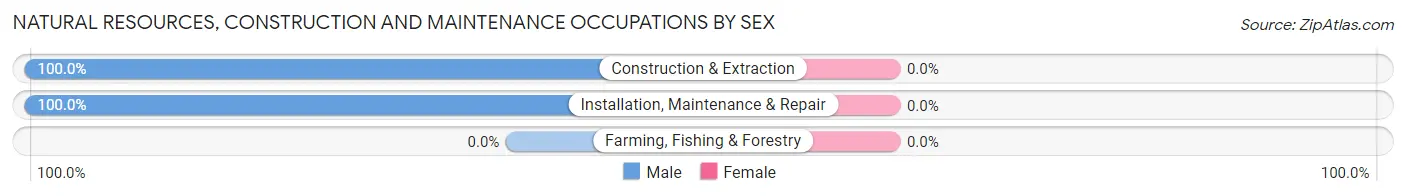
| Occupation | Male | Female |
| Farming, Fishing & Forestry | 0 (0.0%) | 0 (0.0%) |
| Construction & Extraction | 11 (100.0%) | 0 (0.0%) |
| Installation, Maintenance & Repair | 3 (100.0%) | 0 (0.0%) |
| Total (Category) | 14 (100.0%) | 0 (0.0%) |
| Total (Overall) | 43 (47.8%) | 47 (52.2%) |
Production, Transportation and Moving Occupations
The most common Production, Transportation and Moving occupations in Marquette are Material Moving (11 | 12.2%), Production (6 | 6.7%), and Transportation (1 | 1.1%).
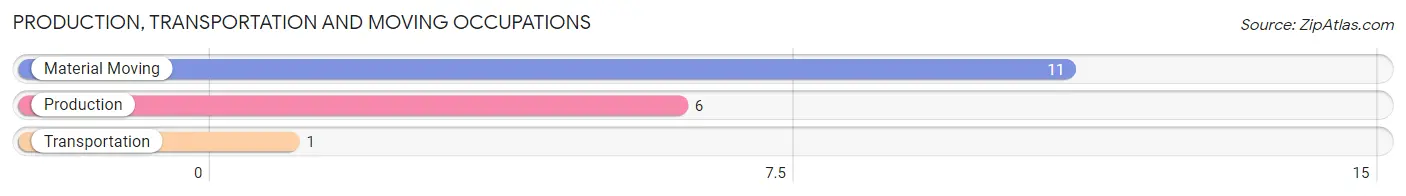
Production, Transportation and Moving Occupations by Sex
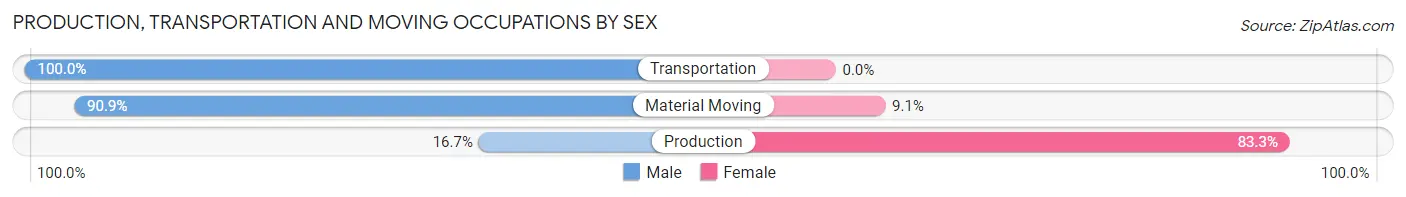
| Occupation | Male | Female |
| Production | 1 (16.7%) | 5 (83.3%) |
| Transportation | 1 (100.0%) | 0 (0.0%) |
| Material Moving | 10 (90.9%) | 1 (9.1%) |
| Total (Category) | 12 (66.7%) | 6 (33.3%) |
| Total (Overall) | 43 (47.8%) | 47 (52.2%) |
Employment Industries by Sex in Marquette
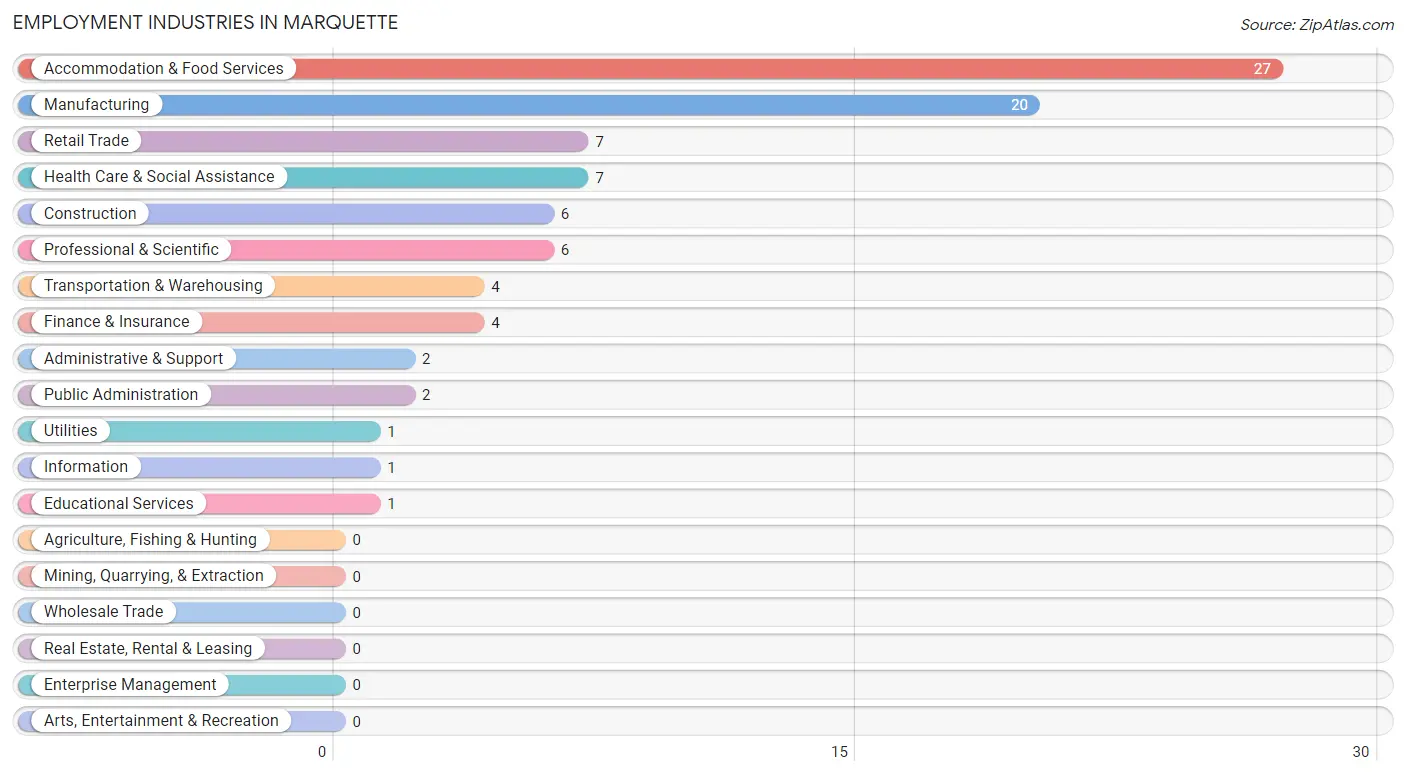
Employment Industries in Marquette
The major employment industries in Marquette include Accommodation & Food Services (27 | 30.0%), Manufacturing (20 | 22.2%), Retail Trade (7 | 7.8%), Health Care & Social Assistance (7 | 7.8%), and Construction (6 | 6.7%).
Employment Industries by Sex in Marquette
The Marquette industries that see more men than women are Construction (100.0%), Utilities (100.0%), and Information (100.0%), whereas the industries that tend to have a higher number of women are Finance & Insurance (100.0%), Professional & Scientific (100.0%), and Health Care & Social Assistance (100.0%).
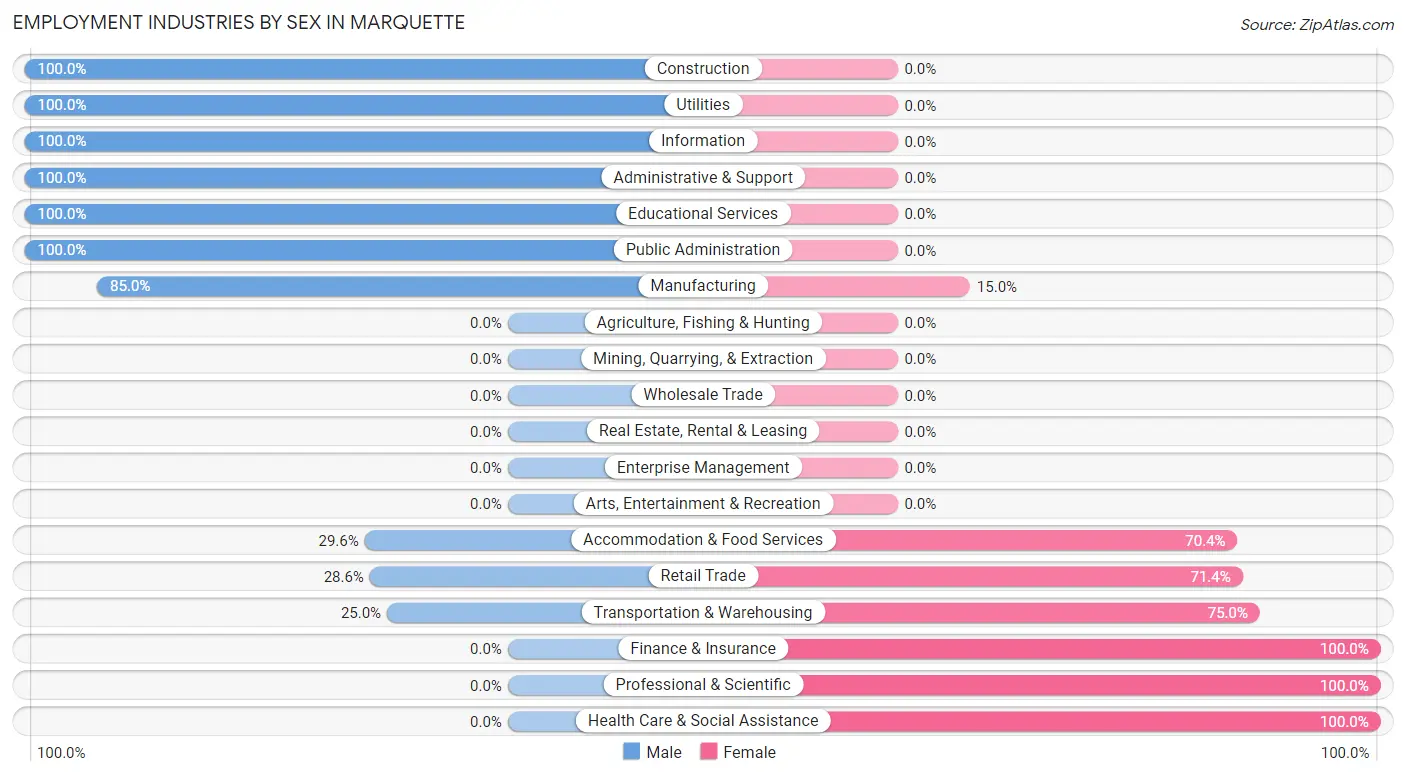
| Industry | Male | Female |
| Agriculture, Fishing & Hunting | 0 (0.0%) | 0 (0.0%) |
| Mining, Quarrying, & Extraction | 0 (0.0%) | 0 (0.0%) |
| Construction | 6 (100.0%) | 0 (0.0%) |
| Manufacturing | 17 (85.0%) | 3 (15.0%) |
| Wholesale Trade | 0 (0.0%) | 0 (0.0%) |
| Retail Trade | 2 (28.6%) | 5 (71.4%) |
| Transportation & Warehousing | 1 (25.0%) | 3 (75.0%) |
| Utilities | 1 (100.0%) | 0 (0.0%) |
| Information | 1 (100.0%) | 0 (0.0%) |
| Finance & Insurance | 0 (0.0%) | 4 (100.0%) |
| Real Estate, Rental & Leasing | 0 (0.0%) | 0 (0.0%) |
| Professional & Scientific | 0 (0.0%) | 6 (100.0%) |
| Enterprise Management | 0 (0.0%) | 0 (0.0%) |
| Administrative & Support | 2 (100.0%) | 0 (0.0%) |
| Educational Services | 1 (100.0%) | 0 (0.0%) |
| Health Care & Social Assistance | 0 (0.0%) | 7 (100.0%) |
| Arts, Entertainment & Recreation | 0 (0.0%) | 0 (0.0%) |
| Accommodation & Food Services | 8 (29.6%) | 19 (70.4%) |
| Public Administration | 2 (100.0%) | 0 (0.0%) |
| Total | 43 (47.8%) | 47 (52.2%) |
Education in Marquette
School Enrollment in Marquette
The most common levels of schooling among the 102 students in Marquette are elementary school (54 | 52.9%), middle school (20 | 19.6%), and high school (19 | 18.6%).
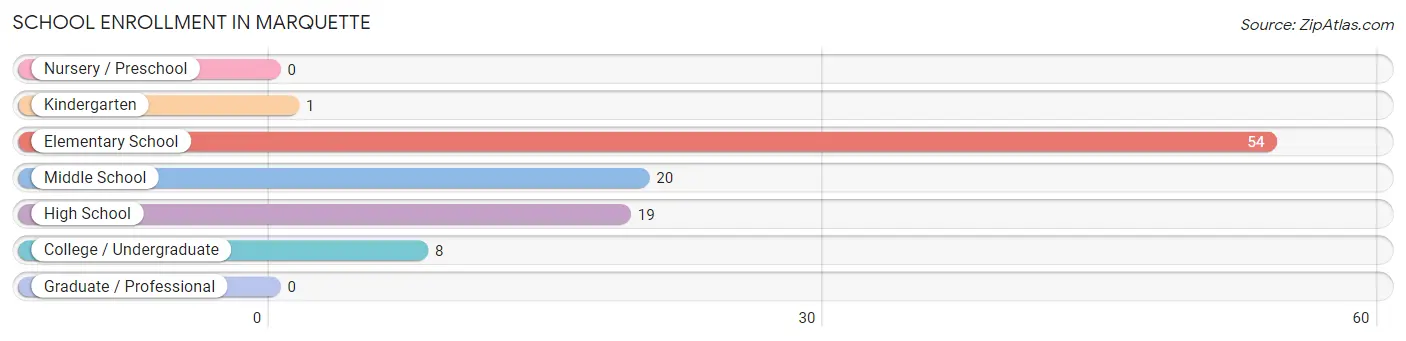
| School Level | # Students | % Students |
| Nursery / Preschool | 0 | 0.0% |
| Kindergarten | 1 | 1.0% |
| Elementary School | 54 | 52.9% |
| Middle School | 20 | 19.6% |
| High School | 19 | 18.6% |
| College / Undergraduate | 8 | 7.8% |
| Graduate / Professional | 0 | 0.0% |
| Total | 102 | 100.0% |
School Enrollment by Age by Funding Source in Marquette
Out of a total of 102 students who are enrolled in schools in Marquette, 4 (3.9%) attend a private institution, while the remaining 98 (96.1%) are enrolled in public schools. The age group of 15 to 17 year olds has the highest likelihood of being enrolled in private schools, with 2 (11.8% in the age bracket) enrolled. Conversely, the age group of 10 to 14 year olds has the lowest likelihood of being enrolled in a private school, with 34 (100.0% in the age bracket) attending a public institution.
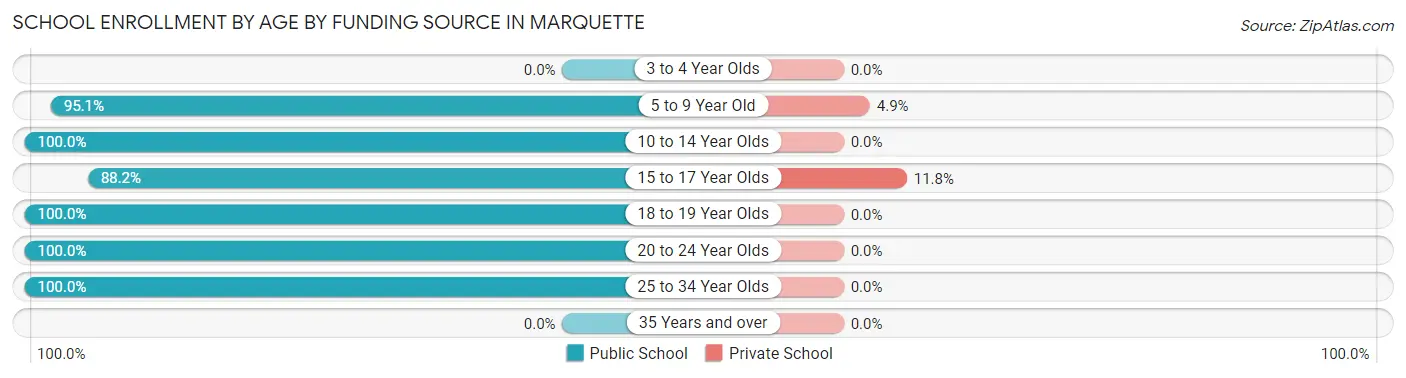
| Age Bracket | Public School | Private School |
| 3 to 4 Year Olds | 0 (0.0%) | 0 (0.0%) |
| 5 to 9 Year Old | 39 (95.1%) | 2 (4.9%) |
| 10 to 14 Year Olds | 34 (100.0%) | 0 (0.0%) |
| 15 to 17 Year Olds | 15 (88.2%) | 2 (11.8%) |
| 18 to 19 Year Olds | 2 (100.0%) | 0 (0.0%) |
| 20 to 24 Year Olds | 6 (100.0%) | 0 (0.0%) |
| 25 to 34 Year Olds | 2 (100.0%) | 0 (0.0%) |
| 35 Years and over | 0 (0.0%) | 0 (0.0%) |
| Total | 98 (96.1%) | 4 (3.9%) |
Educational Attainment by Field of Study in Marquette
Communications (4 | 50.0%), education (2 | 25.0%), bio, nature & agricultural (1 | 12.5%), and social sciences (1 | 12.5%) are the most common fields of study among 8 individuals in Marquette who have obtained a bachelor's degree or higher.
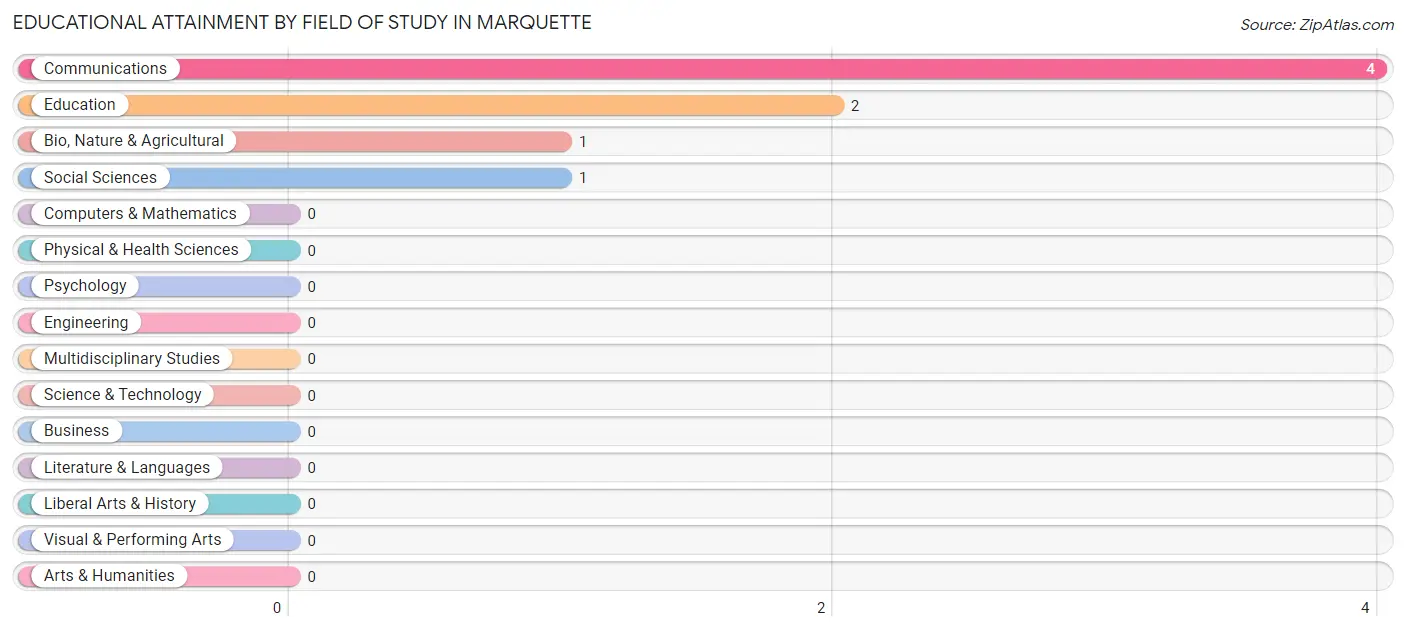
| Field of Study | # Graduates | % Graduates |
| Computers & Mathematics | 0 | 0.0% |
| Bio, Nature & Agricultural | 1 | 12.5% |
| Physical & Health Sciences | 0 | 0.0% |
| Psychology | 0 | 0.0% |
| Social Sciences | 1 | 12.5% |
| Engineering | 0 | 0.0% |
| Multidisciplinary Studies | 0 | 0.0% |
| Science & Technology | 0 | 0.0% |
| Business | 0 | 0.0% |
| Education | 2 | 25.0% |
| Literature & Languages | 0 | 0.0% |
| Liberal Arts & History | 0 | 0.0% |
| Visual & Performing Arts | 0 | 0.0% |
| Communications | 4 | 50.0% |
| Arts & Humanities | 0 | 0.0% |
| Total | 8 | 100.0% |
Transportation & Commute in Marquette
Vehicle Availability by Sex in Marquette
The most prevalent vehicle ownership categories in Marquette are males with 2 vehicles (20, accounting for 52.6%) and females with 2 vehicles (26, making up 42.5%).
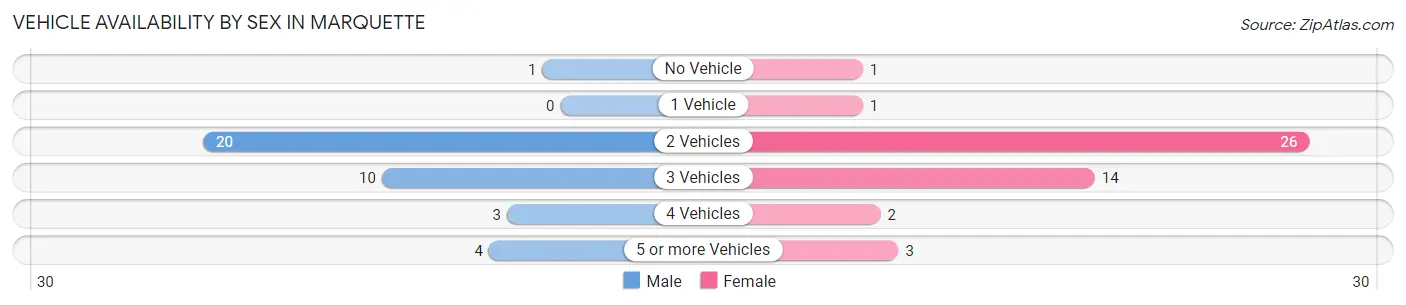
| Vehicles Available | Male | Female |
| No Vehicle | 1 (2.6%) | 1 (2.1%) |
| 1 Vehicle | 0 (0.0%) | 1 (2.1%) |
| 2 Vehicles | 20 (52.6%) | 26 (55.3%) |
| 3 Vehicles | 10 (26.3%) | 14 (29.8%) |
| 4 Vehicles | 3 (7.9%) | 2 (4.3%) |
| 5 or more Vehicles | 4 (10.5%) | 3 (6.4%) |
| Total | 38 (100.0%) | 47 (100.0%) |
Commute Time in Marquette
The most frequently occuring commute durations in Marquette are 30 to 34 minutes (15 commuters, 21.1%), 45 to 59 minutes (12 commuters, 16.9%), and 60 to 89 minutes (12 commuters, 16.9%).
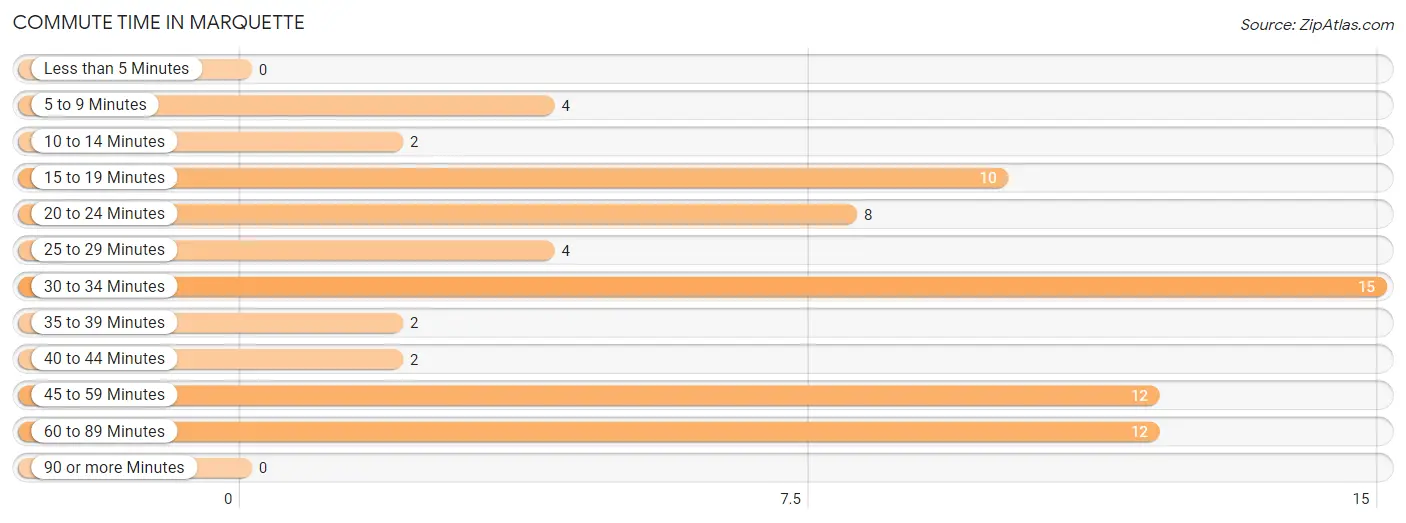
| Commute Time | # Commuters | % Commuters |
| Less than 5 Minutes | 0 | 0.0% |
| 5 to 9 Minutes | 4 | 5.6% |
| 10 to 14 Minutes | 2 | 2.8% |
| 15 to 19 Minutes | 10 | 14.1% |
| 20 to 24 Minutes | 8 | 11.3% |
| 25 to 29 Minutes | 4 | 5.6% |
| 30 to 34 Minutes | 15 | 21.1% |
| 35 to 39 Minutes | 2 | 2.8% |
| 40 to 44 Minutes | 2 | 2.8% |
| 45 to 59 Minutes | 12 | 16.9% |
| 60 to 89 Minutes | 12 | 16.9% |
| 90 or more Minutes | 0 | 0.0% |
Commute Time by Sex in Marquette
The most common commute times in Marquette are 15 to 19 minutes (8 commuters, 24.2%) for males and 60 to 89 minutes (10 commuters, 26.3%) for females.
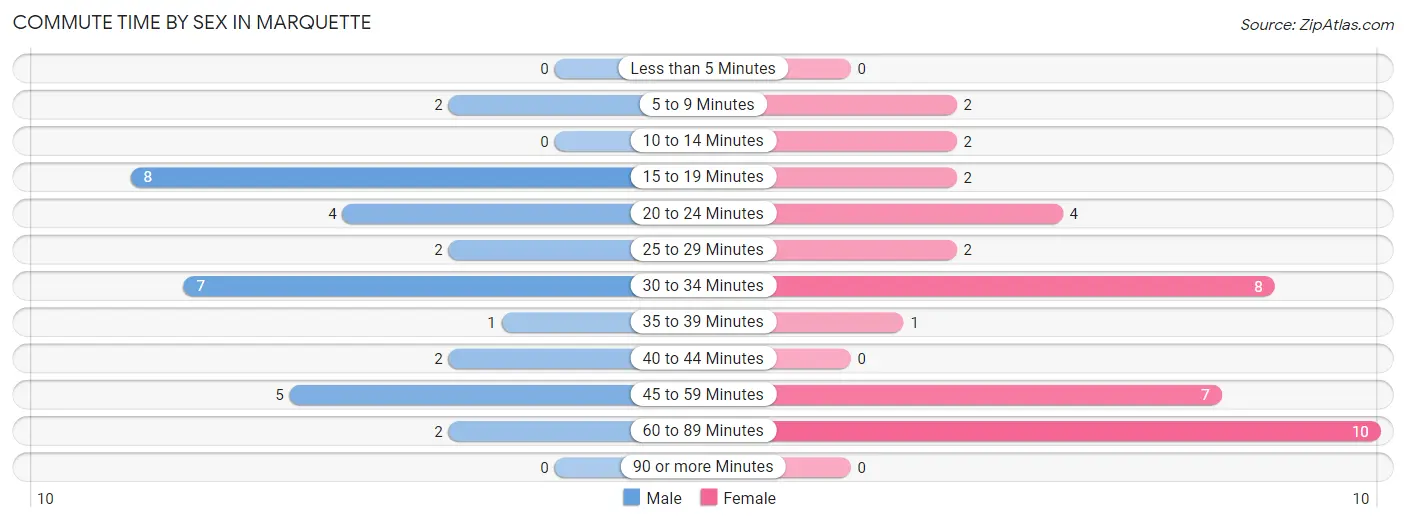
| Commute Time | Male | Female |
| Less than 5 Minutes | 0 (0.0%) | 0 (0.0%) |
| 5 to 9 Minutes | 2 (6.1%) | 2 (5.3%) |
| 10 to 14 Minutes | 0 (0.0%) | 2 (5.3%) |
| 15 to 19 Minutes | 8 (24.2%) | 2 (5.3%) |
| 20 to 24 Minutes | 4 (12.1%) | 4 (10.5%) |
| 25 to 29 Minutes | 2 (6.1%) | 2 (5.3%) |
| 30 to 34 Minutes | 7 (21.2%) | 8 (21.0%) |
| 35 to 39 Minutes | 1 (3.0%) | 1 (2.6%) |
| 40 to 44 Minutes | 2 (6.1%) | 0 (0.0%) |
| 45 to 59 Minutes | 5 (15.1%) | 7 (18.4%) |
| 60 to 89 Minutes | 2 (6.1%) | 10 (26.3%) |
| 90 or more Minutes | 0 (0.0%) | 0 (0.0%) |
Time of Departure to Work by Sex in Marquette
The most frequent times of departure to work in Marquette are 5:30 AM to 5:59 AM (12, 36.4%) for males and 5:30 AM to 5:59 AM (8, 21.0%) for females.
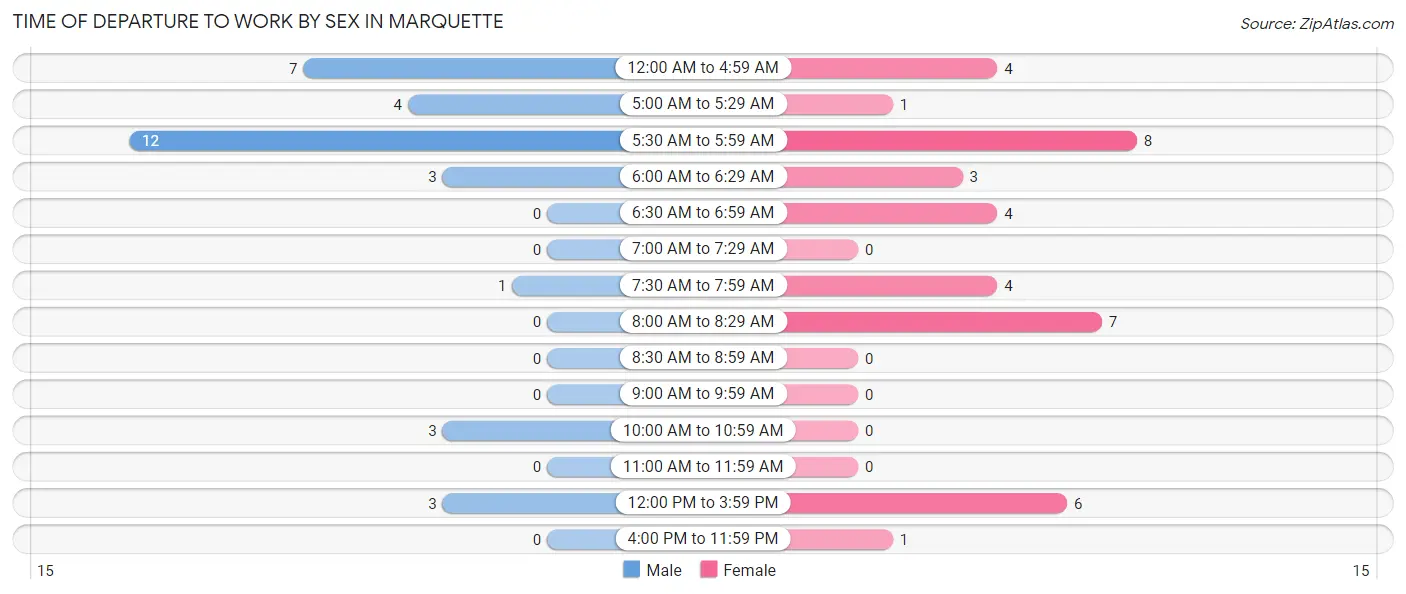
| Time of Departure | Male | Female |
| 12:00 AM to 4:59 AM | 7 (21.2%) | 4 (10.5%) |
| 5:00 AM to 5:29 AM | 4 (12.1%) | 1 (2.6%) |
| 5:30 AM to 5:59 AM | 12 (36.4%) | 8 (21.0%) |
| 6:00 AM to 6:29 AM | 3 (9.1%) | 3 (7.9%) |
| 6:30 AM to 6:59 AM | 0 (0.0%) | 4 (10.5%) |
| 7:00 AM to 7:29 AM | 0 (0.0%) | 0 (0.0%) |
| 7:30 AM to 7:59 AM | 1 (3.0%) | 4 (10.5%) |
| 8:00 AM to 8:29 AM | 0 (0.0%) | 7 (18.4%) |
| 8:30 AM to 8:59 AM | 0 (0.0%) | 0 (0.0%) |
| 9:00 AM to 9:59 AM | 0 (0.0%) | 0 (0.0%) |
| 10:00 AM to 10:59 AM | 3 (9.1%) | 0 (0.0%) |
| 11:00 AM to 11:59 AM | 0 (0.0%) | 0 (0.0%) |
| 12:00 PM to 3:59 PM | 3 (9.1%) | 6 (15.8%) |
| 4:00 PM to 11:59 PM | 0 (0.0%) | 1 (2.6%) |
| Total | 33 (100.0%) | 38 (100.0%) |
Housing Occupancy in Marquette
Occupancy by Ownership in Marquette
Of the total 125 dwellings in Marquette, owner-occupied units account for 90 (72.0%), while renter-occupied units make up 35 (28.0%).
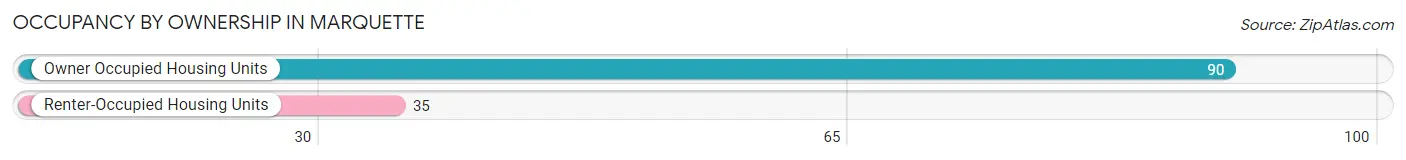
| Occupancy | # Housing Units | % Housing Units |
| Owner Occupied Housing Units | 90 | 72.0% |
| Renter-Occupied Housing Units | 35 | 28.0% |
| Total Occupied Housing Units | 125 | 100.0% |
Occupancy by Household Size in Marquette
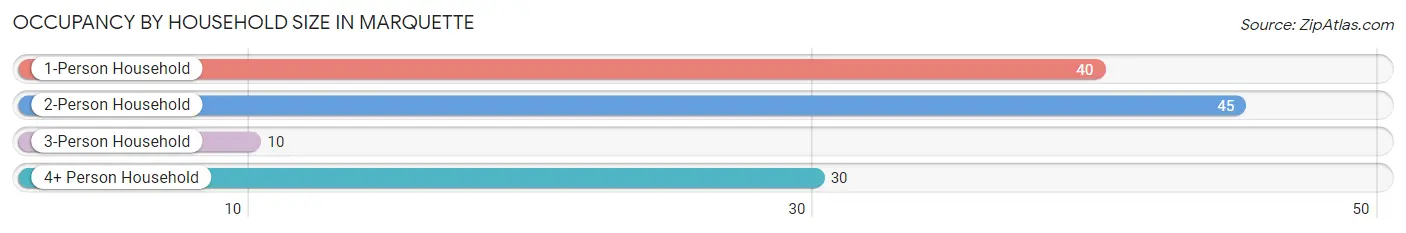
| Household Size | # Housing Units | % Housing Units |
| 1-Person Household | 40 | 32.0% |
| 2-Person Household | 45 | 36.0% |
| 3-Person Household | 10 | 8.0% |
| 4+ Person Household | 30 | 24.0% |
| Total Housing Units | 125 | 100.0% |
Occupancy by Ownership by Household Size in Marquette
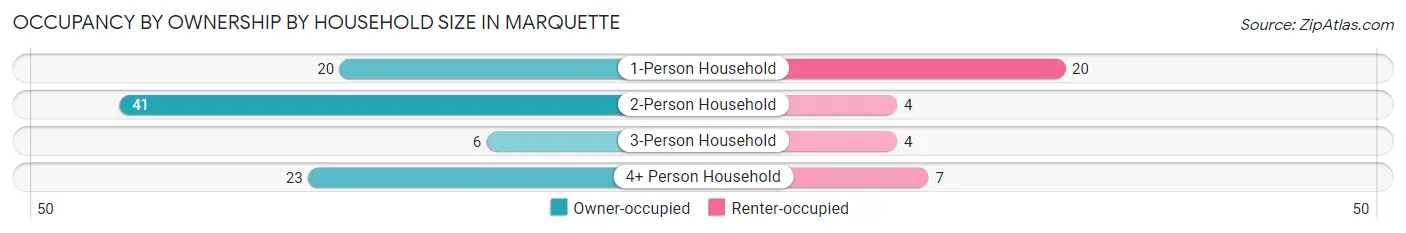
| Household Size | Owner-occupied | Renter-occupied |
| 1-Person Household | 20 (50.0%) | 20 (50.0%) |
| 2-Person Household | 41 (91.1%) | 4 (8.9%) |
| 3-Person Household | 6 (60.0%) | 4 (40.0%) |
| 4+ Person Household | 23 (76.7%) | 7 (23.3%) |
| Total Housing Units | 90 (72.0%) | 35 (28.0%) |
Occupancy by Educational Attainment in Marquette
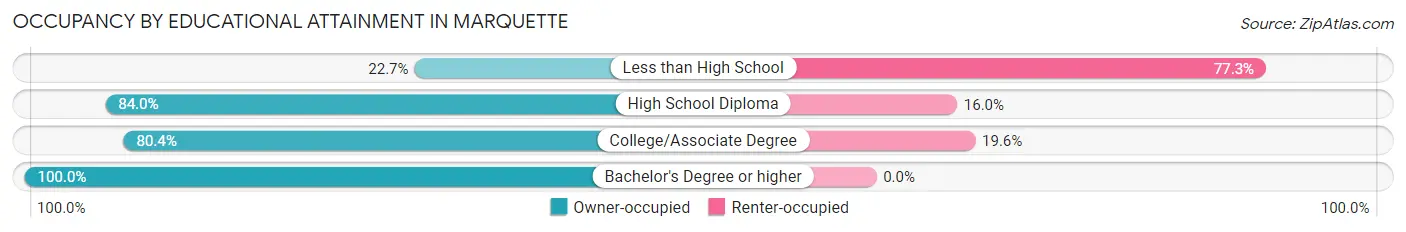
| Household Size | Owner-occupied | Renter-occupied |
| Less than High School | 5 (22.7%) | 17 (77.3%) |
| High School Diploma | 42 (84.0%) | 8 (16.0%) |
| College/Associate Degree | 41 (80.4%) | 10 (19.6%) |
| Bachelor's Degree or higher | 2 (100.0%) | 0 (0.0%) |
Occupancy by Age of Householder in Marquette
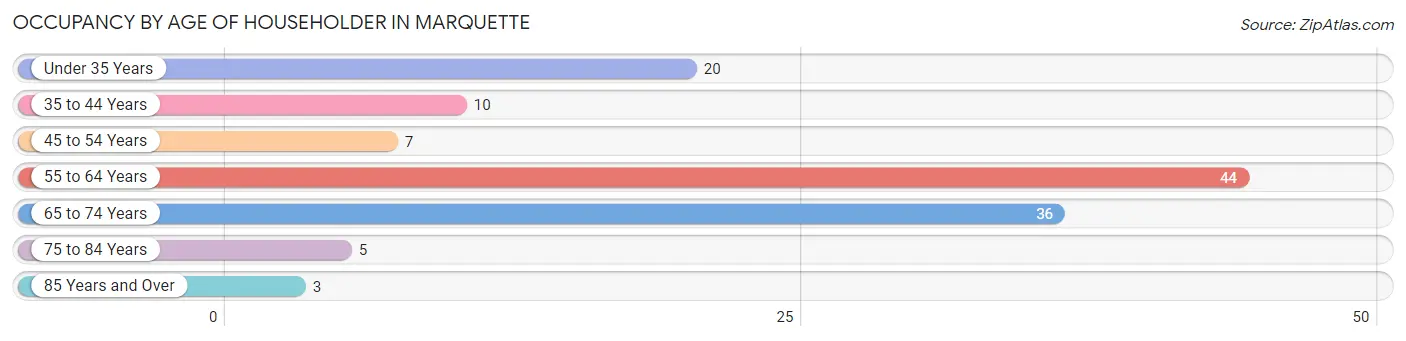
| Age Bracket | # Households | % Households |
| Under 35 Years | 20 | 16.0% |
| 35 to 44 Years | 10 | 8.0% |
| 45 to 54 Years | 7 | 5.6% |
| 55 to 64 Years | 44 | 35.2% |
| 65 to 74 Years | 36 | 28.8% |
| 75 to 84 Years | 5 | 4.0% |
| 85 Years and Over | 3 | 2.4% |
| Total | 125 | 100.0% |
Housing Finances in Marquette
Median Income by Occupancy in Marquette
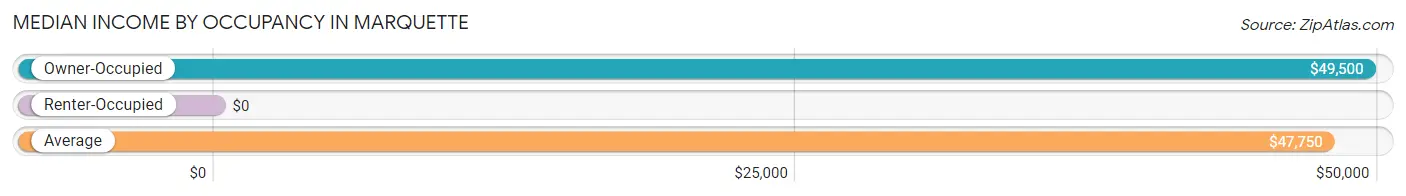
| Occupancy Type | # Households | Median Income |
| Owner-Occupied | 90 (72.0%) | $49,500 |
| Renter-Occupied | 35 (28.0%) | $0 |
| Average | 125 (100.0%) | $47,750 |
Occupancy by Householder Income Bracket in Marquette
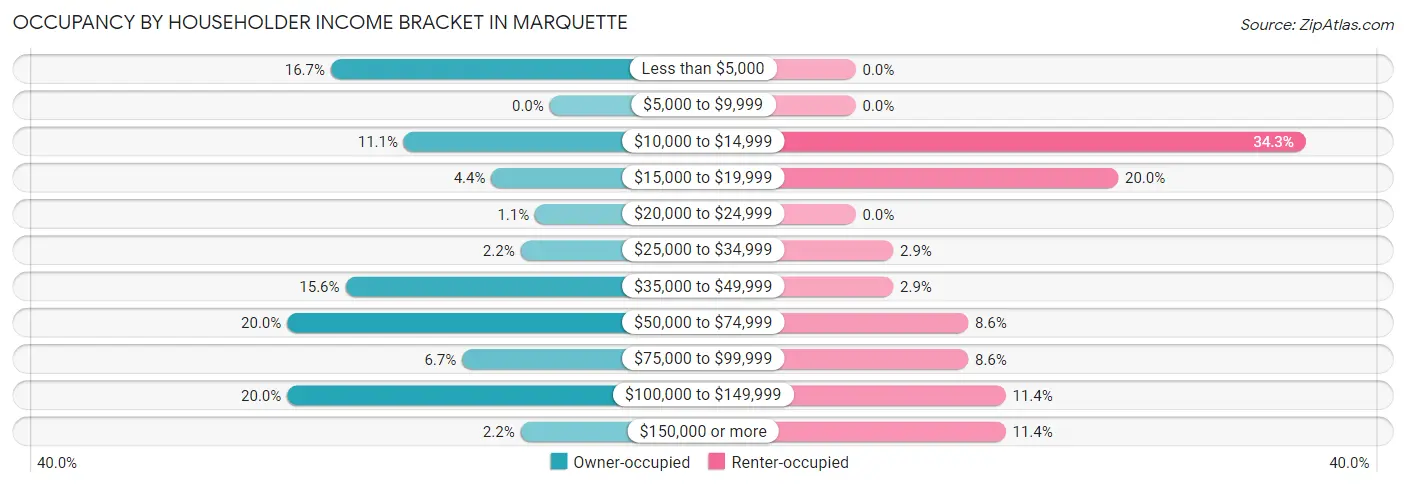
| Income Bracket | Owner-occupied | Renter-occupied |
| Less than $5,000 | 15 (16.7%) | 0 (0.0%) |
| $5,000 to $9,999 | 0 (0.0%) | 0 (0.0%) |
| $10,000 to $14,999 | 10 (11.1%) | 12 (34.3%) |
| $15,000 to $19,999 | 4 (4.4%) | 7 (20.0%) |
| $20,000 to $24,999 | 1 (1.1%) | 0 (0.0%) |
| $25,000 to $34,999 | 2 (2.2%) | 1 (2.9%) |
| $35,000 to $49,999 | 14 (15.6%) | 1 (2.9%) |
| $50,000 to $74,999 | 18 (20.0%) | 3 (8.6%) |
| $75,000 to $99,999 | 6 (6.7%) | 3 (8.6%) |
| $100,000 to $149,999 | 18 (20.0%) | 4 (11.4%) |
| $150,000 or more | 2 (2.2%) | 4 (11.4%) |
| Total | 90 (100.0%) | 35 (100.0%) |
Monthly Housing Cost Tiers in Marquette
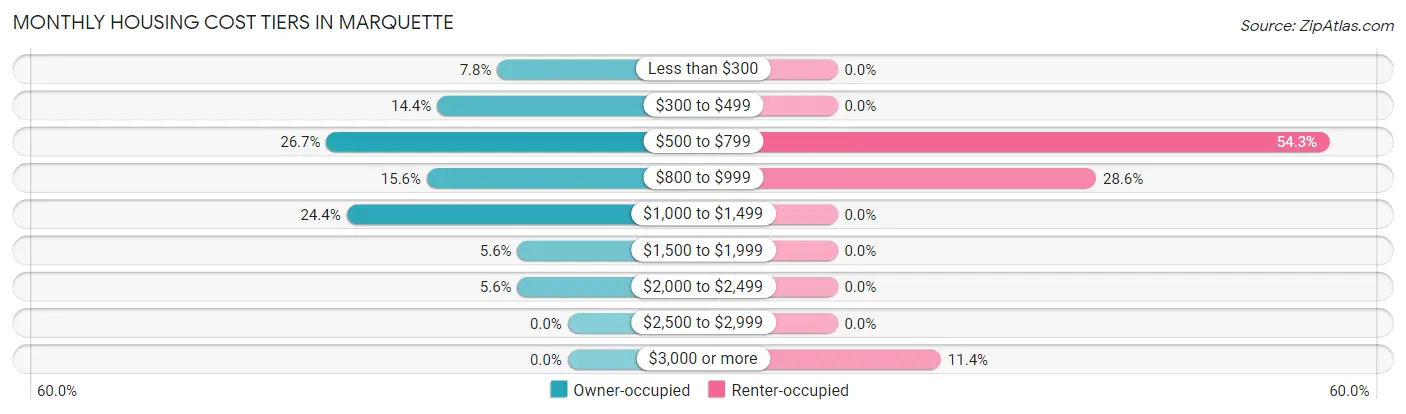
| Monthly Cost | Owner-occupied | Renter-occupied |
| Less than $300 | 7 (7.8%) | 0 (0.0%) |
| $300 to $499 | 13 (14.4%) | 0 (0.0%) |
| $500 to $799 | 24 (26.7%) | 19 (54.3%) |
| $800 to $999 | 14 (15.6%) | 10 (28.6%) |
| $1,000 to $1,499 | 22 (24.4%) | 0 (0.0%) |
| $1,500 to $1,999 | 5 (5.6%) | 0 (0.0%) |
| $2,000 to $2,499 | 5 (5.6%) | 0 (0.0%) |
| $2,500 to $2,999 | 0 (0.0%) | 0 (0.0%) |
| $3,000 or more | 0 (0.0%) | 4 (11.4%) |
| Total | 90 (100.0%) | 35 (100.0%) |
Physical Housing Characteristics in Marquette
Housing Structures in Marquette
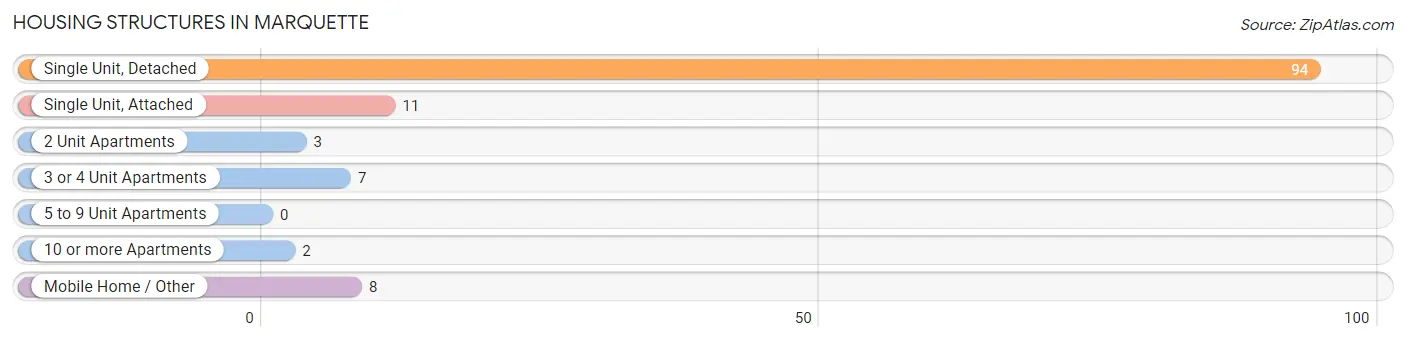
| Structure Type | # Housing Units | % Housing Units |
| Single Unit, Detached | 94 | 75.2% |
| Single Unit, Attached | 11 | 8.8% |
| 2 Unit Apartments | 3 | 2.4% |
| 3 or 4 Unit Apartments | 7 | 5.6% |
| 5 to 9 Unit Apartments | 0 | 0.0% |
| 10 or more Apartments | 2 | 1.6% |
| Mobile Home / Other | 8 | 6.4% |
| Total | 125 | 100.0% |
Housing Structures by Occupancy in Marquette
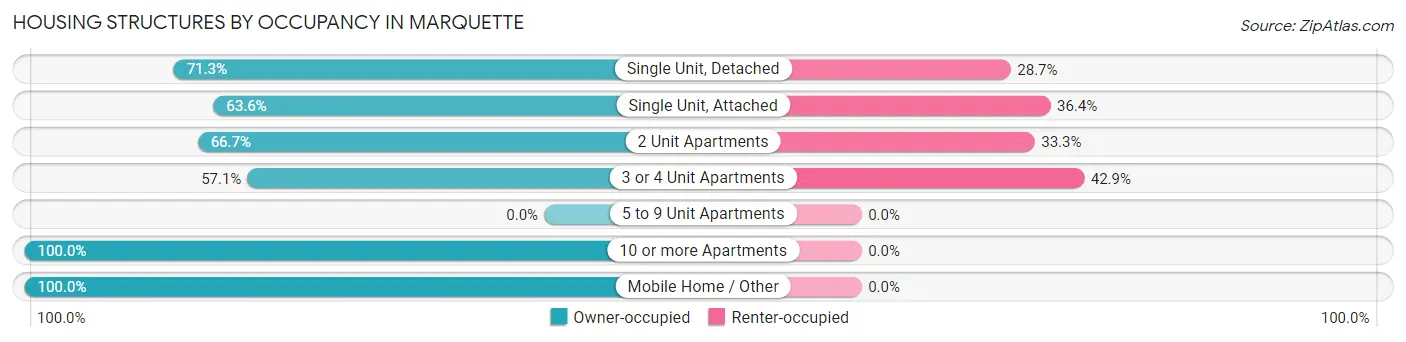
| Structure Type | Owner-occupied | Renter-occupied |
| Single Unit, Detached | 67 (71.3%) | 27 (28.7%) |
| Single Unit, Attached | 7 (63.6%) | 4 (36.4%) |
| 2 Unit Apartments | 2 (66.7%) | 1 (33.3%) |
| 3 or 4 Unit Apartments | 4 (57.1%) | 3 (42.9%) |
| 5 to 9 Unit Apartments | 0 (0.0%) | 0 (0.0%) |
| 10 or more Apartments | 2 (100.0%) | 0 (0.0%) |
| Mobile Home / Other | 8 (100.0%) | 0 (0.0%) |
| Total | 90 (72.0%) | 35 (28.0%) |
Housing Structures by Number of Rooms in Marquette
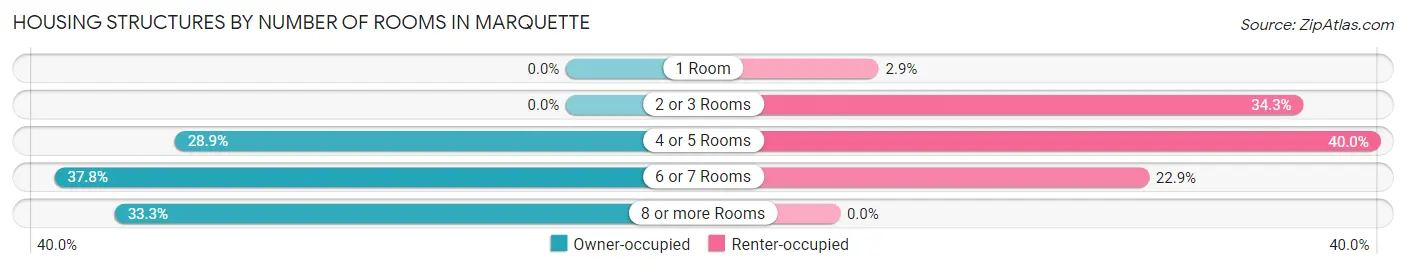
| Number of Rooms | Owner-occupied | Renter-occupied |
| 1 Room | 0 (0.0%) | 1 (2.9%) |
| 2 or 3 Rooms | 0 (0.0%) | 12 (34.3%) |
| 4 or 5 Rooms | 26 (28.9%) | 14 (40.0%) |
| 6 or 7 Rooms | 34 (37.8%) | 8 (22.9%) |
| 8 or more Rooms | 30 (33.3%) | 0 (0.0%) |
| Total | 90 (100.0%) | 35 (100.0%) |
Housing Structure by Heating Type in Marquette
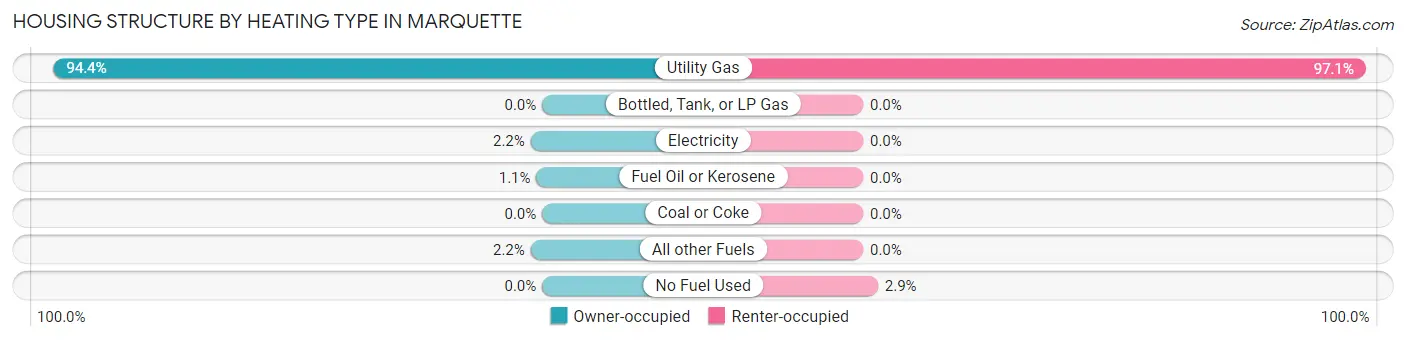
| Heating Type | Owner-occupied | Renter-occupied |
| Utility Gas | 85 (94.4%) | 34 (97.1%) |
| Bottled, Tank, or LP Gas | 0 (0.0%) | 0 (0.0%) |
| Electricity | 2 (2.2%) | 0 (0.0%) |
| Fuel Oil or Kerosene | 1 (1.1%) | 0 (0.0%) |
| Coal or Coke | 0 (0.0%) | 0 (0.0%) |
| All other Fuels | 2 (2.2%) | 0 (0.0%) |
| No Fuel Used | 0 (0.0%) | 1 (2.9%) |
| Total | 90 (100.0%) | 35 (100.0%) |
Household Vehicle Usage in Marquette
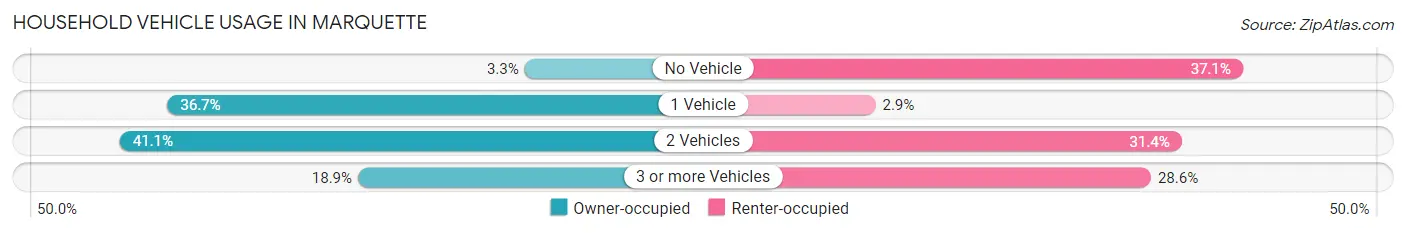
| Vehicles per Household | Owner-occupied | Renter-occupied |
| No Vehicle | 3 (3.3%) | 13 (37.1%) |
| 1 Vehicle | 33 (36.7%) | 1 (2.9%) |
| 2 Vehicles | 37 (41.1%) | 11 (31.4%) |
| 3 or more Vehicles | 17 (18.9%) | 10 (28.6%) |
| Total | 90 (100.0%) | 35 (100.0%) |
Real Estate & Mortgages in Marquette
Real Estate and Mortgage Overview in Marquette
| Characteristic | Without Mortgage | With Mortgage |
| Housing Units | 47 | 43 |
| Median Property Value | $143,800 | $184,500 |
| Median Household Income | $58,036 | $1 |
| Monthly Housing Costs | $522 | $0 |
| Real Estate Taxes | $2,786 | $0 |
Property Value by Mortgage Status in Marquette
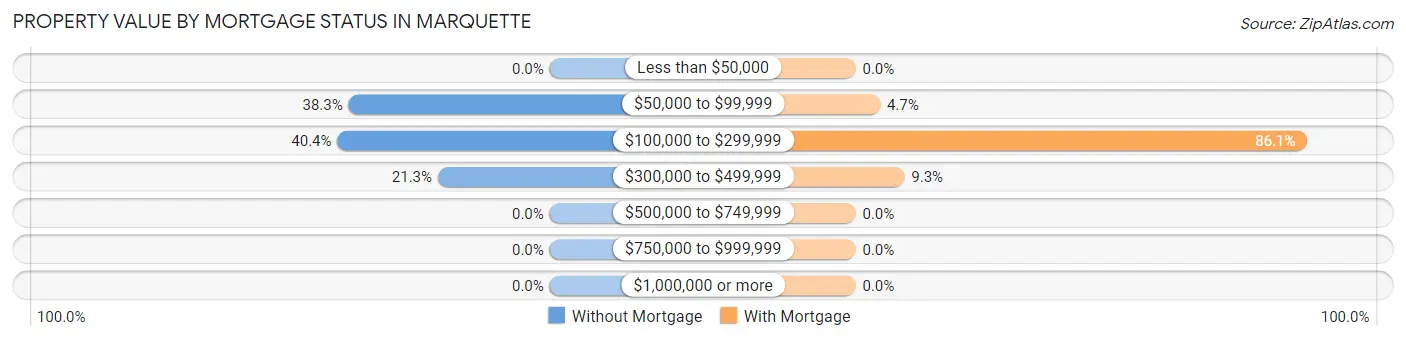
| Property Value | Without Mortgage | With Mortgage |
| Less than $50,000 | 0 (0.0%) | 0 (0.0%) |
| $50,000 to $99,999 | 18 (38.3%) | 2 (4.6%) |
| $100,000 to $299,999 | 19 (40.4%) | 37 (86.1%) |
| $300,000 to $499,999 | 10 (21.3%) | 4 (9.3%) |
| $500,000 to $749,999 | 0 (0.0%) | 0 (0.0%) |
| $750,000 to $999,999 | 0 (0.0%) | 0 (0.0%) |
| $1,000,000 or more | 0 (0.0%) | 0 (0.0%) |
| Total | 47 (100.0%) | 43 (100.0%) |
Household Income by Mortgage Status in Marquette
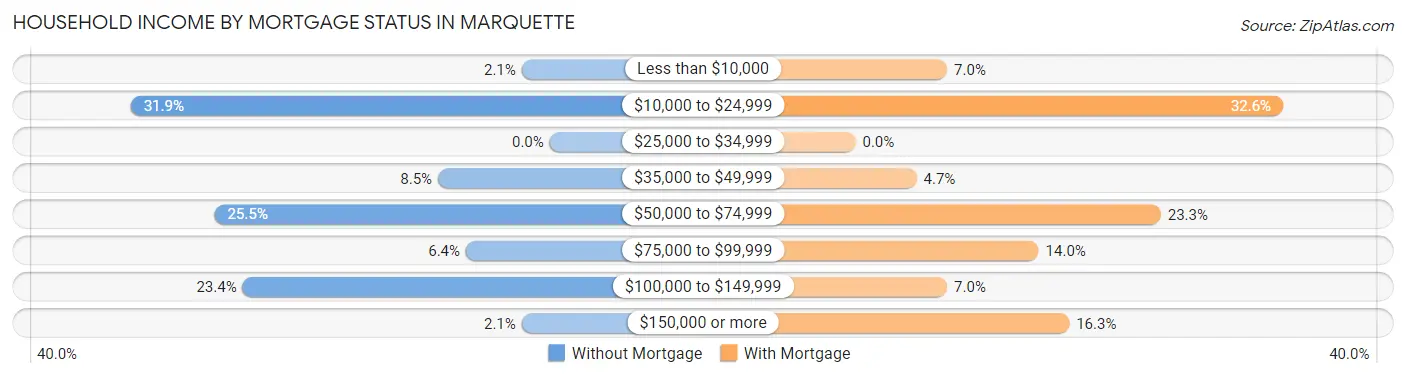
| Household Income | Without Mortgage | With Mortgage |
| Less than $10,000 | 1 (2.1%) | 3 (7.0%) |
| $10,000 to $24,999 | 15 (31.9%) | 14 (32.6%) |
| $25,000 to $34,999 | 0 (0.0%) | 0 (0.0%) |
| $35,000 to $49,999 | 4 (8.5%) | 2 (4.6%) |
| $50,000 to $74,999 | 12 (25.5%) | 10 (23.3%) |
| $75,000 to $99,999 | 3 (6.4%) | 6 (14.0%) |
| $100,000 to $149,999 | 11 (23.4%) | 3 (7.0%) |
| $150,000 or more | 1 (2.1%) | 7 (16.3%) |
| Total | 47 (100.0%) | 43 (100.0%) |
Property Value to Household Income Ratio in Marquette
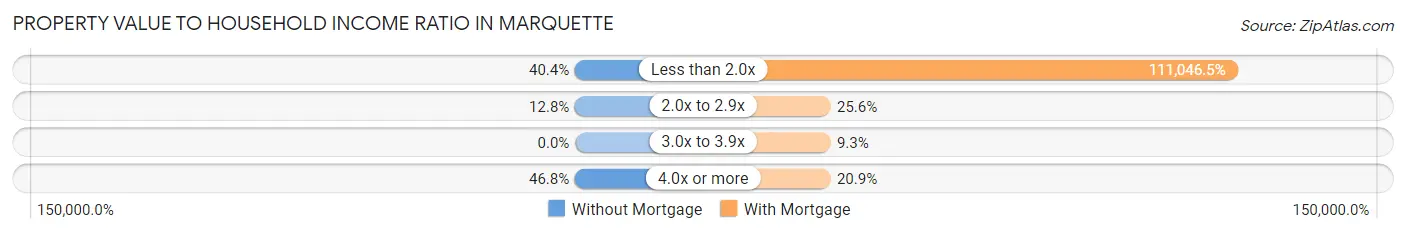
| Value-to-Income Ratio | Without Mortgage | With Mortgage |
| Less than 2.0x | 19 (40.4%) | 47,750 (111,046.5%) |
| 2.0x to 2.9x | 6 (12.8%) | 11 (25.6%) |
| 3.0x to 3.9x | 0 (0.0%) | 4 (9.3%) |
| 4.0x or more | 22 (46.8%) | 9 (20.9%) |
| Total | 47 (100.0%) | 43 (100.0%) |
Real Estate Taxes by Mortgage Status in Marquette
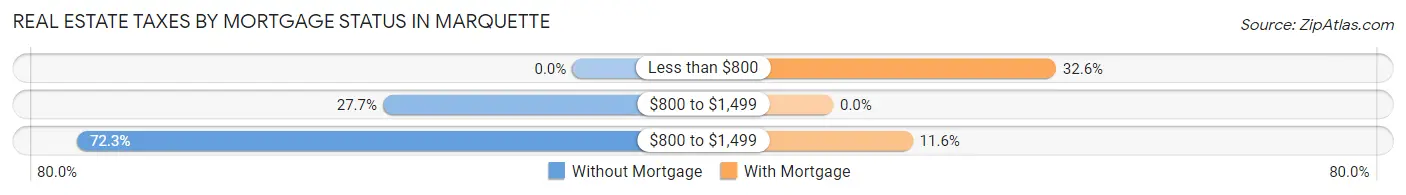
| Property Taxes | Without Mortgage | With Mortgage |
| Less than $800 | 0 (0.0%) | 14 (32.6%) |
| $800 to $1,499 | 13 (27.7%) | 0 (0.0%) |
| $800 to $1,499 | 34 (72.3%) | 5 (11.6%) |
| Total | 47 (100.0%) | 43 (100.0%) |
Health & Disability in Marquette
Health Insurance Coverage by Age in Marquette
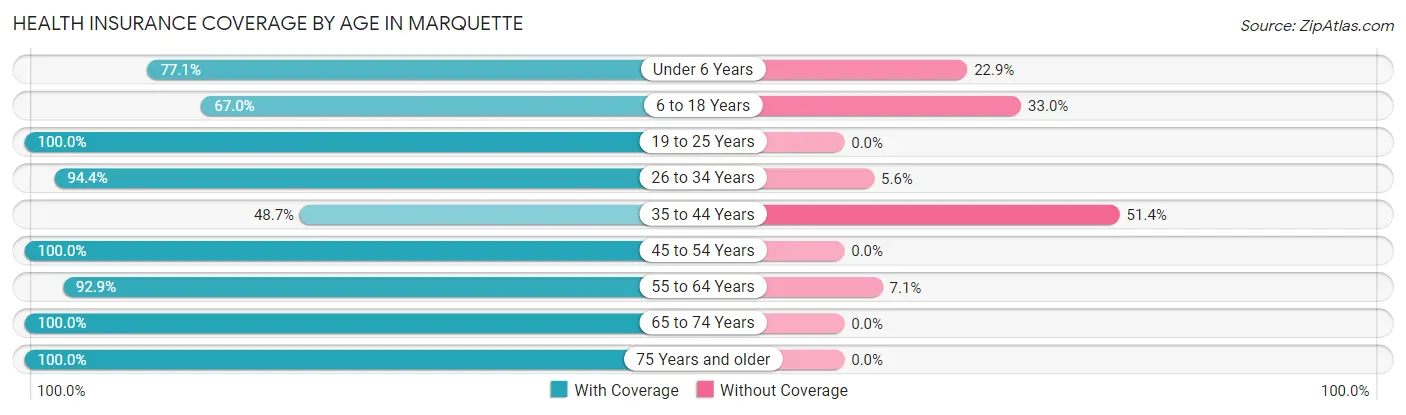
| Age Bracket | With Coverage | Without Coverage |
| Under 6 Years | 37 (77.1%) | 11 (22.9%) |
| 6 to 18 Years | 63 (67.0%) | 31 (33.0%) |
| 19 to 25 Years | 7 (100.0%) | 0 (0.0%) |
| 26 to 34 Years | 17 (94.4%) | 1 (5.6%) |
| 35 to 44 Years | 18 (48.6%) | 19 (51.3%) |
| 45 to 54 Years | 26 (100.0%) | 0 (0.0%) |
| 55 to 64 Years | 52 (92.9%) | 4 (7.1%) |
| 65 to 74 Years | 54 (100.0%) | 0 (0.0%) |
| 75 Years and older | 17 (100.0%) | 0 (0.0%) |
| Total | 291 (81.5%) | 66 (18.5%) |
Health Insurance Coverage by Citizenship Status in Marquette
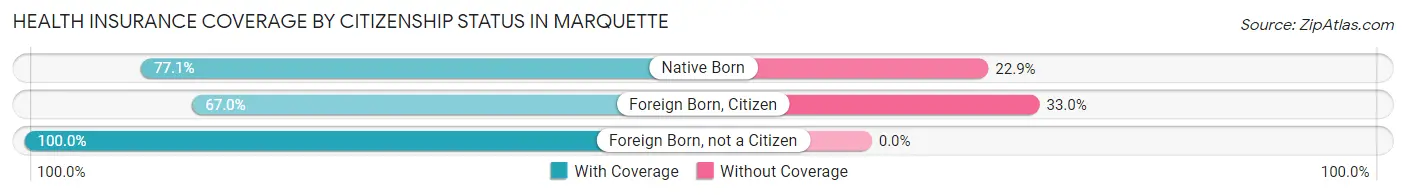
| Citizenship Status | With Coverage | Without Coverage |
| Native Born | 37 (77.1%) | 11 (22.9%) |
| Foreign Born, Citizen | 63 (67.0%) | 31 (33.0%) |
| Foreign Born, not a Citizen | 7 (100.0%) | 0 (0.0%) |
Health Insurance Coverage by Household Income in Marquette
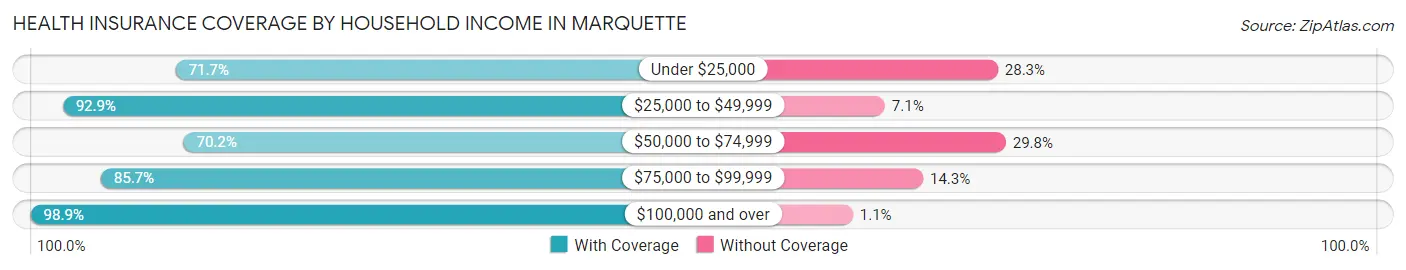
| Household Income | With Coverage | Without Coverage |
| Under $25,000 | 114 (71.7%) | 45 (28.3%) |
| $25,000 to $49,999 | 39 (92.9%) | 3 (7.1%) |
| $50,000 to $74,999 | 33 (70.2%) | 14 (29.8%) |
| $75,000 to $99,999 | 18 (85.7%) | 3 (14.3%) |
| $100,000 and over | 87 (98.9%) | 1 (1.1%) |
Public vs Private Health Insurance Coverage by Age in Marquette
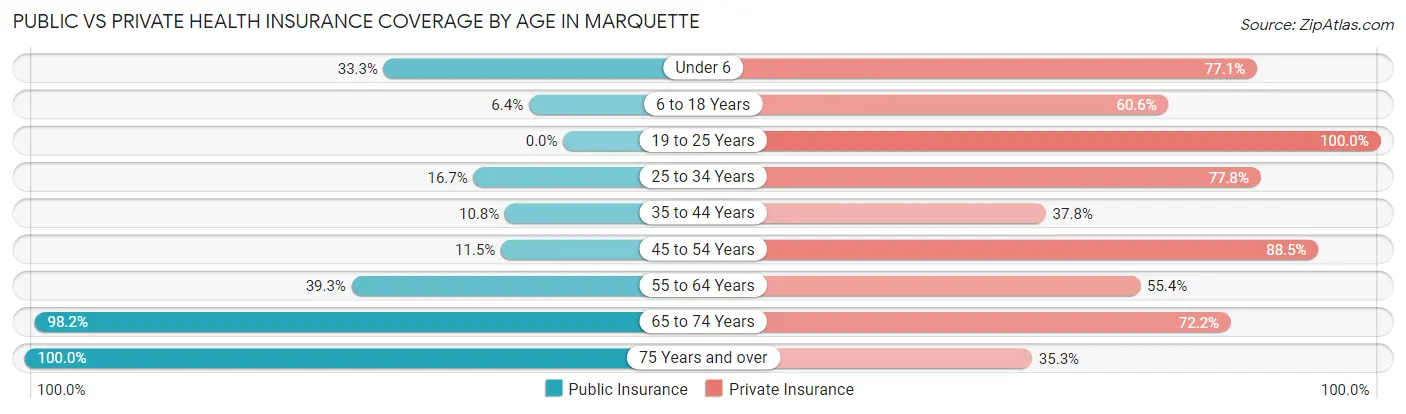
| Age Bracket | Public Insurance | Private Insurance |
| Under 6 | 16 (33.3%) | 37 (77.1%) |
| 6 to 18 Years | 6 (6.4%) | 57 (60.6%) |
| 19 to 25 Years | 0 (0.0%) | 7 (100.0%) |
| 25 to 34 Years | 3 (16.7%) | 14 (77.8%) |
| 35 to 44 Years | 4 (10.8%) | 14 (37.8%) |
| 45 to 54 Years | 3 (11.5%) | 23 (88.5%) |
| 55 to 64 Years | 22 (39.3%) | 31 (55.4%) |
| 65 to 74 Years | 53 (98.2%) | 39 (72.2%) |
| 75 Years and over | 17 (100.0%) | 6 (35.3%) |
| Total | 124 (34.7%) | 228 (63.9%) |
Disability Status by Sex by Age in Marquette
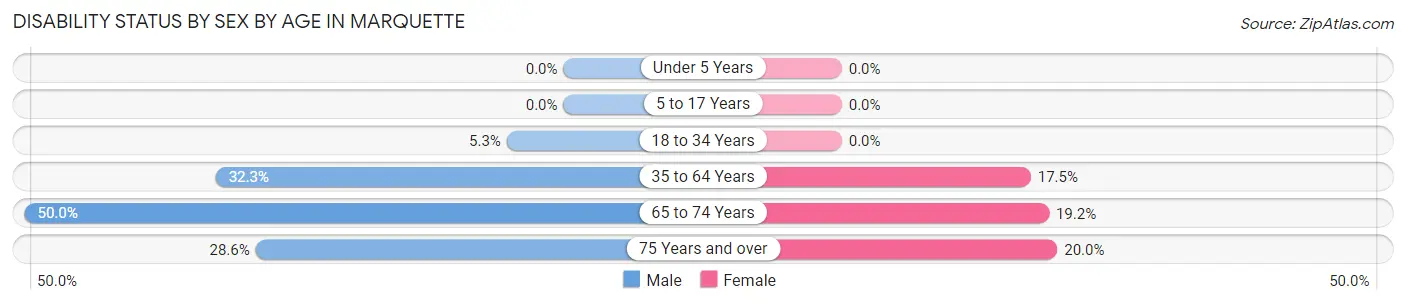
| Age Bracket | Male | Female |
| Under 5 Years | 0 (0.0%) | 0 (0.0%) |
| 5 to 17 Years | 0 (0.0%) | 0 (0.0%) |
| 18 to 34 Years | 1 (5.3%) | 0 (0.0%) |
| 35 to 64 Years | 20 (32.3%) | 10 (17.5%) |
| 65 to 74 Years | 14 (50.0%) | 5 (19.2%) |
| 75 Years and over | 2 (28.6%) | 2 (20.0%) |
Disability Class by Sex by Age in Marquette
Disability Class: Hearing Difficulty
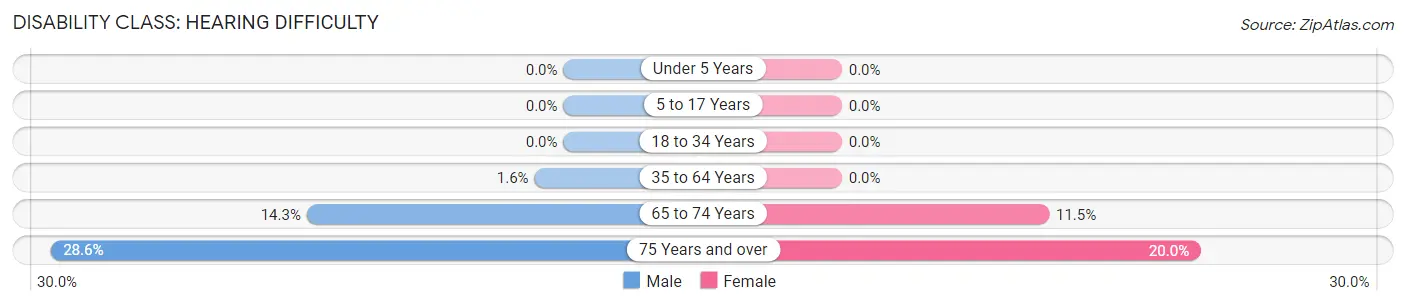
| Age Bracket | Male | Female |
| Under 5 Years | 0 (0.0%) | 0 (0.0%) |
| 5 to 17 Years | 0 (0.0%) | 0 (0.0%) |
| 18 to 34 Years | 0 (0.0%) | 0 (0.0%) |
| 35 to 64 Years | 1 (1.6%) | 0 (0.0%) |
| 65 to 74 Years | 4 (14.3%) | 3 (11.5%) |
| 75 Years and over | 2 (28.6%) | 2 (20.0%) |
Disability Class: Vision Difficulty
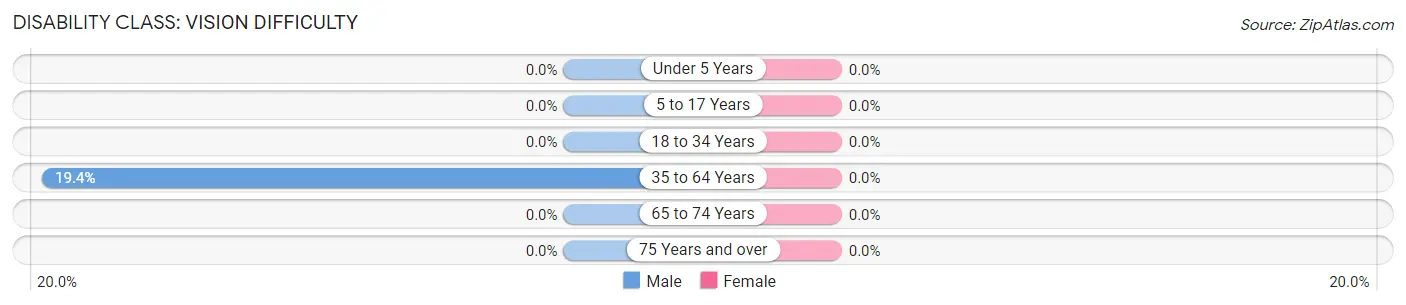
| Age Bracket | Male | Female |
| Under 5 Years | 0 (0.0%) | 0 (0.0%) |
| 5 to 17 Years | 0 (0.0%) | 0 (0.0%) |
| 18 to 34 Years | 0 (0.0%) | 0 (0.0%) |
| 35 to 64 Years | 12 (19.4%) | 0 (0.0%) |
| 65 to 74 Years | 0 (0.0%) | 0 (0.0%) |
| 75 Years and over | 0 (0.0%) | 0 (0.0%) |
Disability Class: Cognitive Difficulty
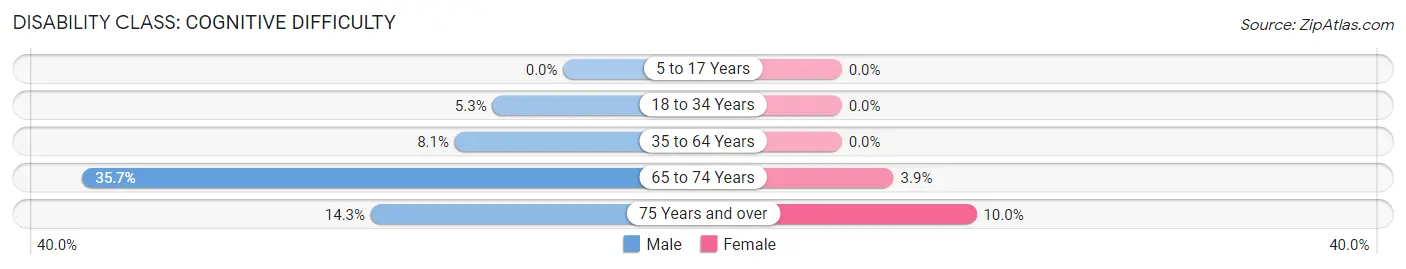
| Age Bracket | Male | Female |
| 5 to 17 Years | 0 (0.0%) | 0 (0.0%) |
| 18 to 34 Years | 1 (5.3%) | 0 (0.0%) |
| 35 to 64 Years | 5 (8.1%) | 0 (0.0%) |
| 65 to 74 Years | 10 (35.7%) | 1 (3.8%) |
| 75 Years and over | 1 (14.3%) | 1 (10.0%) |
Disability Class: Ambulatory Difficulty
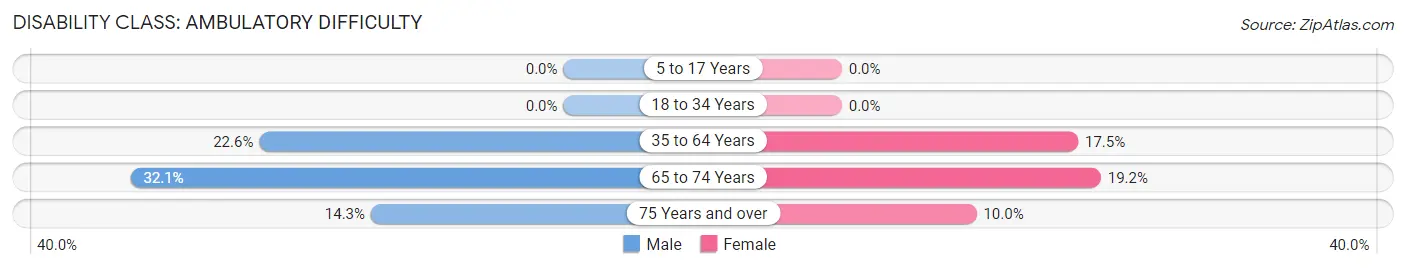
| Age Bracket | Male | Female |
| 5 to 17 Years | 0 (0.0%) | 0 (0.0%) |
| 18 to 34 Years | 0 (0.0%) | 0 (0.0%) |
| 35 to 64 Years | 14 (22.6%) | 10 (17.5%) |
| 65 to 74 Years | 9 (32.1%) | 5 (19.2%) |
| 75 Years and over | 1 (14.3%) | 1 (10.0%) |
Disability Class: Self-Care Difficulty
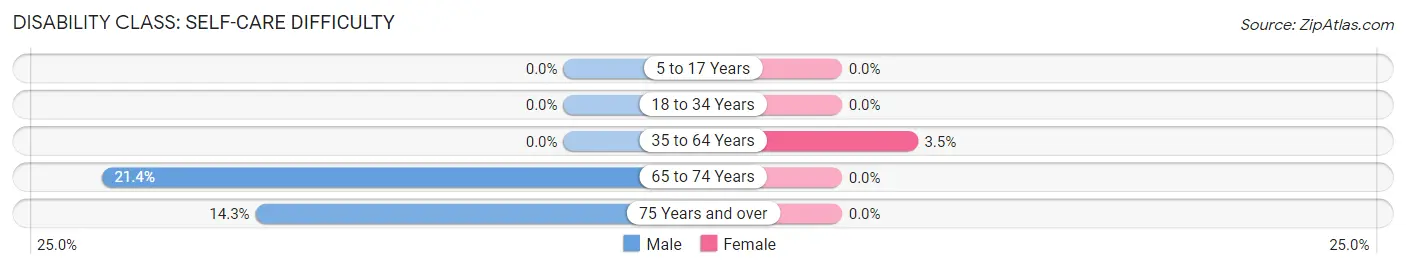
| Age Bracket | Male | Female |
| 5 to 17 Years | 0 (0.0%) | 0 (0.0%) |
| 18 to 34 Years | 0 (0.0%) | 0 (0.0%) |
| 35 to 64 Years | 0 (0.0%) | 2 (3.5%) |
| 65 to 74 Years | 6 (21.4%) | 0 (0.0%) |
| 75 Years and over | 1 (14.3%) | 0 (0.0%) |
Technology Access in Marquette
Computing Device Access in Marquette
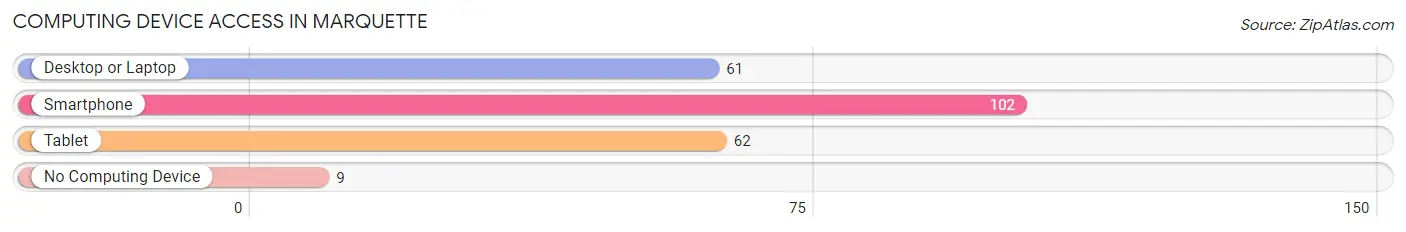
| Device Type | # Households | % Households |
| Desktop or Laptop | 61 | 48.8% |
| Smartphone | 102 | 81.6% |
| Tablet | 62 | 49.6% |
| No Computing Device | 9 | 7.2% |
| Total | 125 | 100.0% |
Internet Access in Marquette
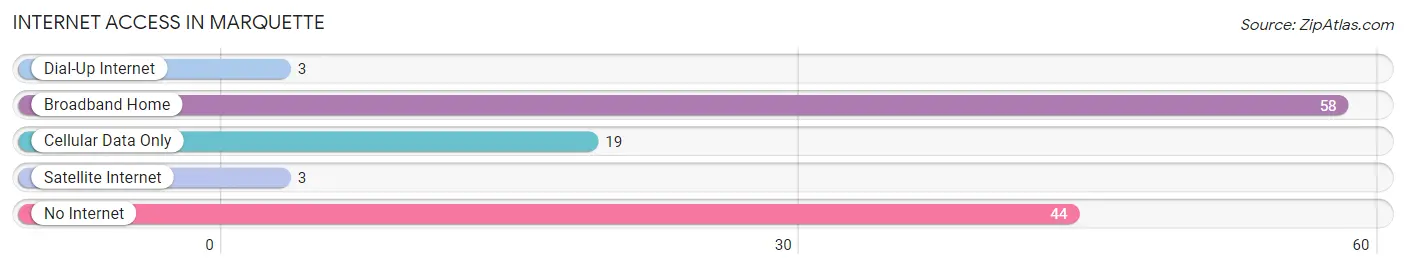
| Internet Type | # Households | % Households |
| Dial-Up Internet | 3 | 2.4% |
| Broadband Home | 58 | 46.4% |
| Cellular Data Only | 19 | 15.2% |
| Satellite Internet | 3 | 2.4% |
| No Internet | 44 | 35.2% |
| Total | 125 | 100.0% |
Marquette Summary
Marquette, Wisconsin is a small city located in the Upper Peninsula of Michigan. It is the county seat of Marquette County and is situated on the shores of Lake Superior. The city has a population of approximately 21,000 people and is the largest city in the Upper Peninsula.
Marquette was founded in 1849 by Father Jacques Marquette, a French Jesuit missionary. The city was named after him and was originally a trading post for the local Native American tribes. The city quickly grew and by the late 19th century, it had become a major port for the Great Lakes shipping industry.
Geographically, Marquette is located on the northern shore of Lake Superior. The city is surrounded by forests and is home to several parks and nature preserves. The city is also home to several ski resorts and is a popular destination for outdoor recreation.
The economy of Marquette is largely based on tourism and the service industry. The city is home to several universities and colleges, including Northern Michigan University, which is the largest employer in the city. The city also has a thriving medical and healthcare industry, as well as a strong manufacturing sector.
The demographics of Marquette are largely white, with a small percentage of African Americans, Hispanics, and Native Americans. The median household income is around $40,000, and the median age is around 40 years old. The city has a relatively low crime rate and is considered to be a safe place to live.
Marquette is a vibrant and diverse city with a rich history and culture. It is a great place to live and work, and offers a variety of activities and attractions for visitors and residents alike. The city is a great place to explore and experience the beauty of the Upper Peninsula.
Common Questions
What is the Total Population of Marquette?
Total Population of Marquette is 357.
What is the Total Male Population of Marquette?
Total Male Population of Marquette is 188.
What is the Total Female Population of Marquette?
Total Female Population of Marquette is 169.
What is the Ratio of Males per 100 Females in Marquette?
There are 111.24 Males per 100 Females in Marquette.
What is the Ratio of Females per 100 Males in Marquette?
There are 89.89 Females per 100 Males in Marquette.
What is the Median Population Age in Marquette?
Median Population Age in Marquette is 37.5 Years.
What is the Average Family Size in Marquette
Average Family Size in Marquette is 3.8 People.
What is the Average Household Size in Marquette
Average Household Size in Marquette is 2.9 People.
What is Per Capita Income in Marquette?
Per Capita income in Marquette is $29,354.
What is the Median Family Income in Marquette?
Median Family Income in Marquette is $58,393.
What is the Median Household income in Marquette?
Median Household Income in Marquette is $47,750.
What is Income or Wage Gap in Marquette?
Income or Wage Gap in Marquette is 36.5%.
Women in Marquette earn 63.5 cents for every dollar earned by a man.
What is Inequality or Gini Index in Marquette?
Inequality or Gini Index in Marquette is 0.68.
How Large is the Labor Force in Marquette?
There are 96 People in the Labor Forcein in Marquette.
What is the Percentage of People in the Labor Force in Marquette?
42.9% of People are in the Labor Force in Marquette.
What is the Unemployment Rate in Marquette?
Unemployment Rate in Marquette is 6.3%.