Maiden Rock, WI
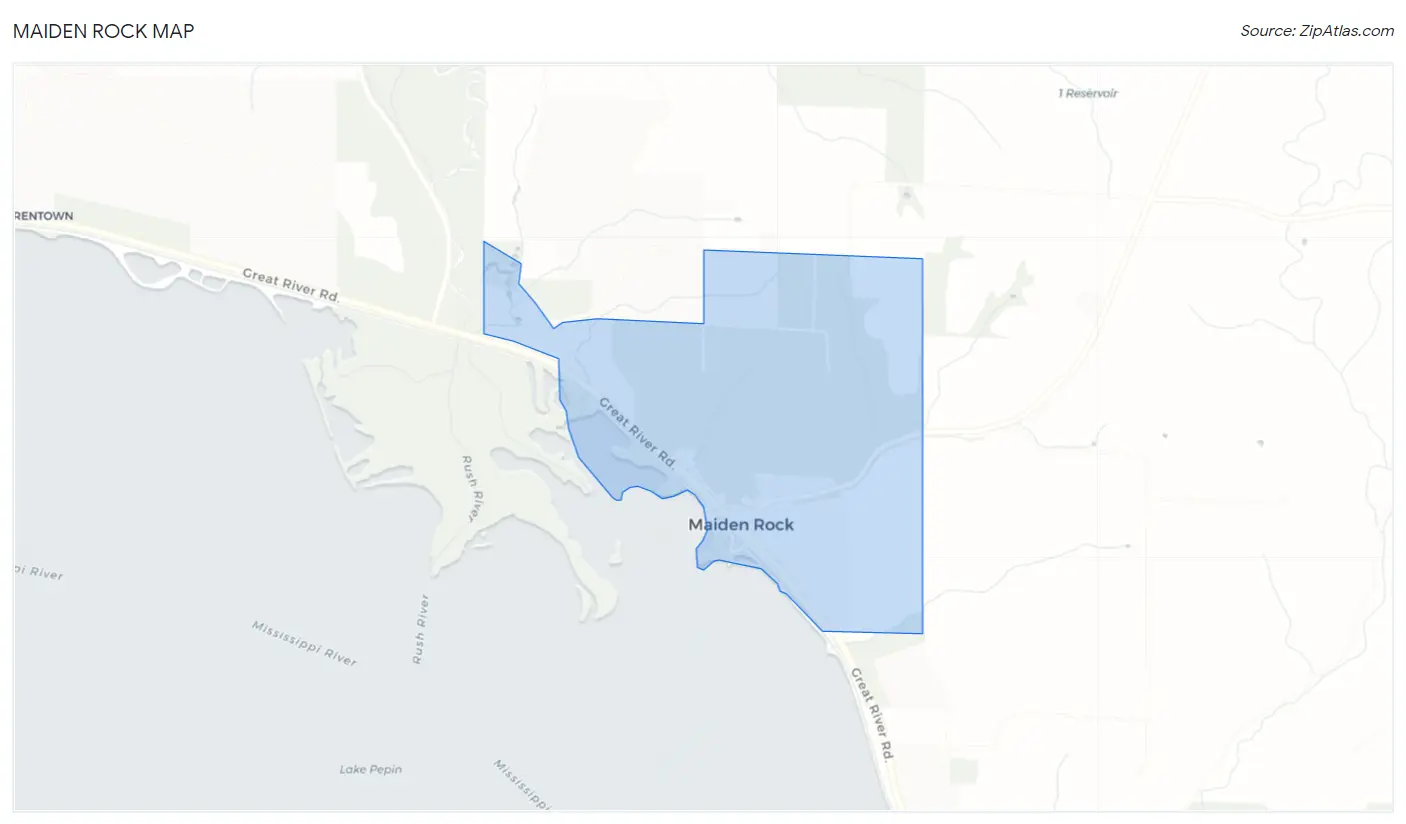
Maiden Rock Map
Maiden Rock Overview
96
TOTAL POPULATION
50
MALE POPULATION
46
FEMALE POPULATION
108.70
MALES / 100 FEMALES
92.00
FEMALES / 100 MALES
52.8
MEDIAN AGE
2.4
AVG FAMILY SIZE
1.9
AVG HOUSEHOLD SIZE
$49,003
PER CAPITA INCOME
$80,250
AVG HOUSEHOLD INCOME
0.41
INEQUALITY / GINI INDEX
56
LABOR FORCE [ PEOPLE ]
68.3%
PERCENT IN LABOR FORCE
1.8%
UNEMPLOYMENT RATE
Maiden Rock Zip Codes
Maiden Rock Area Codes
Race in Maiden Rock
The most populous races in Maiden Rock are White / Caucasian (93 | 96.9%), and Two or more Races (3 | 3.1%).
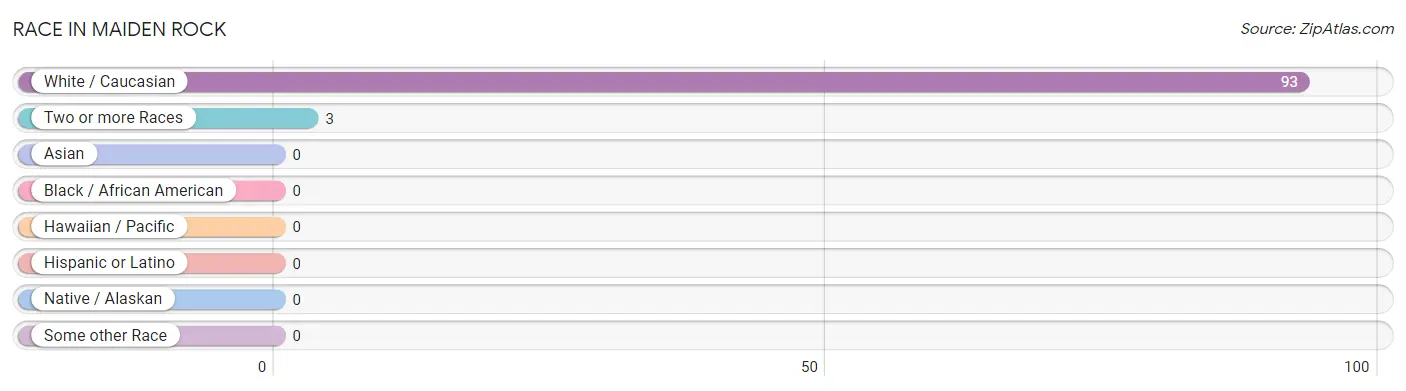
| Race | # Population | % Population |
| Asian | 0 | 0.0% |
| Black / African American | 0 | 0.0% |
| Hawaiian / Pacific | 0 | 0.0% |
| Hispanic or Latino | 0 | 0.0% |
| Native / Alaskan | 0 | 0.0% |
| White / Caucasian | 93 | 96.9% |
| Two or more Races | 3 | 3.1% |
| Some other Race | 0 | 0.0% |
| Total | 96 | 100.0% |
Ancestry in Maiden Rock
The most populous ancestries reported in Maiden Rock are German (17 | 17.7%), English (16 | 16.7%), Norwegian (8 | 8.3%), Swedish (8 | 8.3%), and Czech (4 | 4.2%), together accounting for 55.2% of all Maiden Rock residents.
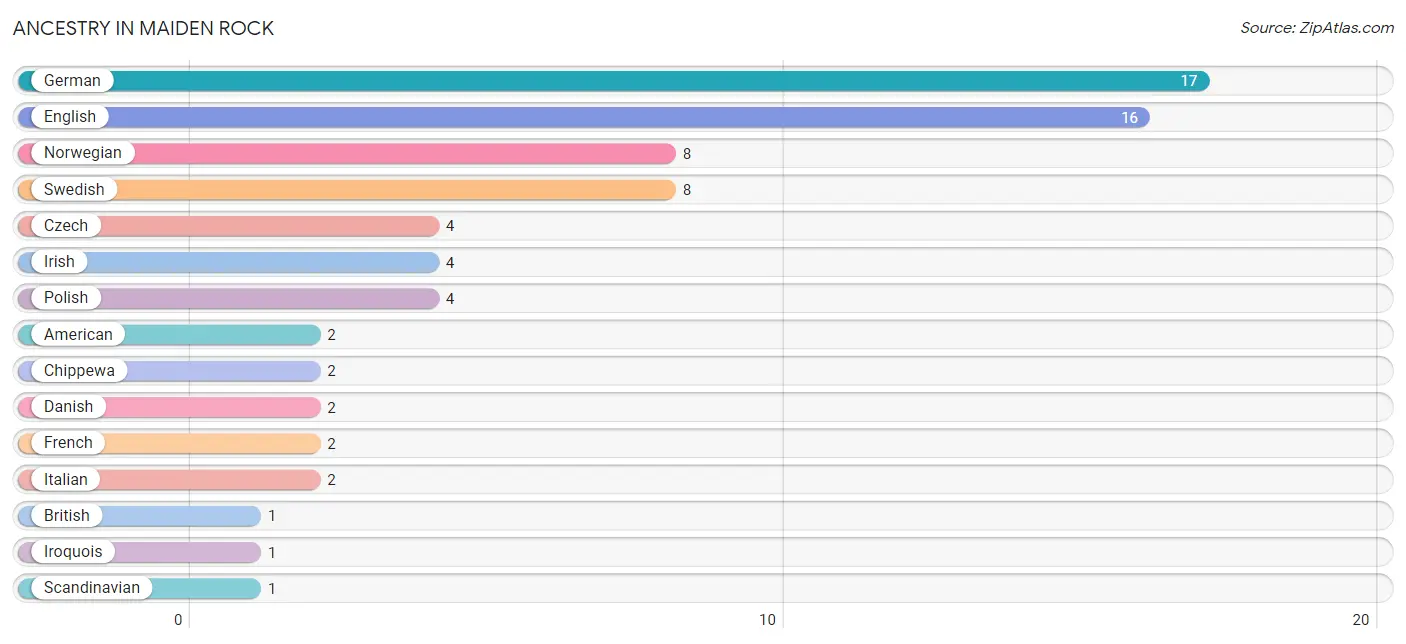
| Ancestry | # Population | % Population |
| American | 2 | 2.1% |
| British | 1 | 1.0% |
| Chippewa | 2 | 2.1% |
| Czech | 4 | 4.2% |
| Danish | 2 | 2.1% |
| English | 16 | 16.7% |
| French | 2 | 2.1% |
| German | 17 | 17.7% |
| Irish | 4 | 4.2% |
| Iroquois | 1 | 1.0% |
| Italian | 2 | 2.1% |
| Norwegian | 8 | 8.3% |
| Polish | 4 | 4.2% |
| Scandinavian | 1 | 1.0% |
| Swedish | 8 | 8.3% |
| Swiss | 1 | 1.0% | View All 16 Rows |
Immigrants in Maiden Rock

| Immigration Origin | # Population | % Population | View All 0 Rows |
Sex and Age in Maiden Rock
Sex and Age in Maiden Rock
The most populous age groups in Maiden Rock are 50 to 54 Years (10 | 20.0%) for men and 70 to 74 Years (9 | 19.6%) for women.
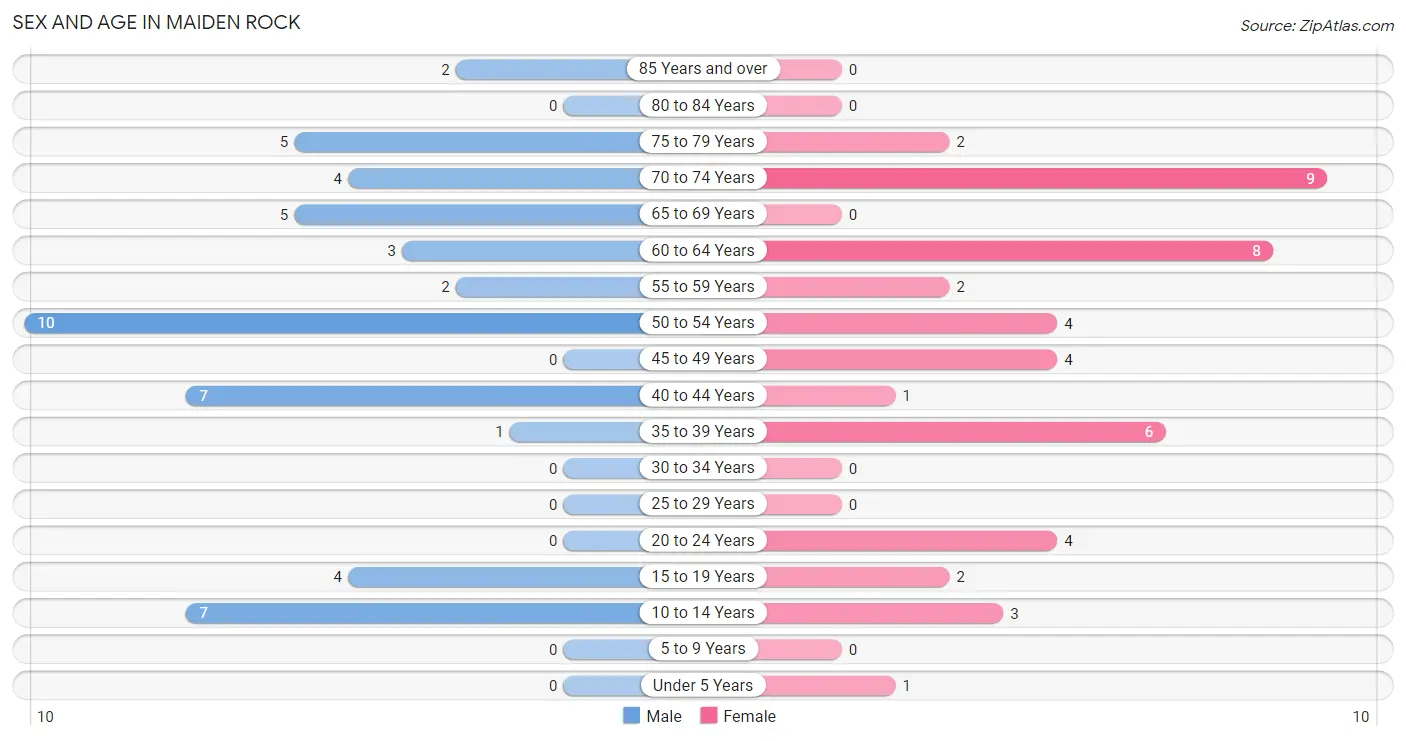
| Age Bracket | Male | Female |
| Under 5 Years | 0 (0.0%) | 1 (2.2%) |
| 5 to 9 Years | 0 (0.0%) | 0 (0.0%) |
| 10 to 14 Years | 7 (14.0%) | 3 (6.5%) |
| 15 to 19 Years | 4 (8.0%) | 2 (4.3%) |
| 20 to 24 Years | 0 (0.0%) | 4 (8.7%) |
| 25 to 29 Years | 0 (0.0%) | 0 (0.0%) |
| 30 to 34 Years | 0 (0.0%) | 0 (0.0%) |
| 35 to 39 Years | 1 (2.0%) | 6 (13.0%) |
| 40 to 44 Years | 7 (14.0%) | 1 (2.2%) |
| 45 to 49 Years | 0 (0.0%) | 4 (8.7%) |
| 50 to 54 Years | 10 (20.0%) | 4 (8.7%) |
| 55 to 59 Years | 2 (4.0%) | 2 (4.3%) |
| 60 to 64 Years | 3 (6.0%) | 8 (17.4%) |
| 65 to 69 Years | 5 (10.0%) | 0 (0.0%) |
| 70 to 74 Years | 4 (8.0%) | 9 (19.6%) |
| 75 to 79 Years | 5 (10.0%) | 2 (4.3%) |
| 80 to 84 Years | 0 (0.0%) | 0 (0.0%) |
| 85 Years and over | 2 (4.0%) | 0 (0.0%) |
| Total | 50 (100.0%) | 46 (100.0%) |
Families and Households in Maiden Rock
Median Family Size in Maiden Rock
The median family size in Maiden Rock is 2.38 persons per family, with single female/mother families (2 | 6.9%) accounting for the largest median family size of 3.5 persons per family. On the other hand, married-couple families (24 | 82.8%) represent the smallest median family size with 2.21 persons per family.
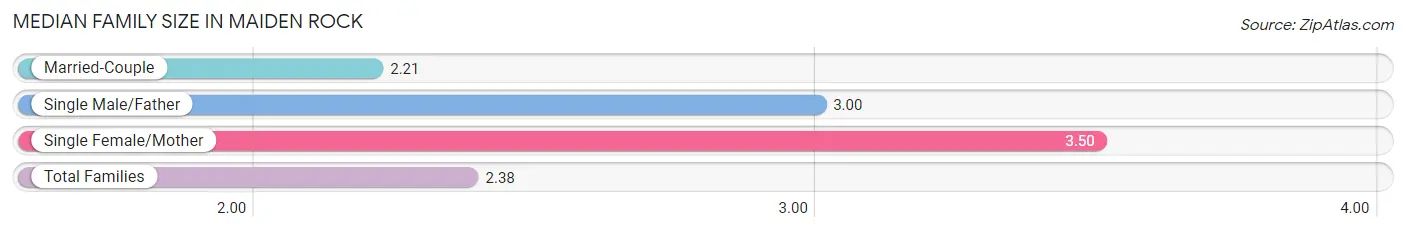
| Family Type | # Families | Family Size |
| Married-Couple | 24 (82.8%) | 2.21 |
| Single Male/Father | 3 (10.3%) | 3.00 |
| Single Female/Mother | 2 (6.9%) | 3.50 |
| Total Families | 29 (100.0%) | 2.38 |
Median Household Size in Maiden Rock
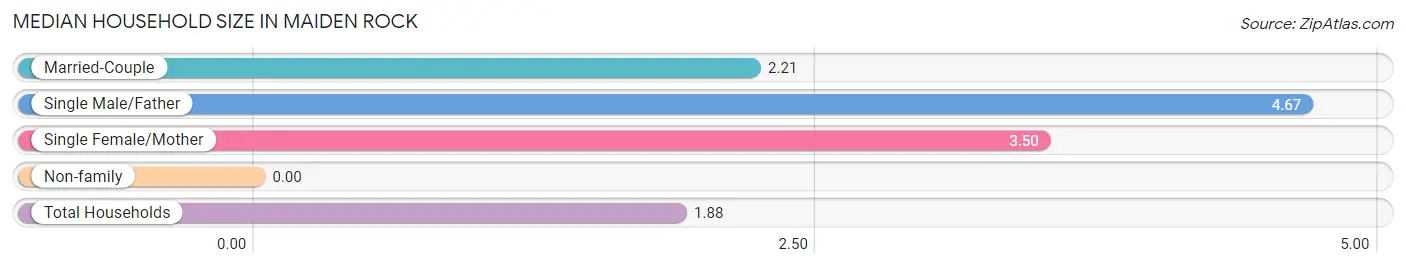
| Household Type | # Households | Household Size |
| Married-Couple | 24 (47.1%) | 2.21 |
| Single Male/Father | 3 (5.9%) | 4.67 |
| Single Female/Mother | 2 (3.9%) | 3.50 |
| Non-family | 22 (43.1%) | - |
| Total Households | 51 (100.0%) | 1.88 |
Household Size by Marriage Status in Maiden Rock
Out of a total of 51 households in Maiden Rock, 29 (56.9%) are family households, while 22 (43.1%) are nonfamily households. The most numerous type of family households are 2-person households, comprising 17, and the most common type of nonfamily households are 1-person households, comprising 22.
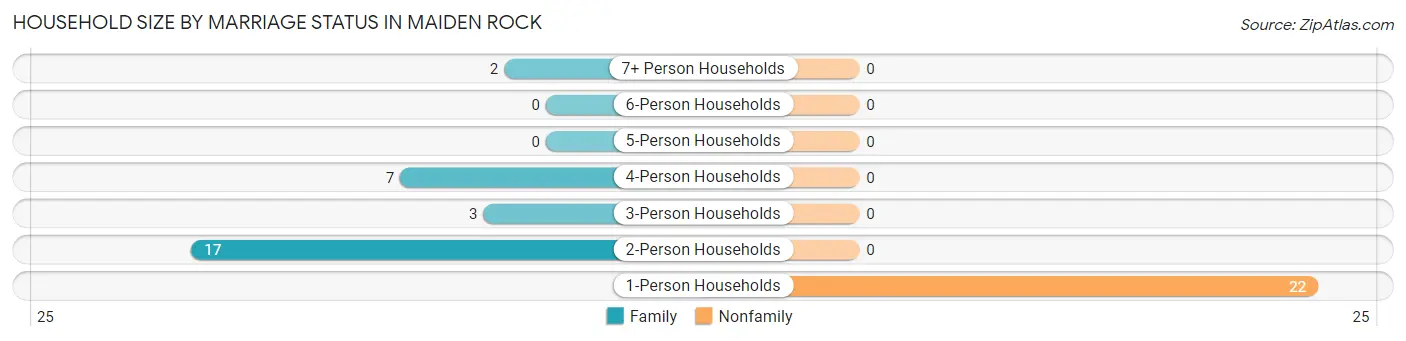
| Household Size | Family Households | Nonfamily Households |
| 1-Person Households | - | 22 (43.1%) |
| 2-Person Households | 17 (33.3%) | 0 (0.0%) |
| 3-Person Households | 3 (5.9%) | 0 (0.0%) |
| 4-Person Households | 7 (13.7%) | 0 (0.0%) |
| 5-Person Households | 0 (0.0%) | 0 (0.0%) |
| 6-Person Households | 0 (0.0%) | 0 (0.0%) |
| 7+ Person Households | 2 (3.9%) | 0 (0.0%) |
| Total | 29 (56.9%) | 22 (43.1%) |
Female Fertility in Maiden Rock
Fertility by Age in Maiden Rock
| Age Bracket | Women with Births | Births / 1,000 Women |
| 15 to 19 years | 0 (0.0%) | 0.0 |
| 20 to 34 years | 0 (0.0%) | 0.0 |
| 35 to 50 years | 0 (0.0%) | 0.0 |
| Total | 0 (0.0%) | 0.0 |
Fertility by Age by Marriage Status in Maiden Rock
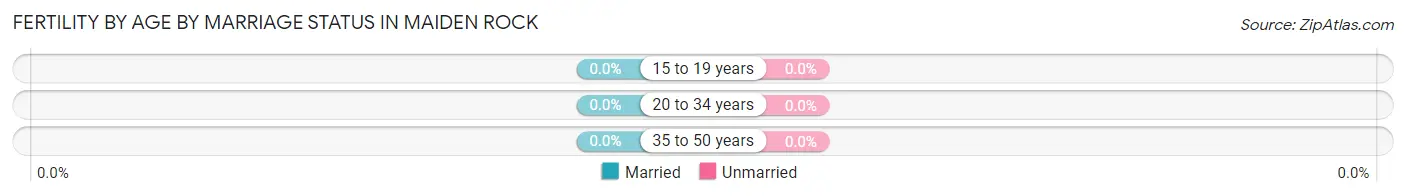
| Age Bracket | Married | Unmarried |
| 15 to 19 years | 0 (0.0%) | 0 (0.0%) |
| 20 to 34 years | 0 (0.0%) | 0 (0.0%) |
| 35 to 50 years | 0 (0.0%) | 0 (0.0%) |
| Total | 0 (0.0%) | 0 (0.0%) |
Fertility by Education in Maiden Rock
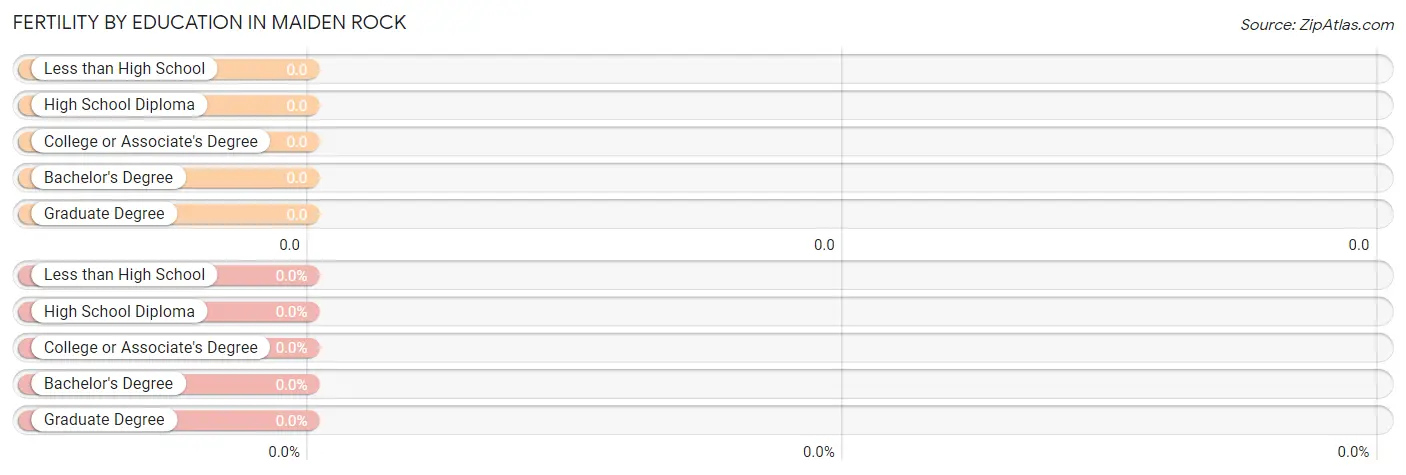
| Educational Attainment | Women with Births | Births / 1,000 Women |
| Less than High School | 0 (0.0%) | 0.0 |
| High School Diploma | 0 (0.0%) | 0.0 |
| College or Associate's Degree | 0 (0.0%) | 0.0 |
| Bachelor's Degree | 0 (0.0%) | 0.0 |
| Graduate Degree | 0 (0.0%) | 0.0 |
| Total | 0 (0.0%) | 0.0 |
Fertility by Education by Marriage Status in Maiden Rock
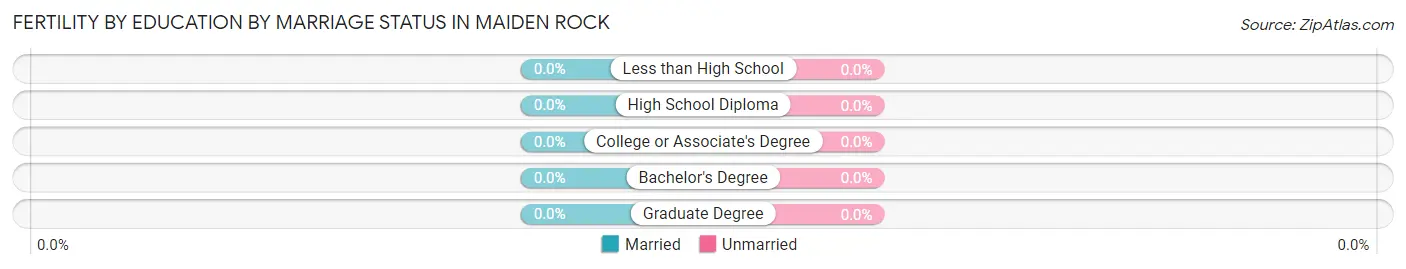
| Educational Attainment | Married | Unmarried |
| Less than High School | 0 (0.0%) | 0 (0.0%) |
| High School Diploma | 0 (0.0%) | 0 (0.0%) |
| College or Associate's Degree | 0 (0.0%) | 0 (0.0%) |
| Bachelor's Degree | 0 (0.0%) | 0 (0.0%) |
| Graduate Degree | 0 (0.0%) | 0 (0.0%) |
| Total | 0 (0.0%) | 0 (0.0%) |
Income in Maiden Rock
Income Overview in Maiden Rock
| Characteristic | Number | Measure |
| Per Capita Income | 96 | $49,003 |
| Median Family Income | 29 | $0 |
| Mean Family Income | 29 | $134,266 |
| Median Household Income | 51 | $80,250 |
| Mean Household Income | 51 | $96,580 |
| Income Deficit | 29 | $0 |
| Wage / Income Gap (%) | 96 | 0.00% |
| Wage / Income Gap ($) | 96 | 100.00¢ per $1 |
| Gini / Inequality Index | 96 | 0.41 |
Earnings by Sex in Maiden Rock
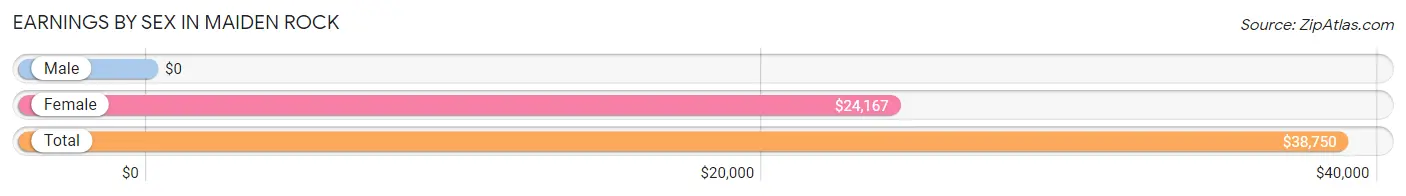
| Sex | Number | Average Earnings |
| Male | 31 (50.8%) | $0 |
| Female | 30 (49.2%) | $24,167 |
| Total | 61 (100.0%) | $38,750 |
Earnings by Sex by Income Bracket in Maiden Rock
The most common earnings brackets in Maiden Rock are $10,000 to $12,499 for men (9 | 29.0%) and $22,500 to $24,999 for women (6 | 20.0%).

| Income | Male | Female |
| $2,499 or less | 0 (0.0%) | 5 (16.7%) |
| $2,500 to $4,999 | 0 (0.0%) | 0 (0.0%) |
| $5,000 to $7,499 | 0 (0.0%) | 0 (0.0%) |
| $7,500 to $9,999 | 0 (0.0%) | 0 (0.0%) |
| $10,000 to $12,499 | 9 (29.0%) | 0 (0.0%) |
| $12,500 to $14,999 | 0 (0.0%) | 0 (0.0%) |
| $15,000 to $17,499 | 0 (0.0%) | 4 (13.3%) |
| $17,500 to $19,999 | 1 (3.2%) | 2 (6.7%) |
| $20,000 to $22,499 | 2 (6.5%) | 0 (0.0%) |
| $22,500 to $24,999 | 0 (0.0%) | 6 (20.0%) |
| $25,000 to $29,999 | 0 (0.0%) | 0 (0.0%) |
| $30,000 to $34,999 | 1 (3.2%) | 0 (0.0%) |
| $35,000 to $39,999 | 1 (3.2%) | 0 (0.0%) |
| $40,000 to $44,999 | 1 (3.2%) | 4 (13.3%) |
| $45,000 to $49,999 | 0 (0.0%) | 0 (0.0%) |
| $50,000 to $54,999 | 1 (3.2%) | 0 (0.0%) |
| $55,000 to $64,999 | 1 (3.2%) | 5 (16.7%) |
| $65,000 to $74,999 | 0 (0.0%) | 1 (3.3%) |
| $75,000 to $99,999 | 7 (22.6%) | 1 (3.3%) |
| $100,000+ | 7 (22.6%) | 2 (6.7%) |
| Total | 31 (100.0%) | 30 (100.0%) |
Earnings by Sex by Educational Attainment in Maiden Rock
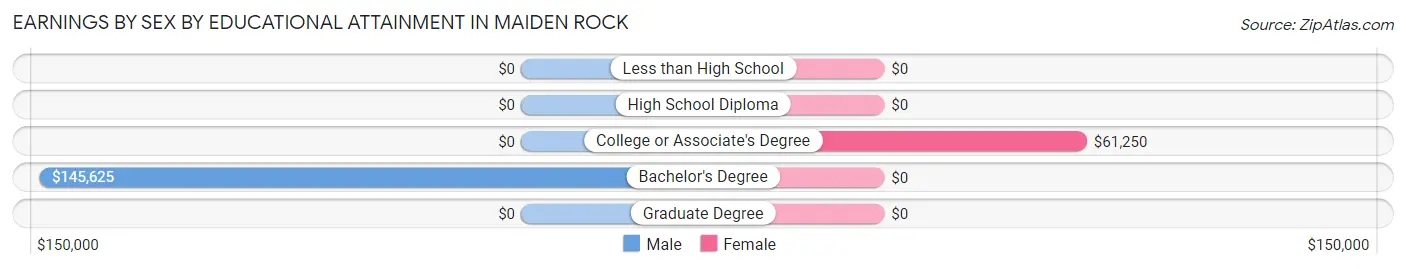
| Educational Attainment | Male Income | Female Income |
| Less than High School | - | - |
| High School Diploma | - | - |
| College or Associate's Degree | - | - |
| Bachelor's Degree | $145,625 | $0 |
| Graduate Degree | - | - |
| Total | - | - |
Family Income in Maiden Rock
Family Income Brackets in Maiden Rock
According to the Maiden Rock family income data, there are 8 families falling into the $150,000 to $199,999 income range, which is the most common income bracket and makes up 27.6% of all families.
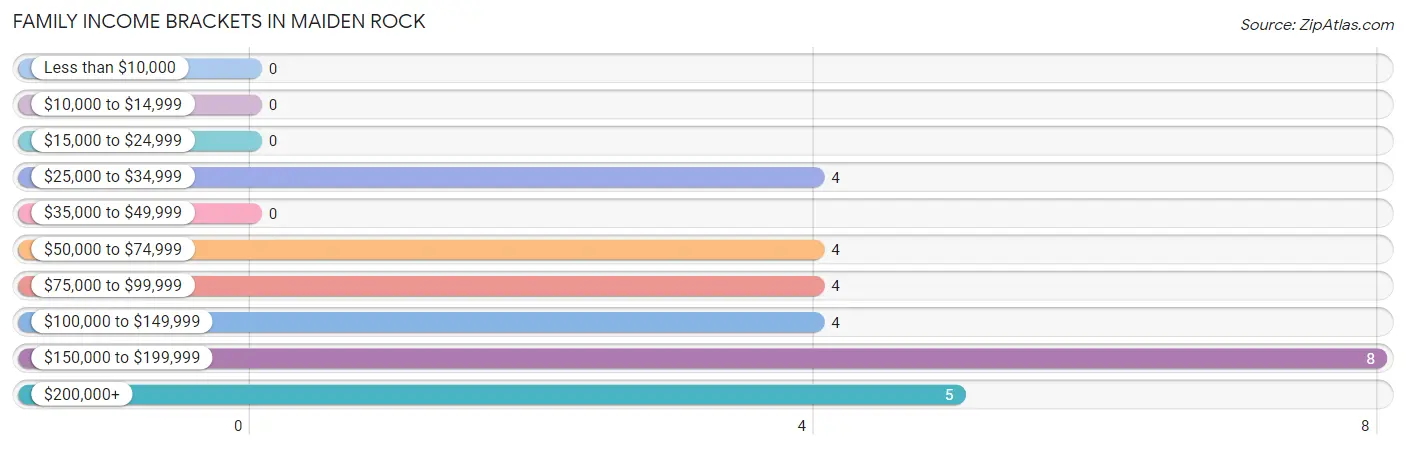
| Income Bracket | # Families | % Families |
| Less than $10,000 | 0 | 0.0% |
| $10,000 to $14,999 | 0 | 0.0% |
| $15,000 to $24,999 | 0 | 0.0% |
| $25,000 to $34,999 | 4 | 13.8% |
| $35,000 to $49,999 | 0 | 0.0% |
| $50,000 to $74,999 | 4 | 13.8% |
| $75,000 to $99,999 | 4 | 13.8% |
| $100,000 to $149,999 | 4 | 13.8% |
| $150,000 to $199,999 | 8 | 27.6% |
| $200,000+ | 5 | 17.2% |
Family Income by Famaliy Size in Maiden Rock
2-person families (17 | 58.6%) account for the highest median family income in Maiden Rock with $170,938 per family, while 2-person families (17 | 58.6%) have the highest median income of $85,469 per family member.
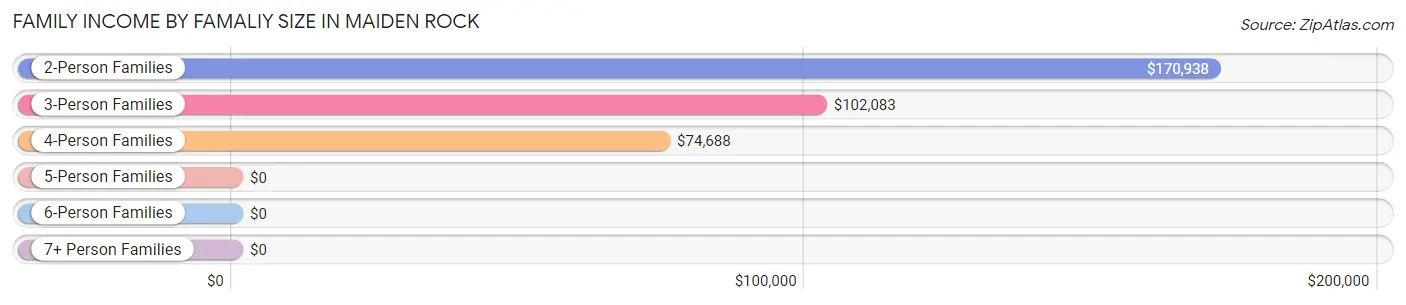
| Income Bracket | # Families | Median Income |
| 2-Person Families | 17 (58.6%) | $170,938 |
| 3-Person Families | 5 (17.2%) | $102,083 |
| 4-Person Families | 7 (24.1%) | $74,688 |
| 5-Person Families | 0 (0.0%) | $0 |
| 6-Person Families | 0 (0.0%) | $0 |
| 7+ Person Families | 0 (0.0%) | $0 |
| Total | 29 (100.0%) | $0 |
Family Income by Number of Earners in Maiden Rock
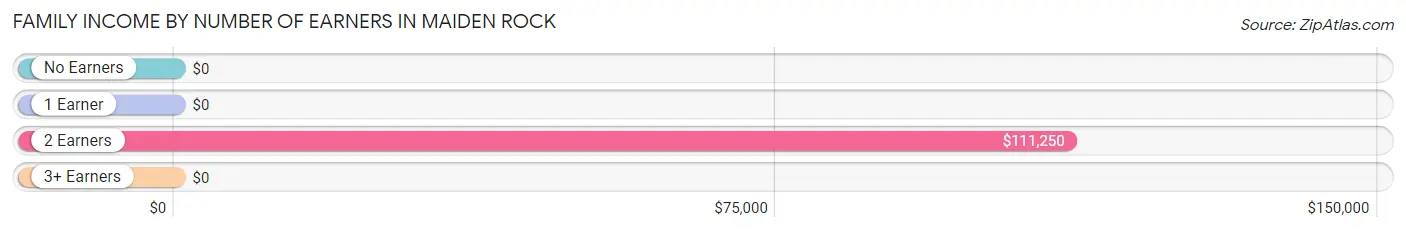
| Number of Earners | # Families | Median Income |
| No Earners | 2 (6.9%) | $0 |
| 1 Earner | 13 (44.8%) | $0 |
| 2 Earners | 10 (34.5%) | $111,250 |
| 3+ Earners | 4 (13.8%) | $0 |
| Total | 29 (100.0%) | $0 |
Household Income in Maiden Rock
Household Income Brackets in Maiden Rock
With 9 households falling in the category, the $75,000 to $99,999 income range is the most frequent in Maiden Rock, accounting for 17.6% of all households.
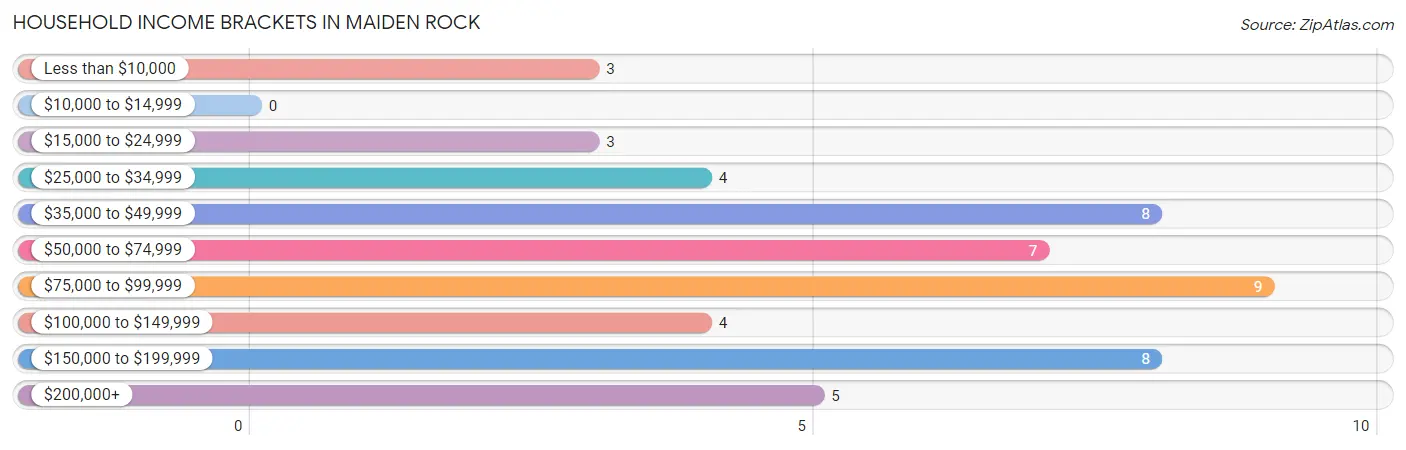
| Income Bracket | # Households | % Households |
| Less than $10,000 | 3 | 5.9% |
| $10,000 to $14,999 | 0 | 0.0% |
| $15,000 to $24,999 | 3 | 5.9% |
| $25,000 to $34,999 | 4 | 7.8% |
| $35,000 to $49,999 | 8 | 15.7% |
| $50,000 to $74,999 | 7 | 13.7% |
| $75,000 to $99,999 | 9 | 17.6% |
| $100,000 to $149,999 | 4 | 7.8% |
| $150,000 to $199,999 | 8 | 15.7% |
| $200,000+ | 5 | 9.8% |
Household Income by Householder Age in Maiden Rock
The median household income in Maiden Rock is $80,250, with the highest median household income of $66,250 found in the 45 to 64 years age bracket for the primary householder. A total of 26 households (51.0%) fall into this category.
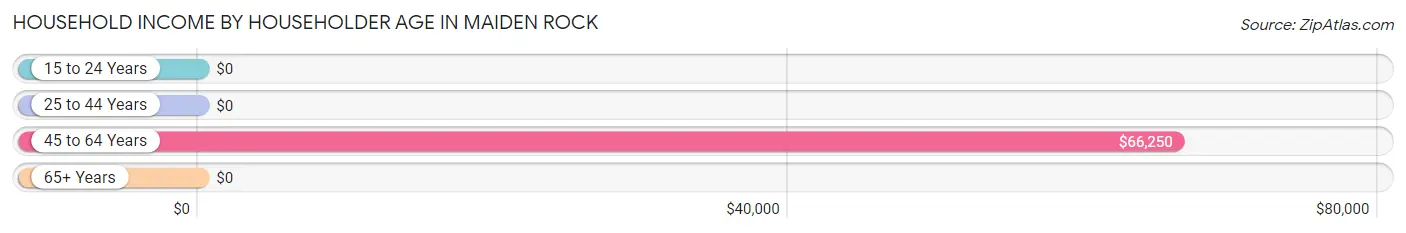
| Income Bracket | # Households | Median Income |
| 15 to 24 Years | 0 (0.0%) | $0 |
| 25 to 44 Years | 8 (15.7%) | $0 |
| 45 to 64 Years | 26 (51.0%) | $66,250 |
| 65+ Years | 17 (33.3%) | $0 |
| Total | 51 (100.0%) | $80,250 |
Poverty in Maiden Rock
Income Below Poverty by Sex and Age in Maiden Rock
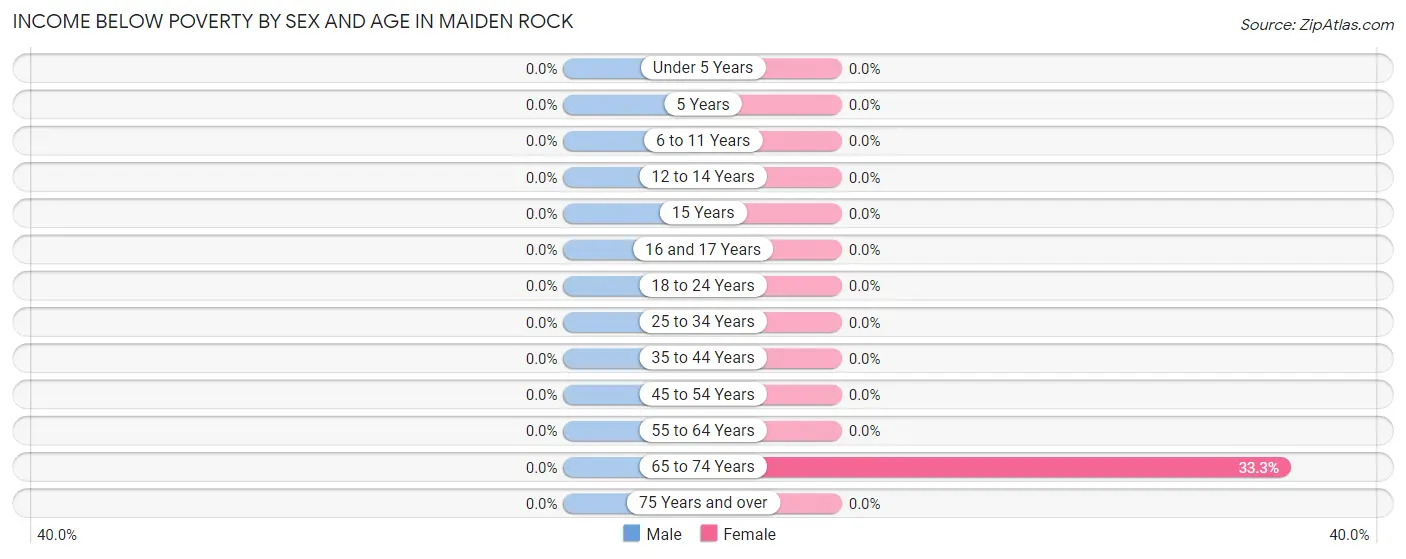
| Age Bracket | Male | Female |
| Under 5 Years | 0 (0.0%) | 0 (0.0%) |
| 5 Years | 0 (0.0%) | 0 (0.0%) |
| 6 to 11 Years | 0 (0.0%) | 0 (0.0%) |
| 12 to 14 Years | 0 (0.0%) | 0 (0.0%) |
| 15 Years | 0 (0.0%) | 0 (0.0%) |
| 16 and 17 Years | 0 (0.0%) | 0 (0.0%) |
| 18 to 24 Years | 0 (0.0%) | 0 (0.0%) |
| 25 to 34 Years | 0 (0.0%) | 0 (0.0%) |
| 35 to 44 Years | 0 (0.0%) | 0 (0.0%) |
| 45 to 54 Years | 0 (0.0%) | 0 (0.0%) |
| 55 to 64 Years | 0 (0.0%) | 0 (0.0%) |
| 65 to 74 Years | 0 (0.0%) | 3 (33.3%) |
| 75 Years and over | 0 (0.0%) | 0 (0.0%) |
| Total | 0 (0.0%) | 3 (7.1%) |
Income Above Poverty by Sex and Age in Maiden Rock
According to the poverty statistics in Maiden Rock, males aged 6 to 11 years and females aged 18 to 24 years are the age groups that are most secure financially, with 100.0% of males and 100.0% of females in these age groups living above the poverty line.
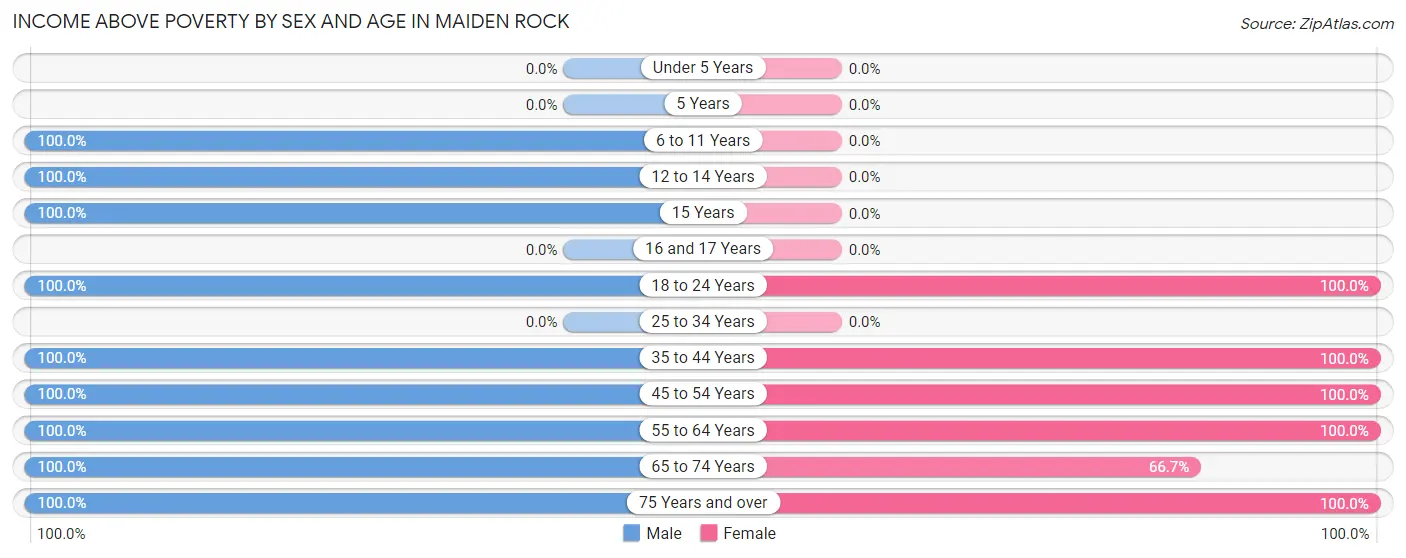
| Age Bracket | Male | Female |
| Under 5 Years | 0 (0.0%) | 0 (0.0%) |
| 5 Years | 0 (0.0%) | 0 (0.0%) |
| 6 to 11 Years | 4 (100.0%) | 0 (0.0%) |
| 12 to 14 Years | 3 (100.0%) | 0 (0.0%) |
| 15 Years | 3 (100.0%) | 0 (0.0%) |
| 16 and 17 Years | 0 (0.0%) | 0 (0.0%) |
| 18 to 24 Years | 1 (100.0%) | 6 (100.0%) |
| 25 to 34 Years | 0 (0.0%) | 0 (0.0%) |
| 35 to 44 Years | 8 (100.0%) | 7 (100.0%) |
| 45 to 54 Years | 10 (100.0%) | 8 (100.0%) |
| 55 to 64 Years | 5 (100.0%) | 10 (100.0%) |
| 65 to 74 Years | 9 (100.0%) | 6 (66.7%) |
| 75 Years and over | 7 (100.0%) | 2 (100.0%) |
| Total | 50 (100.0%) | 39 (92.9%) |
Income Below Poverty Among Married-Couple Families in Maiden Rock
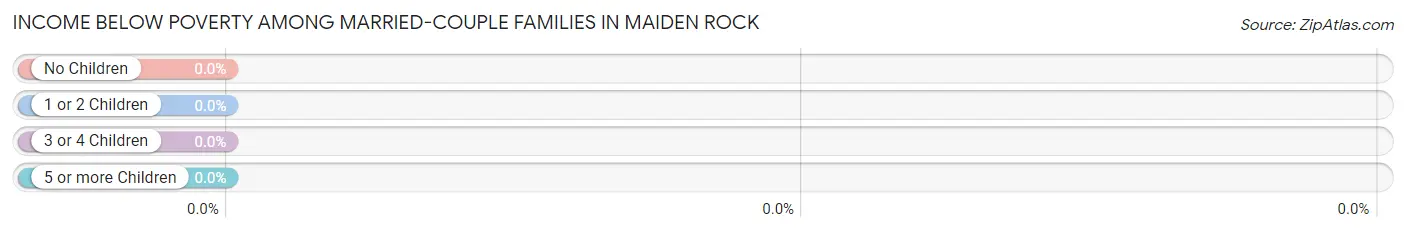
| Children | Above Poverty | Below Poverty |
| No Children | 19 (100.0%) | 0 (0.0%) |
| 1 or 2 Children | 5 (100.0%) | 0 (0.0%) |
| 3 or 4 Children | 0 (0.0%) | 0 (0.0%) |
| 5 or more Children | 0 (0.0%) | 0 (0.0%) |
| Total | 24 (100.0%) | 0 (0.0%) |
Income Below Poverty Among Single-Parent Households in Maiden Rock
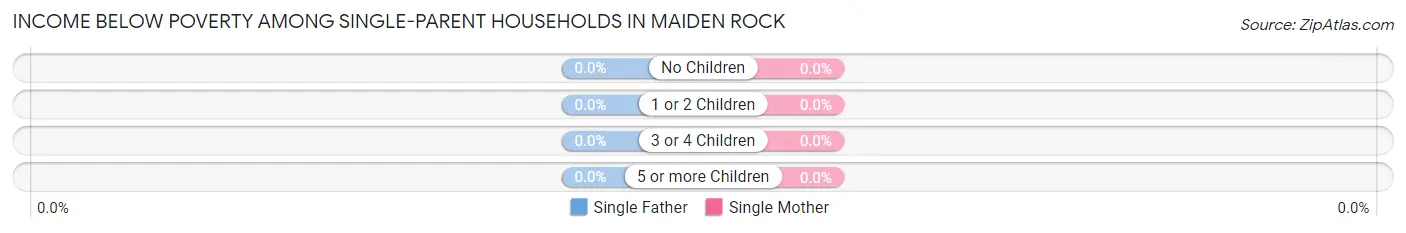
| Children | Single Father | Single Mother |
| No Children | 0 (0.0%) | 0 (0.0%) |
| 1 or 2 Children | 0 (0.0%) | 0 (0.0%) |
| 3 or 4 Children | 0 (0.0%) | 0 (0.0%) |
| 5 or more Children | 0 (0.0%) | 0 (0.0%) |
| Total | 0 (0.0%) | 0 (0.0%) |
Income Below Poverty Among Married-Couple vs Single-Parent Households in Maiden Rock
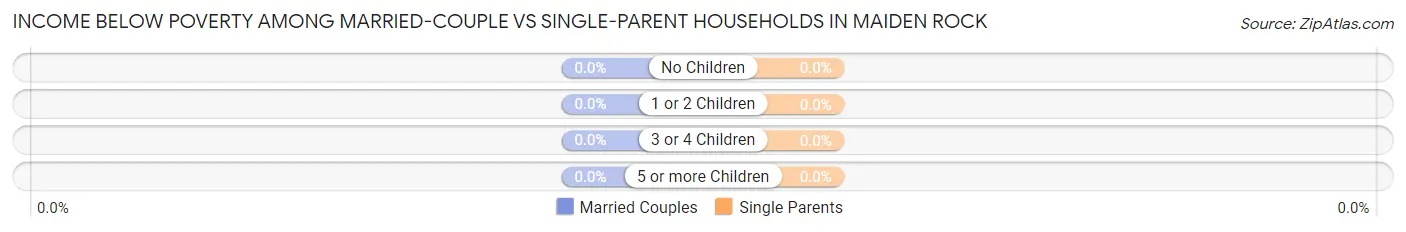
| Children | Married-Couple Families | Single-Parent Households |
| No Children | 0 (0.0%) | 0 (0.0%) |
| 1 or 2 Children | 0 (0.0%) | 0 (0.0%) |
| 3 or 4 Children | 0 (0.0%) | 0 (0.0%) |
| 5 or more Children | 0 (0.0%) | 0 (0.0%) |
| Total | 0 (0.0%) | 0 (0.0%) |
Employment Characteristics in Maiden Rock
Employment by Class of Employer in Maiden Rock
Among the 55 employed individuals in Maiden Rock, private company employees (30 | 54.5%), state government employees (9 | 16.4%), and self-employed (incorporated) (4 | 7.3%) make up the most common classes of employment.
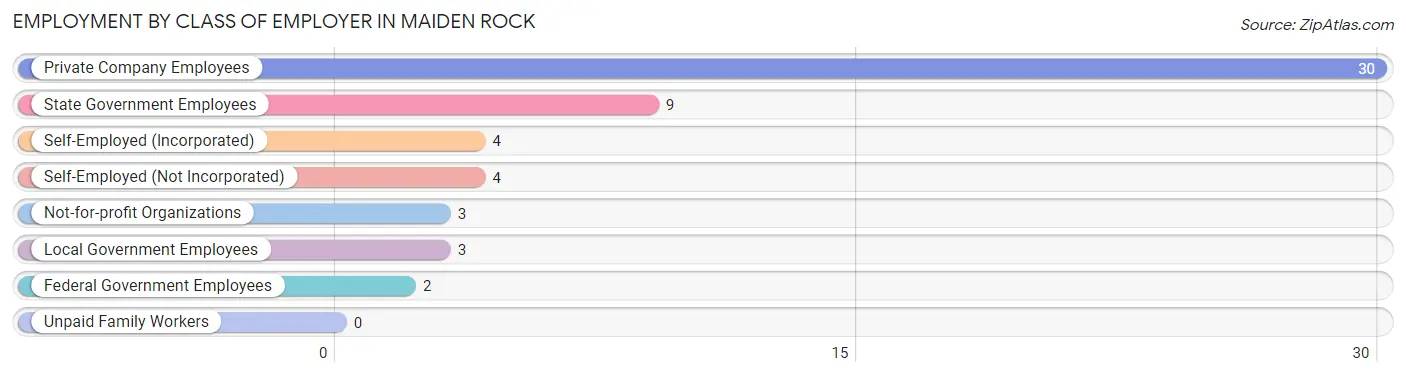
| Employer Class | # Employees | % Employees |
| Private Company Employees | 30 | 54.5% |
| Self-Employed (Incorporated) | 4 | 7.3% |
| Self-Employed (Not Incorporated) | 4 | 7.3% |
| Not-for-profit Organizations | 3 | 5.4% |
| Local Government Employees | 3 | 5.4% |
| State Government Employees | 9 | 16.4% |
| Federal Government Employees | 2 | 3.6% |
| Unpaid Family Workers | 0 | 0.0% |
| Total | 55 | 100.0% |
Employment Status by Age in Maiden Rock
According to the labor force statistics for Maiden Rock, out of the total population over 16 years of age (82), 68.3% or 56 individuals are in the labor force, with 1.8% or 1 of them unemployed. The age group with the highest labor force participation rate is 16 to 19 years, with 100.0% or 3 individuals in the labor force. Within the labor force, the 16 to 19 years age range has the highest percentage of unemployed individuals, with 33.3% or 1 of them being unemployed.
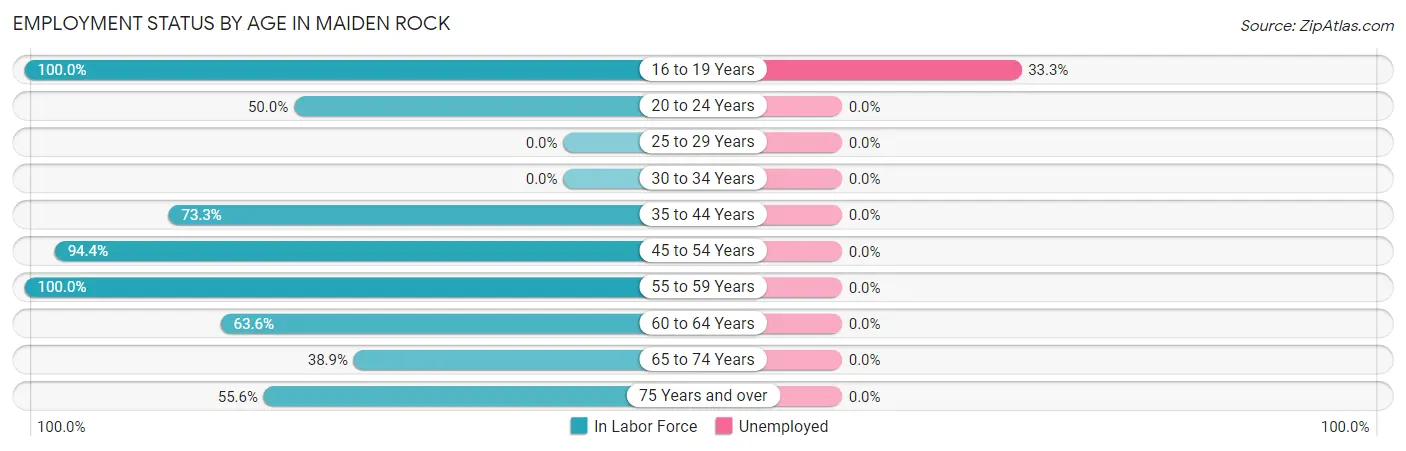
| Age Bracket | In Labor Force | Unemployed |
| 16 to 19 Years | 3 (100.0%) | 1 (33.3%) |
| 20 to 24 Years | 2 (50.0%) | 0 (0.0%) |
| 25 to 29 Years | 0 (0.0%) | 0 (0.0%) |
| 30 to 34 Years | 0 (0.0%) | 0 (0.0%) |
| 35 to 44 Years | 11 (73.3%) | 0 (0.0%) |
| 45 to 54 Years | 17 (94.4%) | 0 (0.0%) |
| 55 to 59 Years | 4 (100.0%) | 0 (0.0%) |
| 60 to 64 Years | 7 (63.6%) | 0 (0.0%) |
| 65 to 74 Years | 7 (38.9%) | 0 (0.0%) |
| 75 Years and over | 5 (55.6%) | 0 (0.0%) |
| Total | 56 (68.3%) | 1 (1.8%) |
Employment Status by Educational Attainment in Maiden Rock
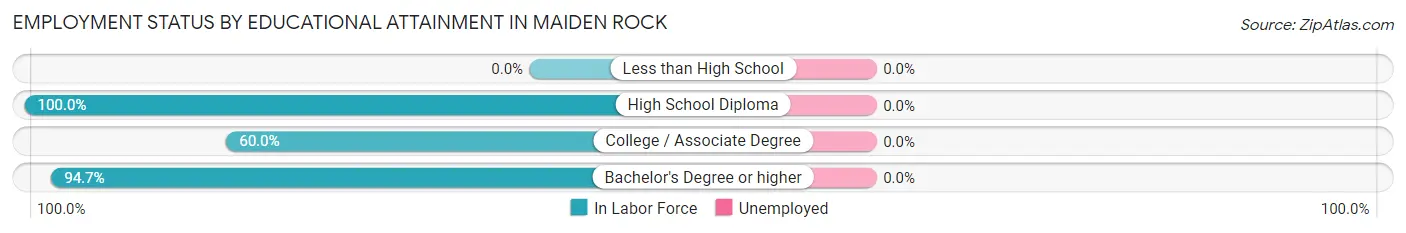
| Educational Attainment | In Labor Force | Unemployed |
| Less than High School | 0 (0.0%) | 0 (0.0%) |
| High School Diploma | 9 (100.0%) | 0 (0.0%) |
| College / Associate Degree | 12 (60.0%) | 0 (0.0%) |
| Bachelor's Degree or higher | 18 (94.7%) | 0 (0.0%) |
| Total | 39 (81.3%) | 0 (0.0%) |
Employment Occupations by Sex in Maiden Rock
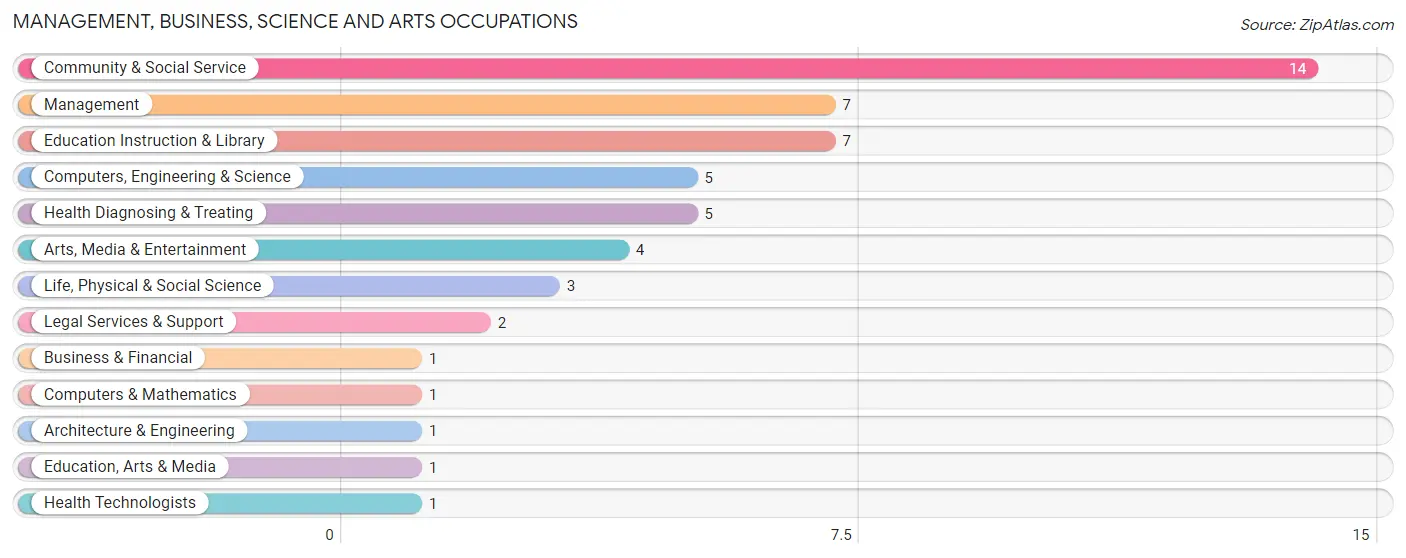
Management, Business, Science and Arts Occupations
The most common Management, Business, Science and Arts occupations in Maiden Rock are Community & Social Service (14 | 25.5%), Management (7 | 12.7%), Education Instruction & Library (7 | 12.7%), Computers, Engineering & Science (5 | 9.1%), and Health Diagnosing & Treating (5 | 9.1%).
Management, Business, Science and Arts Occupations by Sex
Within the Management, Business, Science and Arts occupations in Maiden Rock, the most male-oriented occupations are Architecture & Engineering (100.0%), Life, Physical & Social Science (100.0%), and Education, Arts & Media (100.0%), while the most female-oriented occupations are Business & Financial (100.0%), Computers & Mathematics (100.0%), and Legal Services & Support (100.0%).
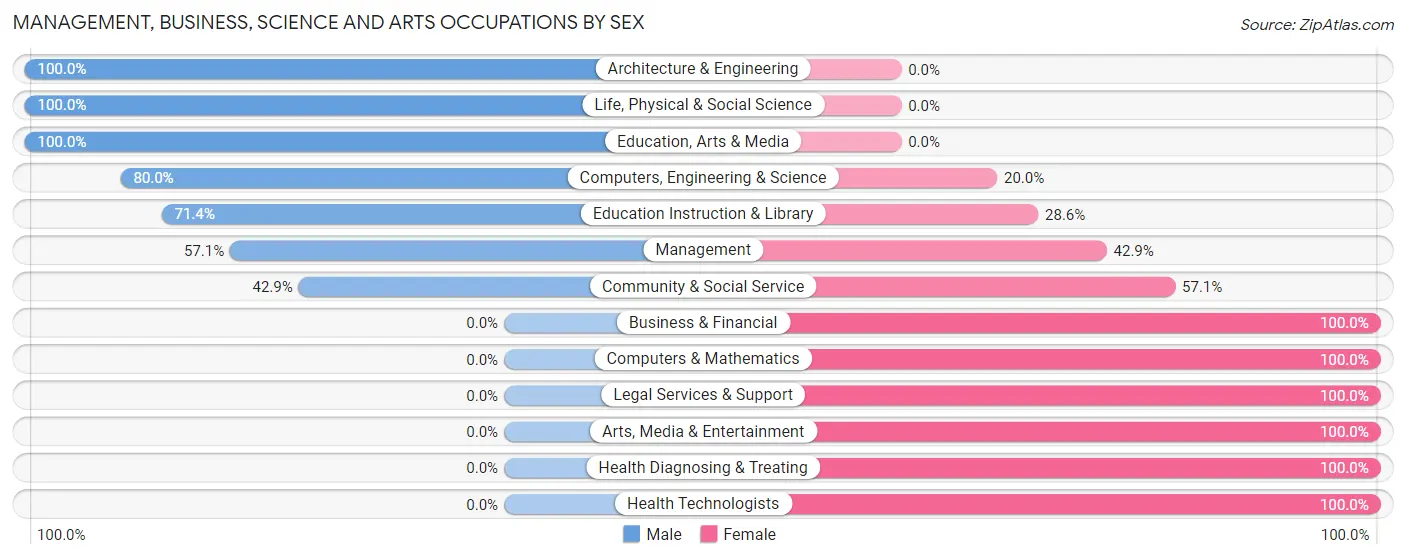
| Occupation | Male | Female |
| Management | 4 (57.1%) | 3 (42.9%) |
| Business & Financial | 0 (0.0%) | 1 (100.0%) |
| Computers, Engineering & Science | 4 (80.0%) | 1 (20.0%) |
| Computers & Mathematics | 0 (0.0%) | 1 (100.0%) |
| Architecture & Engineering | 1 (100.0%) | 0 (0.0%) |
| Life, Physical & Social Science | 3 (100.0%) | 0 (0.0%) |
| Community & Social Service | 6 (42.9%) | 8 (57.1%) |
| Education, Arts & Media | 1 (100.0%) | 0 (0.0%) |
| Legal Services & Support | 0 (0.0%) | 2 (100.0%) |
| Education Instruction & Library | 5 (71.4%) | 2 (28.6%) |
| Arts, Media & Entertainment | 0 (0.0%) | 4 (100.0%) |
| Health Diagnosing & Treating | 0 (0.0%) | 5 (100.0%) |
| Health Technologists | 0 (0.0%) | 1 (100.0%) |
| Total (Category) | 14 (43.8%) | 18 (56.2%) |
| Total (Overall) | 26 (47.3%) | 29 (52.7%) |
Services Occupations
The most common Services occupations in Maiden Rock are , and Cleaning & Maintenance (3 | 5.4%).
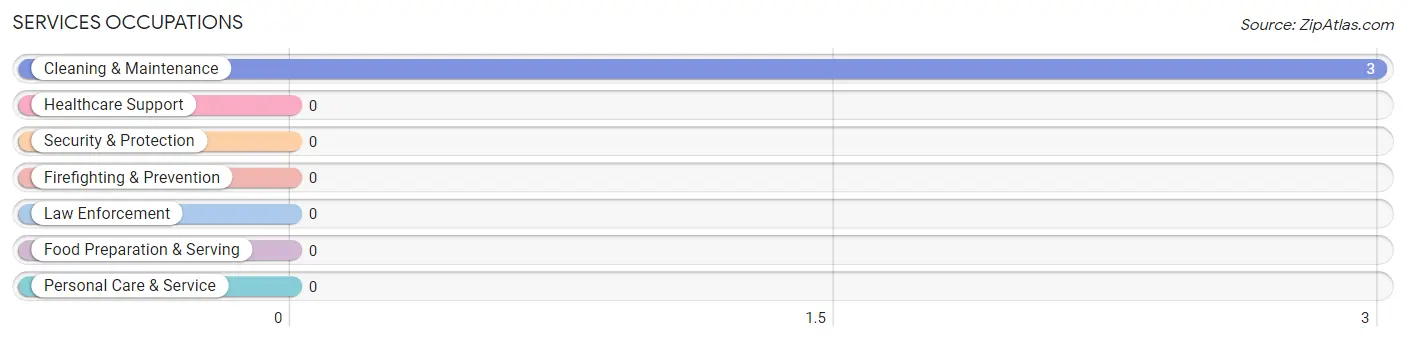
Services Occupations by Sex

| Occupation | Male | Female |
| Healthcare Support | 0 (0.0%) | 0 (0.0%) |
| Security & Protection | 0 (0.0%) | 0 (0.0%) |
| Firefighting & Prevention | 0 (0.0%) | 0 (0.0%) |
| Law Enforcement | 0 (0.0%) | 0 (0.0%) |
| Food Preparation & Serving | 0 (0.0%) | 0 (0.0%) |
| Cleaning & Maintenance | 1 (33.3%) | 2 (66.7%) |
| Personal Care & Service | 0 (0.0%) | 0 (0.0%) |
| Total (Category) | 1 (33.3%) | 2 (66.7%) |
| Total (Overall) | 26 (47.3%) | 29 (52.7%) |
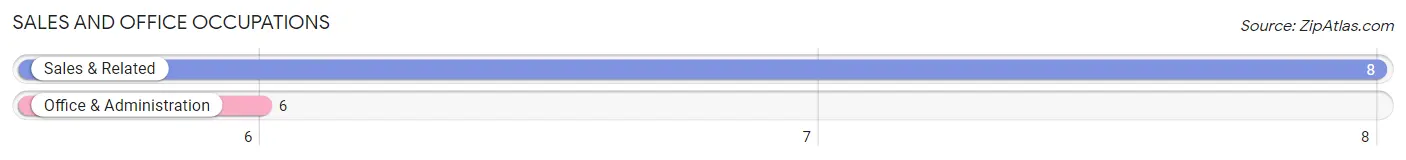
Sales and Office Occupations
The most common Sales and Office occupations in Maiden Rock are Sales & Related (8 | 14.5%), and Office & Administration (6 | 10.9%).
Sales and Office Occupations by Sex
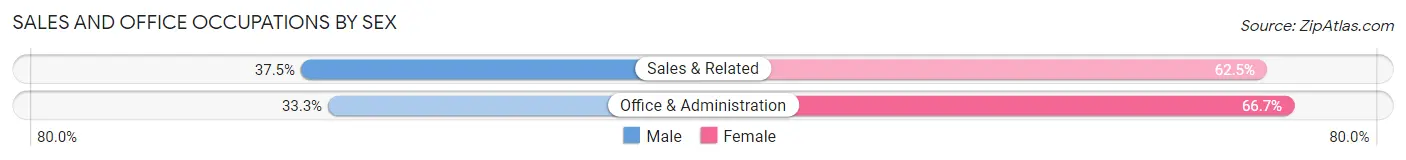
| Occupation | Male | Female |
| Sales & Related | 3 (37.5%) | 5 (62.5%) |
| Office & Administration | 2 (33.3%) | 4 (66.7%) |
| Total (Category) | 5 (35.7%) | 9 (64.3%) |
| Total (Overall) | 26 (47.3%) | 29 (52.7%) |
Natural Resources, Construction and Maintenance Occupations
The most common Natural Resources, Construction and Maintenance occupations in Maiden Rock are Construction & Extraction (2 | 3.6%), and Installation, Maintenance & Repair (2 | 3.6%).
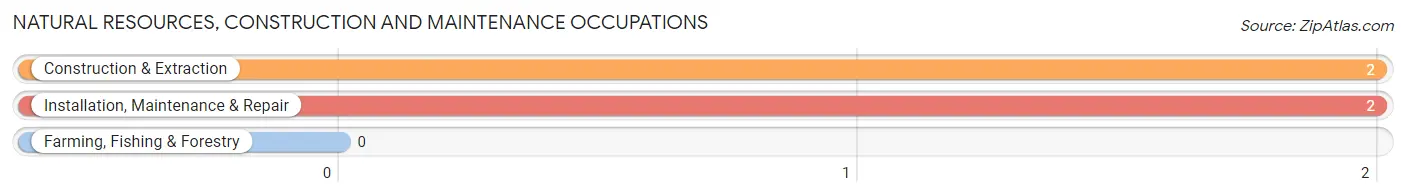
Natural Resources, Construction and Maintenance Occupations by Sex
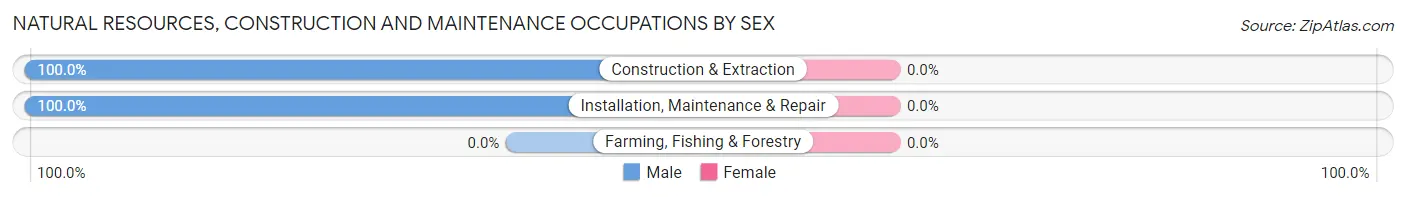
| Occupation | Male | Female |
| Farming, Fishing & Forestry | 0 (0.0%) | 0 (0.0%) |
| Construction & Extraction | 2 (100.0%) | 0 (0.0%) |
| Installation, Maintenance & Repair | 2 (100.0%) | 0 (0.0%) |
| Total (Category) | 4 (100.0%) | 0 (0.0%) |
| Total (Overall) | 26 (47.3%) | 29 (52.7%) |
Production, Transportation and Moving Occupations
The most common Production, Transportation and Moving occupations in Maiden Rock are , and Production (2 | 3.6%).
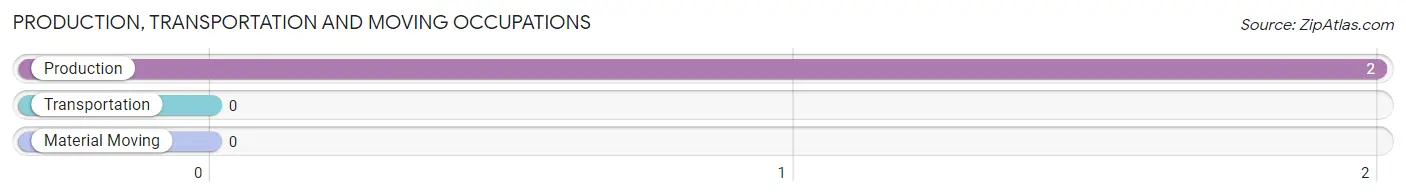
Production, Transportation and Moving Occupations by Sex
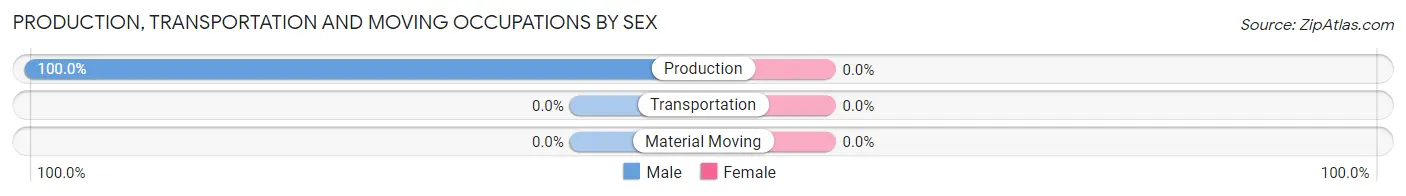
| Occupation | Male | Female |
| Production | 2 (100.0%) | 0 (0.0%) |
| Transportation | 0 (0.0%) | 0 (0.0%) |
| Material Moving | 0 (0.0%) | 0 (0.0%) |
| Total (Category) | 2 (100.0%) | 0 (0.0%) |
| Total (Overall) | 26 (47.3%) | 29 (52.7%) |
Employment Industries by Sex in Maiden Rock
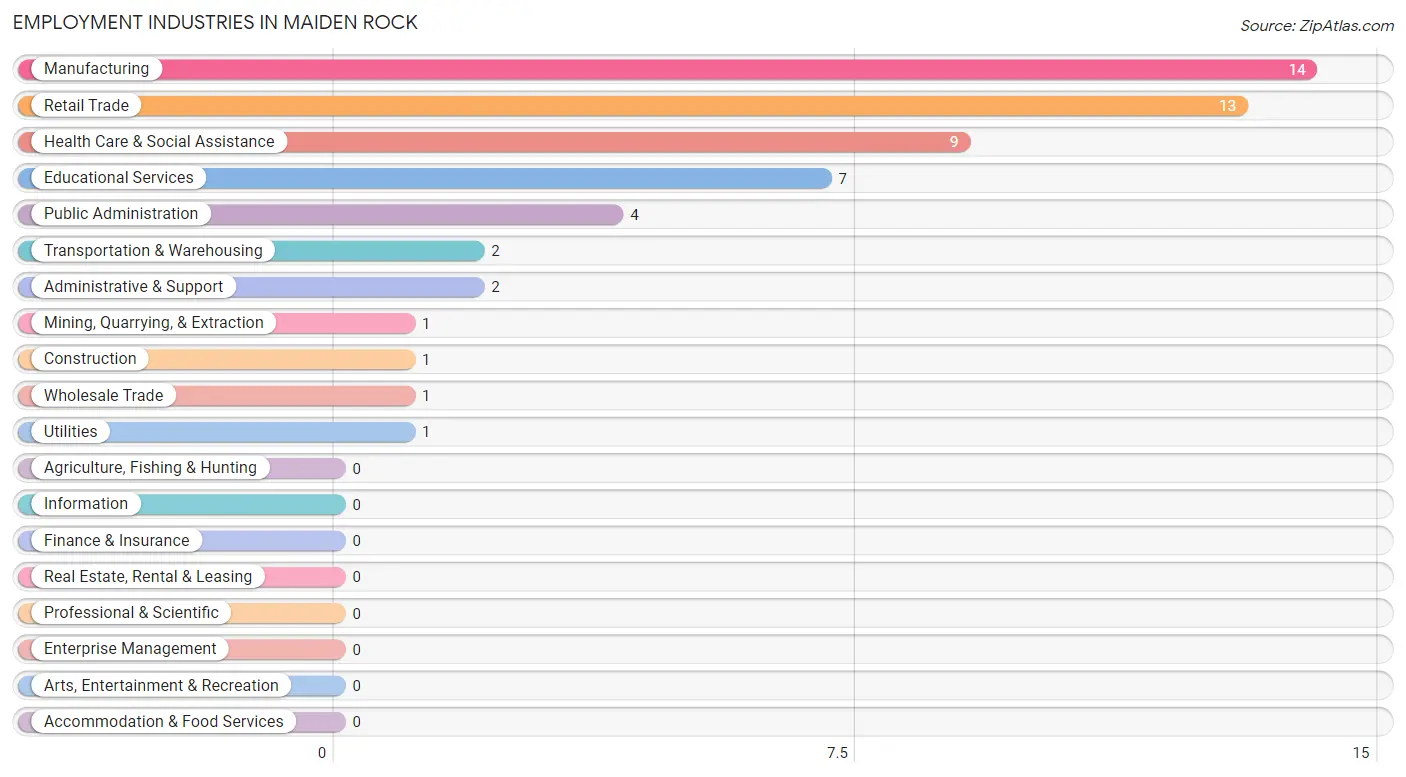
Employment Industries in Maiden Rock
The major employment industries in Maiden Rock include Manufacturing (14 | 25.5%), Retail Trade (13 | 23.6%), Health Care & Social Assistance (9 | 16.4%), Educational Services (7 | 12.7%), and Public Administration (4 | 7.3%).
Employment Industries by Sex in Maiden Rock
The Maiden Rock industries that see more men than women are Mining, Quarrying, & Extraction (100.0%), Construction (100.0%), and Wholesale Trade (100.0%), whereas the industries that tend to have a higher number of women are Utilities (100.0%), Administrative & Support (100.0%), and Public Administration (100.0%).
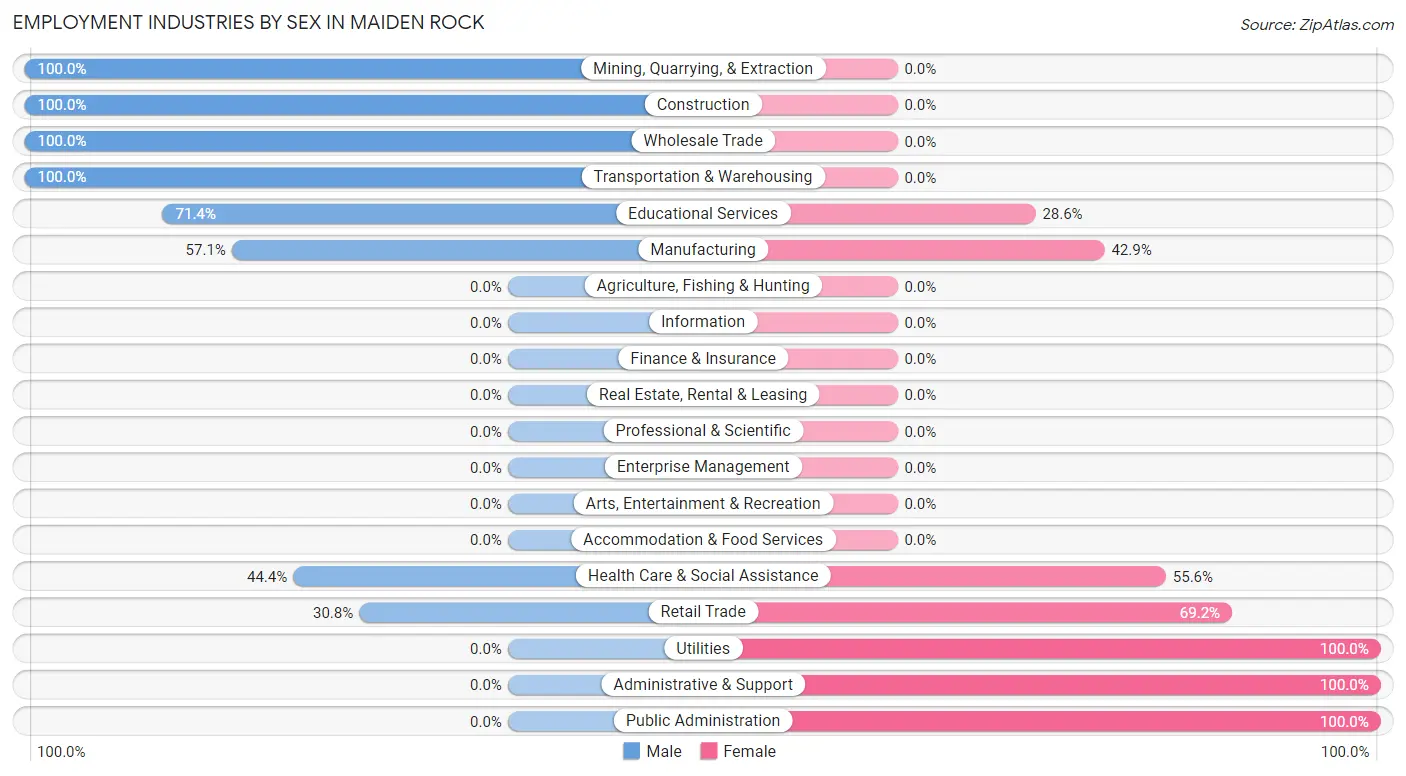
| Industry | Male | Female |
| Agriculture, Fishing & Hunting | 0 (0.0%) | 0 (0.0%) |
| Mining, Quarrying, & Extraction | 1 (100.0%) | 0 (0.0%) |
| Construction | 1 (100.0%) | 0 (0.0%) |
| Manufacturing | 8 (57.1%) | 6 (42.9%) |
| Wholesale Trade | 1 (100.0%) | 0 (0.0%) |
| Retail Trade | 4 (30.8%) | 9 (69.2%) |
| Transportation & Warehousing | 2 (100.0%) | 0 (0.0%) |
| Utilities | 0 (0.0%) | 1 (100.0%) |
| Information | 0 (0.0%) | 0 (0.0%) |
| Finance & Insurance | 0 (0.0%) | 0 (0.0%) |
| Real Estate, Rental & Leasing | 0 (0.0%) | 0 (0.0%) |
| Professional & Scientific | 0 (0.0%) | 0 (0.0%) |
| Enterprise Management | 0 (0.0%) | 0 (0.0%) |
| Administrative & Support | 0 (0.0%) | 2 (100.0%) |
| Educational Services | 5 (71.4%) | 2 (28.6%) |
| Health Care & Social Assistance | 4 (44.4%) | 5 (55.6%) |
| Arts, Entertainment & Recreation | 0 (0.0%) | 0 (0.0%) |
| Accommodation & Food Services | 0 (0.0%) | 0 (0.0%) |
| Public Administration | 0 (0.0%) | 4 (100.0%) |
| Total | 26 (47.3%) | 29 (52.7%) |
Education in Maiden Rock
School Enrollment in Maiden Rock
The most common levels of schooling among the 20 students in Maiden Rock are middle school (7 | 35.0%), high school (7 | 35.0%), and college / undergraduate (6 | 30.0%).
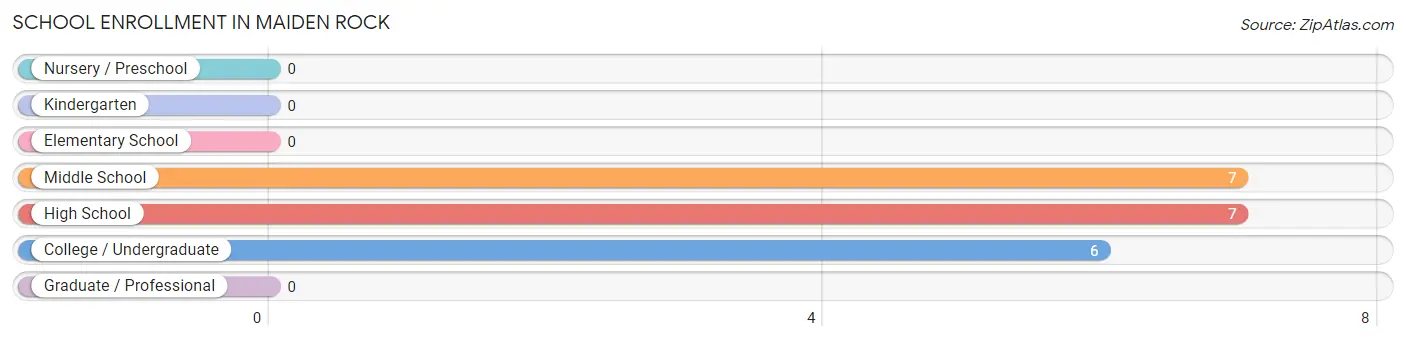
| School Level | # Students | % Students |
| Nursery / Preschool | 0 | 0.0% |
| Kindergarten | 0 | 0.0% |
| Elementary School | 0 | 0.0% |
| Middle School | 7 | 35.0% |
| High School | 7 | 35.0% |
| College / Undergraduate | 6 | 30.0% |
| Graduate / Professional | 0 | 0.0% |
| Total | 20 | 100.0% |
School Enrollment by Age by Funding Source in Maiden Rock
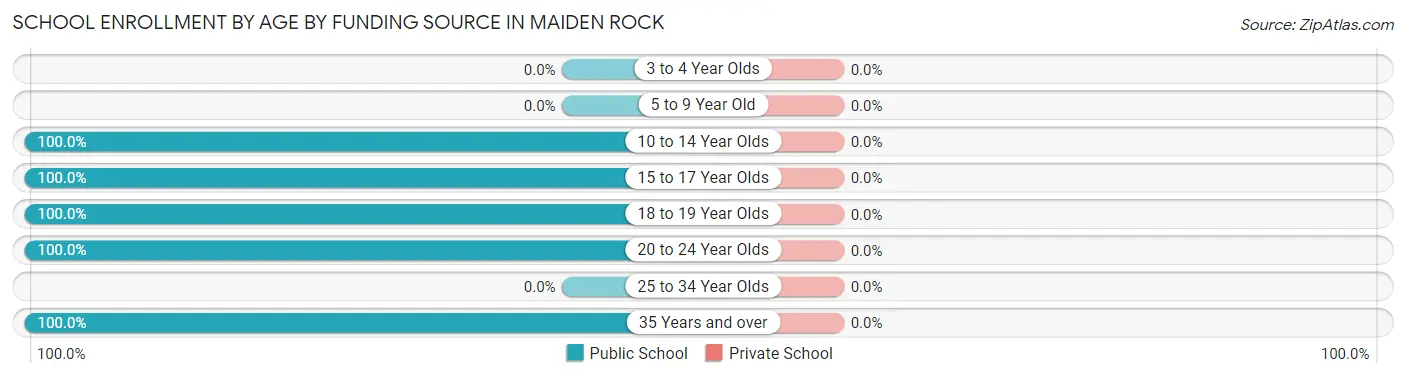
| Age Bracket | Public School | Private School |
| 3 to 4 Year Olds | 0 (0.0%) | 0 (0.0%) |
| 5 to 9 Year Old | 0 (0.0%) | 0 (0.0%) |
| 10 to 14 Year Olds | 9 (100.0%) | 0 (0.0%) |
| 15 to 17 Year Olds | 3 (100.0%) | 0 (0.0%) |
| 18 to 19 Year Olds | 3 (100.0%) | 0 (0.0%) |
| 20 to 24 Year Olds | 4 (100.0%) | 0 (0.0%) |
| 25 to 34 Year Olds | 0 (0.0%) | 0 (0.0%) |
| 35 Years and over | 1 (100.0%) | 0 (0.0%) |
| Total | 20 (100.0%) | 0 (0.0%) |
Educational Attainment by Field of Study in Maiden Rock
Visual & performing arts (11 | 25.0%), education (7 | 15.9%), liberal arts & history (6 | 13.6%), social sciences (4 | 9.1%), and bio, nature & agricultural (3 | 6.8%) are the most common fields of study among 44 individuals in Maiden Rock who have obtained a bachelor's degree or higher.
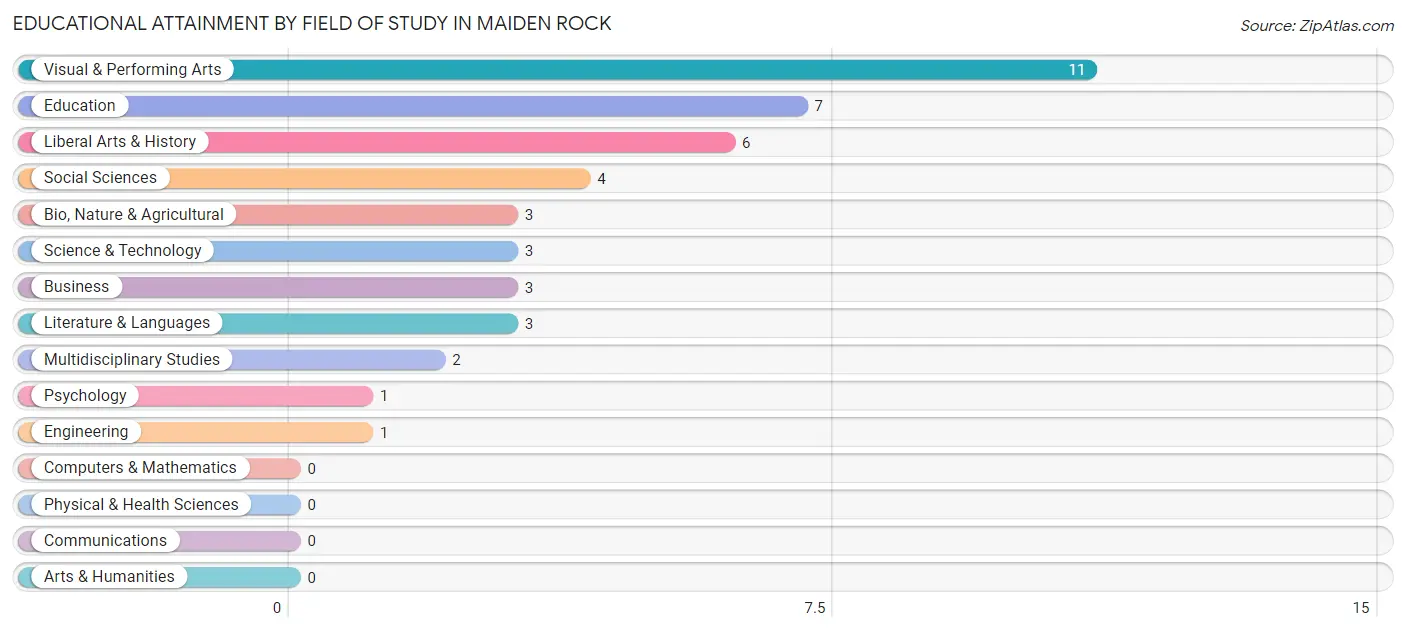
| Field of Study | # Graduates | % Graduates |
| Computers & Mathematics | 0 | 0.0% |
| Bio, Nature & Agricultural | 3 | 6.8% |
| Physical & Health Sciences | 0 | 0.0% |
| Psychology | 1 | 2.3% |
| Social Sciences | 4 | 9.1% |
| Engineering | 1 | 2.3% |
| Multidisciplinary Studies | 2 | 4.5% |
| Science & Technology | 3 | 6.8% |
| Business | 3 | 6.8% |
| Education | 7 | 15.9% |
| Literature & Languages | 3 | 6.8% |
| Liberal Arts & History | 6 | 13.6% |
| Visual & Performing Arts | 11 | 25.0% |
| Communications | 0 | 0.0% |
| Arts & Humanities | 0 | 0.0% |
| Total | 44 | 100.0% |
Transportation & Commute in Maiden Rock
Vehicle Availability by Sex in Maiden Rock
The most prevalent vehicle ownership categories in Maiden Rock are males with 2 vehicles (10, accounting for 38.5%) and females with 2 vehicles (9, making up 34.5%).
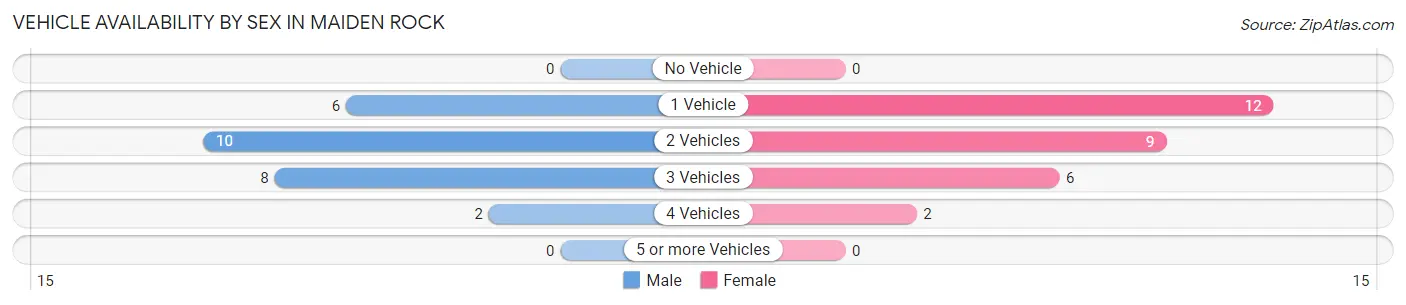
| Vehicles Available | Male | Female |
| No Vehicle | 0 (0.0%) | 0 (0.0%) |
| 1 Vehicle | 6 (23.1%) | 12 (41.4%) |
| 2 Vehicles | 10 (38.5%) | 9 (31.0%) |
| 3 Vehicles | 8 (30.8%) | 6 (20.7%) |
| 4 Vehicles | 2 (7.7%) | 2 (6.9%) |
| 5 or more Vehicles | 0 (0.0%) | 0 (0.0%) |
| Total | 26 (100.0%) | 29 (100.0%) |
Commute Time in Maiden Rock
The most frequently occuring commute durations in Maiden Rock are 60 to 89 minutes (10 commuters, 20.4%), 25 to 29 minutes (8 commuters, 16.3%), and 30 to 34 minutes (8 commuters, 16.3%).
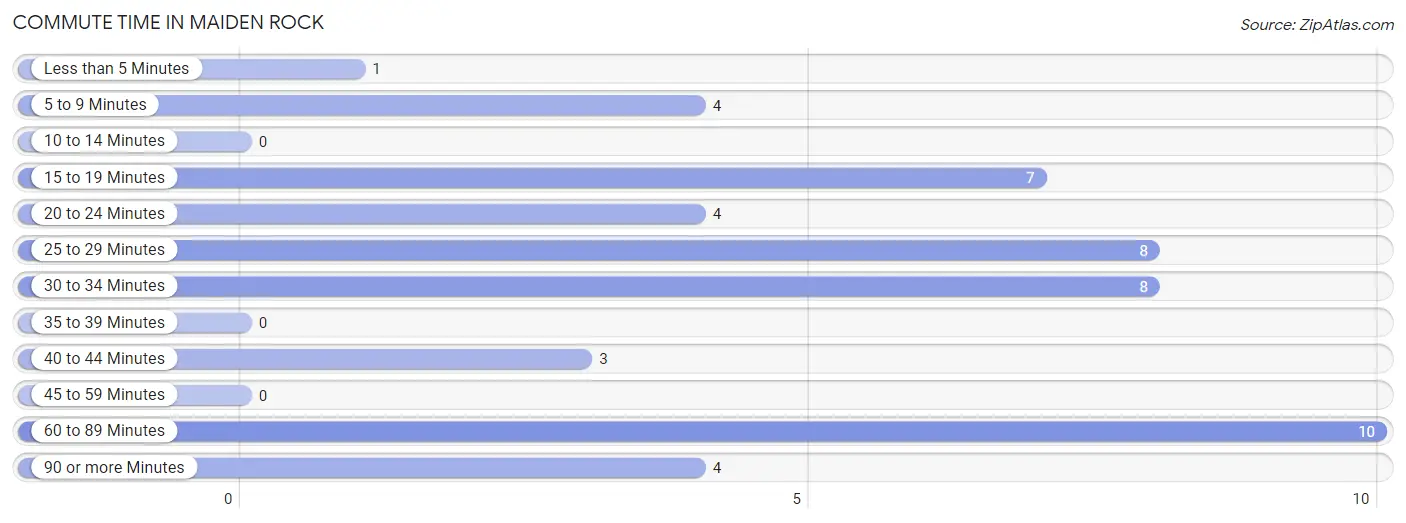
| Commute Time | # Commuters | % Commuters |
| Less than 5 Minutes | 1 | 2.0% |
| 5 to 9 Minutes | 4 | 8.2% |
| 10 to 14 Minutes | 0 | 0.0% |
| 15 to 19 Minutes | 7 | 14.3% |
| 20 to 24 Minutes | 4 | 8.2% |
| 25 to 29 Minutes | 8 | 16.3% |
| 30 to 34 Minutes | 8 | 16.3% |
| 35 to 39 Minutes | 0 | 0.0% |
| 40 to 44 Minutes | 3 | 6.1% |
| 45 to 59 Minutes | 0 | 0.0% |
| 60 to 89 Minutes | 10 | 20.4% |
| 90 or more Minutes | 4 | 8.2% |
Commute Time by Sex in Maiden Rock
The most common commute times in Maiden Rock are 15 to 19 minutes (7 commuters, 28.0%) for males and 25 to 29 minutes (8 commuters, 33.3%) for females.
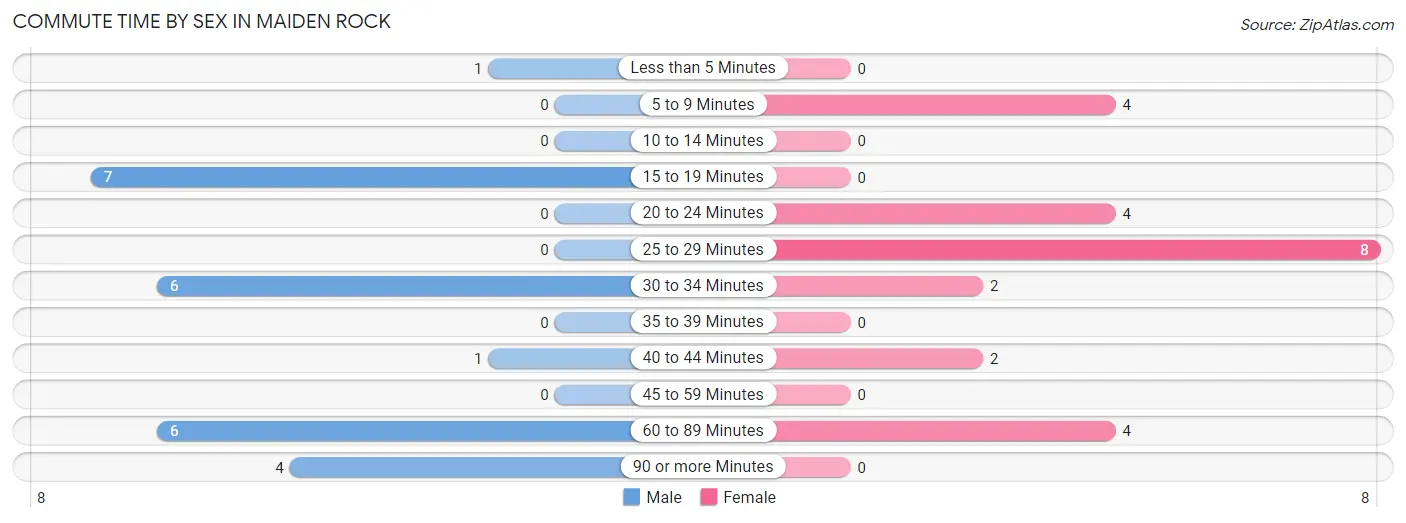
| Commute Time | Male | Female |
| Less than 5 Minutes | 1 (4.0%) | 0 (0.0%) |
| 5 to 9 Minutes | 0 (0.0%) | 4 (16.7%) |
| 10 to 14 Minutes | 0 (0.0%) | 0 (0.0%) |
| 15 to 19 Minutes | 7 (28.0%) | 0 (0.0%) |
| 20 to 24 Minutes | 0 (0.0%) | 4 (16.7%) |
| 25 to 29 Minutes | 0 (0.0%) | 8 (33.3%) |
| 30 to 34 Minutes | 6 (24.0%) | 2 (8.3%) |
| 35 to 39 Minutes | 0 (0.0%) | 0 (0.0%) |
| 40 to 44 Minutes | 1 (4.0%) | 2 (8.3%) |
| 45 to 59 Minutes | 0 (0.0%) | 0 (0.0%) |
| 60 to 89 Minutes | 6 (24.0%) | 4 (16.7%) |
| 90 or more Minutes | 4 (16.0%) | 0 (0.0%) |
Time of Departure to Work by Sex in Maiden Rock
The most frequent times of departure to work in Maiden Rock are 7:00 AM to 7:29 AM (6, 24.0%) for males and 8:00 AM to 8:29 AM (6, 25.0%) for females.
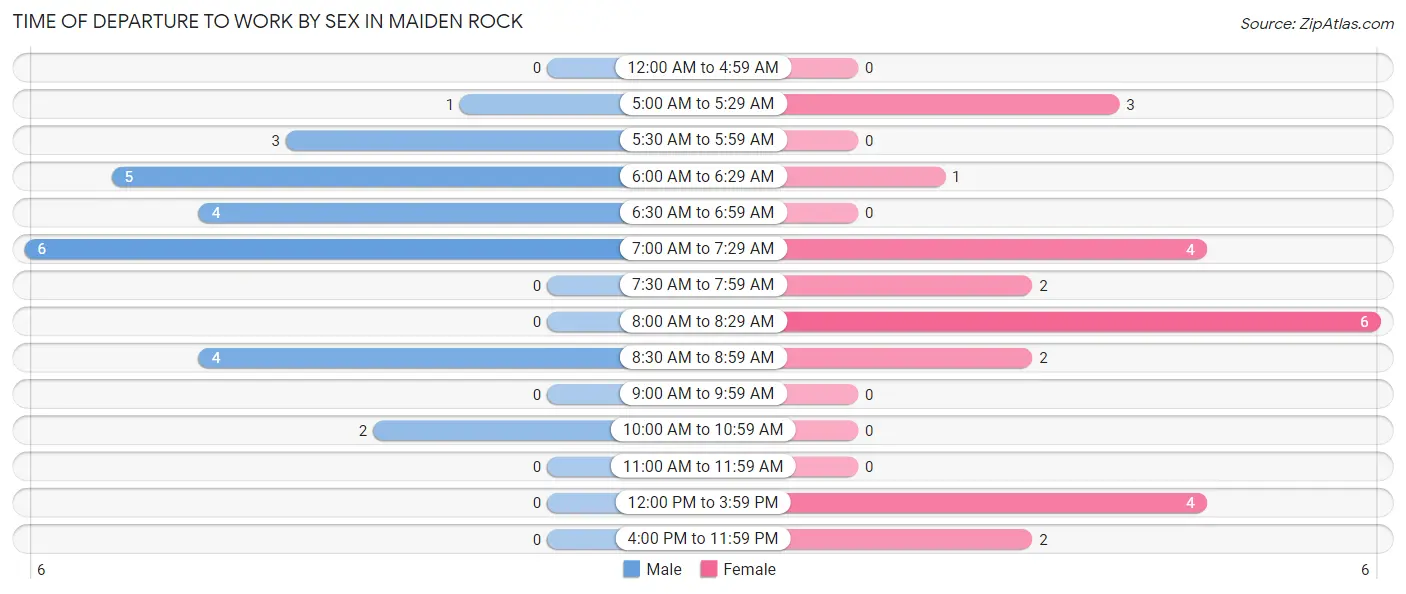
| Time of Departure | Male | Female |
| 12:00 AM to 4:59 AM | 0 (0.0%) | 0 (0.0%) |
| 5:00 AM to 5:29 AM | 1 (4.0%) | 3 (12.5%) |
| 5:30 AM to 5:59 AM | 3 (12.0%) | 0 (0.0%) |
| 6:00 AM to 6:29 AM | 5 (20.0%) | 1 (4.2%) |
| 6:30 AM to 6:59 AM | 4 (16.0%) | 0 (0.0%) |
| 7:00 AM to 7:29 AM | 6 (24.0%) | 4 (16.7%) |
| 7:30 AM to 7:59 AM | 0 (0.0%) | 2 (8.3%) |
| 8:00 AM to 8:29 AM | 0 (0.0%) | 6 (25.0%) |
| 8:30 AM to 8:59 AM | 4 (16.0%) | 2 (8.3%) |
| 9:00 AM to 9:59 AM | 0 (0.0%) | 0 (0.0%) |
| 10:00 AM to 10:59 AM | 2 (8.0%) | 0 (0.0%) |
| 11:00 AM to 11:59 AM | 0 (0.0%) | 0 (0.0%) |
| 12:00 PM to 3:59 PM | 0 (0.0%) | 4 (16.7%) |
| 4:00 PM to 11:59 PM | 0 (0.0%) | 2 (8.3%) |
| Total | 25 (100.0%) | 24 (100.0%) |
Housing Occupancy in Maiden Rock
Occupancy by Ownership in Maiden Rock
Of the total 51 dwellings in Maiden Rock, owner-occupied units account for 48 (94.1%), while renter-occupied units make up 3 (5.9%).
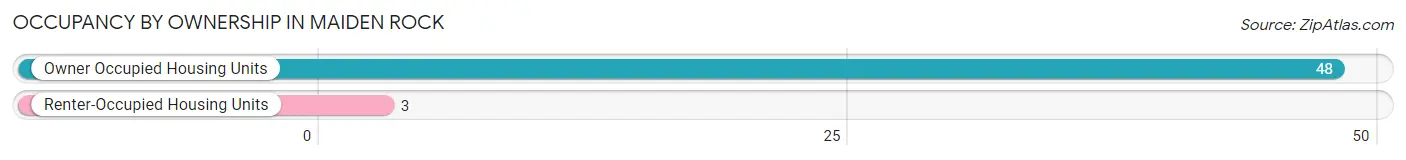
| Occupancy | # Housing Units | % Housing Units |
| Owner Occupied Housing Units | 48 | 94.1% |
| Renter-Occupied Housing Units | 3 | 5.9% |
| Total Occupied Housing Units | 51 | 100.0% |
Occupancy by Household Size in Maiden Rock
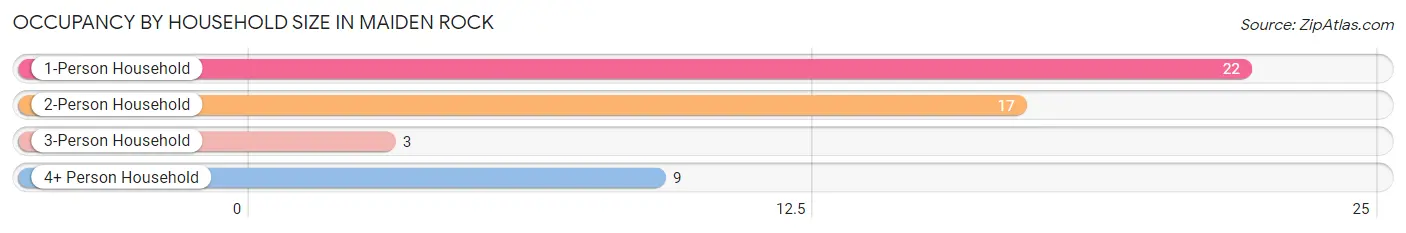
| Household Size | # Housing Units | % Housing Units |
| 1-Person Household | 22 | 43.1% |
| 2-Person Household | 17 | 33.3% |
| 3-Person Household | 3 | 5.9% |
| 4+ Person Household | 9 | 17.6% |
| Total Housing Units | 51 | 100.0% |
Occupancy by Ownership by Household Size in Maiden Rock
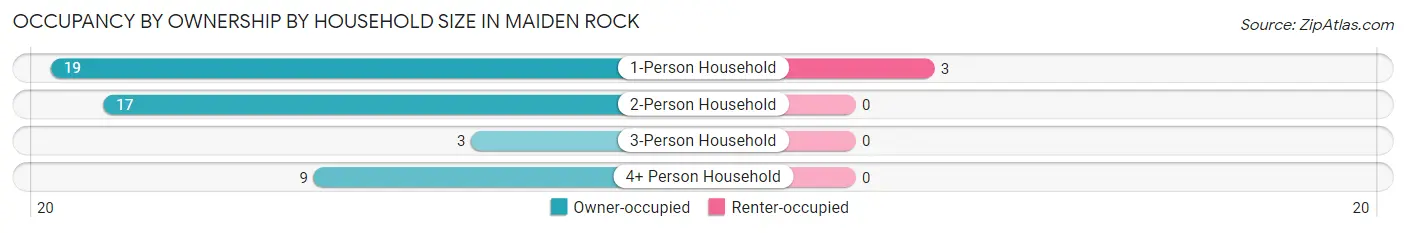
| Household Size | Owner-occupied | Renter-occupied |
| 1-Person Household | 19 (86.4%) | 3 (13.6%) |
| 2-Person Household | 17 (100.0%) | 0 (0.0%) |
| 3-Person Household | 3 (100.0%) | 0 (0.0%) |
| 4+ Person Household | 9 (100.0%) | 0 (0.0%) |
| Total Housing Units | 48 (94.1%) | 3 (5.9%) |
Occupancy by Educational Attainment in Maiden Rock
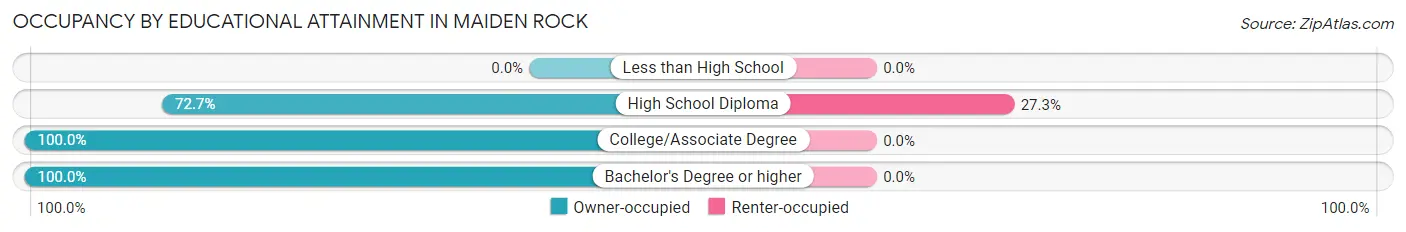
| Household Size | Owner-occupied | Renter-occupied |
| Less than High School | 0 (0.0%) | 0 (0.0%) |
| High School Diploma | 8 (72.7%) | 3 (27.3%) |
| College/Associate Degree | 10 (100.0%) | 0 (0.0%) |
| Bachelor's Degree or higher | 30 (100.0%) | 0 (0.0%) |
Occupancy by Age of Householder in Maiden Rock
| Age Bracket | # Households | % Households |
| Under 35 Years | 0 | 0.0% |
| 35 to 44 Years | 8 | 15.7% |
| 45 to 54 Years | 17 | 33.3% |
| 55 to 64 Years | 9 | 17.6% |
| 65 to 74 Years | 10 | 19.6% |
| 75 to 84 Years | 5 | 9.8% |
| 85 Years and Over | 2 | 3.9% |
| Total | 51 | 100.0% |
Housing Finances in Maiden Rock
Median Income by Occupancy in Maiden Rock
| Occupancy Type | # Households | Median Income |
| Owner-Occupied | 48 (94.1%) | $81,000 |
| Renter-Occupied | 3 (5.9%) | $0 |
| Average | 51 (100.0%) | $80,250 |
Occupancy by Householder Income Bracket in Maiden Rock
| Income Bracket | Owner-occupied | Renter-occupied |
| Less than $5,000 | 0 (0.0%) | 0 (0.0%) |
| $5,000 to $9,999 | 3 (6.2%) | 0 (0.0%) |
| $10,000 to $14,999 | 0 (0.0%) | 0 (0.0%) |
| $15,000 to $19,999 | 2 (4.2%) | 0 (0.0%) |
| $20,000 to $24,999 | 1 (2.1%) | 0 (0.0%) |
| $25,000 to $34,999 | 4 (8.3%) | 0 (0.0%) |
| $35,000 to $49,999 | 5 (10.4%) | 3 (100.0%) |
| $50,000 to $74,999 | 7 (14.6%) | 0 (0.0%) |
| $75,000 to $99,999 | 9 (18.8%) | 0 (0.0%) |
| $100,000 to $149,999 | 4 (8.3%) | 0 (0.0%) |
| $150,000 or more | 13 (27.1%) | 0 (0.0%) |
| Total | 48 (100.0%) | 3 (100.0%) |
Monthly Housing Cost Tiers in Maiden Rock
| Monthly Cost | Owner-occupied | Renter-occupied |
| Less than $300 | 1 (2.1%) | 0 (0.0%) |
| $300 to $499 | 2 (4.2%) | 0 (0.0%) |
| $500 to $799 | 7 (14.6%) | 3 (100.0%) |
| $800 to $999 | 5 (10.4%) | 0 (0.0%) |
| $1,000 to $1,499 | 18 (37.5%) | 0 (0.0%) |
| $1,500 to $1,999 | 7 (14.6%) | 0 (0.0%) |
| $2,000 to $2,499 | 5 (10.4%) | 0 (0.0%) |
| $2,500 to $2,999 | 3 (6.2%) | 0 (0.0%) |
| $3,000 or more | 0 (0.0%) | 0 (0.0%) |
| Total | 48 (100.0%) | 3 (100.0%) |
Physical Housing Characteristics in Maiden Rock
Housing Structures in Maiden Rock
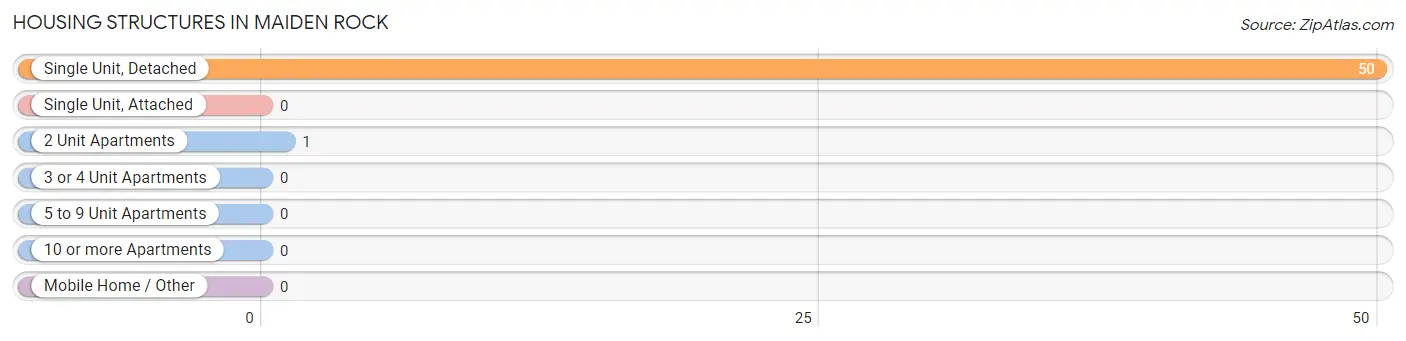
| Structure Type | # Housing Units | % Housing Units |
| Single Unit, Detached | 50 | 98.0% |
| Single Unit, Attached | 0 | 0.0% |
| 2 Unit Apartments | 1 | 2.0% |
| 3 or 4 Unit Apartments | 0 | 0.0% |
| 5 to 9 Unit Apartments | 0 | 0.0% |
| 10 or more Apartments | 0 | 0.0% |
| Mobile Home / Other | 0 | 0.0% |
| Total | 51 | 100.0% |
Housing Structures by Occupancy in Maiden Rock
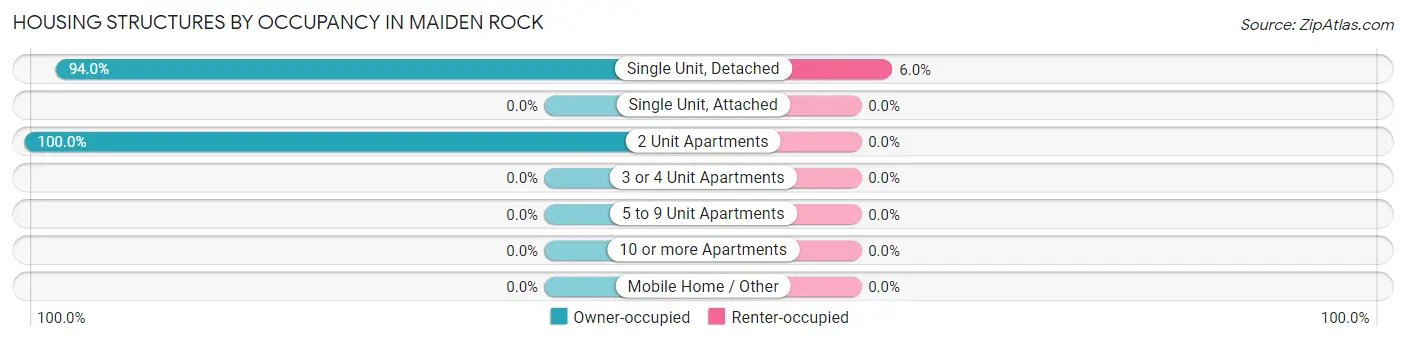
| Structure Type | Owner-occupied | Renter-occupied |
| Single Unit, Detached | 47 (94.0%) | 3 (6.0%) |
| Single Unit, Attached | 0 (0.0%) | 0 (0.0%) |
| 2 Unit Apartments | 1 (100.0%) | 0 (0.0%) |
| 3 or 4 Unit Apartments | 0 (0.0%) | 0 (0.0%) |
| 5 to 9 Unit Apartments | 0 (0.0%) | 0 (0.0%) |
| 10 or more Apartments | 0 (0.0%) | 0 (0.0%) |
| Mobile Home / Other | 0 (0.0%) | 0 (0.0%) |
| Total | 48 (94.1%) | 3 (5.9%) |
Housing Structures by Number of Rooms in Maiden Rock
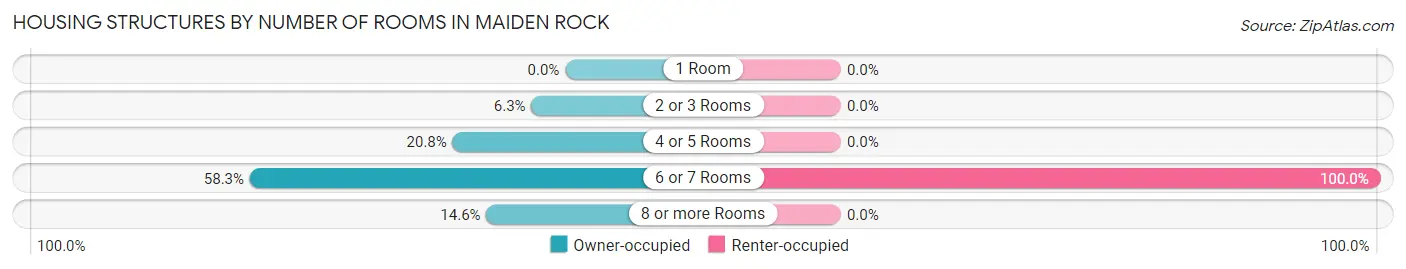
| Number of Rooms | Owner-occupied | Renter-occupied |
| 1 Room | 0 (0.0%) | 0 (0.0%) |
| 2 or 3 Rooms | 3 (6.2%) | 0 (0.0%) |
| 4 or 5 Rooms | 10 (20.8%) | 0 (0.0%) |
| 6 or 7 Rooms | 28 (58.3%) | 3 (100.0%) |
| 8 or more Rooms | 7 (14.6%) | 0 (0.0%) |
| Total | 48 (100.0%) | 3 (100.0%) |
Housing Structure by Heating Type in Maiden Rock
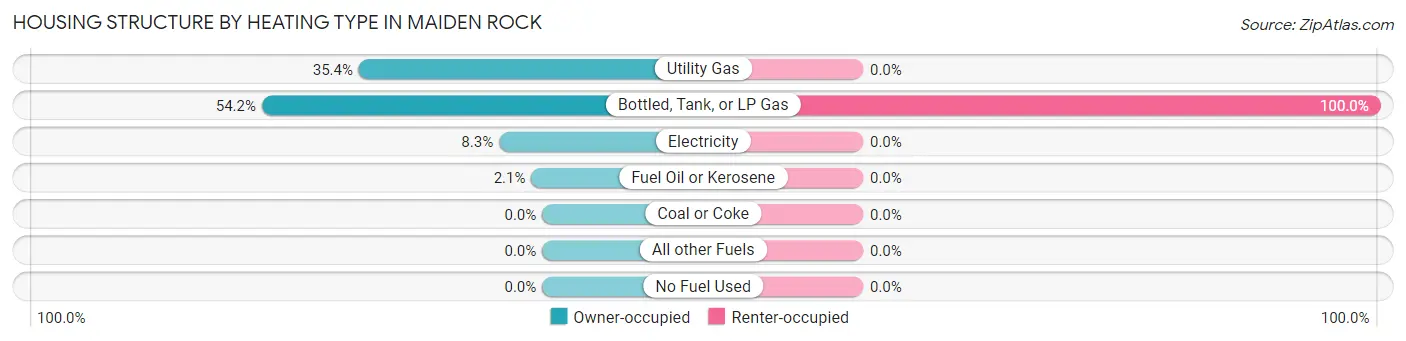
| Heating Type | Owner-occupied | Renter-occupied |
| Utility Gas | 17 (35.4%) | 0 (0.0%) |
| Bottled, Tank, or LP Gas | 26 (54.2%) | 3 (100.0%) |
| Electricity | 4 (8.3%) | 0 (0.0%) |
| Fuel Oil or Kerosene | 1 (2.1%) | 0 (0.0%) |
| Coal or Coke | 0 (0.0%) | 0 (0.0%) |
| All other Fuels | 0 (0.0%) | 0 (0.0%) |
| No Fuel Used | 0 (0.0%) | 0 (0.0%) |
| Total | 48 (100.0%) | 3 (100.0%) |
Household Vehicle Usage in Maiden Rock
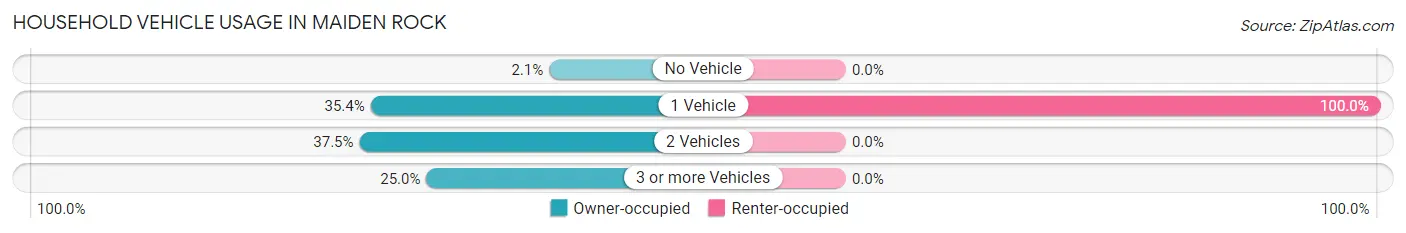
| Vehicles per Household | Owner-occupied | Renter-occupied |
| No Vehicle | 1 (2.1%) | 0 (0.0%) |
| 1 Vehicle | 17 (35.4%) | 3 (100.0%) |
| 2 Vehicles | 18 (37.5%) | 0 (0.0%) |
| 3 or more Vehicles | 12 (25.0%) | 0 (0.0%) |
| Total | 48 (100.0%) | 3 (100.0%) |
Real Estate & Mortgages in Maiden Rock
Real Estate and Mortgage Overview in Maiden Rock
| Characteristic | Without Mortgage | With Mortgage |
| Housing Units | 10 | 38 |
| Median Property Value | $162,500 | $144,400 |
| Median Household Income | $73,750 | $12 |
| Monthly Housing Costs | $800 | $0 |
| Real Estate Taxes | $2,600 | $0 |
Property Value by Mortgage Status in Maiden Rock
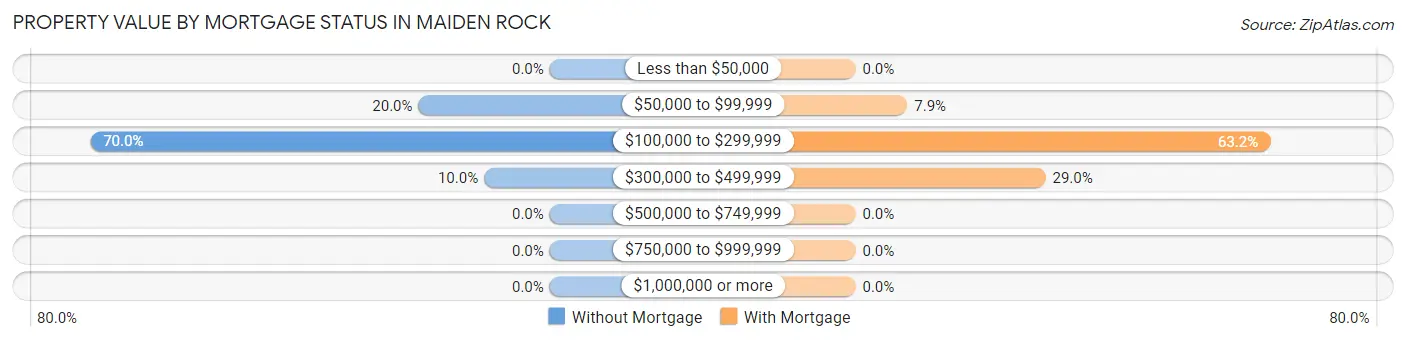
| Property Value | Without Mortgage | With Mortgage |
| Less than $50,000 | 0 (0.0%) | 0 (0.0%) |
| $50,000 to $99,999 | 2 (20.0%) | 3 (7.9%) |
| $100,000 to $299,999 | 7 (70.0%) | 24 (63.2%) |
| $300,000 to $499,999 | 1 (10.0%) | 11 (28.9%) |
| $500,000 to $749,999 | 0 (0.0%) | 0 (0.0%) |
| $750,000 to $999,999 | 0 (0.0%) | 0 (0.0%) |
| $1,000,000 or more | 0 (0.0%) | 0 (0.0%) |
| Total | 10 (100.0%) | 38 (100.0%) |
Household Income by Mortgage Status in Maiden Rock
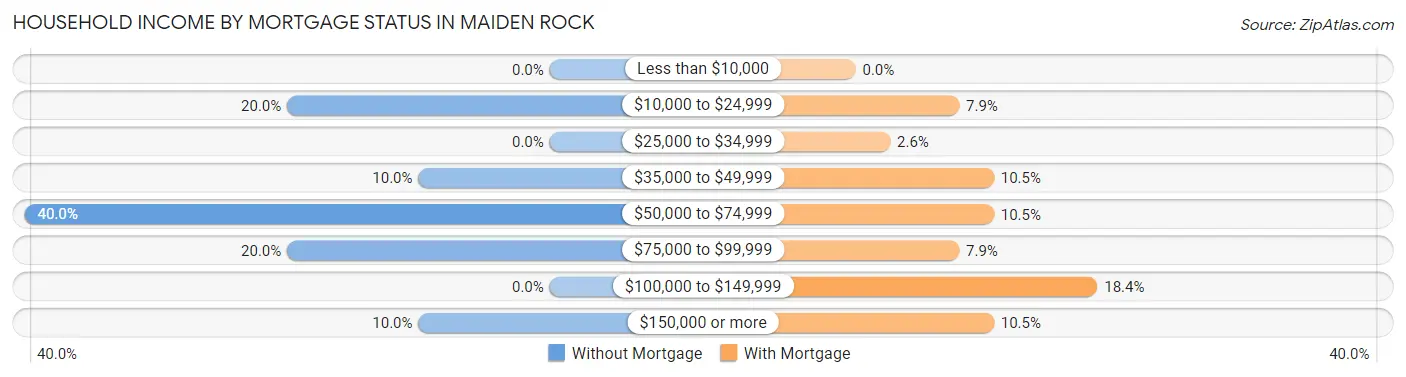
| Household Income | Without Mortgage | With Mortgage |
| Less than $10,000 | 0 (0.0%) | 0 (0.0%) |
| $10,000 to $24,999 | 2 (20.0%) | 3 (7.9%) |
| $25,000 to $34,999 | 0 (0.0%) | 1 (2.6%) |
| $35,000 to $49,999 | 1 (10.0%) | 4 (10.5%) |
| $50,000 to $74,999 | 4 (40.0%) | 4 (10.5%) |
| $75,000 to $99,999 | 2 (20.0%) | 3 (7.9%) |
| $100,000 to $149,999 | 0 (0.0%) | 7 (18.4%) |
| $150,000 or more | 1 (10.0%) | 4 (10.5%) |
| Total | 10 (100.0%) | 38 (100.0%) |
Property Value to Household Income Ratio in Maiden Rock
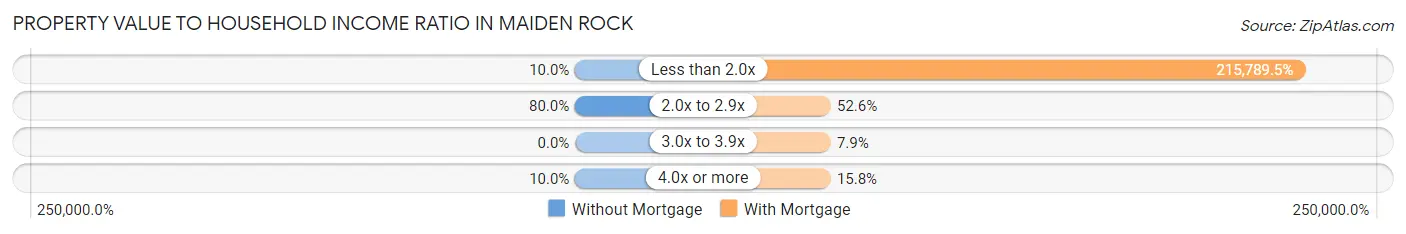
| Value-to-Income Ratio | Without Mortgage | With Mortgage |
| Less than 2.0x | 1 (10.0%) | 82,000 (215,789.5%) |
| 2.0x to 2.9x | 8 (80.0%) | 20 (52.6%) |
| 3.0x to 3.9x | 0 (0.0%) | 3 (7.9%) |
| 4.0x or more | 1 (10.0%) | 6 (15.8%) |
| Total | 10 (100.0%) | 38 (100.0%) |
Real Estate Taxes by Mortgage Status in Maiden Rock
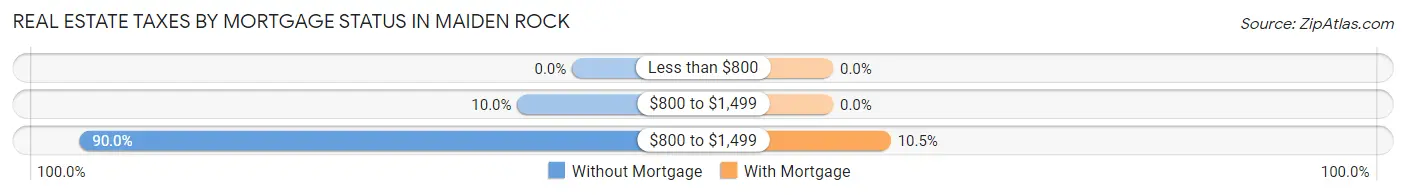
| Property Taxes | Without Mortgage | With Mortgage |
| Less than $800 | 0 (0.0%) | 0 (0.0%) |
| $800 to $1,499 | 1 (10.0%) | 0 (0.0%) |
| $800 to $1,499 | 9 (90.0%) | 4 (10.5%) |
| Total | 10 (100.0%) | 38 (100.0%) |
Health & Disability in Maiden Rock
Health Insurance Coverage by Age in Maiden Rock
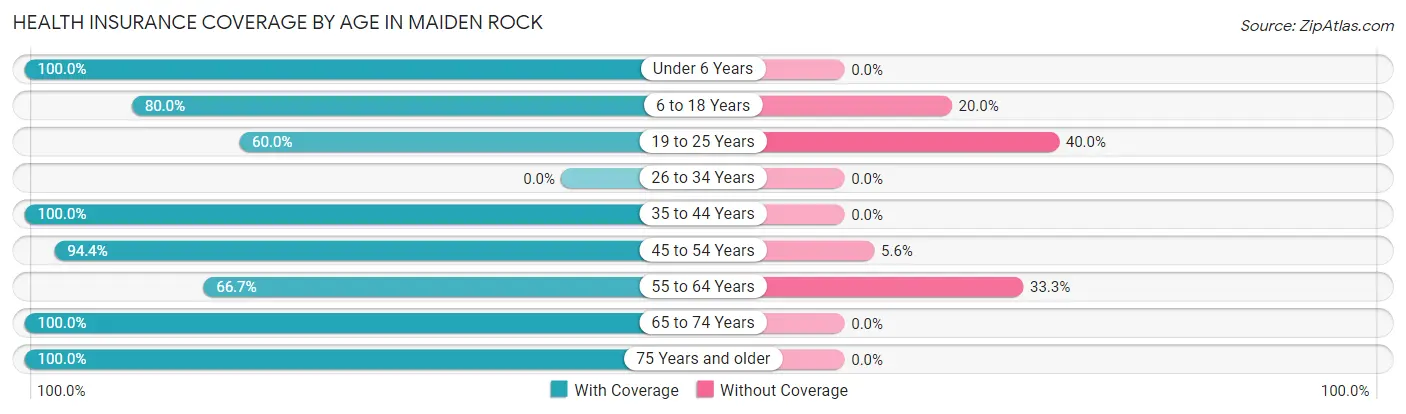
| Age Bracket | With Coverage | Without Coverage |
| Under 6 Years | 1 (100.0%) | 0 (0.0%) |
| 6 to 18 Years | 12 (80.0%) | 3 (20.0%) |
| 19 to 25 Years | 3 (60.0%) | 2 (40.0%) |
| 26 to 34 Years | 0 (0.0%) | 0 (0.0%) |
| 35 to 44 Years | 15 (100.0%) | 0 (0.0%) |
| 45 to 54 Years | 17 (94.4%) | 1 (5.6%) |
| 55 to 64 Years | 10 (66.7%) | 5 (33.3%) |
| 65 to 74 Years | 18 (100.0%) | 0 (0.0%) |
| 75 Years and older | 9 (100.0%) | 0 (0.0%) |
| Total | 85 (88.5%) | 11 (11.5%) |
Health Insurance Coverage by Citizenship Status in Maiden Rock

| Citizenship Status | With Coverage | Without Coverage |
| Native Born | 1 (100.0%) | 0 (0.0%) |
| Foreign Born, Citizen | 12 (80.0%) | 3 (20.0%) |
| Foreign Born, not a Citizen | 3 (60.0%) | 2 (40.0%) |
Health Insurance Coverage by Household Income in Maiden Rock
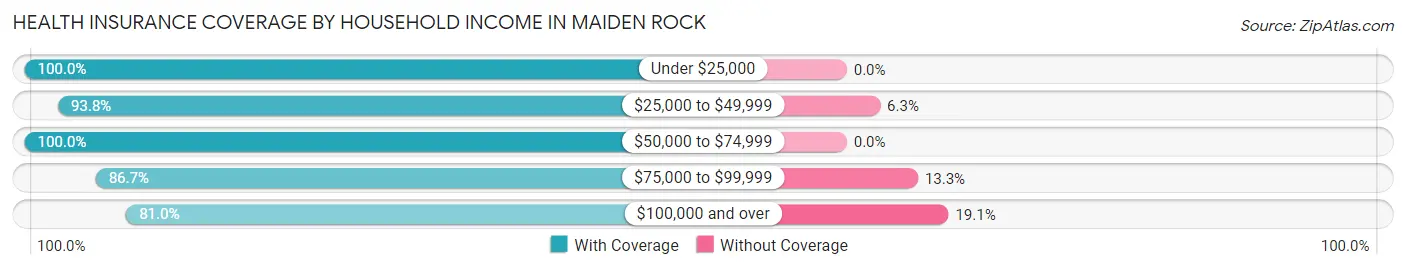
| Household Income | With Coverage | Without Coverage |
| Under $25,000 | 6 (100.0%) | 0 (0.0%) |
| $25,000 to $49,999 | 15 (93.8%) | 1 (6.2%) |
| $50,000 to $74,999 | 17 (100.0%) | 0 (0.0%) |
| $75,000 to $99,999 | 13 (86.7%) | 2 (13.3%) |
| $100,000 and over | 34 (80.9%) | 8 (19.1%) |
Public vs Private Health Insurance Coverage by Age in Maiden Rock
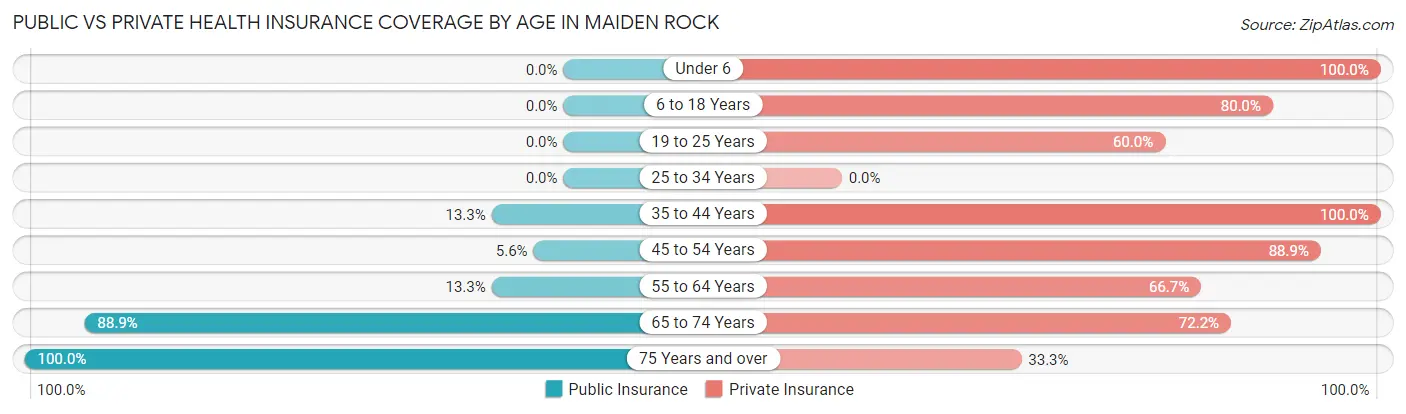
| Age Bracket | Public Insurance | Private Insurance |
| Under 6 | 0 (0.0%) | 1 (100.0%) |
| 6 to 18 Years | 0 (0.0%) | 12 (80.0%) |
| 19 to 25 Years | 0 (0.0%) | 3 (60.0%) |
| 25 to 34 Years | 0 (0.0%) | 0 (0.0%) |
| 35 to 44 Years | 2 (13.3%) | 15 (100.0%) |
| 45 to 54 Years | 1 (5.6%) | 16 (88.9%) |
| 55 to 64 Years | 2 (13.3%) | 10 (66.7%) |
| 65 to 74 Years | 16 (88.9%) | 13 (72.2%) |
| 75 Years and over | 9 (100.0%) | 3 (33.3%) |
| Total | 30 (31.2%) | 73 (76.0%) |
Disability Status by Sex by Age in Maiden Rock
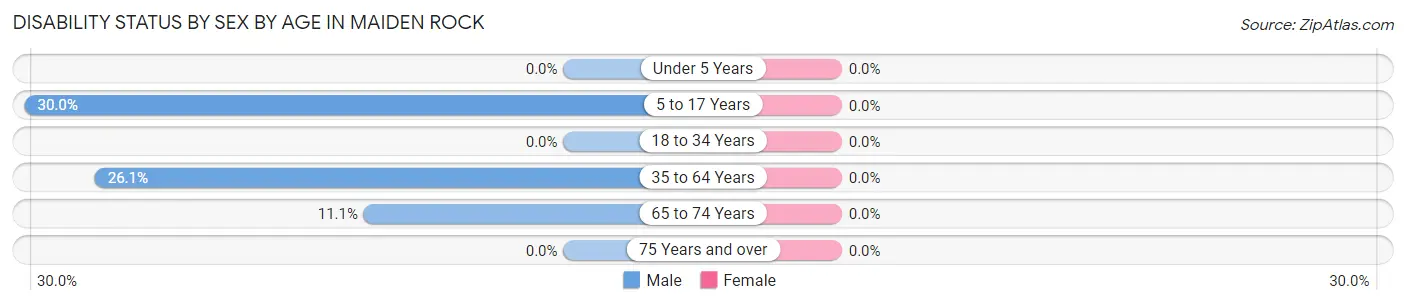
| Age Bracket | Male | Female |
| Under 5 Years | 0 (0.0%) | 0 (0.0%) |
| 5 to 17 Years | 3 (30.0%) | 0 (0.0%) |
| 18 to 34 Years | 0 (0.0%) | 0 (0.0%) |
| 35 to 64 Years | 6 (26.1%) | 0 (0.0%) |
| 65 to 74 Years | 1 (11.1%) | 0 (0.0%) |
| 75 Years and over | 0 (0.0%) | 0 (0.0%) |
Disability Class by Sex by Age in Maiden Rock
Disability Class: Hearing Difficulty
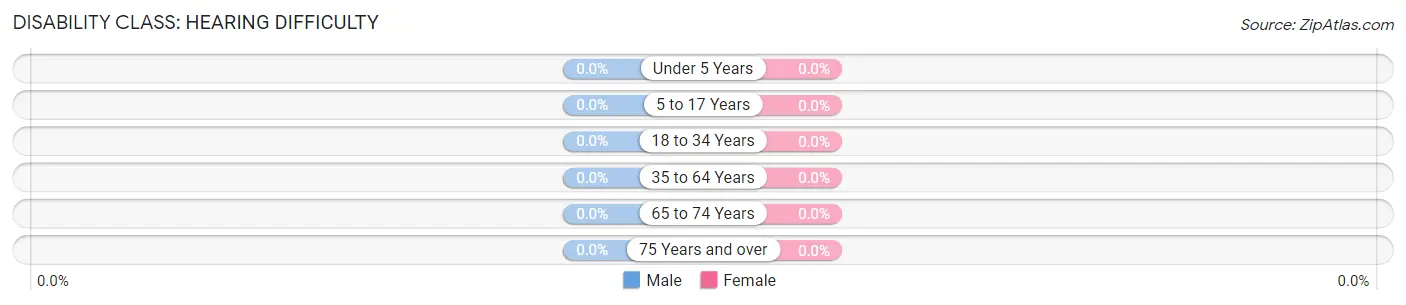
| Age Bracket | Male | Female |
| Under 5 Years | 0 (0.0%) | 0 (0.0%) |
| 5 to 17 Years | 0 (0.0%) | 0 (0.0%) |
| 18 to 34 Years | 0 (0.0%) | 0 (0.0%) |
| 35 to 64 Years | 0 (0.0%) | 0 (0.0%) |
| 65 to 74 Years | 0 (0.0%) | 0 (0.0%) |
| 75 Years and over | 0 (0.0%) | 0 (0.0%) |
Disability Class: Vision Difficulty
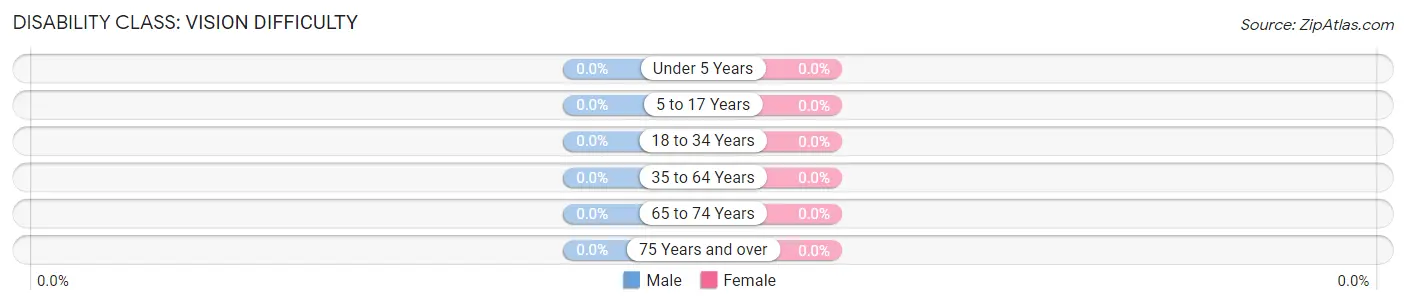
| Age Bracket | Male | Female |
| Under 5 Years | 0 (0.0%) | 0 (0.0%) |
| 5 to 17 Years | 0 (0.0%) | 0 (0.0%) |
| 18 to 34 Years | 0 (0.0%) | 0 (0.0%) |
| 35 to 64 Years | 0 (0.0%) | 0 (0.0%) |
| 65 to 74 Years | 0 (0.0%) | 0 (0.0%) |
| 75 Years and over | 0 (0.0%) | 0 (0.0%) |
Disability Class: Cognitive Difficulty
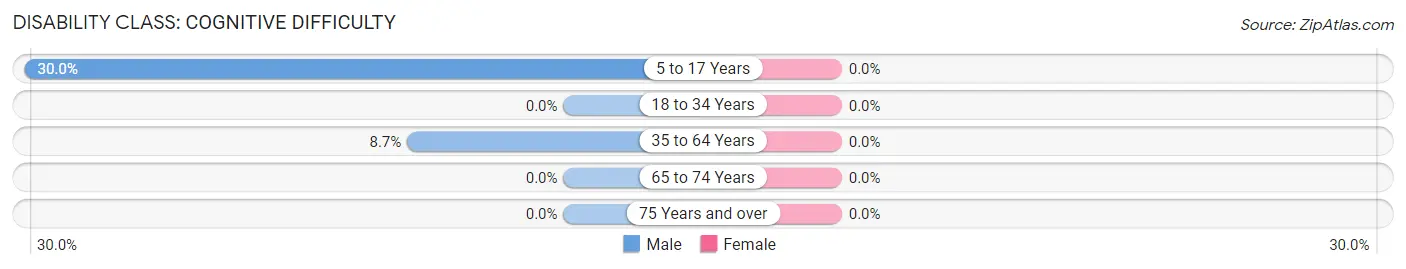
| Age Bracket | Male | Female |
| 5 to 17 Years | 3 (30.0%) | 0 (0.0%) |
| 18 to 34 Years | 0 (0.0%) | 0 (0.0%) |
| 35 to 64 Years | 2 (8.7%) | 0 (0.0%) |
| 65 to 74 Years | 0 (0.0%) | 0 (0.0%) |
| 75 Years and over | 0 (0.0%) | 0 (0.0%) |
Disability Class: Ambulatory Difficulty
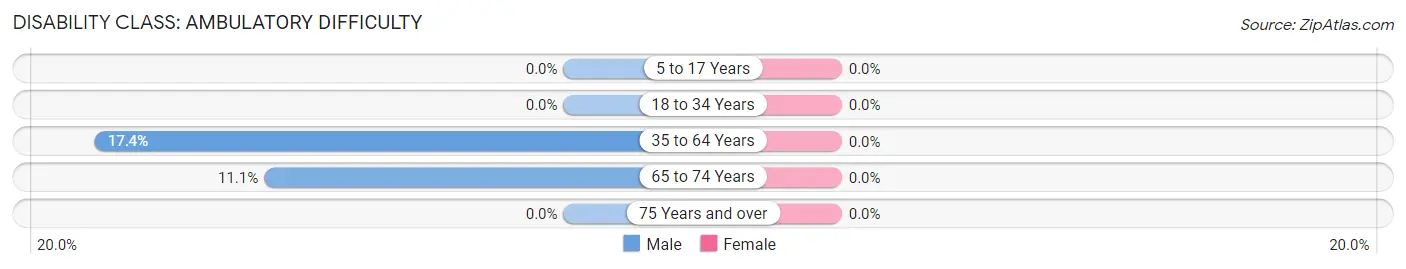
| Age Bracket | Male | Female |
| 5 to 17 Years | 0 (0.0%) | 0 (0.0%) |
| 18 to 34 Years | 0 (0.0%) | 0 (0.0%) |
| 35 to 64 Years | 4 (17.4%) | 0 (0.0%) |
| 65 to 74 Years | 1 (11.1%) | 0 (0.0%) |
| 75 Years and over | 0 (0.0%) | 0 (0.0%) |
Disability Class: Self-Care Difficulty
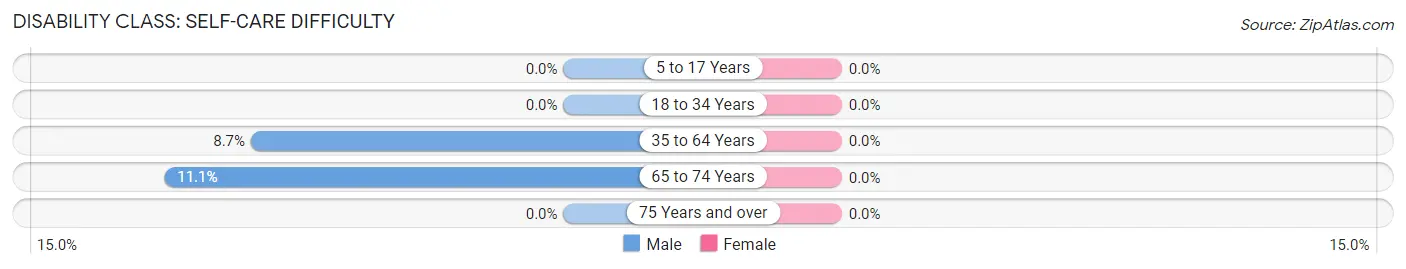
| Age Bracket | Male | Female |
| 5 to 17 Years | 0 (0.0%) | 0 (0.0%) |
| 18 to 34 Years | 0 (0.0%) | 0 (0.0%) |
| 35 to 64 Years | 2 (8.7%) | 0 (0.0%) |
| 65 to 74 Years | 1 (11.1%) | 0 (0.0%) |
| 75 Years and over | 0 (0.0%) | 0 (0.0%) |
Technology Access in Maiden Rock
Computing Device Access in Maiden Rock
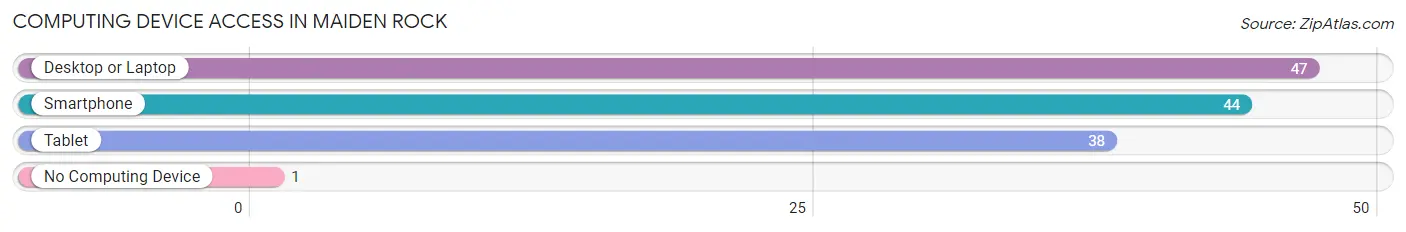
| Device Type | # Households | % Households |
| Desktop or Laptop | 47 | 92.2% |
| Smartphone | 44 | 86.3% |
| Tablet | 38 | 74.5% |
| No Computing Device | 1 | 2.0% |
| Total | 51 | 100.0% |
Internet Access in Maiden Rock
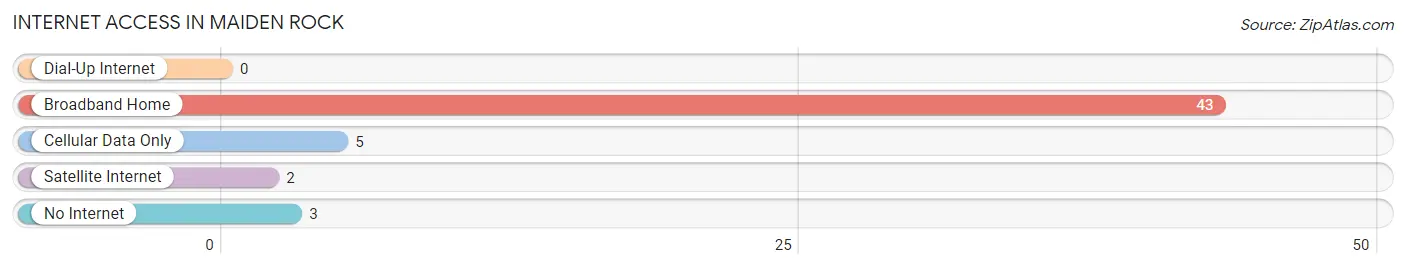
| Internet Type | # Households | % Households |
| Dial-Up Internet | 0 | 0.0% |
| Broadband Home | 43 | 84.3% |
| Cellular Data Only | 5 | 9.8% |
| Satellite Internet | 2 | 3.9% |
| No Internet | 3 | 5.9% |
| Total | 51 | 100.0% |
Maiden Rock Summary
Maiden Rock, Wisconsin is a small village located in Pierce County, Wisconsin. It is situated on the banks of the Mississippi River, just south of the city of Prescott. The village has a population of just over 500 people, and is part of the Prescott School District.
History
Maiden Rock was first settled in 1854 by a group of Norwegian immigrants. The village was named after a nearby rock formation that was said to resemble a maiden. The village was incorporated in 1876 and was home to a variety of businesses, including a sawmill, a grist mill, a blacksmith shop, and a general store.
In the late 19th century, Maiden Rock was a popular tourist destination. The village was home to a number of resorts, including the Maiden Rock Hotel, which was built in 1887. The hotel was a popular destination for visitors from the Twin Cities and other parts of Wisconsin.
In the early 20th century, Maiden Rock was home to a number of industries, including a brickyard, a cheese factory, and a canning factory. The village also had a number of churches, including the Norwegian Lutheran Church, which was built in 1887.
Geography
Maiden Rock is located in western Wisconsin, on the banks of the Mississippi River. The village is situated on the western edge of the St. Croix River Valley, which is part of the Driftless Area. The village is surrounded by rolling hills and bluffs, and is home to a variety of wildlife, including deer, turkeys, and bald eagles.
The village is located just south of the city of Prescott, and is about an hour’s drive from the Twin Cities. The village is also close to the Wisconsin-Minnesota border, and is about a two-hour drive from the cities of Minneapolis and St. Paul.
Economy
Maiden Rock’s economy is largely based on tourism and agriculture. The village is home to a number of resorts, including the Maiden Rock Hotel, which is a popular destination for visitors from the Twin Cities and other parts of Wisconsin. The village also has a number of farms, which produce a variety of crops, including corn, soybeans, and hay.
The village is also home to a number of small businesses, including a general store, a hardware store, and a cafe. The village also has a number of churches, including the Norwegian Lutheran Church, which was built in 1887.
Demographics
As of the 2010 census, the population of Maiden Rock was 517. The village is predominantly white, with 95.3% of the population identifying as white. The median household income in the village is $45,000, and the median age is 44.
Maiden Rock is a small, rural village with a strong sense of community. The village is home to a number of festivals and events, including the annual Maiden Rock Festival, which is held every summer. The village also has a number of parks and recreational areas, including the Maiden Rock Nature Preserve, which is a popular destination for hikers and birdwatchers.
Common Questions
What is the Total Population of Maiden Rock?
Total Population of Maiden Rock is 96.
What is the Total Male Population of Maiden Rock?
Total Male Population of Maiden Rock is 50.
What is the Total Female Population of Maiden Rock?
Total Female Population of Maiden Rock is 46.
What is the Ratio of Males per 100 Females in Maiden Rock?
There are 108.70 Males per 100 Females in Maiden Rock.
What is the Ratio of Females per 100 Males in Maiden Rock?
There are 92.00 Females per 100 Males in Maiden Rock.
What is the Median Population Age in Maiden Rock?
Median Population Age in Maiden Rock is 52.8 Years.
What is the Average Family Size in Maiden Rock
Average Family Size in Maiden Rock is 2.4 People.
What is the Average Household Size in Maiden Rock
Average Household Size in Maiden Rock is 1.9 People.
What is Per Capita Income in Maiden Rock?
Per Capita income in Maiden Rock is $49,003.
What is the Median Household income in Maiden Rock?
Median Household Income in Maiden Rock is $80,250.
What is Inequality or Gini Index in Maiden Rock?
Inequality or Gini Index in Maiden Rock is 0.41.
How Large is the Labor Force in Maiden Rock?
There are 56 People in the Labor Forcein in Maiden Rock.
What is the Percentage of People in the Labor Force in Maiden Rock?
68.3% of People are in the Labor Force in Maiden Rock.
What is the Unemployment Rate in Maiden Rock?
Unemployment Rate in Maiden Rock is 1.8%.