Legend Lake, WI
Legend Lake Map
Legend Lake Overview
1,530
TOTAL POPULATION
804
MALE POPULATION
726
FEMALE POPULATION
110.74
MALES / 100 FEMALES
90.30
FEMALES / 100 MALES
47.5
MEDIAN AGE
3.2
AVG FAMILY SIZE
2.8
AVG HOUSEHOLD SIZE
$36,179
PER CAPITA INCOME
$88,683
AVG FAMILY INCOME
$86,563
AVG HOUSEHOLD INCOME
19.4%
WAGE / INCOME GAP [ % ]
80.6¢/ $1
WAGE / INCOME GAP [ $ ]
0.42
INEQUALITY / GINI INDEX
528
LABOR FORCE [ PEOPLE ]
44.1%
PERCENT IN LABOR FORCE
10.6%
UNEMPLOYMENT RATE
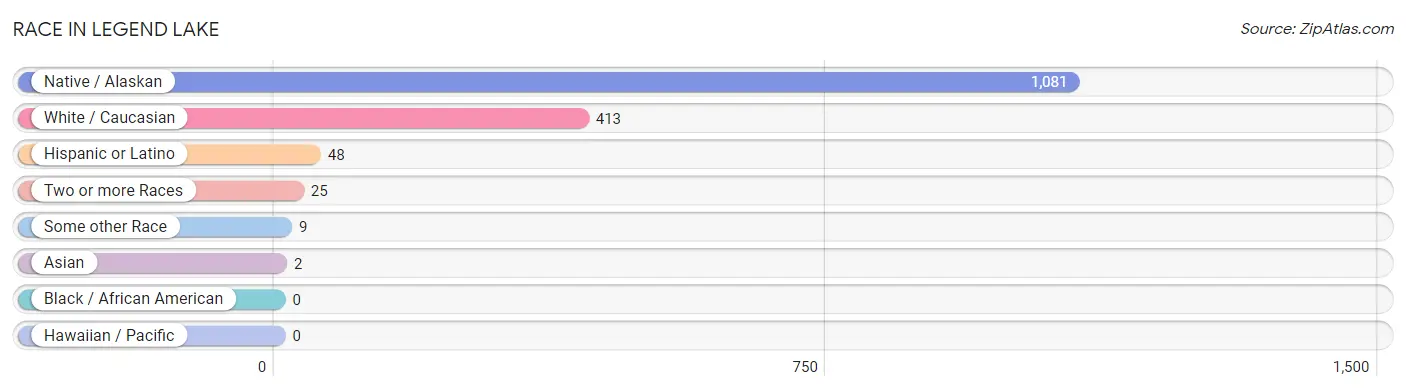
Race in Legend Lake
The most populous races in Legend Lake are Native / Alaskan (1,081 | 70.7%), White / Caucasian (413 | 27.0%), and Hispanic or Latino (48 | 3.1%).
| Race | # Population | % Population |
| Asian | 2 | 0.1% |
| Black / African American | 0 | 0.0% |
| Hawaiian / Pacific | 0 | 0.0% |
| Hispanic or Latino | 48 | 3.1% |
| Native / Alaskan | 1,081 | 70.7% |
| White / Caucasian | 413 | 27.0% |
| Two or more Races | 25 | 1.6% |
| Some other Race | 9 | 0.6% |
| Total | 1,530 | 100.0% |
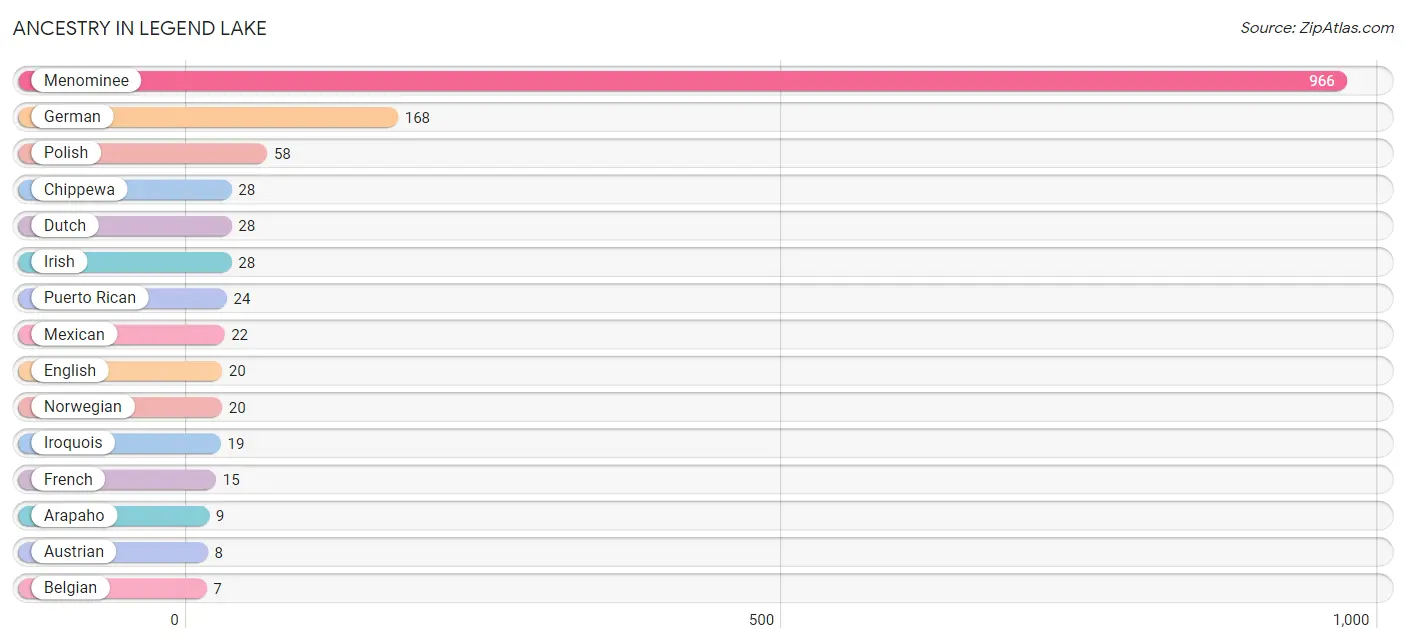
Ancestry in Legend Lake
The most populous ancestries reported in Legend Lake are Menominee (966 | 63.1%), German (168 | 11.0%), Polish (58 | 3.8%), Chippewa (28 | 1.8%), and Dutch (28 | 1.8%), together accounting for 81.6% of all Legend Lake residents.
| Ancestry | # Population | % Population |
| American | 1 | 0.1% |
| Arab | 4 | 0.3% |
| Arapaho | 9 | 0.6% |
| Austrian | 8 | 0.5% |
| Belgian | 7 | 0.5% |
| Cherokee | 5 | 0.3% |
| Chippewa | 28 | 1.8% |
| Cuban | 2 | 0.1% |
| Czech | 3 | 0.2% |
| Czechoslovakian | 3 | 0.2% |
| Dutch | 28 | 1.8% |
| English | 20 | 1.3% |
| European | 3 | 0.2% |
| French | 15 | 1.0% |
| French Canadian | 2 | 0.1% |
| German | 168 | 11.0% |
| Irish | 28 | 1.8% |
| Iroquois | 19 | 1.2% |
| Korean | 2 | 0.1% |
| Lebanese | 4 | 0.3% |
| Menominee | 966 | 63.1% |
| Mexican | 22 | 1.4% |
| Norwegian | 20 | 1.3% |
| Polish | 58 | 3.8% |
| Potawatomi | 3 | 0.2% |
| Puerto Rican | 24 | 1.6% |
| Scottish | 4 | 0.3% |
| Swedish | 7 | 0.5% | View All 28 Rows |
Immigrants in Legend Lake

| Immigration Origin | # Population | % Population | View All 0 Rows |
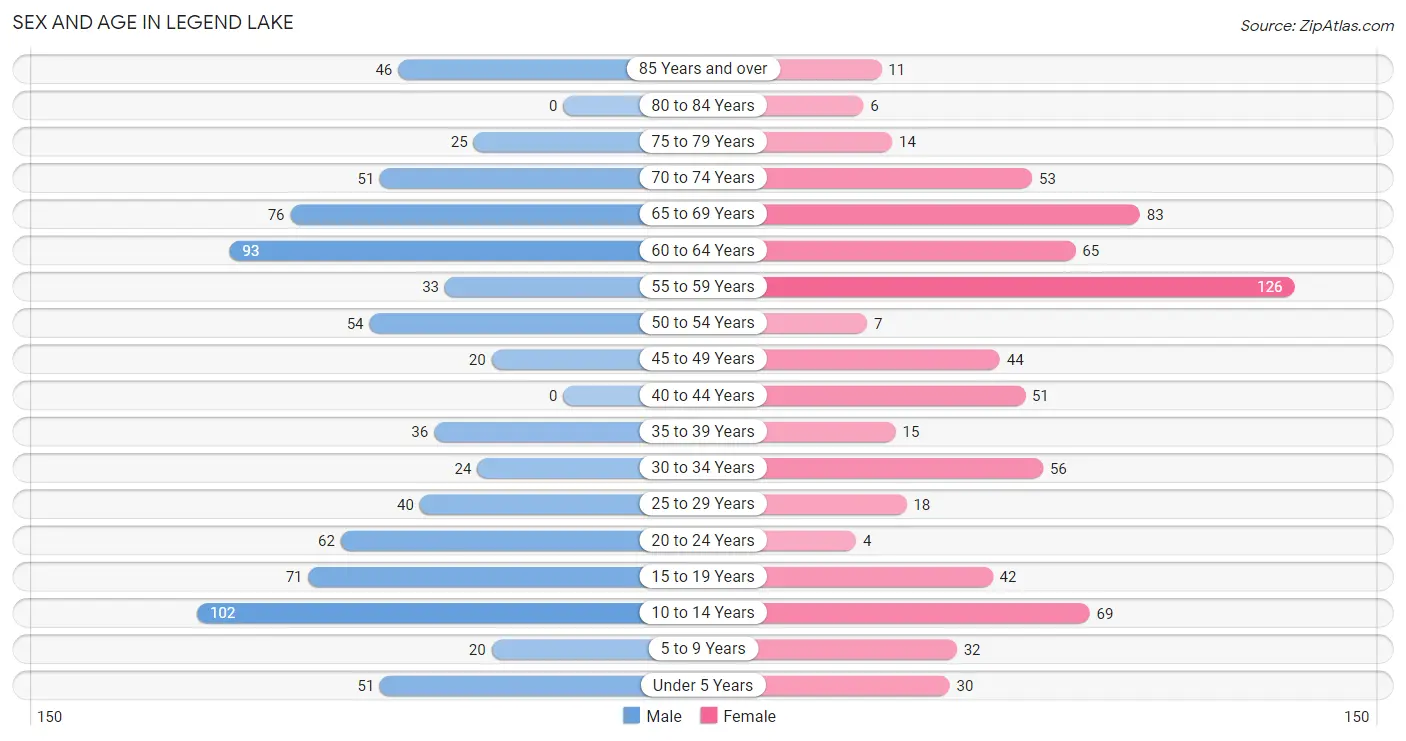
Sex and Age in Legend Lake
Sex and Age in Legend Lake
The most populous age groups in Legend Lake are 10 to 14 Years (102 | 12.7%) for men and 55 to 59 Years (126 | 17.4%) for women.
| Age Bracket | Male | Female |
| Under 5 Years | 51 (6.3%) | 30 (4.1%) |
| 5 to 9 Years | 20 (2.5%) | 32 (4.4%) |
| 10 to 14 Years | 102 (12.7%) | 69 (9.5%) |
| 15 to 19 Years | 71 (8.8%) | 42 (5.8%) |
| 20 to 24 Years | 62 (7.7%) | 4 (0.5%) |
| 25 to 29 Years | 40 (5.0%) | 18 (2.5%) |
| 30 to 34 Years | 24 (3.0%) | 56 (7.7%) |
| 35 to 39 Years | 36 (4.5%) | 15 (2.1%) |
| 40 to 44 Years | 0 (0.0%) | 51 (7.0%) |
| 45 to 49 Years | 20 (2.5%) | 44 (6.1%) |
| 50 to 54 Years | 54 (6.7%) | 7 (1.0%) |
| 55 to 59 Years | 33 (4.1%) | 126 (17.4%) |
| 60 to 64 Years | 93 (11.6%) | 65 (8.9%) |
| 65 to 69 Years | 76 (9.5%) | 83 (11.4%) |
| 70 to 74 Years | 51 (6.3%) | 53 (7.3%) |
| 75 to 79 Years | 25 (3.1%) | 14 (1.9%) |
| 80 to 84 Years | 0 (0.0%) | 6 (0.8%) |
| 85 Years and over | 46 (5.7%) | 11 (1.5%) |
| Total | 804 (100.0%) | 726 (100.0%) |
Families and Households in Legend Lake
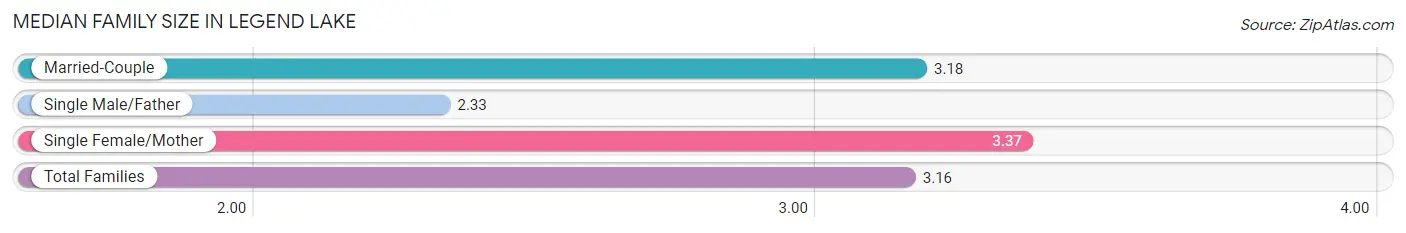
Median Family Size in Legend Lake
The median family size in Legend Lake is 3.16 persons per family, with single female/mother families (145 | 33.6%) accounting for the largest median family size of 3.37 persons per family. On the other hand, single male/father families (40 | 9.3%) represent the smallest median family size with 2.33 persons per family.
| Family Type | # Families | Family Size |
| Married-Couple | 246 (57.1%) | 3.18 |
| Single Male/Father | 40 (9.3%) | 2.33 |
| Single Female/Mother | 145 (33.6%) | 3.37 |
| Total Families | 431 (100.0%) | 3.16 |
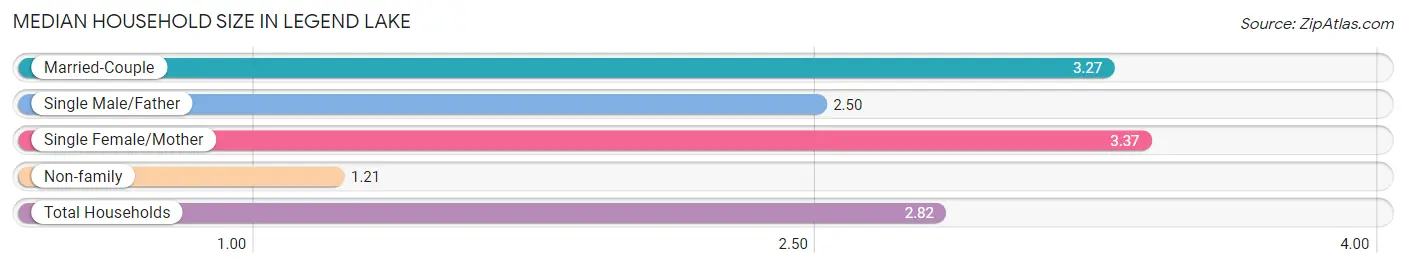
Median Household Size in Legend Lake
The median household size in Legend Lake is 2.82 persons per household, with single female/mother households (145 | 26.7%) accounting for the largest median household size of 3.37 persons per household. non-family households (112 | 20.6%) represent the smallest median household size with 1.21 persons per household.
| Household Type | # Households | Household Size |
| Married-Couple | 246 (45.3%) | 3.27 |
| Single Male/Father | 40 (7.4%) | 2.50 |
| Single Female/Mother | 145 (26.7%) | 3.37 |
| Non-family | 112 (20.6%) | 1.21 |
| Total Households | 543 (100.0%) | 2.82 |
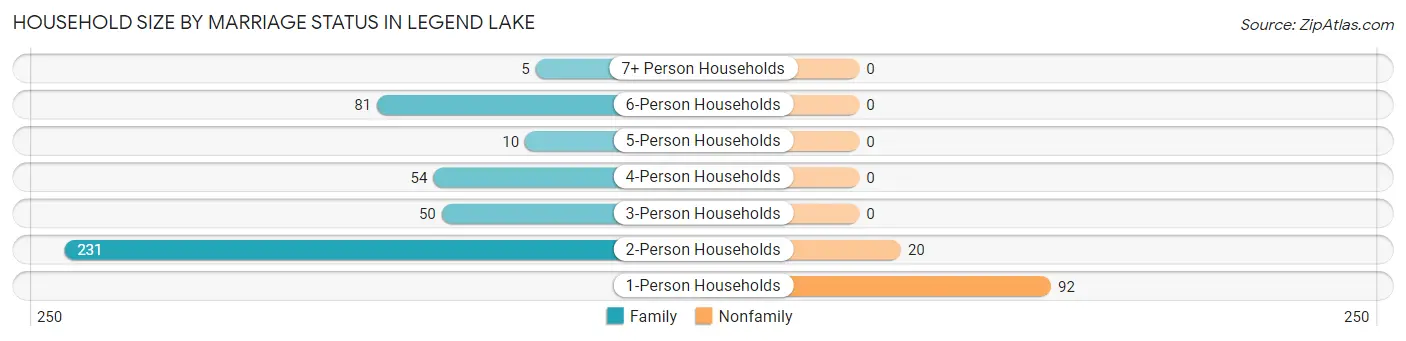
Household Size by Marriage Status in Legend Lake
Out of a total of 543 households in Legend Lake, 431 (79.4%) are family households, while 112 (20.6%) are nonfamily households. The most numerous type of family households are 2-person households, comprising 231, and the most common type of nonfamily households are 1-person households, comprising 92.
| Household Size | Family Households | Nonfamily Households |
| 1-Person Households | - | 92 (16.9%) |
| 2-Person Households | 231 (42.5%) | 20 (3.7%) |
| 3-Person Households | 50 (9.2%) | 0 (0.0%) |
| 4-Person Households | 54 (9.9%) | 0 (0.0%) |
| 5-Person Households | 10 (1.8%) | 0 (0.0%) |
| 6-Person Households | 81 (14.9%) | 0 (0.0%) |
| 7+ Person Households | 5 (0.9%) | 0 (0.0%) |
| Total | 431 (79.4%) | 112 (20.6%) |
Female Fertility in Legend Lake
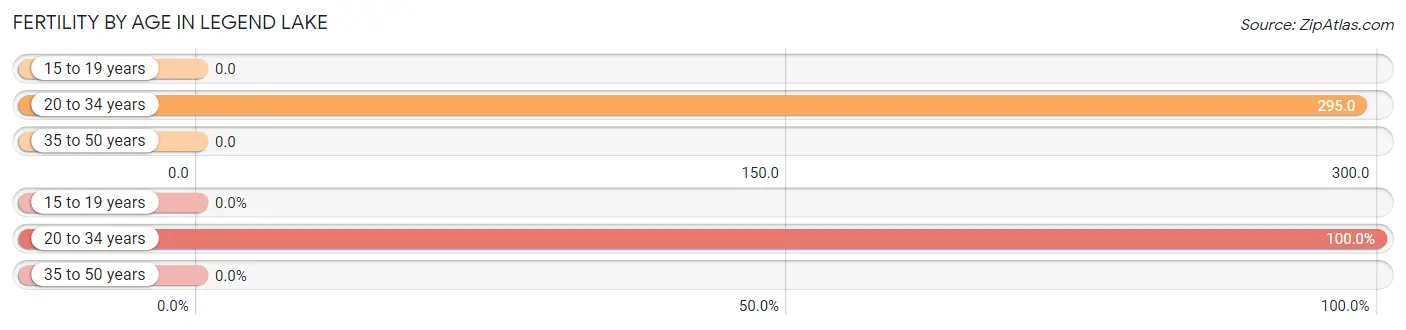
Fertility by Age in Legend Lake
Average fertility rate in Legend Lake is 100.0 births per 1,000 women. Women in the age bracket of 20 to 34 years have the highest fertility rate with 295.0 births per 1,000 women. Women in the age bracket of 20 to 34 years acount for 100.0% of all women with births.
| Age Bracket | Women with Births | Births / 1,000 Women |
| 15 to 19 years | 0 (0.0%) | 0.0 |
| 20 to 34 years | 23 (100.0%) | 295.0 |
| 35 to 50 years | 0 (0.0%) | 0.0 |
| Total | 23 (100.0%) | 100.0 |
Fertility by Age by Marriage Status in Legend Lake
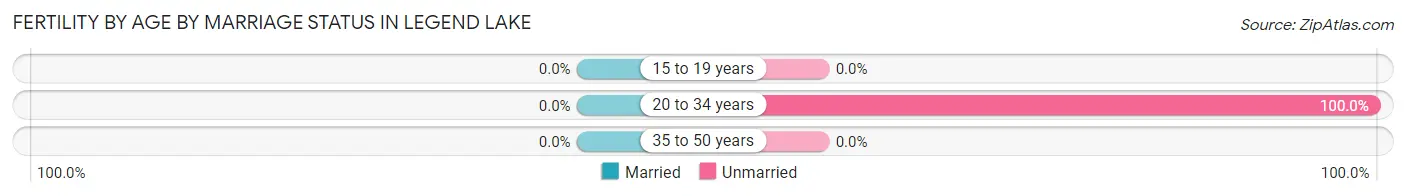
| Age Bracket | Married | Unmarried |
| 15 to 19 years | 0 (0.0%) | 0 (0.0%) |
| 20 to 34 years | 0 (0.0%) | 23 (100.0%) |
| 35 to 50 years | 0 (0.0%) | 0 (0.0%) |
| Total | 0 (0.0%) | 23 (100.0%) |
Fertility by Education in Legend Lake
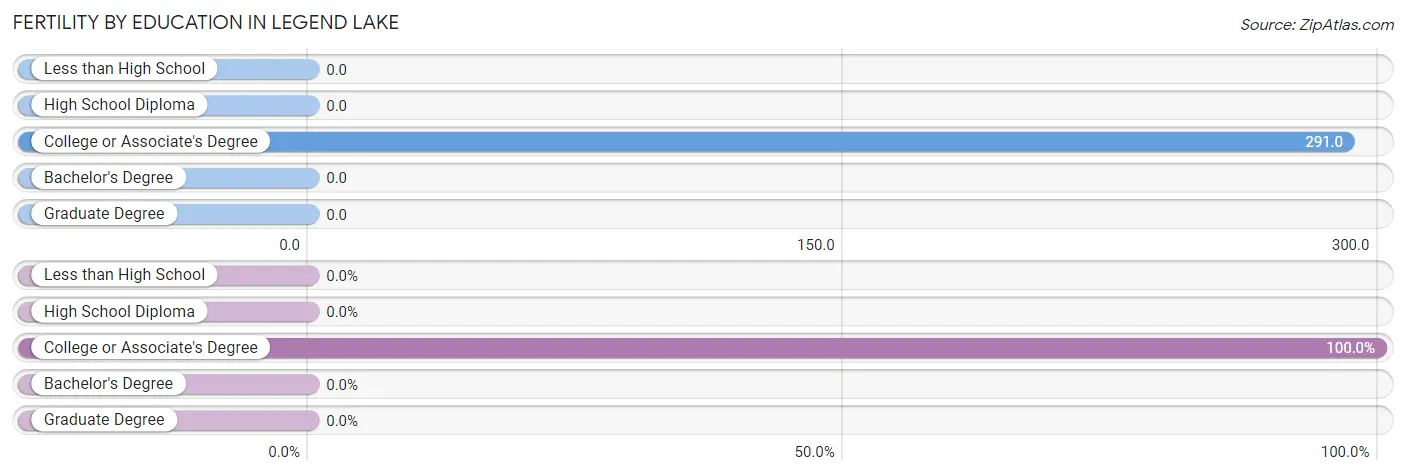
| Educational Attainment | Women with Births | Births / 1,000 Women |
| Less than High School | 0 (0.0%) | 0.0 |
| High School Diploma | 0 (0.0%) | 0.0 |
| College or Associate's Degree | 23 (100.0%) | 291.0 |
| Bachelor's Degree | 0 (0.0%) | 0.0 |
| Graduate Degree | 0 (0.0%) | 0.0 |
| Total | 23 (100.0%) | 100.0 |
Fertility by Education by Marriage Status in Legend Lake
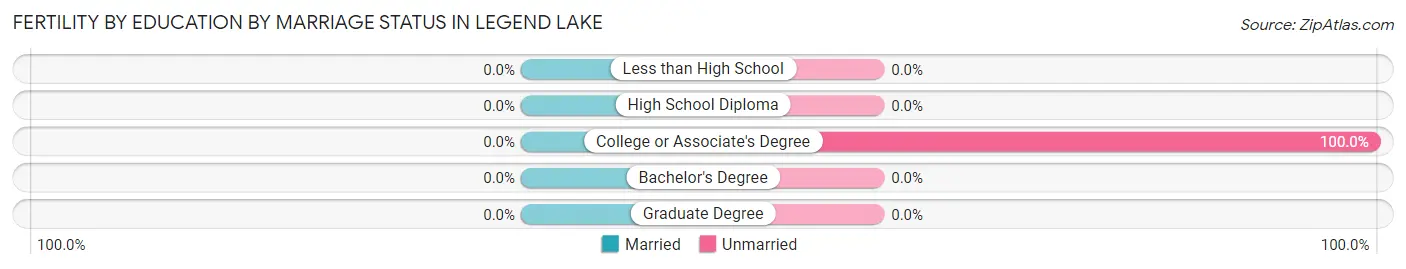
| Educational Attainment | Married | Unmarried |
| Less than High School | 0 (0.0%) | 0 (0.0%) |
| High School Diploma | 0 (0.0%) | 0 (0.0%) |
| College or Associate's Degree | 0 (0.0%) | 23 (100.0%) |
| Bachelor's Degree | 0 (0.0%) | 0 (0.0%) |
| Graduate Degree | 0 (0.0%) | 0 (0.0%) |
| Total | 0 (0.0%) | 23 (100.0%) |
Income in Legend Lake
Income Overview in Legend Lake
Per Capita Income in Legend Lake is $36,179, while median incomes of families and households are $88,683 and $86,563 respectively.
| Characteristic | Number | Measure |
| Per Capita Income | 1,530 | $36,179 |
| Median Family Income | 431 | $88,683 |
| Mean Family Income | 431 | $115,198 |
| Median Household Income | 543 | $86,563 |
| Mean Household Income | 543 | $103,443 |
| Income Deficit | 431 | $0 |
| Wage / Income Gap (%) | 1,530 | 19.40% |
| Wage / Income Gap ($) | 1,530 | 80.60¢ per $1 |
| Gini / Inequality Index | 1,530 | 0.42 |
Earnings by Sex in Legend Lake
Average Earnings in Legend Lake are $35,337, $29,844 for men and $37,026 for women, a difference of 19.4%.
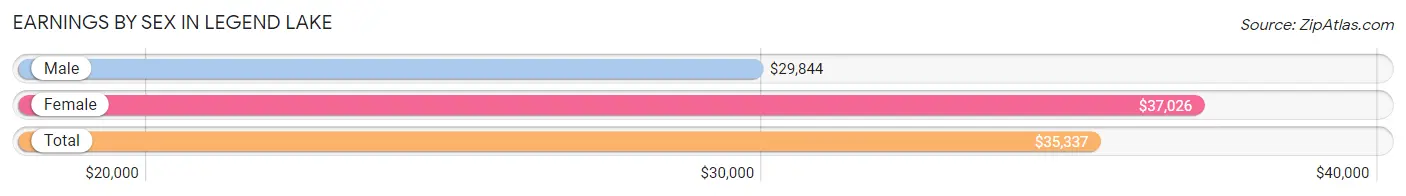
| Sex | Number | Average Earnings |
| Male | 333 (53.9%) | $29,844 |
| Female | 285 (46.1%) | $37,026 |
| Total | 618 (100.0%) | $35,337 |
Earnings by Sex by Income Bracket in Legend Lake
The most common earnings brackets in Legend Lake are $2,499 or less for men (48 | 14.4%) and $30,000 to $34,999 for women (89 | 31.2%).
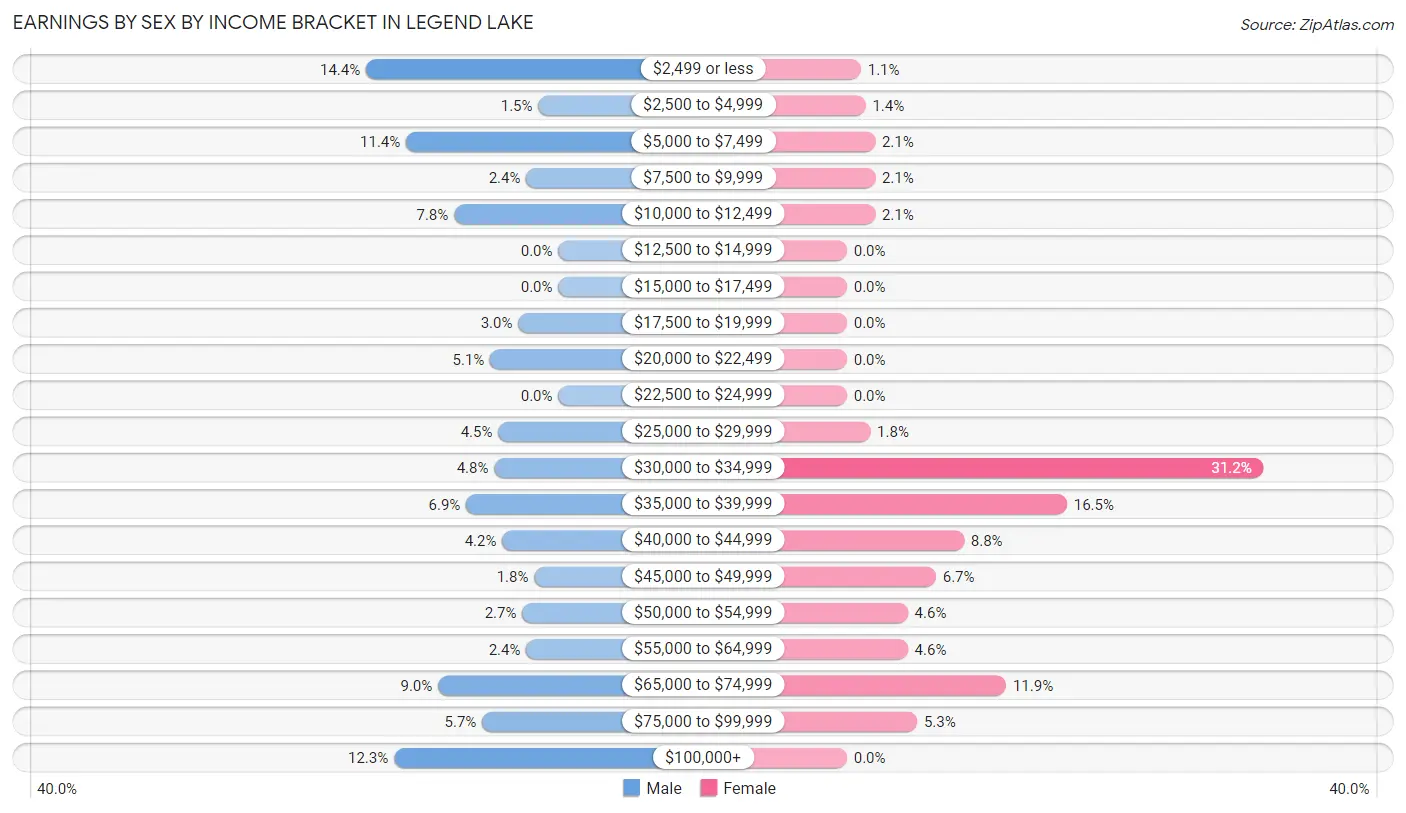
| Income | Male | Female |
| $2,499 or less | 48 (14.4%) | 3 (1.1%) |
| $2,500 to $4,999 | 5 (1.5%) | 4 (1.4%) |
| $5,000 to $7,499 | 38 (11.4%) | 6 (2.1%) |
| $7,500 to $9,999 | 8 (2.4%) | 6 (2.1%) |
| $10,000 to $12,499 | 26 (7.8%) | 6 (2.1%) |
| $12,500 to $14,999 | 0 (0.0%) | 0 (0.0%) |
| $15,000 to $17,499 | 0 (0.0%) | 0 (0.0%) |
| $17,500 to $19,999 | 10 (3.0%) | 0 (0.0%) |
| $20,000 to $22,499 | 17 (5.1%) | 0 (0.0%) |
| $22,500 to $24,999 | 0 (0.0%) | 0 (0.0%) |
| $25,000 to $29,999 | 15 (4.5%) | 5 (1.8%) |
| $30,000 to $34,999 | 16 (4.8%) | 89 (31.2%) |
| $35,000 to $39,999 | 23 (6.9%) | 47 (16.5%) |
| $40,000 to $44,999 | 14 (4.2%) | 25 (8.8%) |
| $45,000 to $49,999 | 6 (1.8%) | 19 (6.7%) |
| $50,000 to $54,999 | 9 (2.7%) | 13 (4.6%) |
| $55,000 to $64,999 | 8 (2.4%) | 13 (4.6%) |
| $65,000 to $74,999 | 30 (9.0%) | 34 (11.9%) |
| $75,000 to $99,999 | 19 (5.7%) | 15 (5.3%) |
| $100,000+ | 41 (12.3%) | 0 (0.0%) |
| Total | 333 (100.0%) | 285 (100.0%) |
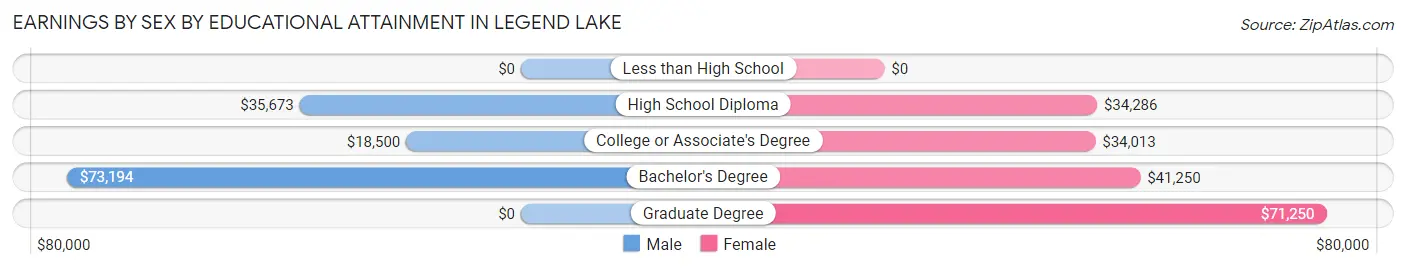
Earnings by Sex by Educational Attainment in Legend Lake
Average earnings in Legend Lake are $35,903 for men and $37,198 for women, a difference of 3.5%. Men with an educational attainment of bachelor's degree enjoy the highest average annual earnings of $73,194, while those with college or associate's degree education earn the least with $18,500. Women with an educational attainment of graduate degree earn the most with the average annual earnings of $71,250, while those with college or associate's degree education have the smallest earnings of $34,013.
| Educational Attainment | Male Income | Female Income |
| Less than High School | - | - |
| High School Diploma | $35,673 | $34,286 |
| College or Associate's Degree | $18,500 | $34,013 |
| Bachelor's Degree | $73,194 | $41,250 |
| Graduate Degree | - | - |
| Total | $35,903 | $37,198 |
Family Income in Legend Lake
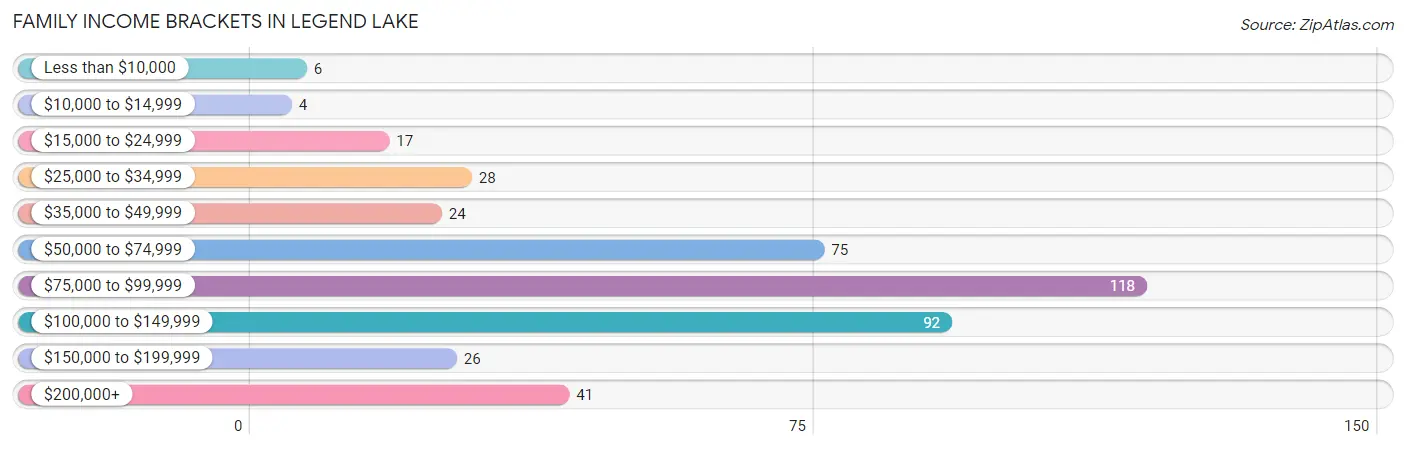
Family Income Brackets in Legend Lake
According to the Legend Lake family income data, there are 118 families falling into the $75,000 to $99,999 income range, which is the most common income bracket and makes up 27.4% of all families. Conversely, the $10,000 to $14,999 income bracket is the least frequent group with only 4 families (0.9%) belonging to this category.
| Income Bracket | # Families | % Families |
| Less than $10,000 | 6 | 1.4% |
| $10,000 to $14,999 | 4 | 0.9% |
| $15,000 to $24,999 | 17 | 3.9% |
| $25,000 to $34,999 | 28 | 6.5% |
| $35,000 to $49,999 | 24 | 5.6% |
| $50,000 to $74,999 | 75 | 17.4% |
| $75,000 to $99,999 | 118 | 27.4% |
| $100,000 to $149,999 | 92 | 21.3% |
| $150,000 to $199,999 | 26 | 6.0% |
| $200,000+ | 41 | 9.5% |
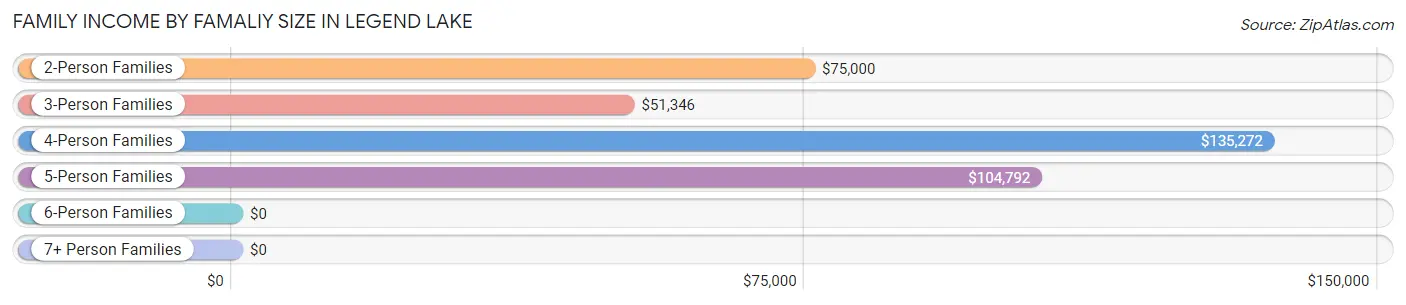
Family Income by Famaliy Size in Legend Lake
4-person families (41 | 9.5%) account for the highest median family income in Legend Lake with $135,272 per family, while 2-person families (236 | 54.8%) have the highest median income of $37,500 per family member.
| Income Bracket | # Families | Median Income |
| 2-Person Families | 236 (54.8%) | $75,000 |
| 3-Person Families | 58 (13.5%) | $51,346 |
| 4-Person Families | 41 (9.5%) | $135,272 |
| 5-Person Families | 19 (4.4%) | $104,792 |
| 6-Person Families | 72 (16.7%) | $0 |
| 7+ Person Families | 5 (1.2%) | $0 |
| Total | 431 (100.0%) | $88,683 |
Family Income by Number of Earners in Legend Lake
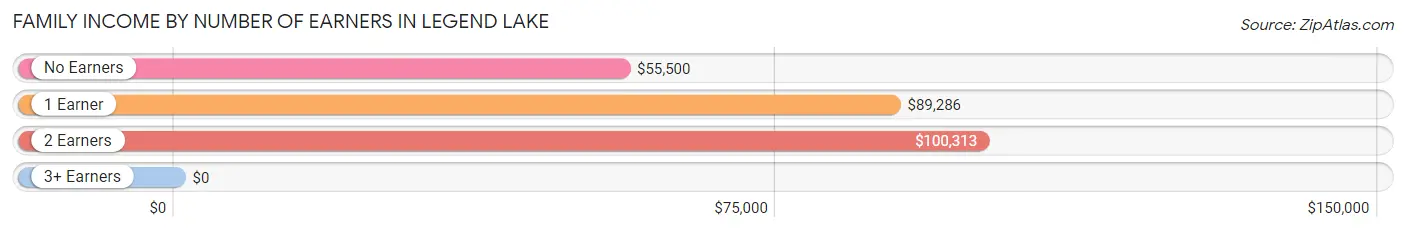
| Number of Earners | # Families | Median Income |
| No Earners | 108 (25.1%) | $55,500 |
| 1 Earner | 172 (39.9%) | $89,286 |
| 2 Earners | 142 (33.0%) | $100,313 |
| 3+ Earners | 9 (2.1%) | $0 |
| Total | 431 (100.0%) | $88,683 |
Household Income in Legend Lake
Household Income Brackets in Legend Lake
With 129 households falling in the category, the $75,000 to $99,999 income range is the most frequent in Legend Lake, accounting for 23.8% of all households. In contrast, only 4 households (0.7%) fall into the $10,000 to $14,999 income bracket, making it the least populous group.
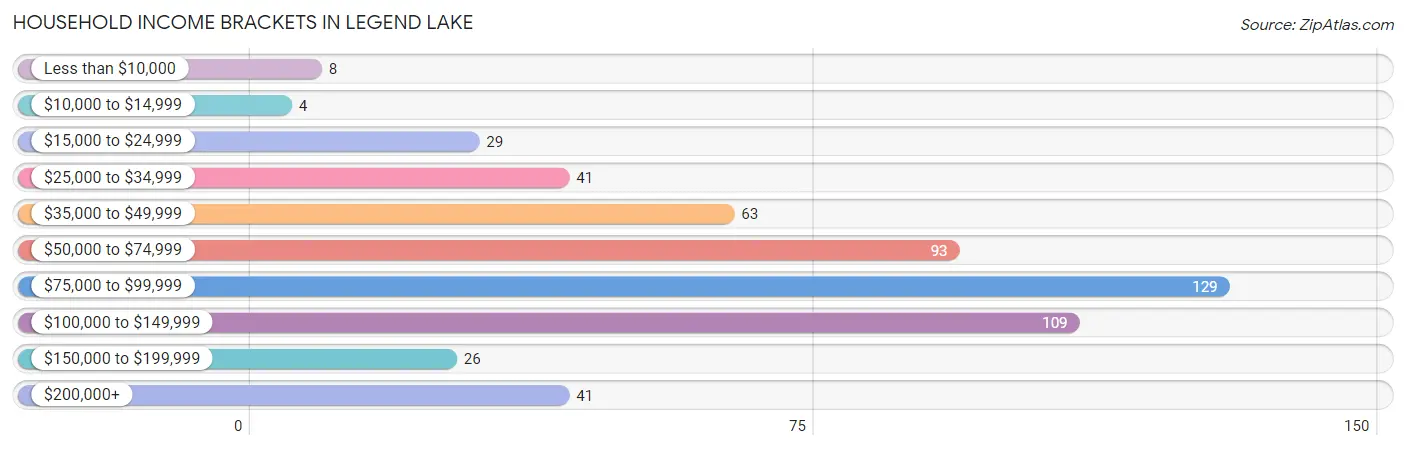
| Income Bracket | # Households | % Households |
| Less than $10,000 | 8 | 1.5% |
| $10,000 to $14,999 | 4 | 0.7% |
| $15,000 to $24,999 | 29 | 5.3% |
| $25,000 to $34,999 | 41 | 7.6% |
| $35,000 to $49,999 | 63 | 11.6% |
| $50,000 to $74,999 | 93 | 17.1% |
| $75,000 to $99,999 | 129 | 23.8% |
| $100,000 to $149,999 | 109 | 20.1% |
| $150,000 to $199,999 | 26 | 4.8% |
| $200,000+ | 41 | 7.6% |
Household Income by Householder Age in Legend Lake
The median household income in Legend Lake is $86,563, with the highest median household income of $135,924 found in the 25 to 44 years age bracket for the primary householder. A total of 83 households (15.3%) fall into this category. Meanwhile, the 15 to 24 years age bracket for the primary householder has the lowest median household income of $0, with 5 households (0.9%) in this group.
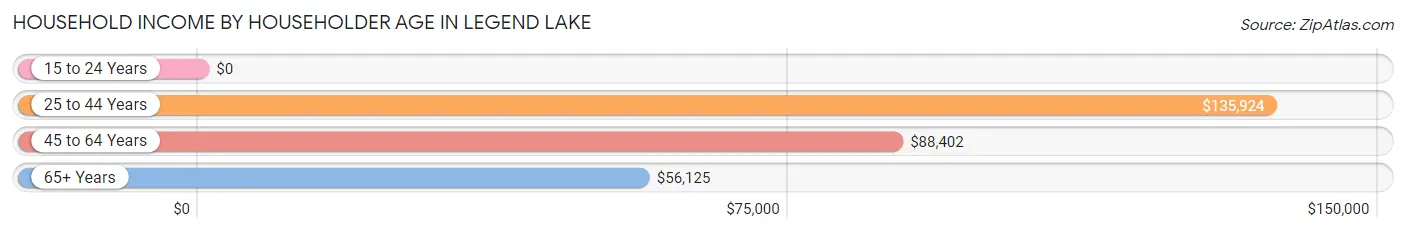
| Income Bracket | # Households | Median Income |
| 15 to 24 Years | 5 (0.9%) | $0 |
| 25 to 44 Years | 83 (15.3%) | $135,924 |
| 45 to 64 Years | 254 (46.8%) | $88,402 |
| 65+ Years | 201 (37.0%) | $56,125 |
| Total | 543 (100.0%) | $86,563 |
Poverty in Legend Lake
Income Below Poverty by Sex and Age in Legend Lake
With 6.5% poverty level for males and 5.2% for females among the residents of Legend Lake, 45 to 54 year old males and 15 year old females are the most vulnerable to poverty, with 16 males (21.6%) and 14 females (56.0%) in their respective age groups living below the poverty level.
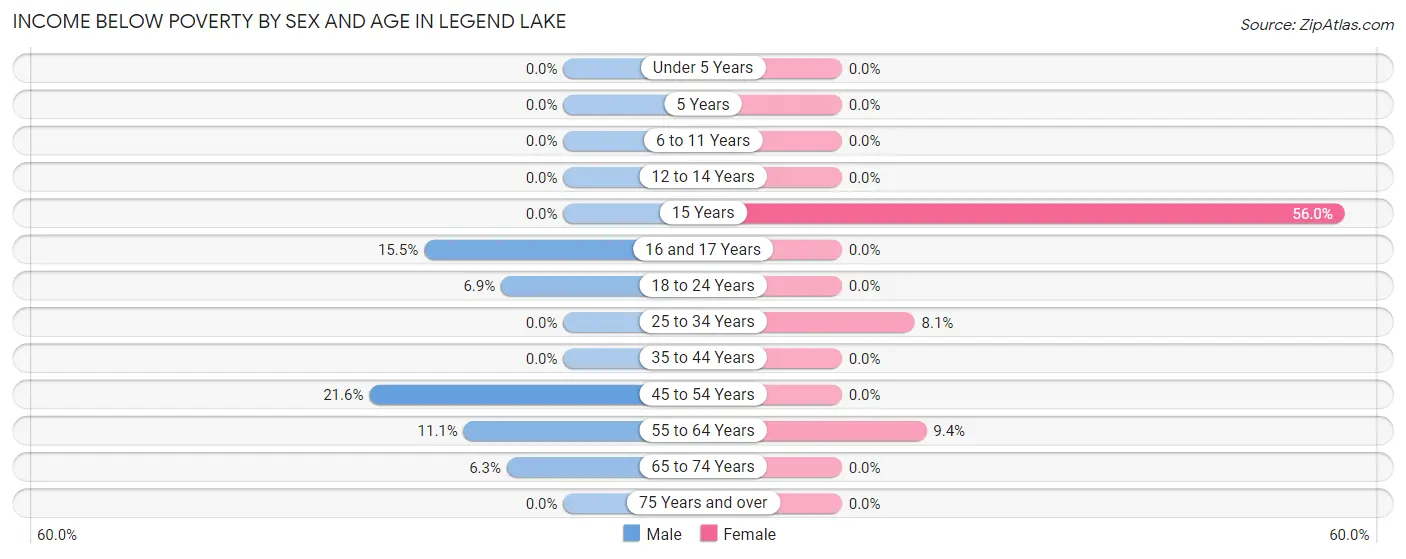
| Age Bracket | Male | Female |
| Under 5 Years | 0 (0.0%) | 0 (0.0%) |
| 5 Years | 0 (0.0%) | 0 (0.0%) |
| 6 to 11 Years | 0 (0.0%) | 0 (0.0%) |
| 12 to 14 Years | 0 (0.0%) | 0 (0.0%) |
| 15 Years | 0 (0.0%) | 14 (56.0%) |
| 16 and 17 Years | 9 (15.5%) | 0 (0.0%) |
| 18 to 24 Years | 5 (6.9%) | 0 (0.0%) |
| 25 to 34 Years | 0 (0.0%) | 6 (8.1%) |
| 35 to 44 Years | 0 (0.0%) | 0 (0.0%) |
| 45 to 54 Years | 16 (21.6%) | 0 (0.0%) |
| 55 to 64 Years | 14 (11.1%) | 18 (9.4%) |
| 65 to 74 Years | 8 (6.3%) | 0 (0.0%) |
| 75 Years and over | 0 (0.0%) | 0 (0.0%) |
| Total | 52 (6.5%) | 38 (5.2%) |
Income Above Poverty by Sex and Age in Legend Lake
According to the poverty statistics in Legend Lake, males aged under 5 years and females aged under 5 years are the age groups that are most secure financially, with 100.0% of males and 100.0% of females in these age groups living above the poverty line.
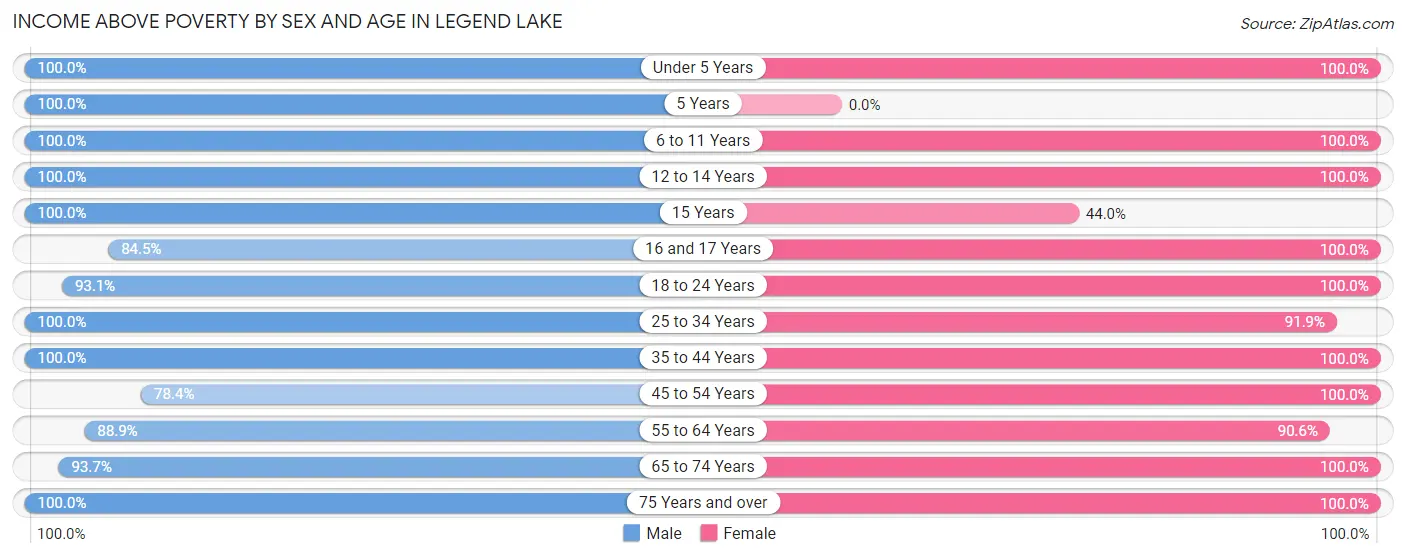
| Age Bracket | Male | Female |
| Under 5 Years | 51 (100.0%) | 30 (100.0%) |
| 5 Years | 8 (100.0%) | 0 (0.0%) |
| 6 to 11 Years | 48 (100.0%) | 44 (100.0%) |
| 12 to 14 Years | 66 (100.0%) | 57 (100.0%) |
| 15 Years | 3 (100.0%) | 11 (44.0%) |
| 16 and 17 Years | 49 (84.5%) | 17 (100.0%) |
| 18 to 24 Years | 67 (93.1%) | 4 (100.0%) |
| 25 to 34 Years | 64 (100.0%) | 68 (91.9%) |
| 35 to 44 Years | 36 (100.0%) | 66 (100.0%) |
| 45 to 54 Years | 58 (78.4%) | 51 (100.0%) |
| 55 to 64 Years | 112 (88.9%) | 173 (90.6%) |
| 65 to 74 Years | 119 (93.7%) | 136 (100.0%) |
| 75 Years and over | 71 (100.0%) | 31 (100.0%) |
| Total | 752 (93.5%) | 688 (94.8%) |
Income Below Poverty Among Married-Couple Families in Legend Lake
The poverty statistics for married-couple families in Legend Lake show that 2.4% or 6 of the total 246 families live below the poverty line. Families with no children have the highest poverty rate of 3.0%, comprising of 6 families. On the other hand, families with 1 or 2 children have the lowest poverty rate of 0.0%, which includes 0 families.
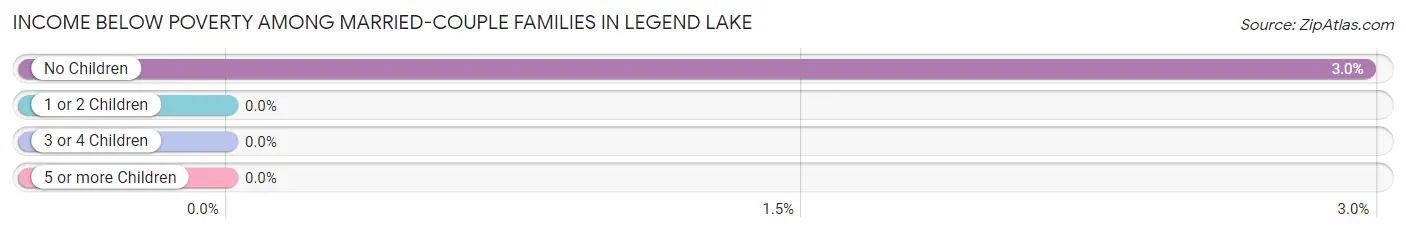
| Children | Above Poverty | Below Poverty |
| No Children | 196 (97.0%) | 6 (3.0%) |
| 1 or 2 Children | 8 (100.0%) | 0 (0.0%) |
| 3 or 4 Children | 36 (100.0%) | 0 (0.0%) |
| 5 or more Children | 0 (0.0%) | 0 (0.0%) |
| Total | 240 (97.6%) | 6 (2.4%) |
Income Below Poverty Among Single-Parent Households in Legend Lake
According to the poverty data in Legend Lake, 10.0% or 4 single-father households and 8.3% or 12 single-mother households are living below the poverty line. Among single-father households, those with no children have the highest poverty rate, with 4 households (11.4%) experiencing poverty. Likewise, among single-mother households, those with 1 or 2 children have the highest poverty rate, with 12 households (30.0%) falling below the poverty line.
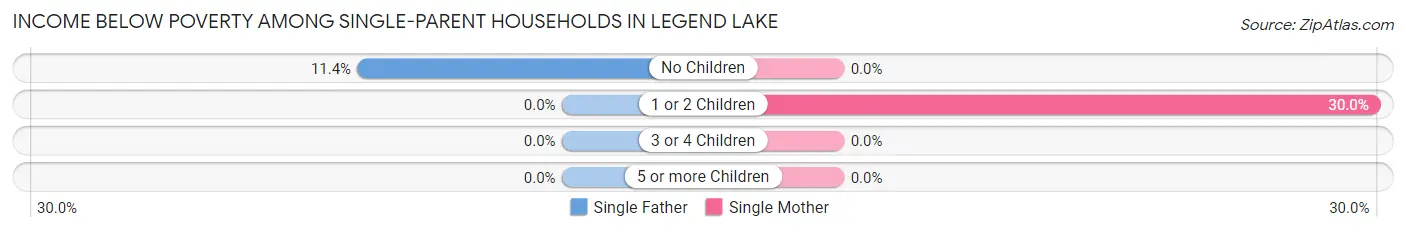
| Children | Single Father | Single Mother |
| No Children | 4 (11.4%) | 0 (0.0%) |
| 1 or 2 Children | 0 (0.0%) | 12 (30.0%) |
| 3 or 4 Children | 0 (0.0%) | 0 (0.0%) |
| 5 or more Children | 0 (0.0%) | 0 (0.0%) |
| Total | 4 (10.0%) | 12 (8.3%) |
Income Below Poverty Among Married-Couple vs Single-Parent Households in Legend Lake
The poverty data for Legend Lake shows that 6 of the married-couple family households (2.4%) and 16 of the single-parent households (8.6%) are living below the poverty level. Within the married-couple family households, those with no children have the highest poverty rate, with 6 households (3.0%) falling below the poverty line. Among the single-parent households, those with 1 or 2 children have the highest poverty rate, with 12 household (26.7%) living below poverty.
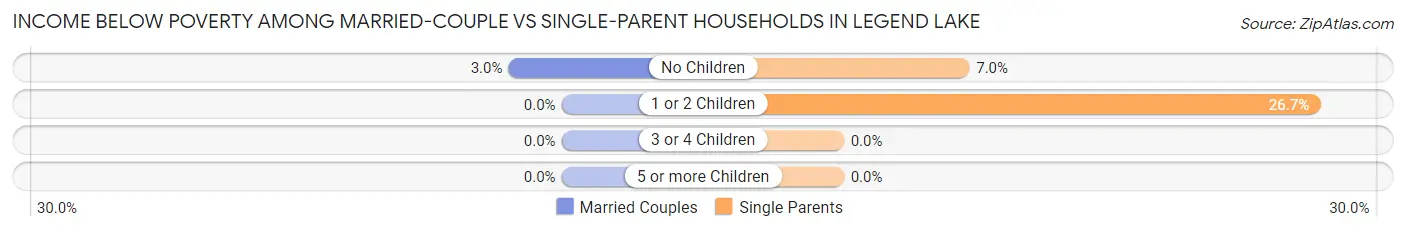
| Children | Married-Couple Families | Single-Parent Households |
| No Children | 6 (3.0%) | 4 (7.0%) |
| 1 or 2 Children | 0 (0.0%) | 12 (26.7%) |
| 3 or 4 Children | 0 (0.0%) | 0 (0.0%) |
| 5 or more Children | 0 (0.0%) | 0 (0.0%) |
| Total | 6 (2.4%) | 16 (8.6%) |
Employment Characteristics in Legend Lake
Employment by Class of Employer in Legend Lake
Among the 472 employed individuals in Legend Lake, local government employees (174 | 36.9%), private company employees (138 | 29.2%), and not-for-profit organizations (56 | 11.9%) make up the most common classes of employment.
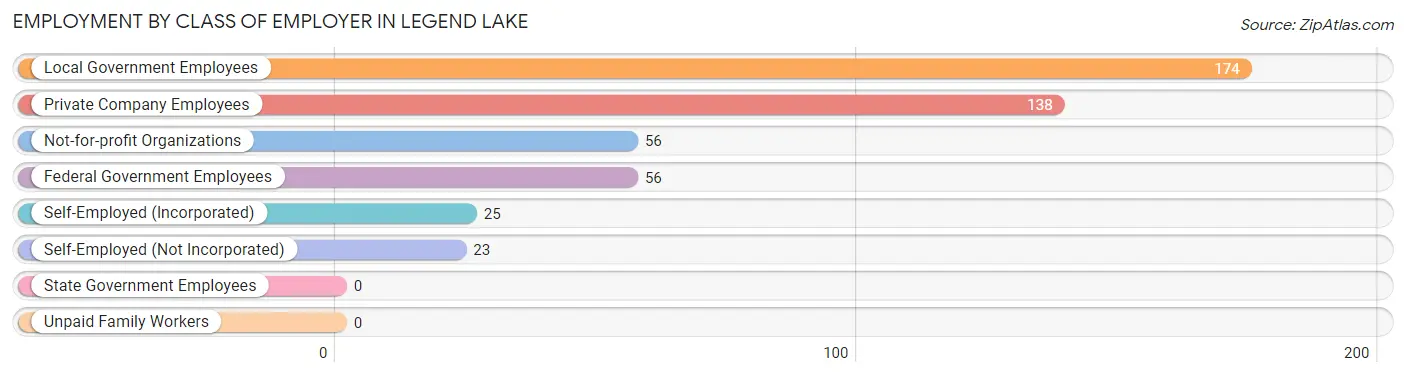
| Employer Class | # Employees | % Employees |
| Private Company Employees | 138 | 29.2% |
| Self-Employed (Incorporated) | 25 | 5.3% |
| Self-Employed (Not Incorporated) | 23 | 4.9% |
| Not-for-profit Organizations | 56 | 11.9% |
| Local Government Employees | 174 | 36.9% |
| State Government Employees | 0 | 0.0% |
| Federal Government Employees | 56 | 11.9% |
| Unpaid Family Workers | 0 | 0.0% |
| Total | 472 | 100.0% |
Employment Status by Age in Legend Lake
According to the labor force statistics for Legend Lake, out of the total population over 16 years of age (1,198), 44.1% or 528 individuals are in the labor force, with 10.6% or 56 of them unemployed. The age group with the highest labor force participation rate is 55 to 59 years, with 86.2% or 137 individuals in the labor force. Within the labor force, the 55 to 59 years age range has the highest percentage of unemployed individuals, with 40.9% or 56 of them being unemployed.
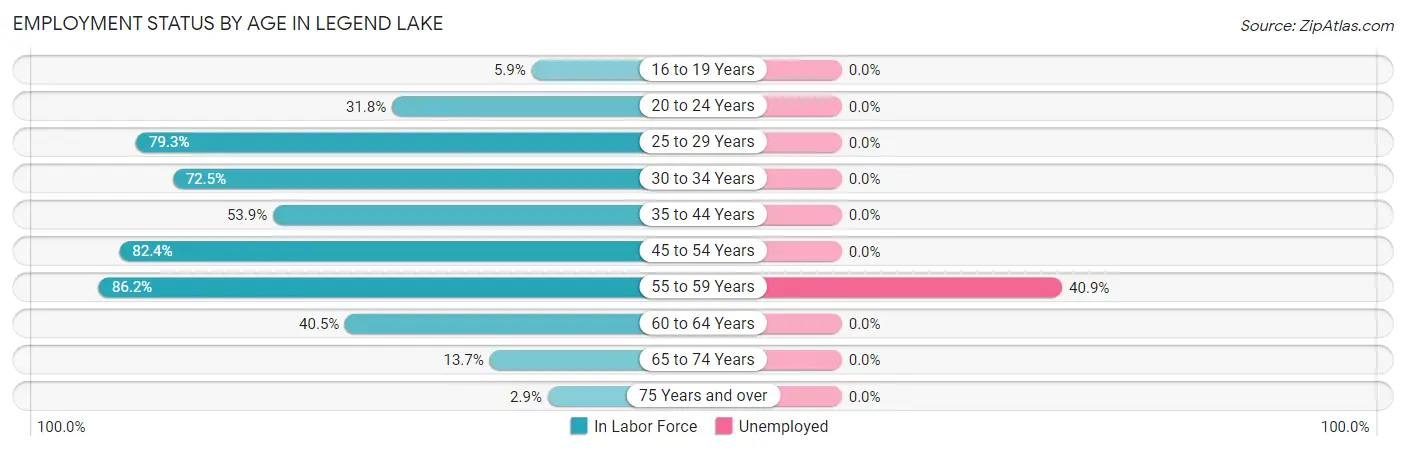
| Age Bracket | In Labor Force | Unemployed |
| 16 to 19 Years | 5 (5.9%) | 0 (0.0%) |
| 20 to 24 Years | 21 (31.8%) | 0 (0.0%) |
| 25 to 29 Years | 46 (79.3%) | 0 (0.0%) |
| 30 to 34 Years | 58 (72.5%) | 0 (0.0%) |
| 35 to 44 Years | 55 (53.9%) | 0 (0.0%) |
| 45 to 54 Years | 103 (82.4%) | 0 (0.0%) |
| 55 to 59 Years | 137 (86.2%) | 56 (40.9%) |
| 60 to 64 Years | 64 (40.5%) | 0 (0.0%) |
| 65 to 74 Years | 36 (13.7%) | 0 (0.0%) |
| 75 Years and over | 3 (2.9%) | 0 (0.0%) |
| Total | 528 (44.1%) | 56 (10.6%) |
Employment Status by Educational Attainment in Legend Lake
According to labor force statistics for Legend Lake, 67.9% of individuals (463) out of the total population between 25 and 64 years of age (682) are in the labor force, with 12.1% or 56 of them being unemployed. The group with the highest labor force participation rate are those with the educational attainment of college / associate degree, with 77.4% or 212 individuals in the labor force. Within the labor force, individuals with college / associate degree education have the highest percentage of unemployment, with 26.4% or 56 of them being unemployed.
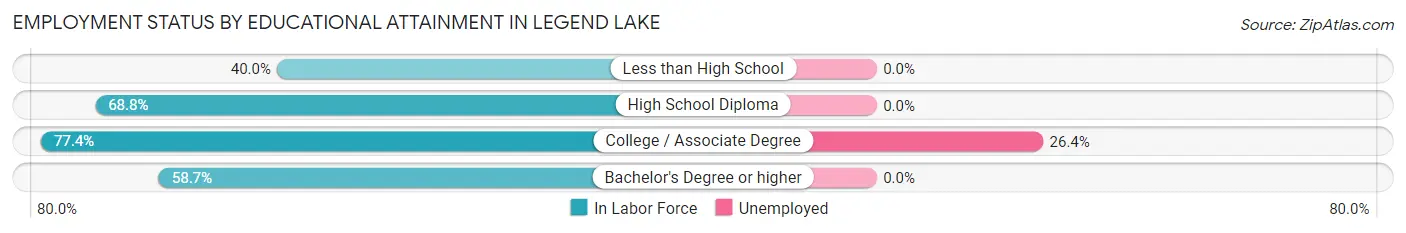
| Educational Attainment | In Labor Force | Unemployed |
| Less than High School | 6 (40.0%) | 0 (0.0%) |
| High School Diploma | 97 (68.8%) | 0 (0.0%) |
| College / Associate Degree | 212 (77.4%) | 72 (26.4%) |
| Bachelor's Degree or higher | 148 (58.7%) | 0 (0.0%) |
| Total | 463 (67.9%) | 83 (12.1%) |
Employment Occupations by Sex in Legend Lake
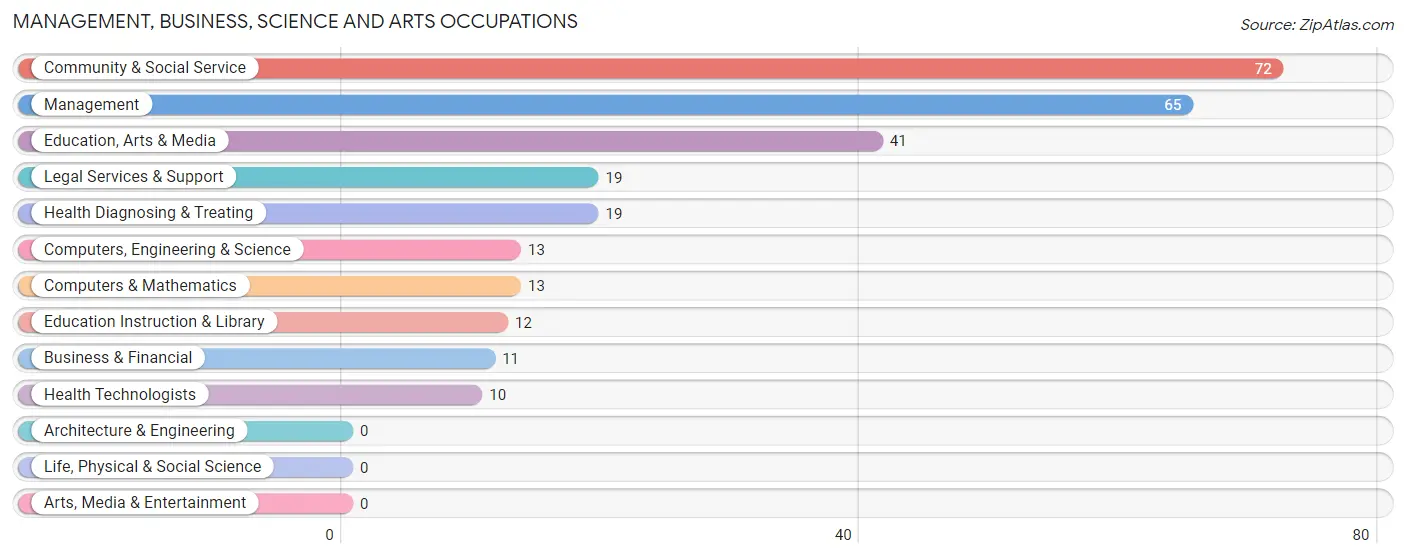
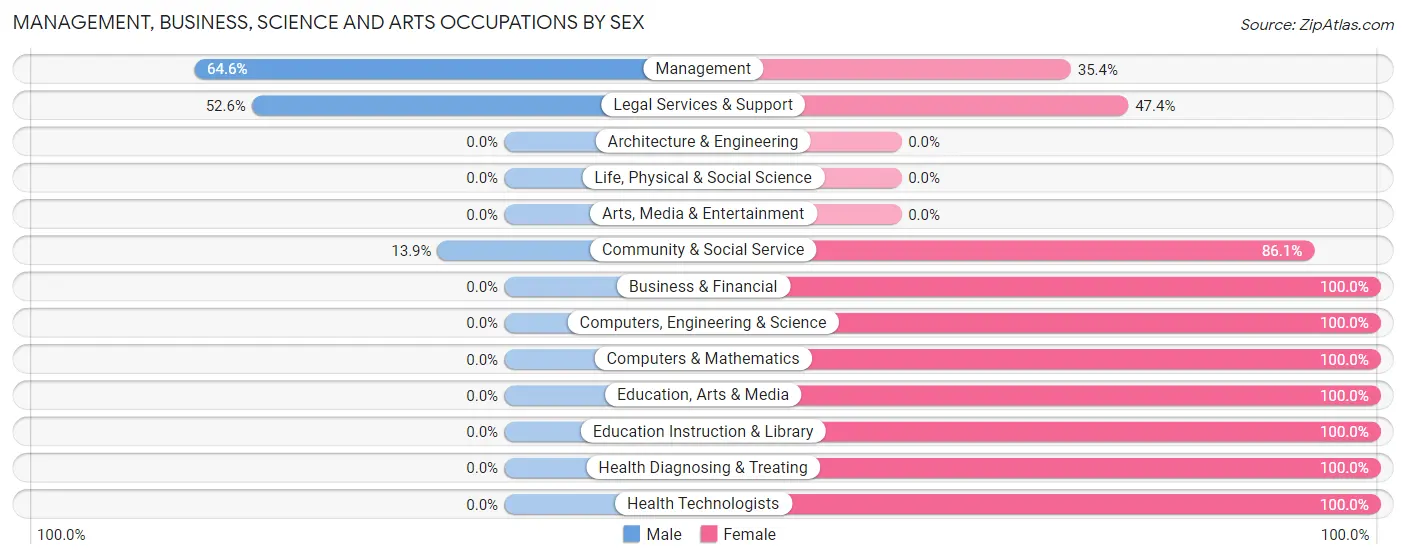
Management, Business, Science and Arts Occupations
The most common Management, Business, Science and Arts occupations in Legend Lake are Community & Social Service (72 | 15.2%), Management (65 | 13.8%), Education, Arts & Media (41 | 8.7%), Legal Services & Support (19 | 4.0%), and Health Diagnosing & Treating (19 | 4.0%).
Management, Business, Science and Arts Occupations by Sex
Within the Management, Business, Science and Arts occupations in Legend Lake, the most male-oriented occupations are Management (64.6%), Legal Services & Support (52.6%), and Community & Social Service (13.9%), while the most female-oriented occupations are Business & Financial (100.0%), Computers, Engineering & Science (100.0%), and Computers & Mathematics (100.0%).
| Occupation | Male | Female |
| Management | 42 (64.6%) | 23 (35.4%) |
| Business & Financial | 0 (0.0%) | 11 (100.0%) |
| Computers, Engineering & Science | 0 (0.0%) | 13 (100.0%) |
| Computers & Mathematics | 0 (0.0%) | 13 (100.0%) |
| Architecture & Engineering | 0 (0.0%) | 0 (0.0%) |
| Life, Physical & Social Science | 0 (0.0%) | 0 (0.0%) |
| Community & Social Service | 10 (13.9%) | 62 (86.1%) |
| Education, Arts & Media | 0 (0.0%) | 41 (100.0%) |
| Legal Services & Support | 10 (52.6%) | 9 (47.4%) |
| Education Instruction & Library | 0 (0.0%) | 12 (100.0%) |
| Arts, Media & Entertainment | 0 (0.0%) | 0 (0.0%) |
| Health Diagnosing & Treating | 0 (0.0%) | 19 (100.0%) |
| Health Technologists | 0 (0.0%) | 10 (100.0%) |
| Total (Category) | 52 (28.9%) | 128 (71.1%) |
| Total (Overall) | 247 (52.3%) | 225 (47.7%) |
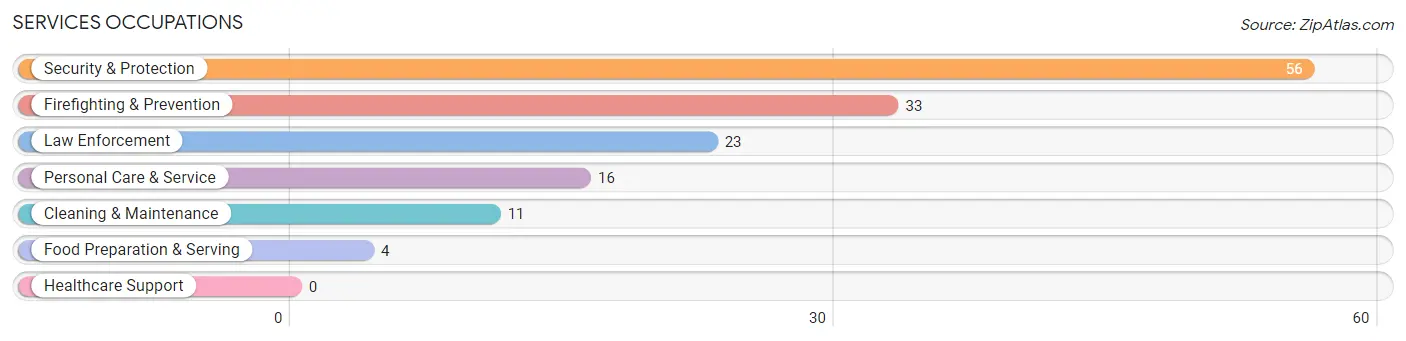
Services Occupations
The most common Services occupations in Legend Lake are Security & Protection (56 | 11.9%), Firefighting & Prevention (33 | 7.0%), Law Enforcement (23 | 4.9%), Personal Care & Service (16 | 3.4%), and Cleaning & Maintenance (11 | 2.3%).
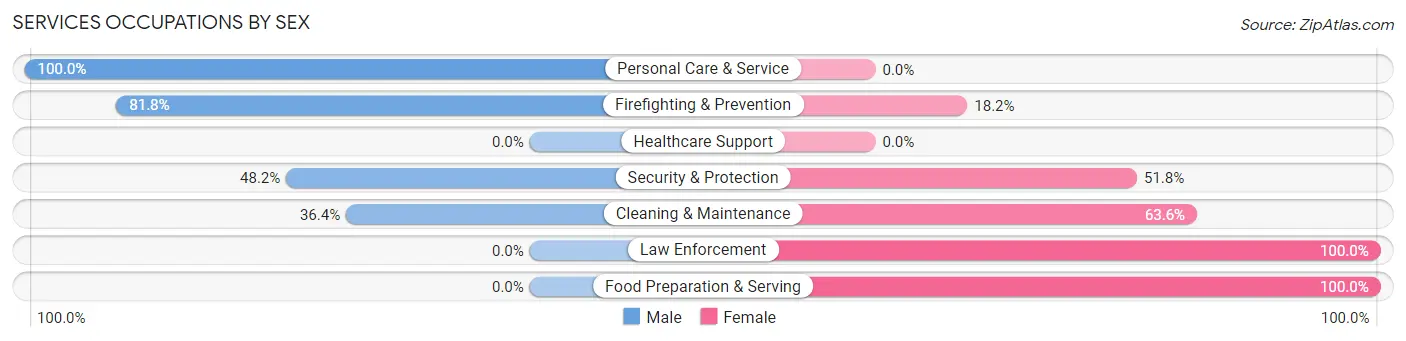
Services Occupations by Sex
Within the Services occupations in Legend Lake, the most male-oriented occupations are Personal Care & Service (100.0%), Firefighting & Prevention (81.8%), and Security & Protection (48.2%), while the most female-oriented occupations are Law Enforcement (100.0%), Food Preparation & Serving (100.0%), and Cleaning & Maintenance (63.6%).
| Occupation | Male | Female |
| Healthcare Support | 0 (0.0%) | 0 (0.0%) |
| Security & Protection | 27 (48.2%) | 29 (51.8%) |
| Firefighting & Prevention | 27 (81.8%) | 6 (18.2%) |
| Law Enforcement | 0 (0.0%) | 23 (100.0%) |
| Food Preparation & Serving | 0 (0.0%) | 4 (100.0%) |
| Cleaning & Maintenance | 4 (36.4%) | 7 (63.6%) |
| Personal Care & Service | 16 (100.0%) | 0 (0.0%) |
| Total (Category) | 47 (54.0%) | 40 (46.0%) |
| Total (Overall) | 247 (52.3%) | 225 (47.7%) |
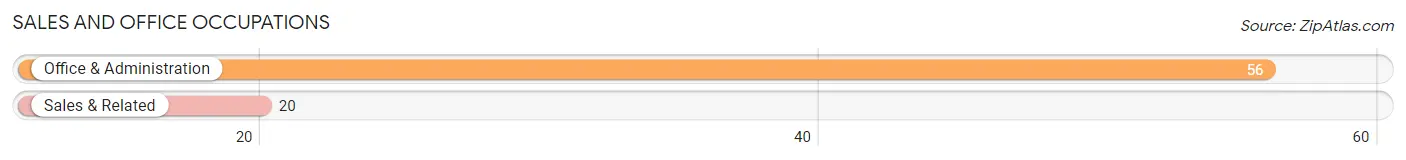
Sales and Office Occupations
The most common Sales and Office occupations in Legend Lake are Office & Administration (56 | 11.9%), and Sales & Related (20 | 4.2%).
Sales and Office Occupations by Sex
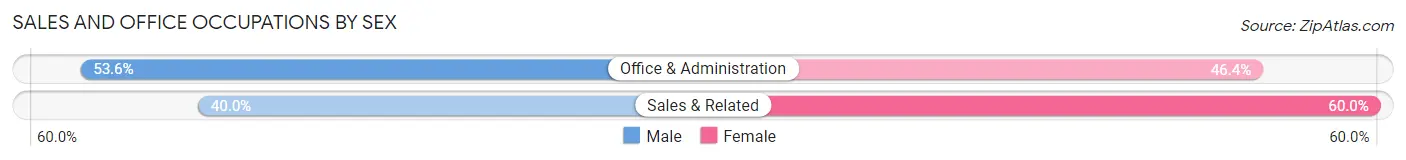
| Occupation | Male | Female |
| Sales & Related | 8 (40.0%) | 12 (60.0%) |
| Office & Administration | 30 (53.6%) | 26 (46.4%) |
| Total (Category) | 38 (50.0%) | 38 (50.0%) |
| Total (Overall) | 247 (52.3%) | 225 (47.7%) |
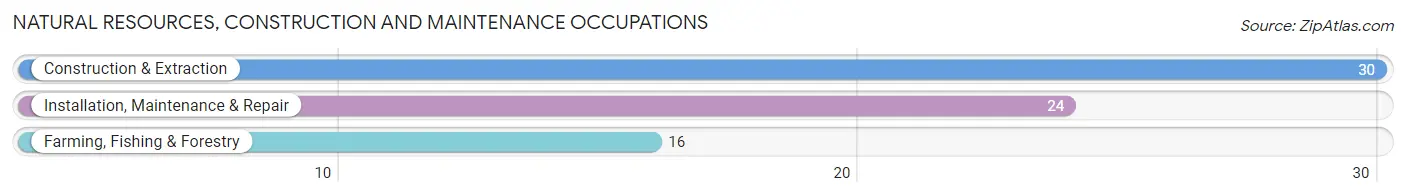
Natural Resources, Construction and Maintenance Occupations
The most common Natural Resources, Construction and Maintenance occupations in Legend Lake are Construction & Extraction (30 | 6.4%), Installation, Maintenance & Repair (24 | 5.1%), and Farming, Fishing & Forestry (16 | 3.4%).
Natural Resources, Construction and Maintenance Occupations by Sex
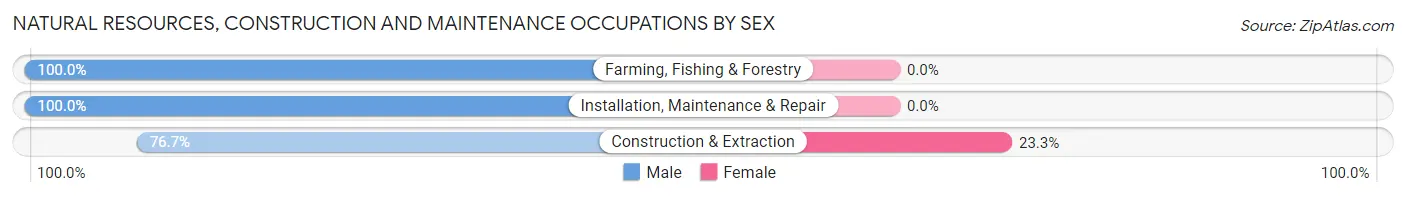
| Occupation | Male | Female |
| Farming, Fishing & Forestry | 16 (100.0%) | 0 (0.0%) |
| Construction & Extraction | 23 (76.7%) | 7 (23.3%) |
| Installation, Maintenance & Repair | 24 (100.0%) | 0 (0.0%) |
| Total (Category) | 63 (90.0%) | 7 (10.0%) |
| Total (Overall) | 247 (52.3%) | 225 (47.7%) |
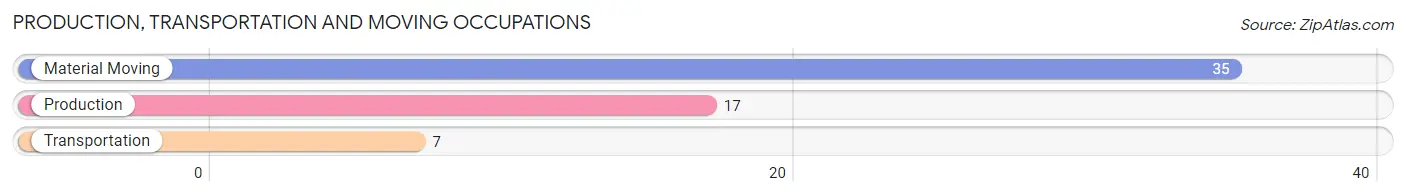
Production, Transportation and Moving Occupations
The most common Production, Transportation and Moving occupations in Legend Lake are Material Moving (35 | 7.4%), Production (17 | 3.6%), and Transportation (7 | 1.5%).
Production, Transportation and Moving Occupations by Sex
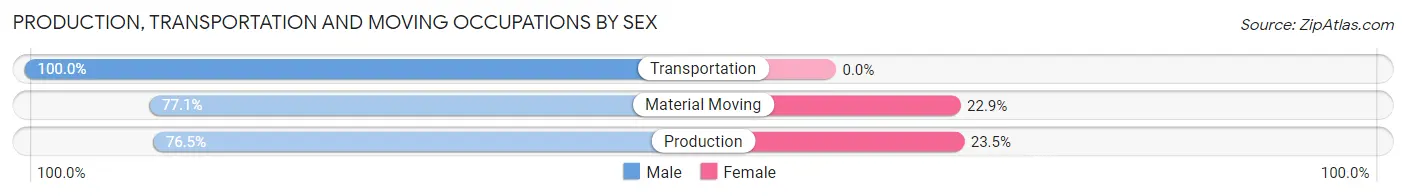
| Occupation | Male | Female |
| Production | 13 (76.5%) | 4 (23.5%) |
| Transportation | 7 (100.0%) | 0 (0.0%) |
| Material Moving | 27 (77.1%) | 8 (22.9%) |
| Total (Category) | 47 (79.7%) | 12 (20.3%) |
| Total (Overall) | 247 (52.3%) | 225 (47.7%) |
Employment Industries by Sex in Legend Lake
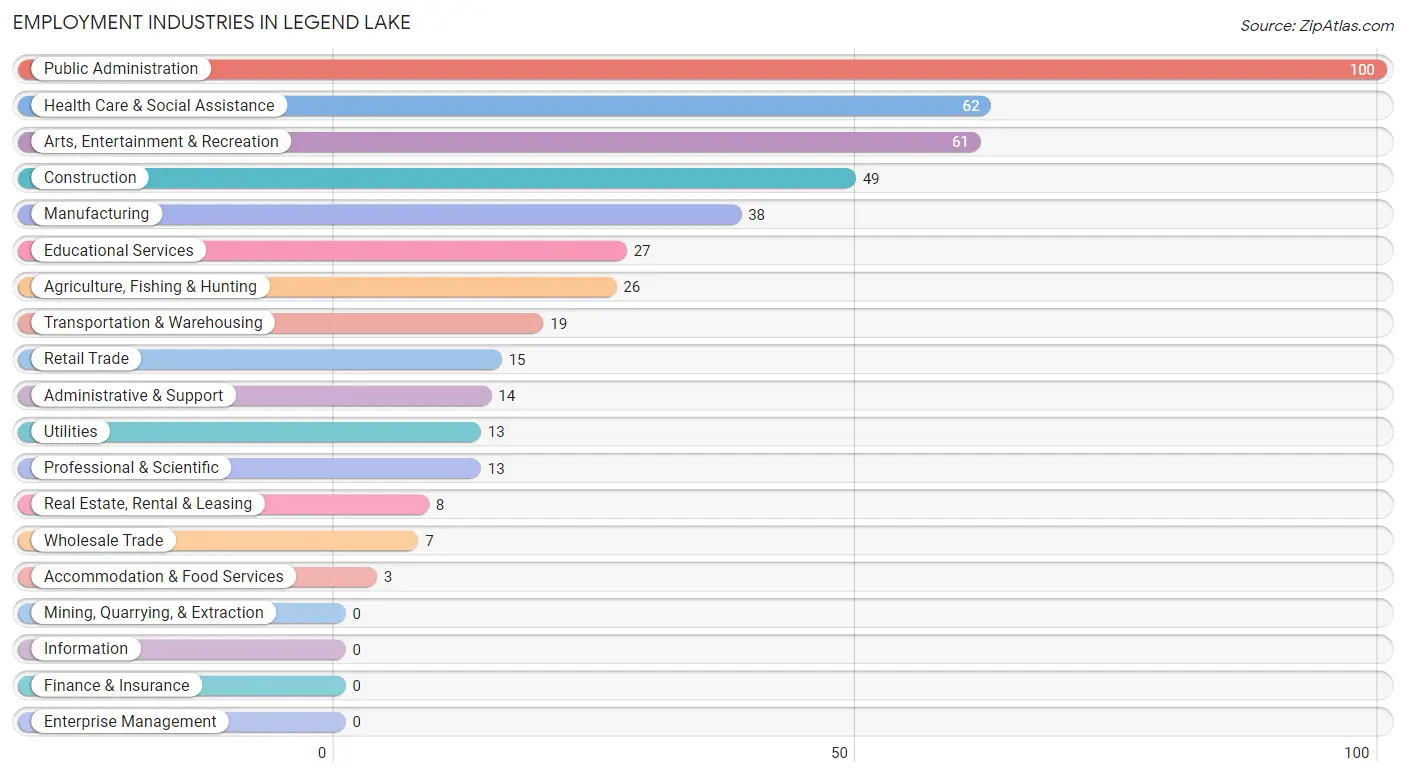
Employment Industries in Legend Lake
The major employment industries in Legend Lake include Public Administration (100 | 21.2%), Health Care & Social Assistance (62 | 13.1%), Arts, Entertainment & Recreation (61 | 12.9%), Construction (49 | 10.4%), and Manufacturing (38 | 8.1%).
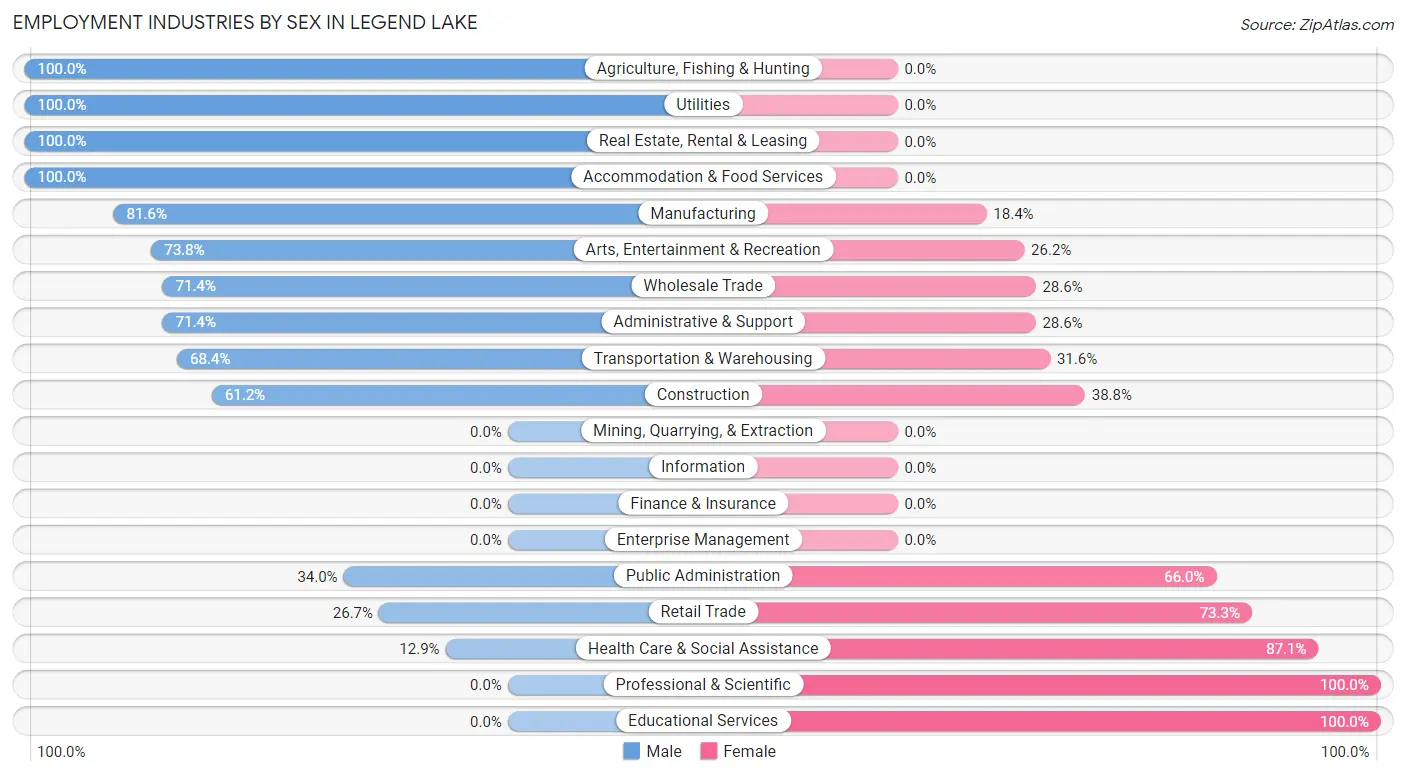
Employment Industries by Sex in Legend Lake
The Legend Lake industries that see more men than women are Agriculture, Fishing & Hunting (100.0%), Utilities (100.0%), and Real Estate, Rental & Leasing (100.0%), whereas the industries that tend to have a higher number of women are Professional & Scientific (100.0%), Educational Services (100.0%), and Health Care & Social Assistance (87.1%).
| Industry | Male | Female |
| Agriculture, Fishing & Hunting | 26 (100.0%) | 0 (0.0%) |
| Mining, Quarrying, & Extraction | 0 (0.0%) | 0 (0.0%) |
| Construction | 30 (61.2%) | 19 (38.8%) |
| Manufacturing | 31 (81.6%) | 7 (18.4%) |
| Wholesale Trade | 5 (71.4%) | 2 (28.6%) |
| Retail Trade | 4 (26.7%) | 11 (73.3%) |
| Transportation & Warehousing | 13 (68.4%) | 6 (31.6%) |
| Utilities | 13 (100.0%) | 0 (0.0%) |
| Information | 0 (0.0%) | 0 (0.0%) |
| Finance & Insurance | 0 (0.0%) | 0 (0.0%) |
| Real Estate, Rental & Leasing | 8 (100.0%) | 0 (0.0%) |
| Professional & Scientific | 0 (0.0%) | 13 (100.0%) |
| Enterprise Management | 0 (0.0%) | 0 (0.0%) |
| Administrative & Support | 10 (71.4%) | 4 (28.6%) |
| Educational Services | 0 (0.0%) | 27 (100.0%) |
| Health Care & Social Assistance | 8 (12.9%) | 54 (87.1%) |
| Arts, Entertainment & Recreation | 45 (73.8%) | 16 (26.2%) |
| Accommodation & Food Services | 3 (100.0%) | 0 (0.0%) |
| Public Administration | 34 (34.0%) | 66 (66.0%) |
| Total | 247 (52.3%) | 225 (47.7%) |
Education in Legend Lake
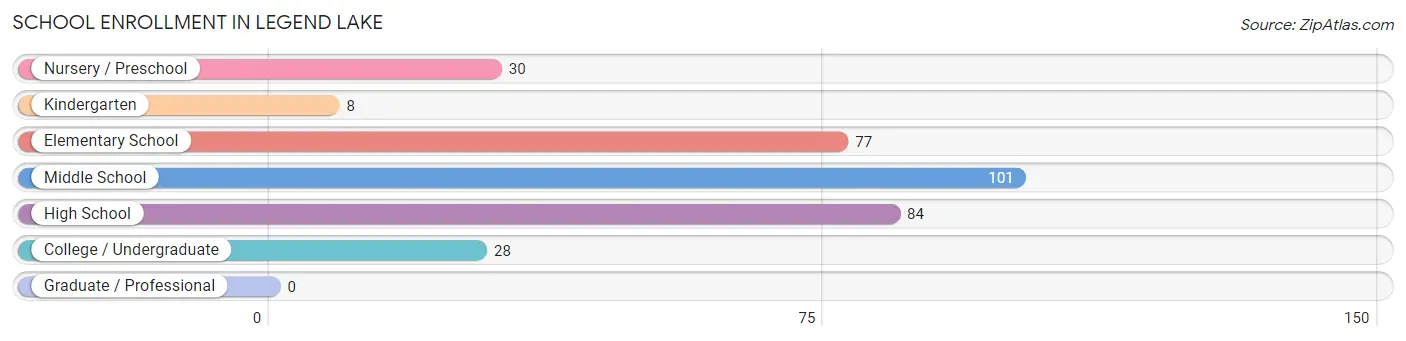
School Enrollment in Legend Lake
The most common levels of schooling among the 328 students in Legend Lake are middle school (101 | 30.8%), high school (84 | 25.6%), and elementary school (77 | 23.5%).
| School Level | # Students | % Students |
| Nursery / Preschool | 30 | 9.1% |
| Kindergarten | 8 | 2.4% |
| Elementary School | 77 | 23.5% |
| Middle School | 101 | 30.8% |
| High School | 84 | 25.6% |
| College / Undergraduate | 28 | 8.5% |
| Graduate / Professional | 0 | 0.0% |
| Total | 328 | 100.0% |
School Enrollment by Age by Funding Source in Legend Lake
Out of a total of 328 students who are enrolled in schools in Legend Lake, 27 (8.2%) attend a private institution, while the remaining 301 (91.8%) are enrolled in public schools. The age group of 5 to 9 year old has the highest likelihood of being enrolled in private schools, with 22 (42.3% in the age bracket) enrolled. Conversely, the age group of 3 to 4 year olds has the lowest likelihood of being enrolled in a private school, with 30 (100.0% in the age bracket) attending a public institution.
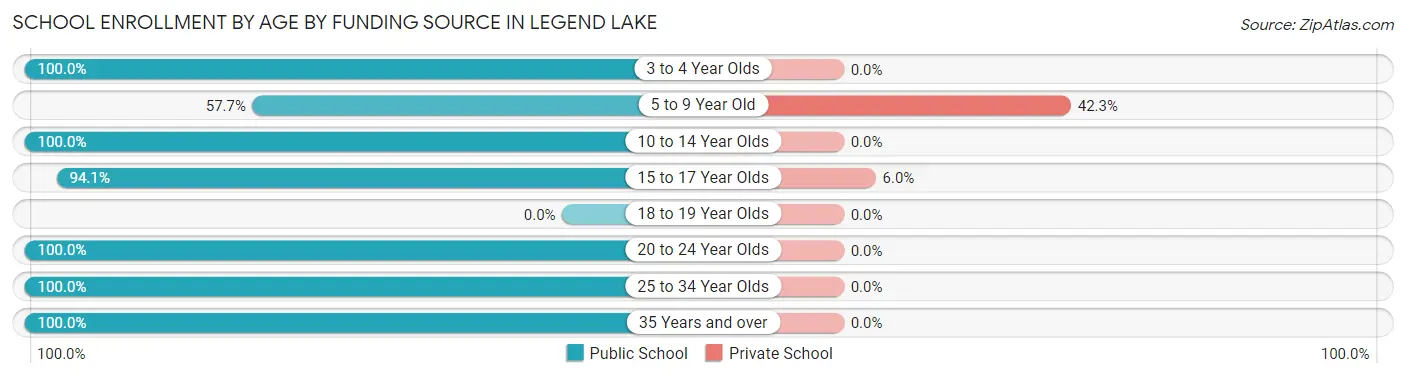
| Age Bracket | Public School | Private School |
| 3 to 4 Year Olds | 30 (100.0%) | 0 (0.0%) |
| 5 to 9 Year Old | 30 (57.7%) | 22 (42.3%) |
| 10 to 14 Year Olds | 134 (100.0%) | 0 (0.0%) |
| 15 to 17 Year Olds | 79 (94.1%) | 5 (5.9%) |
| 18 to 19 Year Olds | 0 (0.0%) | 0 (0.0%) |
| 20 to 24 Year Olds | 11 (100.0%) | 0 (0.0%) |
| 25 to 34 Year Olds | 2 (100.0%) | 0 (0.0%) |
| 35 Years and over | 15 (100.0%) | 0 (0.0%) |
| Total | 301 (91.8%) | 27 (8.2%) |
Educational Attainment by Field of Study in Legend Lake
Education (100 | 28.8%), arts & humanities (60 | 17.3%), social sciences (48 | 13.8%), business (46 | 13.3%), and science & technology (28 | 8.1%) are the most common fields of study among 347 individuals in Legend Lake who have obtained a bachelor's degree or higher.
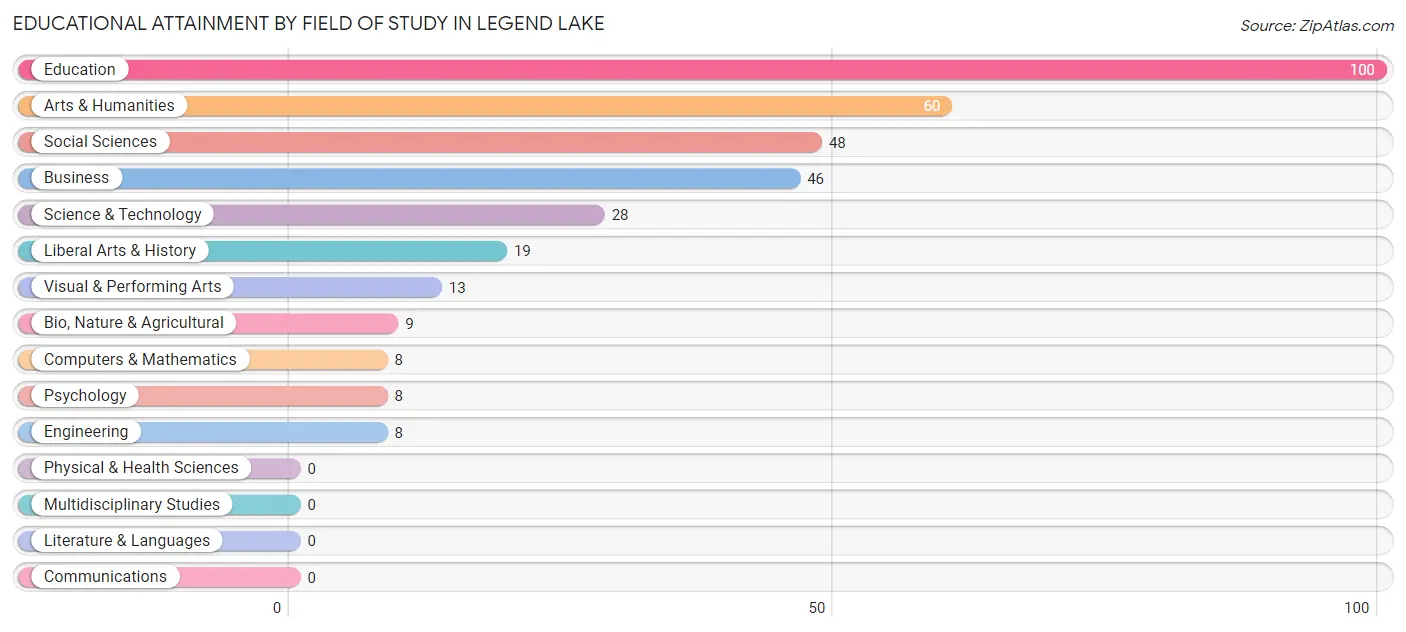
| Field of Study | # Graduates | % Graduates |
| Computers & Mathematics | 8 | 2.3% |
| Bio, Nature & Agricultural | 9 | 2.6% |
| Physical & Health Sciences | 0 | 0.0% |
| Psychology | 8 | 2.3% |
| Social Sciences | 48 | 13.8% |
| Engineering | 8 | 2.3% |
| Multidisciplinary Studies | 0 | 0.0% |
| Science & Technology | 28 | 8.1% |
| Business | 46 | 13.3% |
| Education | 100 | 28.8% |
| Literature & Languages | 0 | 0.0% |
| Liberal Arts & History | 19 | 5.5% |
| Visual & Performing Arts | 13 | 3.7% |
| Communications | 0 | 0.0% |
| Arts & Humanities | 60 | 17.3% |
| Total | 347 | 100.0% |
Transportation & Commute in Legend Lake
Vehicle Availability by Sex in Legend Lake
The most prevalent vehicle ownership categories in Legend Lake are males with 2 vehicles (121, accounting for 49.0%) and females with 2 vehicles (93, making up 53.8%).
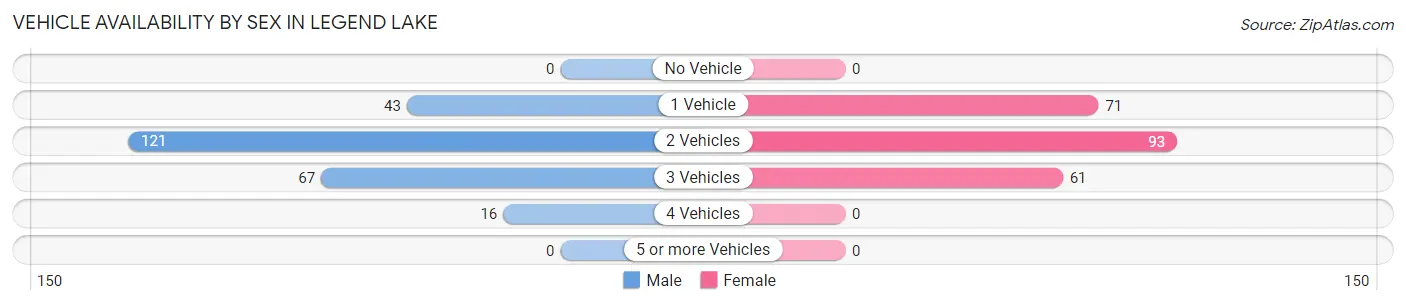
| Vehicles Available | Male | Female |
| No Vehicle | 0 (0.0%) | 0 (0.0%) |
| 1 Vehicle | 43 (17.4%) | 71 (31.6%) |
| 2 Vehicles | 121 (49.0%) | 93 (41.3%) |
| 3 Vehicles | 67 (27.1%) | 61 (27.1%) |
| 4 Vehicles | 16 (6.5%) | 0 (0.0%) |
| 5 or more Vehicles | 0 (0.0%) | 0 (0.0%) |
| Total | 247 (100.0%) | 225 (100.0%) |
Commute Time in Legend Lake
The most frequently occuring commute durations in Legend Lake are 5 to 9 minutes (86 commuters, 20.1%), 10 to 14 minutes (70 commuters, 16.3%), and 20 to 24 minutes (67 commuters, 15.6%).
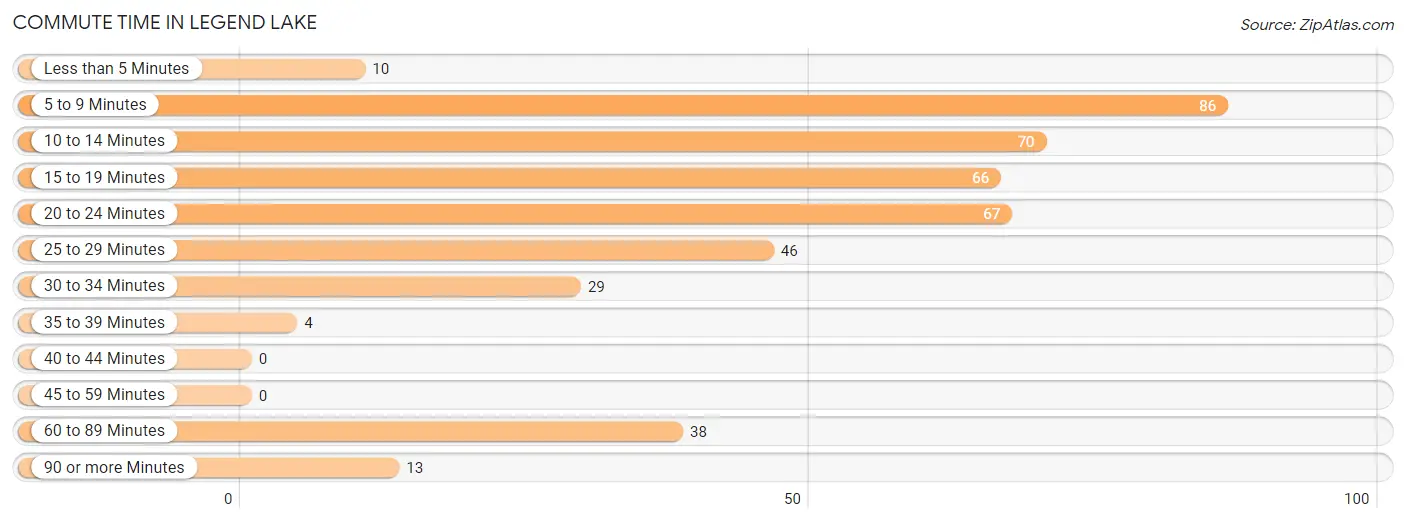
| Commute Time | # Commuters | % Commuters |
| Less than 5 Minutes | 10 | 2.3% |
| 5 to 9 Minutes | 86 | 20.1% |
| 10 to 14 Minutes | 70 | 16.3% |
| 15 to 19 Minutes | 66 | 15.4% |
| 20 to 24 Minutes | 67 | 15.6% |
| 25 to 29 Minutes | 46 | 10.7% |
| 30 to 34 Minutes | 29 | 6.8% |
| 35 to 39 Minutes | 4 | 0.9% |
| 40 to 44 Minutes | 0 | 0.0% |
| 45 to 59 Minutes | 0 | 0.0% |
| 60 to 89 Minutes | 38 | 8.9% |
| 90 or more Minutes | 13 | 3.0% |
Commute Time by Sex in Legend Lake
The most common commute times in Legend Lake are 5 to 9 minutes (56 commuters, 25.0%) for males and 25 to 29 minutes (46 commuters, 22.4%) for females.
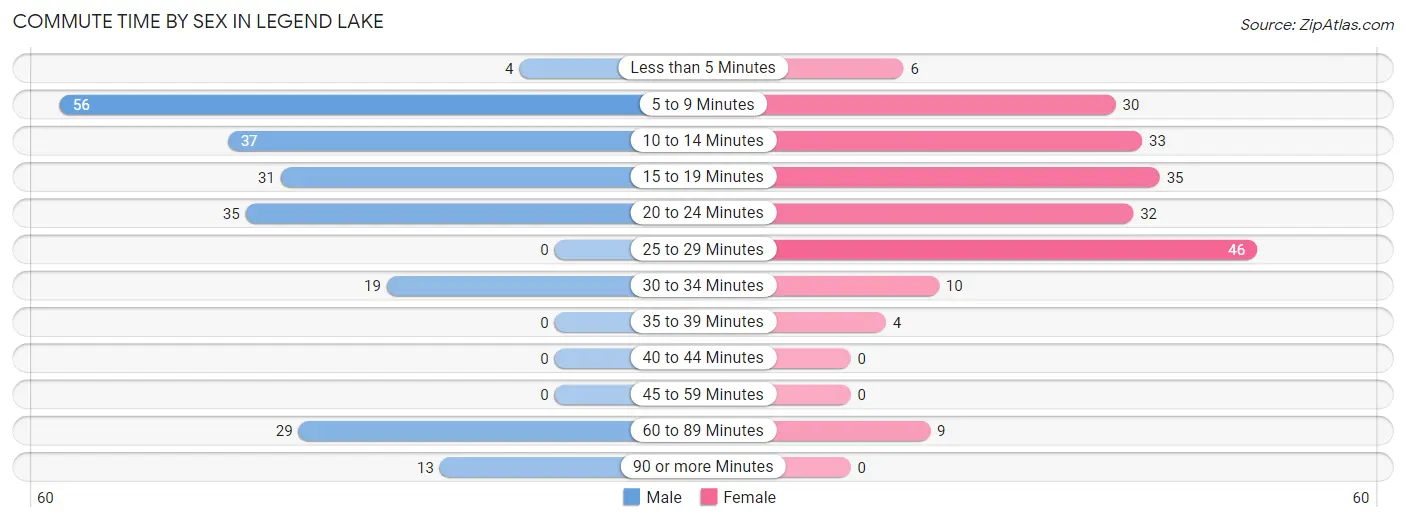
| Commute Time | Male | Female |
| Less than 5 Minutes | 4 (1.8%) | 6 (2.9%) |
| 5 to 9 Minutes | 56 (25.0%) | 30 (14.6%) |
| 10 to 14 Minutes | 37 (16.5%) | 33 (16.1%) |
| 15 to 19 Minutes | 31 (13.8%) | 35 (17.1%) |
| 20 to 24 Minutes | 35 (15.6%) | 32 (15.6%) |
| 25 to 29 Minutes | 0 (0.0%) | 46 (22.4%) |
| 30 to 34 Minutes | 19 (8.5%) | 10 (4.9%) |
| 35 to 39 Minutes | 0 (0.0%) | 4 (1.9%) |
| 40 to 44 Minutes | 0 (0.0%) | 0 (0.0%) |
| 45 to 59 Minutes | 0 (0.0%) | 0 (0.0%) |
| 60 to 89 Minutes | 29 (13.0%) | 9 (4.4%) |
| 90 or more Minutes | 13 (5.8%) | 0 (0.0%) |
Time of Departure to Work by Sex in Legend Lake
The most frequent times of departure to work in Legend Lake are 7:00 AM to 7:29 AM (72, 32.1%) for males and 7:30 AM to 7:59 AM (73, 35.6%) for females.
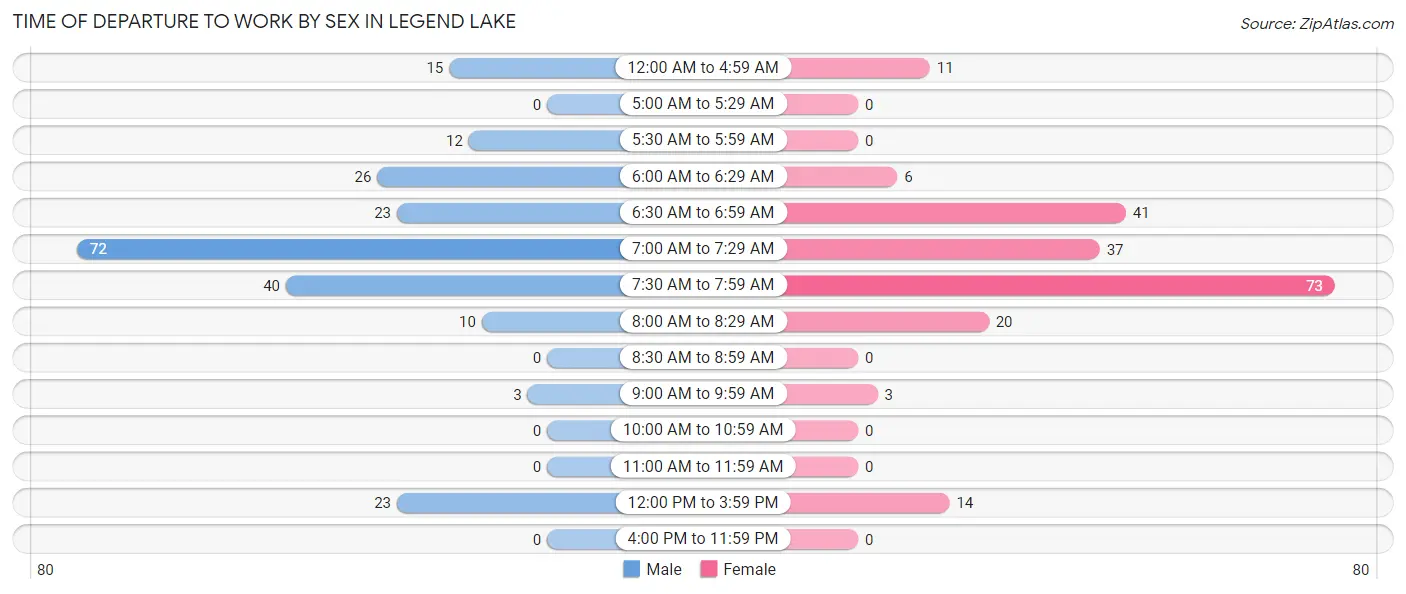
| Time of Departure | Male | Female |
| 12:00 AM to 4:59 AM | 15 (6.7%) | 11 (5.4%) |
| 5:00 AM to 5:29 AM | 0 (0.0%) | 0 (0.0%) |
| 5:30 AM to 5:59 AM | 12 (5.4%) | 0 (0.0%) |
| 6:00 AM to 6:29 AM | 26 (11.6%) | 6 (2.9%) |
| 6:30 AM to 6:59 AM | 23 (10.3%) | 41 (20.0%) |
| 7:00 AM to 7:29 AM | 72 (32.1%) | 37 (18.0%) |
| 7:30 AM to 7:59 AM | 40 (17.9%) | 73 (35.6%) |
| 8:00 AM to 8:29 AM | 10 (4.5%) | 20 (9.8%) |
| 8:30 AM to 8:59 AM | 0 (0.0%) | 0 (0.0%) |
| 9:00 AM to 9:59 AM | 3 (1.3%) | 3 (1.5%) |
| 10:00 AM to 10:59 AM | 0 (0.0%) | 0 (0.0%) |
| 11:00 AM to 11:59 AM | 0 (0.0%) | 0 (0.0%) |
| 12:00 PM to 3:59 PM | 23 (10.3%) | 14 (6.8%) |
| 4:00 PM to 11:59 PM | 0 (0.0%) | 0 (0.0%) |
| Total | 224 (100.0%) | 205 (100.0%) |
Housing Occupancy in Legend Lake
Occupancy by Ownership in Legend Lake
Of the total 543 dwellings in Legend Lake, owner-occupied units account for 508 (93.5%), while renter-occupied units make up 35 (6.5%).
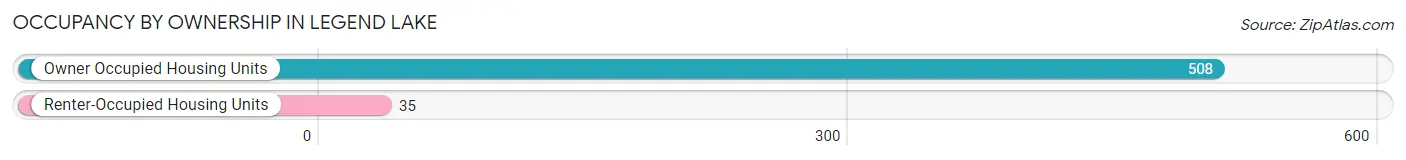
| Occupancy | # Housing Units | % Housing Units |
| Owner Occupied Housing Units | 508 | 93.5% |
| Renter-Occupied Housing Units | 35 | 6.5% |
| Total Occupied Housing Units | 543 | 100.0% |
Occupancy by Household Size in Legend Lake
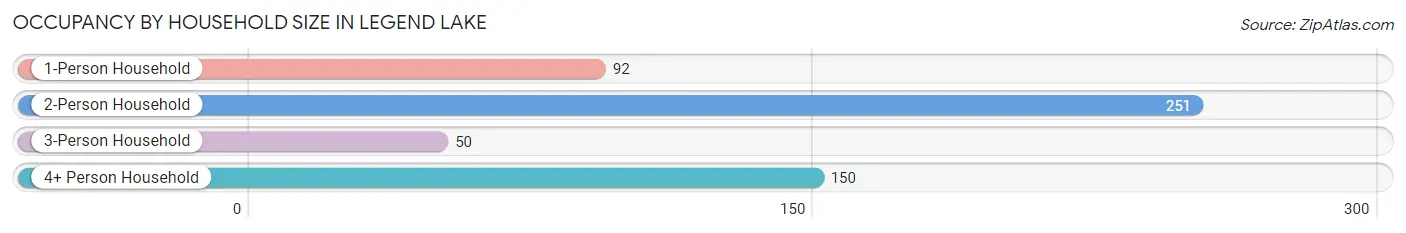
| Household Size | # Housing Units | % Housing Units |
| 1-Person Household | 92 | 16.9% |
| 2-Person Household | 251 | 46.2% |
| 3-Person Household | 50 | 9.2% |
| 4+ Person Household | 150 | 27.6% |
| Total Housing Units | 543 | 100.0% |
Occupancy by Ownership by Household Size in Legend Lake
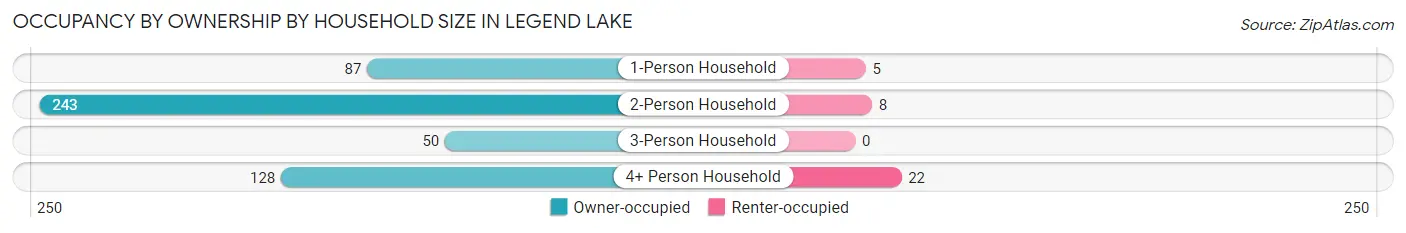
| Household Size | Owner-occupied | Renter-occupied |
| 1-Person Household | 87 (94.6%) | 5 (5.4%) |
| 2-Person Household | 243 (96.8%) | 8 (3.2%) |
| 3-Person Household | 50 (100.0%) | 0 (0.0%) |
| 4+ Person Household | 128 (85.3%) | 22 (14.7%) |
| Total Housing Units | 508 (93.5%) | 35 (6.5%) |
Occupancy by Educational Attainment in Legend Lake
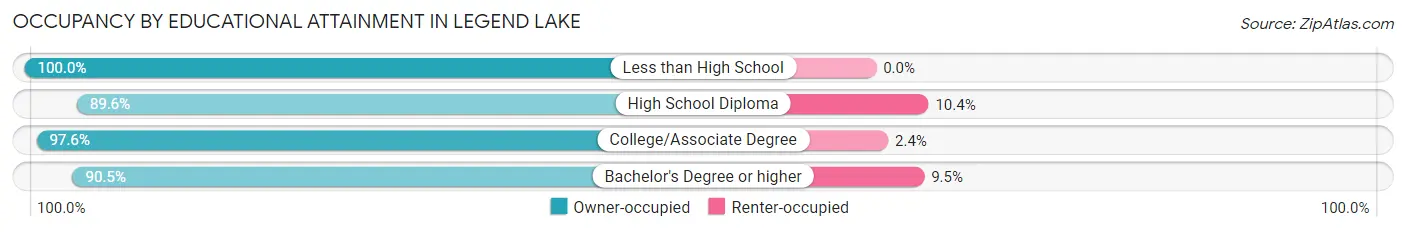
| Household Size | Owner-occupied | Renter-occupied |
| Less than High School | 28 (100.0%) | 0 (0.0%) |
| High School Diploma | 121 (89.6%) | 14 (10.4%) |
| College/Associate Degree | 207 (97.6%) | 5 (2.4%) |
| Bachelor's Degree or higher | 152 (90.5%) | 16 (9.5%) |
Occupancy by Age of Householder in Legend Lake
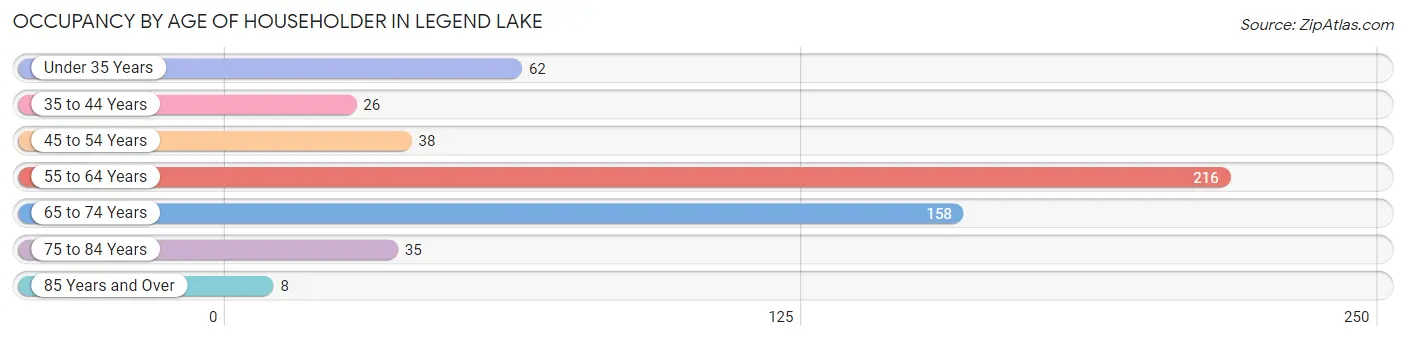
| Age Bracket | # Households | % Households |
| Under 35 Years | 62 | 11.4% |
| 35 to 44 Years | 26 | 4.8% |
| 45 to 54 Years | 38 | 7.0% |
| 55 to 64 Years | 216 | 39.8% |
| 65 to 74 Years | 158 | 29.1% |
| 75 to 84 Years | 35 | 6.5% |
| 85 Years and Over | 8 | 1.5% |
| Total | 543 | 100.0% |
Housing Finances in Legend Lake
Median Income by Occupancy in Legend Lake
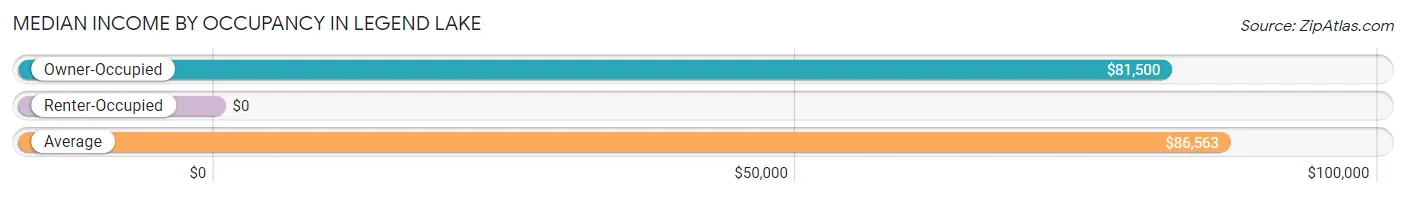
| Occupancy Type | # Households | Median Income |
| Owner-Occupied | 508 (93.5%) | $81,500 |
| Renter-Occupied | 35 (6.5%) | $0 |
| Average | 543 (100.0%) | $86,563 |
Occupancy by Householder Income Bracket in Legend Lake
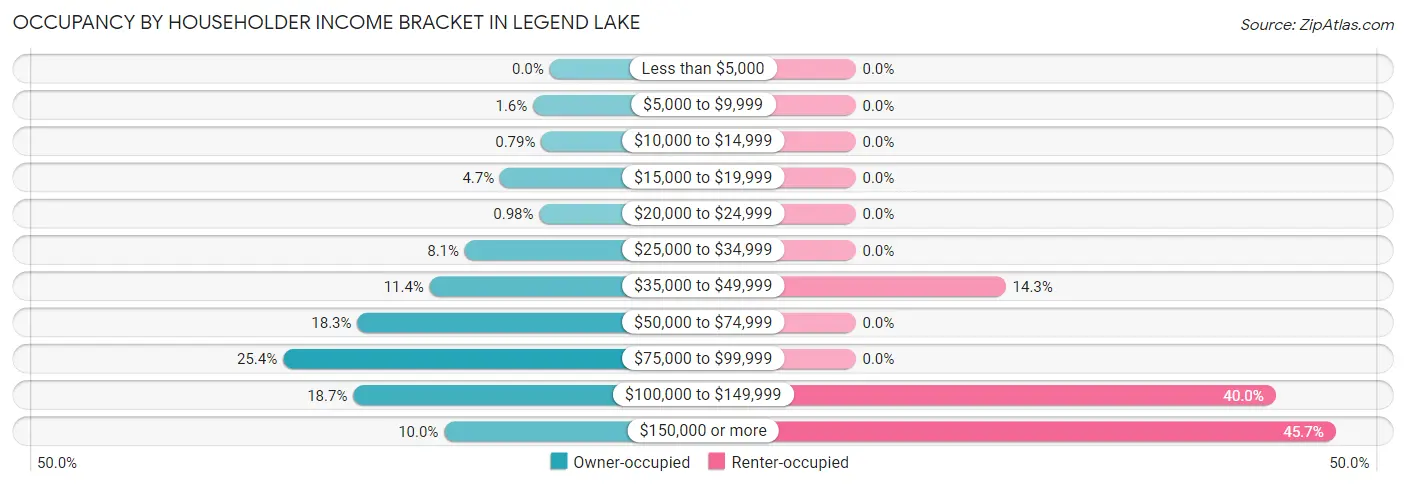
| Income Bracket | Owner-occupied | Renter-occupied |
| Less than $5,000 | 0 (0.0%) | 0 (0.0%) |
| $5,000 to $9,999 | 8 (1.6%) | 0 (0.0%) |
| $10,000 to $14,999 | 4 (0.8%) | 0 (0.0%) |
| $15,000 to $19,999 | 24 (4.7%) | 0 (0.0%) |
| $20,000 to $24,999 | 5 (1.0%) | 0 (0.0%) |
| $25,000 to $34,999 | 41 (8.1%) | 0 (0.0%) |
| $35,000 to $49,999 | 58 (11.4%) | 5 (14.3%) |
| $50,000 to $74,999 | 93 (18.3%) | 0 (0.0%) |
| $75,000 to $99,999 | 129 (25.4%) | 0 (0.0%) |
| $100,000 to $149,999 | 95 (18.7%) | 14 (40.0%) |
| $150,000 or more | 51 (10.0%) | 16 (45.7%) |
| Total | 508 (100.0%) | 35 (100.0%) |
Monthly Housing Cost Tiers in Legend Lake
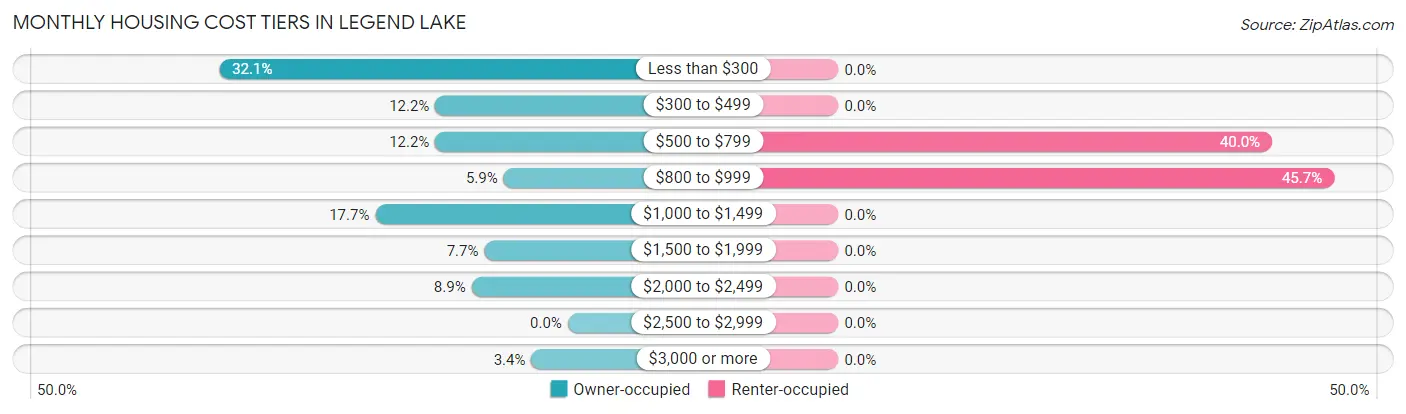
| Monthly Cost | Owner-occupied | Renter-occupied |
| Less than $300 | 163 (32.1%) | 0 (0.0%) |
| $300 to $499 | 62 (12.2%) | 0 (0.0%) |
| $500 to $799 | 62 (12.2%) | 14 (40.0%) |
| $800 to $999 | 30 (5.9%) | 16 (45.7%) |
| $1,000 to $1,499 | 90 (17.7%) | 0 (0.0%) |
| $1,500 to $1,999 | 39 (7.7%) | 0 (0.0%) |
| $2,000 to $2,499 | 45 (8.9%) | 0 (0.0%) |
| $2,500 to $2,999 | 0 (0.0%) | 0 (0.0%) |
| $3,000 or more | 17 (3.4%) | 0 (0.0%) |
| Total | 508 (100.0%) | 35 (100.0%) |
Physical Housing Characteristics in Legend Lake
Housing Structures in Legend Lake
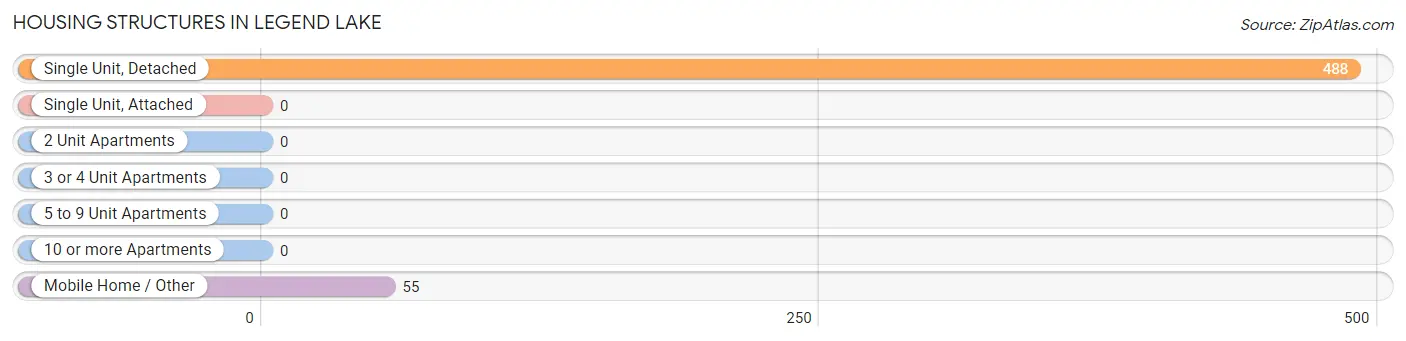
| Structure Type | # Housing Units | % Housing Units |
| Single Unit, Detached | 488 | 89.9% |
| Single Unit, Attached | 0 | 0.0% |
| 2 Unit Apartments | 0 | 0.0% |
| 3 or 4 Unit Apartments | 0 | 0.0% |
| 5 to 9 Unit Apartments | 0 | 0.0% |
| 10 or more Apartments | 0 | 0.0% |
| Mobile Home / Other | 55 | 10.1% |
| Total | 543 | 100.0% |
Housing Structures by Occupancy in Legend Lake
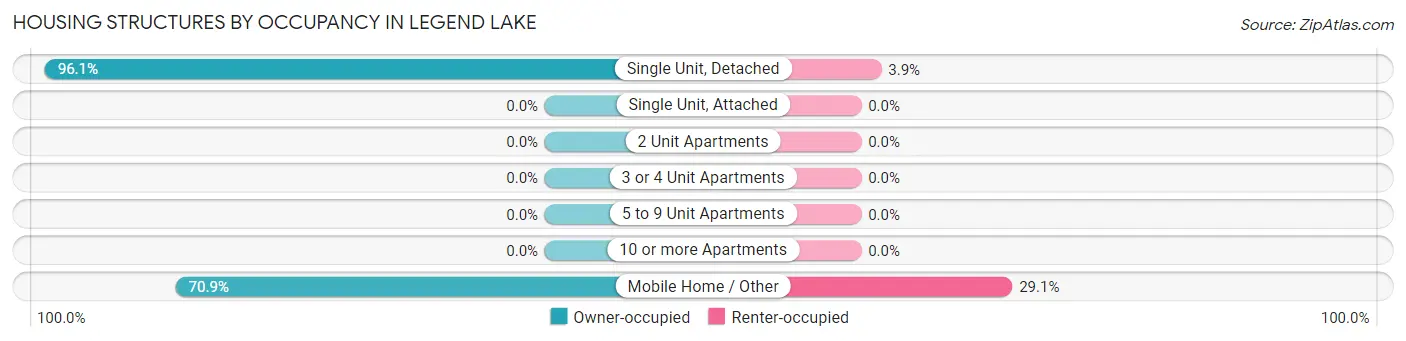
| Structure Type | Owner-occupied | Renter-occupied |
| Single Unit, Detached | 469 (96.1%) | 19 (3.9%) |
| Single Unit, Attached | 0 (0.0%) | 0 (0.0%) |
| 2 Unit Apartments | 0 (0.0%) | 0 (0.0%) |
| 3 or 4 Unit Apartments | 0 (0.0%) | 0 (0.0%) |
| 5 to 9 Unit Apartments | 0 (0.0%) | 0 (0.0%) |
| 10 or more Apartments | 0 (0.0%) | 0 (0.0%) |
| Mobile Home / Other | 39 (70.9%) | 16 (29.1%) |
| Total | 508 (93.5%) | 35 (6.5%) |
Housing Structures by Number of Rooms in Legend Lake
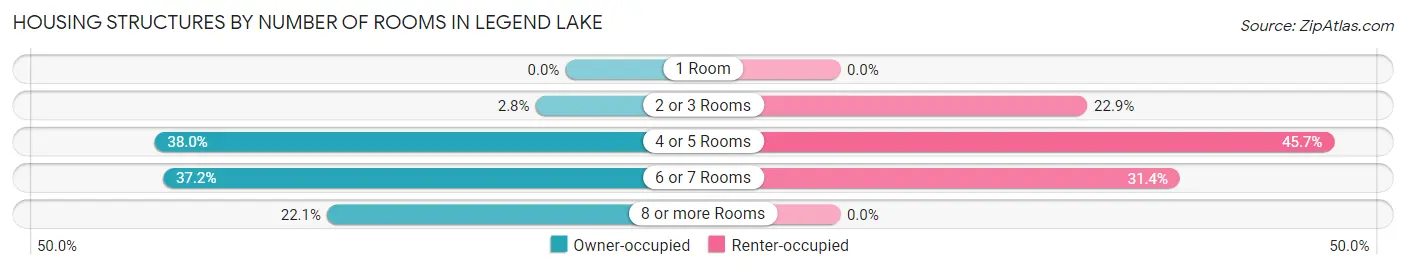
| Number of Rooms | Owner-occupied | Renter-occupied |
| 1 Room | 0 (0.0%) | 0 (0.0%) |
| 2 or 3 Rooms | 14 (2.8%) | 8 (22.9%) |
| 4 or 5 Rooms | 193 (38.0%) | 16 (45.7%) |
| 6 or 7 Rooms | 189 (37.2%) | 11 (31.4%) |
| 8 or more Rooms | 112 (22.1%) | 0 (0.0%) |
| Total | 508 (100.0%) | 35 (100.0%) |
Housing Structure by Heating Type in Legend Lake
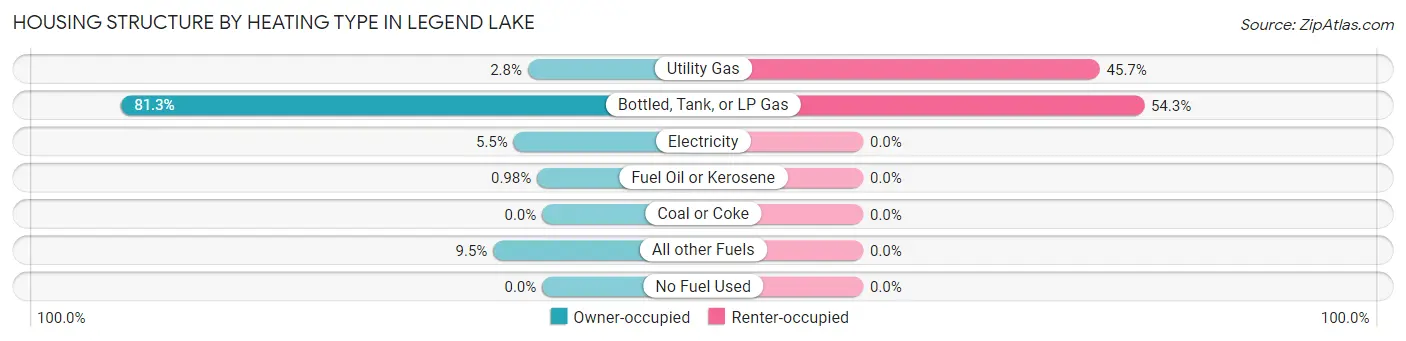
| Heating Type | Owner-occupied | Renter-occupied |
| Utility Gas | 14 (2.8%) | 16 (45.7%) |
| Bottled, Tank, or LP Gas | 413 (81.3%) | 19 (54.3%) |
| Electricity | 28 (5.5%) | 0 (0.0%) |
| Fuel Oil or Kerosene | 5 (1.0%) | 0 (0.0%) |
| Coal or Coke | 0 (0.0%) | 0 (0.0%) |
| All other Fuels | 48 (9.5%) | 0 (0.0%) |
| No Fuel Used | 0 (0.0%) | 0 (0.0%) |
| Total | 508 (100.0%) | 35 (100.0%) |
Household Vehicle Usage in Legend Lake
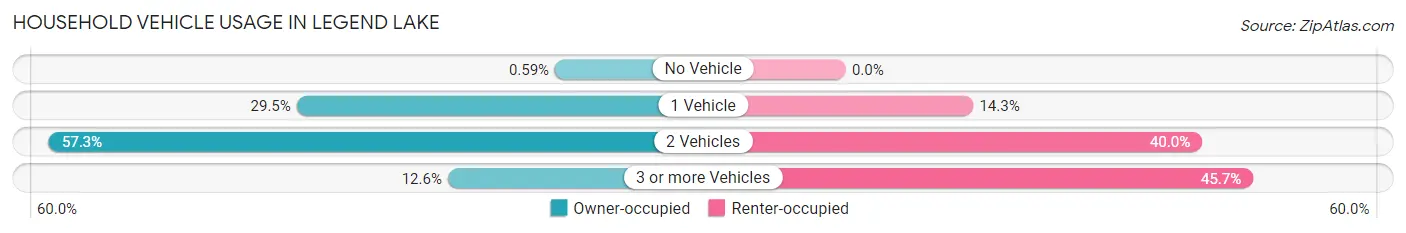
| Vehicles per Household | Owner-occupied | Renter-occupied |
| No Vehicle | 3 (0.6%) | 0 (0.0%) |
| 1 Vehicle | 150 (29.5%) | 5 (14.3%) |
| 2 Vehicles | 291 (57.3%) | 14 (40.0%) |
| 3 or more Vehicles | 64 (12.6%) | 16 (45.7%) |
| Total | 508 (100.0%) | 35 (100.0%) |
Real Estate & Mortgages in Legend Lake
Real Estate and Mortgage Overview in Legend Lake
| Characteristic | Without Mortgage | With Mortgage |
| Housing Units | 305 | 203 |
| Median Property Value | $92,800 | $259,400 |
| Median Household Income | $63,472 | $44 |
| Monthly Housing Costs | $284 | $17 |
| Real Estate Taxes | $3,648 | $52 |
Property Value by Mortgage Status in Legend Lake
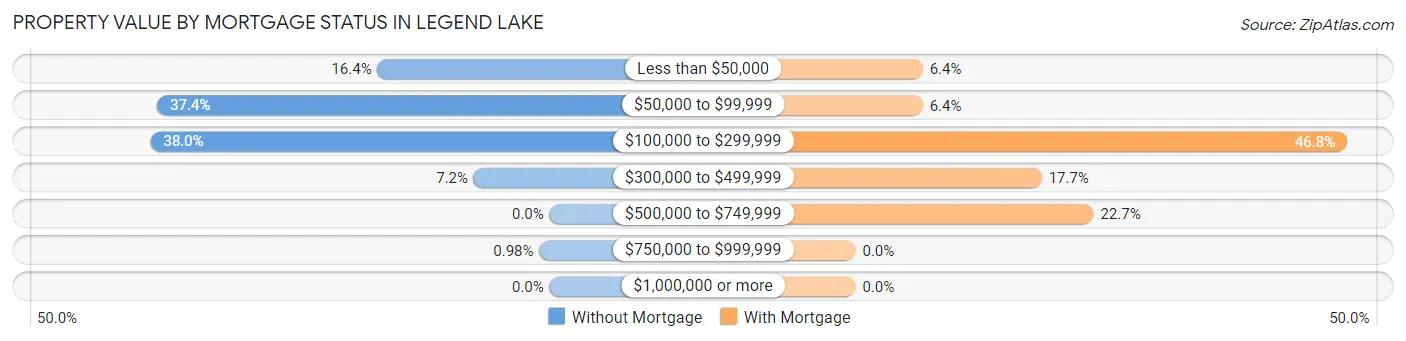
| Property Value | Without Mortgage | With Mortgage |
| Less than $50,000 | 50 (16.4%) | 13 (6.4%) |
| $50,000 to $99,999 | 114 (37.4%) | 13 (6.4%) |
| $100,000 to $299,999 | 116 (38.0%) | 95 (46.8%) |
| $300,000 to $499,999 | 22 (7.2%) | 36 (17.7%) |
| $500,000 to $749,999 | 0 (0.0%) | 46 (22.7%) |
| $750,000 to $999,999 | 3 (1.0%) | 0 (0.0%) |
| $1,000,000 or more | 0 (0.0%) | 0 (0.0%) |
| Total | 305 (100.0%) | 203 (100.0%) |
Household Income by Mortgage Status in Legend Lake
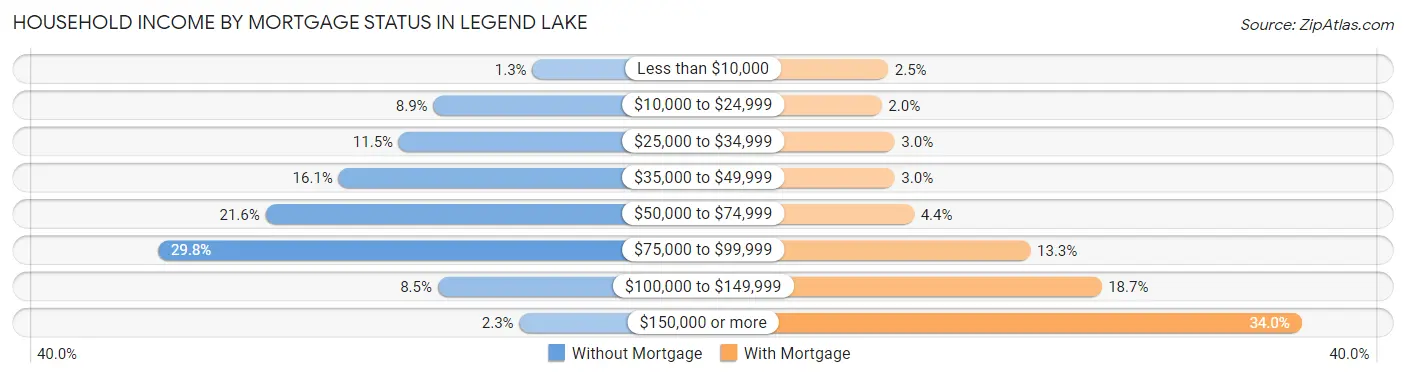
| Household Income | Without Mortgage | With Mortgage |
| Less than $10,000 | 4 (1.3%) | 5 (2.5%) |
| $10,000 to $24,999 | 27 (8.8%) | 4 (2.0%) |
| $25,000 to $34,999 | 35 (11.5%) | 6 (3.0%) |
| $35,000 to $49,999 | 49 (16.1%) | 6 (3.0%) |
| $50,000 to $74,999 | 66 (21.6%) | 9 (4.4%) |
| $75,000 to $99,999 | 91 (29.8%) | 27 (13.3%) |
| $100,000 to $149,999 | 26 (8.5%) | 38 (18.7%) |
| $150,000 or more | 7 (2.3%) | 69 (34.0%) |
| Total | 305 (100.0%) | 203 (100.0%) |
Property Value to Household Income Ratio in Legend Lake
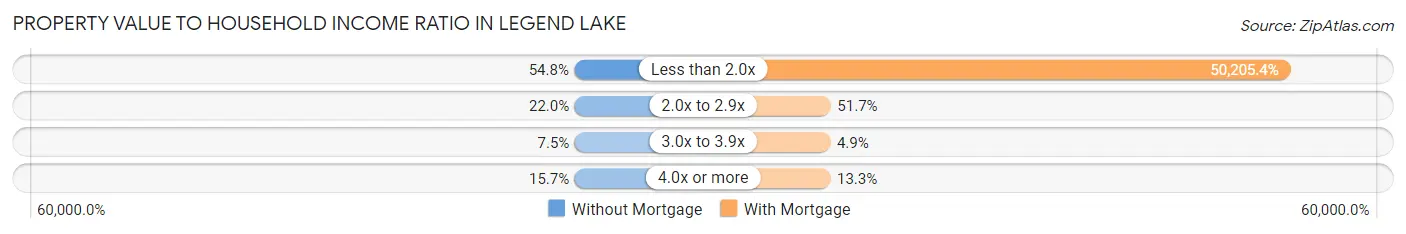
| Value-to-Income Ratio | Without Mortgage | With Mortgage |
| Less than 2.0x | 167 (54.7%) | 101,917 (50,205.4%) |
| 2.0x to 2.9x | 67 (22.0%) | 105 (51.7%) |
| 3.0x to 3.9x | 23 (7.5%) | 10 (4.9%) |
| 4.0x or more | 48 (15.7%) | 27 (13.3%) |
| Total | 305 (100.0%) | 203 (100.0%) |
Real Estate Taxes by Mortgage Status in Legend Lake
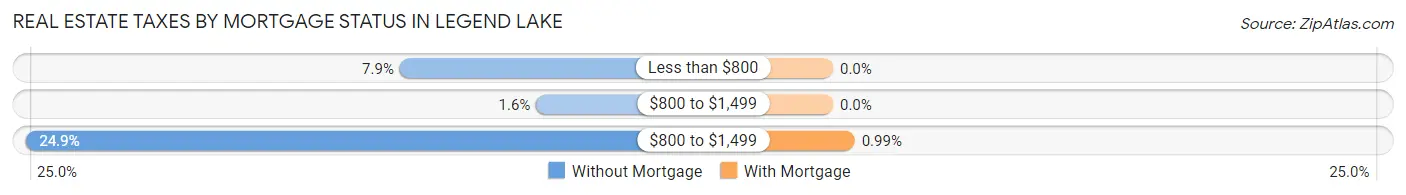
| Property Taxes | Without Mortgage | With Mortgage |
| Less than $800 | 24 (7.9%) | 0 (0.0%) |
| $800 to $1,499 | 5 (1.6%) | 0 (0.0%) |
| $800 to $1,499 | 76 (24.9%) | 2 (1.0%) |
| Total | 305 (100.0%) | 203 (100.0%) |
Health & Disability in Legend Lake
Health Insurance Coverage by Age in Legend Lake
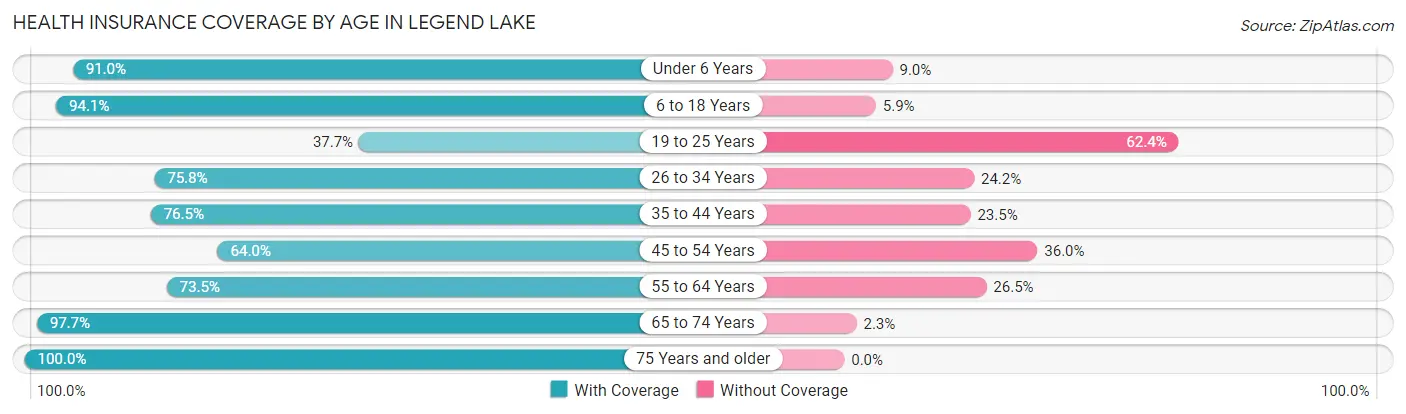
| Age Bracket | With Coverage | Without Coverage |
| Under 6 Years | 81 (91.0%) | 8 (9.0%) |
| 6 to 18 Years | 304 (94.1%) | 19 (5.9%) |
| 19 to 25 Years | 32 (37.7%) | 53 (62.4%) |
| 26 to 34 Years | 94 (75.8%) | 30 (24.2%) |
| 35 to 44 Years | 78 (76.5%) | 24 (23.5%) |
| 45 to 54 Years | 80 (64.0%) | 45 (36.0%) |
| 55 to 64 Years | 233 (73.5%) | 84 (26.5%) |
| 65 to 74 Years | 257 (97.7%) | 6 (2.3%) |
| 75 Years and older | 102 (100.0%) | 0 (0.0%) |
| Total | 1,261 (82.4%) | 269 (17.6%) |
Health Insurance Coverage by Citizenship Status in Legend Lake
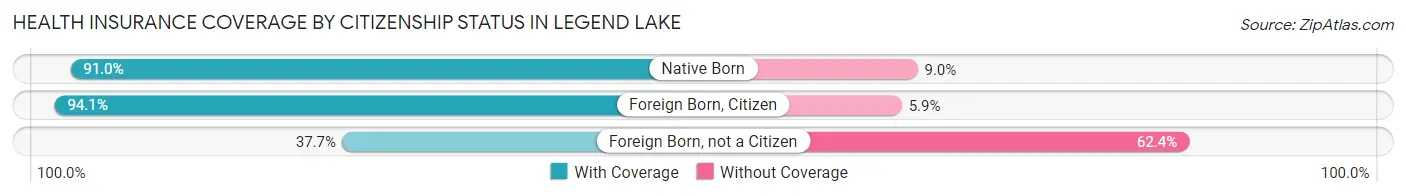
| Citizenship Status | With Coverage | Without Coverage |
| Native Born | 81 (91.0%) | 8 (9.0%) |
| Foreign Born, Citizen | 304 (94.1%) | 19 (5.9%) |
| Foreign Born, not a Citizen | 32 (37.7%) | 53 (62.4%) |
Health Insurance Coverage by Household Income in Legend Lake
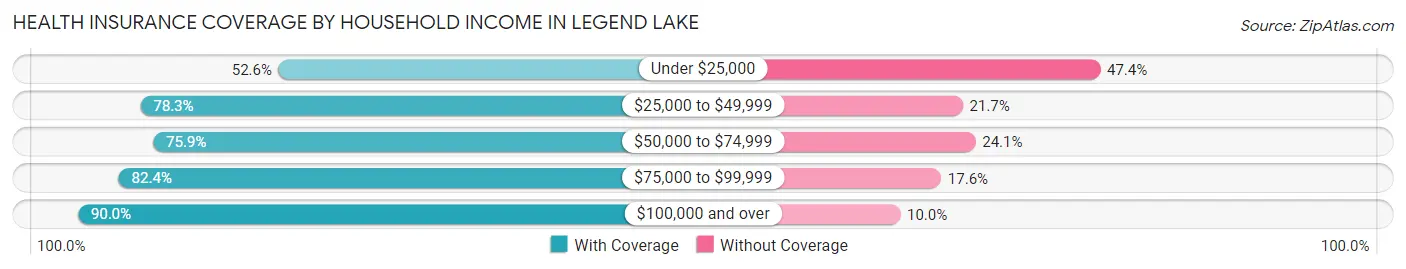
| Household Income | With Coverage | Without Coverage |
| Under $25,000 | 41 (52.6%) | 37 (47.4%) |
| $25,000 to $49,999 | 148 (78.3%) | 41 (21.7%) |
| $50,000 to $74,999 | 186 (75.9%) | 59 (24.1%) |
| $75,000 to $99,999 | 327 (82.4%) | 70 (17.6%) |
| $100,000 and over | 559 (90.0%) | 62 (10.0%) |
Public vs Private Health Insurance Coverage by Age in Legend Lake
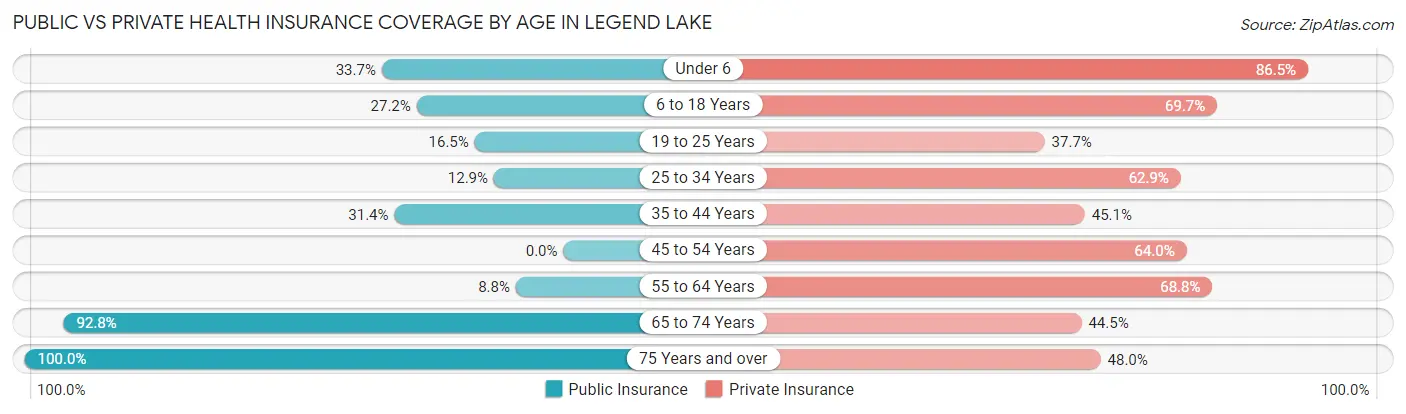
| Age Bracket | Public Insurance | Private Insurance |
| Under 6 | 30 (33.7%) | 77 (86.5%) |
| 6 to 18 Years | 88 (27.2%) | 225 (69.7%) |
| 19 to 25 Years | 14 (16.5%) | 32 (37.7%) |
| 25 to 34 Years | 16 (12.9%) | 78 (62.9%) |
| 35 to 44 Years | 32 (31.4%) | 46 (45.1%) |
| 45 to 54 Years | 0 (0.0%) | 80 (64.0%) |
| 55 to 64 Years | 28 (8.8%) | 218 (68.8%) |
| 65 to 74 Years | 244 (92.8%) | 117 (44.5%) |
| 75 Years and over | 102 (100.0%) | 49 (48.0%) |
| Total | 554 (36.2%) | 922 (60.3%) |
Disability Status by Sex by Age in Legend Lake
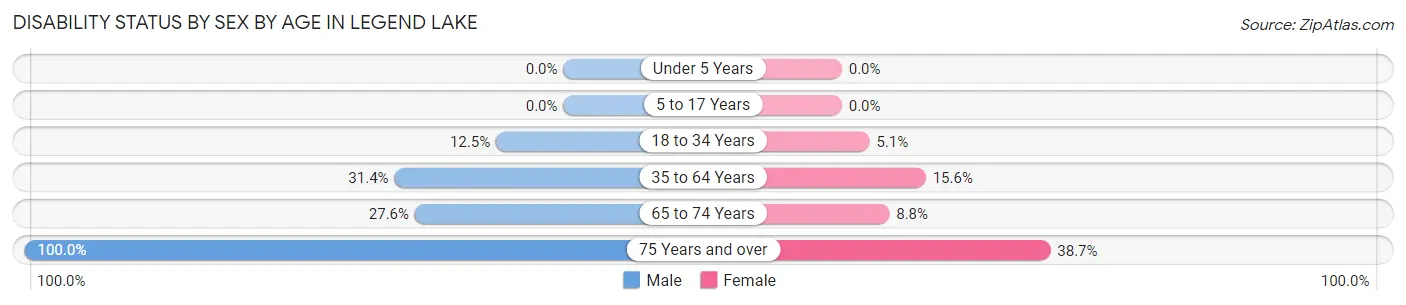
| Age Bracket | Male | Female |
| Under 5 Years | 0 (0.0%) | 0 (0.0%) |
| 5 to 17 Years | 0 (0.0%) | 0 (0.0%) |
| 18 to 34 Years | 17 (12.5%) | 4 (5.1%) |
| 35 to 64 Years | 74 (31.4%) | 48 (15.6%) |
| 65 to 74 Years | 35 (27.6%) | 12 (8.8%) |
| 75 Years and over | 71 (100.0%) | 12 (38.7%) |
Disability Class by Sex by Age in Legend Lake
Disability Class: Hearing Difficulty
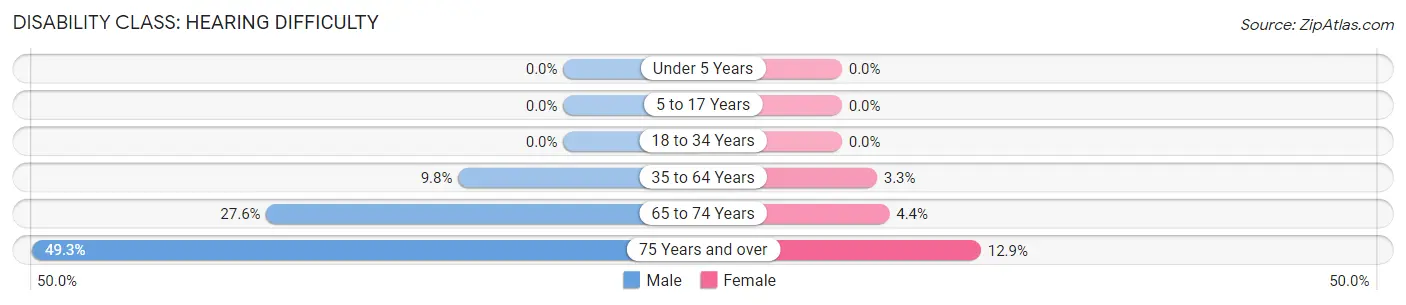
| Age Bracket | Male | Female |
| Under 5 Years | 0 (0.0%) | 0 (0.0%) |
| 5 to 17 Years | 0 (0.0%) | 0 (0.0%) |
| 18 to 34 Years | 0 (0.0%) | 0 (0.0%) |
| 35 to 64 Years | 23 (9.8%) | 10 (3.3%) |
| 65 to 74 Years | 35 (27.6%) | 6 (4.4%) |
| 75 Years and over | 35 (49.3%) | 4 (12.9%) |
Disability Class: Vision Difficulty
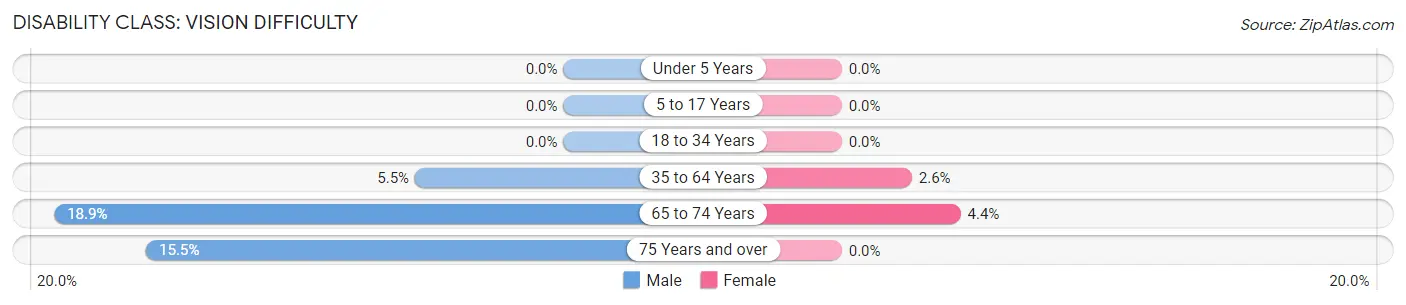
| Age Bracket | Male | Female |
| Under 5 Years | 0 (0.0%) | 0 (0.0%) |
| 5 to 17 Years | 0 (0.0%) | 0 (0.0%) |
| 18 to 34 Years | 0 (0.0%) | 0 (0.0%) |
| 35 to 64 Years | 13 (5.5%) | 8 (2.6%) |
| 65 to 74 Years | 24 (18.9%) | 6 (4.4%) |
| 75 Years and over | 11 (15.5%) | 0 (0.0%) |
Disability Class: Cognitive Difficulty
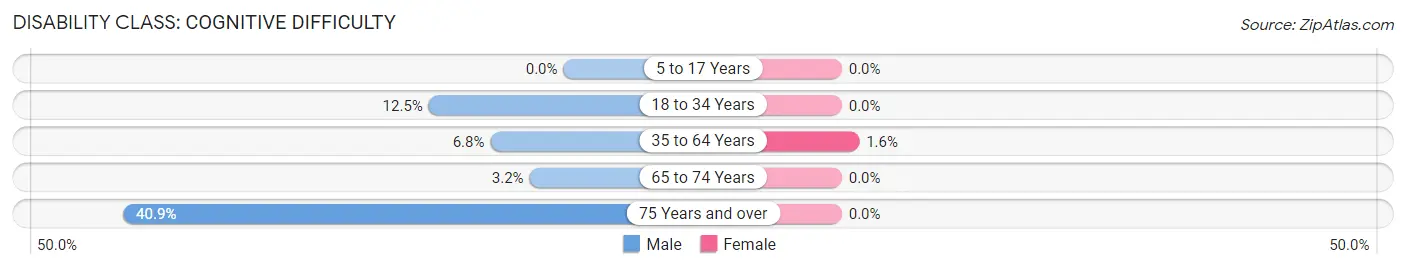
| Age Bracket | Male | Female |
| 5 to 17 Years | 0 (0.0%) | 0 (0.0%) |
| 18 to 34 Years | 17 (12.5%) | 0 (0.0%) |
| 35 to 64 Years | 16 (6.8%) | 5 (1.6%) |
| 65 to 74 Years | 4 (3.2%) | 0 (0.0%) |
| 75 Years and over | 29 (40.8%) | 0 (0.0%) |
Disability Class: Ambulatory Difficulty
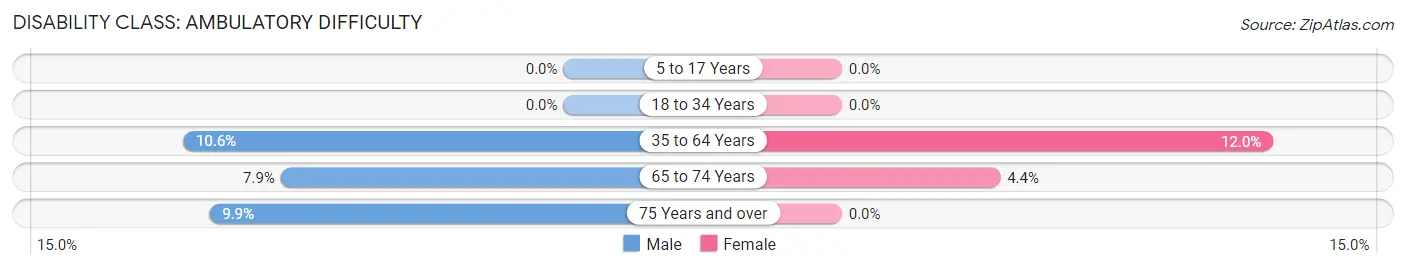
| Age Bracket | Male | Female |
| 5 to 17 Years | 0 (0.0%) | 0 (0.0%) |
| 18 to 34 Years | 0 (0.0%) | 0 (0.0%) |
| 35 to 64 Years | 25 (10.6%) | 37 (12.0%) |
| 65 to 74 Years | 10 (7.9%) | 6 (4.4%) |
| 75 Years and over | 7 (9.9%) | 0 (0.0%) |
Disability Class: Self-Care Difficulty
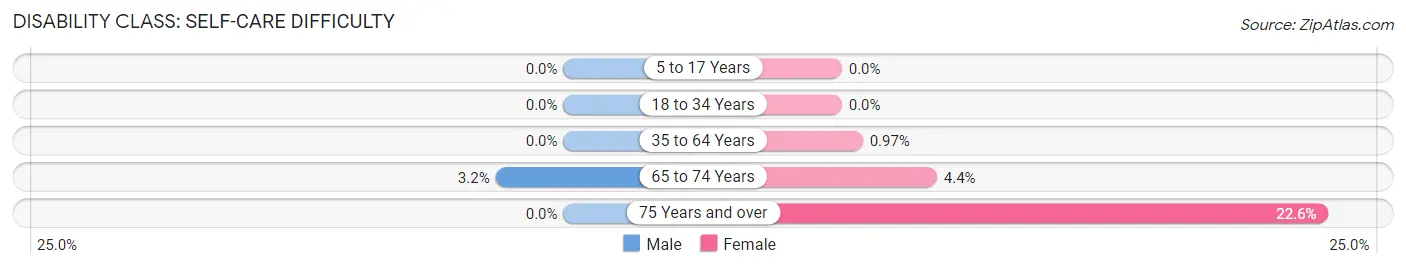
| Age Bracket | Male | Female |
| 5 to 17 Years | 0 (0.0%) | 0 (0.0%) |
| 18 to 34 Years | 0 (0.0%) | 0 (0.0%) |
| 35 to 64 Years | 0 (0.0%) | 3 (1.0%) |
| 65 to 74 Years | 4 (3.2%) | 6 (4.4%) |
| 75 Years and over | 0 (0.0%) | 7 (22.6%) |
Technology Access in Legend Lake
Computing Device Access in Legend Lake
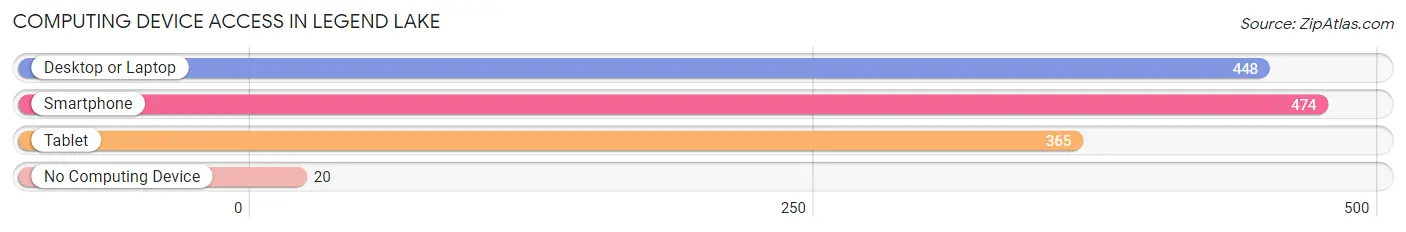
| Device Type | # Households | % Households |
| Desktop or Laptop | 448 | 82.5% |
| Smartphone | 474 | 87.3% |
| Tablet | 365 | 67.2% |
| No Computing Device | 20 | 3.7% |
| Total | 543 | 100.0% |
Internet Access in Legend Lake
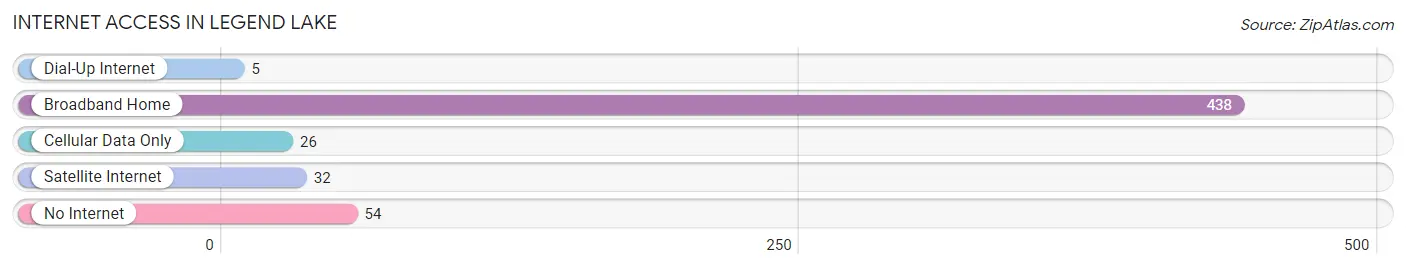
| Internet Type | # Households | % Households |
| Dial-Up Internet | 5 | 0.9% |
| Broadband Home | 438 | 80.7% |
| Cellular Data Only | 26 | 4.8% |
| Satellite Internet | 32 | 5.9% |
| No Internet | 54 | 9.9% |
| Total | 543 | 100.0% |
Legend Lake Summary
Lake, Wisconsin is a small town located in the southeastern corner of the state, near the border of Illinois. It is part of the Milwaukee metropolitan area and is home to a population of just over 1,000 people. The town is situated on the banks of Lake Michigan and is known for its picturesque views and recreational activities.
History
The area that is now Lake, Wisconsin was first settled in the early 1800s by a group of German immigrants. The town was originally known as “New Berlin” and was part of the Town of Lake. In 1845, the Town of Lake was officially incorporated and the name was changed to Lake, Wisconsin.
The town grew slowly over the years, but it was not until the late 19th century that it began to experience significant growth. This was due to the development of the railroad, which allowed for easier transportation of goods and people. The railroad also helped to spur the growth of the local economy, as it allowed for the transportation of goods to and from the nearby cities of Milwaukee and Chicago.
Geography
Lake, Wisconsin is located in the southeastern corner of the state, near the border of Illinois. It is part of the Milwaukee metropolitan area and is situated on the banks of Lake Michigan. The town is surrounded by rolling hills and is home to a variety of wildlife, including deer, foxes, and coyotes.
The town is located in a temperate climate, with hot summers and cold winters. The average temperature in the summer is around 75 degrees Fahrenheit, while the average temperature in the winter is around 25 degrees Fahrenheit. The town receives an average of 40 inches of precipitation each year, with most of it falling in the form of snow.
Economy
The economy of Lake, Wisconsin is largely based on tourism and recreation. The town is home to a variety of recreational activities, including fishing, boating, and swimming. The town also has a number of restaurants, bars, and shops that cater to tourists.
The town is also home to a number of manufacturing and industrial businesses, including a paper mill and a plastics factory. These businesses provide jobs for many of the town’s residents.
Demographics
As of the 2010 census, the population of Lake, Wisconsin was 1,072. The town is predominantly white, with 92.3% of the population identifying as such. The remaining population is made up of African Americans (2.3%), Hispanics (2.2%), and Asians (1.2%).
The median household income in Lake, Wisconsin is $50,945, which is slightly higher than the national average. The median age of the population is 43.7 years, which is slightly lower than the national average.
Conclusion
Lake, Wisconsin is a small town located in the southeastern corner of the state, near the border of Illinois. It is part of the Milwaukee metropolitan area and is home to a population of just over 1,000 people. The town is situated on the banks of Lake Michigan and is known for its picturesque views and recreational activities. The economy of Lake, Wisconsin is largely based on tourism and recreation, and the town is predominantly white. The median household income in Lake, Wisconsin is $50,945, which is slightly higher than the national average.
Common Questions
What is the Total Population of Legend Lake?
Total Population of Legend Lake is 1,530.
What is the Total Male Population of Legend Lake?
Total Male Population of Legend Lake is 804.
What is the Total Female Population of Legend Lake?
Total Female Population of Legend Lake is 726.
What is the Ratio of Males per 100 Females in Legend Lake?
There are 110.74 Males per 100 Females in Legend Lake.
What is the Ratio of Females per 100 Males in Legend Lake?
There are 90.30 Females per 100 Males in Legend Lake.
What is the Median Population Age in Legend Lake?
Median Population Age in Legend Lake is 47.5 Years.
What is the Average Family Size in Legend Lake
Average Family Size in Legend Lake is 3.2 People.
What is the Average Household Size in Legend Lake
Average Household Size in Legend Lake is 2.8 People.
What is Per Capita Income in Legend Lake?
Per Capita income in Legend Lake is $36,179.
What is the Median Family Income in Legend Lake?
Median Family Income in Legend Lake is $88,683.
What is the Median Household income in Legend Lake?
Median Household Income in Legend Lake is $86,563.
What is Income or Wage Gap in Legend Lake?
Income or Wage Gap in Legend Lake is 19.4%.
Women in Legend Lake earn 80.6 cents for every dollar earned by a man.
What is Inequality or Gini Index in Legend Lake?
Inequality or Gini Index in Legend Lake is 0.42.
How Large is the Labor Force in Legend Lake?
There are 528 People in the Labor Forcein in Legend Lake.
What is the Percentage of People in the Labor Force in Legend Lake?
44.1% of People are in the Labor Force in Legend Lake.
What is the Unemployment Rate in Legend Lake?
Unemployment Rate in Legend Lake is 10.6%.