Lake Wissota, WI
Lake Wissota Map
Lake Wissota Overview
3,001
TOTAL POPULATION
1,740
MALE POPULATION
1,261
FEMALE POPULATION
137.99
MALES / 100 FEMALES
72.47
FEMALES / 100 MALES
52.2
MEDIAN AGE
2.5
AVG FAMILY SIZE
2.2
AVG HOUSEHOLD SIZE
$67,221
PER CAPITA INCOME
$135,804
AVG FAMILY INCOME
$126,667
AVG HOUSEHOLD INCOME
28.0%
WAGE / INCOME GAP [ % ]
72.0¢/ $1
WAGE / INCOME GAP [ $ ]
0.41
INEQUALITY / GINI INDEX
1,739
LABOR FORCE [ PEOPLE ]
68.9%
PERCENT IN LABOR FORCE
6.3%
UNEMPLOYMENT RATE
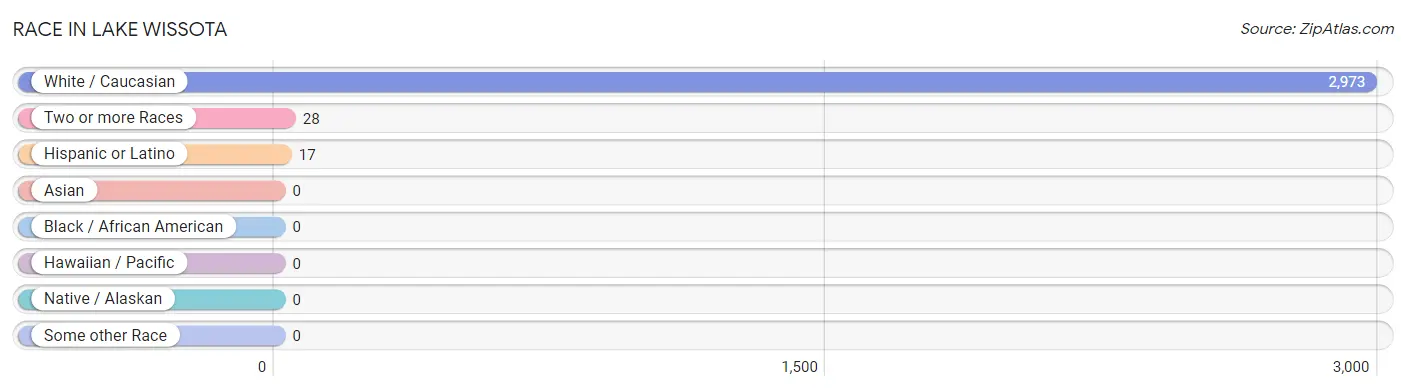
Race in Lake Wissota
The most populous races in Lake Wissota are White / Caucasian (2,973 | 99.1%), Two or more Races (28 | 0.9%), and Hispanic or Latino (17 | 0.6%).
| Race | # Population | % Population |
| Asian | 0 | 0.0% |
| Black / African American | 0 | 0.0% |
| Hawaiian / Pacific | 0 | 0.0% |
| Hispanic or Latino | 17 | 0.6% |
| Native / Alaskan | 0 | 0.0% |
| White / Caucasian | 2,973 | 99.1% |
| Two or more Races | 28 | 0.9% |
| Some other Race | 0 | 0.0% |
| Total | 3,001 | 100.0% |
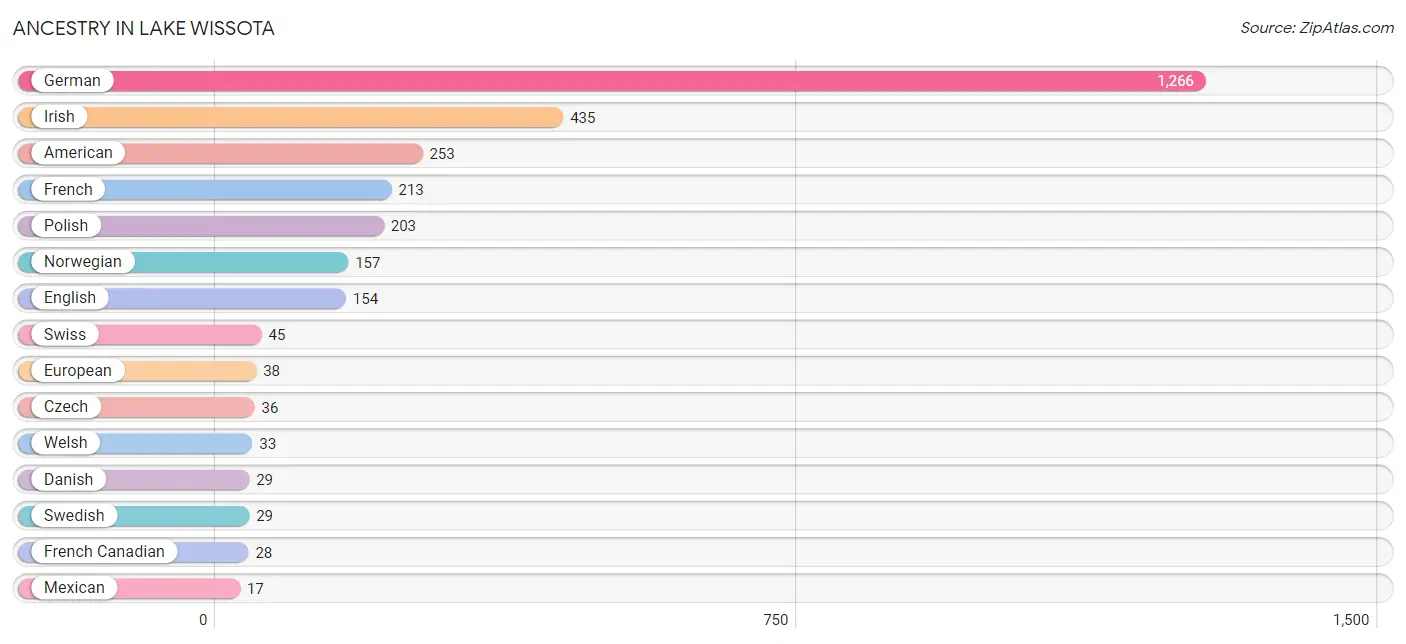
Ancestry in Lake Wissota
The most populous ancestries reported in Lake Wissota are German (1,266 | 42.2%), Irish (435 | 14.5%), American (253 | 8.4%), French (213 | 7.1%), and Polish (203 | 6.8%), together accounting for 79.0% of all Lake Wissota residents.
| Ancestry | # Population | % Population |
| American | 253 | 8.4% |
| Austrian | 12 | 0.4% |
| Chippewa | 7 | 0.2% |
| Czech | 36 | 1.2% |
| Danish | 29 | 1.0% |
| English | 154 | 5.1% |
| European | 38 | 1.3% |
| French | 213 | 7.1% |
| French Canadian | 28 | 0.9% |
| German | 1,266 | 42.2% |
| Irish | 435 | 14.5% |
| Mexican | 17 | 0.6% |
| Norwegian | 157 | 5.2% |
| Polish | 203 | 6.8% |
| Swedish | 29 | 1.0% |
| Swiss | 45 | 1.5% |
| Welsh | 33 | 1.1% | View All 17 Rows |
Immigrants in Lake Wissota
The most numerous immigrant groups reported in Lake Wissota came from , and Canada (19 | 0.6%), together accounting for 0.6% of all Lake Wissota residents.

| Immigration Origin | # Population | % Population |
| Canada | 19 | 0.6% | View All 1 Rows |
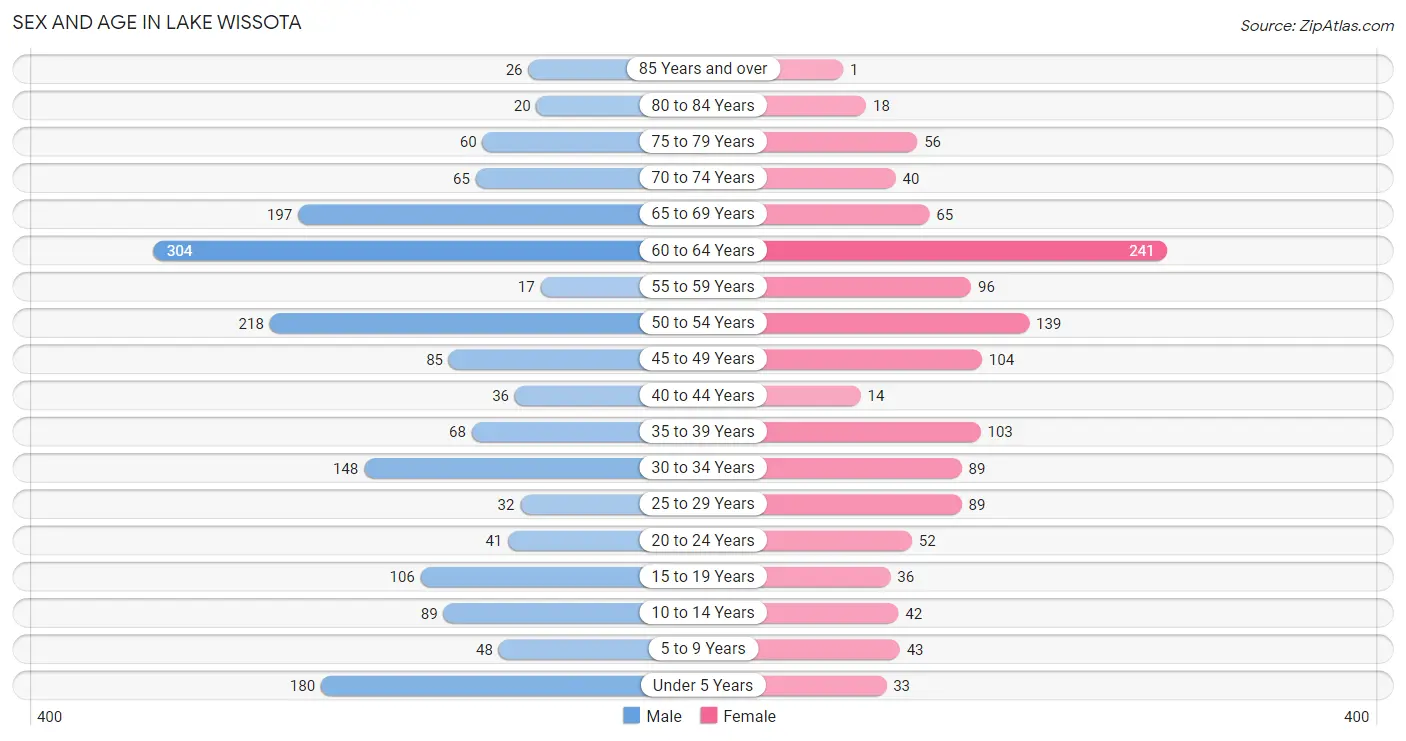
Sex and Age in Lake Wissota
Sex and Age in Lake Wissota
The most populous age groups in Lake Wissota are 60 to 64 Years (304 | 17.5%) for men and 60 to 64 Years (241 | 19.1%) for women.
| Age Bracket | Male | Female |
| Under 5 Years | 180 (10.3%) | 33 (2.6%) |
| 5 to 9 Years | 48 (2.8%) | 43 (3.4%) |
| 10 to 14 Years | 89 (5.1%) | 42 (3.3%) |
| 15 to 19 Years | 106 (6.1%) | 36 (2.9%) |
| 20 to 24 Years | 41 (2.4%) | 52 (4.1%) |
| 25 to 29 Years | 32 (1.8%) | 89 (7.1%) |
| 30 to 34 Years | 148 (8.5%) | 89 (7.1%) |
| 35 to 39 Years | 68 (3.9%) | 103 (8.2%) |
| 40 to 44 Years | 36 (2.1%) | 14 (1.1%) |
| 45 to 49 Years | 85 (4.9%) | 104 (8.3%) |
| 50 to 54 Years | 218 (12.5%) | 139 (11.0%) |
| 55 to 59 Years | 17 (1.0%) | 96 (7.6%) |
| 60 to 64 Years | 304 (17.5%) | 241 (19.1%) |
| 65 to 69 Years | 197 (11.3%) | 65 (5.1%) |
| 70 to 74 Years | 65 (3.7%) | 40 (3.2%) |
| 75 to 79 Years | 60 (3.5%) | 56 (4.4%) |
| 80 to 84 Years | 20 (1.1%) | 18 (1.4%) |
| 85 Years and over | 26 (1.5%) | 1 (0.1%) |
| Total | 1,740 (100.0%) | 1,261 (100.0%) |
Families and Households in Lake Wissota
Median Family Size in Lake Wissota
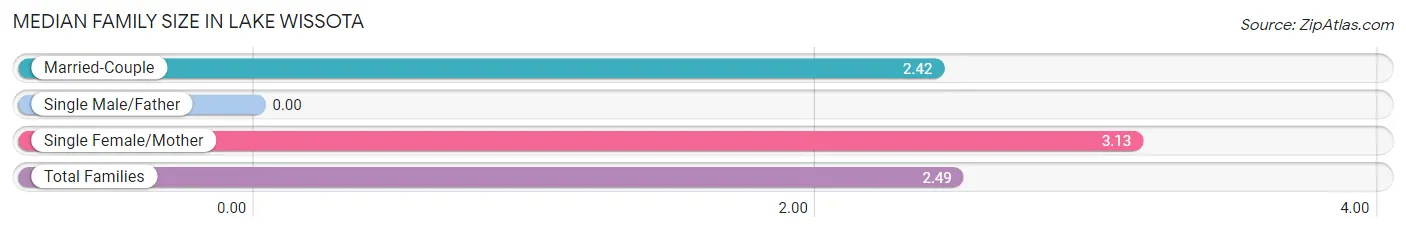
| Family Type | # Families | Family Size |
| Married-Couple | 871 (89.3%) | 2.42 |
| Single Male/Father | 0 (0.0%) | - |
| Single Female/Mother | 104 (10.7%) | 3.13 |
| Total Families | 975 (100.0%) | 2.49 |
Median Household Size in Lake Wissota
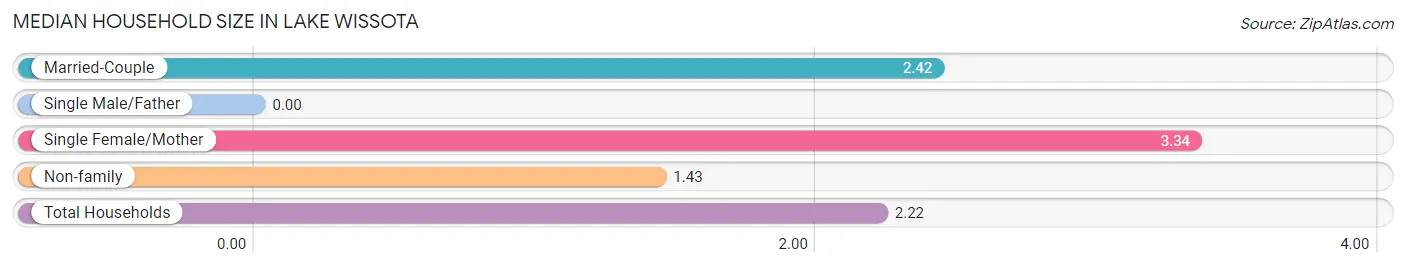
| Household Type | # Households | Household Size |
| Married-Couple | 871 (64.5%) | 2.42 |
| Single Male/Father | 0 (0.0%) | - |
| Single Female/Mother | 104 (7.7%) | 3.34 |
| Non-family | 375 (27.8%) | 1.43 |
| Total Households | 1,350 (100.0%) | 2.22 |
Household Size by Marriage Status in Lake Wissota
Out of a total of 1,350 households in Lake Wissota, 975 (72.2%) are family households, while 375 (27.8%) are nonfamily households. The most numerous type of family households are 2-person households, comprising 698, and the most common type of nonfamily households are 1-person households, comprising 234.
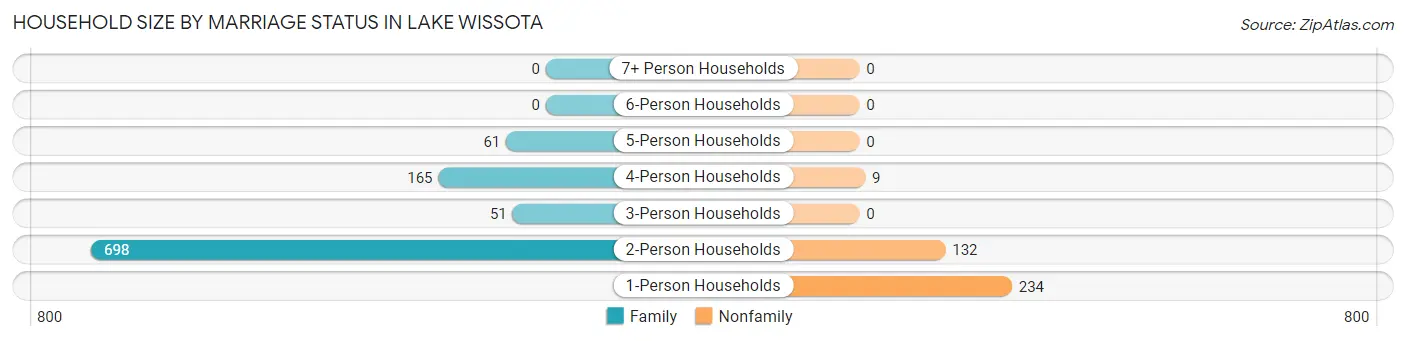
| Household Size | Family Households | Nonfamily Households |
| 1-Person Households | - | 234 (17.3%) |
| 2-Person Households | 698 (51.7%) | 132 (9.8%) |
| 3-Person Households | 51 (3.8%) | 0 (0.0%) |
| 4-Person Households | 165 (12.2%) | 9 (0.7%) |
| 5-Person Households | 61 (4.5%) | 0 (0.0%) |
| 6-Person Households | 0 (0.0%) | 0 (0.0%) |
| 7+ Person Households | 0 (0.0%) | 0 (0.0%) |
| Total | 975 (72.2%) | 375 (27.8%) |
Female Fertility in Lake Wissota
Fertility by Age in Lake Wissota
Average fertility rate in Lake Wissota is 216.0 births per 1,000 women. Women in the age bracket of 20 to 34 years have the highest fertility rate with 504.0 births per 1,000 women. Women in the age bracket of 20 to 34 years acount for 100.0% of all women with births.
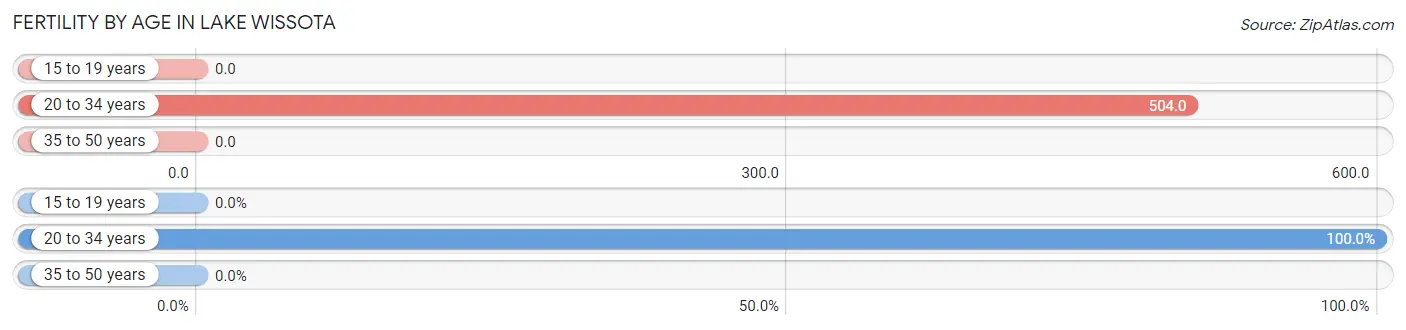
| Age Bracket | Women with Births | Births / 1,000 Women |
| 15 to 19 years | 0 (0.0%) | 0.0 |
| 20 to 34 years | 116 (100.0%) | 504.0 |
| 35 to 50 years | 0 (0.0%) | 0.0 |
| Total | 116 (100.0%) | 216.0 |
Fertility by Age by Marriage Status in Lake Wissota
81.9% of women with births (116) in Lake Wissota are married. The highest percentage of unmarried women with births falls into 20 to 34 years age bracket with 18.1% of them unmarried at the time of birth, while the lowest percentage of unmarried women with births belong to 20 to 34 years age bracket with 18.1% of them unmarried.
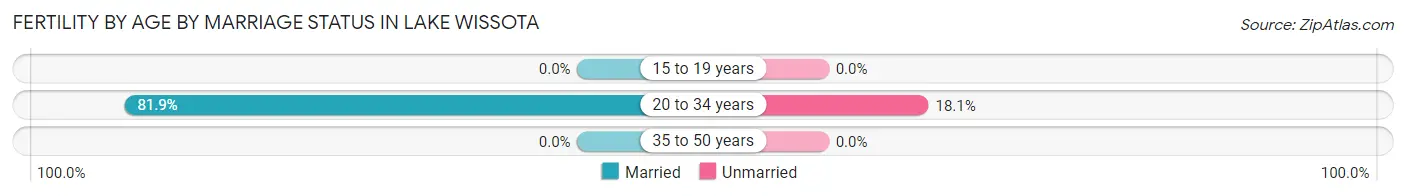
| Age Bracket | Married | Unmarried |
| 15 to 19 years | 0 (0.0%) | 0 (0.0%) |
| 20 to 34 years | 95 (81.9%) | 21 (18.1%) |
| 35 to 50 years | 0 (0.0%) | 0 (0.0%) |
| Total | 95 (81.9%) | 21 (18.1%) |
Fertility by Education in Lake Wissota
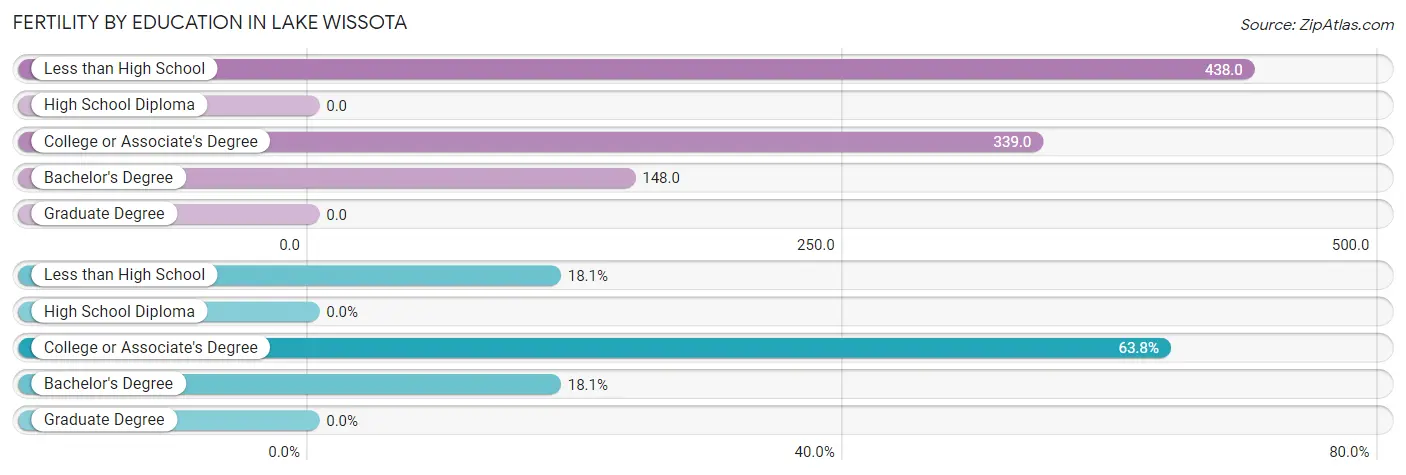
| Educational Attainment | Women with Births | Births / 1,000 Women |
| Less than High School | 21 (18.1%) | 438.0 |
| High School Diploma | 0 (0.0%) | 0.0 |
| College or Associate's Degree | 74 (63.8%) | 339.0 |
| Bachelor's Degree | 21 (18.1%) | 148.0 |
| Graduate Degree | 0 (0.0%) | 0.0 |
| Total | 116 (100.0%) | 216.0 |
Fertility by Education by Marriage Status in Lake Wissota
18.1% of women with births in Lake Wissota are unmarried. Women with the educational attainment of college or associate's degree are most likely to be married with 100.0% of them married at childbirth, while women with the educational attainment of less than high school are least likely to be married with 100.0% of them unmarried at childbirth.
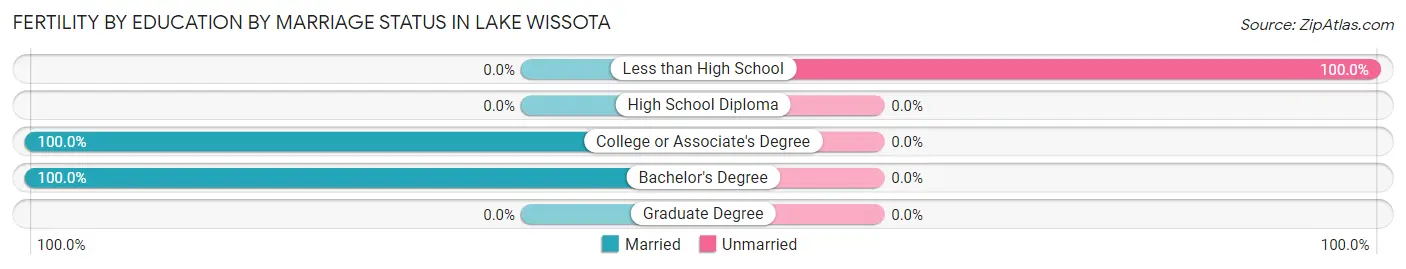
| Educational Attainment | Married | Unmarried |
| Less than High School | 0 (0.0%) | 21 (100.0%) |
| High School Diploma | 0 (0.0%) | 0 (0.0%) |
| College or Associate's Degree | 74 (100.0%) | 0 (0.0%) |
| Bachelor's Degree | 21 (100.0%) | 0 (0.0%) |
| Graduate Degree | 0 (0.0%) | 0 (0.0%) |
| Total | 95 (81.9%) | 21 (18.1%) |
Income in Lake Wissota
Income Overview in Lake Wissota
Per Capita Income in Lake Wissota is $67,221, while median incomes of families and households are $135,804 and $126,667 respectively.
| Characteristic | Number | Measure |
| Per Capita Income | 3,001 | $67,221 |
| Median Family Income | 975 | $135,804 |
| Mean Family Income | 975 | $171,733 |
| Median Household Income | 1,350 | $126,667 |
| Mean Household Income | 1,350 | $154,409 |
| Income Deficit | 975 | $0 |
| Wage / Income Gap (%) | 3,001 | 27.95% |
| Wage / Income Gap ($) | 3,001 | 72.05¢ per $1 |
| Gini / Inequality Index | 3,001 | 0.41 |
Earnings by Sex in Lake Wissota
Average Earnings in Lake Wissota are $57,410, $69,083 for men and $49,773 for women, a difference of 28.0%.
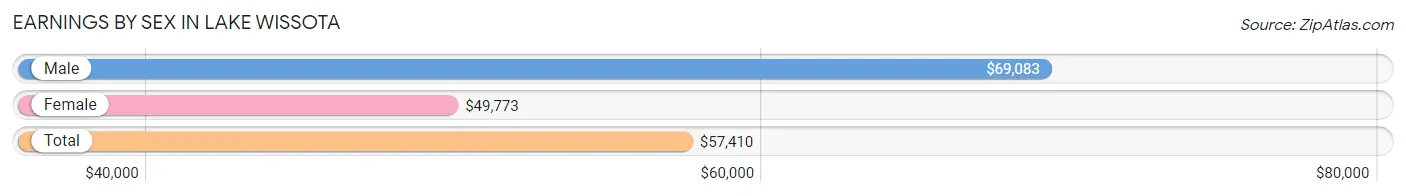
| Sex | Number | Average Earnings |
| Male | 1,017 (56.6%) | $69,083 |
| Female | 780 (43.4%) | $49,773 |
| Total | 1,797 (100.0%) | $57,410 |
Earnings by Sex by Income Bracket in Lake Wissota
The most common earnings brackets in Lake Wissota are $100,000+ for men (266 | 26.2%) and $55,000 to $64,999 for women (150 | 19.2%).
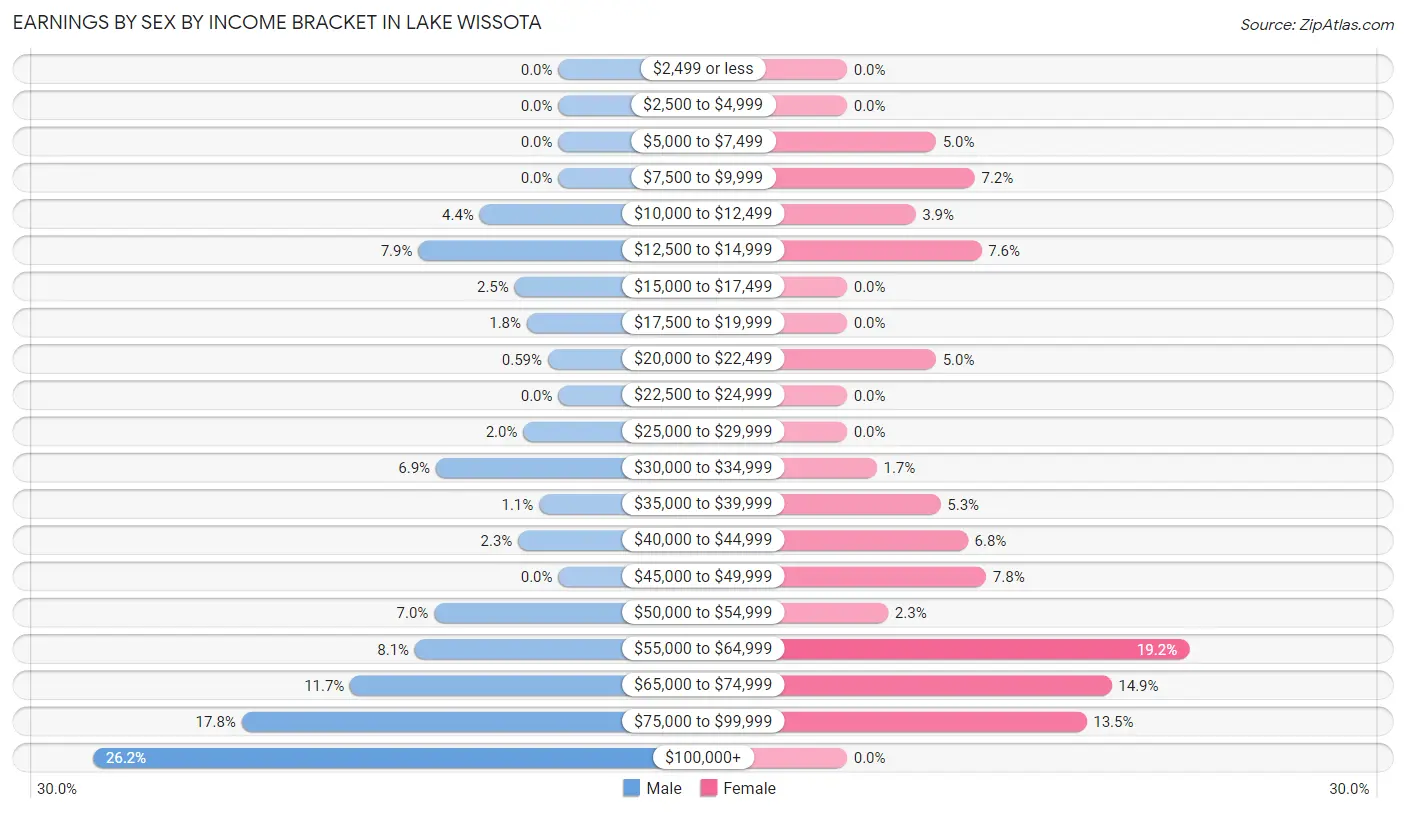
| Income | Male | Female |
| $2,499 or less | 0 (0.0%) | 0 (0.0%) |
| $2,500 to $4,999 | 0 (0.0%) | 0 (0.0%) |
| $5,000 to $7,499 | 0 (0.0%) | 39 (5.0%) |
| $7,500 to $9,999 | 0 (0.0%) | 56 (7.2%) |
| $10,000 to $12,499 | 45 (4.4%) | 30 (3.8%) |
| $12,500 to $14,999 | 80 (7.9%) | 59 (7.6%) |
| $15,000 to $17,499 | 25 (2.5%) | 0 (0.0%) |
| $17,500 to $19,999 | 18 (1.8%) | 0 (0.0%) |
| $20,000 to $22,499 | 6 (0.6%) | 39 (5.0%) |
| $22,500 to $24,999 | 0 (0.0%) | 0 (0.0%) |
| $25,000 to $29,999 | 20 (2.0%) | 0 (0.0%) |
| $30,000 to $34,999 | 70 (6.9%) | 13 (1.7%) |
| $35,000 to $39,999 | 11 (1.1%) | 41 (5.3%) |
| $40,000 to $44,999 | 23 (2.3%) | 53 (6.8%) |
| $45,000 to $49,999 | 0 (0.0%) | 61 (7.8%) |
| $50,000 to $54,999 | 71 (7.0%) | 18 (2.3%) |
| $55,000 to $64,999 | 82 (8.1%) | 150 (19.2%) |
| $65,000 to $74,999 | 119 (11.7%) | 116 (14.9%) |
| $75,000 to $99,999 | 181 (17.8%) | 105 (13.5%) |
| $100,000+ | 266 (26.2%) | 0 (0.0%) |
| Total | 1,017 (100.0%) | 780 (100.0%) |
Earnings by Sex by Educational Attainment in Lake Wissota
Average earnings in Lake Wissota are $75,078 for men and $55,469 for women, a difference of 26.1%. Men with an educational attainment of bachelor's degree enjoy the highest average annual earnings of $247,726, while those with graduate degree education earn the least with $30,558. Women with an educational attainment of bachelor's degree earn the most with the average annual earnings of $65,389, while those with high school diploma education have the smallest earnings of $40,735.
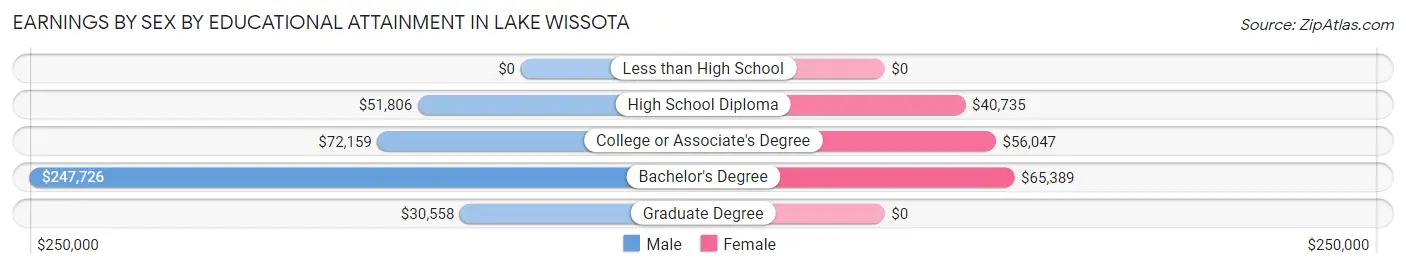
| Educational Attainment | Male Income | Female Income |
| Less than High School | - | - |
| High School Diploma | $51,806 | $40,735 |
| College or Associate's Degree | $72,159 | $56,047 |
| Bachelor's Degree | $247,726 | $65,389 |
| Graduate Degree | $30,558 | $0 |
| Total | $75,078 | $55,469 |
Family Income in Lake Wissota
Family Income Brackets in Lake Wissota
According to the Lake Wissota family income data, there are 292 families falling into the $200,000+ income range, which is the most common income bracket and makes up 29.9% of all families.
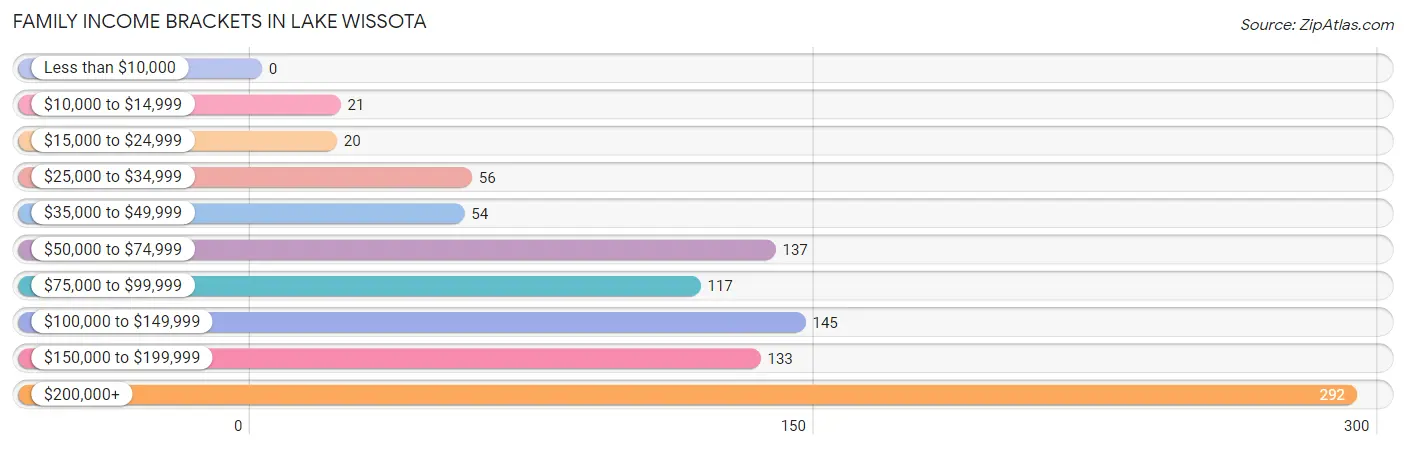
| Income Bracket | # Families | % Families |
| Less than $10,000 | 0 | 0.0% |
| $10,000 to $14,999 | 21 | 2.2% |
| $15,000 to $24,999 | 20 | 2.1% |
| $25,000 to $34,999 | 56 | 5.7% |
| $35,000 to $49,999 | 54 | 5.5% |
| $50,000 to $74,999 | 137 | 14.1% |
| $75,000 to $99,999 | 117 | 12.0% |
| $100,000 to $149,999 | 145 | 14.9% |
| $150,000 to $199,999 | 133 | 13.6% |
| $200,000+ | 292 | 29.9% |
Family Income by Famaliy Size in Lake Wissota
2-person families (698 | 71.6%) account for the highest median family income in Lake Wissota with $160,389 per family, while 2-person families (698 | 71.6%) have the highest median income of $80,194 per family member.
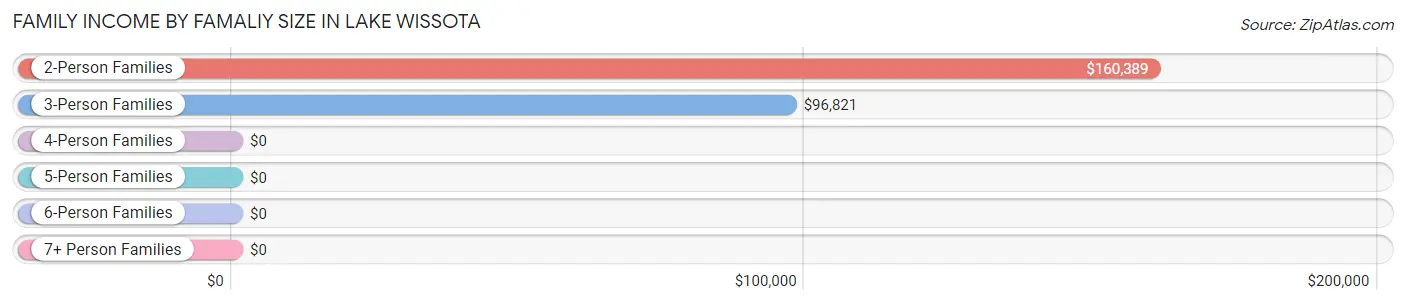
| Income Bracket | # Families | Median Income |
| 2-Person Families | 698 (71.6%) | $160,389 |
| 3-Person Families | 51 (5.2%) | $96,821 |
| 4-Person Families | 186 (19.1%) | $0 |
| 5-Person Families | 40 (4.1%) | $0 |
| 6-Person Families | 0 (0.0%) | $0 |
| 7+ Person Families | 0 (0.0%) | $0 |
| Total | 975 (100.0%) | $135,804 |
Family Income by Number of Earners in Lake Wissota
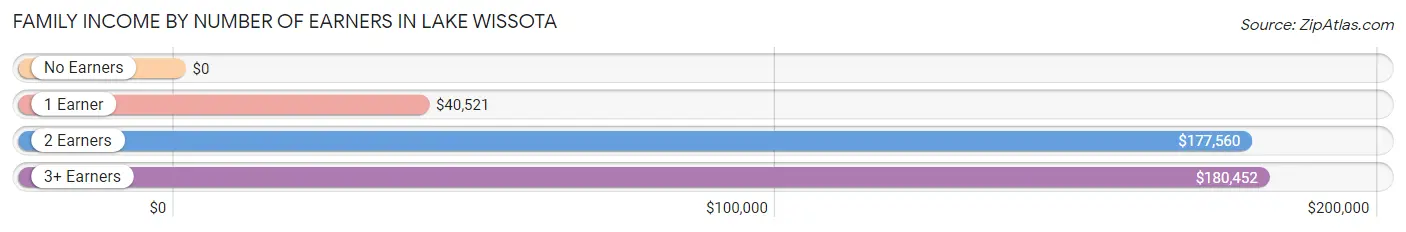
| Number of Earners | # Families | Median Income |
| No Earners | 274 (28.1%) | $0 |
| 1 Earner | 159 (16.3%) | $40,521 |
| 2 Earners | 465 (47.7%) | $177,560 |
| 3+ Earners | 77 (7.9%) | $180,452 |
| Total | 975 (100.0%) | $135,804 |
Household Income in Lake Wissota
Household Income Brackets in Lake Wissota
With 321 households falling in the category, the $200,000+ income range is the most frequent in Lake Wissota, accounting for 23.8% of all households.
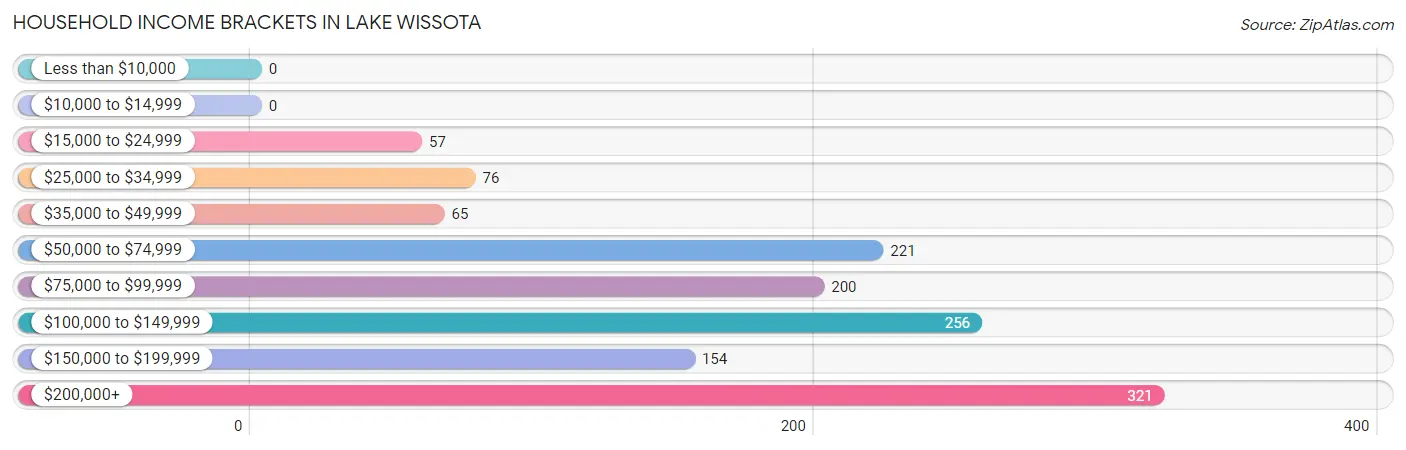
| Income Bracket | # Households | % Households |
| Less than $10,000 | 0 | 0.0% |
| $10,000 to $14,999 | 0 | 0.0% |
| $15,000 to $24,999 | 57 | 4.2% |
| $25,000 to $34,999 | 76 | 5.6% |
| $35,000 to $49,999 | 65 | 4.8% |
| $50,000 to $74,999 | 221 | 16.4% |
| $75,000 to $99,999 | 200 | 14.8% |
| $100,000 to $149,999 | 256 | 19.0% |
| $150,000 to $199,999 | 154 | 11.4% |
| $200,000+ | 321 | 23.8% |
Household Income by Householder Age in Lake Wissota
The median household income in Lake Wissota is $126,667, with the highest median household income of $144,102 found in the 45 to 64 years age bracket for the primary householder. A total of 653 households (48.4%) fall into this category. Meanwhile, the 15 to 24 years age bracket for the primary householder has the lowest median household income of $0, with 19 households (1.4%) in this group.
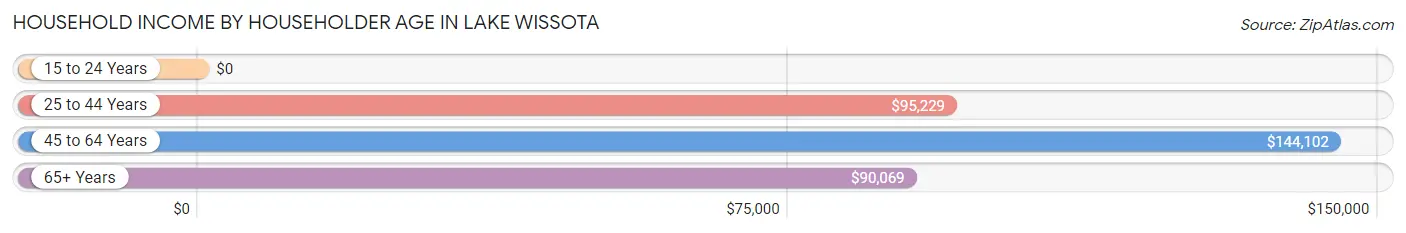
| Income Bracket | # Households | Median Income |
| 15 to 24 Years | 19 (1.4%) | $0 |
| 25 to 44 Years | 335 (24.8%) | $95,229 |
| 45 to 64 Years | 653 (48.4%) | $144,102 |
| 65+ Years | 343 (25.4%) | $90,069 |
| Total | 1,350 (100.0%) | $126,667 |
Poverty in Lake Wissota
Income Below Poverty by Sex and Age in Lake Wissota
With 3.8% poverty level for males and 4.7% for females among the residents of Lake Wissota, 18 to 24 year old males and 15 year old females are the most vulnerable to poverty, with 41 males (40.2%) and 20 females (100.0%) in their respective age groups living below the poverty level.
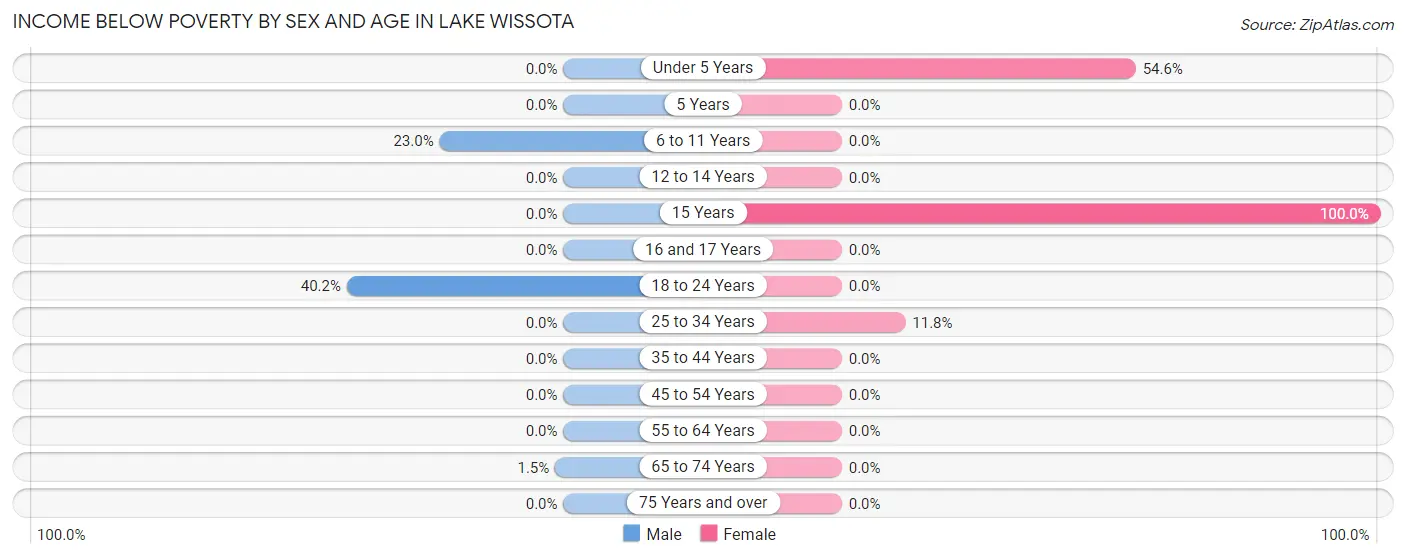
| Age Bracket | Male | Female |
| Under 5 Years | 0 (0.0%) | 18 (54.5%) |
| 5 Years | 0 (0.0%) | 0 (0.0%) |
| 6 to 11 Years | 20 (23.0%) | 0 (0.0%) |
| 12 to 14 Years | 0 (0.0%) | 0 (0.0%) |
| 15 Years | 0 (0.0%) | 20 (100.0%) |
| 16 and 17 Years | 0 (0.0%) | 0 (0.0%) |
| 18 to 24 Years | 41 (40.2%) | 0 (0.0%) |
| 25 to 34 Years | 0 (0.0%) | 21 (11.8%) |
| 35 to 44 Years | 0 (0.0%) | 0 (0.0%) |
| 45 to 54 Years | 0 (0.0%) | 0 (0.0%) |
| 55 to 64 Years | 0 (0.0%) | 0 (0.0%) |
| 65 to 74 Years | 4 (1.5%) | 0 (0.0%) |
| 75 Years and over | 0 (0.0%) | 0 (0.0%) |
| Total | 65 (3.8%) | 59 (4.7%) |
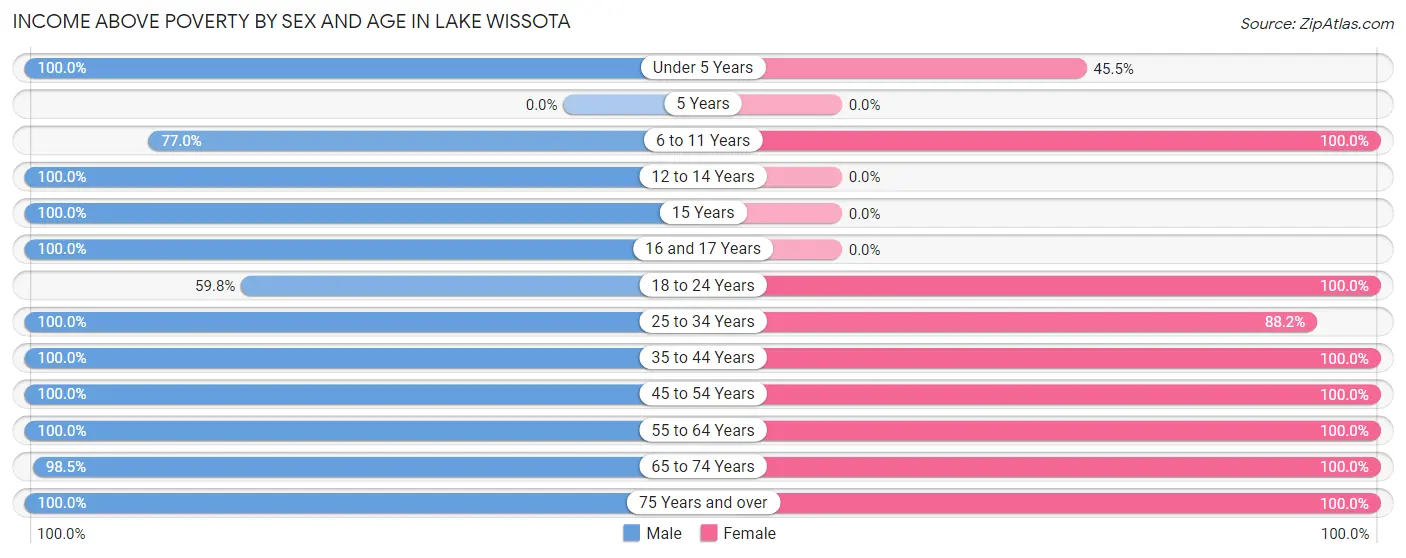
Income Above Poverty by Sex and Age in Lake Wissota
According to the poverty statistics in Lake Wissota, males aged under 5 years and females aged 6 to 11 years are the age groups that are most secure financially, with 100.0% of males and 100.0% of females in these age groups living above the poverty line.
| Age Bracket | Male | Female |
| Under 5 Years | 169 (100.0%) | 15 (45.5%) |
| 5 Years | 0 (0.0%) | 0 (0.0%) |
| 6 to 11 Years | 67 (77.0%) | 85 (100.0%) |
| 12 to 14 Years | 38 (100.0%) | 0 (0.0%) |
| 15 Years | 22 (100.0%) | 0 (0.0%) |
| 16 and 17 Years | 23 (100.0%) | 0 (0.0%) |
| 18 to 24 Years | 61 (59.8%) | 68 (100.0%) |
| 25 to 34 Years | 180 (100.0%) | 157 (88.2%) |
| 35 to 44 Years | 104 (100.0%) | 117 (100.0%) |
| 45 to 54 Years | 303 (100.0%) | 243 (100.0%) |
| 55 to 64 Years | 321 (100.0%) | 337 (100.0%) |
| 65 to 74 Years | 258 (98.5%) | 105 (100.0%) |
| 75 Years and over | 106 (100.0%) | 75 (100.0%) |
| Total | 1,652 (96.2%) | 1,202 (95.3%) |
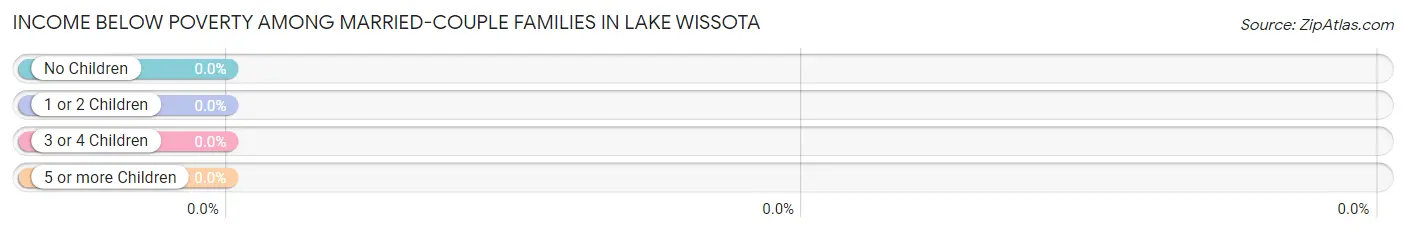
Income Below Poverty Among Married-Couple Families in Lake Wissota
| Children | Above Poverty | Below Poverty |
| No Children | 663 (100.0%) | 0 (0.0%) |
| 1 or 2 Children | 183 (100.0%) | 0 (0.0%) |
| 3 or 4 Children | 25 (100.0%) | 0 (0.0%) |
| 5 or more Children | 0 (0.0%) | 0 (0.0%) |
| Total | 871 (100.0%) | 0 (0.0%) |
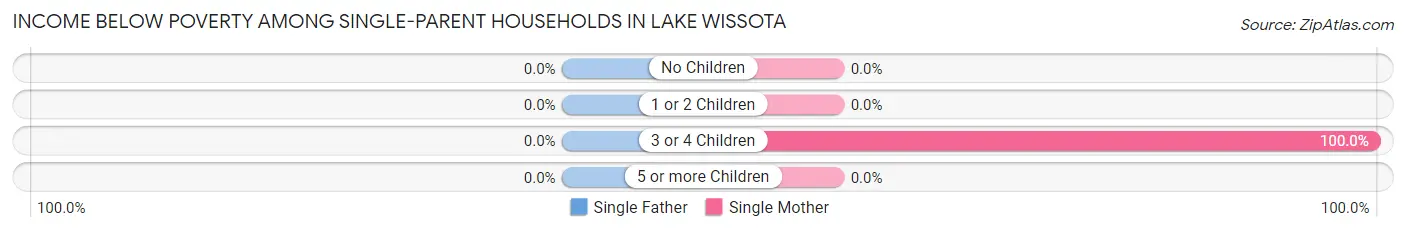
Income Below Poverty Among Single-Parent Households in Lake Wissota
| Children | Single Father | Single Mother |
| No Children | 0 (0.0%) | 0 (0.0%) |
| 1 or 2 Children | 0 (0.0%) | 0 (0.0%) |
| 3 or 4 Children | 0 (0.0%) | 21 (100.0%) |
| 5 or more Children | 0 (0.0%) | 0 (0.0%) |
| Total | 0 (0.0%) | 21 (20.2%) |
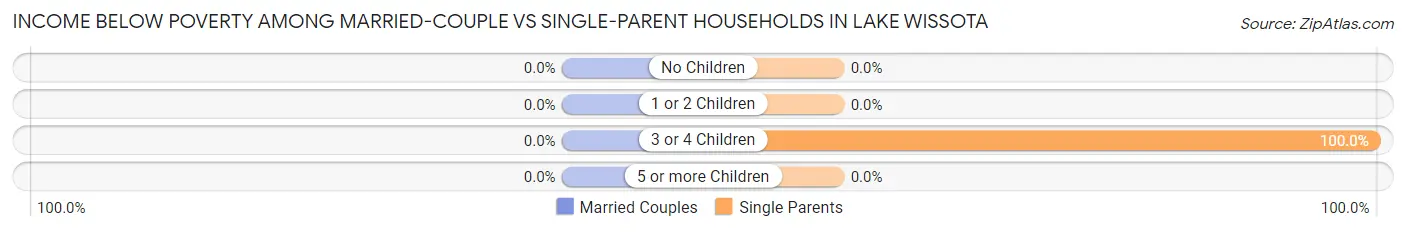
Income Below Poverty Among Married-Couple vs Single-Parent Households in Lake Wissota
| Children | Married-Couple Families | Single-Parent Households |
| No Children | 0 (0.0%) | 0 (0.0%) |
| 1 or 2 Children | 0 (0.0%) | 0 (0.0%) |
| 3 or 4 Children | 0 (0.0%) | 21 (100.0%) |
| 5 or more Children | 0 (0.0%) | 0 (0.0%) |
| Total | 0 (0.0%) | 21 (20.2%) |
Employment Characteristics in Lake Wissota
Employment by Class of Employer in Lake Wissota
Among the 1,629 employed individuals in Lake Wissota, private company employees (1,040 | 63.8%), self-employed (incorporated) (298 | 18.3%), and local government employees (120 | 7.4%) make up the most common classes of employment.
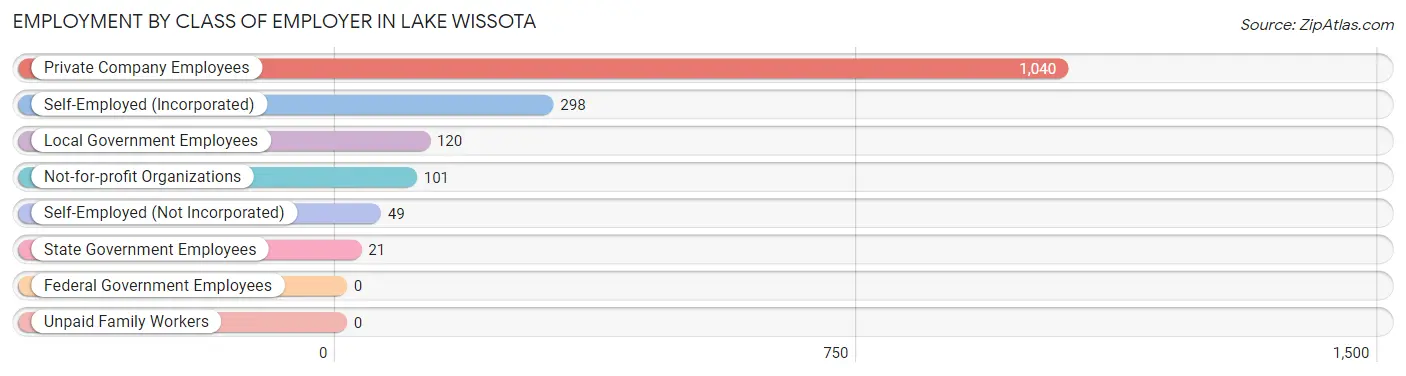
| Employer Class | # Employees | % Employees |
| Private Company Employees | 1,040 | 63.8% |
| Self-Employed (Incorporated) | 298 | 18.3% |
| Self-Employed (Not Incorporated) | 49 | 3.0% |
| Not-for-profit Organizations | 101 | 6.2% |
| Local Government Employees | 120 | 7.4% |
| State Government Employees | 21 | 1.3% |
| Federal Government Employees | 0 | 0.0% |
| Unpaid Family Workers | 0 | 0.0% |
| Total | 1,629 | 100.0% |
Employment Status by Age in Lake Wissota
According to the labor force statistics for Lake Wissota, out of the total population over 16 years of age (2,524), 68.9% or 1,739 individuals are in the labor force, with 6.3% or 110 of them unemployed. The age group with the highest labor force participation rate is 16 to 19 years, with 100.0% or 100 individuals in the labor force. Within the labor force, the 60 to 64 years age range has the highest percentage of unemployed individuals, with 36.8% or 109 of them being unemployed.
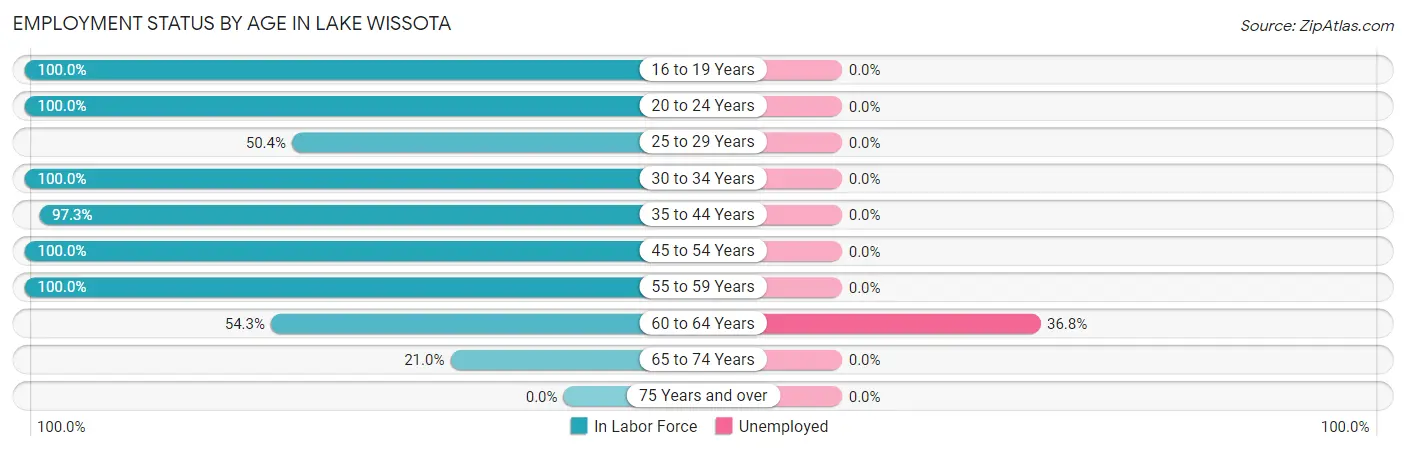
| Age Bracket | In Labor Force | Unemployed |
| 16 to 19 Years | 100 (100.0%) | 0 (0.0%) |
| 20 to 24 Years | 93 (100.0%) | 0 (0.0%) |
| 25 to 29 Years | 61 (50.4%) | 0 (0.0%) |
| 30 to 34 Years | 237 (100.0%) | 0 (0.0%) |
| 35 to 44 Years | 215 (97.3%) | 0 (0.0%) |
| 45 to 54 Years | 546 (100.0%) | 0 (0.0%) |
| 55 to 59 Years | 113 (100.0%) | 0 (0.0%) |
| 60 to 64 Years | 296 (54.3%) | 109 (36.8%) |
| 65 to 74 Years | 77 (21.0%) | 0 (0.0%) |
| 75 Years and over | 0 (0.0%) | 0 (0.0%) |
| Total | 1,739 (68.9%) | 110 (6.3%) |
Employment Status by Educational Attainment in Lake Wissota
According to labor force statistics for Lake Wissota, 82.3% of individuals (1,467) out of the total population between 25 and 64 years of age (1,783) are in the labor force, with 7.4% or 109 of them being unemployed. The group with the highest labor force participation rate are those with the educational attainment of less than high school, with 100.0% or 28 individuals in the labor force. Within the labor force, individuals with college / associate degree education have the highest percentage of unemployment, with 16.7% or 96 of them being unemployed.
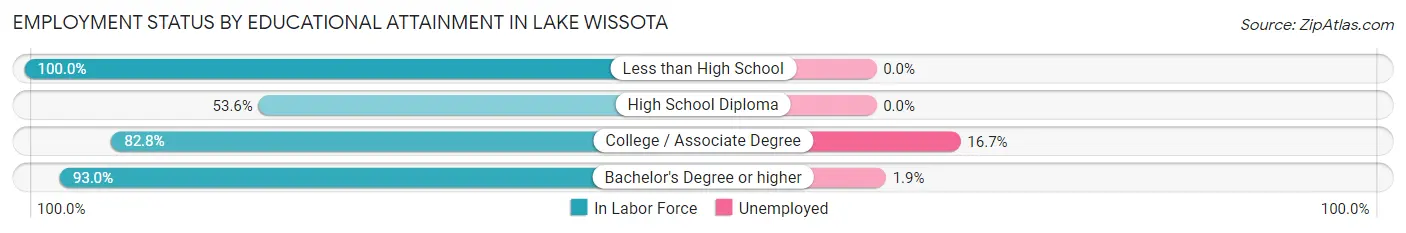
| Educational Attainment | In Labor Force | Unemployed |
| Less than High School | 28 (100.0%) | 0 (0.0%) |
| High School Diploma | 164 (53.6%) | 0 (0.0%) |
| College / Associate Degree | 576 (82.8%) | 116 (16.7%) |
| Bachelor's Degree or higher | 700 (93.0%) | 14 (1.9%) |
| Total | 1,467 (82.3%) | 132 (7.4%) |
Employment Occupations by Sex in Lake Wissota
Management, Business, Science and Arts Occupations
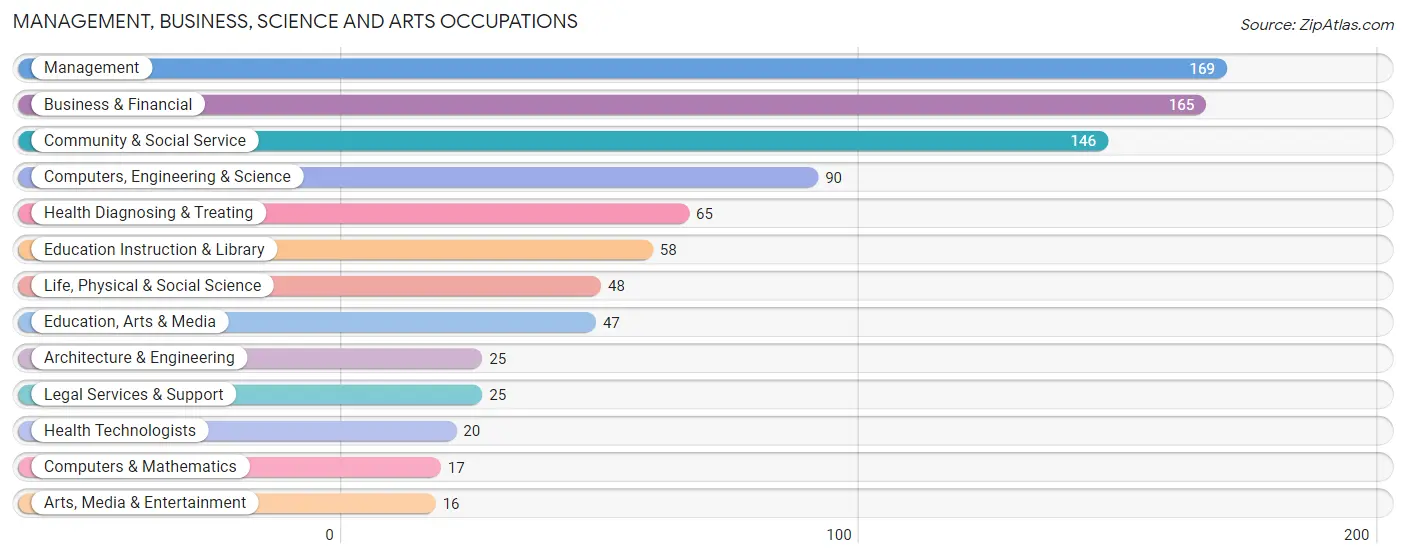
The most common Management, Business, Science and Arts occupations in Lake Wissota are Management (169 | 10.4%), Business & Financial (165 | 10.1%), Community & Social Service (146 | 9.0%), Computers, Engineering & Science (90 | 5.5%), and Health Diagnosing & Treating (65 | 4.0%).
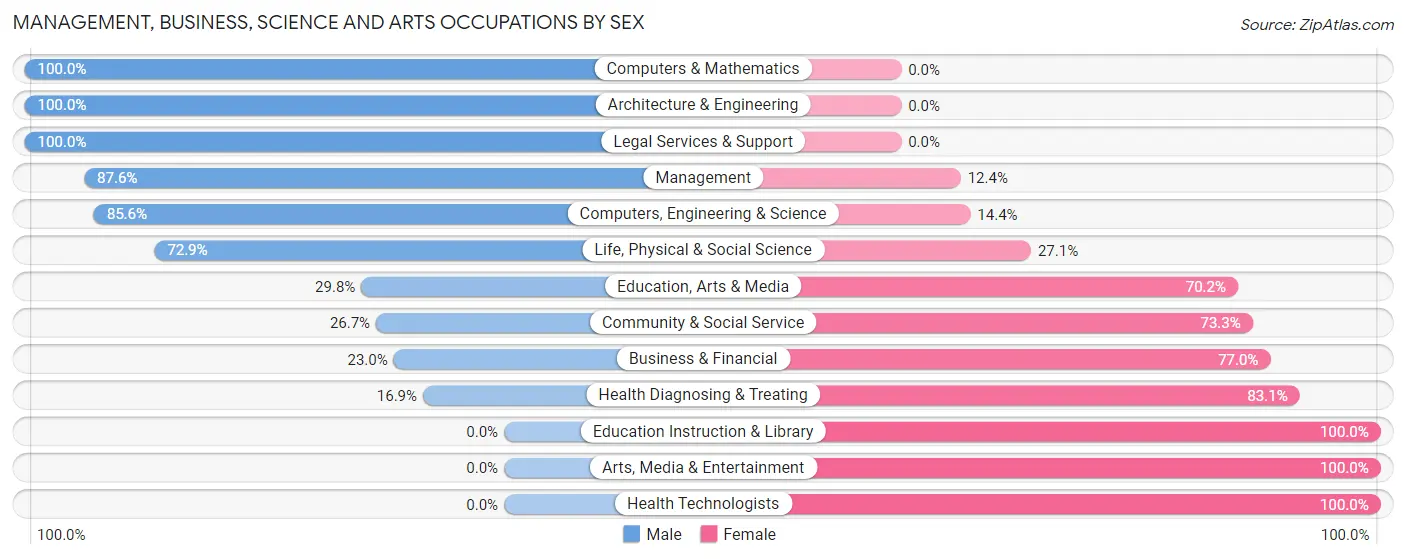
Management, Business, Science and Arts Occupations by Sex
Within the Management, Business, Science and Arts occupations in Lake Wissota, the most male-oriented occupations are Computers & Mathematics (100.0%), Architecture & Engineering (100.0%), and Legal Services & Support (100.0%), while the most female-oriented occupations are Education Instruction & Library (100.0%), Arts, Media & Entertainment (100.0%), and Health Technologists (100.0%).
| Occupation | Male | Female |
| Management | 148 (87.6%) | 21 (12.4%) |
| Business & Financial | 38 (23.0%) | 127 (77.0%) |
| Computers, Engineering & Science | 77 (85.6%) | 13 (14.4%) |
| Computers & Mathematics | 17 (100.0%) | 0 (0.0%) |
| Architecture & Engineering | 25 (100.0%) | 0 (0.0%) |
| Life, Physical & Social Science | 35 (72.9%) | 13 (27.1%) |
| Community & Social Service | 39 (26.7%) | 107 (73.3%) |
| Education, Arts & Media | 14 (29.8%) | 33 (70.2%) |
| Legal Services & Support | 25 (100.0%) | 0 (0.0%) |
| Education Instruction & Library | 0 (0.0%) | 58 (100.0%) |
| Arts, Media & Entertainment | 0 (0.0%) | 16 (100.0%) |
| Health Diagnosing & Treating | 11 (16.9%) | 54 (83.1%) |
| Health Technologists | 0 (0.0%) | 20 (100.0%) |
| Total (Category) | 313 (49.3%) | 322 (50.7%) |
| Total (Overall) | 891 (54.7%) | 738 (45.3%) |
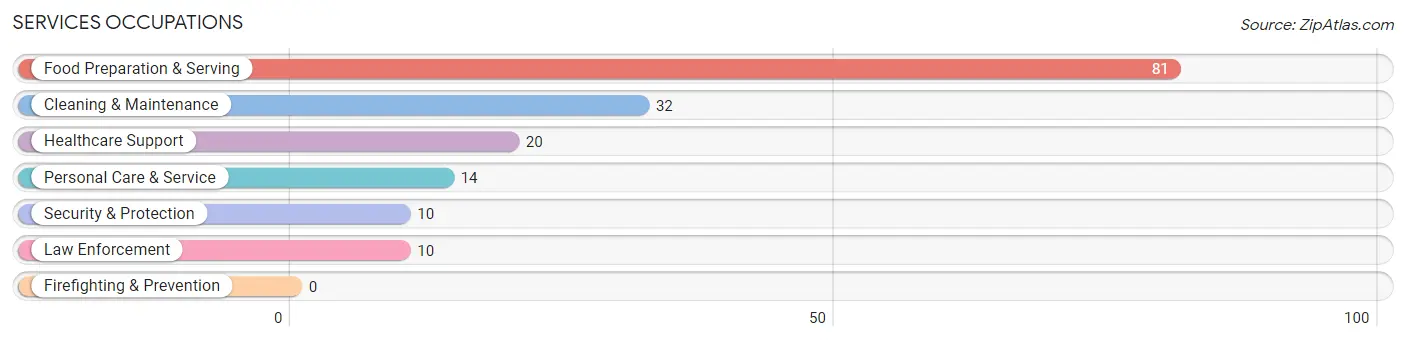
Services Occupations
The most common Services occupations in Lake Wissota are Food Preparation & Serving (81 | 5.0%), Cleaning & Maintenance (32 | 2.0%), Healthcare Support (20 | 1.2%), Personal Care & Service (14 | 0.9%), and Security & Protection (10 | 0.6%).
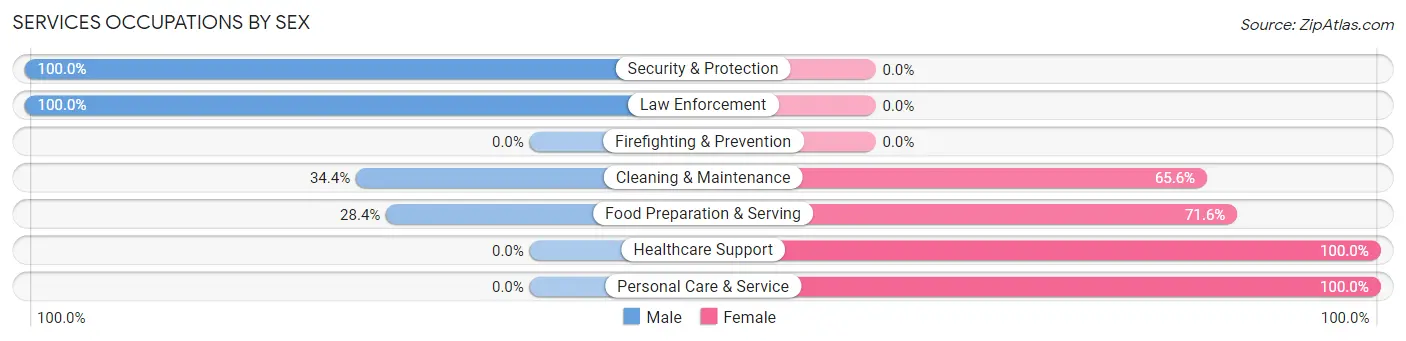
Services Occupations by Sex
Within the Services occupations in Lake Wissota, the most male-oriented occupations are Security & Protection (100.0%), Law Enforcement (100.0%), and Cleaning & Maintenance (34.4%), while the most female-oriented occupations are Healthcare Support (100.0%), Personal Care & Service (100.0%), and Food Preparation & Serving (71.6%).
| Occupation | Male | Female |
| Healthcare Support | 0 (0.0%) | 20 (100.0%) |
| Security & Protection | 10 (100.0%) | 0 (0.0%) |
| Firefighting & Prevention | 0 (0.0%) | 0 (0.0%) |
| Law Enforcement | 10 (100.0%) | 0 (0.0%) |
| Food Preparation & Serving | 23 (28.4%) | 58 (71.6%) |
| Cleaning & Maintenance | 11 (34.4%) | 21 (65.6%) |
| Personal Care & Service | 0 (0.0%) | 14 (100.0%) |
| Total (Category) | 44 (28.0%) | 113 (72.0%) |
| Total (Overall) | 891 (54.7%) | 738 (45.3%) |
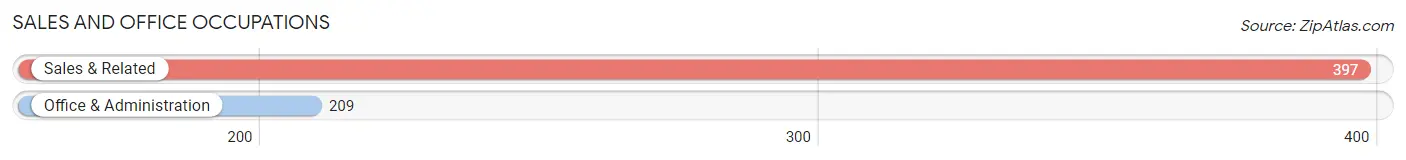
Sales and Office Occupations
The most common Sales and Office occupations in Lake Wissota are Sales & Related (397 | 24.4%), and Office & Administration (209 | 12.8%).
Sales and Office Occupations by Sex
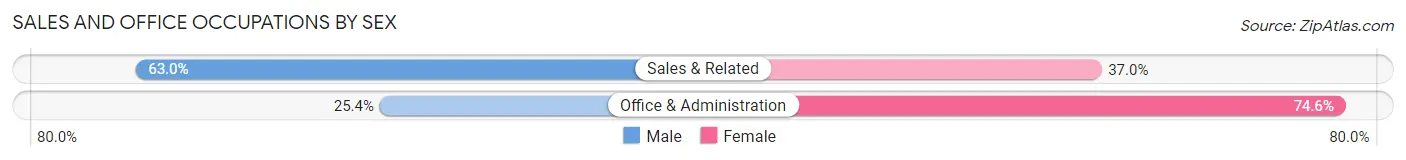
| Occupation | Male | Female |
| Sales & Related | 250 (63.0%) | 147 (37.0%) |
| Office & Administration | 53 (25.4%) | 156 (74.6%) |
| Total (Category) | 303 (50.0%) | 303 (50.0%) |
| Total (Overall) | 891 (54.7%) | 738 (45.3%) |
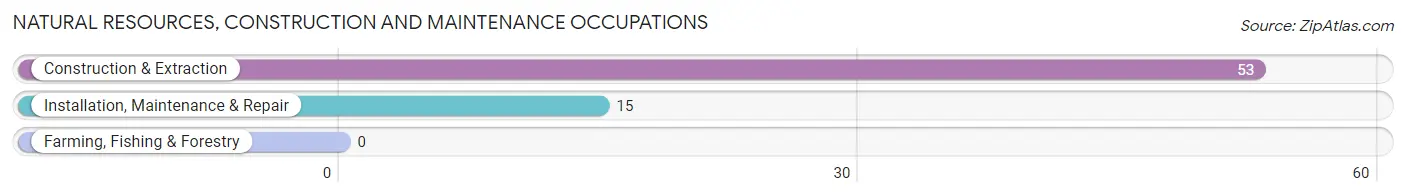
Natural Resources, Construction and Maintenance Occupations
The most common Natural Resources, Construction and Maintenance occupations in Lake Wissota are Construction & Extraction (53 | 3.3%), and Installation, Maintenance & Repair (15 | 0.9%).
Natural Resources, Construction and Maintenance Occupations by Sex
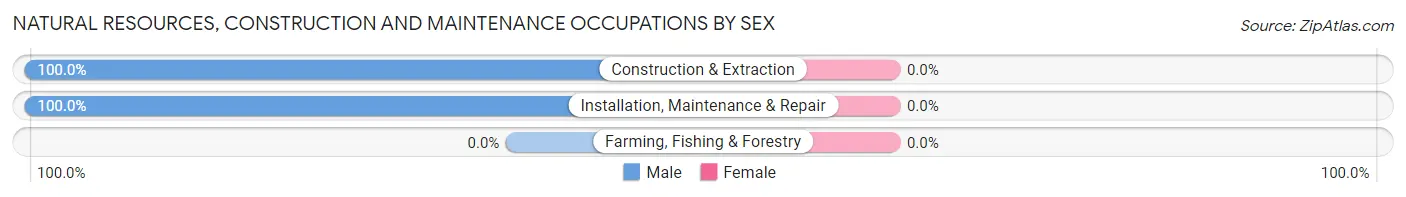
| Occupation | Male | Female |
| Farming, Fishing & Forestry | 0 (0.0%) | 0 (0.0%) |
| Construction & Extraction | 53 (100.0%) | 0 (0.0%) |
| Installation, Maintenance & Repair | 15 (100.0%) | 0 (0.0%) |
| Total (Category) | 68 (100.0%) | 0 (0.0%) |
| Total (Overall) | 891 (54.7%) | 738 (45.3%) |
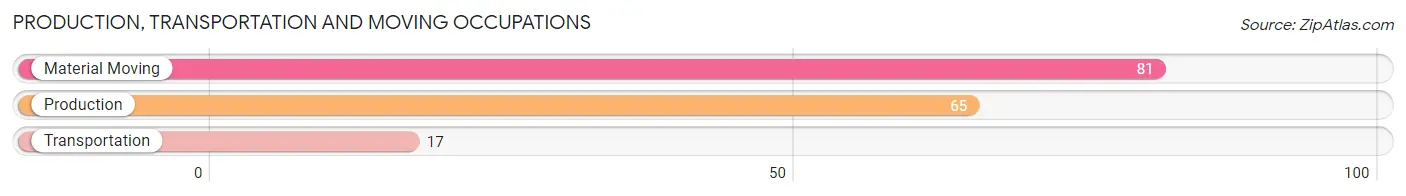
Production, Transportation and Moving Occupations
The most common Production, Transportation and Moving occupations in Lake Wissota are Material Moving (81 | 5.0%), Production (65 | 4.0%), and Transportation (17 | 1.0%).
Production, Transportation and Moving Occupations by Sex
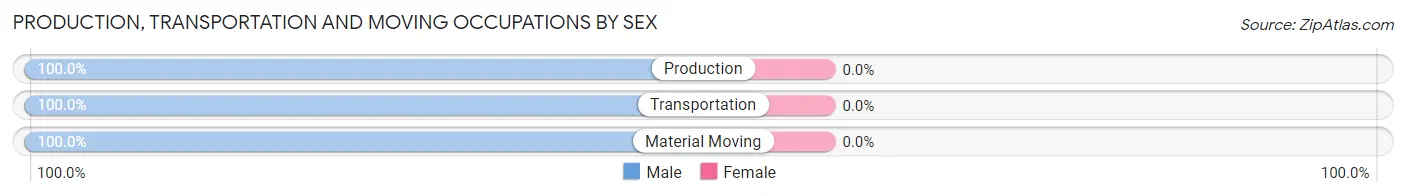
| Occupation | Male | Female |
| Production | 65 (100.0%) | 0 (0.0%) |
| Transportation | 17 (100.0%) | 0 (0.0%) |
| Material Moving | 81 (100.0%) | 0 (0.0%) |
| Total (Category) | 163 (100.0%) | 0 (0.0%) |
| Total (Overall) | 891 (54.7%) | 738 (45.3%) |
Employment Industries by Sex in Lake Wissota
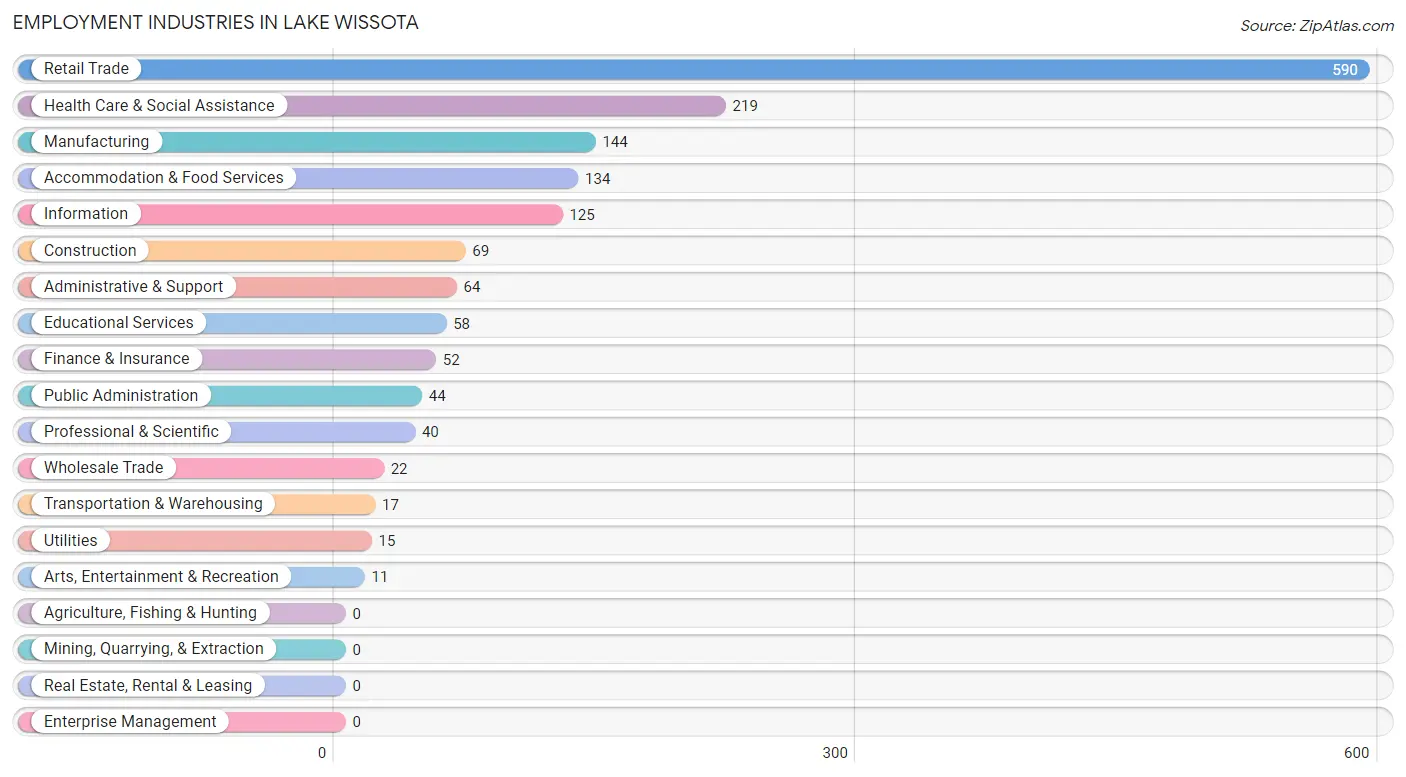
Employment Industries in Lake Wissota
The major employment industries in Lake Wissota include Retail Trade (590 | 36.2%), Health Care & Social Assistance (219 | 13.4%), Manufacturing (144 | 8.8%), Accommodation & Food Services (134 | 8.2%), and Information (125 | 7.7%).
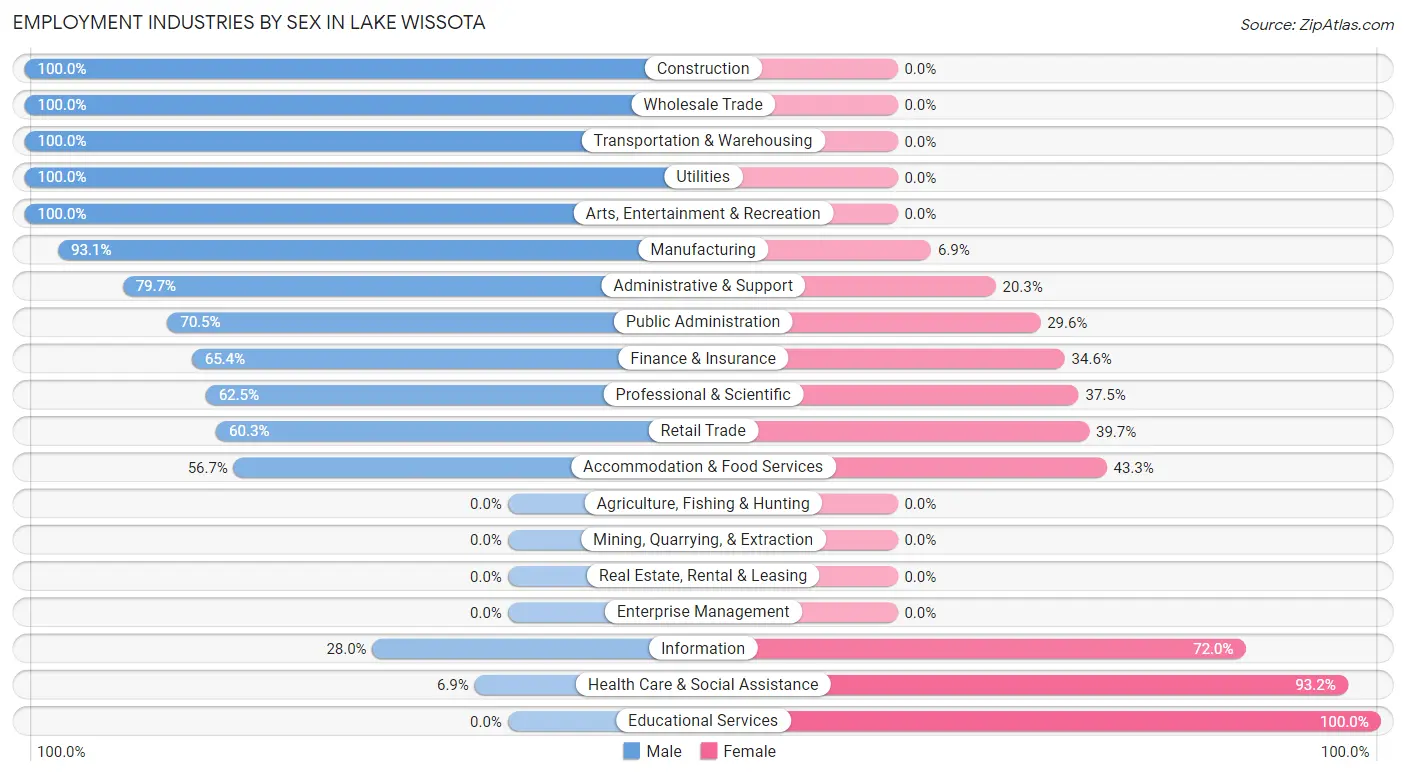
Employment Industries by Sex in Lake Wissota
The Lake Wissota industries that see more men than women are Construction (100.0%), Wholesale Trade (100.0%), and Transportation & Warehousing (100.0%), whereas the industries that tend to have a higher number of women are Educational Services (100.0%), Health Care & Social Assistance (93.1%), and Information (72.0%).
| Industry | Male | Female |
| Agriculture, Fishing & Hunting | 0 (0.0%) | 0 (0.0%) |
| Mining, Quarrying, & Extraction | 0 (0.0%) | 0 (0.0%) |
| Construction | 69 (100.0%) | 0 (0.0%) |
| Manufacturing | 134 (93.1%) | 10 (6.9%) |
| Wholesale Trade | 22 (100.0%) | 0 (0.0%) |
| Retail Trade | 356 (60.3%) | 234 (39.7%) |
| Transportation & Warehousing | 17 (100.0%) | 0 (0.0%) |
| Utilities | 15 (100.0%) | 0 (0.0%) |
| Information | 35 (28.0%) | 90 (72.0%) |
| Finance & Insurance | 34 (65.4%) | 18 (34.6%) |
| Real Estate, Rental & Leasing | 0 (0.0%) | 0 (0.0%) |
| Professional & Scientific | 25 (62.5%) | 15 (37.5%) |
| Enterprise Management | 0 (0.0%) | 0 (0.0%) |
| Administrative & Support | 51 (79.7%) | 13 (20.3%) |
| Educational Services | 0 (0.0%) | 58 (100.0%) |
| Health Care & Social Assistance | 15 (6.9%) | 204 (93.1%) |
| Arts, Entertainment & Recreation | 11 (100.0%) | 0 (0.0%) |
| Accommodation & Food Services | 76 (56.7%) | 58 (43.3%) |
| Public Administration | 31 (70.5%) | 13 (29.5%) |
| Total | 891 (54.7%) | 738 (45.3%) |
Education in Lake Wissota
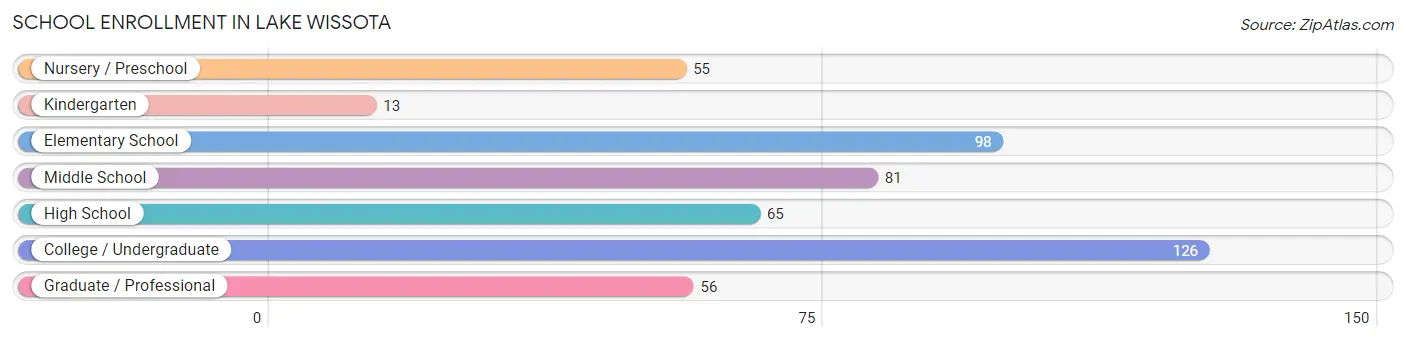
School Enrollment in Lake Wissota
The most common levels of schooling among the 494 students in Lake Wissota are college / undergraduate (126 | 25.5%), elementary school (98 | 19.8%), and middle school (81 | 16.4%).
| School Level | # Students | % Students |
| Nursery / Preschool | 55 | 11.1% |
| Kindergarten | 13 | 2.6% |
| Elementary School | 98 | 19.8% |
| Middle School | 81 | 16.4% |
| High School | 65 | 13.2% |
| College / Undergraduate | 126 | 25.5% |
| Graduate / Professional | 56 | 11.3% |
| Total | 494 | 100.0% |
School Enrollment by Age by Funding Source in Lake Wissota
Out of a total of 494 students who are enrolled in schools in Lake Wissota, 46 (9.3%) attend a private institution, while the remaining 448 (90.7%) are enrolled in public schools. The age group of 3 to 4 year olds has the highest likelihood of being enrolled in private schools, with 46 (83.6% in the age bracket) enrolled. Conversely, the age group of 5 to 9 year old has the lowest likelihood of being enrolled in a private school, with 91 (100.0% in the age bracket) attending a public institution.
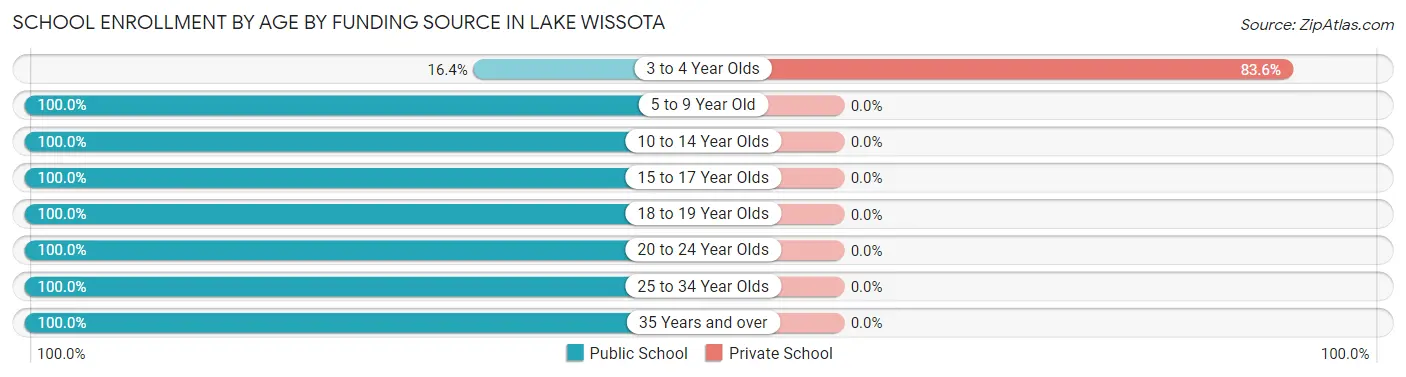
| Age Bracket | Public School | Private School |
| 3 to 4 Year Olds | 9 (16.4%) | 46 (83.6%) |
| 5 to 9 Year Old | 91 (100.0%) | 0 (0.0%) |
| 10 to 14 Year Olds | 101 (100.0%) | 0 (0.0%) |
| 15 to 17 Year Olds | 65 (100.0%) | 0 (0.0%) |
| 18 to 19 Year Olds | 61 (100.0%) | 0 (0.0%) |
| 20 to 24 Year Olds | 52 (100.0%) | 0 (0.0%) |
| 25 to 34 Year Olds | 56 (100.0%) | 0 (0.0%) |
| 35 Years and over | 13 (100.0%) | 0 (0.0%) |
| Total | 448 (90.7%) | 46 (9.3%) |
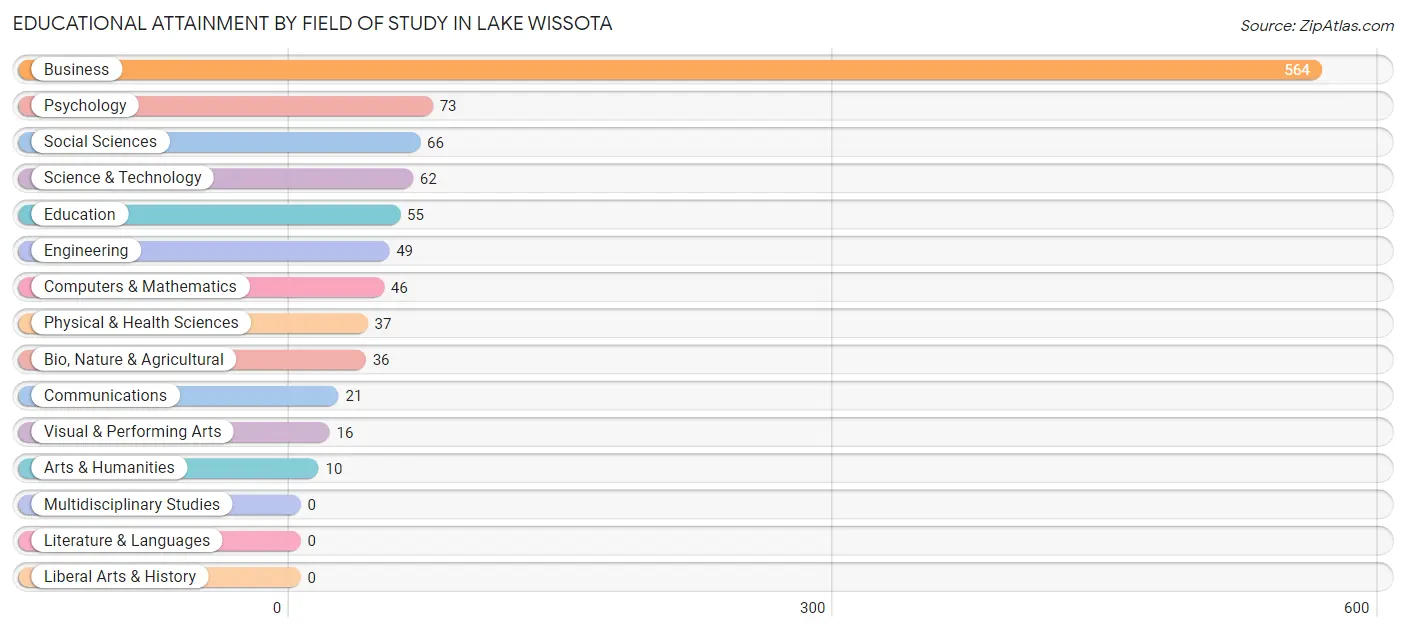
Educational Attainment by Field of Study in Lake Wissota
Business (564 | 54.5%), psychology (73 | 7.0%), social sciences (66 | 6.4%), science & technology (62 | 6.0%), and education (55 | 5.3%) are the most common fields of study among 1,035 individuals in Lake Wissota who have obtained a bachelor's degree or higher.
| Field of Study | # Graduates | % Graduates |
| Computers & Mathematics | 46 | 4.4% |
| Bio, Nature & Agricultural | 36 | 3.5% |
| Physical & Health Sciences | 37 | 3.6% |
| Psychology | 73 | 7.0% |
| Social Sciences | 66 | 6.4% |
| Engineering | 49 | 4.7% |
| Multidisciplinary Studies | 0 | 0.0% |
| Science & Technology | 62 | 6.0% |
| Business | 564 | 54.5% |
| Education | 55 | 5.3% |
| Literature & Languages | 0 | 0.0% |
| Liberal Arts & History | 0 | 0.0% |
| Visual & Performing Arts | 16 | 1.5% |
| Communications | 21 | 2.0% |
| Arts & Humanities | 10 | 1.0% |
| Total | 1,035 | 100.0% |
Transportation & Commute in Lake Wissota
Vehicle Availability by Sex in Lake Wissota
The most prevalent vehicle ownership categories in Lake Wissota are males with 2 vehicles (412, accounting for 46.6%) and females with 2 vehicles (253, making up 55.8%).
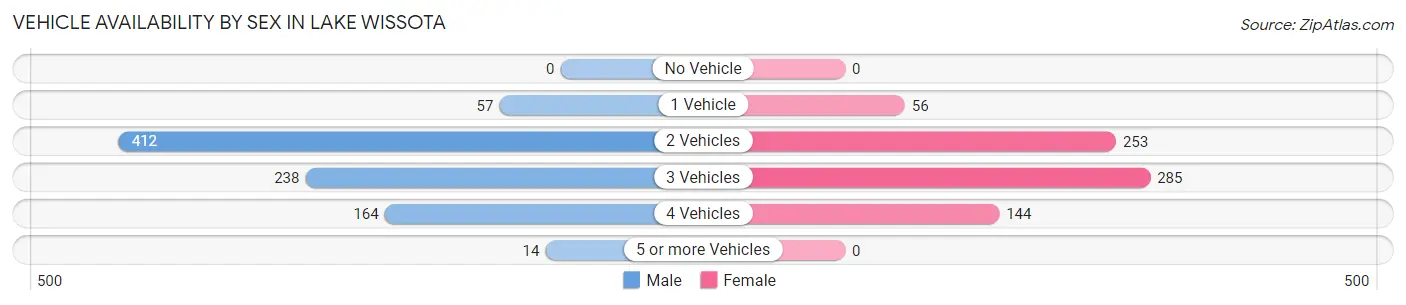
| Vehicles Available | Male | Female |
| No Vehicle | 0 (0.0%) | 0 (0.0%) |
| 1 Vehicle | 57 (6.4%) | 56 (7.6%) |
| 2 Vehicles | 412 (46.6%) | 253 (34.3%) |
| 3 Vehicles | 238 (26.9%) | 285 (38.6%) |
| 4 Vehicles | 164 (18.5%) | 144 (19.5%) |
| 5 or more Vehicles | 14 (1.6%) | 0 (0.0%) |
| Total | 885 (100.0%) | 738 (100.0%) |
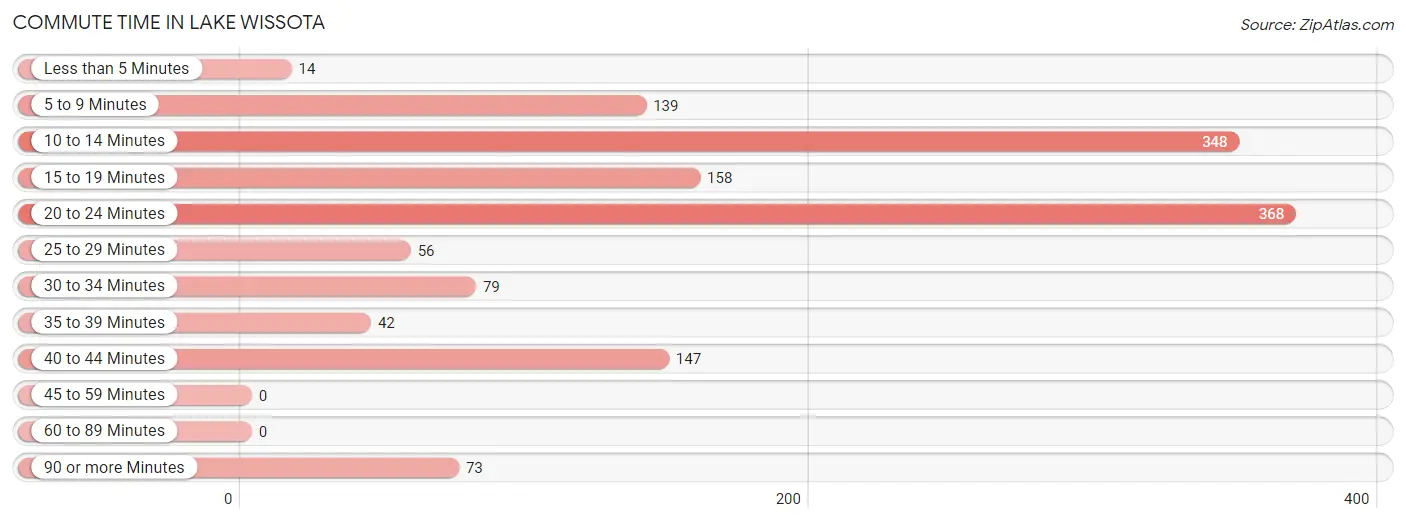
Commute Time in Lake Wissota
The most frequently occuring commute durations in Lake Wissota are 20 to 24 minutes (368 commuters, 25.8%), 10 to 14 minutes (348 commuters, 24.4%), and 15 to 19 minutes (158 commuters, 11.1%).
| Commute Time | # Commuters | % Commuters |
| Less than 5 Minutes | 14 | 1.0% |
| 5 to 9 Minutes | 139 | 9.8% |
| 10 to 14 Minutes | 348 | 24.4% |
| 15 to 19 Minutes | 158 | 11.1% |
| 20 to 24 Minutes | 368 | 25.8% |
| 25 to 29 Minutes | 56 | 3.9% |
| 30 to 34 Minutes | 79 | 5.6% |
| 35 to 39 Minutes | 42 | 2.9% |
| 40 to 44 Minutes | 147 | 10.3% |
| 45 to 59 Minutes | 0 | 0.0% |
| 60 to 89 Minutes | 0 | 0.0% |
| 90 or more Minutes | 73 | 5.1% |
Commute Time by Sex in Lake Wissota
The most common commute times in Lake Wissota are 20 to 24 minutes (222 commuters, 27.5%) for males and 10 to 14 minutes (162 commuters, 26.3%) for females.
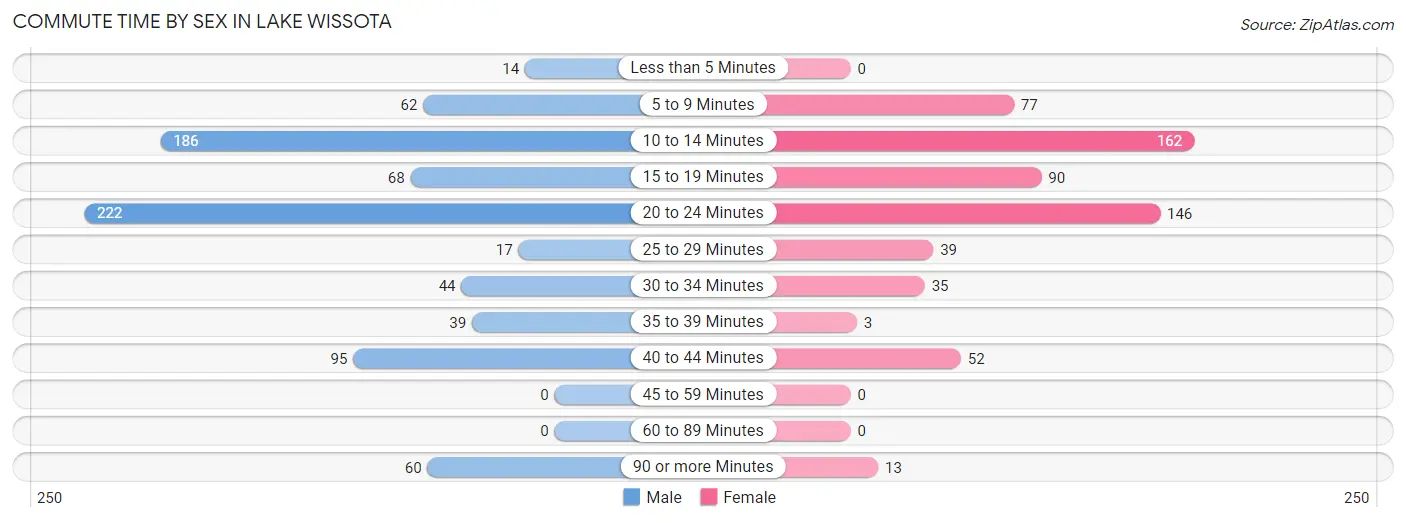
| Commute Time | Male | Female |
| Less than 5 Minutes | 14 (1.7%) | 0 (0.0%) |
| 5 to 9 Minutes | 62 (7.7%) | 77 (12.5%) |
| 10 to 14 Minutes | 186 (23.1%) | 162 (26.3%) |
| 15 to 19 Minutes | 68 (8.4%) | 90 (14.6%) |
| 20 to 24 Minutes | 222 (27.5%) | 146 (23.7%) |
| 25 to 29 Minutes | 17 (2.1%) | 39 (6.3%) |
| 30 to 34 Minutes | 44 (5.4%) | 35 (5.7%) |
| 35 to 39 Minutes | 39 (4.8%) | 3 (0.5%) |
| 40 to 44 Minutes | 95 (11.8%) | 52 (8.4%) |
| 45 to 59 Minutes | 0 (0.0%) | 0 (0.0%) |
| 60 to 89 Minutes | 0 (0.0%) | 0 (0.0%) |
| 90 or more Minutes | 60 (7.4%) | 13 (2.1%) |
Time of Departure to Work by Sex in Lake Wissota
The most frequent times of departure to work in Lake Wissota are 9:00 AM to 9:59 AM (161, 20.0%) for males and 7:30 AM to 7:59 AM (132, 21.4%) for females.
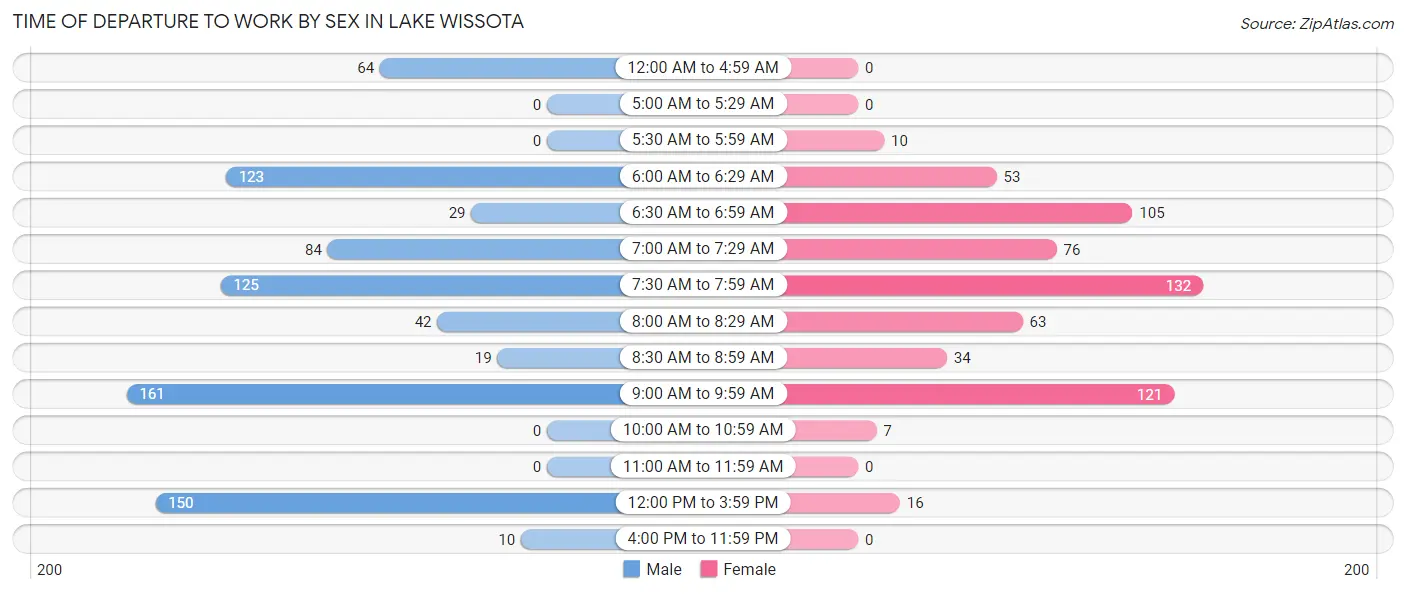
| Time of Departure | Male | Female |
| 12:00 AM to 4:59 AM | 64 (7.9%) | 0 (0.0%) |
| 5:00 AM to 5:29 AM | 0 (0.0%) | 0 (0.0%) |
| 5:30 AM to 5:59 AM | 0 (0.0%) | 10 (1.6%) |
| 6:00 AM to 6:29 AM | 123 (15.2%) | 53 (8.6%) |
| 6:30 AM to 6:59 AM | 29 (3.6%) | 105 (17.0%) |
| 7:00 AM to 7:29 AM | 84 (10.4%) | 76 (12.3%) |
| 7:30 AM to 7:59 AM | 125 (15.5%) | 132 (21.4%) |
| 8:00 AM to 8:29 AM | 42 (5.2%) | 63 (10.2%) |
| 8:30 AM to 8:59 AM | 19 (2.4%) | 34 (5.5%) |
| 9:00 AM to 9:59 AM | 161 (20.0%) | 121 (19.6%) |
| 10:00 AM to 10:59 AM | 0 (0.0%) | 7 (1.1%) |
| 11:00 AM to 11:59 AM | 0 (0.0%) | 0 (0.0%) |
| 12:00 PM to 3:59 PM | 150 (18.6%) | 16 (2.6%) |
| 4:00 PM to 11:59 PM | 10 (1.2%) | 0 (0.0%) |
| Total | 807 (100.0%) | 617 (100.0%) |
Housing Occupancy in Lake Wissota
Occupancy by Ownership in Lake Wissota
Of the total 1,350 dwellings in Lake Wissota, owner-occupied units account for 1,101 (81.6%), while renter-occupied units make up 249 (18.4%).
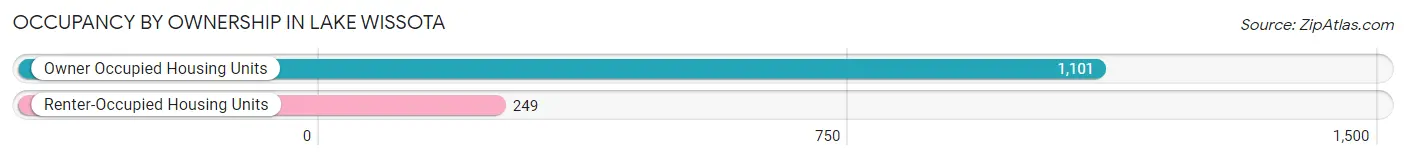
| Occupancy | # Housing Units | % Housing Units |
| Owner Occupied Housing Units | 1,101 | 81.6% |
| Renter-Occupied Housing Units | 249 | 18.4% |
| Total Occupied Housing Units | 1,350 | 100.0% |
Occupancy by Household Size in Lake Wissota
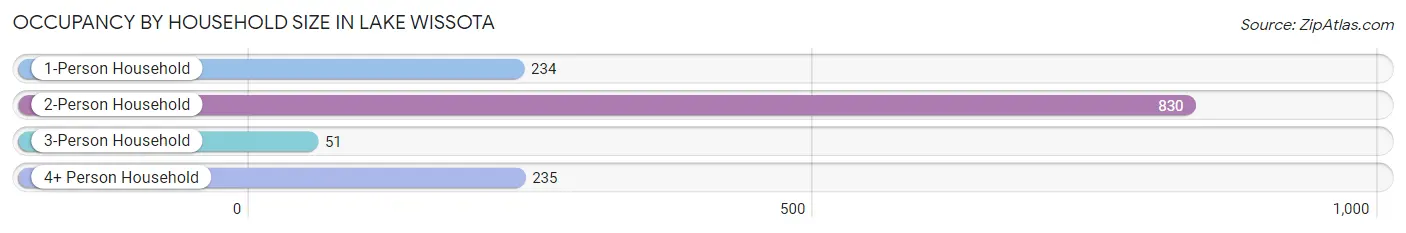
| Household Size | # Housing Units | % Housing Units |
| 1-Person Household | 234 | 17.3% |
| 2-Person Household | 830 | 61.5% |
| 3-Person Household | 51 | 3.8% |
| 4+ Person Household | 235 | 17.4% |
| Total Housing Units | 1,350 | 100.0% |
Occupancy by Ownership by Household Size in Lake Wissota
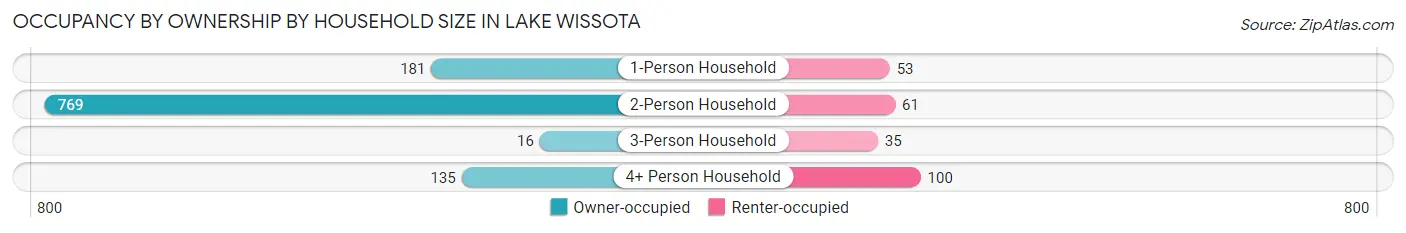
| Household Size | Owner-occupied | Renter-occupied |
| 1-Person Household | 181 (77.3%) | 53 (22.7%) |
| 2-Person Household | 769 (92.6%) | 61 (7.3%) |
| 3-Person Household | 16 (31.4%) | 35 (68.6%) |
| 4+ Person Household | 135 (57.5%) | 100 (42.5%) |
| Total Housing Units | 1,101 (81.6%) | 249 (18.4%) |
Occupancy by Educational Attainment in Lake Wissota
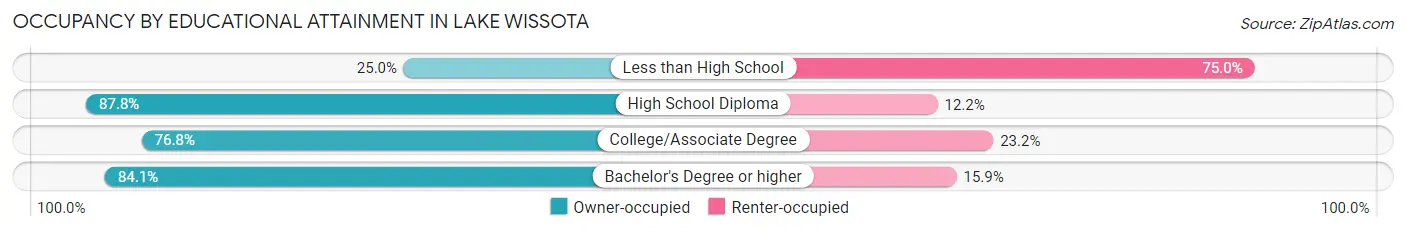
| Household Size | Owner-occupied | Renter-occupied |
| Less than High School | 7 (25.0%) | 21 (75.0%) |
| High School Diploma | 260 (87.8%) | 36 (12.2%) |
| College/Associate Degree | 301 (76.8%) | 91 (23.2%) |
| Bachelor's Degree or higher | 533 (84.1%) | 101 (15.9%) |
Occupancy by Age of Householder in Lake Wissota
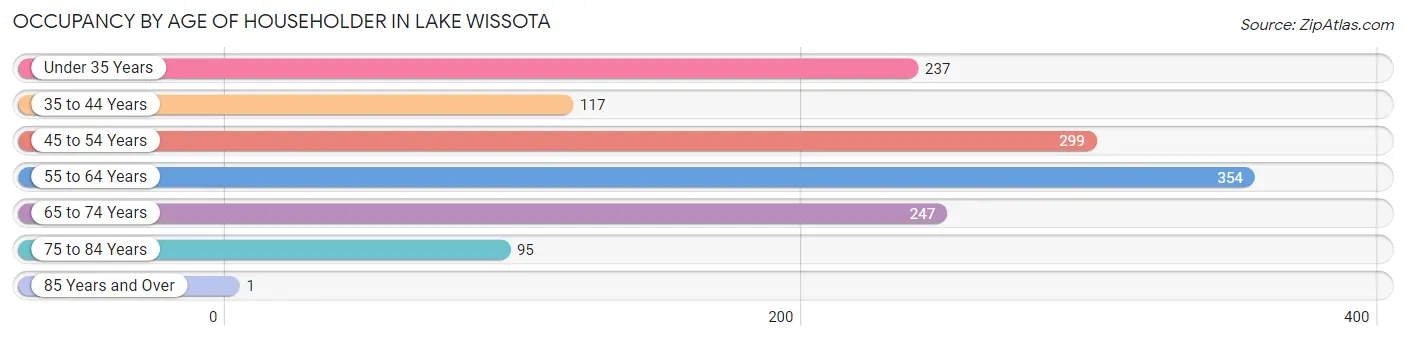
| Age Bracket | # Households | % Households |
| Under 35 Years | 237 | 17.6% |
| 35 to 44 Years | 117 | 8.7% |
| 45 to 54 Years | 299 | 22.2% |
| 55 to 64 Years | 354 | 26.2% |
| 65 to 74 Years | 247 | 18.3% |
| 75 to 84 Years | 95 | 7.0% |
| 85 Years and Over | 1 | 0.1% |
| Total | 1,350 | 100.0% |
Housing Finances in Lake Wissota
Median Income by Occupancy in Lake Wissota
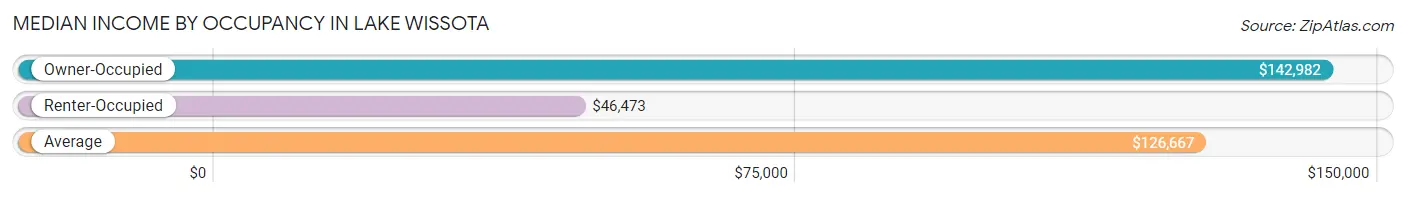
| Occupancy Type | # Households | Median Income |
| Owner-Occupied | 1,101 (81.6%) | $142,982 |
| Renter-Occupied | 249 (18.4%) | $46,473 |
| Average | 1,350 (100.0%) | $126,667 |
Occupancy by Householder Income Bracket in Lake Wissota
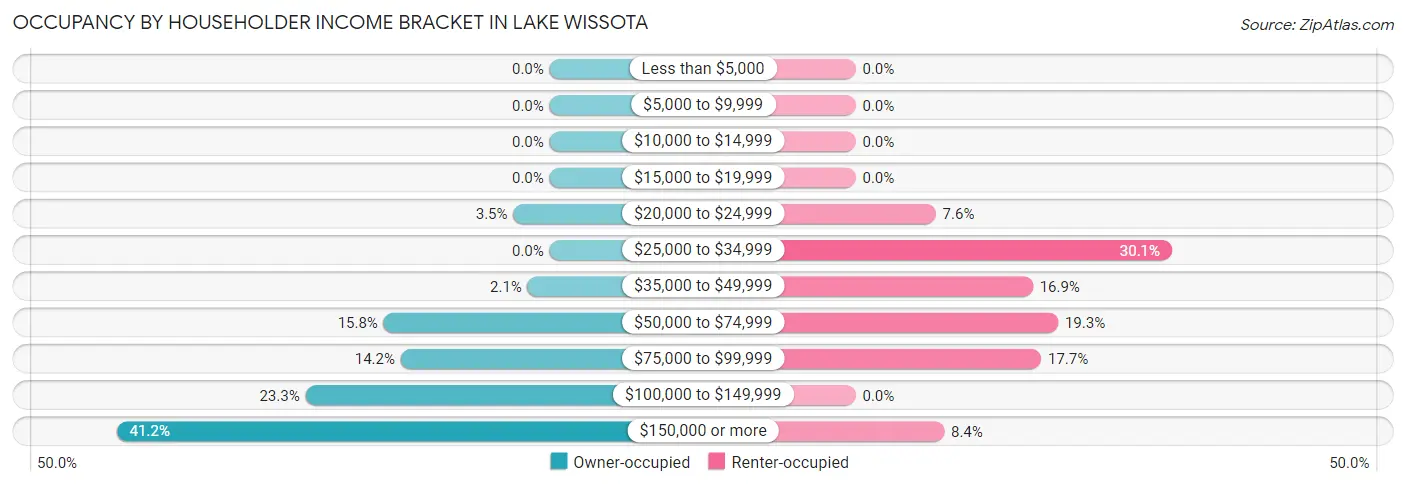
| Income Bracket | Owner-occupied | Renter-occupied |
| Less than $5,000 | 0 (0.0%) | 0 (0.0%) |
| $5,000 to $9,999 | 0 (0.0%) | 0 (0.0%) |
| $10,000 to $14,999 | 0 (0.0%) | 0 (0.0%) |
| $15,000 to $19,999 | 0 (0.0%) | 0 (0.0%) |
| $20,000 to $24,999 | 38 (3.5%) | 19 (7.6%) |
| $25,000 to $34,999 | 0 (0.0%) | 75 (30.1%) |
| $35,000 to $49,999 | 23 (2.1%) | 42 (16.9%) |
| $50,000 to $74,999 | 174 (15.8%) | 48 (19.3%) |
| $75,000 to $99,999 | 156 (14.2%) | 44 (17.7%) |
| $100,000 to $149,999 | 256 (23.3%) | 0 (0.0%) |
| $150,000 or more | 454 (41.2%) | 21 (8.4%) |
| Total | 1,101 (100.0%) | 249 (100.0%) |
Monthly Housing Cost Tiers in Lake Wissota
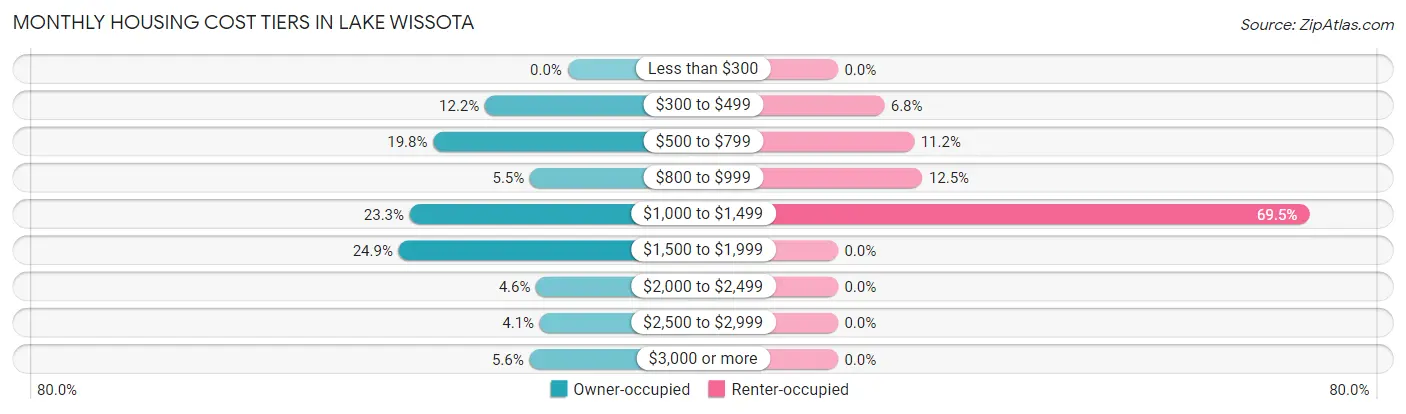
| Monthly Cost | Owner-occupied | Renter-occupied |
| Less than $300 | 0 (0.0%) | 0 (0.0%) |
| $300 to $499 | 134 (12.2%) | 17 (6.8%) |
| $500 to $799 | 218 (19.8%) | 28 (11.2%) |
| $800 to $999 | 61 (5.5%) | 31 (12.4%) |
| $1,000 to $1,499 | 256 (23.3%) | 173 (69.5%) |
| $1,500 to $1,999 | 274 (24.9%) | 0 (0.0%) |
| $2,000 to $2,499 | 51 (4.6%) | 0 (0.0%) |
| $2,500 to $2,999 | 45 (4.1%) | 0 (0.0%) |
| $3,000 or more | 62 (5.6%) | 0 (0.0%) |
| Total | 1,101 (100.0%) | 249 (100.0%) |
Physical Housing Characteristics in Lake Wissota
Housing Structures in Lake Wissota
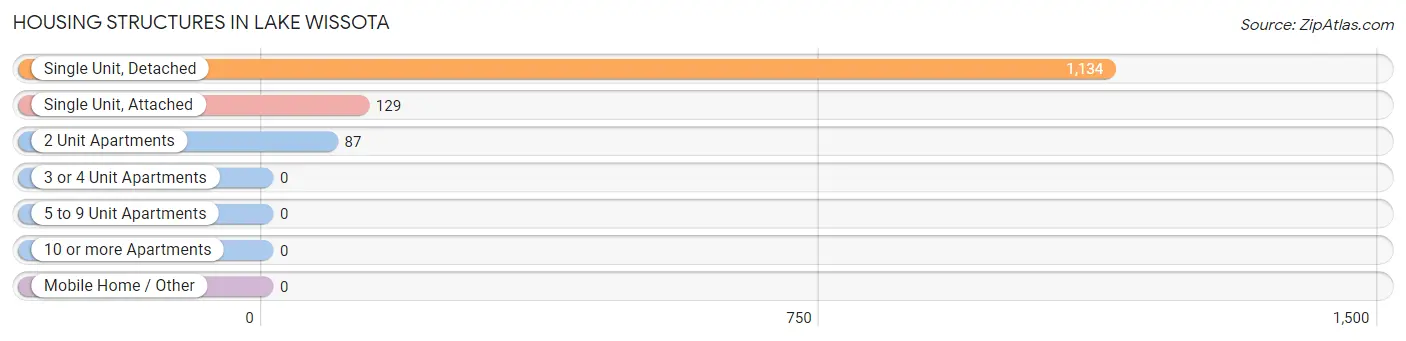
| Structure Type | # Housing Units | % Housing Units |
| Single Unit, Detached | 1,134 | 84.0% |
| Single Unit, Attached | 129 | 9.6% |
| 2 Unit Apartments | 87 | 6.4% |
| 3 or 4 Unit Apartments | 0 | 0.0% |
| 5 to 9 Unit Apartments | 0 | 0.0% |
| 10 or more Apartments | 0 | 0.0% |
| Mobile Home / Other | 0 | 0.0% |
| Total | 1,350 | 100.0% |
Housing Structures by Occupancy in Lake Wissota
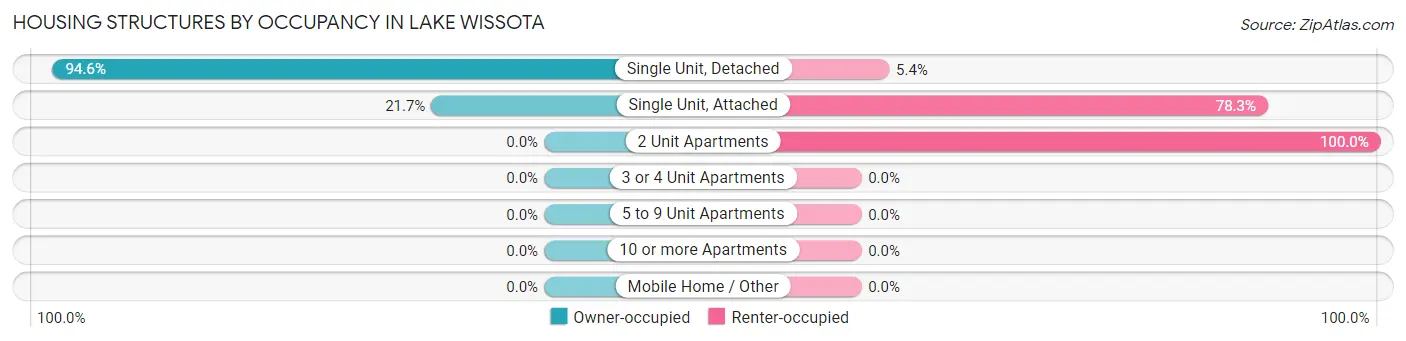
| Structure Type | Owner-occupied | Renter-occupied |
| Single Unit, Detached | 1,073 (94.6%) | 61 (5.4%) |
| Single Unit, Attached | 28 (21.7%) | 101 (78.3%) |
| 2 Unit Apartments | 0 (0.0%) | 87 (100.0%) |
| 3 or 4 Unit Apartments | 0 (0.0%) | 0 (0.0%) |
| 5 to 9 Unit Apartments | 0 (0.0%) | 0 (0.0%) |
| 10 or more Apartments | 0 (0.0%) | 0 (0.0%) |
| Mobile Home / Other | 0 (0.0%) | 0 (0.0%) |
| Total | 1,101 (81.6%) | 249 (18.4%) |
Housing Structures by Number of Rooms in Lake Wissota
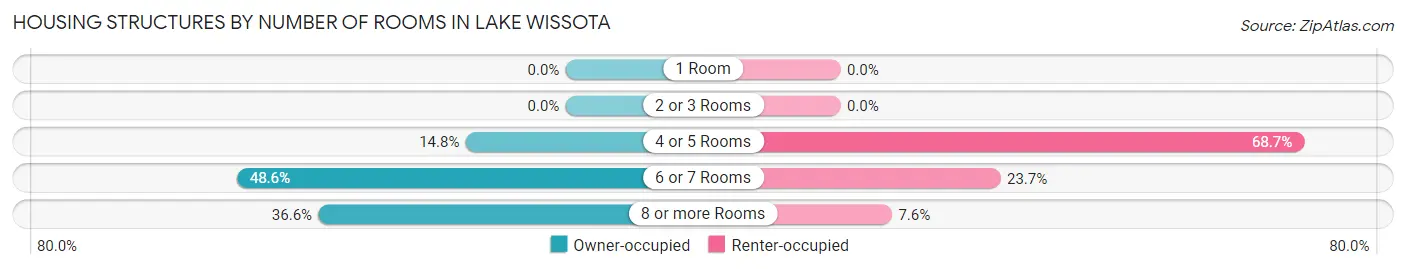
| Number of Rooms | Owner-occupied | Renter-occupied |
| 1 Room | 0 (0.0%) | 0 (0.0%) |
| 2 or 3 Rooms | 0 (0.0%) | 0 (0.0%) |
| 4 or 5 Rooms | 163 (14.8%) | 171 (68.7%) |
| 6 or 7 Rooms | 535 (48.6%) | 59 (23.7%) |
| 8 or more Rooms | 403 (36.6%) | 19 (7.6%) |
| Total | 1,101 (100.0%) | 249 (100.0%) |
Housing Structure by Heating Type in Lake Wissota
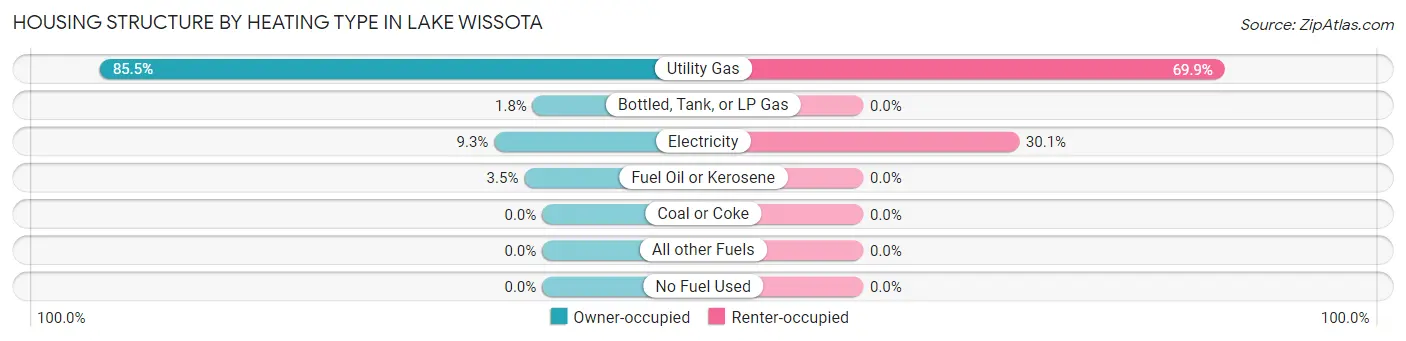
| Heating Type | Owner-occupied | Renter-occupied |
| Utility Gas | 941 (85.5%) | 174 (69.9%) |
| Bottled, Tank, or LP Gas | 20 (1.8%) | 0 (0.0%) |
| Electricity | 102 (9.3%) | 75 (30.1%) |
| Fuel Oil or Kerosene | 38 (3.5%) | 0 (0.0%) |
| Coal or Coke | 0 (0.0%) | 0 (0.0%) |
| All other Fuels | 0 (0.0%) | 0 (0.0%) |
| No Fuel Used | 0 (0.0%) | 0 (0.0%) |
| Total | 1,101 (100.0%) | 249 (100.0%) |
Household Vehicle Usage in Lake Wissota
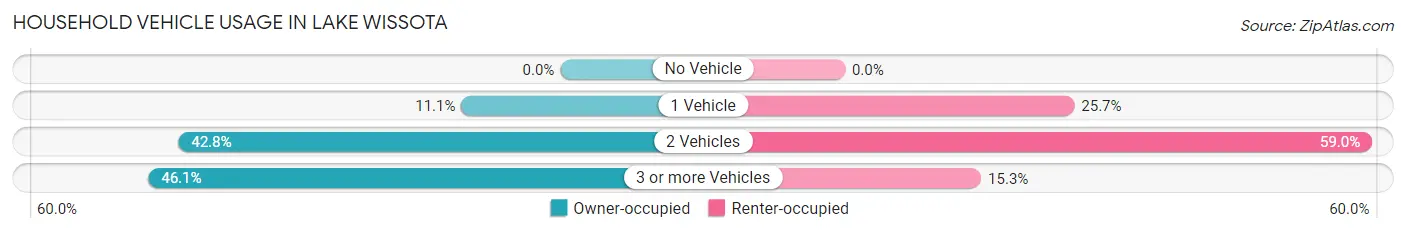
| Vehicles per Household | Owner-occupied | Renter-occupied |
| No Vehicle | 0 (0.0%) | 0 (0.0%) |
| 1 Vehicle | 122 (11.1%) | 64 (25.7%) |
| 2 Vehicles | 471 (42.8%) | 147 (59.0%) |
| 3 or more Vehicles | 508 (46.1%) | 38 (15.3%) |
| Total | 1,101 (100.0%) | 249 (100.0%) |
Real Estate & Mortgages in Lake Wissota
Real Estate and Mortgage Overview in Lake Wissota
| Characteristic | Without Mortgage | With Mortgage |
| Housing Units | 556 | 545 |
| Median Property Value | $397,200 | $288,200 |
| Median Household Income | $180,160 | $148 |
| Monthly Housing Costs | $606 | $62 |
| Real Estate Taxes | $4,278 | $0 |
Property Value by Mortgage Status in Lake Wissota
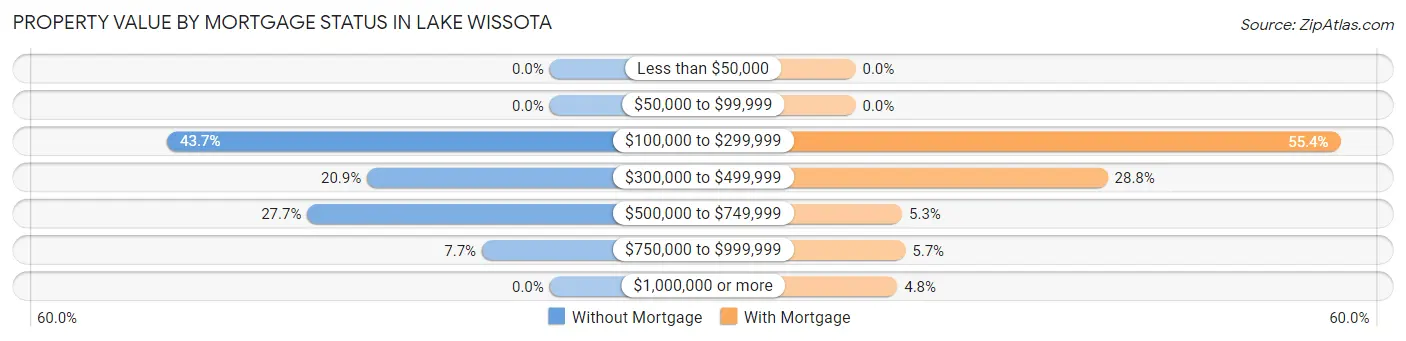
| Property Value | Without Mortgage | With Mortgage |
| Less than $50,000 | 0 (0.0%) | 0 (0.0%) |
| $50,000 to $99,999 | 0 (0.0%) | 0 (0.0%) |
| $100,000 to $299,999 | 243 (43.7%) | 302 (55.4%) |
| $300,000 to $499,999 | 116 (20.9%) | 157 (28.8%) |
| $500,000 to $749,999 | 154 (27.7%) | 29 (5.3%) |
| $750,000 to $999,999 | 43 (7.7%) | 31 (5.7%) |
| $1,000,000 or more | 0 (0.0%) | 26 (4.8%) |
| Total | 556 (100.0%) | 545 (100.0%) |
Household Income by Mortgage Status in Lake Wissota
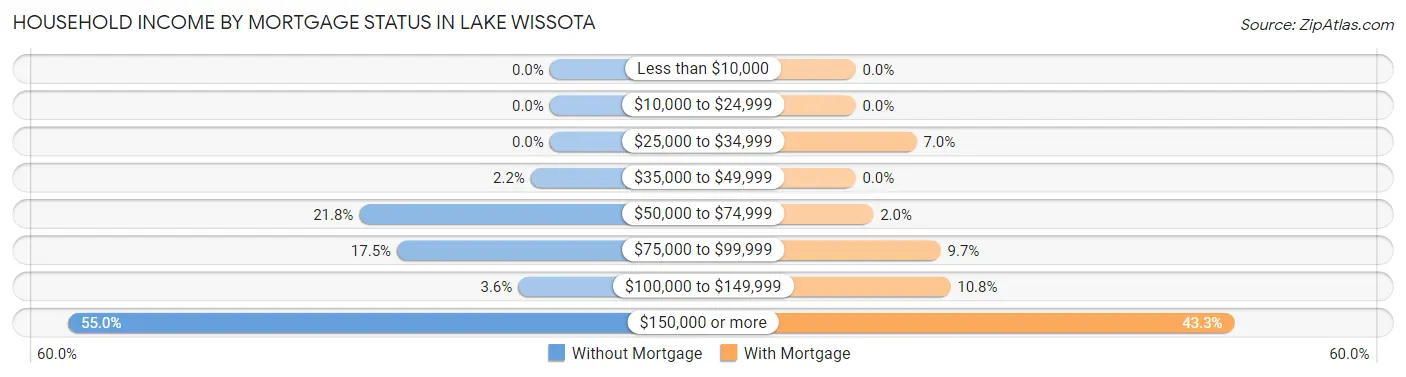
| Household Income | Without Mortgage | With Mortgage |
| Less than $10,000 | 0 (0.0%) | 0 (0.0%) |
| $10,000 to $24,999 | 0 (0.0%) | 0 (0.0%) |
| $25,000 to $34,999 | 0 (0.0%) | 38 (7.0%) |
| $35,000 to $49,999 | 12 (2.2%) | 0 (0.0%) |
| $50,000 to $74,999 | 121 (21.8%) | 11 (2.0%) |
| $75,000 to $99,999 | 97 (17.4%) | 53 (9.7%) |
| $100,000 to $149,999 | 20 (3.6%) | 59 (10.8%) |
| $150,000 or more | 306 (55.0%) | 236 (43.3%) |
| Total | 556 (100.0%) | 545 (100.0%) |
Property Value to Household Income Ratio in Lake Wissota
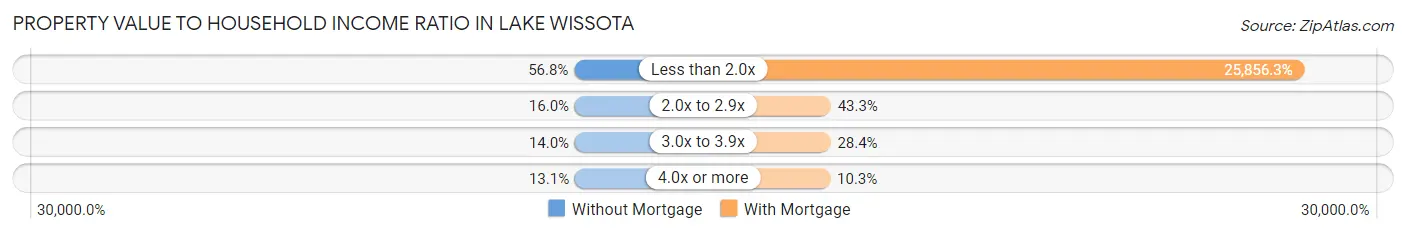
| Value-to-Income Ratio | Without Mortgage | With Mortgage |
| Less than 2.0x | 316 (56.8%) | 140,917 (25,856.3%) |
| 2.0x to 2.9x | 89 (16.0%) | 236 (43.3%) |
| 3.0x to 3.9x | 78 (14.0%) | 155 (28.4%) |
| 4.0x or more | 73 (13.1%) | 56 (10.3%) |
| Total | 556 (100.0%) | 545 (100.0%) |
Real Estate Taxes by Mortgage Status in Lake Wissota
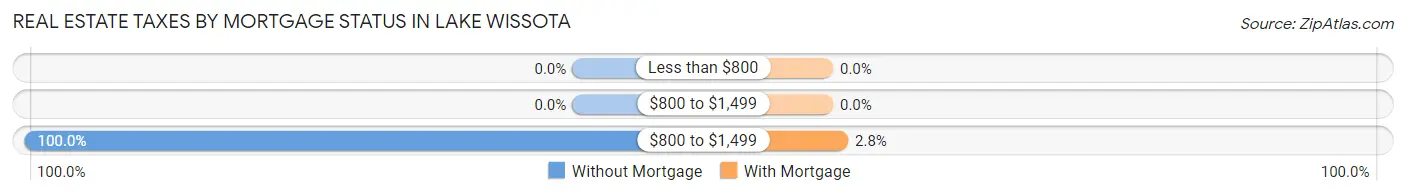
| Property Taxes | Without Mortgage | With Mortgage |
| Less than $800 | 0 (0.0%) | 0 (0.0%) |
| $800 to $1,499 | 0 (0.0%) | 0 (0.0%) |
| $800 to $1,499 | 556 (100.0%) | 15 (2.8%) |
| Total | 556 (100.0%) | 545 (100.0%) |
Health & Disability in Lake Wissota
Health Insurance Coverage by Age in Lake Wissota
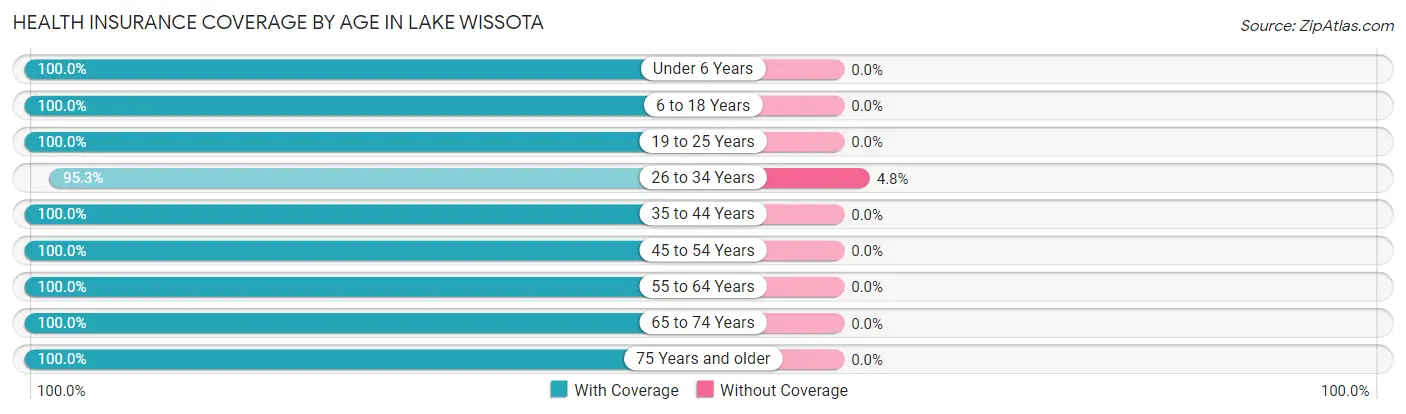
| Age Bracket | With Coverage | Without Coverage |
| Under 6 Years | 213 (100.0%) | 0 (0.0%) |
| 6 to 18 Years | 303 (100.0%) | 0 (0.0%) |
| 19 to 25 Years | 154 (100.0%) | 0 (0.0%) |
| 26 to 34 Years | 341 (95.3%) | 17 (4.8%) |
| 35 to 44 Years | 221 (100.0%) | 0 (0.0%) |
| 45 to 54 Years | 546 (100.0%) | 0 (0.0%) |
| 55 to 64 Years | 658 (100.0%) | 0 (0.0%) |
| 65 to 74 Years | 367 (100.0%) | 0 (0.0%) |
| 75 Years and older | 181 (100.0%) | 0 (0.0%) |
| Total | 2,984 (99.4%) | 17 (0.6%) |
Health Insurance Coverage by Citizenship Status in Lake Wissota
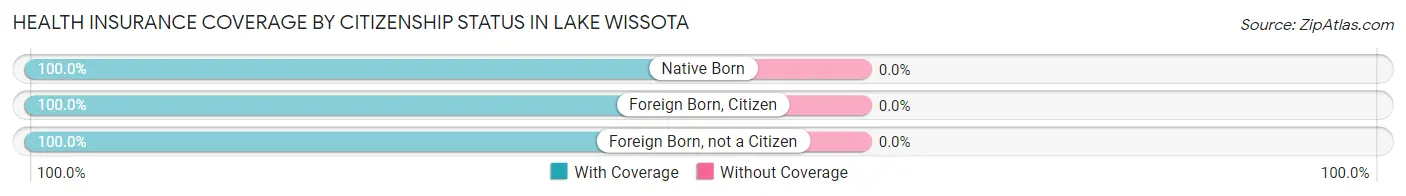
| Citizenship Status | With Coverage | Without Coverage |
| Native Born | 213 (100.0%) | 0 (0.0%) |
| Foreign Born, Citizen | 303 (100.0%) | 0 (0.0%) |
| Foreign Born, not a Citizen | 154 (100.0%) | 0 (0.0%) |
Health Insurance Coverage by Household Income in Lake Wissota
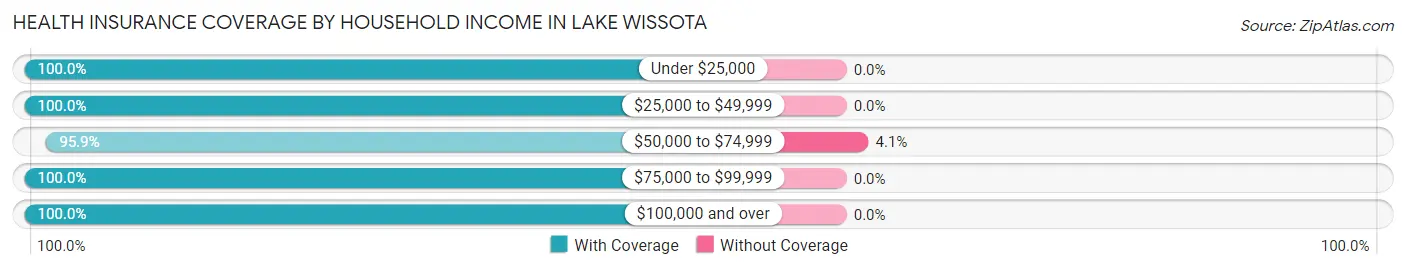
| Household Income | With Coverage | Without Coverage |
| Under $25,000 | 97 (100.0%) | 0 (0.0%) |
| $25,000 to $49,999 | 370 (100.0%) | 0 (0.0%) |
| $50,000 to $74,999 | 400 (95.9%) | 17 (4.1%) |
| $75,000 to $99,999 | 467 (100.0%) | 0 (0.0%) |
| $100,000 and over | 1,640 (100.0%) | 0 (0.0%) |
Public vs Private Health Insurance Coverage by Age in Lake Wissota
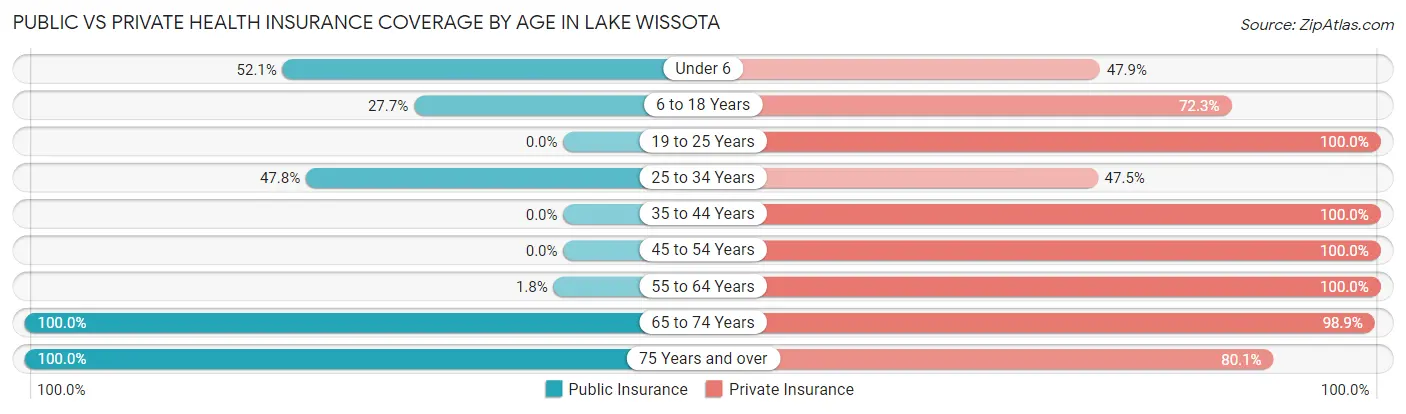
| Age Bracket | Public Insurance | Private Insurance |
| Under 6 | 111 (52.1%) | 102 (47.9%) |
| 6 to 18 Years | 84 (27.7%) | 219 (72.3%) |
| 19 to 25 Years | 0 (0.0%) | 154 (100.0%) |
| 25 to 34 Years | 171 (47.8%) | 170 (47.5%) |
| 35 to 44 Years | 0 (0.0%) | 221 (100.0%) |
| 45 to 54 Years | 0 (0.0%) | 546 (100.0%) |
| 55 to 64 Years | 12 (1.8%) | 658 (100.0%) |
| 65 to 74 Years | 367 (100.0%) | 363 (98.9%) |
| 75 Years and over | 181 (100.0%) | 145 (80.1%) |
| Total | 926 (30.9%) | 2,578 (85.9%) |
Disability Status by Sex by Age in Lake Wissota
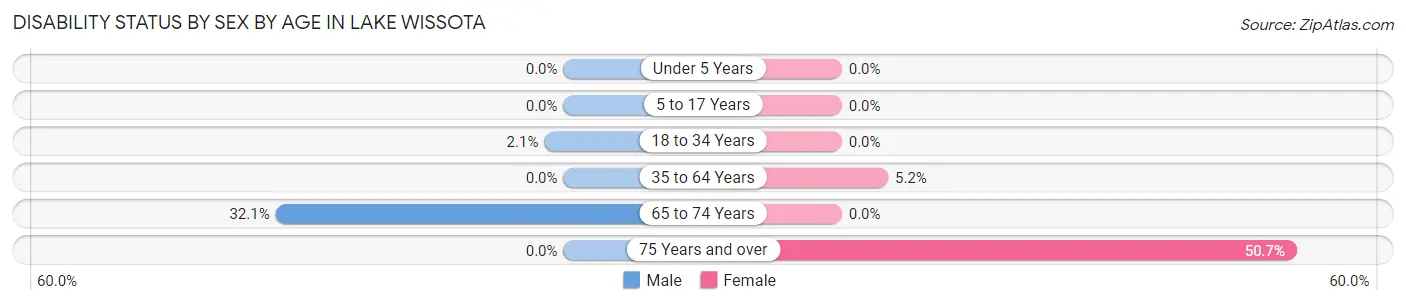
| Age Bracket | Male | Female |
| Under 5 Years | 0 (0.0%) | 0 (0.0%) |
| 5 to 17 Years | 0 (0.0%) | 0 (0.0%) |
| 18 to 34 Years | 6 (2.1%) | 0 (0.0%) |
| 35 to 64 Years | 0 (0.0%) | 36 (5.2%) |
| 65 to 74 Years | 84 (32.1%) | 0 (0.0%) |
| 75 Years and over | 0 (0.0%) | 38 (50.7%) |
Disability Class by Sex by Age in Lake Wissota
Disability Class: Hearing Difficulty
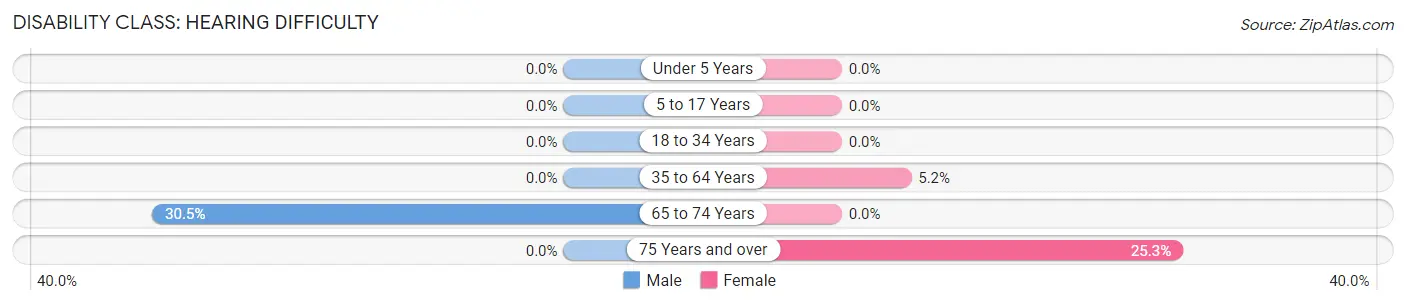
| Age Bracket | Male | Female |
| Under 5 Years | 0 (0.0%) | 0 (0.0%) |
| 5 to 17 Years | 0 (0.0%) | 0 (0.0%) |
| 18 to 34 Years | 0 (0.0%) | 0 (0.0%) |
| 35 to 64 Years | 0 (0.0%) | 36 (5.2%) |
| 65 to 74 Years | 80 (30.5%) | 0 (0.0%) |
| 75 Years and over | 0 (0.0%) | 19 (25.3%) |
Disability Class: Vision Difficulty
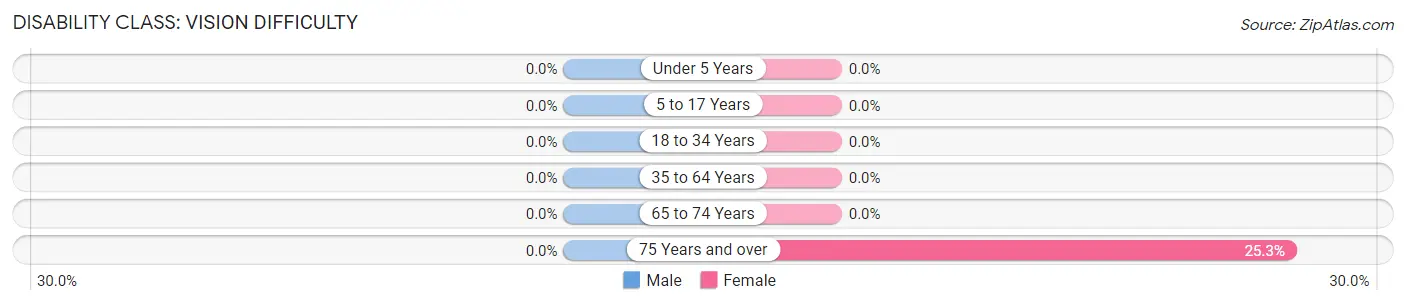
| Age Bracket | Male | Female |
| Under 5 Years | 0 (0.0%) | 0 (0.0%) |
| 5 to 17 Years | 0 (0.0%) | 0 (0.0%) |
| 18 to 34 Years | 0 (0.0%) | 0 (0.0%) |
| 35 to 64 Years | 0 (0.0%) | 0 (0.0%) |
| 65 to 74 Years | 0 (0.0%) | 0 (0.0%) |
| 75 Years and over | 0 (0.0%) | 19 (25.3%) |
Disability Class: Cognitive Difficulty
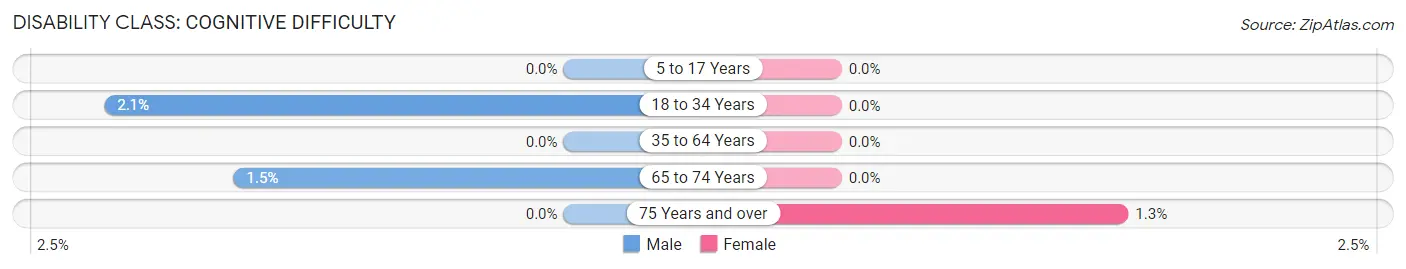
| Age Bracket | Male | Female |
| 5 to 17 Years | 0 (0.0%) | 0 (0.0%) |
| 18 to 34 Years | 6 (2.1%) | 0 (0.0%) |
| 35 to 64 Years | 0 (0.0%) | 0 (0.0%) |
| 65 to 74 Years | 4 (1.5%) | 0 (0.0%) |
| 75 Years and over | 0 (0.0%) | 1 (1.3%) |
Disability Class: Ambulatory Difficulty
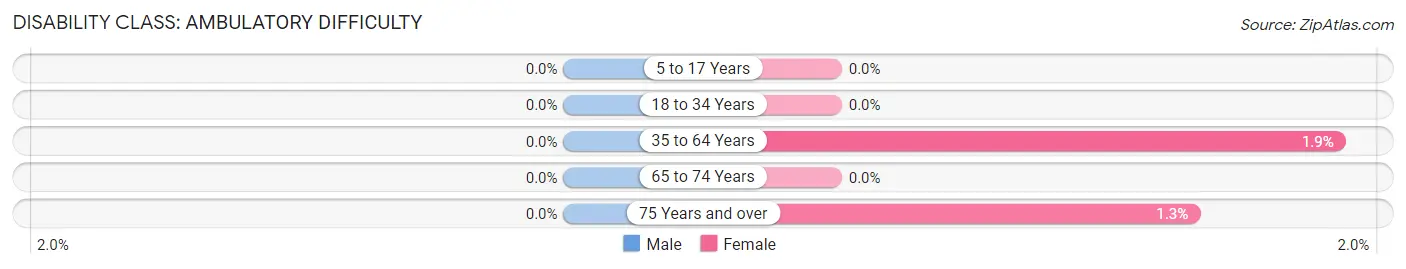
| Age Bracket | Male | Female |
| 5 to 17 Years | 0 (0.0%) | 0 (0.0%) |
| 18 to 34 Years | 0 (0.0%) | 0 (0.0%) |
| 35 to 64 Years | 0 (0.0%) | 13 (1.9%) |
| 65 to 74 Years | 0 (0.0%) | 0 (0.0%) |
| 75 Years and over | 0 (0.0%) | 1 (1.3%) |
Disability Class: Self-Care Difficulty
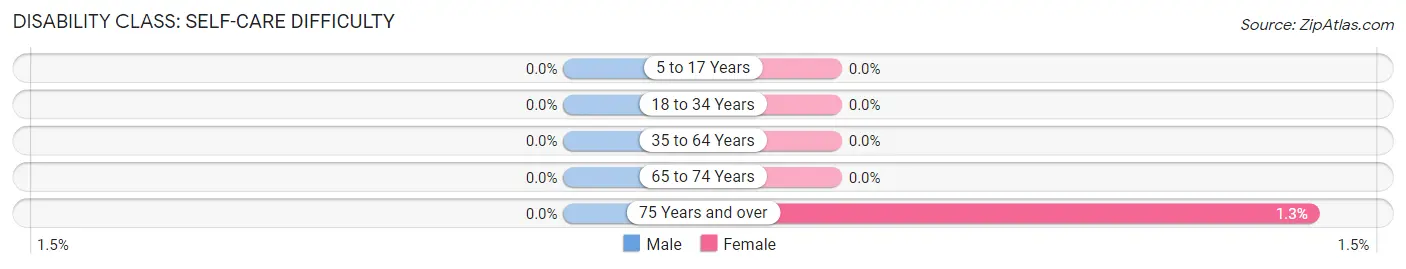
| Age Bracket | Male | Female |
| 5 to 17 Years | 0 (0.0%) | 0 (0.0%) |
| 18 to 34 Years | 0 (0.0%) | 0 (0.0%) |
| 35 to 64 Years | 0 (0.0%) | 0 (0.0%) |
| 65 to 74 Years | 0 (0.0%) | 0 (0.0%) |
| 75 Years and over | 0 (0.0%) | 1 (1.3%) |
Technology Access in Lake Wissota
Computing Device Access in Lake Wissota
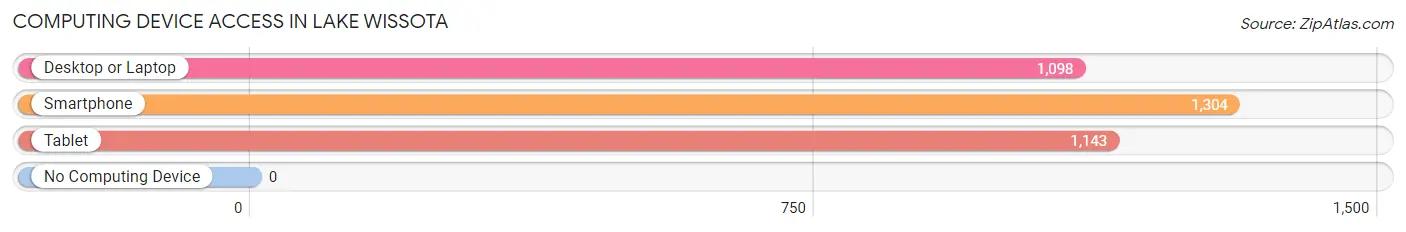
| Device Type | # Households | % Households |
| Desktop or Laptop | 1,098 | 81.3% |
| Smartphone | 1,304 | 96.6% |
| Tablet | 1,143 | 84.7% |
| No Computing Device | 0 | 0.0% |
| Total | 1,350 | 100.0% |
Internet Access in Lake Wissota
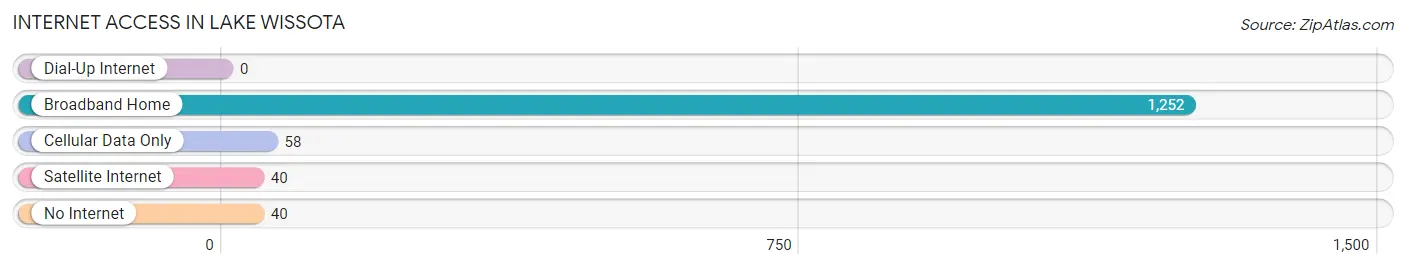
| Internet Type | # Households | % Households |
| Dial-Up Internet | 0 | 0.0% |
| Broadband Home | 1,252 | 92.7% |
| Cellular Data Only | 58 | 4.3% |
| Satellite Internet | 40 | 3.0% |
| No Internet | 40 | 3.0% |
| Total | 1,350 | 100.0% |
Lake Wissota Summary
Lake Wissota is a man-made lake located in Chippewa County, Wisconsin. It was created in 1917 when the Chippewa River was dammed to provide hydroelectric power to the area. The lake is approximately 6,400 acres in size and is the largest lake in the Chippewa Valley. It is a popular destination for fishing, boating, swimming, and other recreational activities.
History
The area around Lake Wissota was originally inhabited by the Ojibwe people. The lake was created in 1917 when the Chippewa River was dammed to provide hydroelectric power to the area. The dam was built by the Northern States Power Company, which is now known as Xcel Energy. The lake was named after the nearby Wissota Rapids, which were named after the Ojibwe word for “big water”.
The lake quickly became a popular destination for fishing, boating, and other recreational activities. In the 1920s, the lake was stocked with walleye, northern pike, and muskellunge. In the 1950s, the lake was stocked with largemouth bass, smallmouth bass, and bluegill. The lake is now home to a variety of fish species, including walleye, northern pike, muskellunge, largemouth bass, smallmouth bass, bluegill, crappie, and perch.
Geography
Lake Wissota is located in Chippewa County, Wisconsin. It is approximately 6,400 acres in size and is the largest lake in the Chippewa Valley. The lake is surrounded by the towns of Chippewa Falls, Lake Hallie, and Jim Falls. The lake is fed by the Chippewa River and is drained by the same river. The lake has a maximum depth of 40 feet and an average depth of 15 feet.
Economy
Lake Wissota is a popular destination for fishing, boating, swimming, and other recreational activities. The lake is home to several marinas, boat launches, and public beaches. There are also several resorts and campgrounds located on the lake. The lake is also a popular destination for water sports, such as wakeboarding, water skiing, and tubing.
The lake is also home to several businesses that cater to visitors. These businesses include restaurants, bars, and retail stores. The lake is also home to several charter fishing companies that offer guided fishing trips.
Demographics
The population of the Lake Wissota area is approximately 10,000 people. The majority of the population is white (94.3%), followed by Hispanic (2.2%), Asian (1.2%), and African American (0.7%). The median household income is $50,000 and the median home value is $150,000. The unemployment rate is 4.2%.
Conclusion
Lake Wissota is a man-made lake located in Chippewa County, Wisconsin. It was created in 1917 when the Chippewa River was dammed to provide hydroelectric power to the area. The lake is approximately 6,400 acres in size and is the largest lake in the Chippewa Valley. It is a popular destination for fishing, boating, swimming, and other recreational activities. The lake is home to several businesses that cater to visitors, as well as a variety of fish species. The population of the Lake Wissota area is approximately 10,000 people, with a median household income of $50,000 and a median home value of $150,000.
Common Questions
What is the Total Population of Lake Wissota?
Total Population of Lake Wissota is 3,001.
What is the Total Male Population of Lake Wissota?
Total Male Population of Lake Wissota is 1,740.
What is the Total Female Population of Lake Wissota?
Total Female Population of Lake Wissota is 1,261.
What is the Ratio of Males per 100 Females in Lake Wissota?
There are 137.99 Males per 100 Females in Lake Wissota.
What is the Ratio of Females per 100 Males in Lake Wissota?
There are 72.47 Females per 100 Males in Lake Wissota.
What is the Median Population Age in Lake Wissota?
Median Population Age in Lake Wissota is 52.2 Years.
What is the Average Family Size in Lake Wissota
Average Family Size in Lake Wissota is 2.5 People.
What is the Average Household Size in Lake Wissota
Average Household Size in Lake Wissota is 2.2 People.
What is Per Capita Income in Lake Wissota?
Per Capita income in Lake Wissota is $67,221.
What is the Median Family Income in Lake Wissota?
Median Family Income in Lake Wissota is $135,804.
What is the Median Household income in Lake Wissota?
Median Household Income in Lake Wissota is $126,667.
What is Income or Wage Gap in Lake Wissota?
Income or Wage Gap in Lake Wissota is 28.0%.
Women in Lake Wissota earn 72.0 cents for every dollar earned by a man.
What is Inequality or Gini Index in Lake Wissota?
Inequality or Gini Index in Lake Wissota is 0.41.
How Large is the Labor Force in Lake Wissota?
There are 1,739 People in the Labor Forcein in Lake Wissota.
What is the Percentage of People in the Labor Force in Lake Wissota?
68.9% of People are in the Labor Force in Lake Wissota.
What is the Unemployment Rate in Lake Wissota?
Unemployment Rate in Lake Wissota is 6.3%.