Lake Nebagamon, WI
Lake Nebagamon Map
Lake Nebagamon Overview
960
TOTAL POPULATION
511
MALE POPULATION
449
FEMALE POPULATION
113.81
MALES / 100 FEMALES
87.87
FEMALES / 100 MALES
53.8
MEDIAN AGE
2.6
AVG FAMILY SIZE
2.2
AVG HOUSEHOLD SIZE
$42,713
PER CAPITA INCOME
$94,375
AVG FAMILY INCOME
$74,444
AVG HOUSEHOLD INCOME
10.9%
WAGE / INCOME GAP [ % ]
89.1¢/ $1
WAGE / INCOME GAP [ $ ]
0.41
INEQUALITY / GINI INDEX
441
LABOR FORCE [ PEOPLE ]
54.2%
PERCENT IN LABOR FORCE
3.4%
UNEMPLOYMENT RATE
Lake Nebagamon Zip Codes
Lake Nebagamon Area Codes
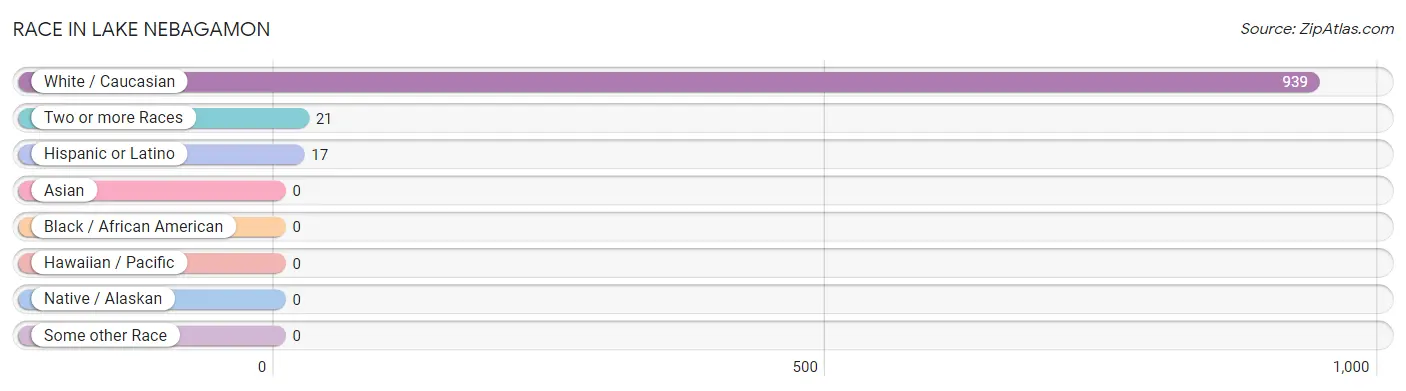
Race in Lake Nebagamon
The most populous races in Lake Nebagamon are White / Caucasian (939 | 97.8%), Two or more Races (21 | 2.2%), and Hispanic or Latino (17 | 1.8%).
| Race | # Population | % Population |
| Asian | 0 | 0.0% |
| Black / African American | 0 | 0.0% |
| Hawaiian / Pacific | 0 | 0.0% |
| Hispanic or Latino | 17 | 1.8% |
| Native / Alaskan | 0 | 0.0% |
| White / Caucasian | 939 | 97.8% |
| Two or more Races | 21 | 2.2% |
| Some other Race | 0 | 0.0% |
| Total | 960 | 100.0% |
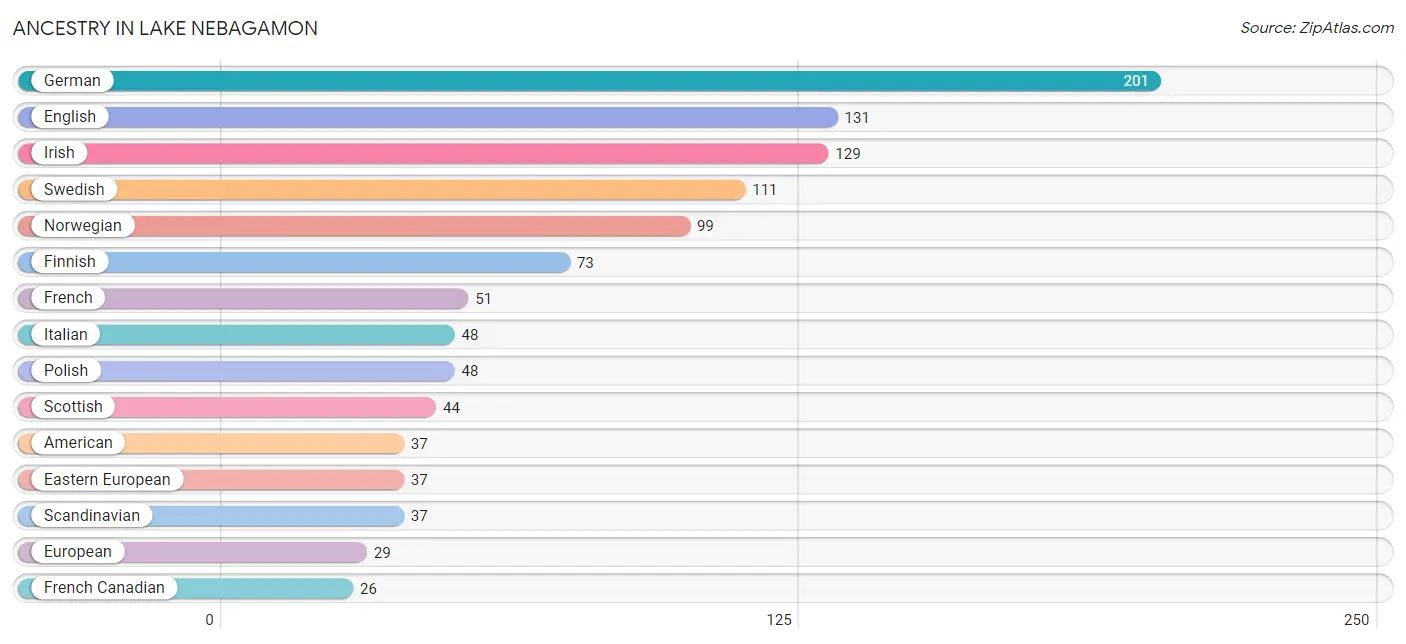
Ancestry in Lake Nebagamon
The most populous ancestries reported in Lake Nebagamon are German (201 | 20.9%), English (131 | 13.7%), Irish (129 | 13.4%), Swedish (111 | 11.6%), and Norwegian (99 | 10.3%), together accounting for 69.9% of all Lake Nebagamon residents.
| Ancestry | # Population | % Population |
| American | 37 | 3.8% |
| Belgian | 9 | 0.9% |
| British | 5 | 0.5% |
| Chippewa | 4 | 0.4% |
| Croatian | 6 | 0.6% |
| Czech | 2 | 0.2% |
| Danish | 14 | 1.5% |
| Dutch | 18 | 1.9% |
| Eastern European | 37 | 3.8% |
| English | 131 | 13.7% |
| European | 29 | 3.0% |
| Finnish | 73 | 7.6% |
| French | 51 | 5.3% |
| French Canadian | 26 | 2.7% |
| German | 201 | 20.9% |
| Irish | 129 | 13.4% |
| Italian | 48 | 5.0% |
| Norwegian | 99 | 10.3% |
| Polish | 48 | 5.0% |
| Puerto Rican | 17 | 1.8% |
| Scandinavian | 37 | 3.8% |
| Scottish | 44 | 4.6% |
| Serbian | 4 | 0.4% |
| Slovene | 2 | 0.2% |
| Swedish | 111 | 11.6% |
| Swiss | 14 | 1.5% |
| Turkish | 3 | 0.3% |
| Ukrainian | 3 | 0.3% | View All 28 Rows |
Immigrants in Lake Nebagamon

| Immigration Origin | # Population | % Population | View All 0 Rows |
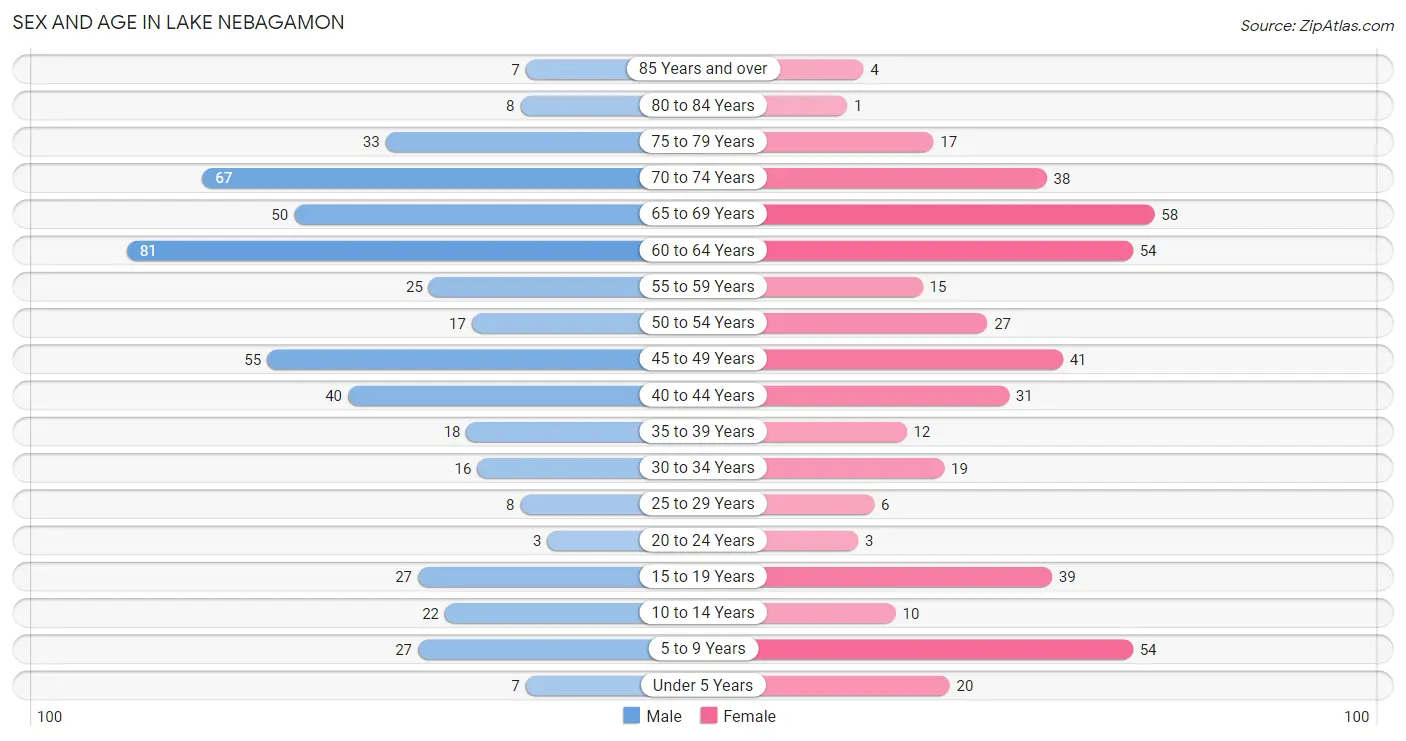
Sex and Age in Lake Nebagamon
Sex and Age in Lake Nebagamon
The most populous age groups in Lake Nebagamon are 60 to 64 Years (81 | 15.9%) for men and 65 to 69 Years (58 | 12.9%) for women.
| Age Bracket | Male | Female |
| Under 5 Years | 7 (1.4%) | 20 (4.4%) |
| 5 to 9 Years | 27 (5.3%) | 54 (12.0%) |
| 10 to 14 Years | 22 (4.3%) | 10 (2.2%) |
| 15 to 19 Years | 27 (5.3%) | 39 (8.7%) |
| 20 to 24 Years | 3 (0.6%) | 3 (0.7%) |
| 25 to 29 Years | 8 (1.6%) | 6 (1.3%) |
| 30 to 34 Years | 16 (3.1%) | 19 (4.2%) |
| 35 to 39 Years | 18 (3.5%) | 12 (2.7%) |
| 40 to 44 Years | 40 (7.8%) | 31 (6.9%) |
| 45 to 49 Years | 55 (10.8%) | 41 (9.1%) |
| 50 to 54 Years | 17 (3.3%) | 27 (6.0%) |
| 55 to 59 Years | 25 (4.9%) | 15 (3.3%) |
| 60 to 64 Years | 81 (15.9%) | 54 (12.0%) |
| 65 to 69 Years | 50 (9.8%) | 58 (12.9%) |
| 70 to 74 Years | 67 (13.1%) | 38 (8.5%) |
| 75 to 79 Years | 33 (6.5%) | 17 (3.8%) |
| 80 to 84 Years | 8 (1.6%) | 1 (0.2%) |
| 85 Years and over | 7 (1.4%) | 4 (0.9%) |
| Total | 511 (100.0%) | 449 (100.0%) |
Families and Households in Lake Nebagamon
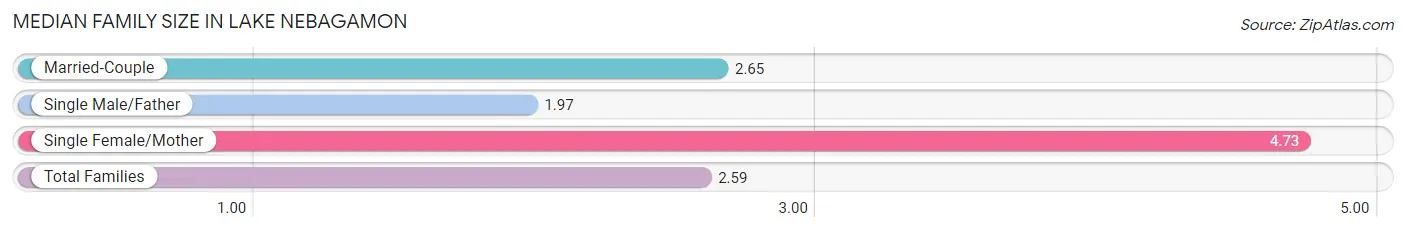
Median Family Size in Lake Nebagamon
The median family size in Lake Nebagamon is 2.59 persons per family, with single female/mother families (11 | 3.7%) accounting for the largest median family size of 4.73 persons per family. On the other hand, single male/father families (59 | 19.8%) represent the smallest median family size with 1.97 persons per family.
| Family Type | # Families | Family Size |
| Married-Couple | 228 (76.5%) | 2.65 |
| Single Male/Father | 59 (19.8%) | 1.97 |
| Single Female/Mother | 11 (3.7%) | 4.73 |
| Total Families | 298 (100.0%) | 2.59 |
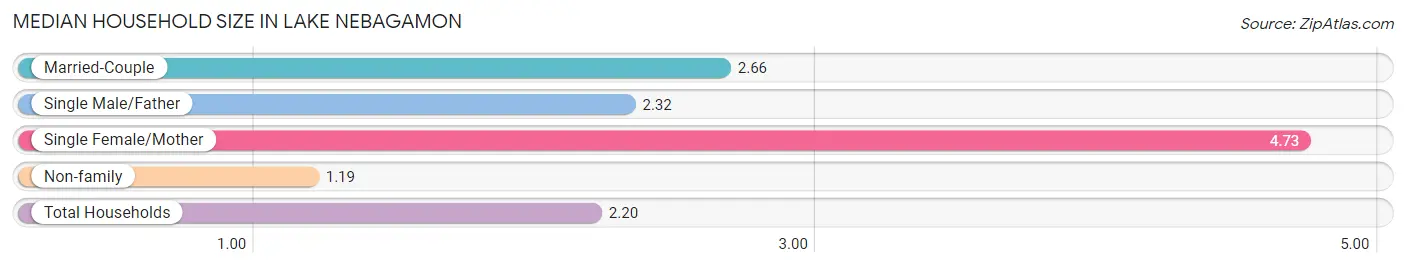
Median Household Size in Lake Nebagamon
The median household size in Lake Nebagamon is 2.20 persons per household, with single female/mother households (11 | 2.5%) accounting for the largest median household size of 4.73 persons per household. non-family households (138 | 31.7%) represent the smallest median household size with 1.19 persons per household.
| Household Type | # Households | Household Size |
| Married-Couple | 228 (52.3%) | 2.66 |
| Single Male/Father | 59 (13.5%) | 2.32 |
| Single Female/Mother | 11 (2.5%) | 4.73 |
| Non-family | 138 (31.7%) | 1.19 |
| Total Households | 436 (100.0%) | 2.20 |
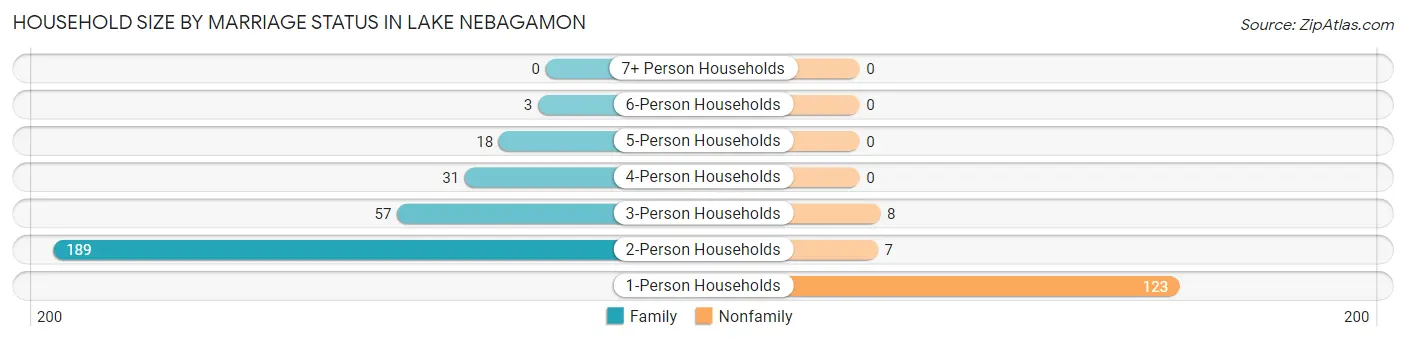
Household Size by Marriage Status in Lake Nebagamon
Out of a total of 436 households in Lake Nebagamon, 298 (68.3%) are family households, while 138 (31.7%) are nonfamily households. The most numerous type of family households are 2-person households, comprising 189, and the most common type of nonfamily households are 1-person households, comprising 123.
| Household Size | Family Households | Nonfamily Households |
| 1-Person Households | - | 123 (28.2%) |
| 2-Person Households | 189 (43.3%) | 7 (1.6%) |
| 3-Person Households | 57 (13.1%) | 8 (1.8%) |
| 4-Person Households | 31 (7.1%) | 0 (0.0%) |
| 5-Person Households | 18 (4.1%) | 0 (0.0%) |
| 6-Person Households | 3 (0.7%) | 0 (0.0%) |
| 7+ Person Households | 0 (0.0%) | 0 (0.0%) |
| Total | 298 (68.3%) | 138 (31.7%) |
Female Fertility in Lake Nebagamon
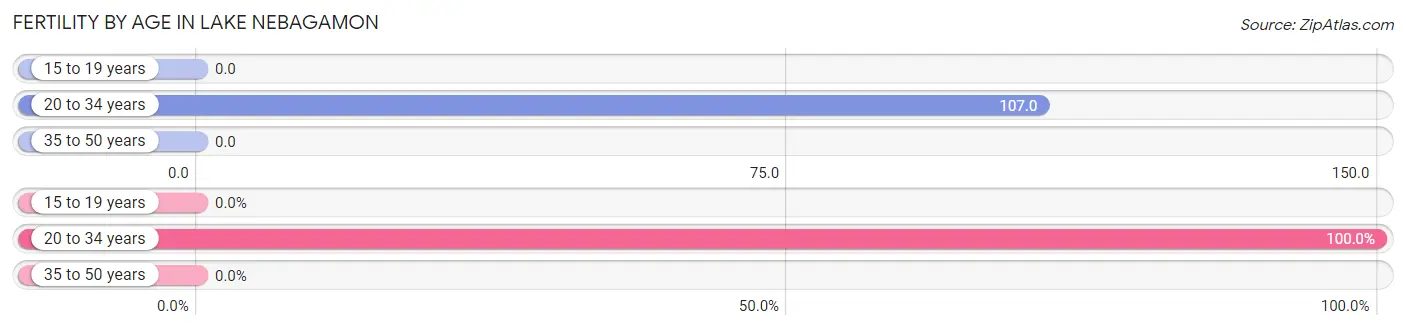
Fertility by Age in Lake Nebagamon
Average fertility rate in Lake Nebagamon is 19.0 births per 1,000 women. Women in the age bracket of 20 to 34 years have the highest fertility rate with 107.0 births per 1,000 women. Women in the age bracket of 20 to 34 years acount for 100.0% of all women with births.
| Age Bracket | Women with Births | Births / 1,000 Women |
| 15 to 19 years | 0 (0.0%) | 0.0 |
| 20 to 34 years | 3 (100.0%) | 107.0 |
| 35 to 50 years | 0 (0.0%) | 0.0 |
| Total | 3 (100.0%) | 19.0 |
Fertility by Age by Marriage Status in Lake Nebagamon
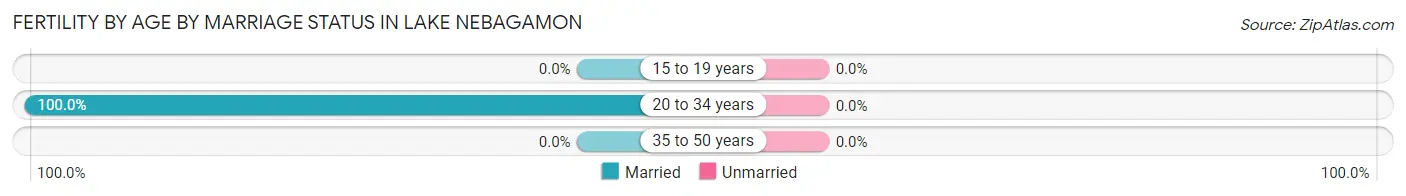
| Age Bracket | Married | Unmarried |
| 15 to 19 years | 0 (0.0%) | 0 (0.0%) |
| 20 to 34 years | 3 (100.0%) | 0 (0.0%) |
| 35 to 50 years | 0 (0.0%) | 0 (0.0%) |
| Total | 3 (100.0%) | 0 (0.0%) |
Fertility by Education in Lake Nebagamon
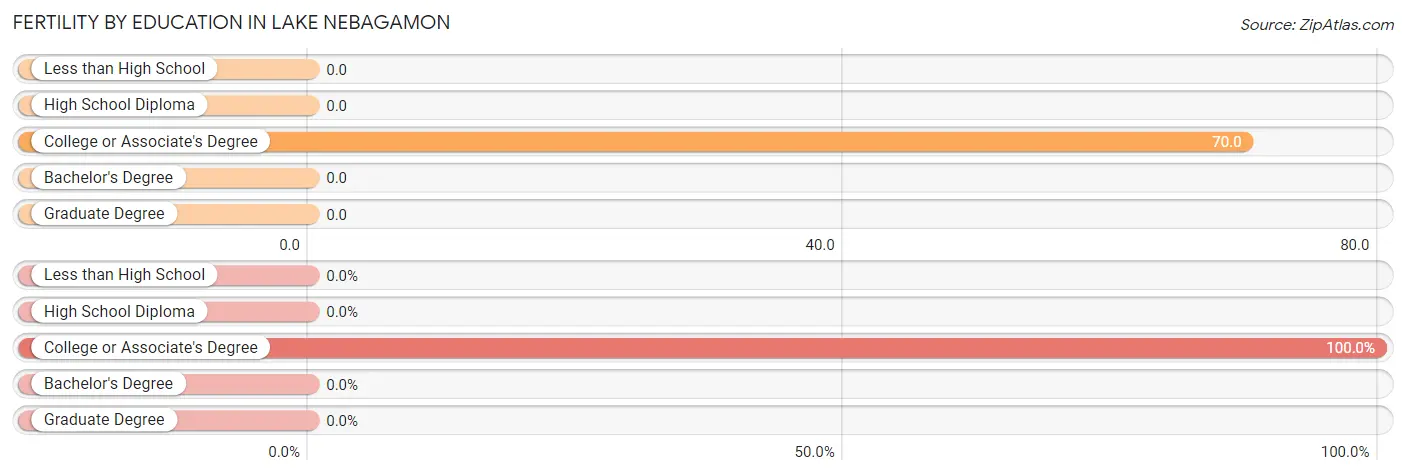
| Educational Attainment | Women with Births | Births / 1,000 Women |
| Less than High School | 0 (0.0%) | 0.0 |
| High School Diploma | 0 (0.0%) | 0.0 |
| College or Associate's Degree | 3 (100.0%) | 70.0 |
| Bachelor's Degree | 0 (0.0%) | 0.0 |
| Graduate Degree | 0 (0.0%) | 0.0 |
| Total | 3 (100.0%) | 19.0 |
Fertility by Education by Marriage Status in Lake Nebagamon
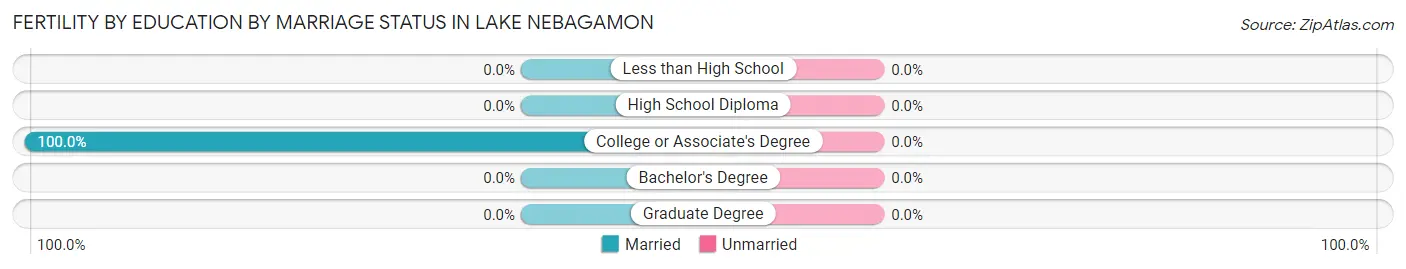
| Educational Attainment | Married | Unmarried |
| Less than High School | 0 (0.0%) | 0 (0.0%) |
| High School Diploma | 0 (0.0%) | 0 (0.0%) |
| College or Associate's Degree | 3 (100.0%) | 0 (0.0%) |
| Bachelor's Degree | 0 (0.0%) | 0 (0.0%) |
| Graduate Degree | 0 (0.0%) | 0 (0.0%) |
| Total | 3 (100.0%) | 0 (0.0%) |
Income in Lake Nebagamon
Income Overview in Lake Nebagamon
Per Capita Income in Lake Nebagamon is $42,713, while median incomes of families and households are $94,375 and $74,444 respectively.
| Characteristic | Number | Measure |
| Per Capita Income | 960 | $42,713 |
| Median Family Income | 298 | $94,375 |
| Mean Family Income | 298 | $110,860 |
| Median Household Income | 436 | $74,444 |
| Mean Household Income | 436 | $92,400 |
| Income Deficit | 298 | $0 |
| Wage / Income Gap (%) | 960 | 10.86% |
| Wage / Income Gap ($) | 960 | 89.14¢ per $1 |
| Gini / Inequality Index | 960 | 0.41 |
Earnings by Sex in Lake Nebagamon
Average Earnings in Lake Nebagamon are $45,875, $49,196 for men and $43,854 for women, a difference of 10.9%.
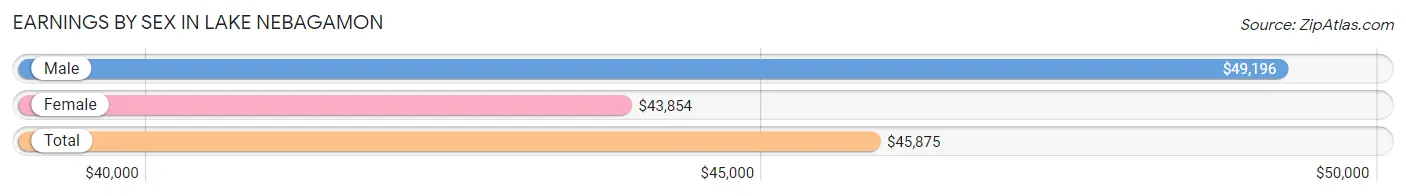
| Sex | Number | Average Earnings |
| Male | 281 (56.0%) | $49,196 |
| Female | 221 (44.0%) | $43,854 |
| Total | 502 (100.0%) | $45,875 |
Earnings by Sex by Income Bracket in Lake Nebagamon
The most common earnings brackets in Lake Nebagamon are $75,000 to $99,999 for men (39 | 13.9%) and $65,000 to $74,999 for women (45 | 20.4%).
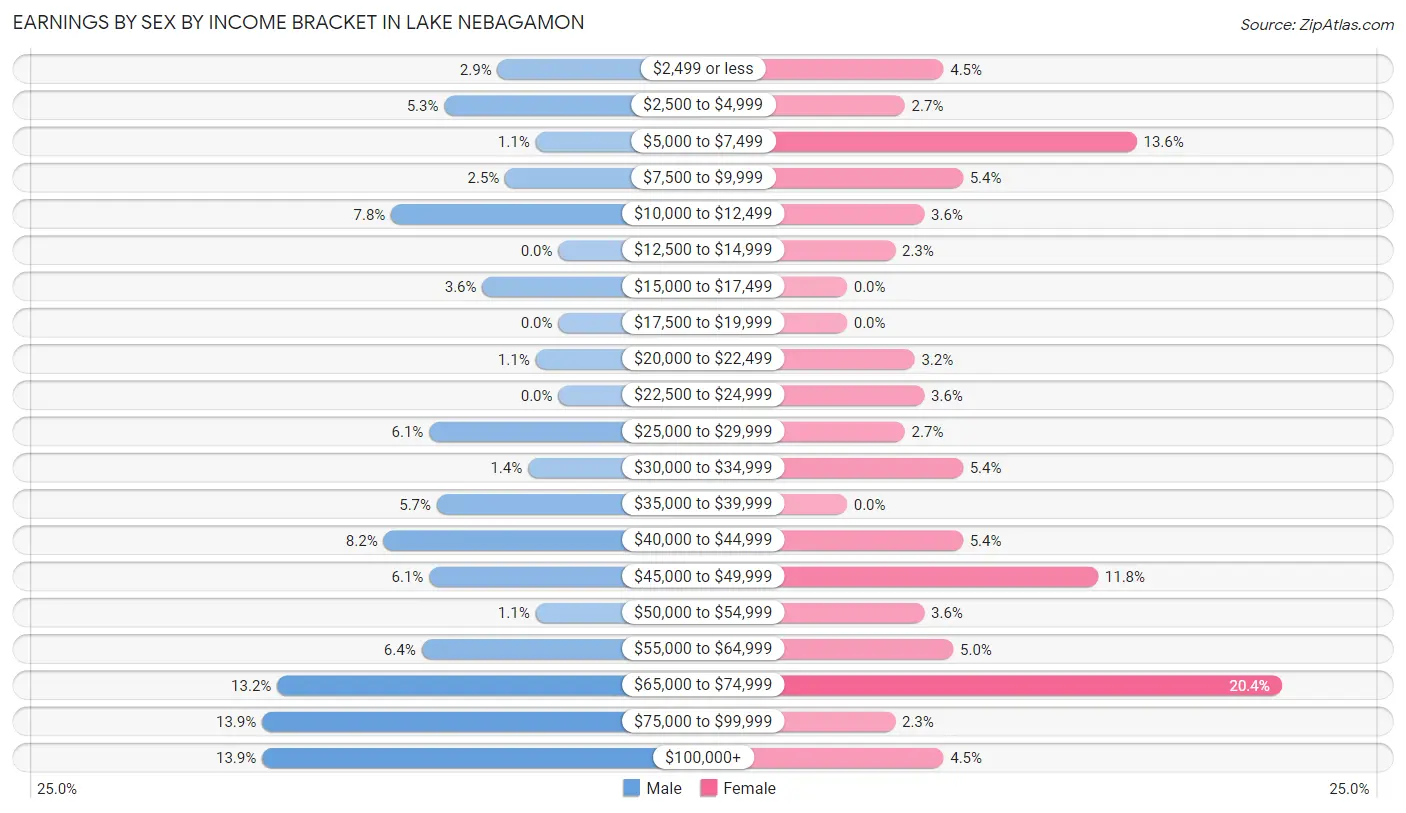
| Income | Male | Female |
| $2,499 or less | 8 (2.9%) | 10 (4.5%) |
| $2,500 to $4,999 | 15 (5.3%) | 6 (2.7%) |
| $5,000 to $7,499 | 3 (1.1%) | 30 (13.6%) |
| $7,500 to $9,999 | 7 (2.5%) | 12 (5.4%) |
| $10,000 to $12,499 | 22 (7.8%) | 8 (3.6%) |
| $12,500 to $14,999 | 0 (0.0%) | 5 (2.3%) |
| $15,000 to $17,499 | 10 (3.6%) | 0 (0.0%) |
| $17,500 to $19,999 | 0 (0.0%) | 0 (0.0%) |
| $20,000 to $22,499 | 3 (1.1%) | 7 (3.2%) |
| $22,500 to $24,999 | 0 (0.0%) | 8 (3.6%) |
| $25,000 to $29,999 | 17 (6.0%) | 6 (2.7%) |
| $30,000 to $34,999 | 4 (1.4%) | 12 (5.4%) |
| $35,000 to $39,999 | 16 (5.7%) | 0 (0.0%) |
| $40,000 to $44,999 | 23 (8.2%) | 12 (5.4%) |
| $45,000 to $49,999 | 17 (6.0%) | 26 (11.8%) |
| $50,000 to $54,999 | 3 (1.1%) | 8 (3.6%) |
| $55,000 to $64,999 | 18 (6.4%) | 11 (5.0%) |
| $65,000 to $74,999 | 37 (13.2%) | 45 (20.4%) |
| $75,000 to $99,999 | 39 (13.9%) | 5 (2.3%) |
| $100,000+ | 39 (13.9%) | 10 (4.5%) |
| Total | 281 (100.0%) | 221 (100.0%) |
Earnings by Sex by Educational Attainment in Lake Nebagamon
Average earnings in Lake Nebagamon are $58,333 for men and $45,441 for women, a difference of 22.1%. Men with an educational attainment of graduate degree enjoy the highest average annual earnings of $78,281, while those with less than high school education earn the least with $16,406. Women with an educational attainment of graduate degree earn the most with the average annual earnings of $53,750, while those with college or associate's degree education have the smallest earnings of $34,583.
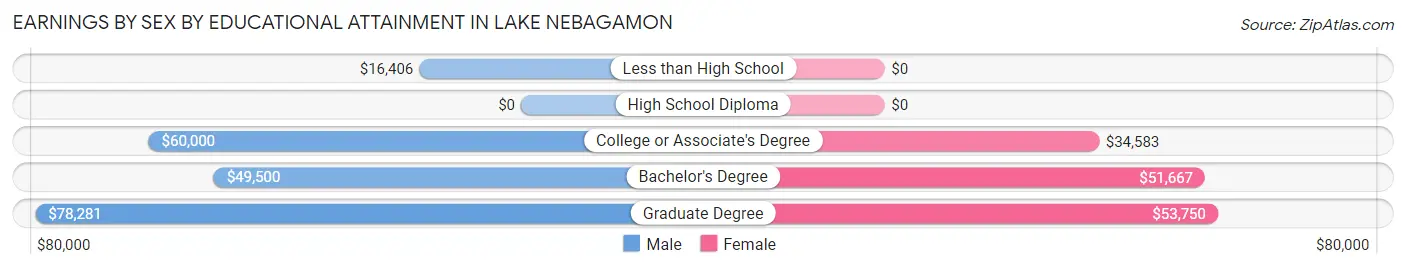
| Educational Attainment | Male Income | Female Income |
| Less than High School | $16,406 | $0 |
| High School Diploma | - | - |
| College or Associate's Degree | $60,000 | $34,583 |
| Bachelor's Degree | $49,500 | $51,667 |
| Graduate Degree | $78,281 | $53,750 |
| Total | $58,333 | $45,441 |
Family Income in Lake Nebagamon
Family Income Brackets in Lake Nebagamon
According to the Lake Nebagamon family income data, there are 68 families falling into the $100,000 to $149,999 income range, which is the most common income bracket and makes up 22.8% of all families.
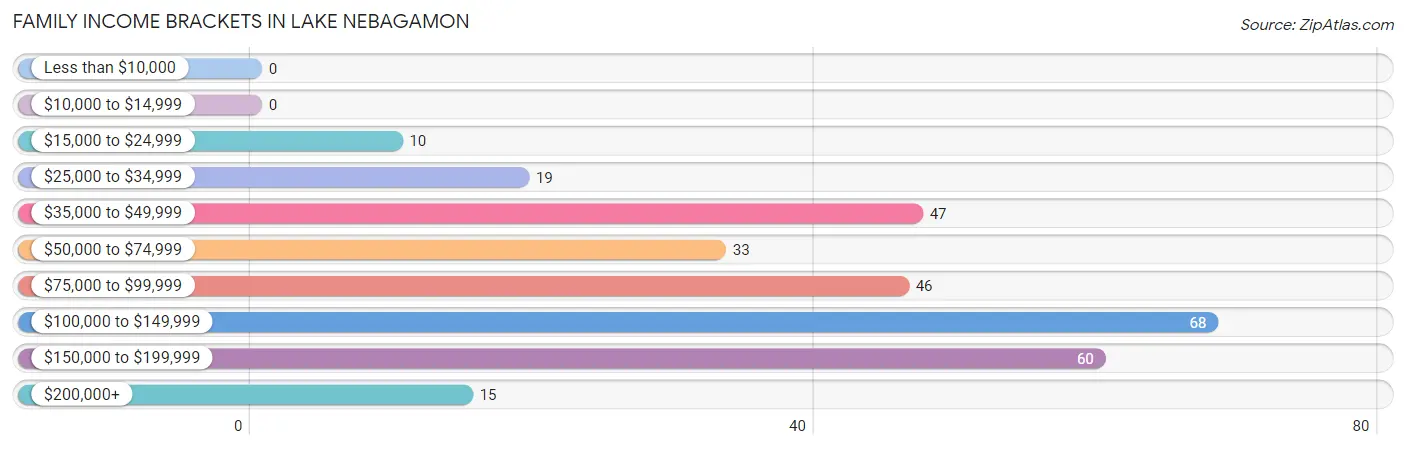
| Income Bracket | # Families | % Families |
| Less than $10,000 | 0 | 0.0% |
| $10,000 to $14,999 | 0 | 0.0% |
| $15,000 to $24,999 | 10 | 3.4% |
| $25,000 to $34,999 | 19 | 6.4% |
| $35,000 to $49,999 | 47 | 15.8% |
| $50,000 to $74,999 | 33 | 11.1% |
| $75,000 to $99,999 | 46 | 15.4% |
| $100,000 to $149,999 | 68 | 22.8% |
| $150,000 to $199,999 | 60 | 20.1% |
| $200,000+ | 15 | 5.0% |
Family Income by Famaliy Size in Lake Nebagamon
4-person families (22 | 7.4%) account for the highest median family income in Lake Nebagamon with $153,929 per family, while 2-person families (199 | 66.8%) have the highest median income of $45,938 per family member.
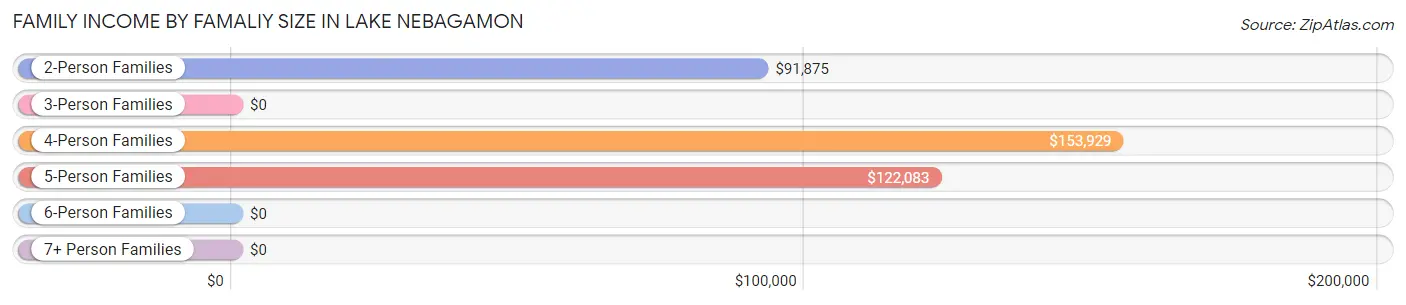
| Income Bracket | # Families | Median Income |
| 2-Person Families | 199 (66.8%) | $91,875 |
| 3-Person Families | 59 (19.8%) | $0 |
| 4-Person Families | 22 (7.4%) | $153,929 |
| 5-Person Families | 15 (5.0%) | $122,083 |
| 6-Person Families | 3 (1.0%) | $0 |
| 7+ Person Families | 0 (0.0%) | $0 |
| Total | 298 (100.0%) | $94,375 |
Family Income by Number of Earners in Lake Nebagamon
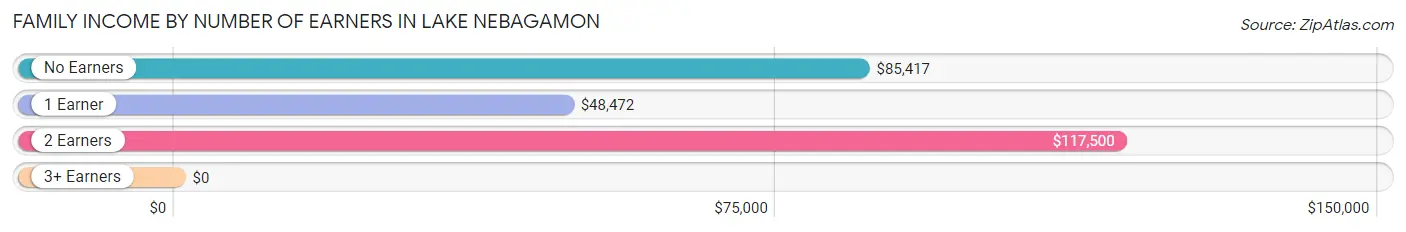
| Number of Earners | # Families | Median Income |
| No Earners | 63 (21.1%) | $85,417 |
| 1 Earner | 81 (27.2%) | $48,472 |
| 2 Earners | 146 (49.0%) | $117,500 |
| 3+ Earners | 8 (2.7%) | $0 |
| Total | 298 (100.0%) | $94,375 |
Household Income in Lake Nebagamon
Household Income Brackets in Lake Nebagamon
With 89 households falling in the category, the $100,000 to $149,999 income range is the most frequent in Lake Nebagamon, accounting for 20.4% of all households. In contrast, only 9 households (2.1%) fall into the $10,000 to $14,999 income bracket, making it the least populous group.
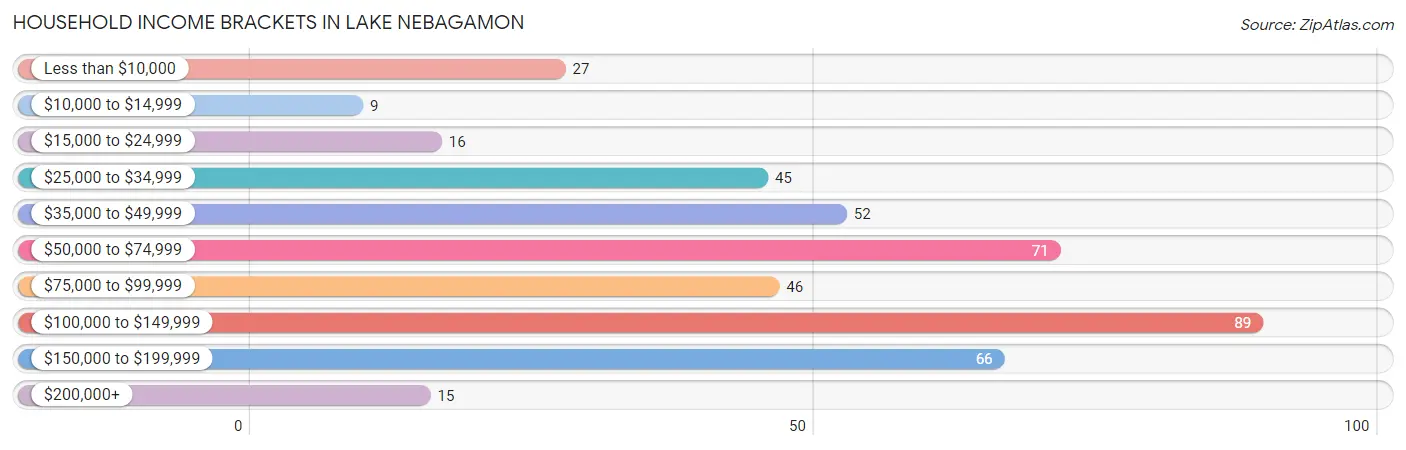
| Income Bracket | # Households | % Households |
| Less than $10,000 | 27 | 6.2% |
| $10,000 to $14,999 | 9 | 2.1% |
| $15,000 to $24,999 | 16 | 3.7% |
| $25,000 to $34,999 | 45 | 10.3% |
| $35,000 to $49,999 | 52 | 11.9% |
| $50,000 to $74,999 | 71 | 16.3% |
| $75,000 to $99,999 | 46 | 10.6% |
| $100,000 to $149,999 | 89 | 20.4% |
| $150,000 to $199,999 | 66 | 15.1% |
| $200,000+ | 15 | 3.4% |
Household Income by Householder Age in Lake Nebagamon
The median household income in Lake Nebagamon is $74,444, with the highest median household income of $108,750 found in the 45 to 64 years age bracket for the primary householder. A total of 185 households (42.4%) fall into this category. Meanwhile, the 15 to 24 years age bracket for the primary householder has the lowest median household income of $0, with 3 households (0.7%) in this group.
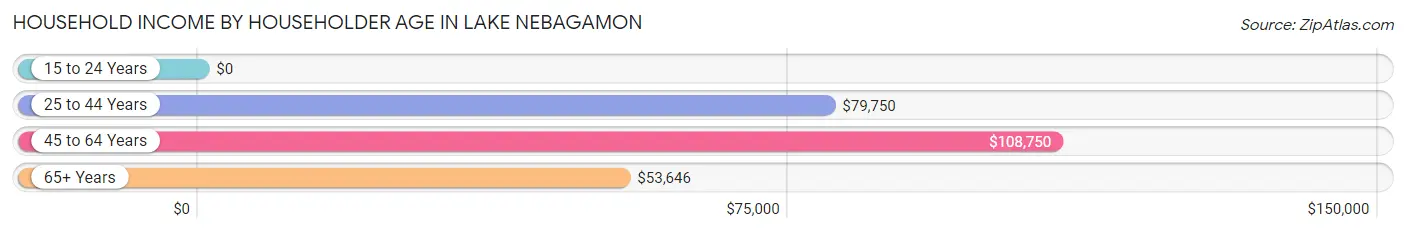
| Income Bracket | # Households | Median Income |
| 15 to 24 Years | 3 (0.7%) | $0 |
| 25 to 44 Years | 61 (14.0%) | $79,750 |
| 45 to 64 Years | 185 (42.4%) | $108,750 |
| 65+ Years | 187 (42.9%) | $53,646 |
| Total | 436 (100.0%) | $74,444 |
Poverty in Lake Nebagamon
Income Below Poverty by Sex and Age in Lake Nebagamon
With 4.9% poverty level for males and 4.9% for females among the residents of Lake Nebagamon, 75 year old and over males and 16 and 17 year old females are the most vulnerable to poverty, with 9 males (18.8%) and 8 females (40.0%) in their respective age groups living below the poverty level.
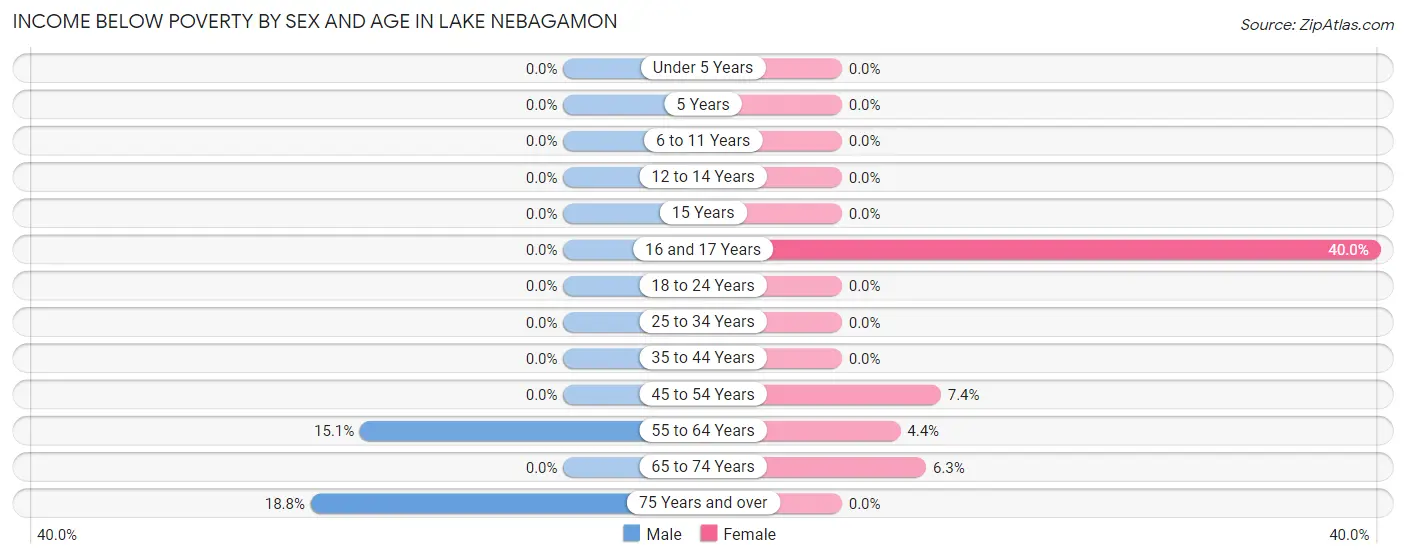
| Age Bracket | Male | Female |
| Under 5 Years | 0 (0.0%) | 0 (0.0%) |
| 5 Years | 0 (0.0%) | 0 (0.0%) |
| 6 to 11 Years | 0 (0.0%) | 0 (0.0%) |
| 12 to 14 Years | 0 (0.0%) | 0 (0.0%) |
| 15 Years | 0 (0.0%) | 0 (0.0%) |
| 16 and 17 Years | 0 (0.0%) | 8 (40.0%) |
| 18 to 24 Years | 0 (0.0%) | 0 (0.0%) |
| 25 to 34 Years | 0 (0.0%) | 0 (0.0%) |
| 35 to 44 Years | 0 (0.0%) | 0 (0.0%) |
| 45 to 54 Years | 0 (0.0%) | 5 (7.3%) |
| 55 to 64 Years | 16 (15.1%) | 3 (4.3%) |
| 65 to 74 Years | 0 (0.0%) | 6 (6.2%) |
| 75 Years and over | 9 (18.8%) | 0 (0.0%) |
| Total | 25 (4.9%) | 22 (4.9%) |
Income Above Poverty by Sex and Age in Lake Nebagamon
According to the poverty statistics in Lake Nebagamon, males aged under 5 years and females aged under 5 years are the age groups that are most secure financially, with 100.0% of males and 100.0% of females in these age groups living above the poverty line.
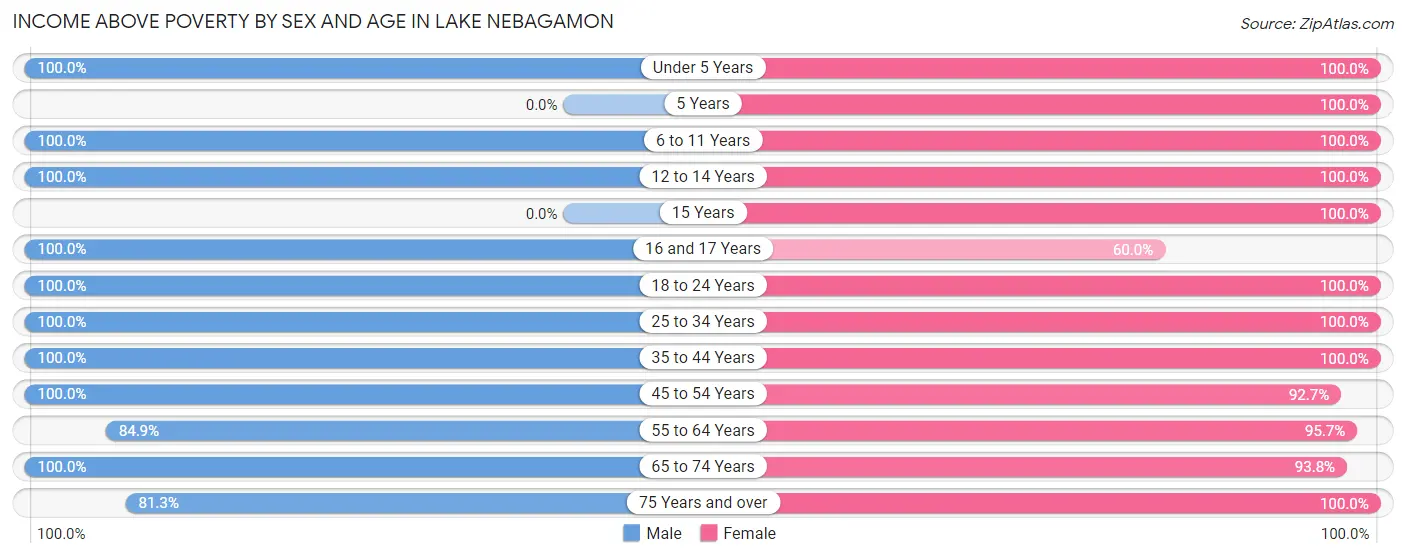
| Age Bracket | Male | Female |
| Under 5 Years | 7 (100.0%) | 20 (100.0%) |
| 5 Years | 0 (0.0%) | 13 (100.0%) |
| 6 to 11 Years | 33 (100.0%) | 48 (100.0%) |
| 12 to 14 Years | 16 (100.0%) | 3 (100.0%) |
| 15 Years | 0 (0.0%) | 7 (100.0%) |
| 16 and 17 Years | 18 (100.0%) | 12 (60.0%) |
| 18 to 24 Years | 12 (100.0%) | 15 (100.0%) |
| 25 to 34 Years | 24 (100.0%) | 25 (100.0%) |
| 35 to 44 Years | 58 (100.0%) | 43 (100.0%) |
| 45 to 54 Years | 72 (100.0%) | 63 (92.6%) |
| 55 to 64 Years | 90 (84.9%) | 66 (95.7%) |
| 65 to 74 Years | 117 (100.0%) | 90 (93.8%) |
| 75 Years and over | 39 (81.2%) | 22 (100.0%) |
| Total | 486 (95.1%) | 427 (95.1%) |
Income Below Poverty Among Married-Couple Families in Lake Nebagamon
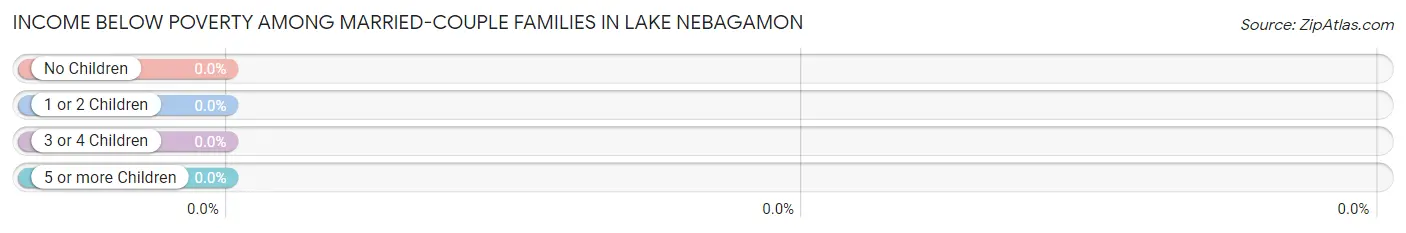
| Children | Above Poverty | Below Poverty |
| No Children | 156 (100.0%) | 0 (0.0%) |
| 1 or 2 Children | 57 (100.0%) | 0 (0.0%) |
| 3 or 4 Children | 15 (100.0%) | 0 (0.0%) |
| 5 or more Children | 0 (0.0%) | 0 (0.0%) |
| Total | 228 (100.0%) | 0 (0.0%) |
Income Below Poverty Among Single-Parent Households in Lake Nebagamon
| Children | Single Father | Single Mother |
| No Children | 0 (0.0%) | 0 (0.0%) |
| 1 or 2 Children | 0 (0.0%) | 0 (0.0%) |
| 3 or 4 Children | 0 (0.0%) | 0 (0.0%) |
| 5 or more Children | 0 (0.0%) | 0 (0.0%) |
| Total | 0 (0.0%) | 0 (0.0%) |
Income Below Poverty Among Married-Couple vs Single-Parent Households in Lake Nebagamon
| Children | Married-Couple Families | Single-Parent Households |
| No Children | 0 (0.0%) | 0 (0.0%) |
| 1 or 2 Children | 0 (0.0%) | 0 (0.0%) |
| 3 or 4 Children | 0 (0.0%) | 0 (0.0%) |
| 5 or more Children | 0 (0.0%) | 0 (0.0%) |
| Total | 0 (0.0%) | 0 (0.0%) |
Employment Characteristics in Lake Nebagamon
Employment by Class of Employer in Lake Nebagamon
Among the 426 employed individuals in Lake Nebagamon, private company employees (233 | 54.7%), not-for-profit organizations (54 | 12.7%), and local government employees (43 | 10.1%) make up the most common classes of employment.
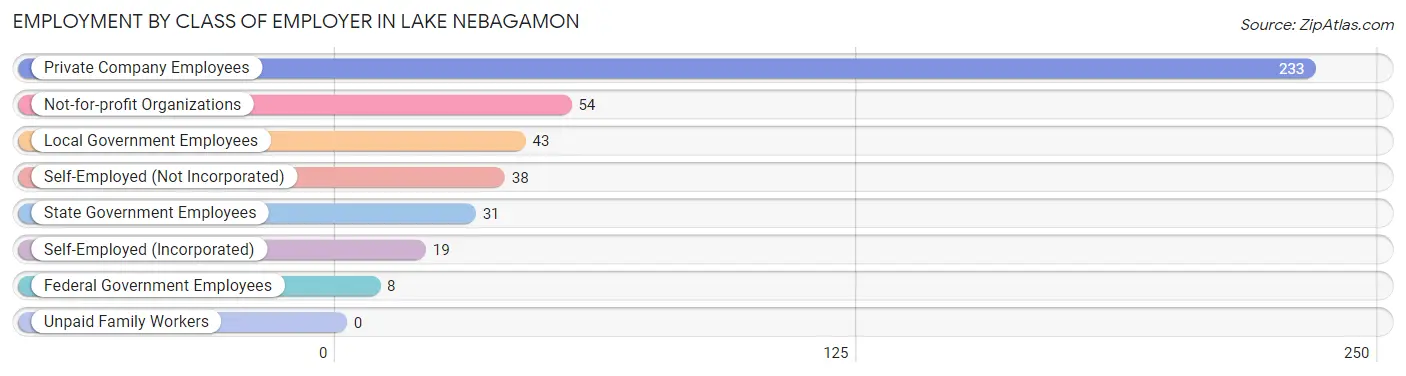
| Employer Class | # Employees | % Employees |
| Private Company Employees | 233 | 54.7% |
| Self-Employed (Incorporated) | 19 | 4.5% |
| Self-Employed (Not Incorporated) | 38 | 8.9% |
| Not-for-profit Organizations | 54 | 12.7% |
| Local Government Employees | 43 | 10.1% |
| State Government Employees | 31 | 7.3% |
| Federal Government Employees | 8 | 1.9% |
| Unpaid Family Workers | 0 | 0.0% |
| Total | 426 | 100.0% |
Employment Status by Age in Lake Nebagamon
According to the labor force statistics for Lake Nebagamon, out of the total population over 16 years of age (813), 54.2% or 441 individuals are in the labor force, with 3.4% or 15 of them unemployed. The age group with the highest labor force participation rate is 20 to 24 years, with 100.0% or 6 individuals in the labor force. Within the labor force, the 30 to 34 years age range has the highest percentage of unemployed individuals, with 14.3% or 5 of them being unemployed.
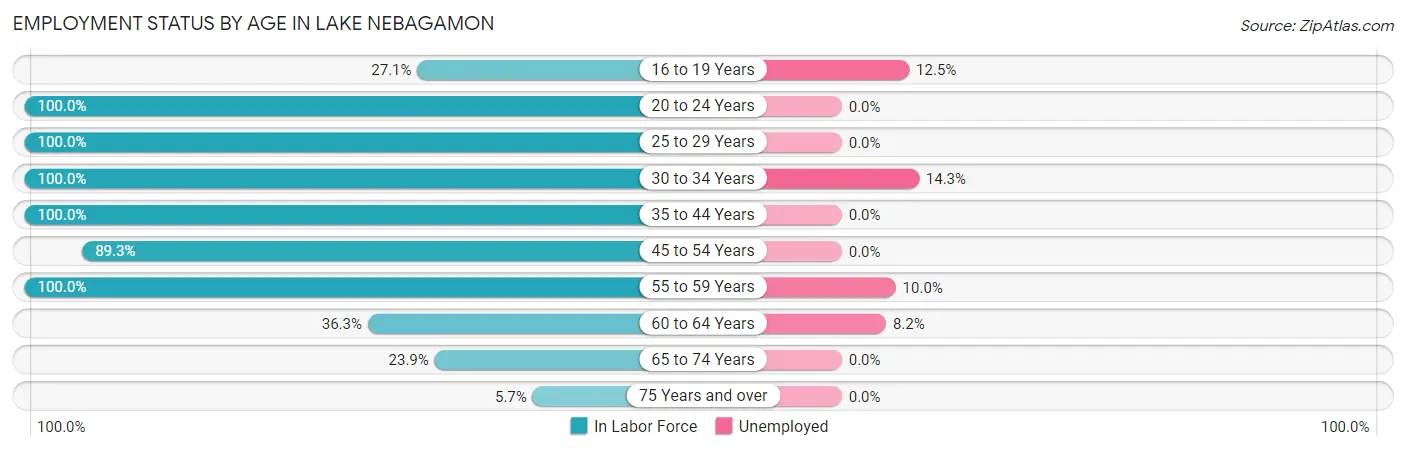
| Age Bracket | In Labor Force | Unemployed |
| 16 to 19 Years | 16 (27.1%) | 2 (12.5%) |
| 20 to 24 Years | 6 (100.0%) | 0 (0.0%) |
| 25 to 29 Years | 14 (100.0%) | 0 (0.0%) |
| 30 to 34 Years | 35 (100.0%) | 5 (14.3%) |
| 35 to 44 Years | 101 (100.0%) | 0 (0.0%) |
| 45 to 54 Years | 125 (89.3%) | 0 (0.0%) |
| 55 to 59 Years | 40 (100.0%) | 4 (10.0%) |
| 60 to 64 Years | 49 (36.3%) | 4 (8.2%) |
| 65 to 74 Years | 51 (23.9%) | 0 (0.0%) |
| 75 Years and over | 4 (5.7%) | 0 (0.0%) |
| Total | 441 (54.2%) | 15 (3.4%) |
Employment Status by Educational Attainment in Lake Nebagamon
According to labor force statistics for Lake Nebagamon, 78.3% of individuals (364) out of the total population between 25 and 64 years of age (465) are in the labor force, with 3.6% or 13 of them being unemployed. The group with the highest labor force participation rate are those with the educational attainment of bachelor's degree or higher, with 84.4% or 151 individuals in the labor force. Within the labor force, individuals with bachelor's degree or higher education have the highest percentage of unemployment, with 5.3% or 8 of them being unemployed.

| Educational Attainment | In Labor Force | Unemployed |
| Less than High School | 14 (58.3%) | 0 (0.0%) |
| High School Diploma | 42 (60.0%) | 0 (0.0%) |
| College / Associate Degree | 157 (81.8%) | 6 (3.2%) |
| Bachelor's Degree or higher | 151 (84.4%) | 9 (5.3%) |
| Total | 364 (78.3%) | 17 (3.6%) |
Employment Occupations by Sex in Lake Nebagamon
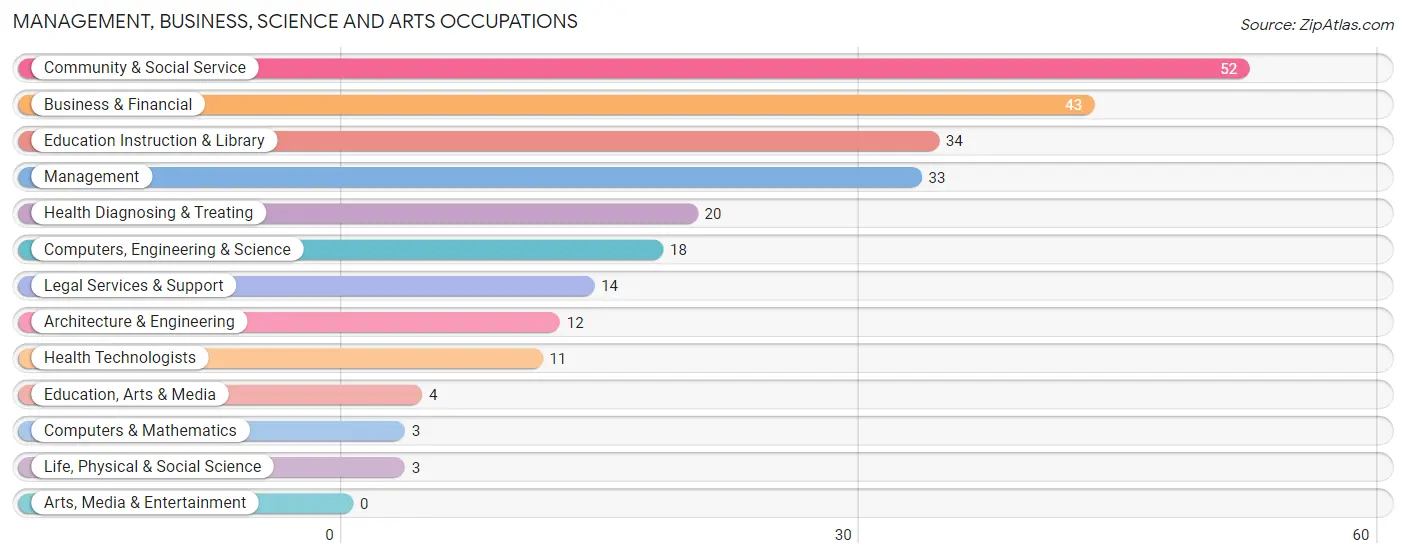
Management, Business, Science and Arts Occupations
The most common Management, Business, Science and Arts occupations in Lake Nebagamon are Community & Social Service (52 | 12.3%), Business & Financial (43 | 10.1%), Education Instruction & Library (34 | 8.0%), Management (33 | 7.8%), and Health Diagnosing & Treating (20 | 4.7%).
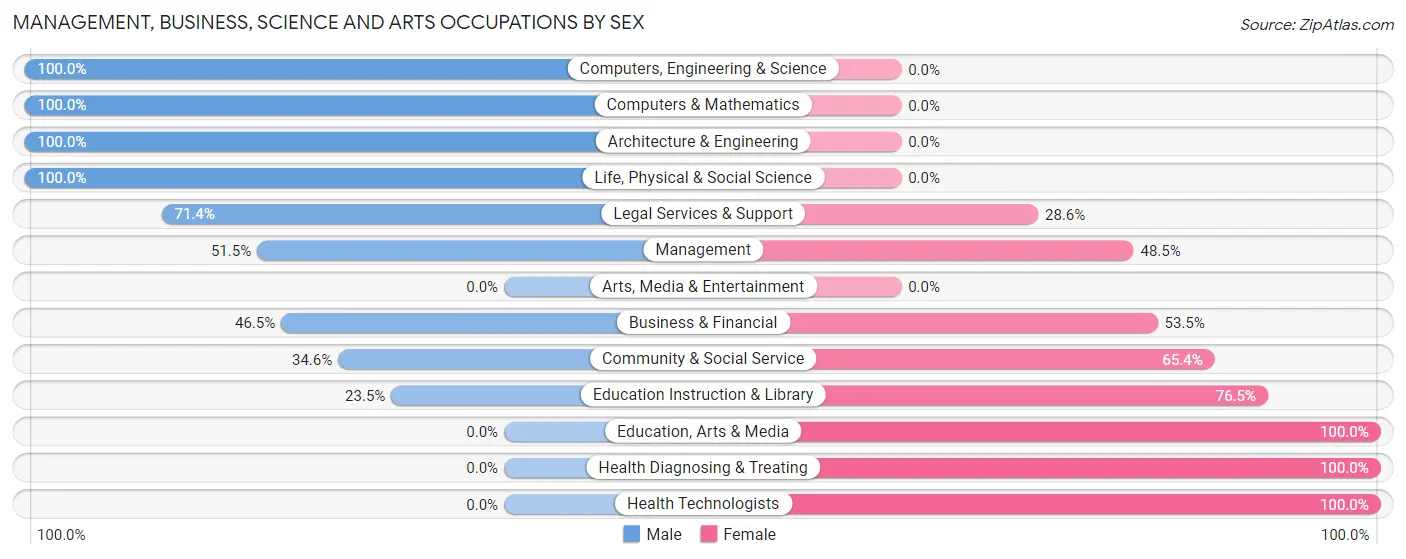
Management, Business, Science and Arts Occupations by Sex
Within the Management, Business, Science and Arts occupations in Lake Nebagamon, the most male-oriented occupations are Computers, Engineering & Science (100.0%), Computers & Mathematics (100.0%), and Architecture & Engineering (100.0%), while the most female-oriented occupations are Education, Arts & Media (100.0%), Health Diagnosing & Treating (100.0%), and Health Technologists (100.0%).
| Occupation | Male | Female |
| Management | 17 (51.5%) | 16 (48.5%) |
| Business & Financial | 20 (46.5%) | 23 (53.5%) |
| Computers, Engineering & Science | 18 (100.0%) | 0 (0.0%) |
| Computers & Mathematics | 3 (100.0%) | 0 (0.0%) |
| Architecture & Engineering | 12 (100.0%) | 0 (0.0%) |
| Life, Physical & Social Science | 3 (100.0%) | 0 (0.0%) |
| Community & Social Service | 18 (34.6%) | 34 (65.4%) |
| Education, Arts & Media | 0 (0.0%) | 4 (100.0%) |
| Legal Services & Support | 10 (71.4%) | 4 (28.6%) |
| Education Instruction & Library | 8 (23.5%) | 26 (76.5%) |
| Arts, Media & Entertainment | 0 (0.0%) | 0 (0.0%) |
| Health Diagnosing & Treating | 0 (0.0%) | 20 (100.0%) |
| Health Technologists | 0 (0.0%) | 11 (100.0%) |
| Total (Category) | 73 (44.0%) | 93 (56.0%) |
| Total (Overall) | 255 (60.1%) | 169 (39.9%) |
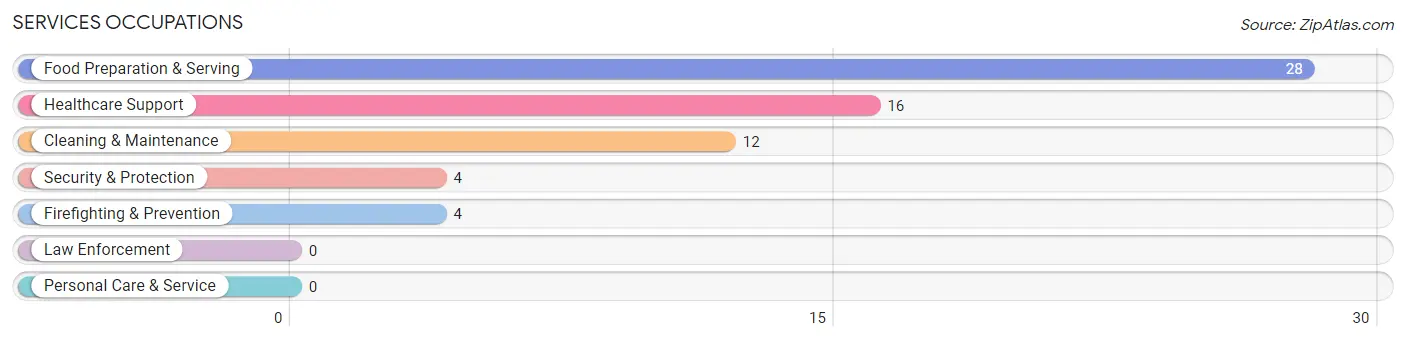
Services Occupations
The most common Services occupations in Lake Nebagamon are Food Preparation & Serving (28 | 6.6%), Healthcare Support (16 | 3.8%), Cleaning & Maintenance (12 | 2.8%), Security & Protection (4 | 0.9%), and Firefighting & Prevention (4 | 0.9%).
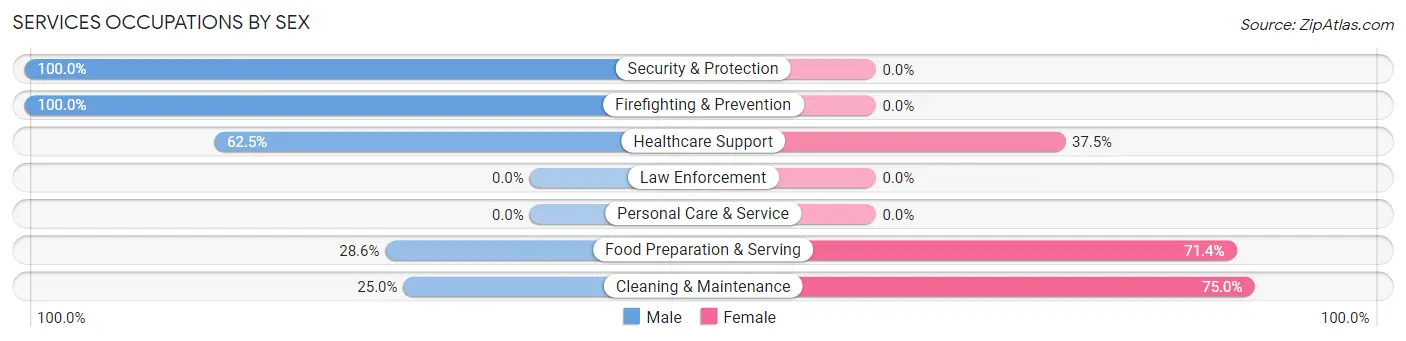
Services Occupations by Sex
Within the Services occupations in Lake Nebagamon, the most male-oriented occupations are Security & Protection (100.0%), Firefighting & Prevention (100.0%), and Healthcare Support (62.5%), while the most female-oriented occupations are Cleaning & Maintenance (75.0%), Food Preparation & Serving (71.4%), and Healthcare Support (37.5%).
| Occupation | Male | Female |
| Healthcare Support | 10 (62.5%) | 6 (37.5%) |
| Security & Protection | 4 (100.0%) | 0 (0.0%) |
| Firefighting & Prevention | 4 (100.0%) | 0 (0.0%) |
| Law Enforcement | 0 (0.0%) | 0 (0.0%) |
| Food Preparation & Serving | 8 (28.6%) | 20 (71.4%) |
| Cleaning & Maintenance | 3 (25.0%) | 9 (75.0%) |
| Personal Care & Service | 0 (0.0%) | 0 (0.0%) |
| Total (Category) | 25 (41.7%) | 35 (58.3%) |
| Total (Overall) | 255 (60.1%) | 169 (39.9%) |
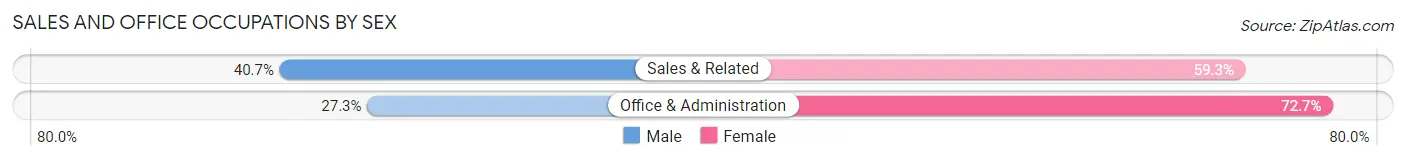
Sales and Office Occupations
The most common Sales and Office occupations in Lake Nebagamon are Sales & Related (27 | 6.4%), and Office & Administration (22 | 5.2%).

Sales and Office Occupations by Sex
| Occupation | Male | Female |
| Sales & Related | 11 (40.7%) | 16 (59.3%) |
| Office & Administration | 6 (27.3%) | 16 (72.7%) |
| Total (Category) | 17 (34.7%) | 32 (65.3%) |
| Total (Overall) | 255 (60.1%) | 169 (39.9%) |
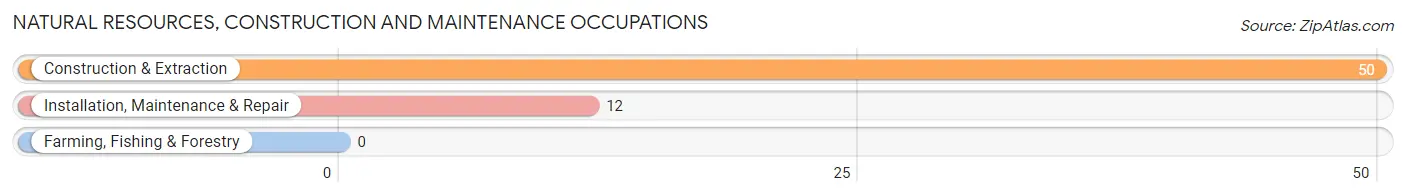
Natural Resources, Construction and Maintenance Occupations
The most common Natural Resources, Construction and Maintenance occupations in Lake Nebagamon are Construction & Extraction (50 | 11.8%), and Installation, Maintenance & Repair (12 | 2.8%).
Natural Resources, Construction and Maintenance Occupations by Sex
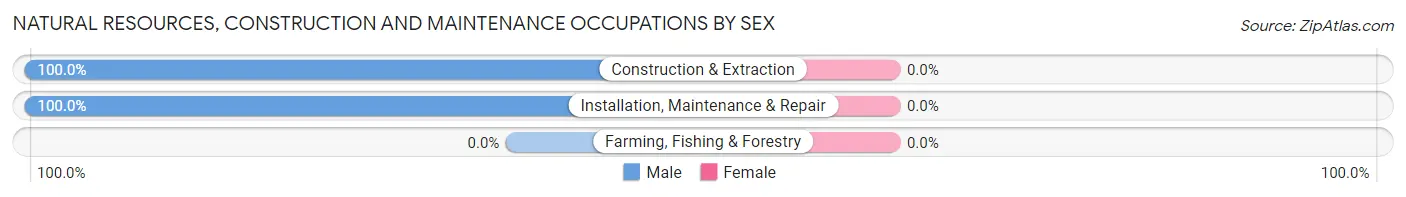
| Occupation | Male | Female |
| Farming, Fishing & Forestry | 0 (0.0%) | 0 (0.0%) |
| Construction & Extraction | 50 (100.0%) | 0 (0.0%) |
| Installation, Maintenance & Repair | 12 (100.0%) | 0 (0.0%) |
| Total (Category) | 62 (100.0%) | 0 (0.0%) |
| Total (Overall) | 255 (60.1%) | 169 (39.9%) |
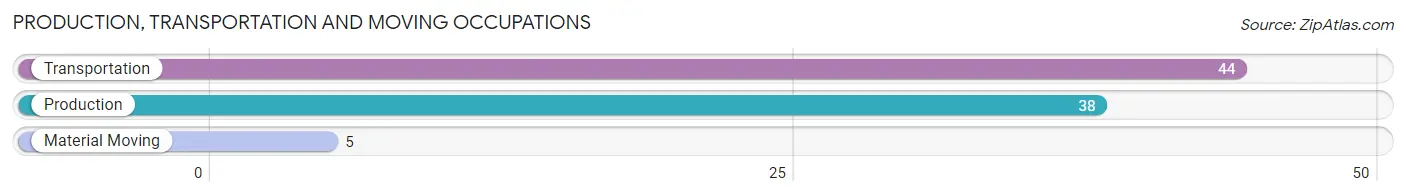
Production, Transportation and Moving Occupations
The most common Production, Transportation and Moving occupations in Lake Nebagamon are Transportation (44 | 10.4%), Production (38 | 9.0%), and Material Moving (5 | 1.2%).
Production, Transportation and Moving Occupations by Sex
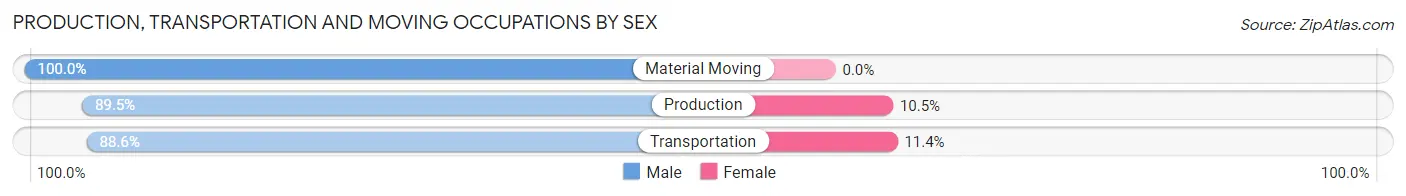
| Occupation | Male | Female |
| Production | 34 (89.5%) | 4 (10.5%) |
| Transportation | 39 (88.6%) | 5 (11.4%) |
| Material Moving | 5 (100.0%) | 0 (0.0%) |
| Total (Category) | 78 (89.7%) | 9 (10.3%) |
| Total (Overall) | 255 (60.1%) | 169 (39.9%) |
Employment Industries by Sex in Lake Nebagamon
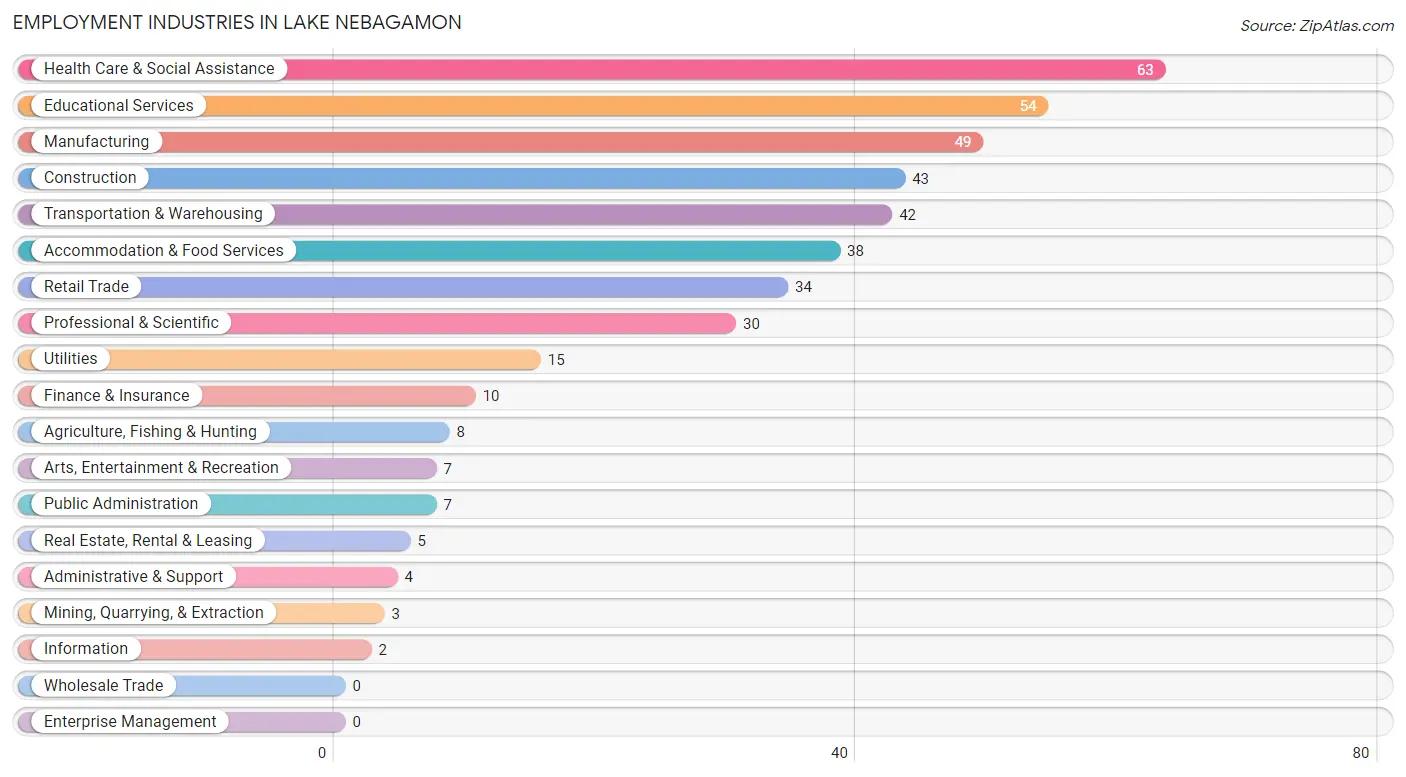
Employment Industries in Lake Nebagamon
The major employment industries in Lake Nebagamon include Health Care & Social Assistance (63 | 14.9%), Educational Services (54 | 12.7%), Manufacturing (49 | 11.6%), Construction (43 | 10.1%), and Transportation & Warehousing (42 | 9.9%).
Employment Industries by Sex in Lake Nebagamon
The Lake Nebagamon industries that see more men than women are Agriculture, Fishing & Hunting (100.0%), Mining, Quarrying, & Extraction (100.0%), and Utilities (100.0%), whereas the industries that tend to have a higher number of women are Real Estate, Rental & Leasing (100.0%), Health Care & Social Assistance (77.8%), and Finance & Insurance (70.0%).
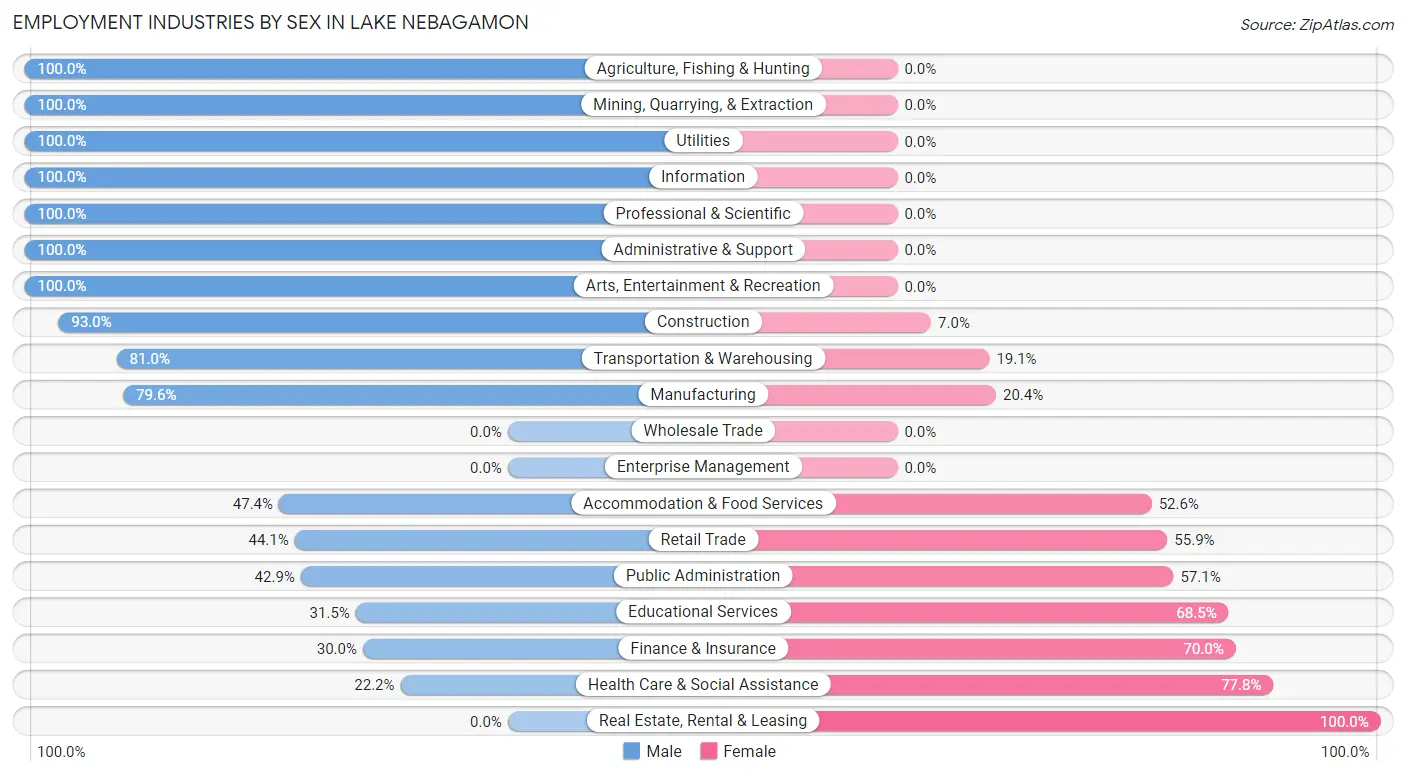
| Industry | Male | Female |
| Agriculture, Fishing & Hunting | 8 (100.0%) | 0 (0.0%) |
| Mining, Quarrying, & Extraction | 3 (100.0%) | 0 (0.0%) |
| Construction | 40 (93.0%) | 3 (7.0%) |
| Manufacturing | 39 (79.6%) | 10 (20.4%) |
| Wholesale Trade | 0 (0.0%) | 0 (0.0%) |
| Retail Trade | 15 (44.1%) | 19 (55.9%) |
| Transportation & Warehousing | 34 (80.9%) | 8 (19.1%) |
| Utilities | 15 (100.0%) | 0 (0.0%) |
| Information | 2 (100.0%) | 0 (0.0%) |
| Finance & Insurance | 3 (30.0%) | 7 (70.0%) |
| Real Estate, Rental & Leasing | 0 (0.0%) | 5 (100.0%) |
| Professional & Scientific | 30 (100.0%) | 0 (0.0%) |
| Enterprise Management | 0 (0.0%) | 0 (0.0%) |
| Administrative & Support | 4 (100.0%) | 0 (0.0%) |
| Educational Services | 17 (31.5%) | 37 (68.5%) |
| Health Care & Social Assistance | 14 (22.2%) | 49 (77.8%) |
| Arts, Entertainment & Recreation | 7 (100.0%) | 0 (0.0%) |
| Accommodation & Food Services | 18 (47.4%) | 20 (52.6%) |
| Public Administration | 3 (42.9%) | 4 (57.1%) |
| Total | 255 (60.1%) | 169 (39.9%) |
Education in Lake Nebagamon
School Enrollment in Lake Nebagamon
The most common levels of schooling among the 177 students in Lake Nebagamon are elementary school (71 | 40.1%), high school (57 | 32.2%), and middle school (30 | 17.0%).
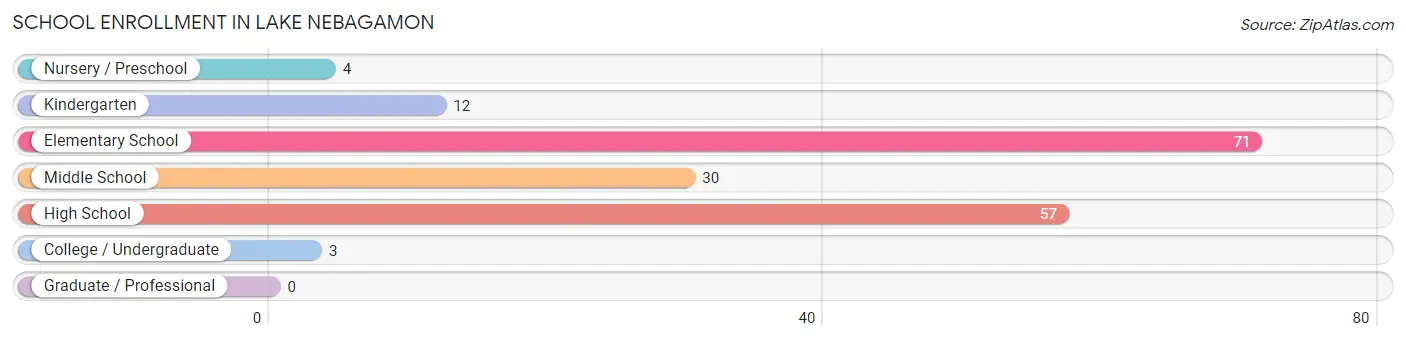
| School Level | # Students | % Students |
| Nursery / Preschool | 4 | 2.3% |
| Kindergarten | 12 | 6.8% |
| Elementary School | 71 | 40.1% |
| Middle School | 30 | 17.0% |
| High School | 57 | 32.2% |
| College / Undergraduate | 3 | 1.7% |
| Graduate / Professional | 0 | 0.0% |
| Total | 177 | 100.0% |
School Enrollment by Age by Funding Source in Lake Nebagamon
Out of a total of 177 students who are enrolled in schools in Lake Nebagamon, 12 (6.8%) attend a private institution, while the remaining 165 (93.2%) are enrolled in public schools. The age group of 10 to 14 year olds has the highest likelihood of being enrolled in private schools, with 7 (21.9% in the age bracket) enrolled. Conversely, the age group of 5 to 9 year old has the lowest likelihood of being enrolled in a private school, with 81 (100.0% in the age bracket) attending a public institution.
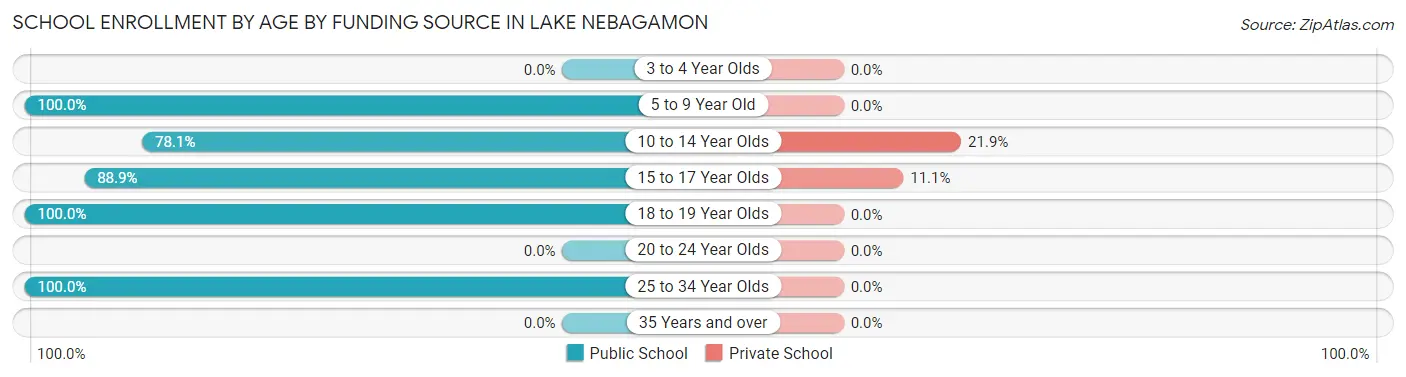
| Age Bracket | Public School | Private School |
| 3 to 4 Year Olds | 0 (0.0%) | 0 (0.0%) |
| 5 to 9 Year Old | 81 (100.0%) | 0 (0.0%) |
| 10 to 14 Year Olds | 25 (78.1%) | 7 (21.9%) |
| 15 to 17 Year Olds | 40 (88.9%) | 5 (11.1%) |
| 18 to 19 Year Olds | 16 (100.0%) | 0 (0.0%) |
| 20 to 24 Year Olds | 0 (0.0%) | 0 (0.0%) |
| 25 to 34 Year Olds | 3 (100.0%) | 0 (0.0%) |
| 35 Years and over | 0 (0.0%) | 0 (0.0%) |
| Total | 165 (93.2%) | 12 (6.8%) |
Educational Attainment by Field of Study in Lake Nebagamon
Education (76 | 21.7%), physical & health sciences (40 | 11.4%), science & technology (40 | 11.4%), business (34 | 9.7%), and social sciences (33 | 9.4%) are the most common fields of study among 350 individuals in Lake Nebagamon who have obtained a bachelor's degree or higher.
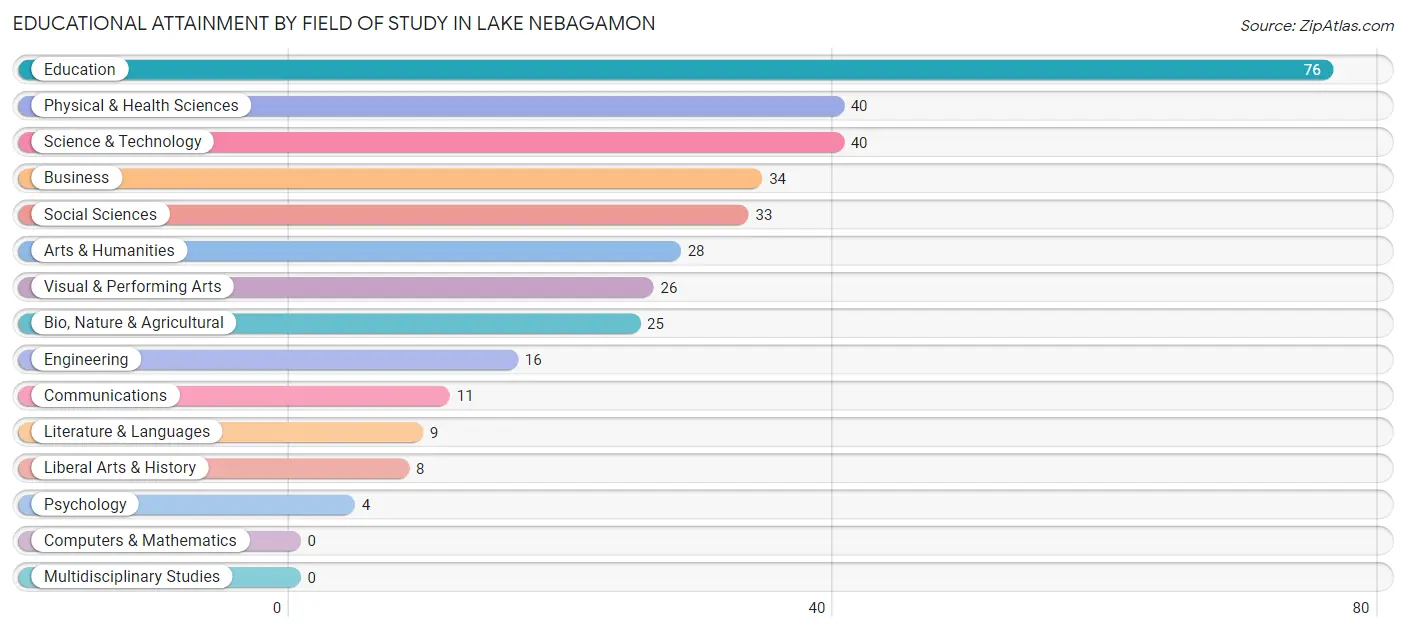
| Field of Study | # Graduates | % Graduates |
| Computers & Mathematics | 0 | 0.0% |
| Bio, Nature & Agricultural | 25 | 7.1% |
| Physical & Health Sciences | 40 | 11.4% |
| Psychology | 4 | 1.1% |
| Social Sciences | 33 | 9.4% |
| Engineering | 16 | 4.6% |
| Multidisciplinary Studies | 0 | 0.0% |
| Science & Technology | 40 | 11.4% |
| Business | 34 | 9.7% |
| Education | 76 | 21.7% |
| Literature & Languages | 9 | 2.6% |
| Liberal Arts & History | 8 | 2.3% |
| Visual & Performing Arts | 26 | 7.4% |
| Communications | 11 | 3.1% |
| Arts & Humanities | 28 | 8.0% |
| Total | 350 | 100.0% |
Transportation & Commute in Lake Nebagamon
Vehicle Availability by Sex in Lake Nebagamon
The most prevalent vehicle ownership categories in Lake Nebagamon are males with 2 vehicles (90, accounting for 35.3%) and females with 2 vehicles (88, making up 52.6%).
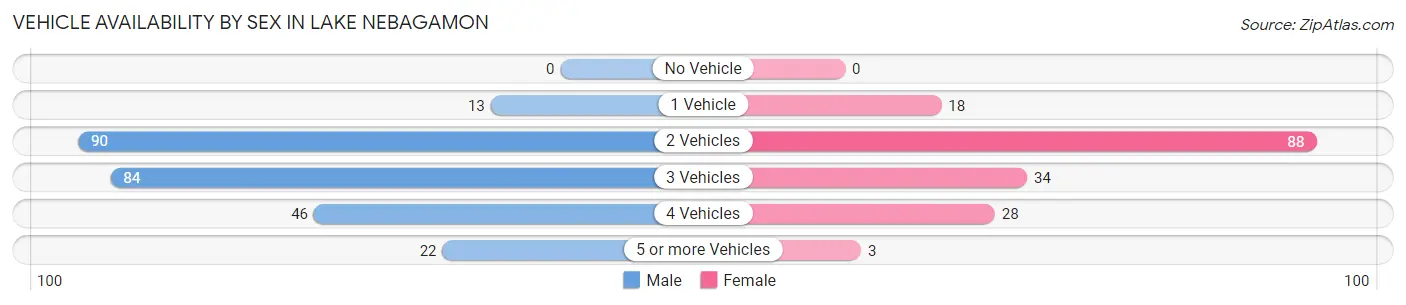
| Vehicles Available | Male | Female |
| No Vehicle | 0 (0.0%) | 0 (0.0%) |
| 1 Vehicle | 13 (5.1%) | 18 (10.5%) |
| 2 Vehicles | 90 (35.3%) | 88 (51.5%) |
| 3 Vehicles | 84 (32.9%) | 34 (19.9%) |
| 4 Vehicles | 46 (18.0%) | 28 (16.4%) |
| 5 or more Vehicles | 22 (8.6%) | 3 (1.8%) |
| Total | 255 (100.0%) | 171 (100.0%) |
Commute Time in Lake Nebagamon
The most frequently occuring commute durations in Lake Nebagamon are 30 to 34 minutes (90 commuters, 22.6%), 45 to 59 minutes (77 commuters, 19.3%), and 60 to 89 minutes (44 commuters, 11.0%).
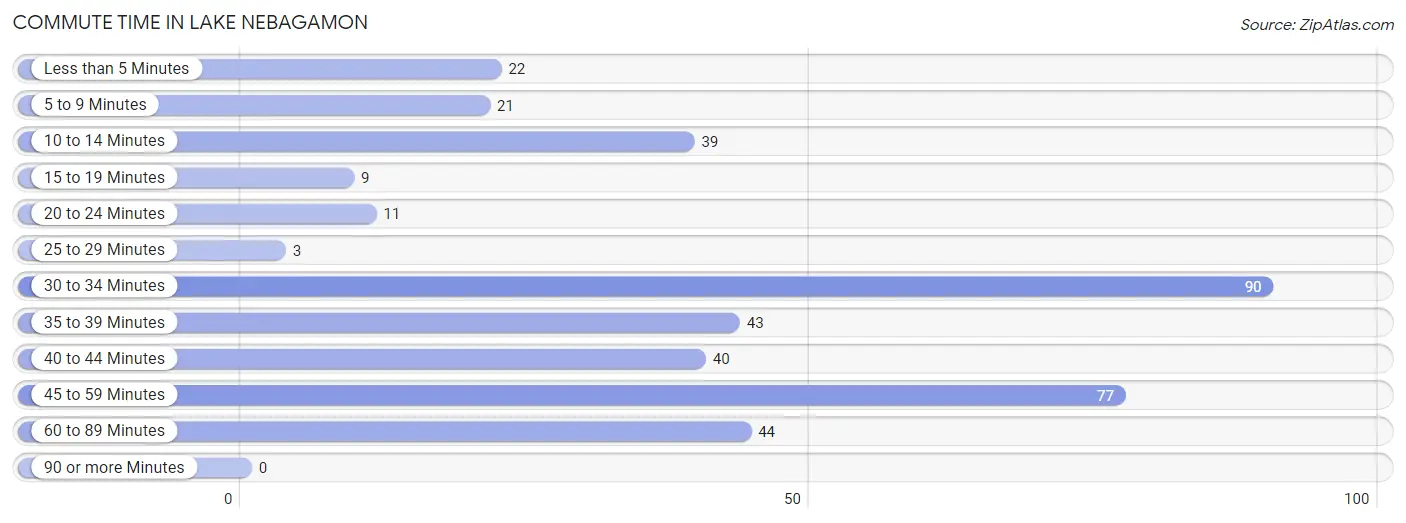
| Commute Time | # Commuters | % Commuters |
| Less than 5 Minutes | 22 | 5.5% |
| 5 to 9 Minutes | 21 | 5.3% |
| 10 to 14 Minutes | 39 | 9.8% |
| 15 to 19 Minutes | 9 | 2.3% |
| 20 to 24 Minutes | 11 | 2.8% |
| 25 to 29 Minutes | 3 | 0.7% |
| 30 to 34 Minutes | 90 | 22.6% |
| 35 to 39 Minutes | 43 | 10.8% |
| 40 to 44 Minutes | 40 | 10.0% |
| 45 to 59 Minutes | 77 | 19.3% |
| 60 to 89 Minutes | 44 | 11.0% |
| 90 or more Minutes | 0 | 0.0% |
Commute Time by Sex in Lake Nebagamon
The most common commute times in Lake Nebagamon are 30 to 34 minutes (67 commuters, 27.1%) for males and 45 to 59 minutes (36 commuters, 23.7%) for females.
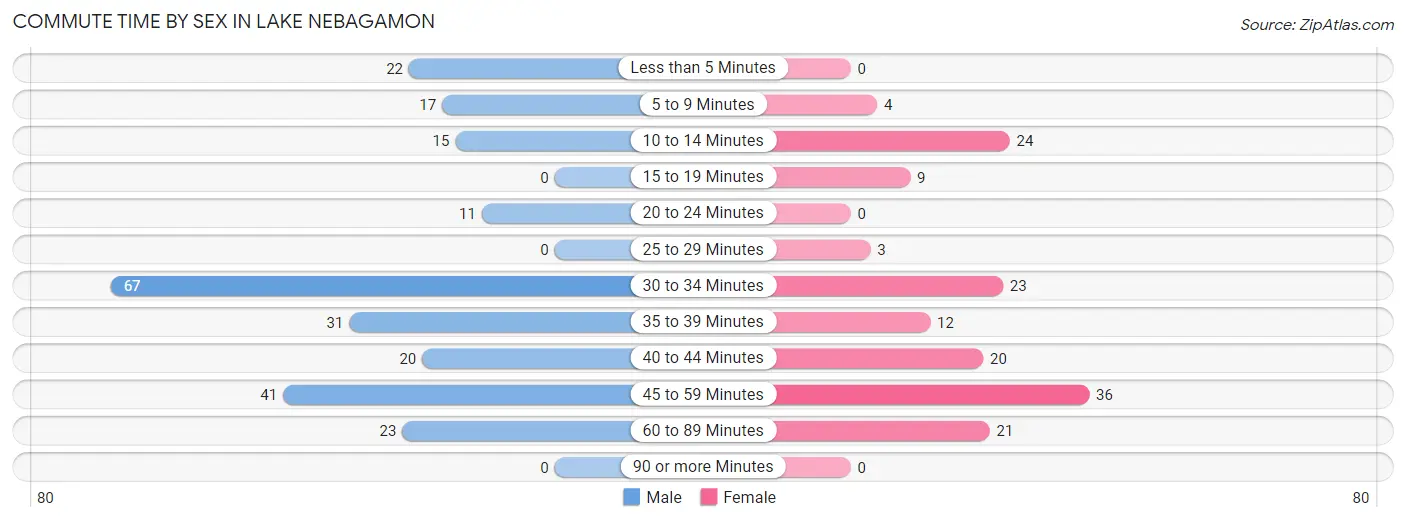
| Commute Time | Male | Female |
| Less than 5 Minutes | 22 (8.9%) | 0 (0.0%) |
| 5 to 9 Minutes | 17 (6.9%) | 4 (2.6%) |
| 10 to 14 Minutes | 15 (6.1%) | 24 (15.8%) |
| 15 to 19 Minutes | 0 (0.0%) | 9 (5.9%) |
| 20 to 24 Minutes | 11 (4.4%) | 0 (0.0%) |
| 25 to 29 Minutes | 0 (0.0%) | 3 (2.0%) |
| 30 to 34 Minutes | 67 (27.1%) | 23 (15.1%) |
| 35 to 39 Minutes | 31 (12.6%) | 12 (7.9%) |
| 40 to 44 Minutes | 20 (8.1%) | 20 (13.2%) |
| 45 to 59 Minutes | 41 (16.6%) | 36 (23.7%) |
| 60 to 89 Minutes | 23 (9.3%) | 21 (13.8%) |
| 90 or more Minutes | 0 (0.0%) | 0 (0.0%) |
Time of Departure to Work by Sex in Lake Nebagamon
The most frequent times of departure to work in Lake Nebagamon are 7:00 AM to 7:29 AM (47, 19.0%) for males and 7:00 AM to 7:29 AM (48, 31.6%) for females.
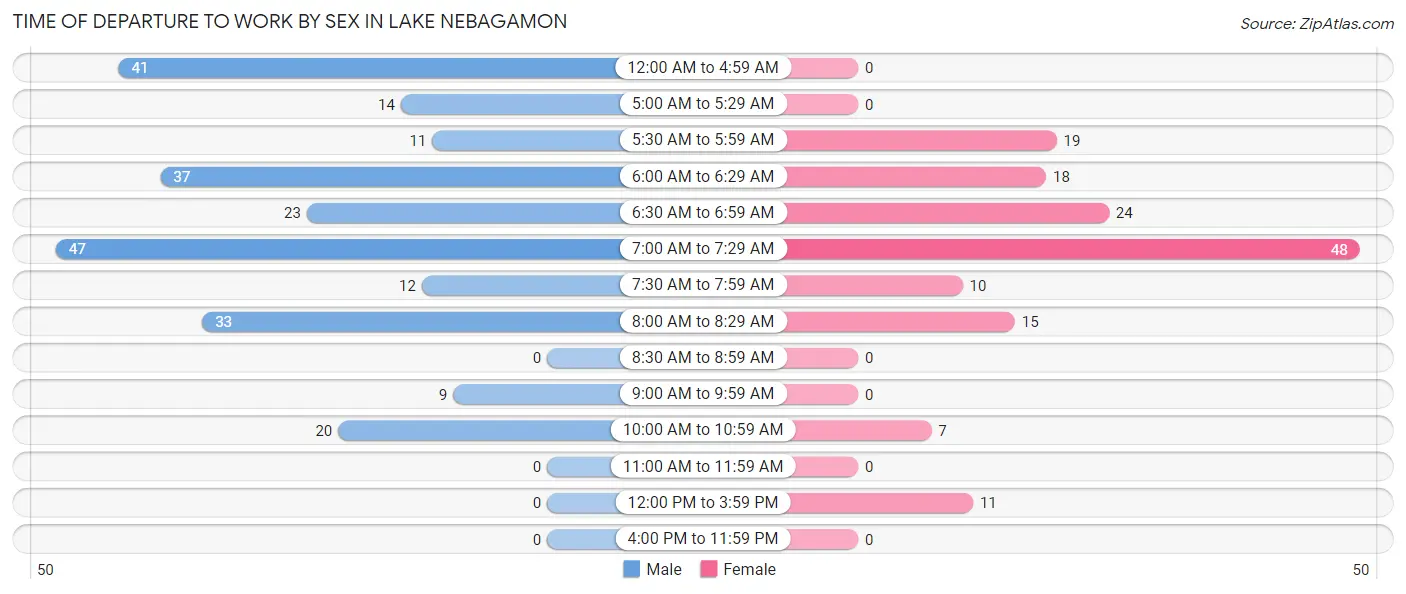
| Time of Departure | Male | Female |
| 12:00 AM to 4:59 AM | 41 (16.6%) | 0 (0.0%) |
| 5:00 AM to 5:29 AM | 14 (5.7%) | 0 (0.0%) |
| 5:30 AM to 5:59 AM | 11 (4.4%) | 19 (12.5%) |
| 6:00 AM to 6:29 AM | 37 (15.0%) | 18 (11.8%) |
| 6:30 AM to 6:59 AM | 23 (9.3%) | 24 (15.8%) |
| 7:00 AM to 7:29 AM | 47 (19.0%) | 48 (31.6%) |
| 7:30 AM to 7:59 AM | 12 (4.9%) | 10 (6.6%) |
| 8:00 AM to 8:29 AM | 33 (13.4%) | 15 (9.9%) |
| 8:30 AM to 8:59 AM | 0 (0.0%) | 0 (0.0%) |
| 9:00 AM to 9:59 AM | 9 (3.6%) | 0 (0.0%) |
| 10:00 AM to 10:59 AM | 20 (8.1%) | 7 (4.6%) |
| 11:00 AM to 11:59 AM | 0 (0.0%) | 0 (0.0%) |
| 12:00 PM to 3:59 PM | 0 (0.0%) | 11 (7.2%) |
| 4:00 PM to 11:59 PM | 0 (0.0%) | 0 (0.0%) |
| Total | 247 (100.0%) | 152 (100.0%) |
Housing Occupancy in Lake Nebagamon
Occupancy by Ownership in Lake Nebagamon
Of the total 436 dwellings in Lake Nebagamon, owner-occupied units account for 385 (88.3%), while renter-occupied units make up 51 (11.7%).
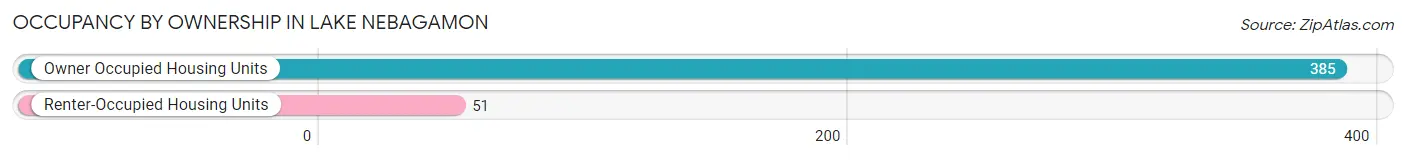
| Occupancy | # Housing Units | % Housing Units |
| Owner Occupied Housing Units | 385 | 88.3% |
| Renter-Occupied Housing Units | 51 | 11.7% |
| Total Occupied Housing Units | 436 | 100.0% |
Occupancy by Household Size in Lake Nebagamon
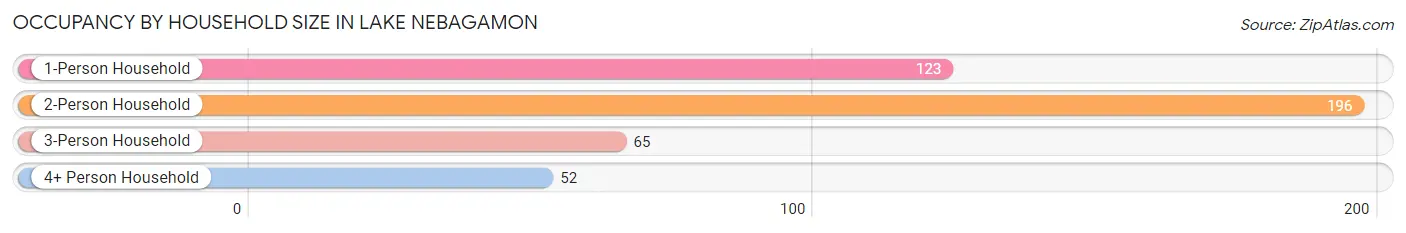
| Household Size | # Housing Units | % Housing Units |
| 1-Person Household | 123 | 28.2% |
| 2-Person Household | 196 | 45.0% |
| 3-Person Household | 65 | 14.9% |
| 4+ Person Household | 52 | 11.9% |
| Total Housing Units | 436 | 100.0% |
Occupancy by Ownership by Household Size in Lake Nebagamon
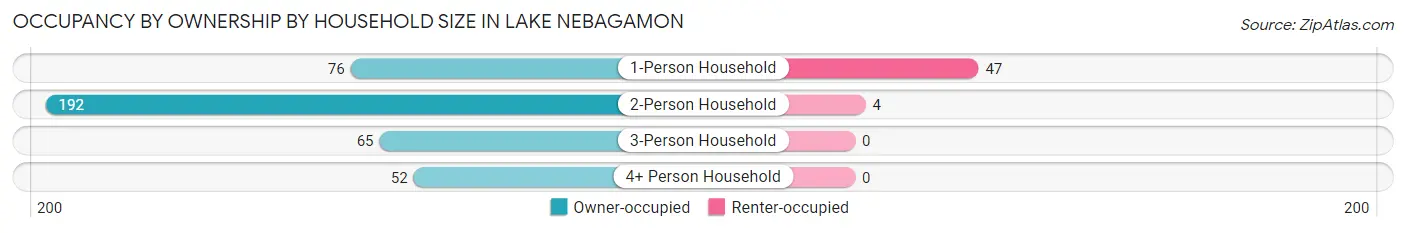
| Household Size | Owner-occupied | Renter-occupied |
| 1-Person Household | 76 (61.8%) | 47 (38.2%) |
| 2-Person Household | 192 (98.0%) | 4 (2.0%) |
| 3-Person Household | 65 (100.0%) | 0 (0.0%) |
| 4+ Person Household | 52 (100.0%) | 0 (0.0%) |
| Total Housing Units | 385 (88.3%) | 51 (11.7%) |
Occupancy by Educational Attainment in Lake Nebagamon
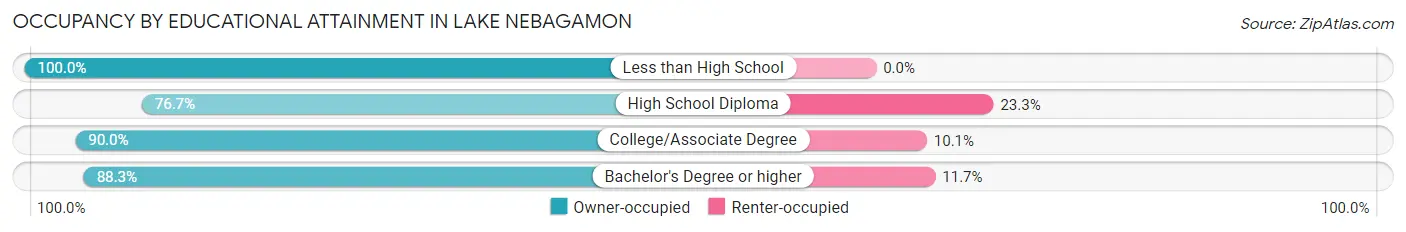
| Household Size | Owner-occupied | Renter-occupied |
| Less than High School | 15 (100.0%) | 0 (0.0%) |
| High School Diploma | 33 (76.7%) | 10 (23.3%) |
| College/Associate Degree | 179 (89.9%) | 20 (10.1%) |
| Bachelor's Degree or higher | 158 (88.3%) | 21 (11.7%) |
Occupancy by Age of Householder in Lake Nebagamon
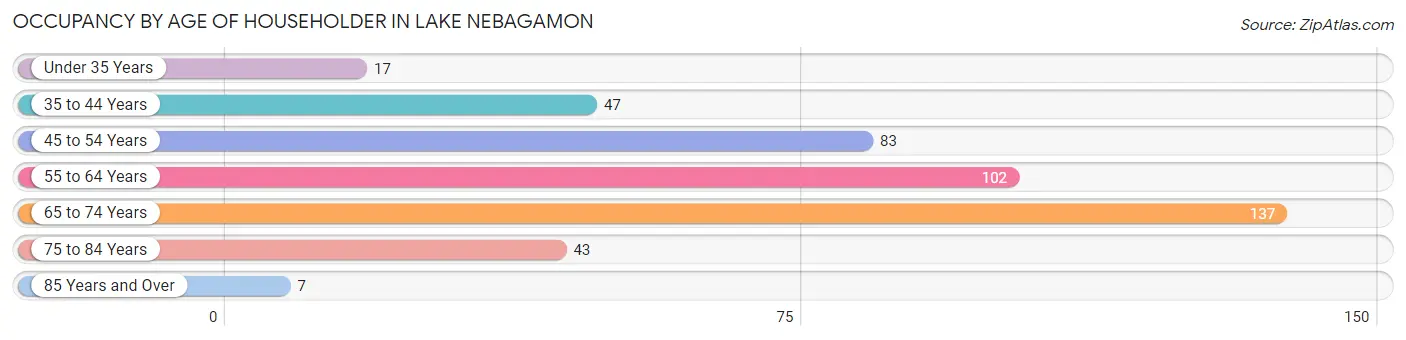
| Age Bracket | # Households | % Households |
| Under 35 Years | 17 | 3.9% |
| 35 to 44 Years | 47 | 10.8% |
| 45 to 54 Years | 83 | 19.0% |
| 55 to 64 Years | 102 | 23.4% |
| 65 to 74 Years | 137 | 31.4% |
| 75 to 84 Years | 43 | 9.9% |
| 85 Years and Over | 7 | 1.6% |
| Total | 436 | 100.0% |
Housing Finances in Lake Nebagamon
Median Income by Occupancy in Lake Nebagamon
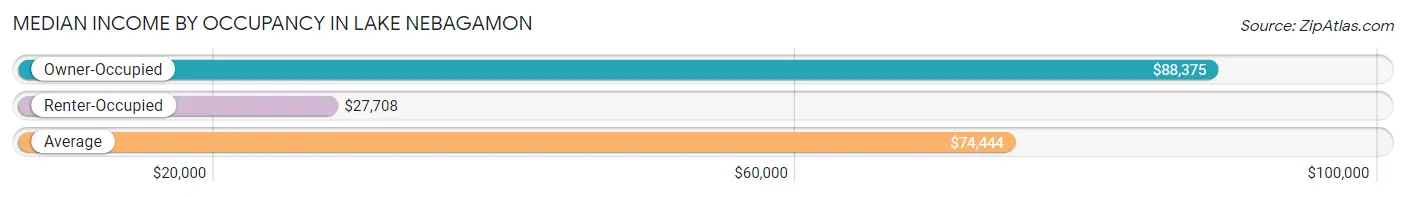
| Occupancy Type | # Households | Median Income |
| Owner-Occupied | 385 (88.3%) | $88,375 |
| Renter-Occupied | 51 (11.7%) | $27,708 |
| Average | 436 (100.0%) | $74,444 |
Occupancy by Householder Income Bracket in Lake Nebagamon
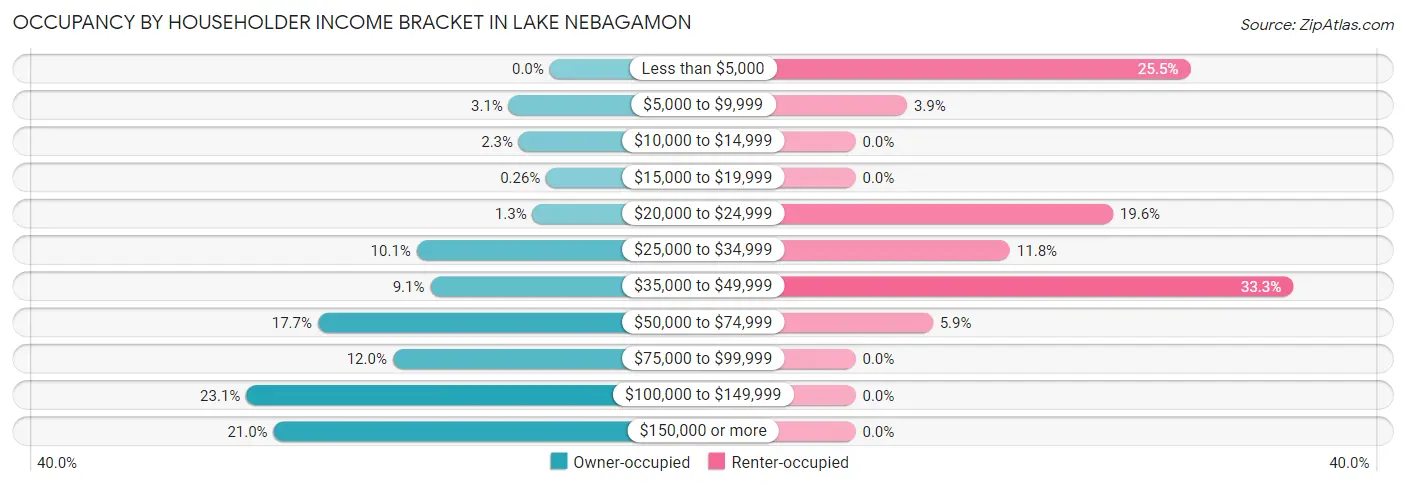
| Income Bracket | Owner-occupied | Renter-occupied |
| Less than $5,000 | 0 (0.0%) | 13 (25.5%) |
| $5,000 to $9,999 | 12 (3.1%) | 2 (3.9%) |
| $10,000 to $14,999 | 9 (2.3%) | 0 (0.0%) |
| $15,000 to $19,999 | 1 (0.3%) | 0 (0.0%) |
| $20,000 to $24,999 | 5 (1.3%) | 10 (19.6%) |
| $25,000 to $34,999 | 39 (10.1%) | 6 (11.8%) |
| $35,000 to $49,999 | 35 (9.1%) | 17 (33.3%) |
| $50,000 to $74,999 | 68 (17.7%) | 3 (5.9%) |
| $75,000 to $99,999 | 46 (11.9%) | 0 (0.0%) |
| $100,000 to $149,999 | 89 (23.1%) | 0 (0.0%) |
| $150,000 or more | 81 (21.0%) | 0 (0.0%) |
| Total | 385 (100.0%) | 51 (100.0%) |
Monthly Housing Cost Tiers in Lake Nebagamon
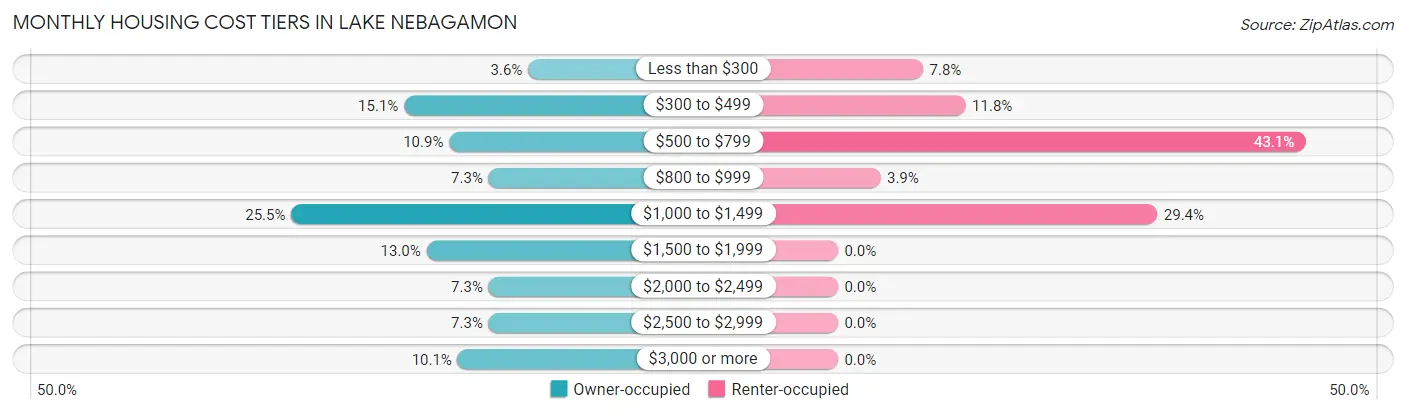
| Monthly Cost | Owner-occupied | Renter-occupied |
| Less than $300 | 14 (3.6%) | 4 (7.8%) |
| $300 to $499 | 58 (15.1%) | 6 (11.8%) |
| $500 to $799 | 42 (10.9%) | 22 (43.1%) |
| $800 to $999 | 28 (7.3%) | 2 (3.9%) |
| $1,000 to $1,499 | 98 (25.5%) | 15 (29.4%) |
| $1,500 to $1,999 | 50 (13.0%) | 0 (0.0%) |
| $2,000 to $2,499 | 28 (7.3%) | 0 (0.0%) |
| $2,500 to $2,999 | 28 (7.3%) | 0 (0.0%) |
| $3,000 or more | 39 (10.1%) | 0 (0.0%) |
| Total | 385 (100.0%) | 51 (100.0%) |
Physical Housing Characteristics in Lake Nebagamon
Housing Structures in Lake Nebagamon
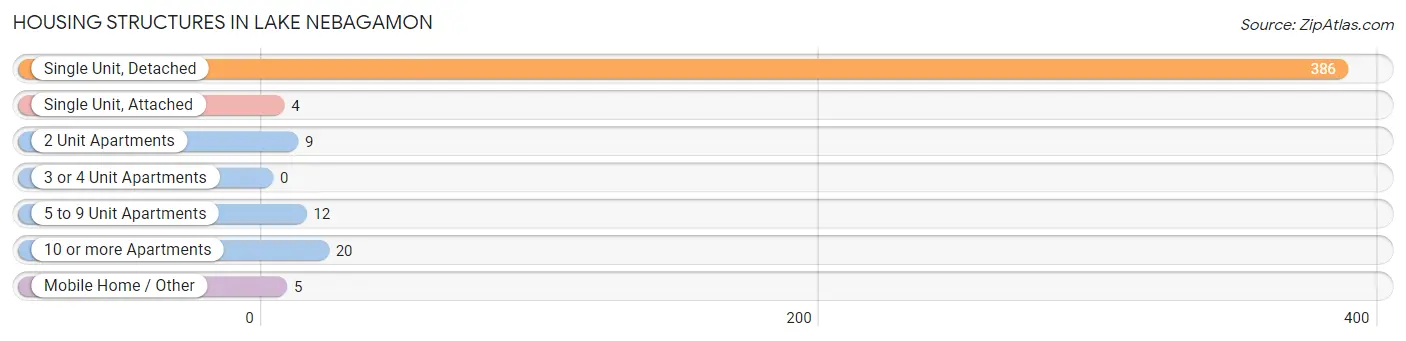
| Structure Type | # Housing Units | % Housing Units |
| Single Unit, Detached | 386 | 88.5% |
| Single Unit, Attached | 4 | 0.9% |
| 2 Unit Apartments | 9 | 2.1% |
| 3 or 4 Unit Apartments | 0 | 0.0% |
| 5 to 9 Unit Apartments | 12 | 2.8% |
| 10 or more Apartments | 20 | 4.6% |
| Mobile Home / Other | 5 | 1.1% |
| Total | 436 | 100.0% |
Housing Structures by Occupancy in Lake Nebagamon
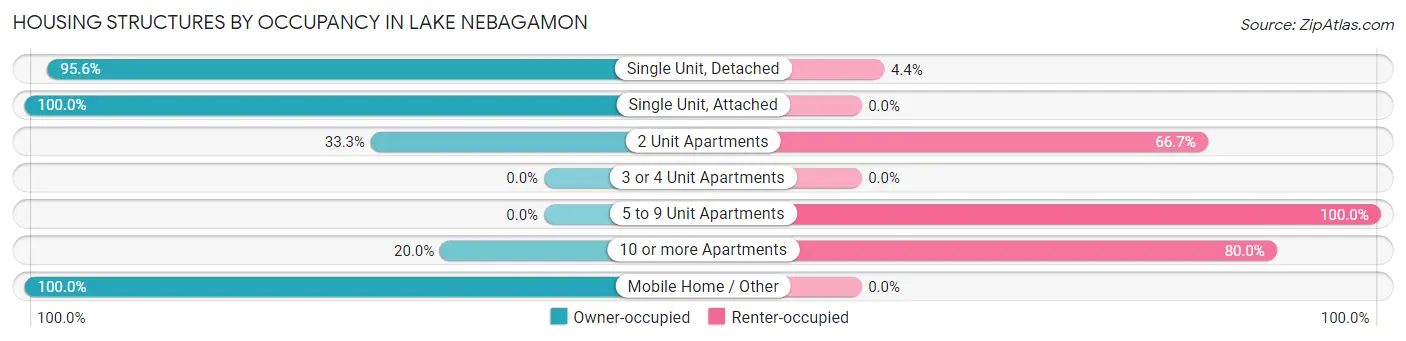
| Structure Type | Owner-occupied | Renter-occupied |
| Single Unit, Detached | 369 (95.6%) | 17 (4.4%) |
| Single Unit, Attached | 4 (100.0%) | 0 (0.0%) |
| 2 Unit Apartments | 3 (33.3%) | 6 (66.7%) |
| 3 or 4 Unit Apartments | 0 (0.0%) | 0 (0.0%) |
| 5 to 9 Unit Apartments | 0 (0.0%) | 12 (100.0%) |
| 10 or more Apartments | 4 (20.0%) | 16 (80.0%) |
| Mobile Home / Other | 5 (100.0%) | 0 (0.0%) |
| Total | 385 (88.3%) | 51 (11.7%) |
Housing Structures by Number of Rooms in Lake Nebagamon
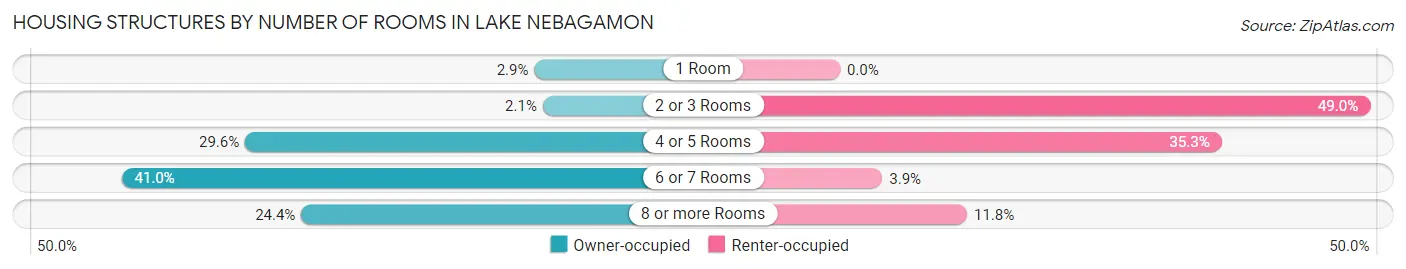
| Number of Rooms | Owner-occupied | Renter-occupied |
| 1 Room | 11 (2.9%) | 0 (0.0%) |
| 2 or 3 Rooms | 8 (2.1%) | 25 (49.0%) |
| 4 or 5 Rooms | 114 (29.6%) | 18 (35.3%) |
| 6 or 7 Rooms | 158 (41.0%) | 2 (3.9%) |
| 8 or more Rooms | 94 (24.4%) | 6 (11.8%) |
| Total | 385 (100.0%) | 51 (100.0%) |
Housing Structure by Heating Type in Lake Nebagamon
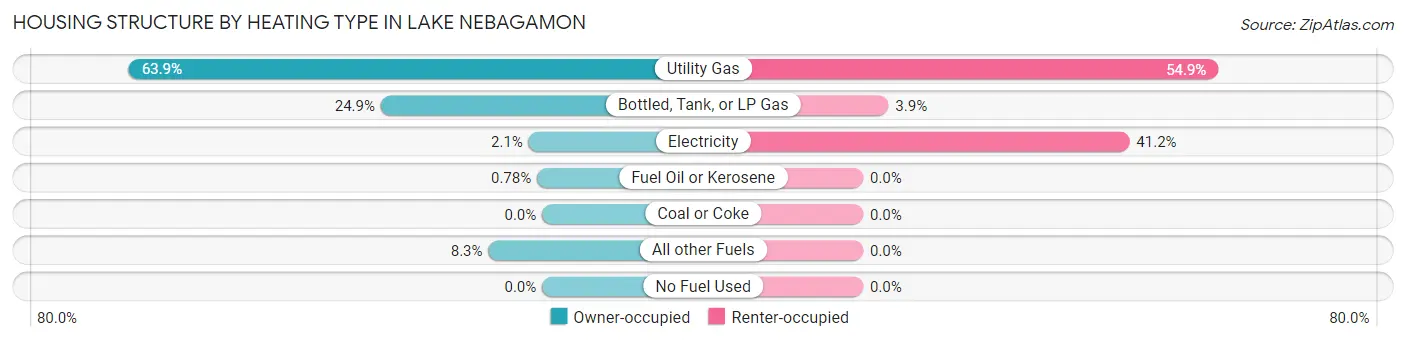
| Heating Type | Owner-occupied | Renter-occupied |
| Utility Gas | 246 (63.9%) | 28 (54.9%) |
| Bottled, Tank, or LP Gas | 96 (24.9%) | 2 (3.9%) |
| Electricity | 8 (2.1%) | 21 (41.2%) |
| Fuel Oil or Kerosene | 3 (0.8%) | 0 (0.0%) |
| Coal or Coke | 0 (0.0%) | 0 (0.0%) |
| All other Fuels | 32 (8.3%) | 0 (0.0%) |
| No Fuel Used | 0 (0.0%) | 0 (0.0%) |
| Total | 385 (100.0%) | 51 (100.0%) |
Household Vehicle Usage in Lake Nebagamon
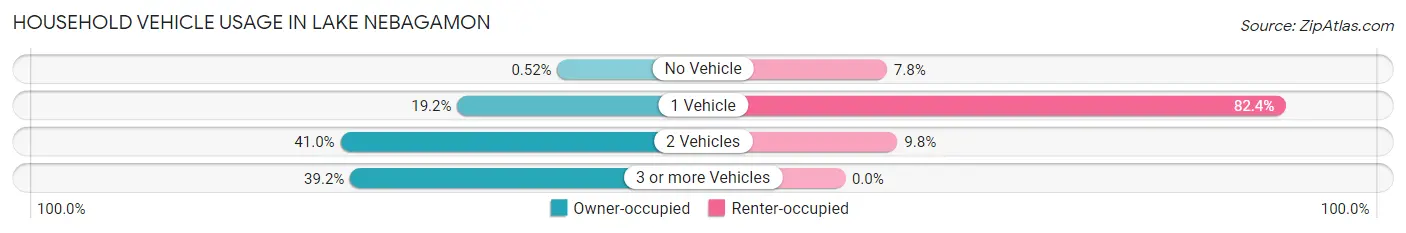
| Vehicles per Household | Owner-occupied | Renter-occupied |
| No Vehicle | 2 (0.5%) | 4 (7.8%) |
| 1 Vehicle | 74 (19.2%) | 42 (82.4%) |
| 2 Vehicles | 158 (41.0%) | 5 (9.8%) |
| 3 or more Vehicles | 151 (39.2%) | 0 (0.0%) |
| Total | 385 (100.0%) | 51 (100.0%) |
Real Estate & Mortgages in Lake Nebagamon
Real Estate and Mortgage Overview in Lake Nebagamon
| Characteristic | Without Mortgage | With Mortgage |
| Housing Units | 146 | 239 |
| Median Property Value | $178,600 | $273,900 |
| Median Household Income | $61,875 | $60 |
| Monthly Housing Costs | $564 | $36 |
| Real Estate Taxes | $3,300 | $6 |
Property Value by Mortgage Status in Lake Nebagamon
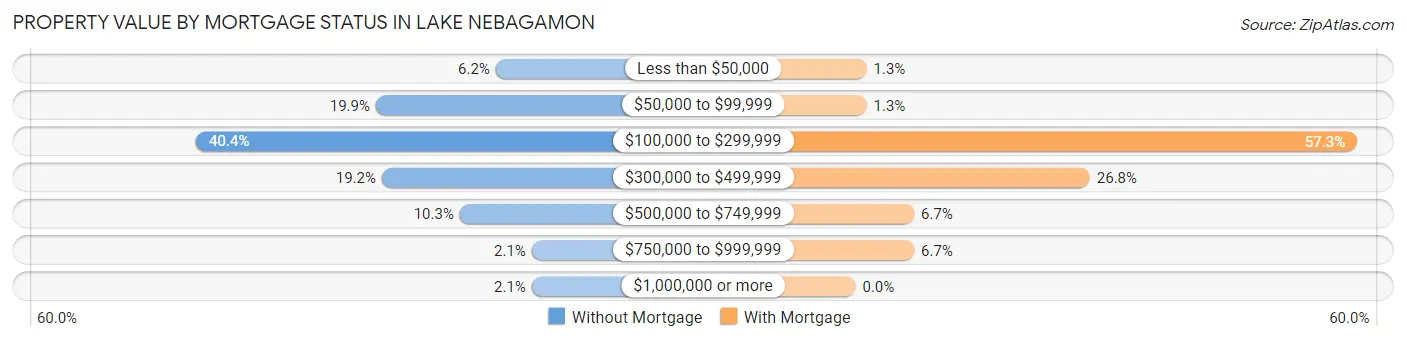
| Property Value | Without Mortgage | With Mortgage |
| Less than $50,000 | 9 (6.2%) | 3 (1.3%) |
| $50,000 to $99,999 | 29 (19.9%) | 3 (1.3%) |
| $100,000 to $299,999 | 59 (40.4%) | 137 (57.3%) |
| $300,000 to $499,999 | 28 (19.2%) | 64 (26.8%) |
| $500,000 to $749,999 | 15 (10.3%) | 16 (6.7%) |
| $750,000 to $999,999 | 3 (2.1%) | 16 (6.7%) |
| $1,000,000 or more | 3 (2.1%) | 0 (0.0%) |
| Total | 146 (100.0%) | 239 (100.0%) |
Household Income by Mortgage Status in Lake Nebagamon
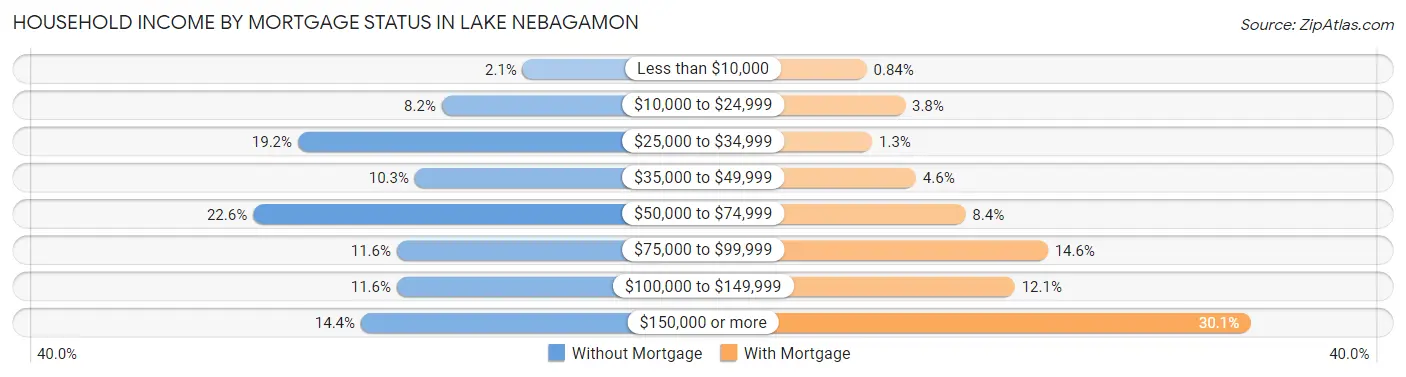
| Household Income | Without Mortgage | With Mortgage |
| Less than $10,000 | 3 (2.1%) | 2 (0.8%) |
| $10,000 to $24,999 | 12 (8.2%) | 9 (3.8%) |
| $25,000 to $34,999 | 28 (19.2%) | 3 (1.3%) |
| $35,000 to $49,999 | 15 (10.3%) | 11 (4.6%) |
| $50,000 to $74,999 | 33 (22.6%) | 20 (8.4%) |
| $75,000 to $99,999 | 17 (11.6%) | 35 (14.6%) |
| $100,000 to $149,999 | 17 (11.6%) | 29 (12.1%) |
| $150,000 or more | 21 (14.4%) | 72 (30.1%) |
| Total | 146 (100.0%) | 239 (100.0%) |
Property Value to Household Income Ratio in Lake Nebagamon
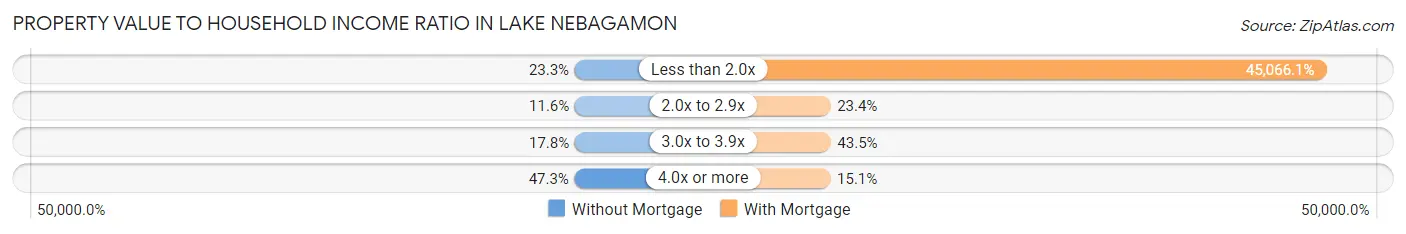
| Value-to-Income Ratio | Without Mortgage | With Mortgage |
| Less than 2.0x | 34 (23.3%) | 107,708 (45,066.1%) |
| 2.0x to 2.9x | 17 (11.6%) | 56 (23.4%) |
| 3.0x to 3.9x | 26 (17.8%) | 104 (43.5%) |
| 4.0x or more | 69 (47.3%) | 36 (15.1%) |
| Total | 146 (100.0%) | 239 (100.0%) |
Real Estate Taxes by Mortgage Status in Lake Nebagamon
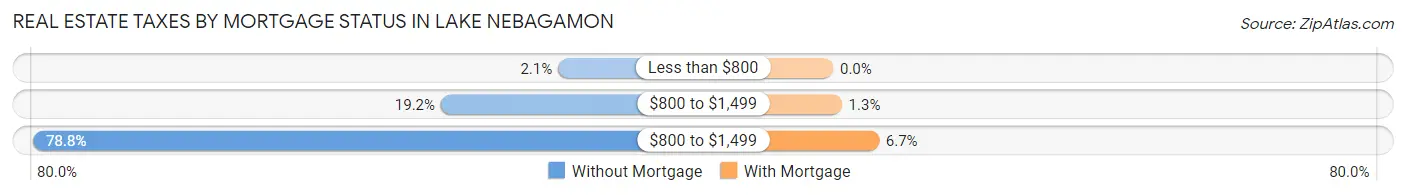
| Property Taxes | Without Mortgage | With Mortgage |
| Less than $800 | 3 (2.1%) | 0 (0.0%) |
| $800 to $1,499 | 28 (19.2%) | 3 (1.3%) |
| $800 to $1,499 | 115 (78.8%) | 16 (6.7%) |
| Total | 146 (100.0%) | 239 (100.0%) |
Health & Disability in Lake Nebagamon
Health Insurance Coverage by Age in Lake Nebagamon
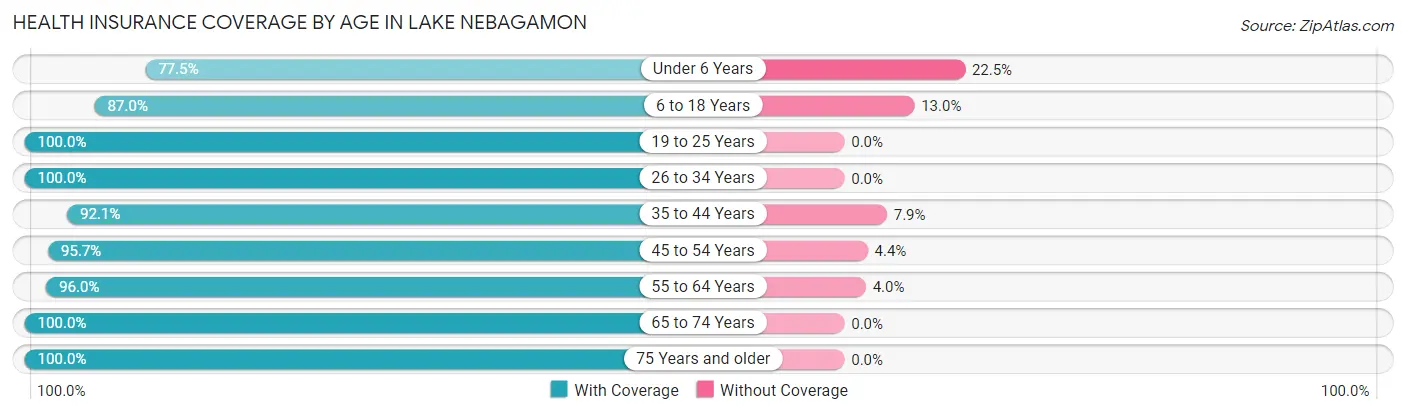
| Age Bracket | With Coverage | Without Coverage |
| Under 6 Years | 31 (77.5%) | 9 (22.5%) |
| 6 to 18 Years | 140 (87.0%) | 21 (13.0%) |
| 19 to 25 Years | 14 (100.0%) | 0 (0.0%) |
| 26 to 34 Years | 46 (100.0%) | 0 (0.0%) |
| 35 to 44 Years | 93 (92.1%) | 8 (7.9%) |
| 45 to 54 Years | 132 (95.7%) | 6 (4.3%) |
| 55 to 64 Years | 168 (96.0%) | 7 (4.0%) |
| 65 to 74 Years | 213 (100.0%) | 0 (0.0%) |
| 75 Years and older | 70 (100.0%) | 0 (0.0%) |
| Total | 907 (94.7%) | 51 (5.3%) |
Health Insurance Coverage by Citizenship Status in Lake Nebagamon

| Citizenship Status | With Coverage | Without Coverage |
| Native Born | 31 (77.5%) | 9 (22.5%) |
| Foreign Born, Citizen | 140 (87.0%) | 21 (13.0%) |
| Foreign Born, not a Citizen | 14 (100.0%) | 0 (0.0%) |
Health Insurance Coverage by Household Income in Lake Nebagamon
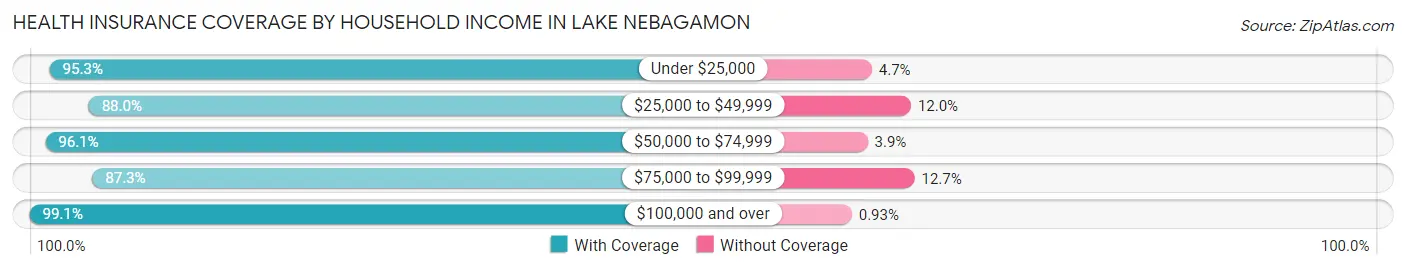
| Household Income | With Coverage | Without Coverage |
| Under $25,000 | 61 (95.3%) | 3 (4.7%) |
| $25,000 to $49,999 | 161 (88.0%) | 22 (12.0%) |
| $50,000 to $74,999 | 148 (96.1%) | 6 (3.9%) |
| $75,000 to $99,999 | 110 (87.3%) | 16 (12.7%) |
| $100,000 and over | 427 (99.1%) | 4 (0.9%) |
Public vs Private Health Insurance Coverage by Age in Lake Nebagamon
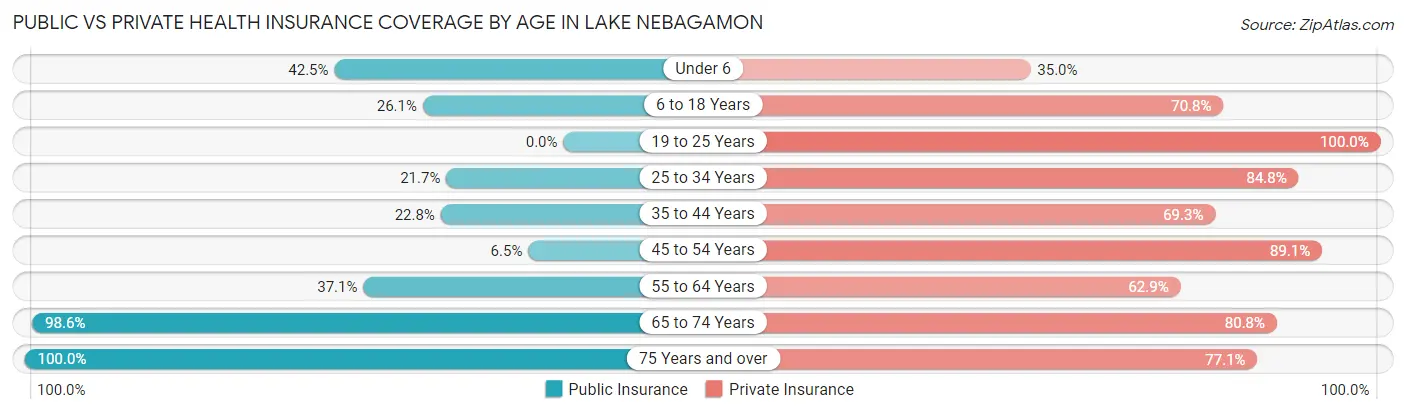
| Age Bracket | Public Insurance | Private Insurance |
| Under 6 | 17 (42.5%) | 14 (35.0%) |
| 6 to 18 Years | 42 (26.1%) | 114 (70.8%) |
| 19 to 25 Years | 0 (0.0%) | 14 (100.0%) |
| 25 to 34 Years | 10 (21.7%) | 39 (84.8%) |
| 35 to 44 Years | 23 (22.8%) | 70 (69.3%) |
| 45 to 54 Years | 9 (6.5%) | 123 (89.1%) |
| 55 to 64 Years | 65 (37.1%) | 110 (62.9%) |
| 65 to 74 Years | 210 (98.6%) | 172 (80.7%) |
| 75 Years and over | 70 (100.0%) | 54 (77.1%) |
| Total | 446 (46.6%) | 710 (74.1%) |
Disability Status by Sex by Age in Lake Nebagamon
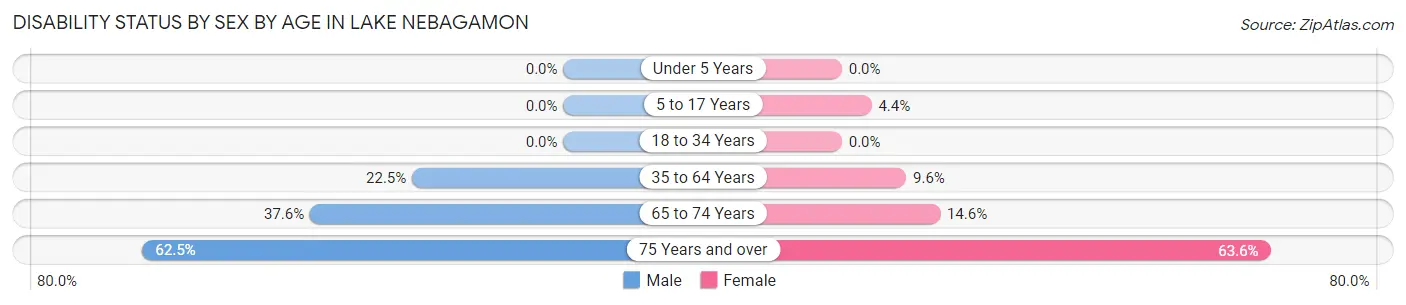
| Age Bracket | Male | Female |
| Under 5 Years | 0 (0.0%) | 0 (0.0%) |
| 5 to 17 Years | 0 (0.0%) | 4 (4.4%) |
| 18 to 34 Years | 0 (0.0%) | 0 (0.0%) |
| 35 to 64 Years | 53 (22.5%) | 17 (9.6%) |
| 65 to 74 Years | 44 (37.6%) | 14 (14.6%) |
| 75 Years and over | 30 (62.5%) | 14 (63.6%) |
Disability Class by Sex by Age in Lake Nebagamon
Disability Class: Hearing Difficulty
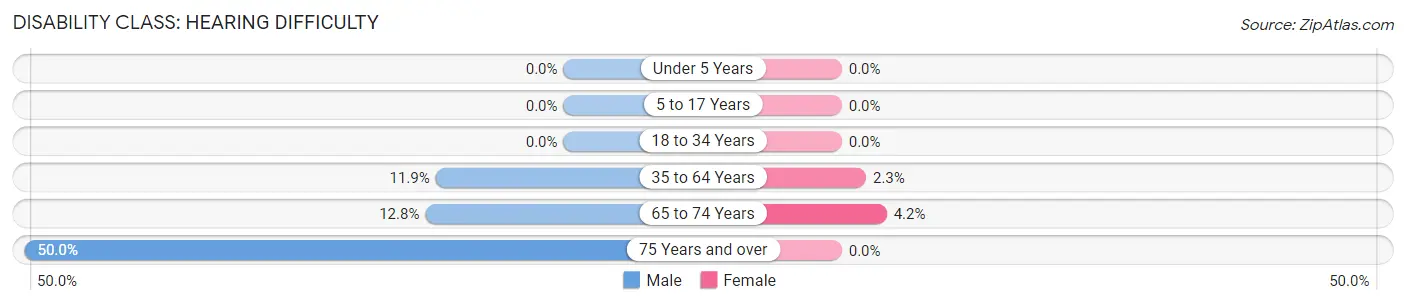
| Age Bracket | Male | Female |
| Under 5 Years | 0 (0.0%) | 0 (0.0%) |
| 5 to 17 Years | 0 (0.0%) | 0 (0.0%) |
| 18 to 34 Years | 0 (0.0%) | 0 (0.0%) |
| 35 to 64 Years | 28 (11.9%) | 4 (2.2%) |
| 65 to 74 Years | 15 (12.8%) | 4 (4.2%) |
| 75 Years and over | 24 (50.0%) | 0 (0.0%) |
Disability Class: Vision Difficulty
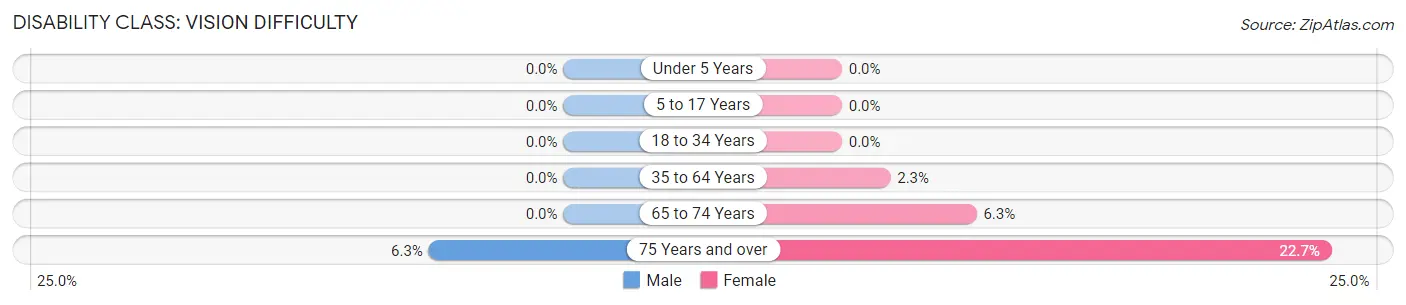
| Age Bracket | Male | Female |
| Under 5 Years | 0 (0.0%) | 0 (0.0%) |
| 5 to 17 Years | 0 (0.0%) | 0 (0.0%) |
| 18 to 34 Years | 0 (0.0%) | 0 (0.0%) |
| 35 to 64 Years | 0 (0.0%) | 4 (2.2%) |
| 65 to 74 Years | 0 (0.0%) | 6 (6.2%) |
| 75 Years and over | 3 (6.2%) | 5 (22.7%) |
Disability Class: Cognitive Difficulty
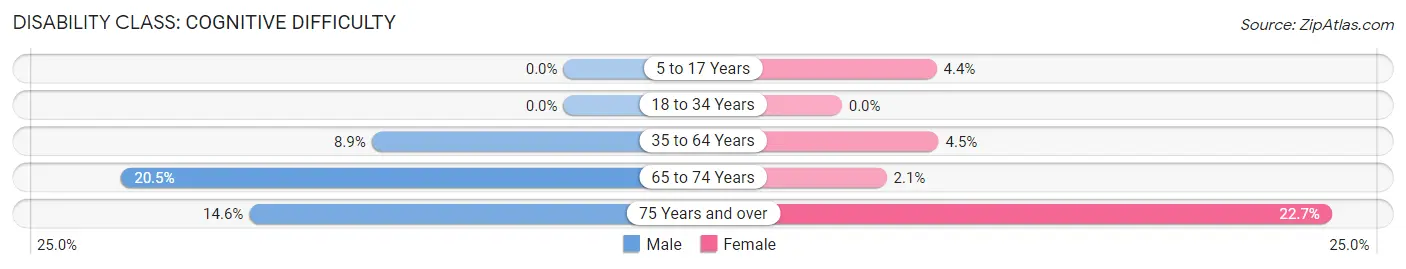
| Age Bracket | Male | Female |
| 5 to 17 Years | 0 (0.0%) | 4 (4.4%) |
| 18 to 34 Years | 0 (0.0%) | 0 (0.0%) |
| 35 to 64 Years | 21 (8.9%) | 8 (4.5%) |
| 65 to 74 Years | 24 (20.5%) | 2 (2.1%) |
| 75 Years and over | 7 (14.6%) | 5 (22.7%) |
Disability Class: Ambulatory Difficulty
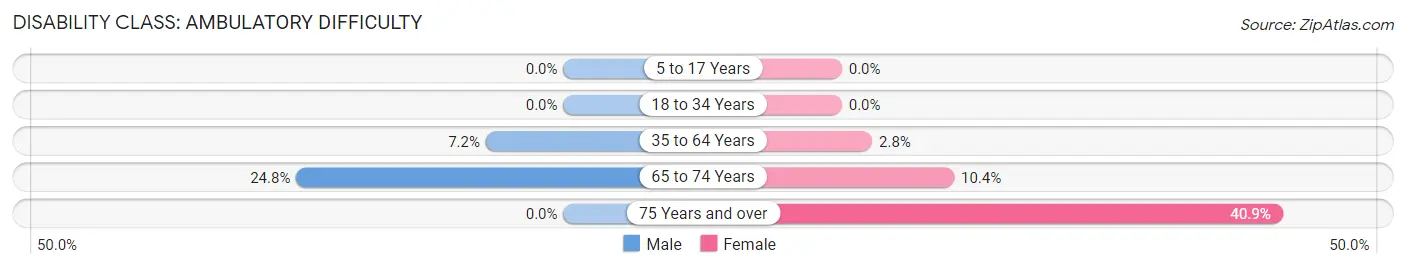
| Age Bracket | Male | Female |
| 5 to 17 Years | 0 (0.0%) | 0 (0.0%) |
| 18 to 34 Years | 0 (0.0%) | 0 (0.0%) |
| 35 to 64 Years | 17 (7.2%) | 5 (2.8%) |
| 65 to 74 Years | 29 (24.8%) | 10 (10.4%) |
| 75 Years and over | 0 (0.0%) | 9 (40.9%) |
Disability Class: Self-Care Difficulty
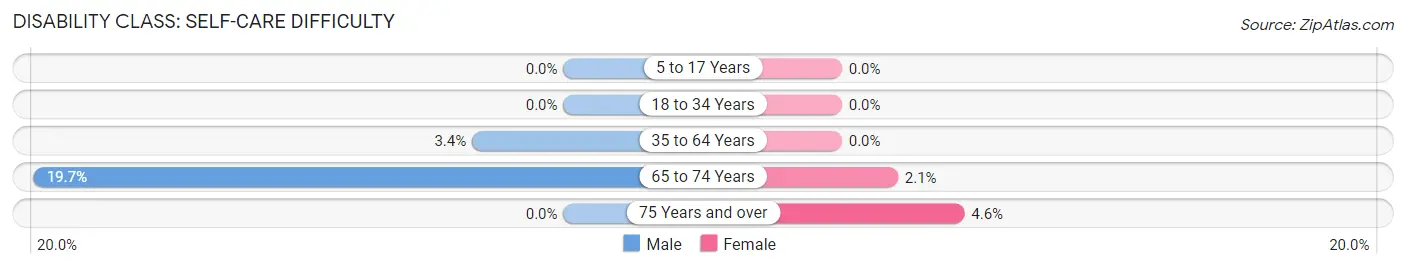
| Age Bracket | Male | Female |
| 5 to 17 Years | 0 (0.0%) | 0 (0.0%) |
| 18 to 34 Years | 0 (0.0%) | 0 (0.0%) |
| 35 to 64 Years | 8 (3.4%) | 0 (0.0%) |
| 65 to 74 Years | 23 (19.7%) | 2 (2.1%) |
| 75 Years and over | 0 (0.0%) | 1 (4.5%) |
Technology Access in Lake Nebagamon
Computing Device Access in Lake Nebagamon
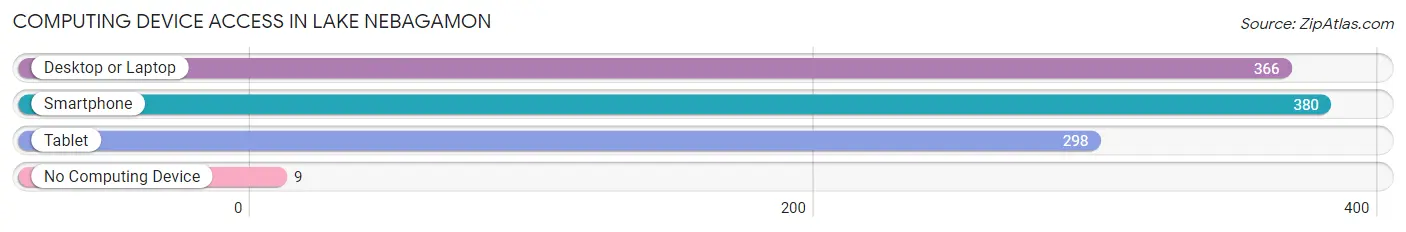
| Device Type | # Households | % Households |
| Desktop or Laptop | 366 | 83.9% |
| Smartphone | 380 | 87.2% |
| Tablet | 298 | 68.3% |
| No Computing Device | 9 | 2.1% |
| Total | 436 | 100.0% |
Internet Access in Lake Nebagamon
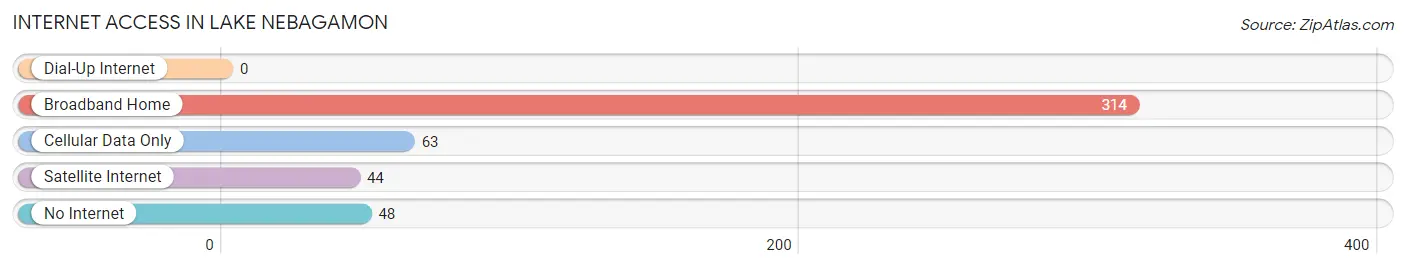
| Internet Type | # Households | % Households |
| Dial-Up Internet | 0 | 0.0% |
| Broadband Home | 314 | 72.0% |
| Cellular Data Only | 63 | 14.4% |
| Satellite Internet | 44 | 10.1% |
| No Internet | 48 | 11.0% |
| Total | 436 | 100.0% |
Lake Nebagamon Summary
History
The area now known as Lake Nebagamon, Wisconsin was first inhabited by the Ojibwe people. The Ojibwe were a Native American tribe that lived in the area for centuries before the arrival of European settlers. The first Europeans to settle in the area were French fur traders, who established trading posts in the area in the late 1700s.
In the early 1800s, the area was part of the Northwest Territory, and was later included in the Wisconsin Territory when it was created in 1836. The area was officially organized as the Town of Lake Nebagamon in 1856. The town was named after the nearby lake, which was named after the Ojibwe word for “big lake”.
The town grew slowly over the next few decades, and by the early 1900s, it had become a popular summer resort destination. The town was home to several resorts, including the Nebagamon Hotel, which was built in 1906. The hotel was a popular destination for wealthy vacationers from the Twin Cities area.
In the 1920s, the town began to experience a population boom, as people from the Twin Cities area began to move to the area in search of a more rural lifestyle. The population of the town grew steadily over the next few decades, and by the 2000 census, the population had reached 1,845.
Geography
Lake Nebagamon is located in northwestern Wisconsin, in Douglas County. The town is situated on the western shore of Lake Nebagamon, a large lake that is approximately 4,000 acres in size. The lake is fed by the Nemadji River, which flows through the town.
The town is bordered by the Town of Solon Springs to the north, the Town of Wascott to the east, and the Town of Poplar to the south. The town is approximately 25 miles east of the city of Superior, and about 50 miles south of Duluth, Minnesota.
The town has a total area of 35.2 square miles, of which 33.2 square miles is land and 2.0 square miles is water. The town is located in a heavily forested area, and is home to several small lakes and streams.
Economy
The economy of Lake Nebagamon is largely based on tourism and recreation. The town is home to several resorts, including the Nebagamon Hotel, which is a popular destination for vacationers from the Twin Cities area. The town is also home to several campgrounds, which attract visitors from all over the region.
In addition to tourism, the town is also home to several small businesses, including a grocery store, a hardware store, and a few restaurants. The town is also home to a small manufacturing plant, which produces plastic products.
Demographics
As of the 2000 census, there were 1,845 people, 745 households, and 517 families residing in the town. The population density was 55.3 people per square mile. There were 845 housing units at an average density of 25.3 per square mile.
The racial makeup of the town was 97.2% White, 0.3% African American, 0.7% Native American, 0.2% Asian, 0.1% Pacific Islander, 0.4% from other races, and 1.1% from two or more races. Hispanic or Latino of any race were 1.2% of the population.
There were 745 households, out of which 28.2% had children under the age of 18 living with them, 56.2% were married couples living together, 8.2% had a female householder with no husband present, and 32.2% were non-families. 27.2% of all households were made up of individuals, and 11.2% had someone living alone who was 65 years of age or older. The average household size was 2.45 and the average family size was 2.97.
In the town, the population was spread out, with 24.2% under the age of 18, 6.2% from 18 to 24, 27.2% from 25 to 44, 25.2% from 45 to 64, and 17.2% who were 65 years of age or older. The median age was 40 years. For every 100 females, there were 97.2 males. For every 100 females age 18 and over, there were 94.2 males.
The median income for a household in the town was $37,500, and the median income for a family was $45,000. Males had a median income of $31,250 versus $22,500 for females. The per capita income for the town was $18,945. About 6.2% of families and 8.2% of the population were below the poverty line, including 10.2% of those under age 18 and 8.2% of those age 65 or over.
Common Questions
What is the Total Population of Lake Nebagamon?
Total Population of Lake Nebagamon is 960.
What is the Total Male Population of Lake Nebagamon?
Total Male Population of Lake Nebagamon is 511.
What is the Total Female Population of Lake Nebagamon?
Total Female Population of Lake Nebagamon is 449.
What is the Ratio of Males per 100 Females in Lake Nebagamon?
There are 113.81 Males per 100 Females in Lake Nebagamon.
What is the Ratio of Females per 100 Males in Lake Nebagamon?
There are 87.87 Females per 100 Males in Lake Nebagamon.
What is the Median Population Age in Lake Nebagamon?
Median Population Age in Lake Nebagamon is 53.8 Years.
What is the Average Family Size in Lake Nebagamon
Average Family Size in Lake Nebagamon is 2.6 People.
What is the Average Household Size in Lake Nebagamon
Average Household Size in Lake Nebagamon is 2.2 People.
What is Per Capita Income in Lake Nebagamon?
Per Capita income in Lake Nebagamon is $42,713.
What is the Median Family Income in Lake Nebagamon?
Median Family Income in Lake Nebagamon is $94,375.
What is the Median Household income in Lake Nebagamon?
Median Household Income in Lake Nebagamon is $74,444.
What is Income or Wage Gap in Lake Nebagamon?
Income or Wage Gap in Lake Nebagamon is 10.9%.
Women in Lake Nebagamon earn 89.1 cents for every dollar earned by a man.
What is Inequality or Gini Index in Lake Nebagamon?
Inequality or Gini Index in Lake Nebagamon is 0.41.
How Large is the Labor Force in Lake Nebagamon?
There are 441 People in the Labor Forcein in Lake Nebagamon.
What is the Percentage of People in the Labor Force in Lake Nebagamon?
54.2% of People are in the Labor Force in Lake Nebagamon.
What is the Unemployment Rate in Lake Nebagamon?
Unemployment Rate in Lake Nebagamon is 3.4%.