Lake Lorraine, WI
Lake Lorraine Map
Lake Lorraine Overview
290
TOTAL POPULATION
146
MALE POPULATION
144
FEMALE POPULATION
101.39
MALES / 100 FEMALES
98.63
FEMALES / 100 MALES
38.0
MEDIAN AGE
2.8
AVG FAMILY SIZE
2.3
AVG HOUSEHOLD SIZE
$32,648
PER CAPITA INCOME
$86,750
AVG FAMILY INCOME
$67,188
AVG HOUSEHOLD INCOME
45.0%
WAGE / INCOME GAP [ % ]
55.0¢/ $1
WAGE / INCOME GAP [ $ ]
0.36
INEQUALITY / GINI INDEX
201
LABOR FORCE [ PEOPLE ]
79.1%
PERCENT IN LABOR FORCE
3.0%
UNEMPLOYMENT RATE
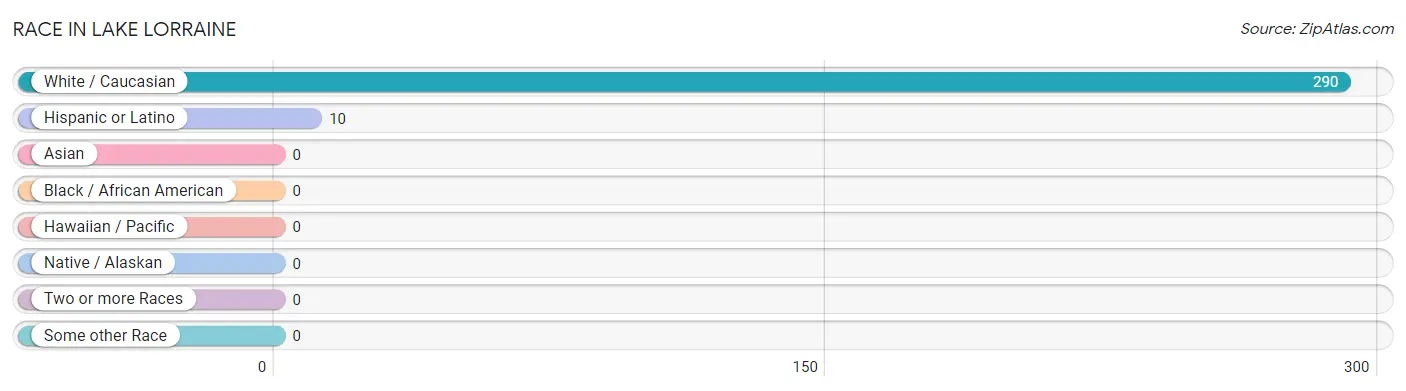
Race in Lake Lorraine
The most populous races in Lake Lorraine are White / Caucasian (290 | 100.0%), and Hispanic or Latino (10 | 3.5%).
| Race | # Population | % Population |
| Asian | 0 | 0.0% |
| Black / African American | 0 | 0.0% |
| Hawaiian / Pacific | 0 | 0.0% |
| Hispanic or Latino | 10 | 3.5% |
| Native / Alaskan | 0 | 0.0% |
| White / Caucasian | 290 | 100.0% |
| Two or more Races | 0 | 0.0% |
| Some other Race | 0 | 0.0% |
| Total | 290 | 100.0% |
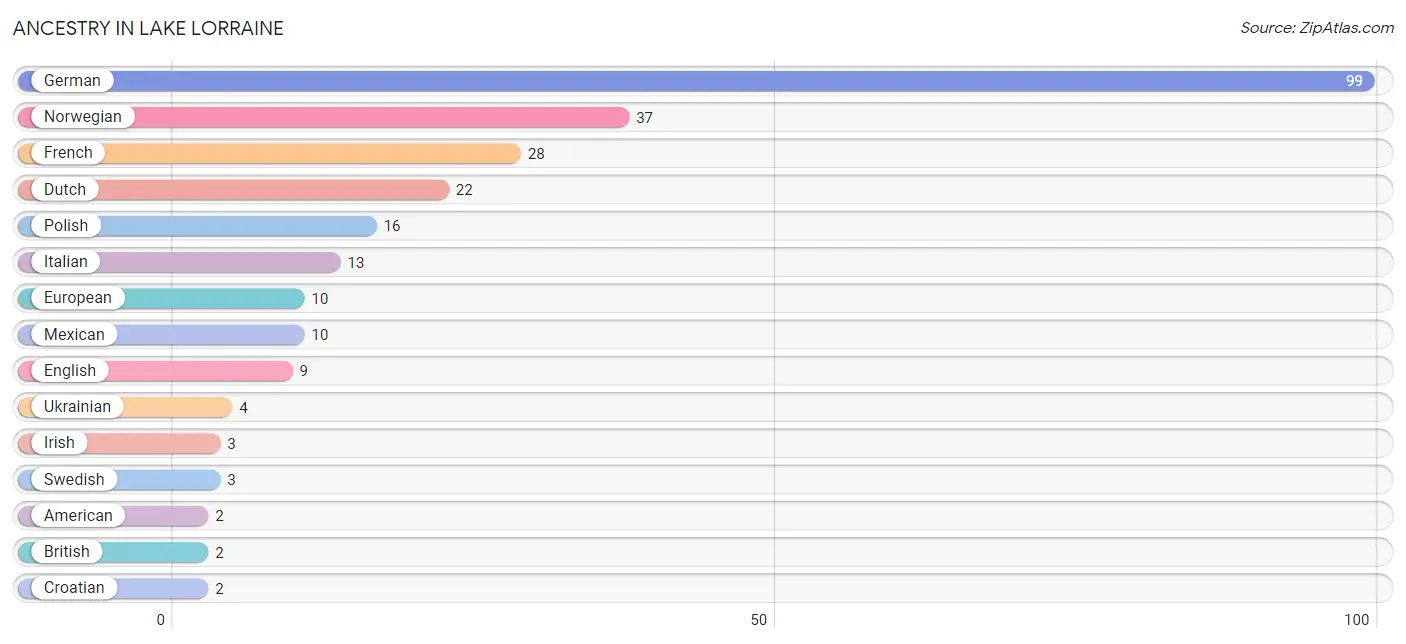
Ancestry in Lake Lorraine
The most populous ancestries reported in Lake Lorraine are German (99 | 34.1%), Norwegian (37 | 12.8%), French (28 | 9.7%), Dutch (22 | 7.6%), and Polish (16 | 5.5%), together accounting for 69.7% of all Lake Lorraine residents.
| Ancestry | # Population | % Population |
| American | 2 | 0.7% |
| British | 2 | 0.7% |
| Croatian | 2 | 0.7% |
| Dutch | 22 | 7.6% |
| English | 9 | 3.1% |
| European | 10 | 3.5% |
| French | 28 | 9.7% |
| German | 99 | 34.1% |
| Irish | 3 | 1.0% |
| Italian | 13 | 4.5% |
| Mexican | 10 | 3.5% |
| Norwegian | 37 | 12.8% |
| Polish | 16 | 5.5% |
| Scandinavian | 2 | 0.7% |
| Scottish | 2 | 0.7% |
| Swedish | 3 | 1.0% |
| Ukrainian | 4 | 1.4% | View All 17 Rows |
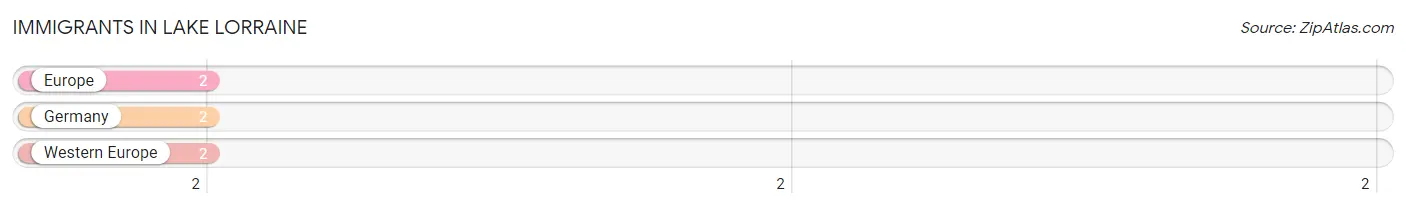
Immigrants in Lake Lorraine
The most numerous immigrant groups reported in Lake Lorraine came from Europe (2 | 0.7%), Germany (2 | 0.7%), and Western Europe (2 | 0.7%), together accounting for 2.1% of all Lake Lorraine residents.
| Immigration Origin | # Population | % Population |
| Europe | 2 | 0.7% |
| Germany | 2 | 0.7% |
| Western Europe | 2 | 0.7% | View All 3 Rows |
Sex and Age in Lake Lorraine
Sex and Age in Lake Lorraine
The most populous age groups in Lake Lorraine are 20 to 24 Years (18 | 12.3%) for men and 20 to 24 Years (28 | 19.4%) for women.
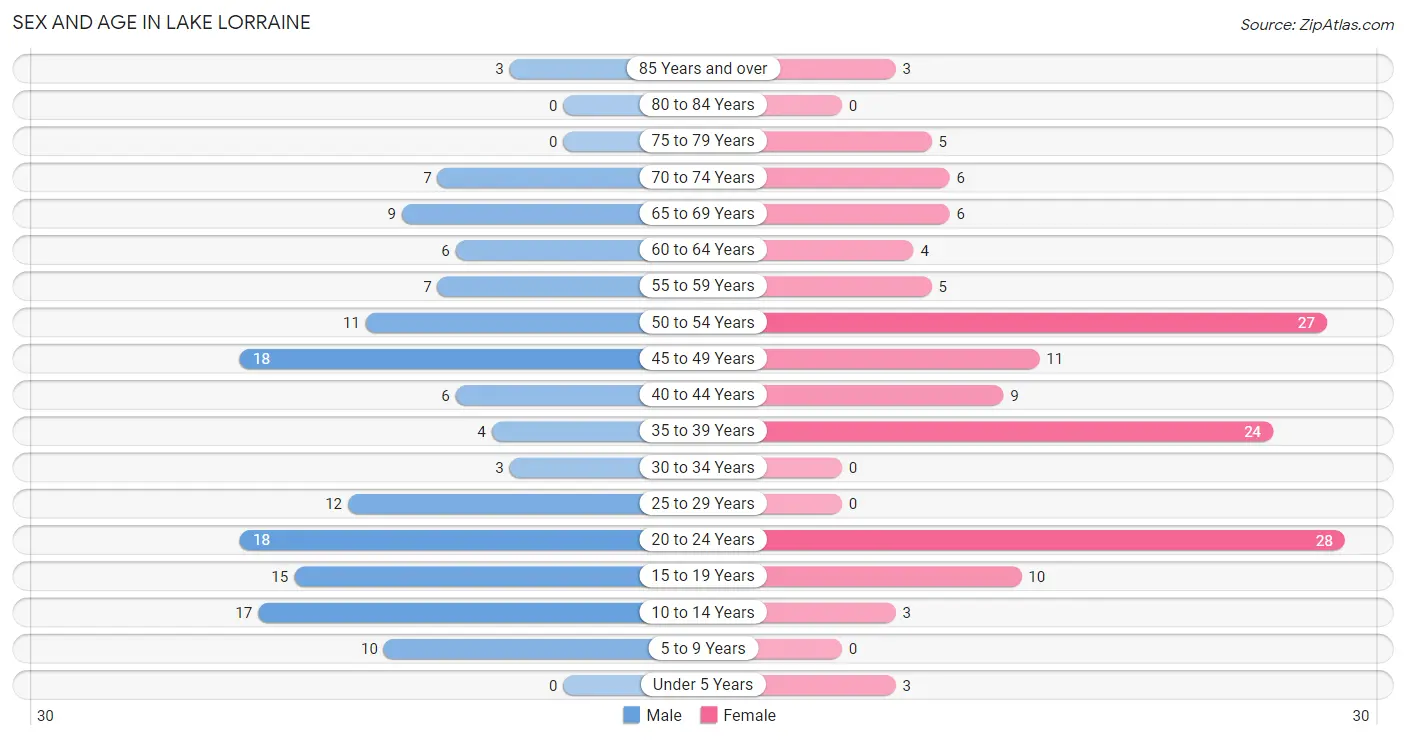
| Age Bracket | Male | Female |
| Under 5 Years | 0 (0.0%) | 3 (2.1%) |
| 5 to 9 Years | 10 (6.9%) | 0 (0.0%) |
| 10 to 14 Years | 17 (11.6%) | 3 (2.1%) |
| 15 to 19 Years | 15 (10.3%) | 10 (6.9%) |
| 20 to 24 Years | 18 (12.3%) | 28 (19.4%) |
| 25 to 29 Years | 12 (8.2%) | 0 (0.0%) |
| 30 to 34 Years | 3 (2.1%) | 0 (0.0%) |
| 35 to 39 Years | 4 (2.7%) | 24 (16.7%) |
| 40 to 44 Years | 6 (4.1%) | 9 (6.2%) |
| 45 to 49 Years | 18 (12.3%) | 11 (7.6%) |
| 50 to 54 Years | 11 (7.5%) | 27 (18.8%) |
| 55 to 59 Years | 7 (4.8%) | 5 (3.5%) |
| 60 to 64 Years | 6 (4.1%) | 4 (2.8%) |
| 65 to 69 Years | 9 (6.2%) | 6 (4.2%) |
| 70 to 74 Years | 7 (4.8%) | 6 (4.2%) |
| 75 to 79 Years | 0 (0.0%) | 5 (3.5%) |
| 80 to 84 Years | 0 (0.0%) | 0 (0.0%) |
| 85 Years and over | 3 (2.1%) | 3 (2.1%) |
| Total | 146 (100.0%) | 144 (100.0%) |
Families and Households in Lake Lorraine
Median Family Size in Lake Lorraine
The median family size in Lake Lorraine is 2.81 persons per family, with single male/father families (3 | 3.8%) accounting for the largest median family size of 3 persons per family. On the other hand, single female/mother families (6 | 7.6%) represent the smallest median family size with 2.17 persons per family.
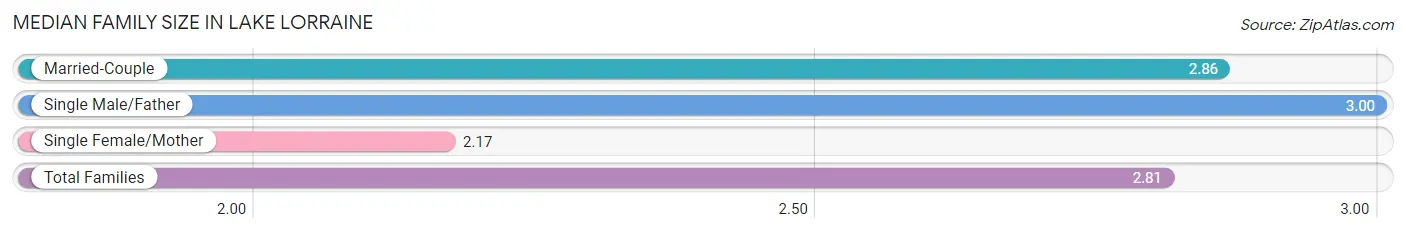
| Family Type | # Families | Family Size |
| Married-Couple | 70 (88.6%) | 2.86 |
| Single Male/Father | 3 (3.8%) | 3.00 |
| Single Female/Mother | 6 (7.6%) | 2.17 |
| Total Families | 79 (100.0%) | 2.81 |
Median Household Size in Lake Lorraine
The median household size in Lake Lorraine is 2.27 persons per household, with single male/father households (3 | 2.3%) accounting for the largest median household size of 3 persons per household. non-family households (49 | 38.3%) represent the smallest median household size with 1.39 persons per household.
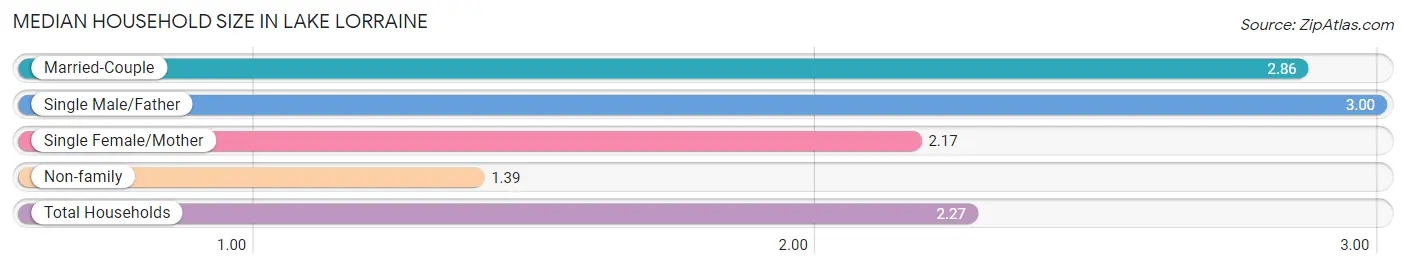
| Household Type | # Households | Household Size |
| Married-Couple | 70 (54.7%) | 2.86 |
| Single Male/Father | 3 (2.3%) | 3.00 |
| Single Female/Mother | 6 (4.7%) | 2.17 |
| Non-family | 49 (38.3%) | 1.39 |
| Total Households | 128 (100.0%) | 2.27 |
Household Size by Marriage Status in Lake Lorraine
Out of a total of 128 households in Lake Lorraine, 79 (61.7%) are family households, while 49 (38.3%) are nonfamily households. The most numerous type of family households are 2-person households, comprising 41, and the most common type of nonfamily households are 1-person households, comprising 31.
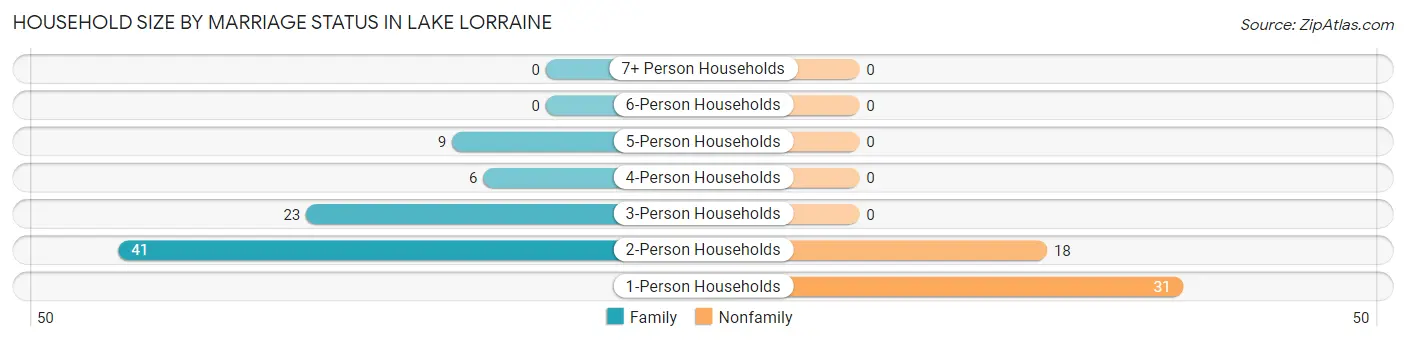
| Household Size | Family Households | Nonfamily Households |
| 1-Person Households | - | 31 (24.2%) |
| 2-Person Households | 41 (32.0%) | 18 (14.1%) |
| 3-Person Households | 23 (18.0%) | 0 (0.0%) |
| 4-Person Households | 6 (4.7%) | 0 (0.0%) |
| 5-Person Households | 9 (7.0%) | 0 (0.0%) |
| 6-Person Households | 0 (0.0%) | 0 (0.0%) |
| 7+ Person Households | 0 (0.0%) | 0 (0.0%) |
| Total | 79 (61.7%) | 49 (38.3%) |
Female Fertility in Lake Lorraine
Fertility by Age in Lake Lorraine
| Age Bracket | Women with Births | Births / 1,000 Women |
| 15 to 19 years | 0 (0.0%) | 0.0 |
| 20 to 34 years | 0 (0.0%) | 0.0 |
| 35 to 50 years | 0 (0.0%) | 0.0 |
| Total | 0 (0.0%) | 0.0 |
Fertility by Age by Marriage Status in Lake Lorraine
| Age Bracket | Married | Unmarried |
| 15 to 19 years | 0 (0.0%) | 0 (0.0%) |
| 20 to 34 years | 0 (0.0%) | 0 (0.0%) |
| 35 to 50 years | 0 (0.0%) | 0 (0.0%) |
| Total | 0 (0.0%) | 0 (0.0%) |
Fertility by Education in Lake Lorraine
| Educational Attainment | Women with Births | Births / 1,000 Women |
| Less than High School | 0 (0.0%) | 0.0 |
| High School Diploma | 0 (0.0%) | 0.0 |
| College or Associate's Degree | 0 (0.0%) | 0.0 |
| Bachelor's Degree | 0 (0.0%) | 0.0 |
| Graduate Degree | 0 (0.0%) | 0.0 |
| Total | 0 (0.0%) | 0.0 |
Fertility by Education by Marriage Status in Lake Lorraine
| Educational Attainment | Married | Unmarried |
| Less than High School | 0 (0.0%) | 0 (0.0%) |
| High School Diploma | 0 (0.0%) | 0 (0.0%) |
| College or Associate's Degree | 0 (0.0%) | 0 (0.0%) |
| Bachelor's Degree | 0 (0.0%) | 0 (0.0%) |
| Graduate Degree | 0 (0.0%) | 0 (0.0%) |
| Total | 0 (0.0%) | 0 (0.0%) |
Income in Lake Lorraine
Income Overview in Lake Lorraine
Per Capita Income in Lake Lorraine is $32,648, while median incomes of families and households are $86,750 and $67,188 respectively.
| Characteristic | Number | Measure |
| Per Capita Income | 290 | $32,648 |
| Median Family Income | 79 | $86,750 |
| Mean Family Income | 79 | $96,139 |
| Median Household Income | 128 | $67,188 |
| Mean Household Income | 128 | $74,754 |
| Income Deficit | 79 | $0 |
| Wage / Income Gap (%) | 290 | 44.99% |
| Wage / Income Gap ($) | 290 | 55.01¢ per $1 |
| Gini / Inequality Index | 290 | 0.36 |
Earnings by Sex in Lake Lorraine
Average Earnings in Lake Lorraine are $40,313, $45,446 for men and $25,000 for women, a difference of 45.0%.
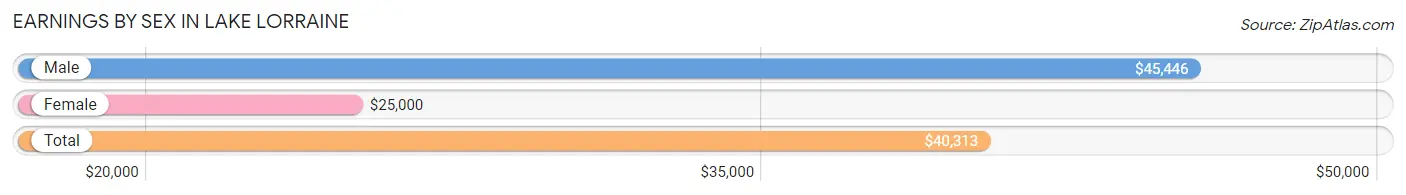
| Sex | Number | Average Earnings |
| Male | 97 (48.7%) | $45,446 |
| Female | 102 (51.3%) | $25,000 |
| Total | 199 (100.0%) | $40,313 |
Earnings by Sex by Income Bracket in Lake Lorraine
The most common earnings brackets in Lake Lorraine are $75,000 to $99,999 for men (20 | 20.6%) and $12,500 to $14,999 for women (24 | 23.5%).
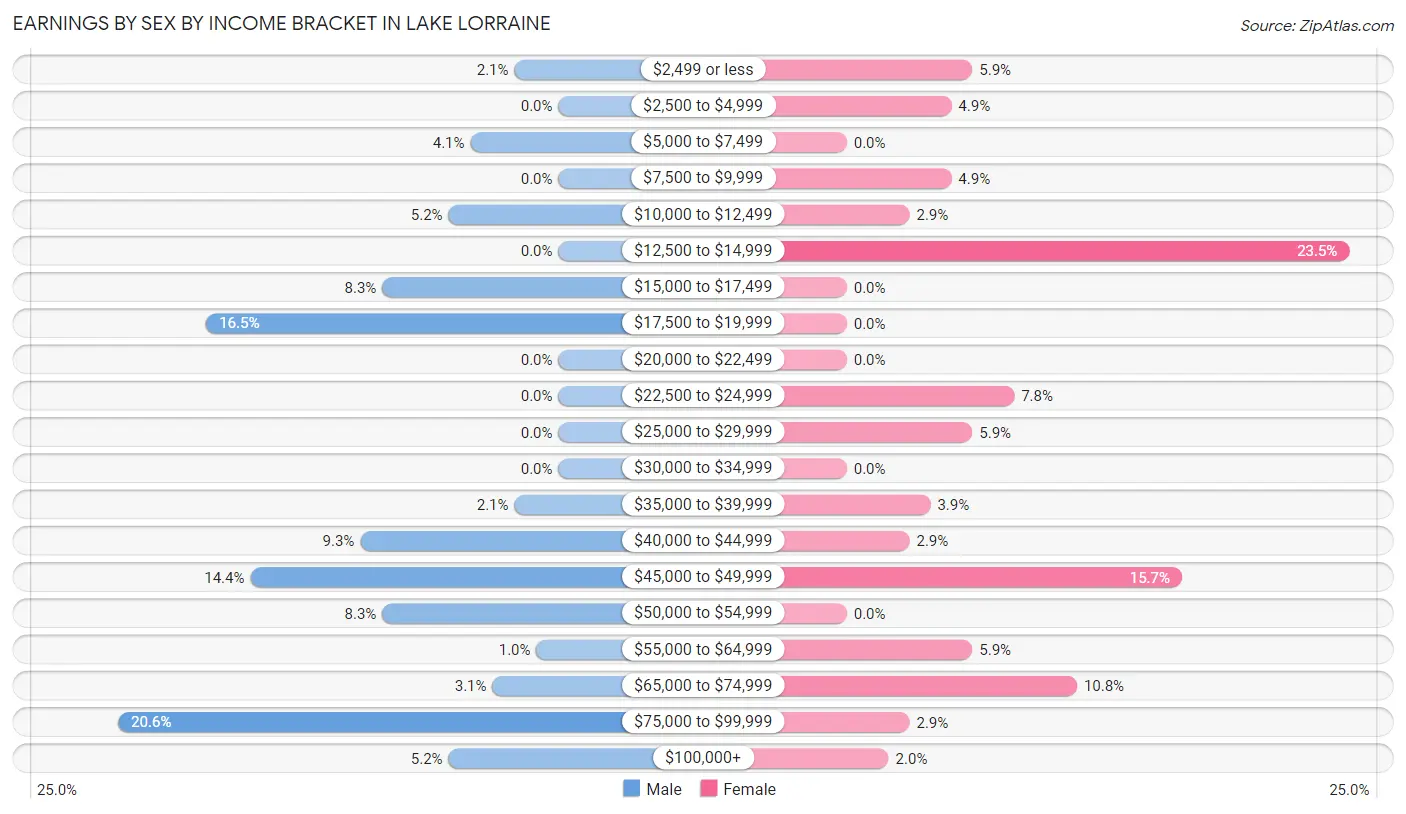
| Income | Male | Female |
| $2,499 or less | 2 (2.1%) | 6 (5.9%) |
| $2,500 to $4,999 | 0 (0.0%) | 5 (4.9%) |
| $5,000 to $7,499 | 4 (4.1%) | 0 (0.0%) |
| $7,500 to $9,999 | 0 (0.0%) | 5 (4.9%) |
| $10,000 to $12,499 | 5 (5.1%) | 3 (2.9%) |
| $12,500 to $14,999 | 0 (0.0%) | 24 (23.5%) |
| $15,000 to $17,499 | 8 (8.3%) | 0 (0.0%) |
| $17,500 to $19,999 | 16 (16.5%) | 0 (0.0%) |
| $20,000 to $22,499 | 0 (0.0%) | 0 (0.0%) |
| $22,500 to $24,999 | 0 (0.0%) | 8 (7.8%) |
| $25,000 to $29,999 | 0 (0.0%) | 6 (5.9%) |
| $30,000 to $34,999 | 0 (0.0%) | 0 (0.0%) |
| $35,000 to $39,999 | 2 (2.1%) | 4 (3.9%) |
| $40,000 to $44,999 | 9 (9.3%) | 3 (2.9%) |
| $45,000 to $49,999 | 14 (14.4%) | 16 (15.7%) |
| $50,000 to $54,999 | 8 (8.3%) | 0 (0.0%) |
| $55,000 to $64,999 | 1 (1.0%) | 6 (5.9%) |
| $65,000 to $74,999 | 3 (3.1%) | 11 (10.8%) |
| $75,000 to $99,999 | 20 (20.6%) | 3 (2.9%) |
| $100,000+ | 5 (5.1%) | 2 (2.0%) |
| Total | 97 (100.0%) | 102 (100.0%) |
Earnings by Sex by Educational Attainment in Lake Lorraine
Average earnings in Lake Lorraine are $51,250 for men and $45,865 for women, a difference of 10.5%. Men with an educational attainment of college or associate's degree enjoy the highest average annual earnings of $75,417, while those with high school diploma education earn the least with $45,893. Women with an educational attainment of college or associate's degree earn the most with the average annual earnings of $48,750, while those with high school diploma education have the smallest earnings of $24,219.
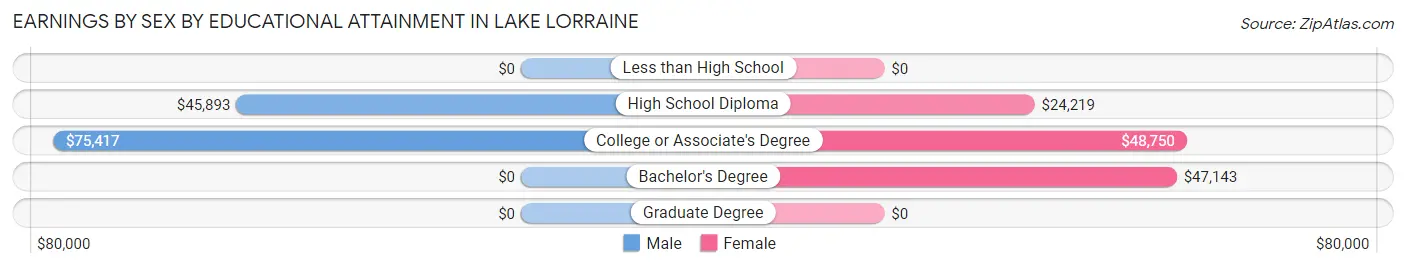
| Educational Attainment | Male Income | Female Income |
| Less than High School | - | - |
| High School Diploma | $45,893 | $24,219 |
| College or Associate's Degree | $75,417 | $48,750 |
| Bachelor's Degree | - | - |
| Graduate Degree | - | - |
| Total | $51,250 | $45,865 |
Family Income in Lake Lorraine
Family Income Brackets in Lake Lorraine
According to the Lake Lorraine family income data, there are 22 families falling into the $100,000 to $149,999 income range, which is the most common income bracket and makes up 27.9% of all families.
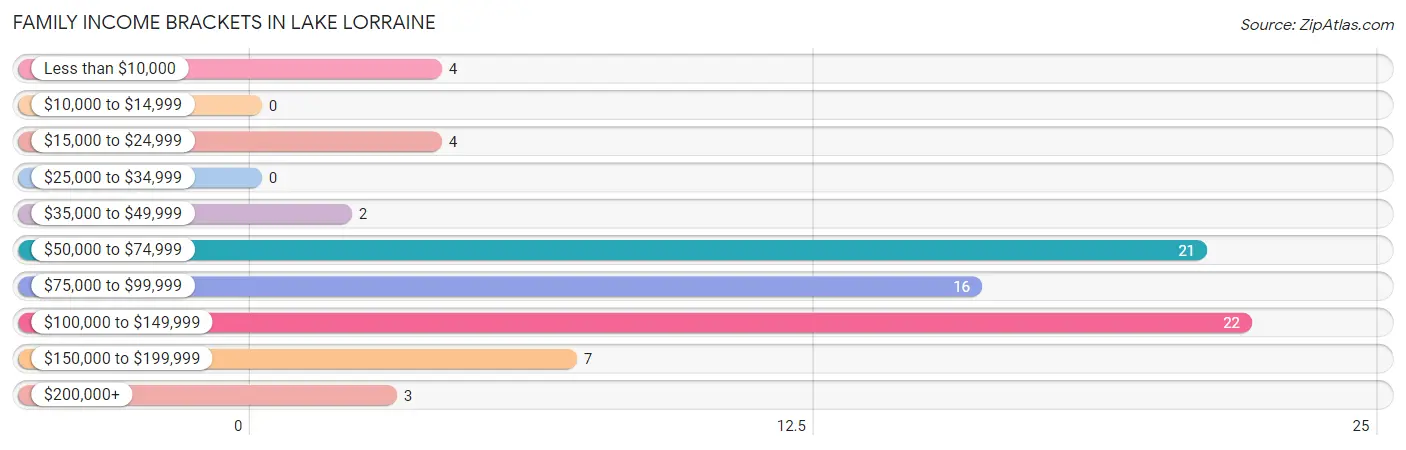
| Income Bracket | # Families | % Families |
| Less than $10,000 | 4 | 5.1% |
| $10,000 to $14,999 | 0 | 0.0% |
| $15,000 to $24,999 | 4 | 5.1% |
| $25,000 to $34,999 | 0 | 0.0% |
| $35,000 to $49,999 | 2 | 2.5% |
| $50,000 to $74,999 | 21 | 26.6% |
| $75,000 to $99,999 | 16 | 20.3% |
| $100,000 to $149,999 | 22 | 27.8% |
| $150,000 to $199,999 | 7 | 8.9% |
| $200,000+ | 3 | 3.8% |
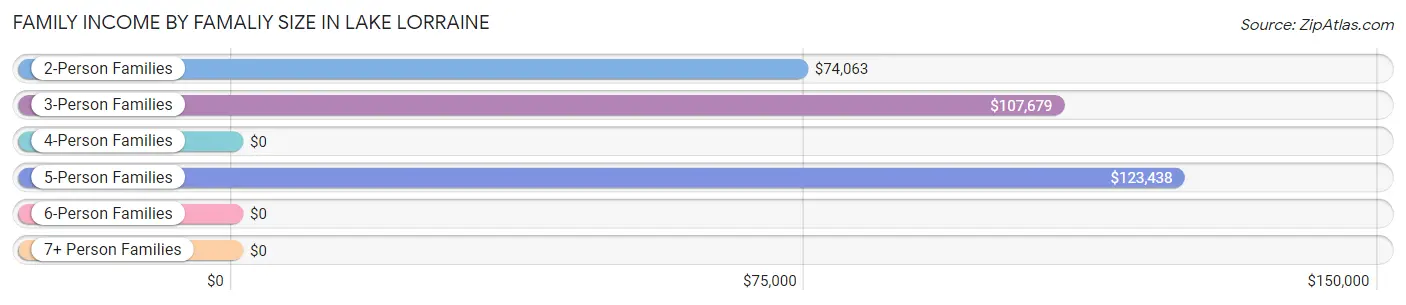
Family Income by Famaliy Size in Lake Lorraine
5-person families (9 | 11.4%) account for the highest median family income in Lake Lorraine with $123,438 per family, while 2-person families (41 | 51.9%) have the highest median income of $37,032 per family member.
| Income Bracket | # Families | Median Income |
| 2-Person Families | 41 (51.9%) | $74,063 |
| 3-Person Families | 23 (29.1%) | $107,679 |
| 4-Person Families | 6 (7.6%) | $0 |
| 5-Person Families | 9 (11.4%) | $123,438 |
| 6-Person Families | 0 (0.0%) | $0 |
| 7+ Person Families | 0 (0.0%) | $0 |
| Total | 79 (100.0%) | $86,750 |
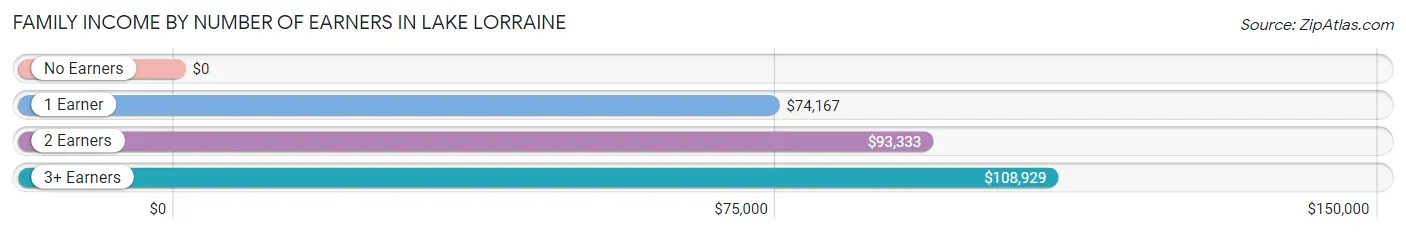
Family Income by Number of Earners in Lake Lorraine
| Number of Earners | # Families | Median Income |
| No Earners | 11 (13.9%) | $0 |
| 1 Earner | 14 (17.7%) | $74,167 |
| 2 Earners | 36 (45.6%) | $93,333 |
| 3+ Earners | 18 (22.8%) | $108,929 |
| Total | 79 (100.0%) | $86,750 |
Household Income in Lake Lorraine
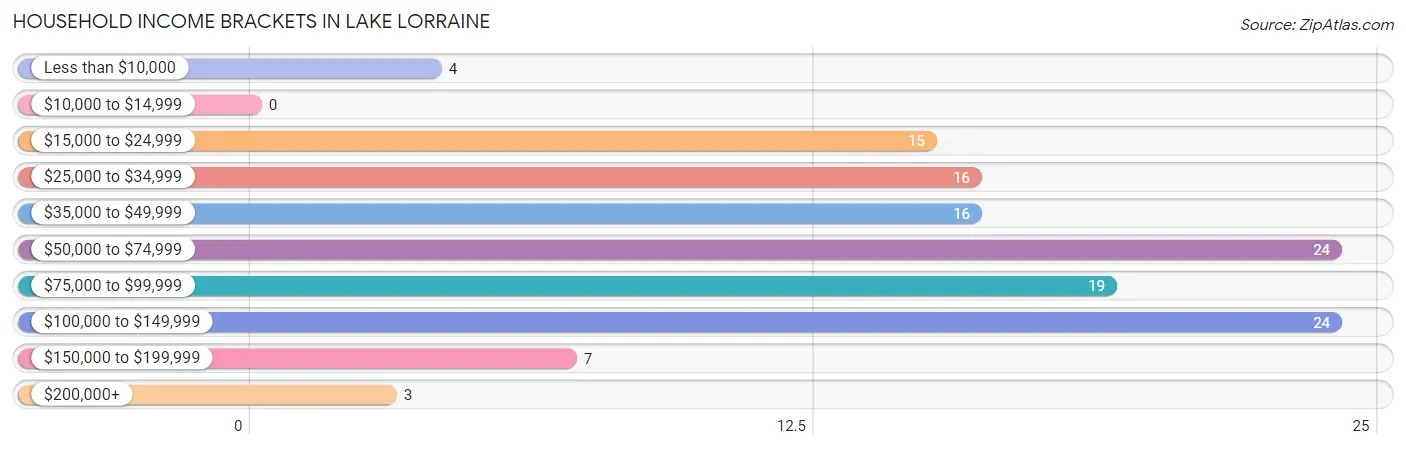
Household Income Brackets in Lake Lorraine
With 24 households falling in the category, the $50,000 to $74,999 income range is the most frequent in Lake Lorraine, accounting for 18.8% of all households.
| Income Bracket | # Households | % Households |
| Less than $10,000 | 4 | 3.1% |
| $10,000 to $14,999 | 0 | 0.0% |
| $15,000 to $24,999 | 15 | 11.7% |
| $25,000 to $34,999 | 16 | 12.5% |
| $35,000 to $49,999 | 16 | 12.5% |
| $50,000 to $74,999 | 24 | 18.8% |
| $75,000 to $99,999 | 19 | 14.8% |
| $100,000 to $149,999 | 24 | 18.8% |
| $150,000 to $199,999 | 7 | 5.5% |
| $200,000+ | 3 | 2.3% |
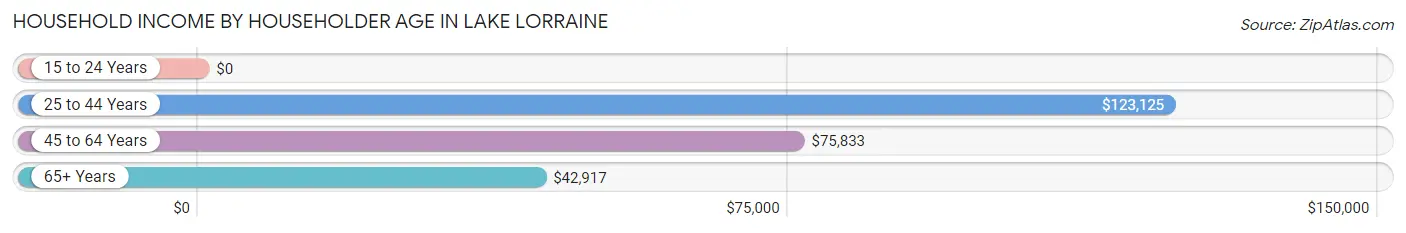
Household Income by Householder Age in Lake Lorraine
The median household income in Lake Lorraine is $67,188, with the highest median household income of $123,125 found in the 25 to 44 years age bracket for the primary householder. A total of 22 households (17.2%) fall into this category. Meanwhile, the 15 to 24 years age bracket for the primary householder has the lowest median household income of $0, with 25 households (19.5%) in this group.
| Income Bracket | # Households | Median Income |
| 15 to 24 Years | 25 (19.5%) | $0 |
| 25 to 44 Years | 22 (17.2%) | $123,125 |
| 45 to 64 Years | 54 (42.2%) | $75,833 |
| 65+ Years | 27 (21.1%) | $42,917 |
| Total | 128 (100.0%) | $67,188 |
Poverty in Lake Lorraine
Income Below Poverty by Sex and Age in Lake Lorraine
With 6.9% poverty level for males and 18.8% for females among the residents of Lake Lorraine, 75 year old and over males and 18 to 24 year old females are the most vulnerable to poverty, with 3 males (100.0%) and 16 females (57.1%) in their respective age groups living below the poverty level.
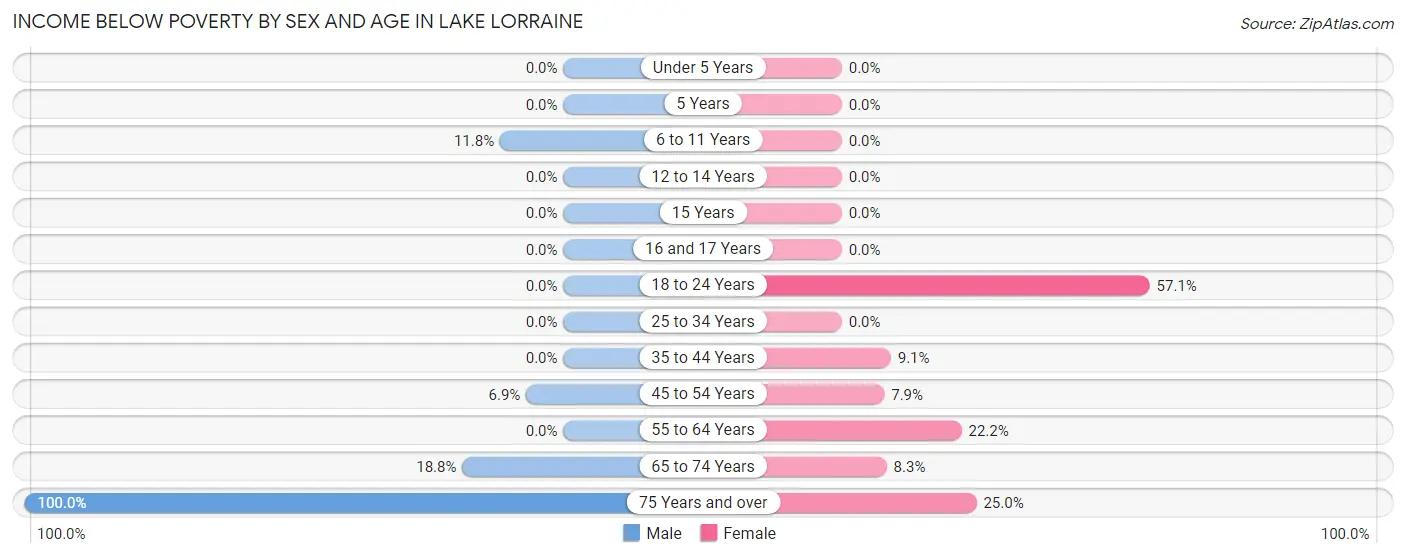
| Age Bracket | Male | Female |
| Under 5 Years | 0 (0.0%) | 0 (0.0%) |
| 5 Years | 0 (0.0%) | 0 (0.0%) |
| 6 to 11 Years | 2 (11.8%) | 0 (0.0%) |
| 12 to 14 Years | 0 (0.0%) | 0 (0.0%) |
| 15 Years | 0 (0.0%) | 0 (0.0%) |
| 16 and 17 Years | 0 (0.0%) | 0 (0.0%) |
| 18 to 24 Years | 0 (0.0%) | 16 (57.1%) |
| 25 to 34 Years | 0 (0.0%) | 0 (0.0%) |
| 35 to 44 Years | 0 (0.0%) | 3 (9.1%) |
| 45 to 54 Years | 2 (6.9%) | 3 (7.9%) |
| 55 to 64 Years | 0 (0.0%) | 2 (22.2%) |
| 65 to 74 Years | 3 (18.8%) | 1 (8.3%) |
| 75 Years and over | 3 (100.0%) | 2 (25.0%) |
| Total | 10 (6.9%) | 27 (18.8%) |
Income Above Poverty by Sex and Age in Lake Lorraine
According to the poverty statistics in Lake Lorraine, males aged 12 to 14 years and females aged under 5 years are the age groups that are most secure financially, with 100.0% of males and 100.0% of females in these age groups living above the poverty line.
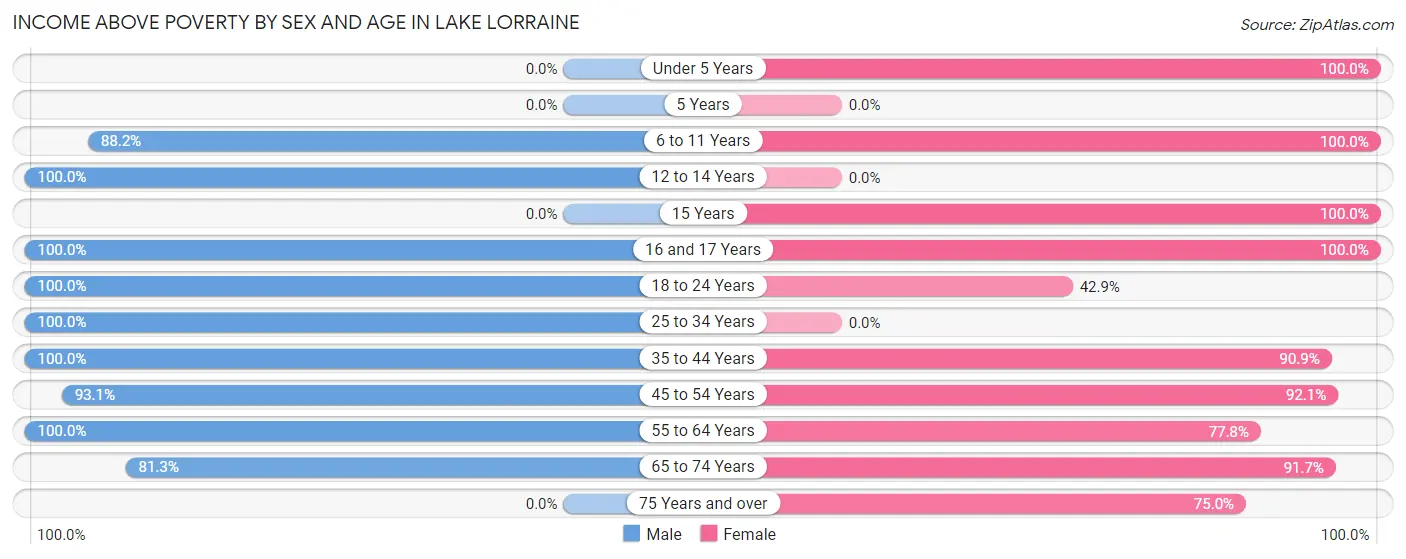
| Age Bracket | Male | Female |
| Under 5 Years | 0 (0.0%) | 3 (100.0%) |
| 5 Years | 0 (0.0%) | 0 (0.0%) |
| 6 to 11 Years | 15 (88.2%) | 3 (100.0%) |
| 12 to 14 Years | 10 (100.0%) | 0 (0.0%) |
| 15 Years | 0 (0.0%) | 3 (100.0%) |
| 16 and 17 Years | 4 (100.0%) | 7 (100.0%) |
| 18 to 24 Years | 29 (100.0%) | 12 (42.9%) |
| 25 to 34 Years | 15 (100.0%) | 0 (0.0%) |
| 35 to 44 Years | 10 (100.0%) | 30 (90.9%) |
| 45 to 54 Years | 27 (93.1%) | 35 (92.1%) |
| 55 to 64 Years | 13 (100.0%) | 7 (77.8%) |
| 65 to 74 Years | 13 (81.2%) | 11 (91.7%) |
| 75 Years and over | 0 (0.0%) | 6 (75.0%) |
| Total | 136 (93.1%) | 117 (81.2%) |
Income Below Poverty Among Married-Couple Families in Lake Lorraine
The poverty statistics for married-couple families in Lake Lorraine show that 7.1% or 5 of the total 70 families live below the poverty line. Families with 1 or 2 children have the highest poverty rate of 14.3%, comprising of 2 families. On the other hand, families with 3 or 4 children have the lowest poverty rate of 0.0%, which includes 0 families.
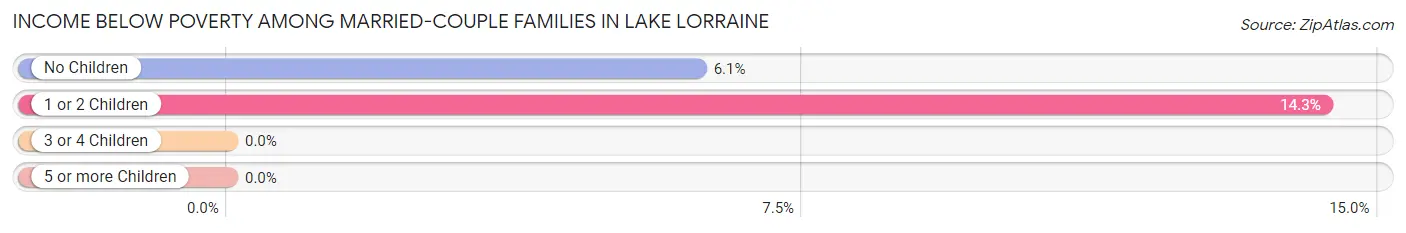
| Children | Above Poverty | Below Poverty |
| No Children | 46 (93.9%) | 3 (6.1%) |
| 1 or 2 Children | 12 (85.7%) | 2 (14.3%) |
| 3 or 4 Children | 7 (100.0%) | 0 (0.0%) |
| 5 or more Children | 0 (0.0%) | 0 (0.0%) |
| Total | 65 (92.9%) | 5 (7.1%) |
Income Below Poverty Among Single-Parent Households in Lake Lorraine
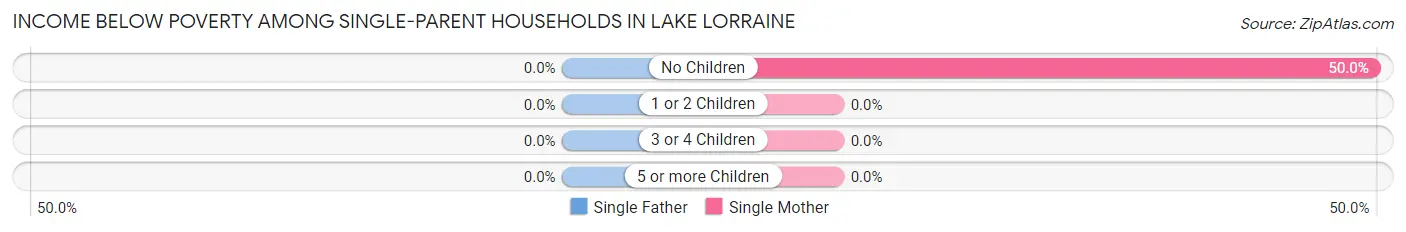
| Children | Single Father | Single Mother |
| No Children | 0 (0.0%) | 3 (50.0%) |
| 1 or 2 Children | 0 (0.0%) | 0 (0.0%) |
| 3 or 4 Children | 0 (0.0%) | 0 (0.0%) |
| 5 or more Children | 0 (0.0%) | 0 (0.0%) |
| Total | 0 (0.0%) | 3 (50.0%) |
Income Below Poverty Among Married-Couple vs Single-Parent Households in Lake Lorraine
The poverty data for Lake Lorraine shows that 5 of the married-couple family households (7.1%) and 3 of the single-parent households (33.3%) are living below the poverty level. Within the married-couple family households, those with 1 or 2 children have the highest poverty rate, with 2 households (14.3%) falling below the poverty line. Among the single-parent households, those with no children have the highest poverty rate, with 3 household (50.0%) living below poverty.
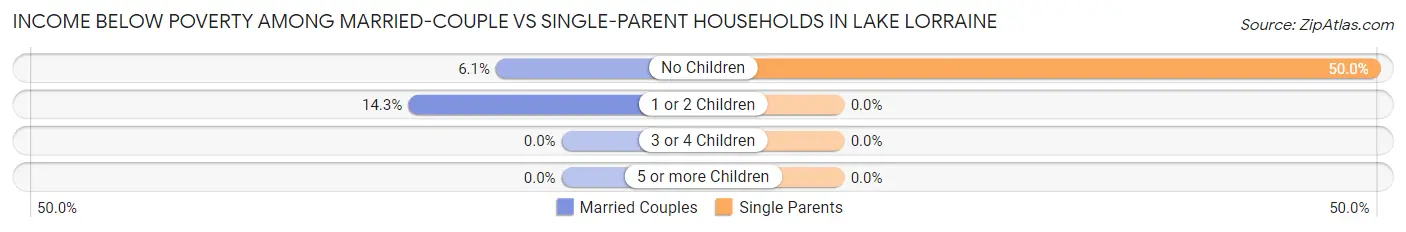
| Children | Married-Couple Families | Single-Parent Households |
| No Children | 3 (6.1%) | 3 (50.0%) |
| 1 or 2 Children | 2 (14.3%) | 0 (0.0%) |
| 3 or 4 Children | 0 (0.0%) | 0 (0.0%) |
| 5 or more Children | 0 (0.0%) | 0 (0.0%) |
| Total | 5 (7.1%) | 3 (33.3%) |
Employment Characteristics in Lake Lorraine
Employment by Class of Employer in Lake Lorraine
Among the 194 employed individuals in Lake Lorraine, private company employees (135 | 69.6%), state government employees (22 | 11.3%), and self-employed (not incorporated) (15 | 7.7%) make up the most common classes of employment.
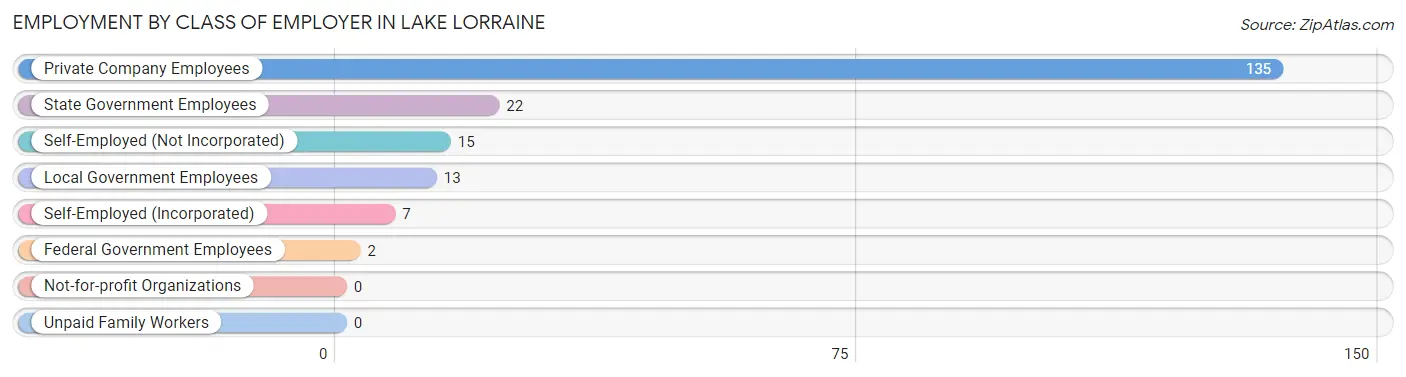
| Employer Class | # Employees | % Employees |
| Private Company Employees | 135 | 69.6% |
| Self-Employed (Incorporated) | 7 | 3.6% |
| Self-Employed (Not Incorporated) | 15 | 7.7% |
| Not-for-profit Organizations | 0 | 0.0% |
| Local Government Employees | 13 | 6.7% |
| State Government Employees | 22 | 11.3% |
| Federal Government Employees | 2 | 1.0% |
| Unpaid Family Workers | 0 | 0.0% |
| Total | 194 | 100.0% |
Employment Status by Age in Lake Lorraine
According to the labor force statistics for Lake Lorraine, out of the total population over 16 years of age (254), 79.1% or 201 individuals are in the labor force, with 3.0% or 6 of them unemployed. The age group with the highest labor force participation rate is 20 to 24 years, with 100.0% or 46 individuals in the labor force. Within the labor force, the 55 to 59 years age range has the highest percentage of unemployed individuals, with 16.7% or 2 of them being unemployed.
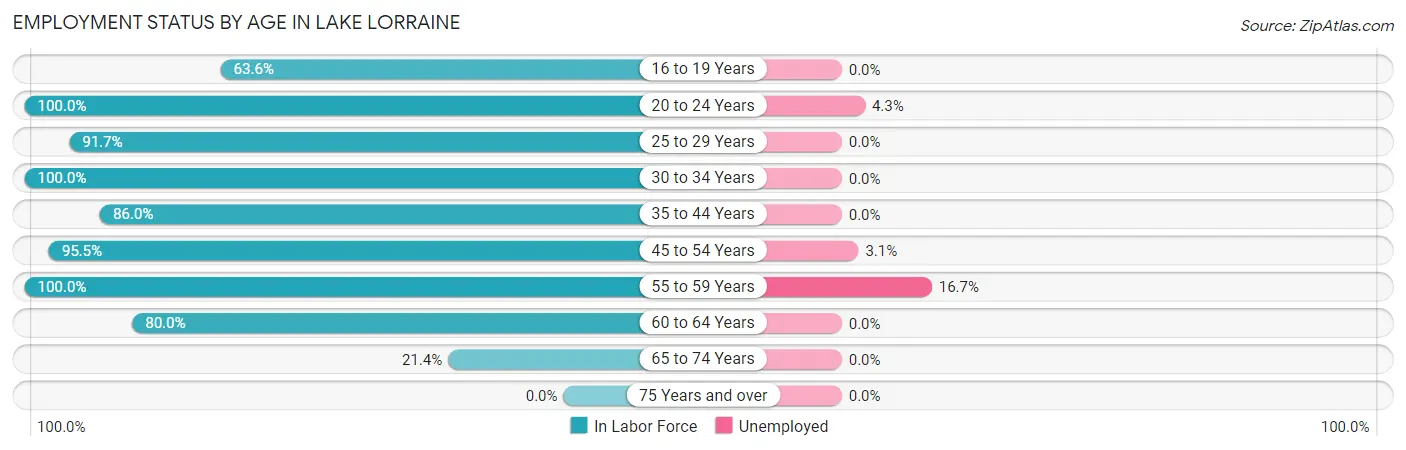
| Age Bracket | In Labor Force | Unemployed |
| 16 to 19 Years | 14 (63.6%) | 0 (0.0%) |
| 20 to 24 Years | 46 (100.0%) | 2 (4.3%) |
| 25 to 29 Years | 11 (91.7%) | 0 (0.0%) |
| 30 to 34 Years | 3 (100.0%) | 0 (0.0%) |
| 35 to 44 Years | 37 (86.0%) | 0 (0.0%) |
| 45 to 54 Years | 64 (95.5%) | 2 (3.1%) |
| 55 to 59 Years | 12 (100.0%) | 2 (16.7%) |
| 60 to 64 Years | 8 (80.0%) | 0 (0.0%) |
| 65 to 74 Years | 6 (21.4%) | 0 (0.0%) |
| 75 Years and over | 0 (0.0%) | 0 (0.0%) |
| Total | 201 (79.1%) | 6 (3.0%) |
Employment Status by Educational Attainment in Lake Lorraine
According to labor force statistics for Lake Lorraine, 91.8% of individuals (135) out of the total population between 25 and 64 years of age (147) are in the labor force, with 3.0% or 4 of them being unemployed. The group with the highest labor force participation rate are those with the educational attainment of less than high school, with 100.0% or 5 individuals in the labor force. Within the labor force, individuals with bachelor's degree or higher education have the highest percentage of unemployment, with 5.3% or 2 of them being unemployed.
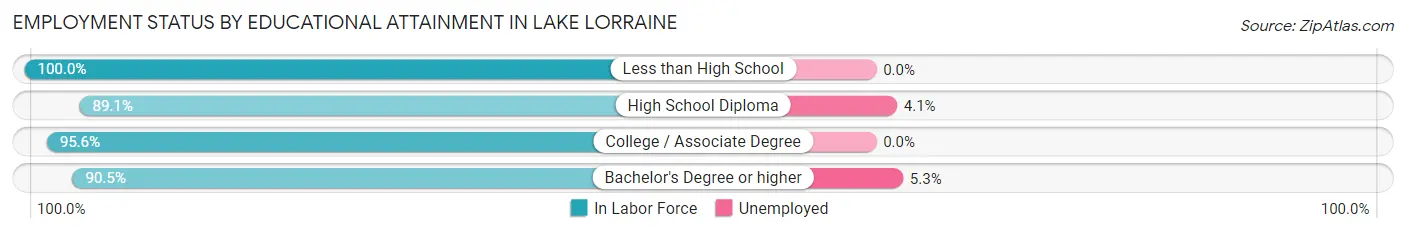
| Educational Attainment | In Labor Force | Unemployed |
| Less than High School | 5 (100.0%) | 0 (0.0%) |
| High School Diploma | 49 (89.1%) | 2 (4.1%) |
| College / Associate Degree | 43 (95.6%) | 0 (0.0%) |
| Bachelor's Degree or higher | 38 (90.5%) | 2 (5.3%) |
| Total | 135 (91.8%) | 4 (3.0%) |
Employment Occupations by Sex in Lake Lorraine
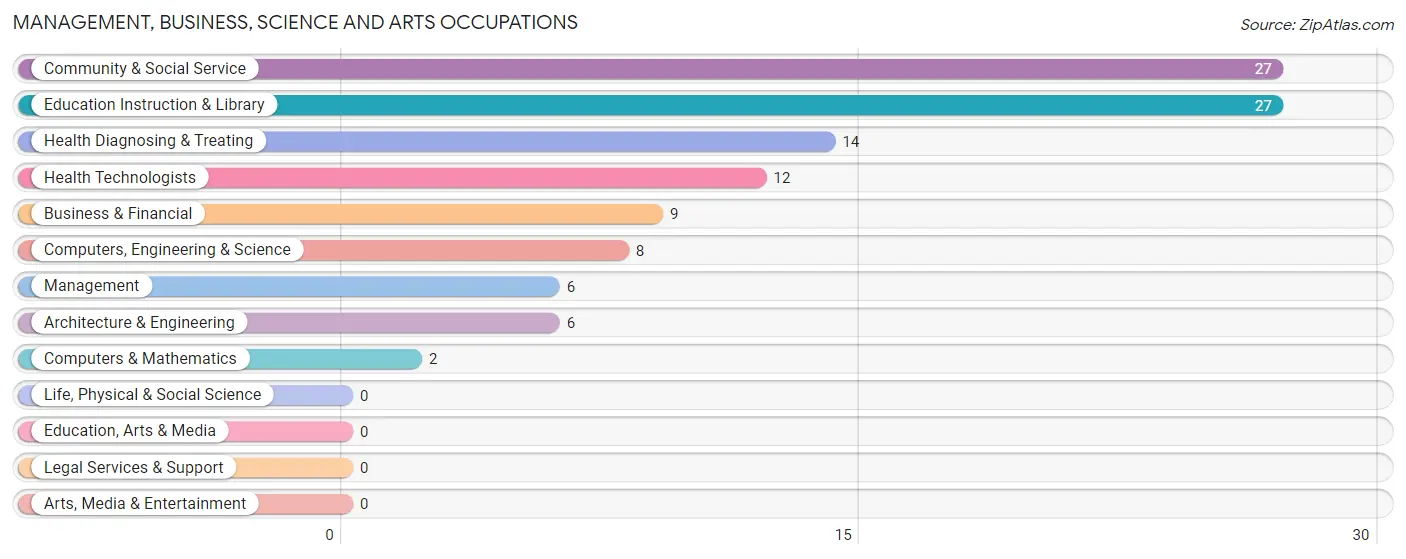
Management, Business, Science and Arts Occupations
The most common Management, Business, Science and Arts occupations in Lake Lorraine are Community & Social Service (27 | 13.9%), Education Instruction & Library (27 | 13.9%), Health Diagnosing & Treating (14 | 7.2%), Health Technologists (12 | 6.1%), and Business & Financial (9 | 4.6%).
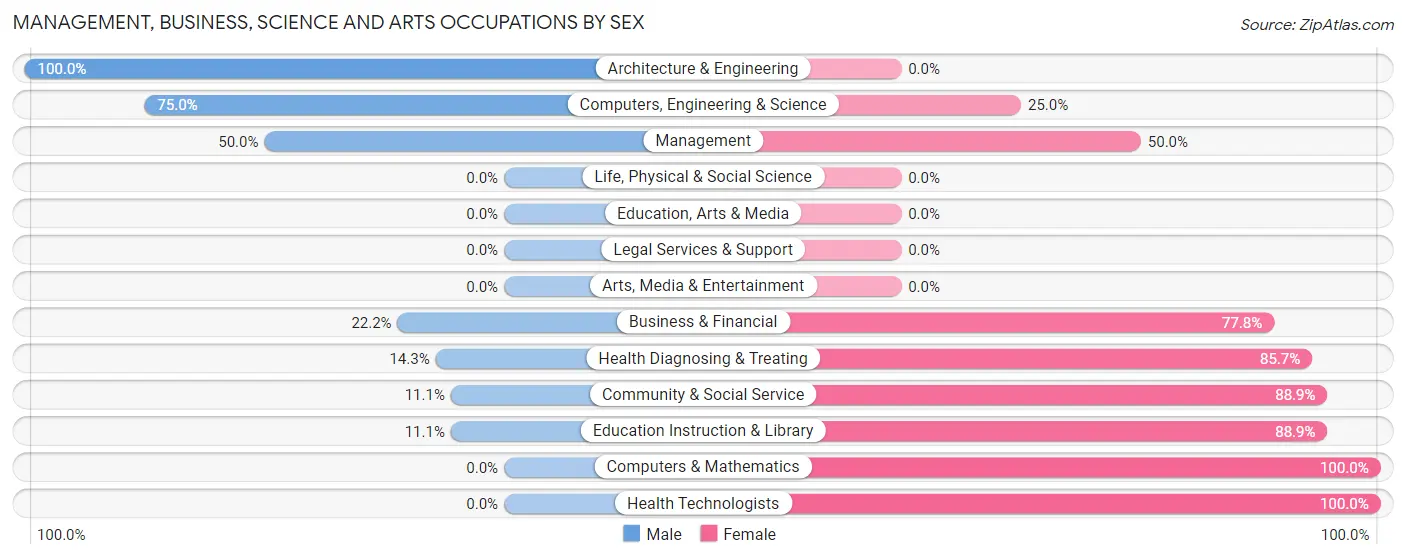
Management, Business, Science and Arts Occupations by Sex
Within the Management, Business, Science and Arts occupations in Lake Lorraine, the most male-oriented occupations are Architecture & Engineering (100.0%), Computers, Engineering & Science (75.0%), and Management (50.0%), while the most female-oriented occupations are Computers & Mathematics (100.0%), Health Technologists (100.0%), and Community & Social Service (88.9%).
| Occupation | Male | Female |
| Management | 3 (50.0%) | 3 (50.0%) |
| Business & Financial | 2 (22.2%) | 7 (77.8%) |
| Computers, Engineering & Science | 6 (75.0%) | 2 (25.0%) |
| Computers & Mathematics | 0 (0.0%) | 2 (100.0%) |
| Architecture & Engineering | 6 (100.0%) | 0 (0.0%) |
| Life, Physical & Social Science | 0 (0.0%) | 0 (0.0%) |
| Community & Social Service | 3 (11.1%) | 24 (88.9%) |
| Education, Arts & Media | 0 (0.0%) | 0 (0.0%) |
| Legal Services & Support | 0 (0.0%) | 0 (0.0%) |
| Education Instruction & Library | 3 (11.1%) | 24 (88.9%) |
| Arts, Media & Entertainment | 0 (0.0%) | 0 (0.0%) |
| Health Diagnosing & Treating | 2 (14.3%) | 12 (85.7%) |
| Health Technologists | 0 (0.0%) | 12 (100.0%) |
| Total (Category) | 16 (25.0%) | 48 (75.0%) |
| Total (Overall) | 95 (48.7%) | 100 (51.3%) |
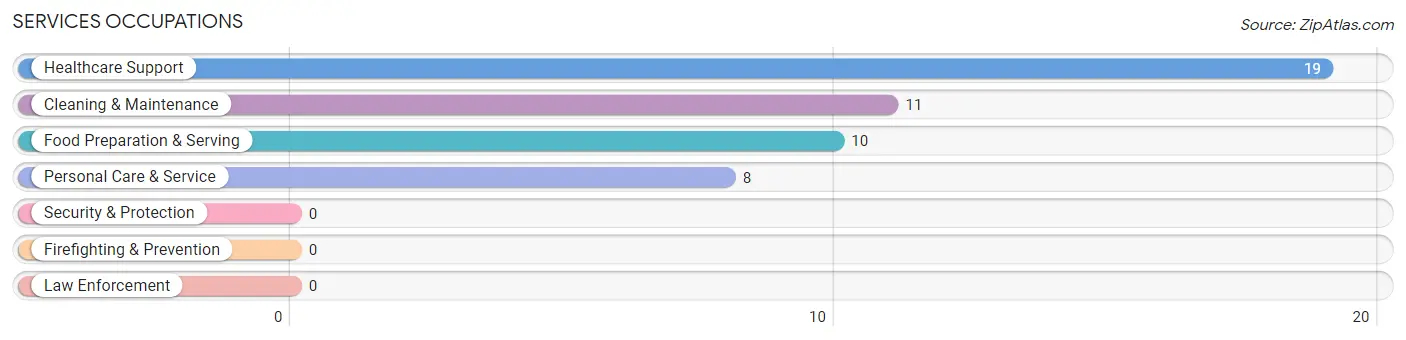
Services Occupations
The most common Services occupations in Lake Lorraine are Healthcare Support (19 | 9.7%), Cleaning & Maintenance (11 | 5.6%), Food Preparation & Serving (10 | 5.1%), and Personal Care & Service (8 | 4.1%).
Services Occupations by Sex
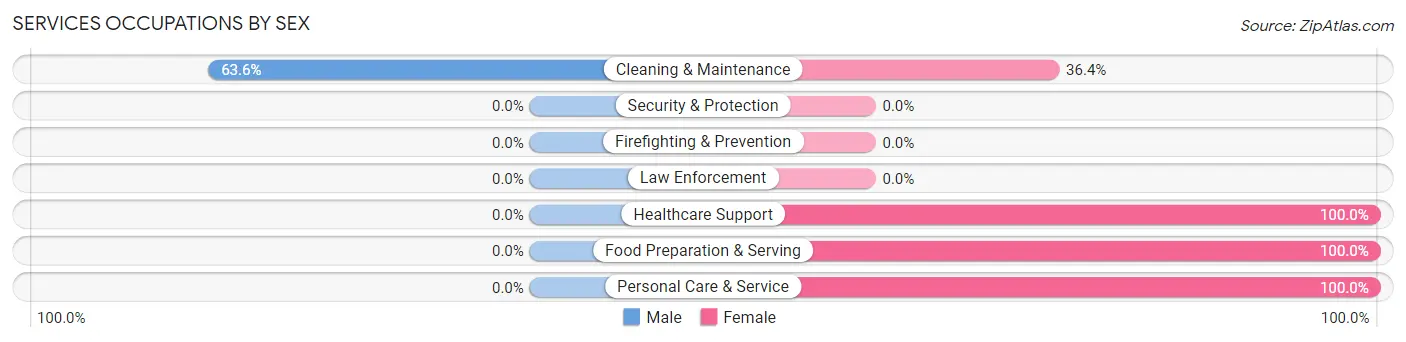
| Occupation | Male | Female |
| Healthcare Support | 0 (0.0%) | 19 (100.0%) |
| Security & Protection | 0 (0.0%) | 0 (0.0%) |
| Firefighting & Prevention | 0 (0.0%) | 0 (0.0%) |
| Law Enforcement | 0 (0.0%) | 0 (0.0%) |
| Food Preparation & Serving | 0 (0.0%) | 10 (100.0%) |
| Cleaning & Maintenance | 7 (63.6%) | 4 (36.4%) |
| Personal Care & Service | 0 (0.0%) | 8 (100.0%) |
| Total (Category) | 7 (14.6%) | 41 (85.4%) |
| Total (Overall) | 95 (48.7%) | 100 (51.3%) |
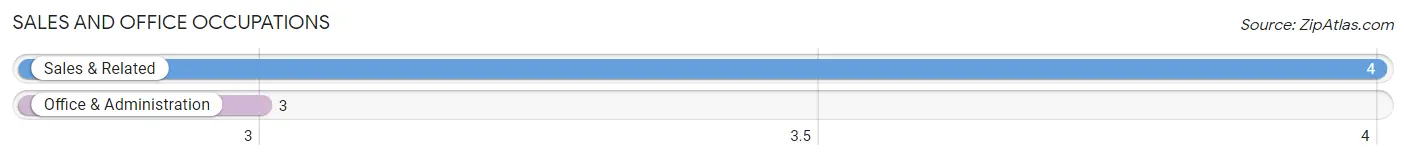
Sales and Office Occupations
The most common Sales and Office occupations in Lake Lorraine are Sales & Related (4 | 2.1%), and Office & Administration (3 | 1.5%).
Sales and Office Occupations by Sex
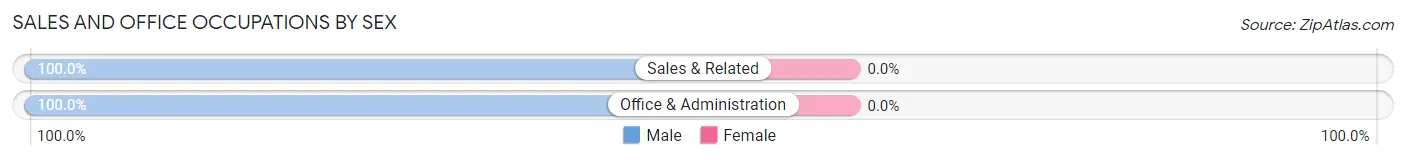
| Occupation | Male | Female |
| Sales & Related | 4 (100.0%) | 0 (0.0%) |
| Office & Administration | 3 (100.0%) | 0 (0.0%) |
| Total (Category) | 7 (100.0%) | 0 (0.0%) |
| Total (Overall) | 95 (48.7%) | 100 (51.3%) |
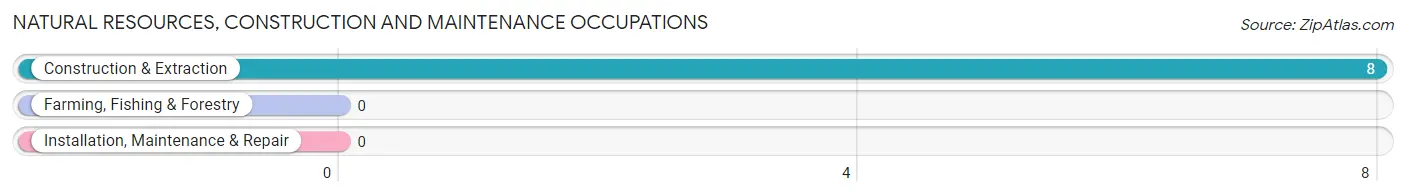
Natural Resources, Construction and Maintenance Occupations
The most common Natural Resources, Construction and Maintenance occupations in Lake Lorraine are , and Construction & Extraction (8 | 4.1%).
Natural Resources, Construction and Maintenance Occupations by Sex
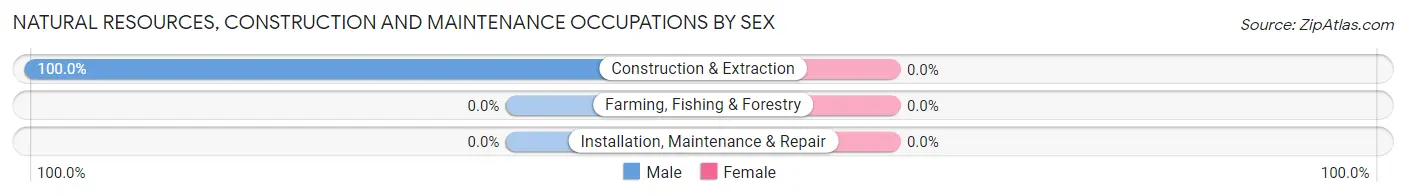
| Occupation | Male | Female |
| Farming, Fishing & Forestry | 0 (0.0%) | 0 (0.0%) |
| Construction & Extraction | 8 (100.0%) | 0 (0.0%) |
| Installation, Maintenance & Repair | 0 (0.0%) | 0 (0.0%) |
| Total (Category) | 8 (100.0%) | 0 (0.0%) |
| Total (Overall) | 95 (48.7%) | 100 (51.3%) |
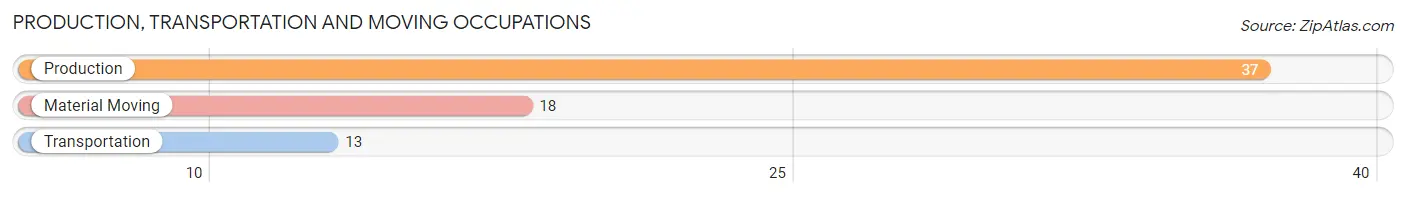
Production, Transportation and Moving Occupations
The most common Production, Transportation and Moving occupations in Lake Lorraine are Production (37 | 19.0%), Material Moving (18 | 9.2%), and Transportation (13 | 6.7%).
Production, Transportation and Moving Occupations by Sex
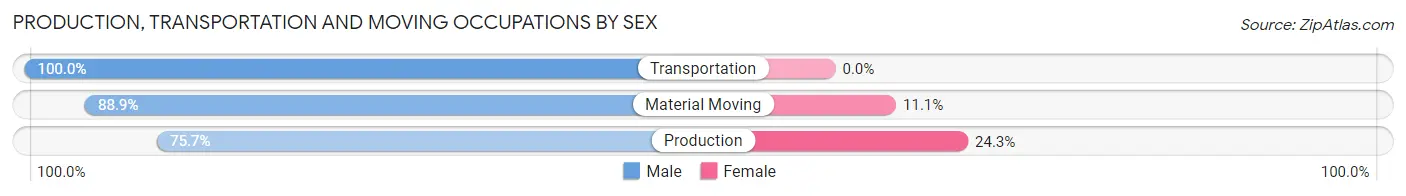
| Occupation | Male | Female |
| Production | 28 (75.7%) | 9 (24.3%) |
| Transportation | 13 (100.0%) | 0 (0.0%) |
| Material Moving | 16 (88.9%) | 2 (11.1%) |
| Total (Category) | 57 (83.8%) | 11 (16.2%) |
| Total (Overall) | 95 (48.7%) | 100 (51.3%) |
Employment Industries by Sex in Lake Lorraine
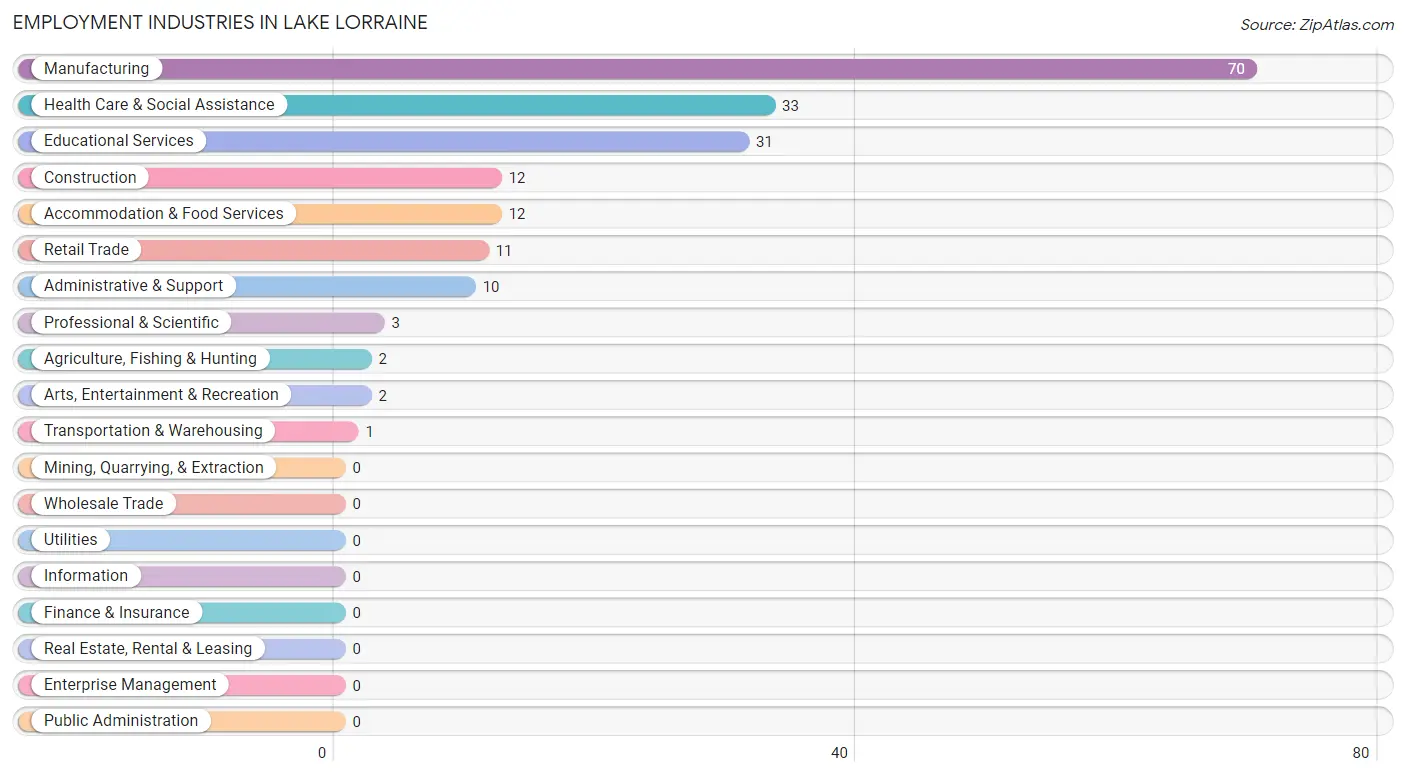
Employment Industries in Lake Lorraine
The major employment industries in Lake Lorraine include Manufacturing (70 | 35.9%), Health Care & Social Assistance (33 | 16.9%), Educational Services (31 | 15.9%), Construction (12 | 6.1%), and Accommodation & Food Services (12 | 6.1%).
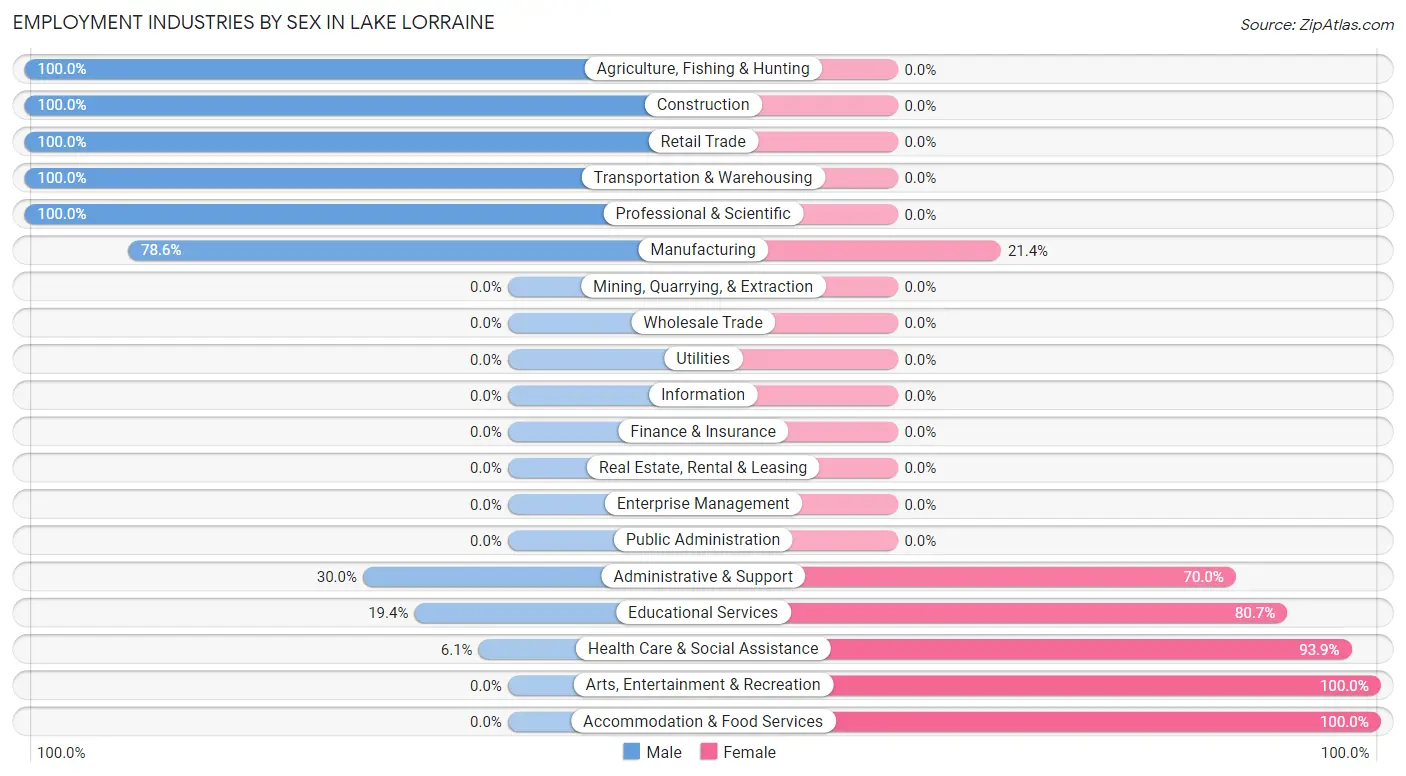
Employment Industries by Sex in Lake Lorraine
The Lake Lorraine industries that see more men than women are Agriculture, Fishing & Hunting (100.0%), Construction (100.0%), and Retail Trade (100.0%), whereas the industries that tend to have a higher number of women are Arts, Entertainment & Recreation (100.0%), Accommodation & Food Services (100.0%), and Health Care & Social Assistance (93.9%).
| Industry | Male | Female |
| Agriculture, Fishing & Hunting | 2 (100.0%) | 0 (0.0%) |
| Mining, Quarrying, & Extraction | 0 (0.0%) | 0 (0.0%) |
| Construction | 12 (100.0%) | 0 (0.0%) |
| Manufacturing | 55 (78.6%) | 15 (21.4%) |
| Wholesale Trade | 0 (0.0%) | 0 (0.0%) |
| Retail Trade | 11 (100.0%) | 0 (0.0%) |
| Transportation & Warehousing | 1 (100.0%) | 0 (0.0%) |
| Utilities | 0 (0.0%) | 0 (0.0%) |
| Information | 0 (0.0%) | 0 (0.0%) |
| Finance & Insurance | 0 (0.0%) | 0 (0.0%) |
| Real Estate, Rental & Leasing | 0 (0.0%) | 0 (0.0%) |
| Professional & Scientific | 3 (100.0%) | 0 (0.0%) |
| Enterprise Management | 0 (0.0%) | 0 (0.0%) |
| Administrative & Support | 3 (30.0%) | 7 (70.0%) |
| Educational Services | 6 (19.4%) | 25 (80.6%) |
| Health Care & Social Assistance | 2 (6.1%) | 31 (93.9%) |
| Arts, Entertainment & Recreation | 0 (0.0%) | 2 (100.0%) |
| Accommodation & Food Services | 0 (0.0%) | 12 (100.0%) |
| Public Administration | 0 (0.0%) | 0 (0.0%) |
| Total | 95 (48.7%) | 100 (51.3%) |
Education in Lake Lorraine
School Enrollment in Lake Lorraine
The most common levels of schooling among the 68 students in Lake Lorraine are college / undergraduate (18 | 26.5%), high school (17 | 25.0%), and middle school (15 | 22.1%).
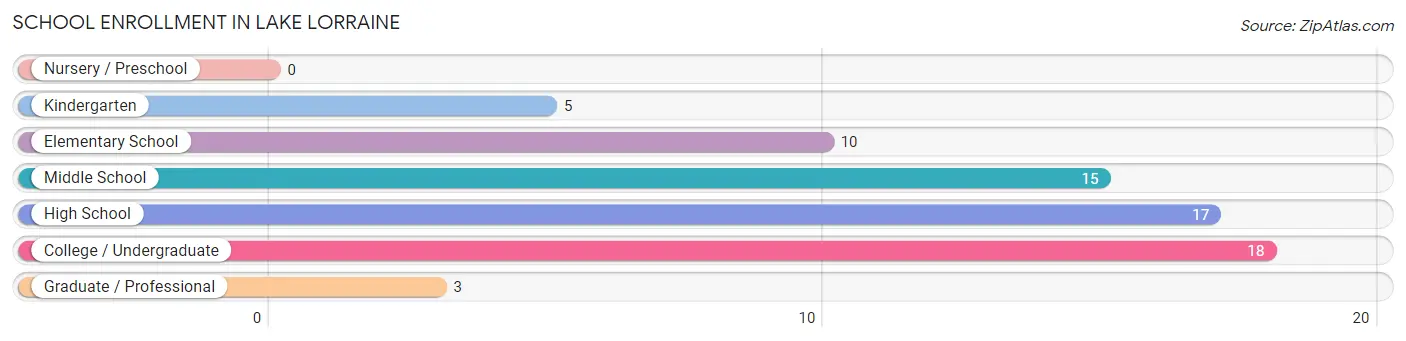
| School Level | # Students | % Students |
| Nursery / Preschool | 0 | 0.0% |
| Kindergarten | 5 | 7.3% |
| Elementary School | 10 | 14.7% |
| Middle School | 15 | 22.1% |
| High School | 17 | 25.0% |
| College / Undergraduate | 18 | 26.5% |
| Graduate / Professional | 3 | 4.4% |
| Total | 68 | 100.0% |
School Enrollment by Age by Funding Source in Lake Lorraine
Out of a total of 68 students who are enrolled in schools in Lake Lorraine, 4 (5.9%) attend a private institution, while the remaining 64 (94.1%) are enrolled in public schools. The age group of 18 to 19 year olds has the highest likelihood of being enrolled in private schools, with 3 (100.0% in the age bracket) enrolled. Conversely, the age group of 5 to 9 year old has the lowest likelihood of being enrolled in a private school, with 10 (100.0% in the age bracket) attending a public institution.
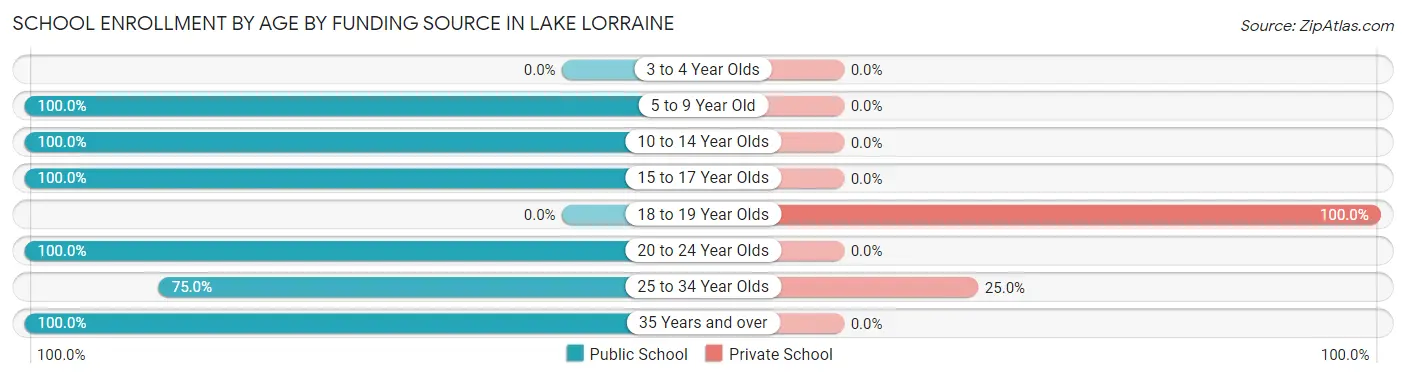
| Age Bracket | Public School | Private School |
| 3 to 4 Year Olds | 0 (0.0%) | 0 (0.0%) |
| 5 to 9 Year Old | 10 (100.0%) | 0 (0.0%) |
| 10 to 14 Year Olds | 20 (100.0%) | 0 (0.0%) |
| 15 to 17 Year Olds | 14 (100.0%) | 0 (0.0%) |
| 18 to 19 Year Olds | 0 (0.0%) | 3 (100.0%) |
| 20 to 24 Year Olds | 5 (100.0%) | 0 (0.0%) |
| 25 to 34 Year Olds | 3 (75.0%) | 1 (25.0%) |
| 35 Years and over | 12 (100.0%) | 0 (0.0%) |
| Total | 64 (94.1%) | 4 (5.9%) |
Educational Attainment by Field of Study in Lake Lorraine
Business (9 | 18.8%), literature & languages (9 | 18.8%), bio, nature & agricultural (7 | 14.6%), science & technology (7 | 14.6%), and education (5 | 10.4%) are the most common fields of study among 48 individuals in Lake Lorraine who have obtained a bachelor's degree or higher.
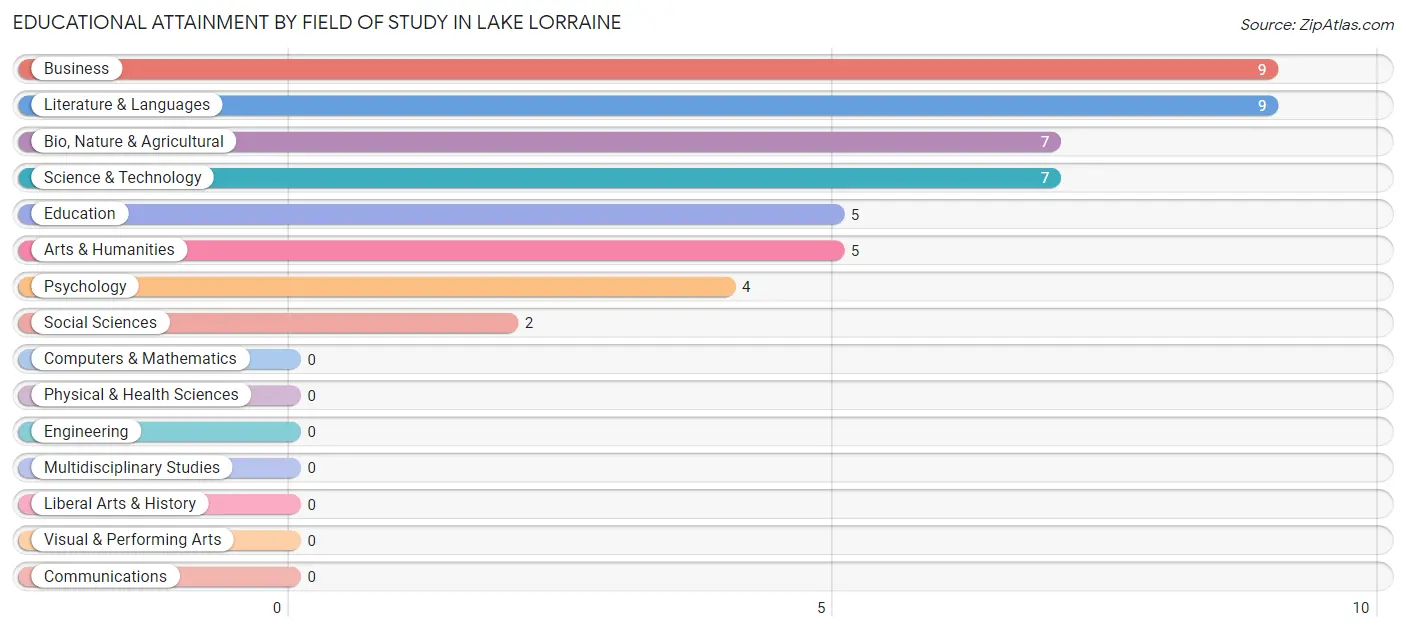
| Field of Study | # Graduates | % Graduates |
| Computers & Mathematics | 0 | 0.0% |
| Bio, Nature & Agricultural | 7 | 14.6% |
| Physical & Health Sciences | 0 | 0.0% |
| Psychology | 4 | 8.3% |
| Social Sciences | 2 | 4.2% |
| Engineering | 0 | 0.0% |
| Multidisciplinary Studies | 0 | 0.0% |
| Science & Technology | 7 | 14.6% |
| Business | 9 | 18.8% |
| Education | 5 | 10.4% |
| Literature & Languages | 9 | 18.8% |
| Liberal Arts & History | 0 | 0.0% |
| Visual & Performing Arts | 0 | 0.0% |
| Communications | 0 | 0.0% |
| Arts & Humanities | 5 | 10.4% |
| Total | 48 | 100.0% |
Transportation & Commute in Lake Lorraine
Vehicle Availability by Sex in Lake Lorraine
The most prevalent vehicle ownership categories in Lake Lorraine are males with 1 vehicle (43, accounting for 45.7%) and females with 1 vehicle (33, making up 43.0%).
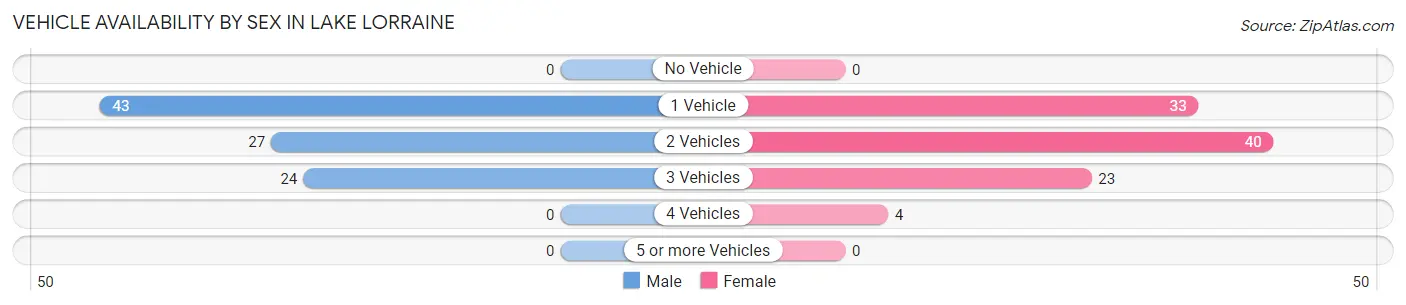
| Vehicles Available | Male | Female |
| No Vehicle | 0 (0.0%) | 0 (0.0%) |
| 1 Vehicle | 43 (45.7%) | 33 (33.0%) |
| 2 Vehicles | 27 (28.7%) | 40 (40.0%) |
| 3 Vehicles | 24 (25.5%) | 23 (23.0%) |
| 4 Vehicles | 0 (0.0%) | 4 (4.0%) |
| 5 or more Vehicles | 0 (0.0%) | 0 (0.0%) |
| Total | 94 (100.0%) | 100 (100.0%) |
Commute Time in Lake Lorraine
The most frequently occuring commute durations in Lake Lorraine are 30 to 34 minutes (38 commuters, 20.6%), 15 to 19 minutes (37 commuters, 20.1%), and 10 to 14 minutes (22 commuters, 12.0%).
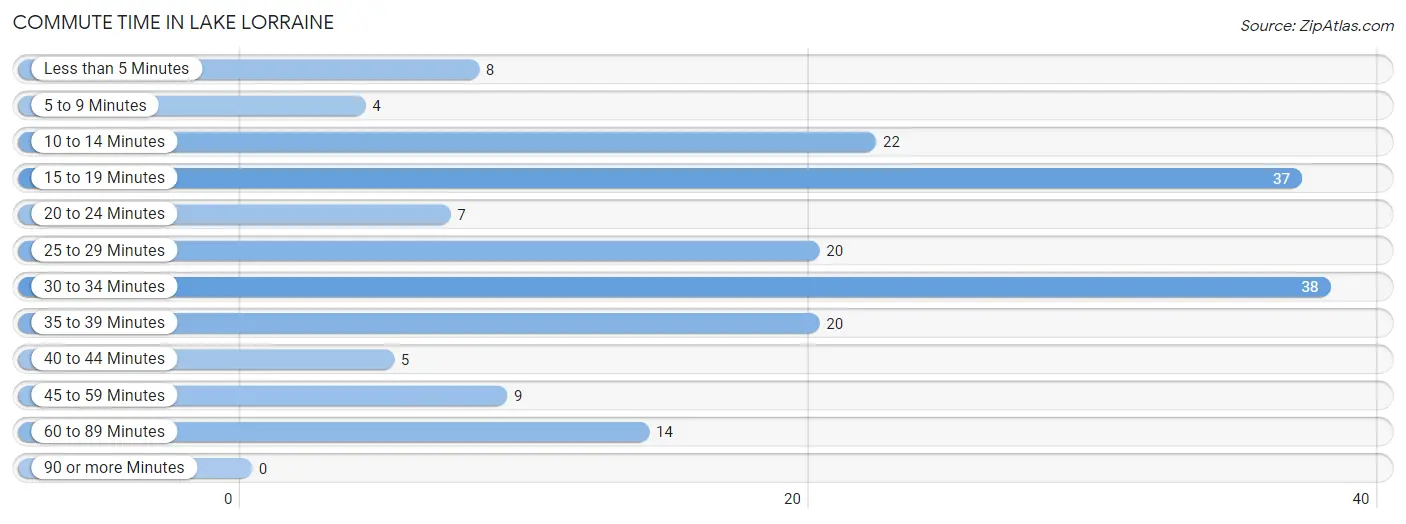
| Commute Time | # Commuters | % Commuters |
| Less than 5 Minutes | 8 | 4.3% |
| 5 to 9 Minutes | 4 | 2.2% |
| 10 to 14 Minutes | 22 | 12.0% |
| 15 to 19 Minutes | 37 | 20.1% |
| 20 to 24 Minutes | 7 | 3.8% |
| 25 to 29 Minutes | 20 | 10.9% |
| 30 to 34 Minutes | 38 | 20.6% |
| 35 to 39 Minutes | 20 | 10.9% |
| 40 to 44 Minutes | 5 | 2.7% |
| 45 to 59 Minutes | 9 | 4.9% |
| 60 to 89 Minutes | 14 | 7.6% |
| 90 or more Minutes | 0 | 0.0% |
Commute Time by Sex in Lake Lorraine
The most common commute times in Lake Lorraine are 15 to 19 minutes (22 commuters, 25.0%) for males and 30 to 34 minutes (23 commuters, 24.0%) for females.
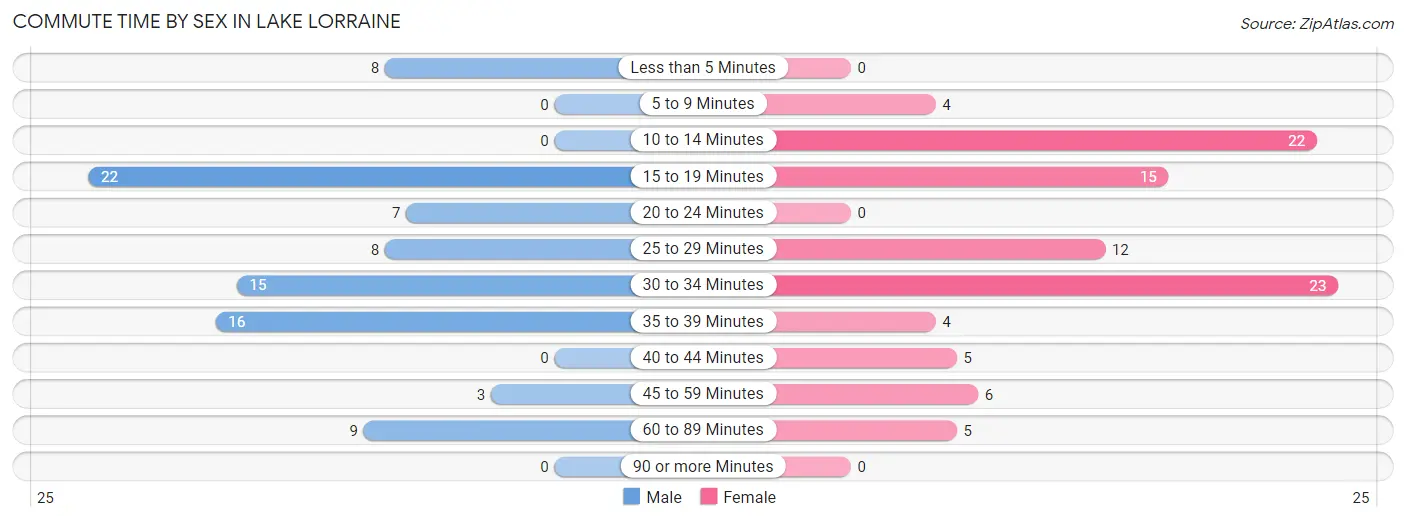
| Commute Time | Male | Female |
| Less than 5 Minutes | 8 (9.1%) | 0 (0.0%) |
| 5 to 9 Minutes | 0 (0.0%) | 4 (4.2%) |
| 10 to 14 Minutes | 0 (0.0%) | 22 (22.9%) |
| 15 to 19 Minutes | 22 (25.0%) | 15 (15.6%) |
| 20 to 24 Minutes | 7 (8.0%) | 0 (0.0%) |
| 25 to 29 Minutes | 8 (9.1%) | 12 (12.5%) |
| 30 to 34 Minutes | 15 (17.1%) | 23 (24.0%) |
| 35 to 39 Minutes | 16 (18.2%) | 4 (4.2%) |
| 40 to 44 Minutes | 0 (0.0%) | 5 (5.2%) |
| 45 to 59 Minutes | 3 (3.4%) | 6 (6.2%) |
| 60 to 89 Minutes | 9 (10.2%) | 5 (5.2%) |
| 90 or more Minutes | 0 (0.0%) | 0 (0.0%) |
Time of Departure to Work by Sex in Lake Lorraine
The most frequent times of departure to work in Lake Lorraine are 6:30 AM to 6:59 AM (20, 22.7%) for males and 6:30 AM to 6:59 AM (27, 28.1%) for females.
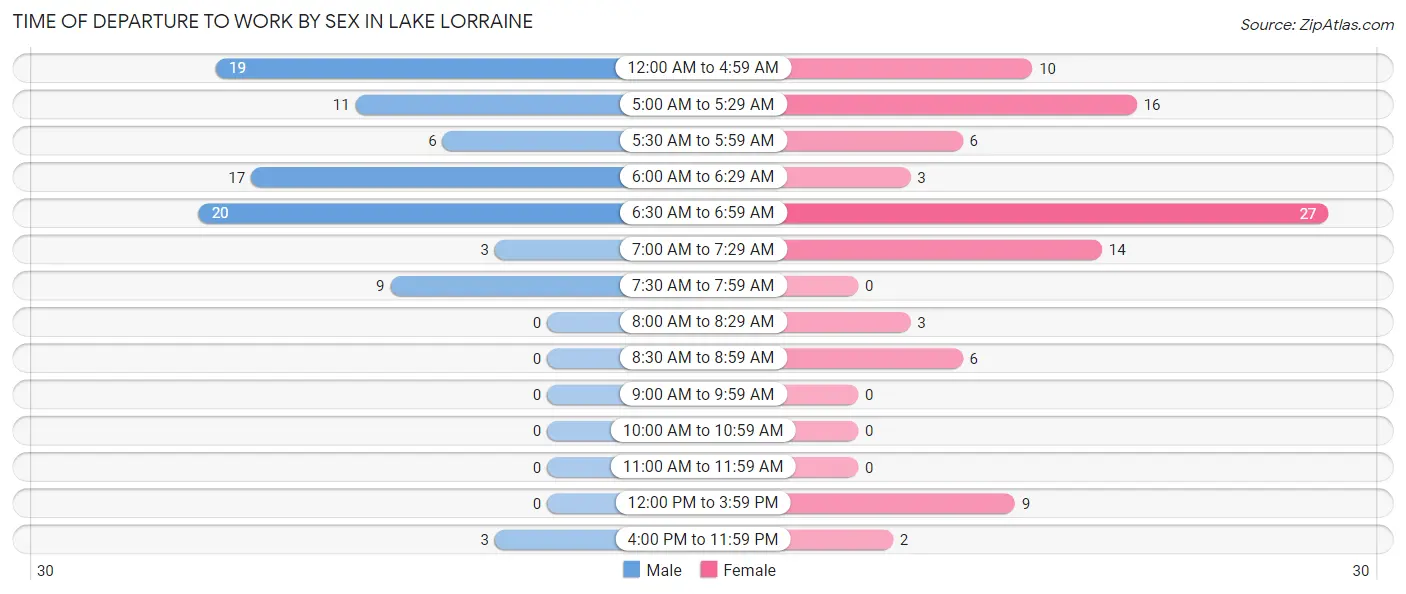
| Time of Departure | Male | Female |
| 12:00 AM to 4:59 AM | 19 (21.6%) | 10 (10.4%) |
| 5:00 AM to 5:29 AM | 11 (12.5%) | 16 (16.7%) |
| 5:30 AM to 5:59 AM | 6 (6.8%) | 6 (6.2%) |
| 6:00 AM to 6:29 AM | 17 (19.3%) | 3 (3.1%) |
| 6:30 AM to 6:59 AM | 20 (22.7%) | 27 (28.1%) |
| 7:00 AM to 7:29 AM | 3 (3.4%) | 14 (14.6%) |
| 7:30 AM to 7:59 AM | 9 (10.2%) | 0 (0.0%) |
| 8:00 AM to 8:29 AM | 0 (0.0%) | 3 (3.1%) |
| 8:30 AM to 8:59 AM | 0 (0.0%) | 6 (6.2%) |
| 9:00 AM to 9:59 AM | 0 (0.0%) | 0 (0.0%) |
| 10:00 AM to 10:59 AM | 0 (0.0%) | 0 (0.0%) |
| 11:00 AM to 11:59 AM | 0 (0.0%) | 0 (0.0%) |
| 12:00 PM to 3:59 PM | 0 (0.0%) | 9 (9.4%) |
| 4:00 PM to 11:59 PM | 3 (3.4%) | 2 (2.1%) |
| Total | 88 (100.0%) | 96 (100.0%) |
Housing Occupancy in Lake Lorraine
Occupancy by Ownership in Lake Lorraine
Of the total 128 dwellings in Lake Lorraine, owner-occupied units account for 96 (75.0%), while renter-occupied units make up 32 (25.0%).
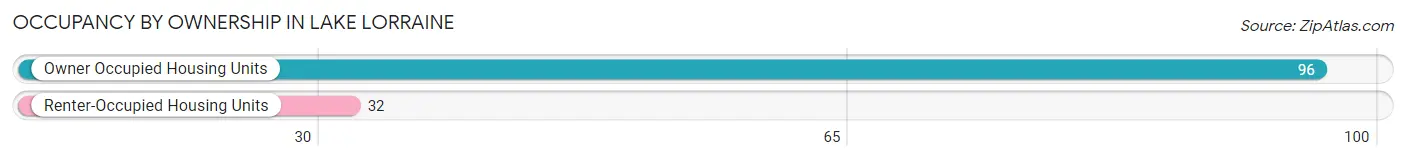
| Occupancy | # Housing Units | % Housing Units |
| Owner Occupied Housing Units | 96 | 75.0% |
| Renter-Occupied Housing Units | 32 | 25.0% |
| Total Occupied Housing Units | 128 | 100.0% |
Occupancy by Household Size in Lake Lorraine
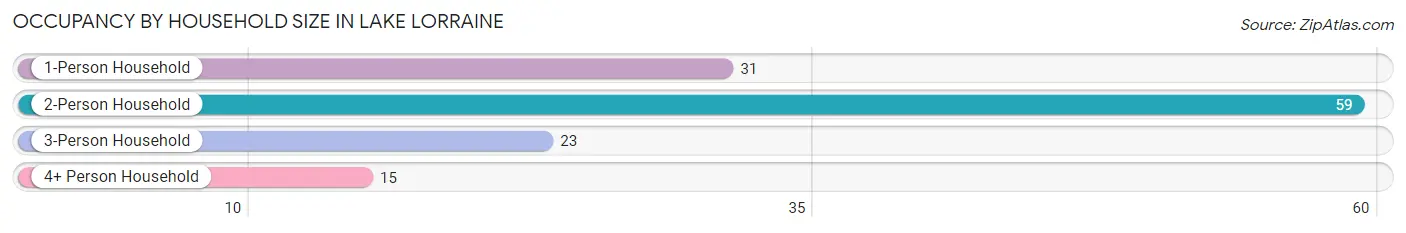
| Household Size | # Housing Units | % Housing Units |
| 1-Person Household | 31 | 24.2% |
| 2-Person Household | 59 | 46.1% |
| 3-Person Household | 23 | 18.0% |
| 4+ Person Household | 15 | 11.7% |
| Total Housing Units | 128 | 100.0% |
Occupancy by Ownership by Household Size in Lake Lorraine
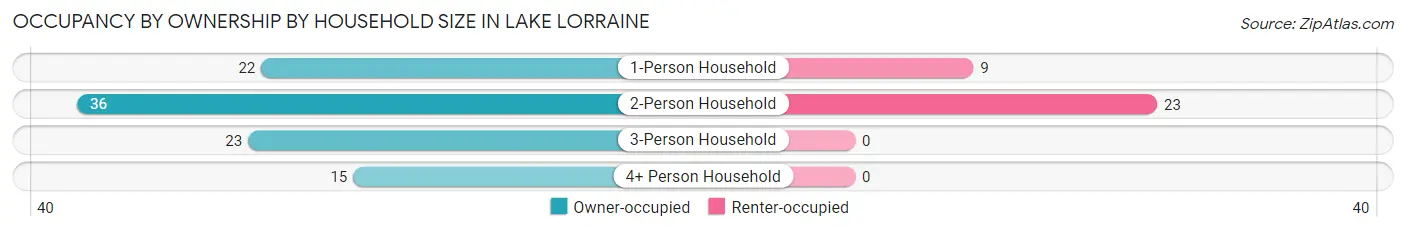
| Household Size | Owner-occupied | Renter-occupied |
| 1-Person Household | 22 (71.0%) | 9 (29.0%) |
| 2-Person Household | 36 (61.0%) | 23 (39.0%) |
| 3-Person Household | 23 (100.0%) | 0 (0.0%) |
| 4+ Person Household | 15 (100.0%) | 0 (0.0%) |
| Total Housing Units | 96 (75.0%) | 32 (25.0%) |
Occupancy by Educational Attainment in Lake Lorraine
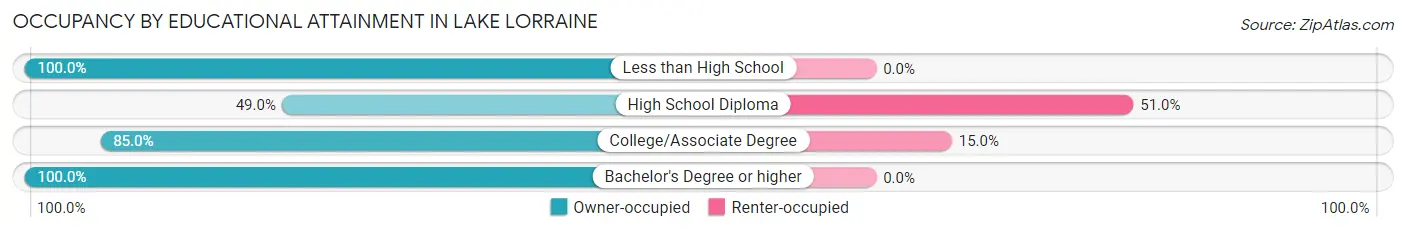
| Household Size | Owner-occupied | Renter-occupied |
| Less than High School | 8 (100.0%) | 0 (0.0%) |
| High School Diploma | 25 (49.0%) | 26 (51.0%) |
| College/Associate Degree | 34 (85.0%) | 6 (15.0%) |
| Bachelor's Degree or higher | 29 (100.0%) | 0 (0.0%) |
Occupancy by Age of Householder in Lake Lorraine
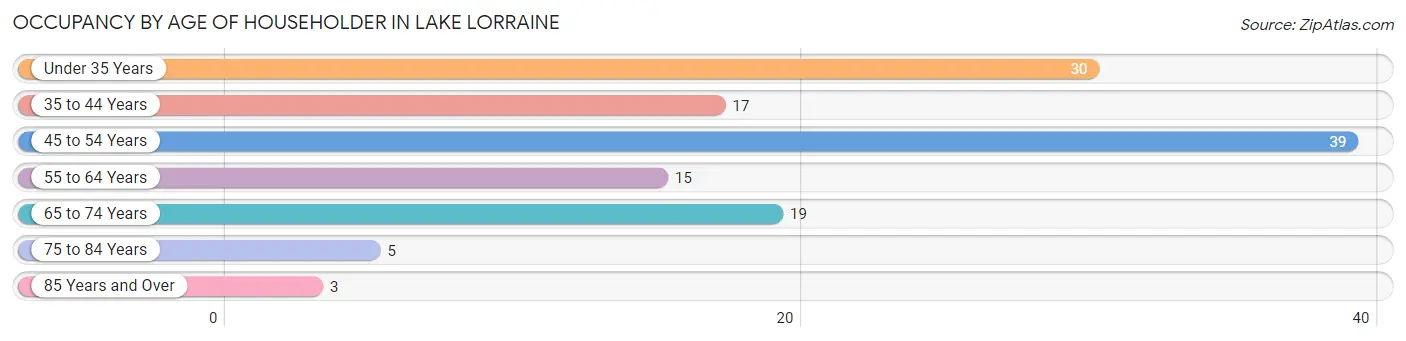
| Age Bracket | # Households | % Households |
| Under 35 Years | 30 | 23.4% |
| 35 to 44 Years | 17 | 13.3% |
| 45 to 54 Years | 39 | 30.5% |
| 55 to 64 Years | 15 | 11.7% |
| 65 to 74 Years | 19 | 14.8% |
| 75 to 84 Years | 5 | 3.9% |
| 85 Years and Over | 3 | 2.3% |
| Total | 128 | 100.0% |
Housing Finances in Lake Lorraine
Median Income by Occupancy in Lake Lorraine
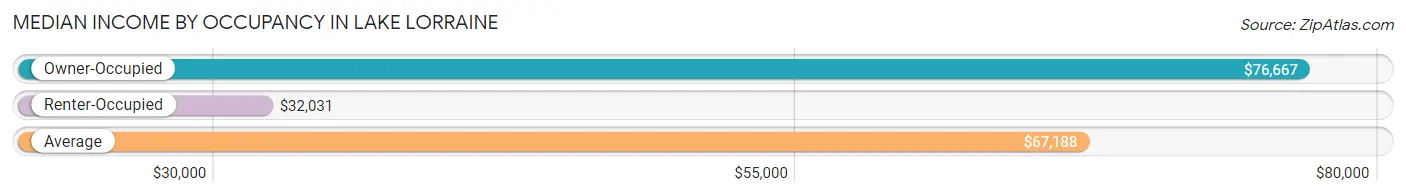
| Occupancy Type | # Households | Median Income |
| Owner-Occupied | 96 (75.0%) | $76,667 |
| Renter-Occupied | 32 (25.0%) | $32,031 |
| Average | 128 (100.0%) | $67,188 |
Occupancy by Householder Income Bracket in Lake Lorraine
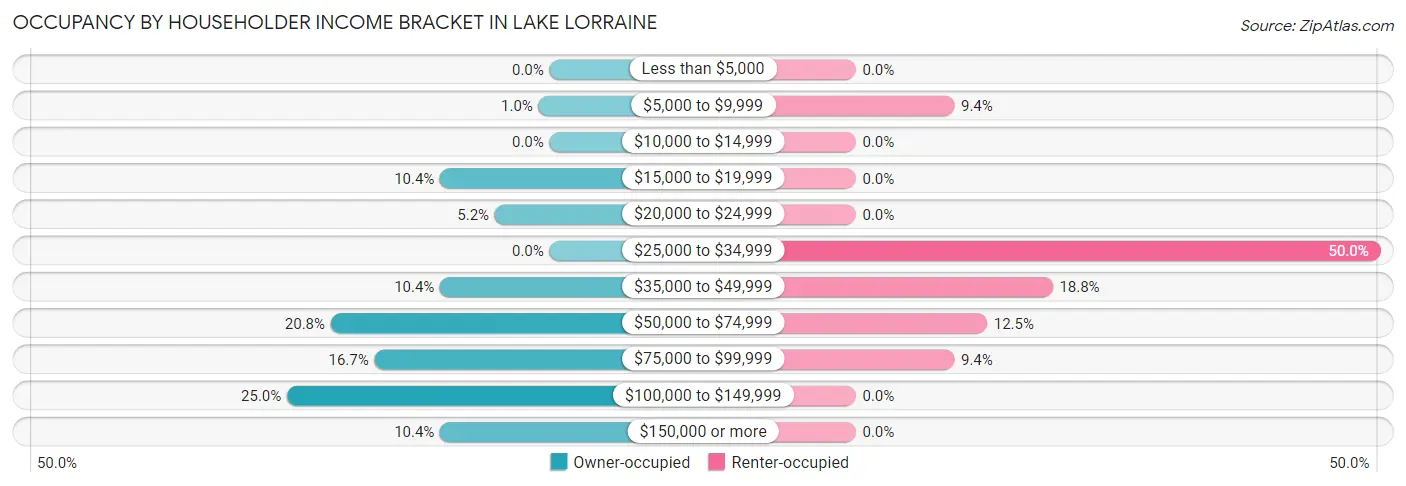
| Income Bracket | Owner-occupied | Renter-occupied |
| Less than $5,000 | 0 (0.0%) | 0 (0.0%) |
| $5,000 to $9,999 | 1 (1.0%) | 3 (9.4%) |
| $10,000 to $14,999 | 0 (0.0%) | 0 (0.0%) |
| $15,000 to $19,999 | 10 (10.4%) | 0 (0.0%) |
| $20,000 to $24,999 | 5 (5.2%) | 0 (0.0%) |
| $25,000 to $34,999 | 0 (0.0%) | 16 (50.0%) |
| $35,000 to $49,999 | 10 (10.4%) | 6 (18.8%) |
| $50,000 to $74,999 | 20 (20.8%) | 4 (12.5%) |
| $75,000 to $99,999 | 16 (16.7%) | 3 (9.4%) |
| $100,000 to $149,999 | 24 (25.0%) | 0 (0.0%) |
| $150,000 or more | 10 (10.4%) | 0 (0.0%) |
| Total | 96 (100.0%) | 32 (100.0%) |
Monthly Housing Cost Tiers in Lake Lorraine
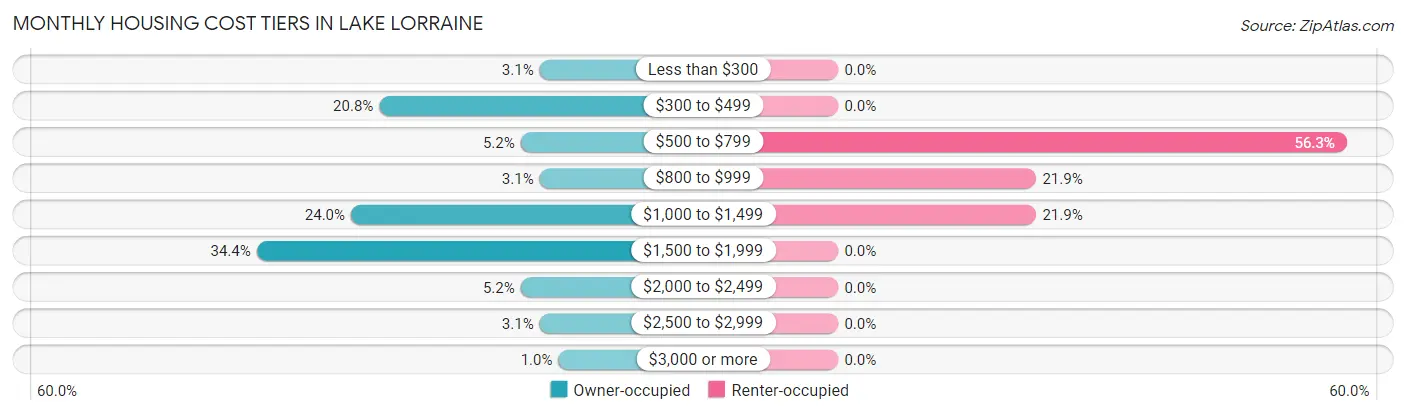
| Monthly Cost | Owner-occupied | Renter-occupied |
| Less than $300 | 3 (3.1%) | 0 (0.0%) |
| $300 to $499 | 20 (20.8%) | 0 (0.0%) |
| $500 to $799 | 5 (5.2%) | 18 (56.2%) |
| $800 to $999 | 3 (3.1%) | 7 (21.9%) |
| $1,000 to $1,499 | 23 (24.0%) | 7 (21.9%) |
| $1,500 to $1,999 | 33 (34.4%) | 0 (0.0%) |
| $2,000 to $2,499 | 5 (5.2%) | 0 (0.0%) |
| $2,500 to $2,999 | 3 (3.1%) | 0 (0.0%) |
| $3,000 or more | 1 (1.0%) | 0 (0.0%) |
| Total | 96 (100.0%) | 32 (100.0%) |
Physical Housing Characteristics in Lake Lorraine
Housing Structures in Lake Lorraine
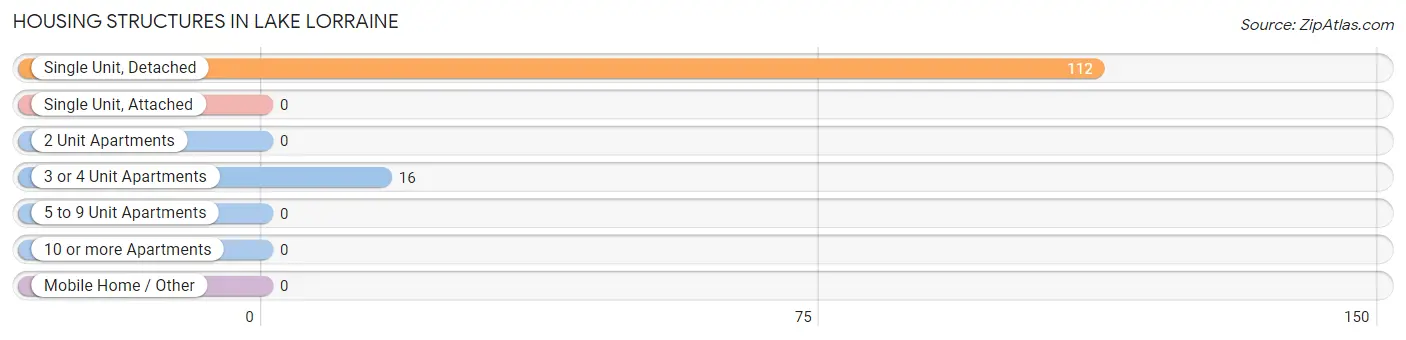
| Structure Type | # Housing Units | % Housing Units |
| Single Unit, Detached | 112 | 87.5% |
| Single Unit, Attached | 0 | 0.0% |
| 2 Unit Apartments | 0 | 0.0% |
| 3 or 4 Unit Apartments | 16 | 12.5% |
| 5 to 9 Unit Apartments | 0 | 0.0% |
| 10 or more Apartments | 0 | 0.0% |
| Mobile Home / Other | 0 | 0.0% |
| Total | 128 | 100.0% |
Housing Structures by Occupancy in Lake Lorraine
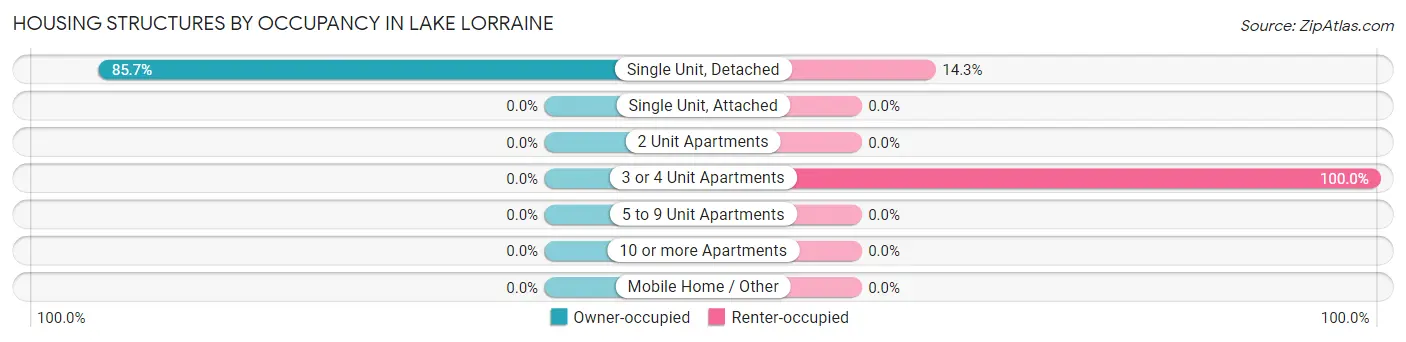
| Structure Type | Owner-occupied | Renter-occupied |
| Single Unit, Detached | 96 (85.7%) | 16 (14.3%) |
| Single Unit, Attached | 0 (0.0%) | 0 (0.0%) |
| 2 Unit Apartments | 0 (0.0%) | 0 (0.0%) |
| 3 or 4 Unit Apartments | 0 (0.0%) | 16 (100.0%) |
| 5 to 9 Unit Apartments | 0 (0.0%) | 0 (0.0%) |
| 10 or more Apartments | 0 (0.0%) | 0 (0.0%) |
| Mobile Home / Other | 0 (0.0%) | 0 (0.0%) |
| Total | 96 (75.0%) | 32 (25.0%) |
Housing Structures by Number of Rooms in Lake Lorraine
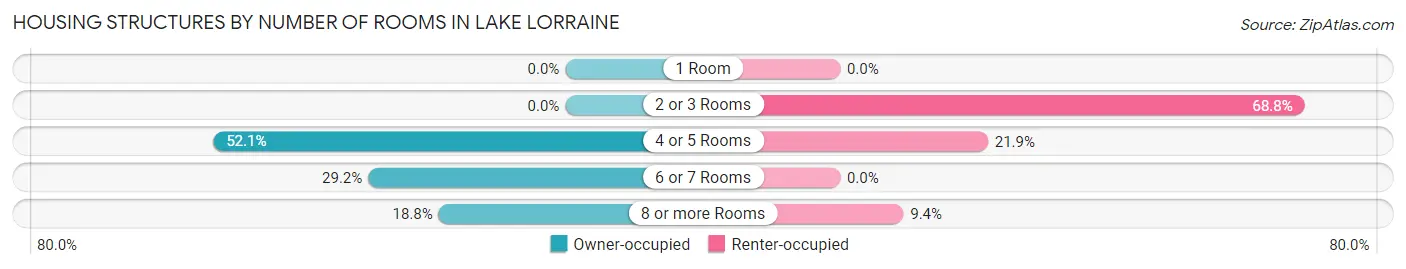
| Number of Rooms | Owner-occupied | Renter-occupied |
| 1 Room | 0 (0.0%) | 0 (0.0%) |
| 2 or 3 Rooms | 0 (0.0%) | 22 (68.8%) |
| 4 or 5 Rooms | 50 (52.1%) | 7 (21.9%) |
| 6 or 7 Rooms | 28 (29.2%) | 0 (0.0%) |
| 8 or more Rooms | 18 (18.8%) | 3 (9.4%) |
| Total | 96 (100.0%) | 32 (100.0%) |
Housing Structure by Heating Type in Lake Lorraine
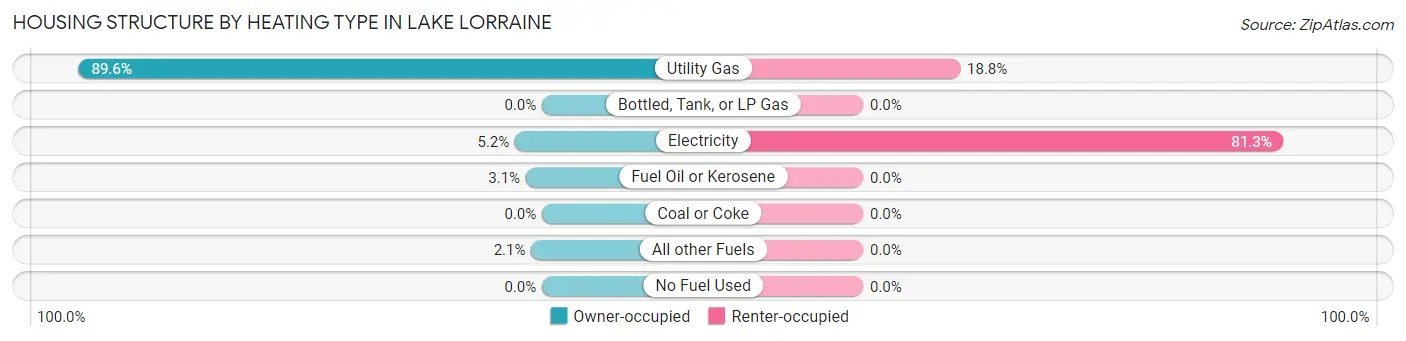
| Heating Type | Owner-occupied | Renter-occupied |
| Utility Gas | 86 (89.6%) | 6 (18.8%) |
| Bottled, Tank, or LP Gas | 0 (0.0%) | 0 (0.0%) |
| Electricity | 5 (5.2%) | 26 (81.2%) |
| Fuel Oil or Kerosene | 3 (3.1%) | 0 (0.0%) |
| Coal or Coke | 0 (0.0%) | 0 (0.0%) |
| All other Fuels | 2 (2.1%) | 0 (0.0%) |
| No Fuel Used | 0 (0.0%) | 0 (0.0%) |
| Total | 96 (100.0%) | 32 (100.0%) |
Household Vehicle Usage in Lake Lorraine
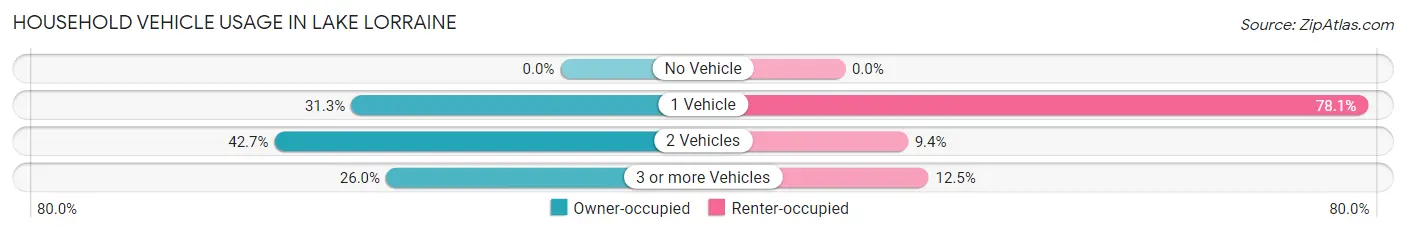
| Vehicles per Household | Owner-occupied | Renter-occupied |
| No Vehicle | 0 (0.0%) | 0 (0.0%) |
| 1 Vehicle | 30 (31.2%) | 25 (78.1%) |
| 2 Vehicles | 41 (42.7%) | 3 (9.4%) |
| 3 or more Vehicles | 25 (26.0%) | 4 (12.5%) |
| Total | 96 (100.0%) | 32 (100.0%) |
Real Estate & Mortgages in Lake Lorraine
Real Estate and Mortgage Overview in Lake Lorraine
| Characteristic | Without Mortgage | With Mortgage |
| Housing Units | 28 | 68 |
| Median Property Value | $176,700 | $196,900 |
| Median Household Income | - | - |
| Monthly Housing Costs | $360 | $1 |
| Real Estate Taxes | $2,375 | $0 |
Property Value by Mortgage Status in Lake Lorraine
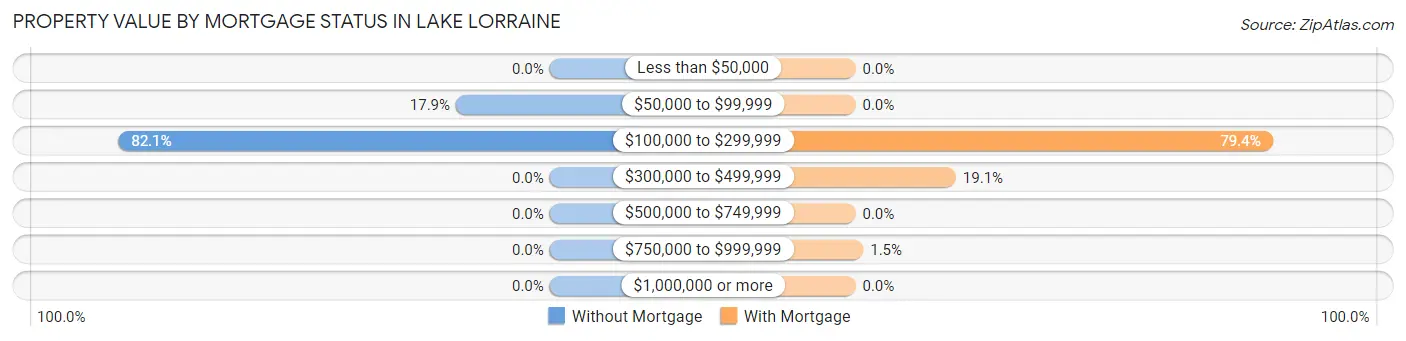
| Property Value | Without Mortgage | With Mortgage |
| Less than $50,000 | 0 (0.0%) | 0 (0.0%) |
| $50,000 to $99,999 | 5 (17.9%) | 0 (0.0%) |
| $100,000 to $299,999 | 23 (82.1%) | 54 (79.4%) |
| $300,000 to $499,999 | 0 (0.0%) | 13 (19.1%) |
| $500,000 to $749,999 | 0 (0.0%) | 0 (0.0%) |
| $750,000 to $999,999 | 0 (0.0%) | 1 (1.5%) |
| $1,000,000 or more | 0 (0.0%) | 0 (0.0%) |
| Total | 28 (100.0%) | 68 (100.0%) |
Household Income by Mortgage Status in Lake Lorraine
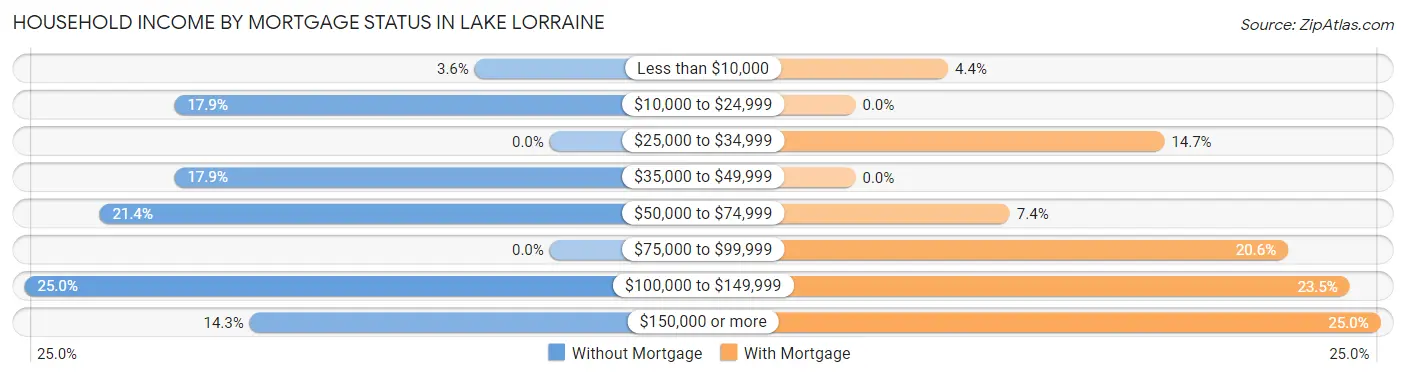
| Household Income | Without Mortgage | With Mortgage |
| Less than $10,000 | 1 (3.6%) | 3 (4.4%) |
| $10,000 to $24,999 | 5 (17.9%) | 0 (0.0%) |
| $25,000 to $34,999 | 0 (0.0%) | 10 (14.7%) |
| $35,000 to $49,999 | 5 (17.9%) | 0 (0.0%) |
| $50,000 to $74,999 | 6 (21.4%) | 5 (7.3%) |
| $75,000 to $99,999 | 0 (0.0%) | 14 (20.6%) |
| $100,000 to $149,999 | 7 (25.0%) | 16 (23.5%) |
| $150,000 or more | 4 (14.3%) | 17 (25.0%) |
| Total | 28 (100.0%) | 68 (100.0%) |
Property Value to Household Income Ratio in Lake Lorraine
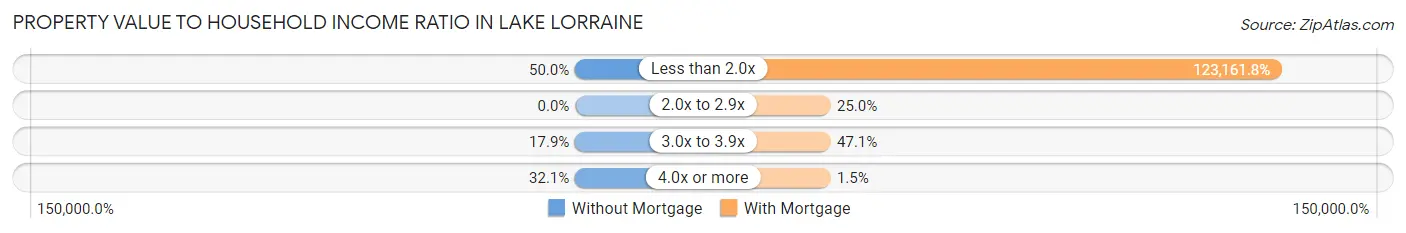
| Value-to-Income Ratio | Without Mortgage | With Mortgage |
| Less than 2.0x | 14 (50.0%) | 83,750 (123,161.8%) |
| 2.0x to 2.9x | 0 (0.0%) | 17 (25.0%) |
| 3.0x to 3.9x | 5 (17.9%) | 32 (47.1%) |
| 4.0x or more | 9 (32.1%) | 1 (1.5%) |
| Total | 28 (100.0%) | 68 (100.0%) |
Real Estate Taxes by Mortgage Status in Lake Lorraine
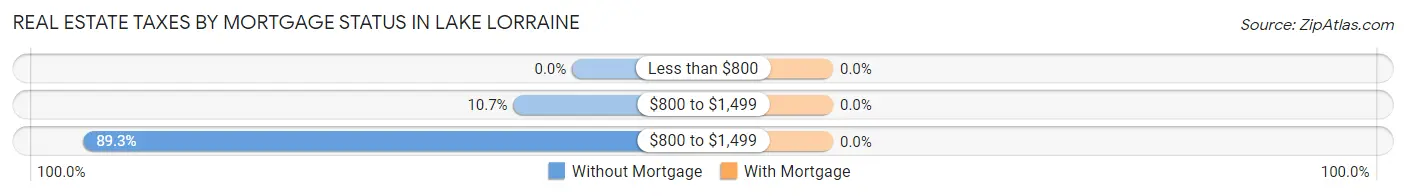
| Property Taxes | Without Mortgage | With Mortgage |
| Less than $800 | 0 (0.0%) | 0 (0.0%) |
| $800 to $1,499 | 3 (10.7%) | 0 (0.0%) |
| $800 to $1,499 | 25 (89.3%) | 0 (0.0%) |
| Total | 28 (100.0%) | 68 (100.0%) |
Health & Disability in Lake Lorraine
Health Insurance Coverage by Age in Lake Lorraine
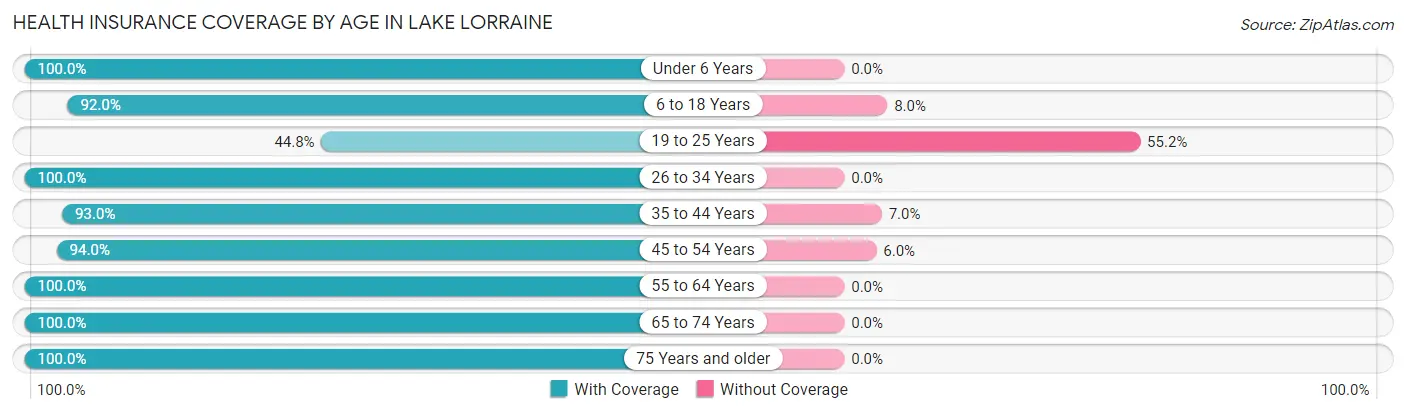
| Age Bracket | With Coverage | Without Coverage |
| Under 6 Years | 3 (100.0%) | 0 (0.0%) |
| 6 to 18 Years | 46 (92.0%) | 4 (8.0%) |
| 19 to 25 Years | 26 (44.8%) | 32 (55.2%) |
| 26 to 34 Years | 8 (100.0%) | 0 (0.0%) |
| 35 to 44 Years | 40 (93.0%) | 3 (7.0%) |
| 45 to 54 Years | 63 (94.0%) | 4 (6.0%) |
| 55 to 64 Years | 22 (100.0%) | 0 (0.0%) |
| 65 to 74 Years | 28 (100.0%) | 0 (0.0%) |
| 75 Years and older | 11 (100.0%) | 0 (0.0%) |
| Total | 247 (85.2%) | 43 (14.8%) |
Health Insurance Coverage by Citizenship Status in Lake Lorraine
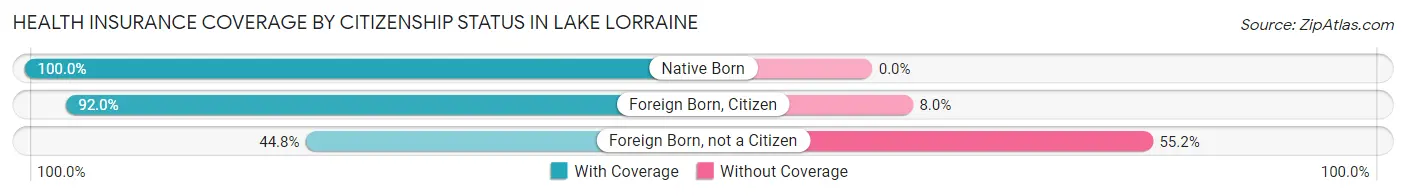
| Citizenship Status | With Coverage | Without Coverage |
| Native Born | 3 (100.0%) | 0 (0.0%) |
| Foreign Born, Citizen | 46 (92.0%) | 4 (8.0%) |
| Foreign Born, not a Citizen | 26 (44.8%) | 32 (55.2%) |
Health Insurance Coverage by Household Income in Lake Lorraine
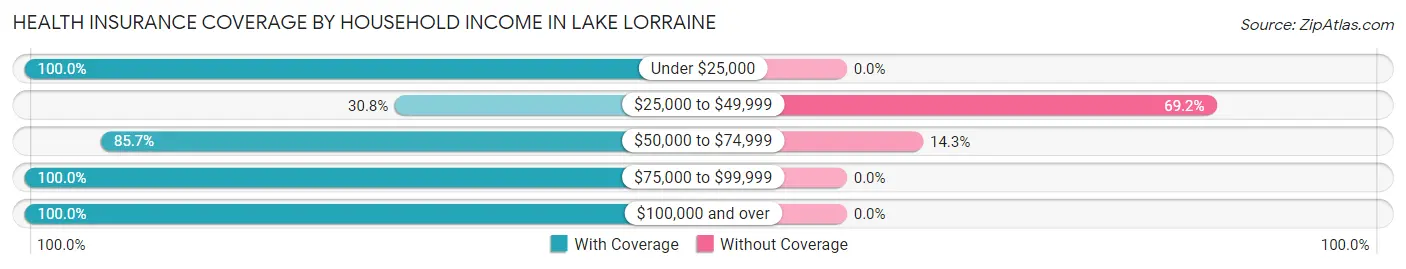
| Household Income | With Coverage | Without Coverage |
| Under $25,000 | 32 (100.0%) | 0 (0.0%) |
| $25,000 to $49,999 | 16 (30.8%) | 36 (69.2%) |
| $50,000 to $74,999 | 42 (85.7%) | 7 (14.3%) |
| $75,000 to $99,999 | 50 (100.0%) | 0 (0.0%) |
| $100,000 and over | 107 (100.0%) | 0 (0.0%) |
Public vs Private Health Insurance Coverage by Age in Lake Lorraine
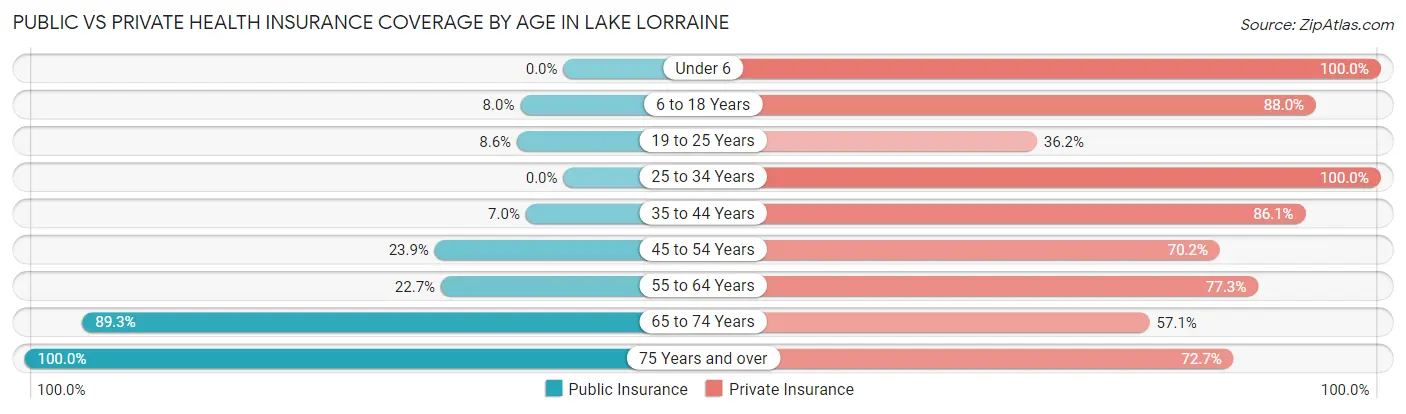
| Age Bracket | Public Insurance | Private Insurance |
| Under 6 | 0 (0.0%) | 3 (100.0%) |
| 6 to 18 Years | 4 (8.0%) | 44 (88.0%) |
| 19 to 25 Years | 5 (8.6%) | 21 (36.2%) |
| 25 to 34 Years | 0 (0.0%) | 8 (100.0%) |
| 35 to 44 Years | 3 (7.0%) | 37 (86.1%) |
| 45 to 54 Years | 16 (23.9%) | 47 (70.2%) |
| 55 to 64 Years | 5 (22.7%) | 17 (77.3%) |
| 65 to 74 Years | 25 (89.3%) | 16 (57.1%) |
| 75 Years and over | 11 (100.0%) | 8 (72.7%) |
| Total | 69 (23.8%) | 201 (69.3%) |
Disability Status by Sex by Age in Lake Lorraine
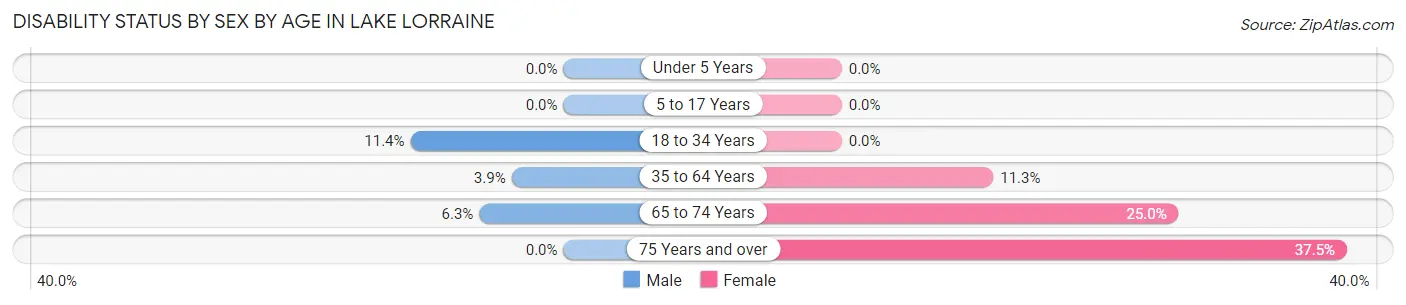
| Age Bracket | Male | Female |
| Under 5 Years | 0 (0.0%) | 0 (0.0%) |
| 5 to 17 Years | 0 (0.0%) | 0 (0.0%) |
| 18 to 34 Years | 5 (11.4%) | 0 (0.0%) |
| 35 to 64 Years | 2 (3.8%) | 9 (11.3%) |
| 65 to 74 Years | 1 (6.2%) | 3 (25.0%) |
| 75 Years and over | 0 (0.0%) | 3 (37.5%) |
Disability Class by Sex by Age in Lake Lorraine
Disability Class: Hearing Difficulty
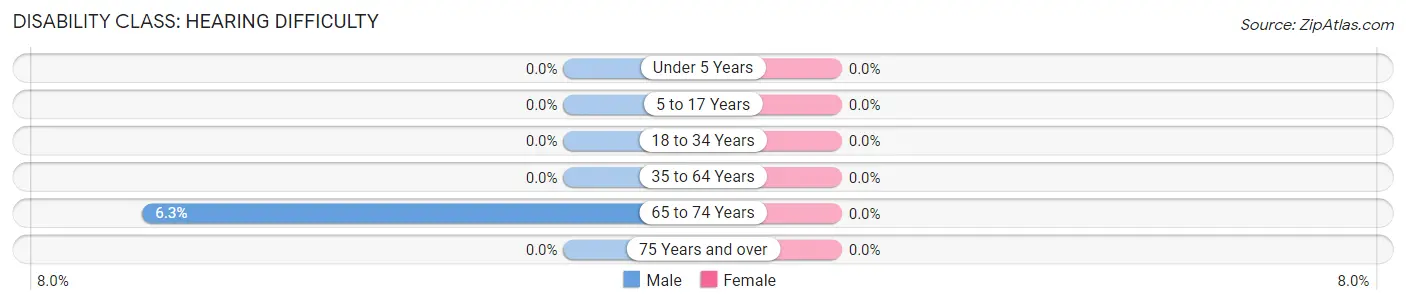
| Age Bracket | Male | Female |
| Under 5 Years | 0 (0.0%) | 0 (0.0%) |
| 5 to 17 Years | 0 (0.0%) | 0 (0.0%) |
| 18 to 34 Years | 0 (0.0%) | 0 (0.0%) |
| 35 to 64 Years | 0 (0.0%) | 0 (0.0%) |
| 65 to 74 Years | 1 (6.2%) | 0 (0.0%) |
| 75 Years and over | 0 (0.0%) | 0 (0.0%) |
Disability Class: Vision Difficulty
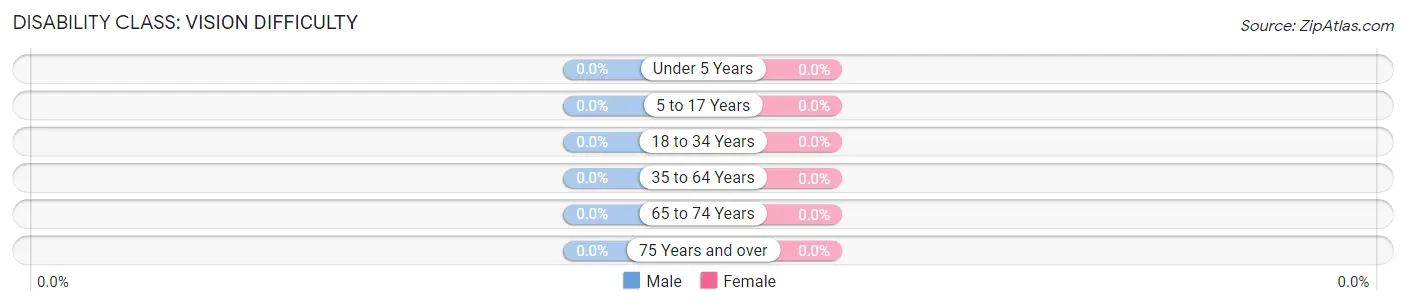
| Age Bracket | Male | Female |
| Under 5 Years | 0 (0.0%) | 0 (0.0%) |
| 5 to 17 Years | 0 (0.0%) | 0 (0.0%) |
| 18 to 34 Years | 0 (0.0%) | 0 (0.0%) |
| 35 to 64 Years | 0 (0.0%) | 0 (0.0%) |
| 65 to 74 Years | 0 (0.0%) | 0 (0.0%) |
| 75 Years and over | 0 (0.0%) | 0 (0.0%) |
Disability Class: Cognitive Difficulty
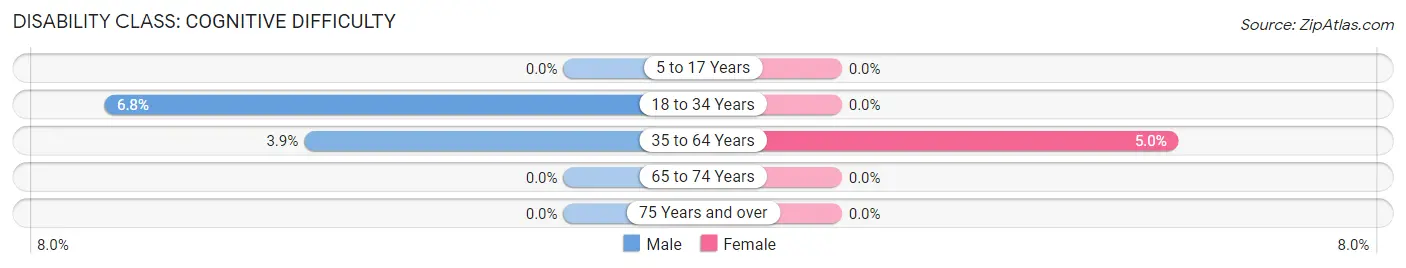
| Age Bracket | Male | Female |
| 5 to 17 Years | 0 (0.0%) | 0 (0.0%) |
| 18 to 34 Years | 3 (6.8%) | 0 (0.0%) |
| 35 to 64 Years | 2 (3.8%) | 4 (5.0%) |
| 65 to 74 Years | 0 (0.0%) | 0 (0.0%) |
| 75 Years and over | 0 (0.0%) | 0 (0.0%) |
Disability Class: Ambulatory Difficulty
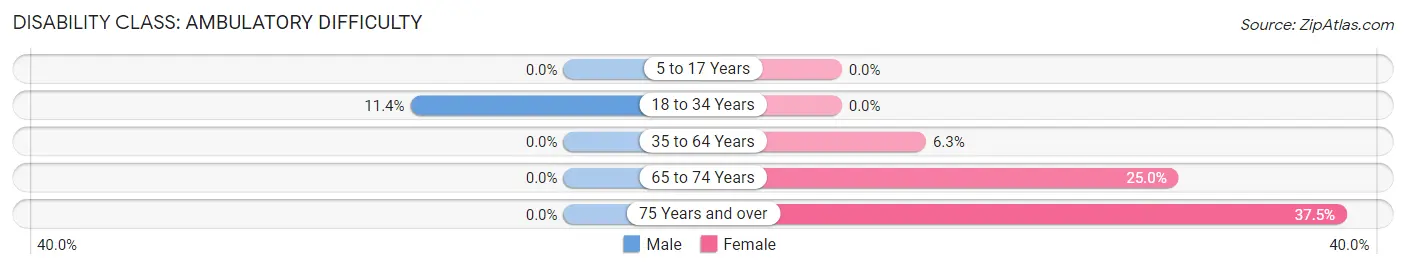
| Age Bracket | Male | Female |
| 5 to 17 Years | 0 (0.0%) | 0 (0.0%) |
| 18 to 34 Years | 5 (11.4%) | 0 (0.0%) |
| 35 to 64 Years | 0 (0.0%) | 5 (6.2%) |
| 65 to 74 Years | 0 (0.0%) | 3 (25.0%) |
| 75 Years and over | 0 (0.0%) | 3 (37.5%) |
Disability Class: Self-Care Difficulty
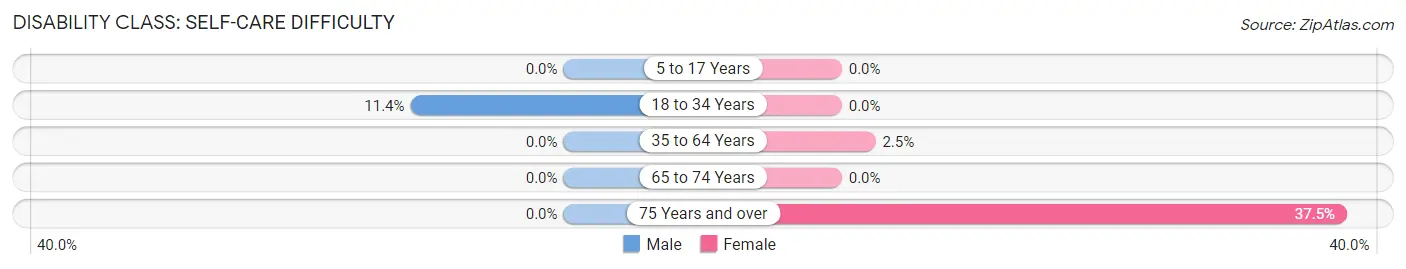
| Age Bracket | Male | Female |
| 5 to 17 Years | 0 (0.0%) | 0 (0.0%) |
| 18 to 34 Years | 5 (11.4%) | 0 (0.0%) |
| 35 to 64 Years | 0 (0.0%) | 2 (2.5%) |
| 65 to 74 Years | 0 (0.0%) | 0 (0.0%) |
| 75 Years and over | 0 (0.0%) | 3 (37.5%) |
Technology Access in Lake Lorraine
Computing Device Access in Lake Lorraine
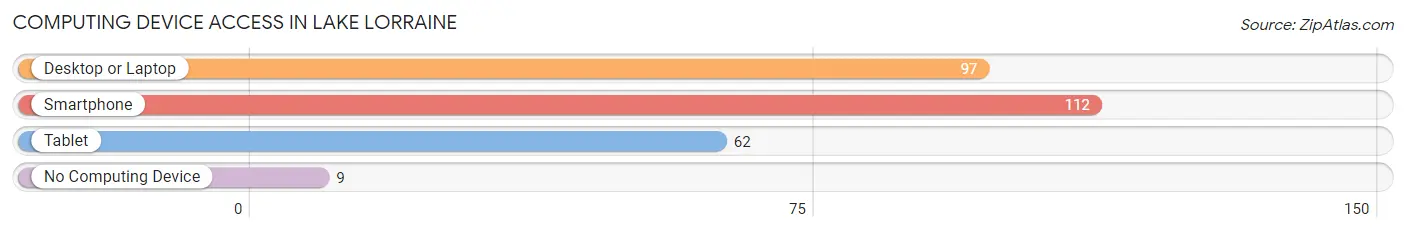
| Device Type | # Households | % Households |
| Desktop or Laptop | 97 | 75.8% |
| Smartphone | 112 | 87.5% |
| Tablet | 62 | 48.4% |
| No Computing Device | 9 | 7.0% |
| Total | 128 | 100.0% |
Internet Access in Lake Lorraine
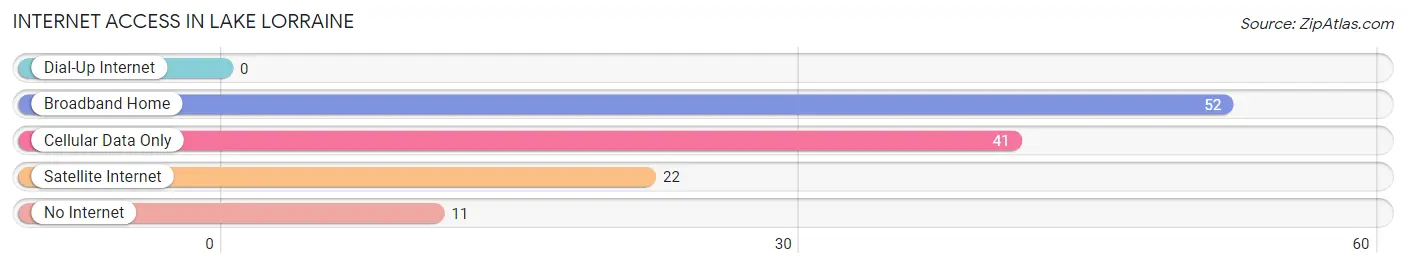
| Internet Type | # Households | % Households |
| Dial-Up Internet | 0 | 0.0% |
| Broadband Home | 52 | 40.6% |
| Cellular Data Only | 41 | 32.0% |
| Satellite Internet | 22 | 17.2% |
| No Internet | 11 | 8.6% |
| Total | 128 | 100.0% |
Lake Lorraine Summary
Lake Lorraine is a small unincorporated community located in the town of Lorraine, in Waushara County, Wisconsin. It is situated on the shores of Lake Lorraine, a small lake of approximately 200 acres. The lake is a popular destination for fishing, swimming, and boating.
History
The area around Lake Lorraine was first settled in the mid-1800s by German immigrants. The lake was originally known as “Lorraine’s Lake”, named after the town of Lorraine, which was established in 1854. The lake was later renamed to Lake Lorraine in 1876.
The first settlers of the area were mostly farmers, who grew crops such as wheat, corn, and oats. The lake was also used for fishing and recreation. In the early 1900s, the area around the lake began to develop, with the construction of a hotel, a general store, and a post office.
In the 1950s, the lake was developed for recreational use, with the construction of a marina and a campground. The lake is now a popular destination for fishing, swimming, and boating.
Geography
Lake Lorraine is located in the town of Lorraine, in Waushara County, Wisconsin. It is situated on the shores of Lake Lorraine, a small lake of approximately 200 acres. The lake is surrounded by wooded hills and is fed by several small streams.
The lake is a popular destination for fishing, swimming, and boating. There is a marina and a campground located on the lake. The lake is also home to several species of fish, including largemouth bass, northern pike, walleye, and panfish.
Economy
The economy of Lake Lorraine is largely based on tourism and recreation. The lake is a popular destination for fishing, swimming, and boating. There is a marina and a campground located on the lake.
The area also has several small businesses, including a general store, a restaurant, and a gas station. The town also has a post office and a library.
Demographics
As of the 2010 census, the population of Lake Lorraine was 545. The racial makeup of the town was 97.3% White, 0.2% African American, 0.4% Native American, 0.2% Asian, 0.2% from other races, and 1.9% from two or more races. Hispanic or Latino of any race were 0.7% of the population.
The median income for a household in the town was $41,250, and the median income for a family was $45,833. The per capita income for the town was $19,945. About 8.3% of families and 10.2% of the population were below the poverty line, including 14.3% of those under age 18 and 6.3% of those age 65 or over.
Common Questions
What is the Total Population of Lake Lorraine?
Total Population of Lake Lorraine is 290.
What is the Total Male Population of Lake Lorraine?
Total Male Population of Lake Lorraine is 146.
What is the Total Female Population of Lake Lorraine?
Total Female Population of Lake Lorraine is 144.
What is the Ratio of Males per 100 Females in Lake Lorraine?
There are 101.39 Males per 100 Females in Lake Lorraine.
What is the Ratio of Females per 100 Males in Lake Lorraine?
There are 98.63 Females per 100 Males in Lake Lorraine.
What is the Median Population Age in Lake Lorraine?
Median Population Age in Lake Lorraine is 38.0 Years.
What is the Average Family Size in Lake Lorraine
Average Family Size in Lake Lorraine is 2.8 People.
What is the Average Household Size in Lake Lorraine
Average Household Size in Lake Lorraine is 2.3 People.
What is Per Capita Income in Lake Lorraine?
Per Capita income in Lake Lorraine is $32,648.
What is the Median Family Income in Lake Lorraine?
Median Family Income in Lake Lorraine is $86,750.
What is the Median Household income in Lake Lorraine?
Median Household Income in Lake Lorraine is $67,188.
What is Income or Wage Gap in Lake Lorraine?
Income or Wage Gap in Lake Lorraine is 45.0%.
Women in Lake Lorraine earn 55.0 cents for every dollar earned by a man.
What is Inequality or Gini Index in Lake Lorraine?
Inequality or Gini Index in Lake Lorraine is 0.36.
How Large is the Labor Force in Lake Lorraine?
There are 201 People in the Labor Forcein in Lake Lorraine.
What is the Percentage of People in the Labor Force in Lake Lorraine?
79.1% of People are in the Labor Force in Lake Lorraine.
What is the Unemployment Rate in Lake Lorraine?
Unemployment Rate in Lake Lorraine is 3.0%.