Kewaunee, WI
Kewaunee Map
Kewaunee Overview
2,819
TOTAL POPULATION
1,421
MALE POPULATION
1,398
FEMALE POPULATION
101.65
MALES / 100 FEMALES
98.38
FEMALES / 100 MALES
45.7
MEDIAN AGE
2.6
AVG FAMILY SIZE
2.1
AVG HOUSEHOLD SIZE
$42,881
PER CAPITA INCOME
$83,250
AVG FAMILY INCOME
$64,643
AVG HOUSEHOLD INCOME
25.6%
WAGE / INCOME GAP [ % ]
74.4¢/ $1
WAGE / INCOME GAP [ $ ]
0.44
INEQUALITY / GINI INDEX
1,557
LABOR FORCE [ PEOPLE ]
64.0%
PERCENT IN LABOR FORCE
0.3%
UNEMPLOYMENT RATE
Kewaunee Zip Codes
Kewaunee Area Codes
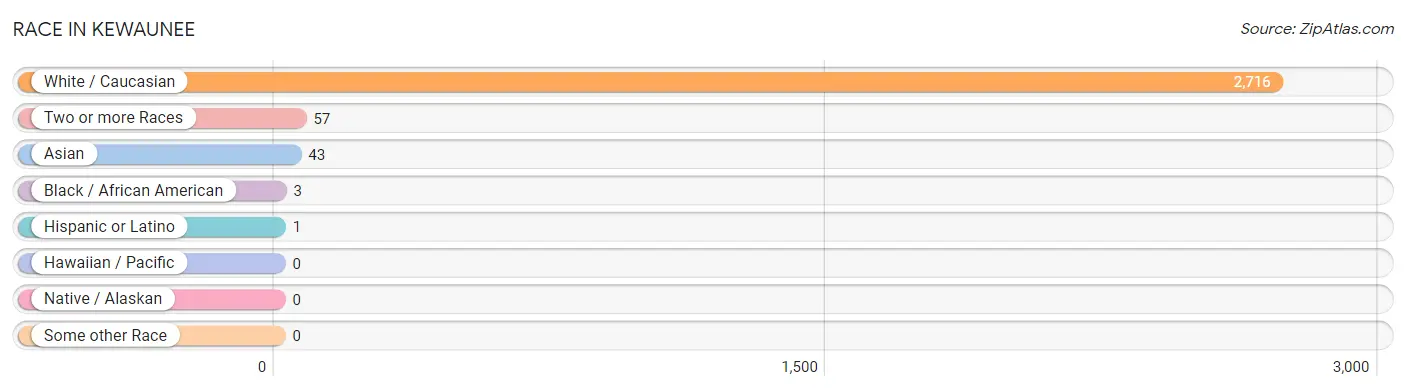
Race in Kewaunee
The most populous races in Kewaunee are White / Caucasian (2,716 | 96.4%), Two or more Races (57 | 2.0%), and Asian (43 | 1.5%).
| Race | # Population | % Population |
| Asian | 43 | 1.5% |
| Black / African American | 3 | 0.1% |
| Hawaiian / Pacific | 0 | 0.0% |
| Hispanic or Latino | 1 | 0.0% |
| Native / Alaskan | 0 | 0.0% |
| White / Caucasian | 2,716 | 96.4% |
| Two or more Races | 57 | 2.0% |
| Some other Race | 0 | 0.0% |
| Total | 2,819 | 100.0% |
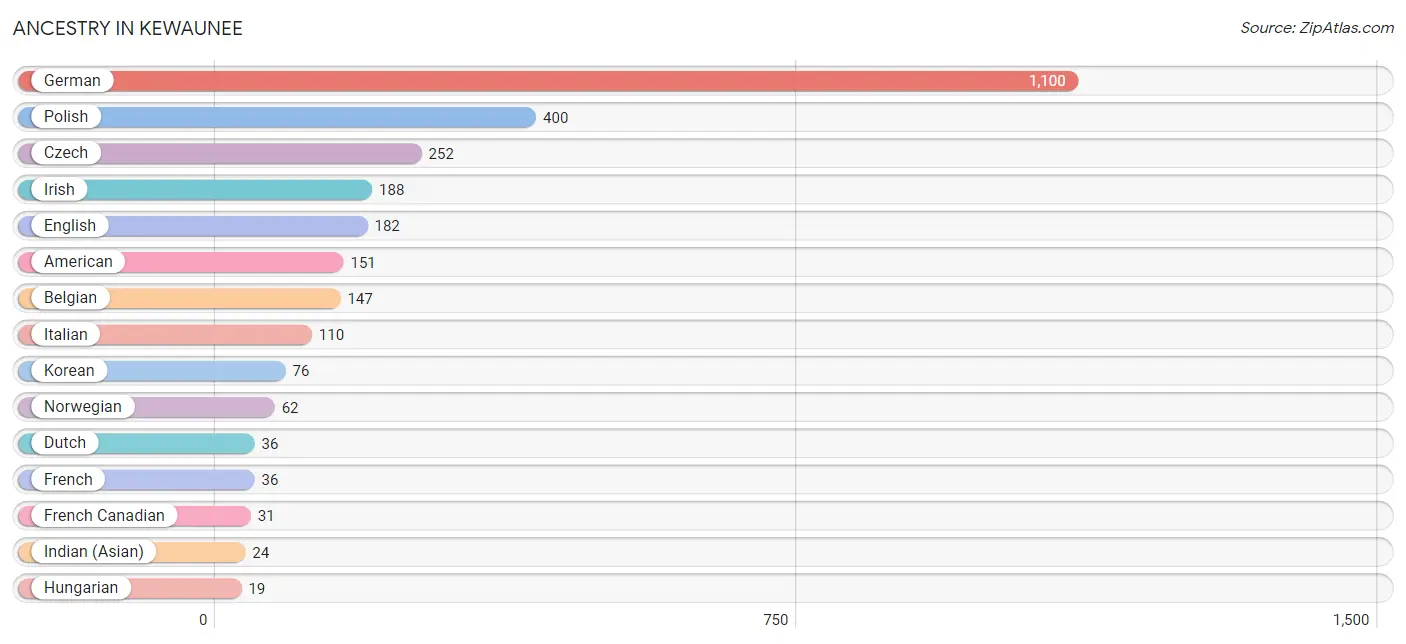
Ancestry in Kewaunee
The most populous ancestries reported in Kewaunee are German (1,100 | 39.0%), Polish (400 | 14.2%), Czech (252 | 8.9%), Irish (188 | 6.7%), and English (182 | 6.5%), together accounting for 75.3% of all Kewaunee residents.
| Ancestry | # Population | % Population |
| American | 151 | 5.4% |
| Belgian | 147 | 5.2% |
| Czech | 252 | 8.9% |
| Czechoslovakian | 18 | 0.6% |
| Dutch | 36 | 1.3% |
| English | 182 | 6.5% |
| European | 10 | 0.4% |
| French | 36 | 1.3% |
| French Canadian | 31 | 1.1% |
| German | 1,100 | 39.0% |
| Hungarian | 19 | 0.7% |
| Indian (Asian) | 24 | 0.9% |
| Irish | 188 | 6.7% |
| Italian | 110 | 3.9% |
| Korean | 76 | 2.7% |
| Mexican | 1 | 0.0% |
| Norwegian | 62 | 2.2% |
| Polish | 400 | 14.2% |
| Scotch-Irish | 18 | 0.6% |
| Swedish | 7 | 0.3% | View All 20 Rows |
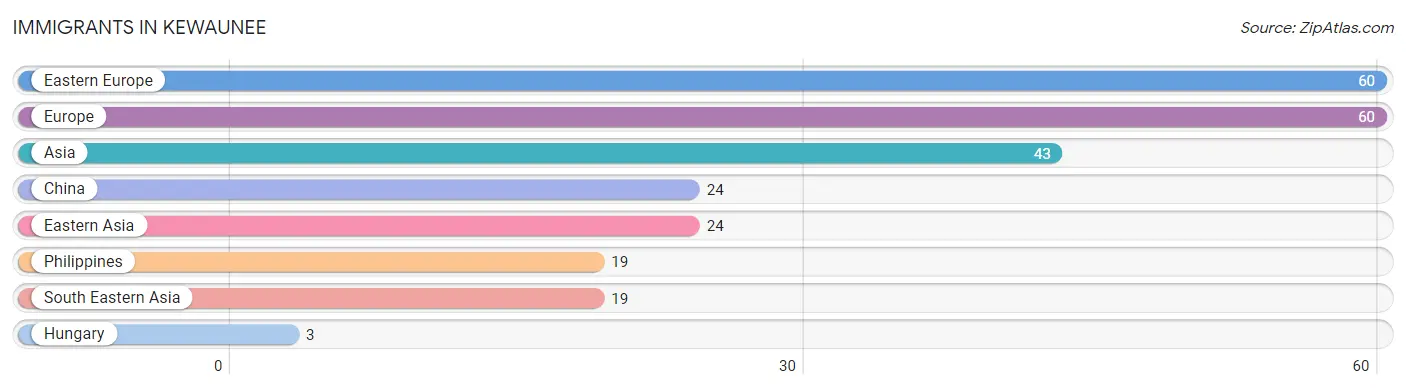
Immigrants in Kewaunee
The most numerous immigrant groups reported in Kewaunee came from Eastern Europe (60 | 2.1%), Europe (60 | 2.1%), Asia (43 | 1.5%), China (24 | 0.9%), and Eastern Asia (24 | 0.9%), together accounting for 7.5% of all Kewaunee residents.
| Immigration Origin | # Population | % Population |
| Asia | 43 | 1.5% |
| China | 24 | 0.9% |
| Eastern Asia | 24 | 0.9% |
| Eastern Europe | 60 | 2.1% |
| Europe | 60 | 2.1% |
| Hungary | 3 | 0.1% |
| Philippines | 19 | 0.7% |
| South Eastern Asia | 19 | 0.7% | View All 8 Rows |
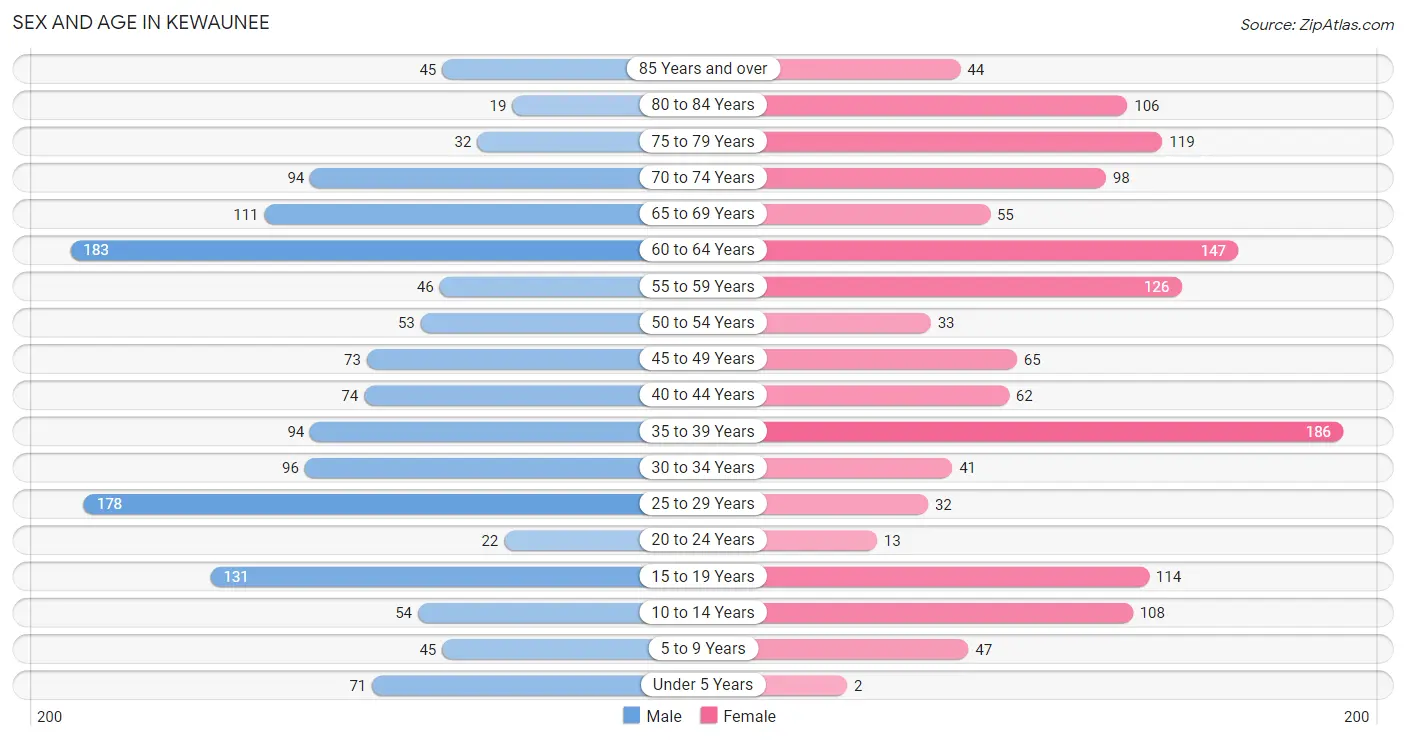
Sex and Age in Kewaunee
Sex and Age in Kewaunee
The most populous age groups in Kewaunee are 60 to 64 Years (183 | 12.9%) for men and 35 to 39 Years (186 | 13.3%) for women.
| Age Bracket | Male | Female |
| Under 5 Years | 71 (5.0%) | 2 (0.1%) |
| 5 to 9 Years | 45 (3.2%) | 47 (3.4%) |
| 10 to 14 Years | 54 (3.8%) | 108 (7.7%) |
| 15 to 19 Years | 131 (9.2%) | 114 (8.2%) |
| 20 to 24 Years | 22 (1.5%) | 13 (0.9%) |
| 25 to 29 Years | 178 (12.5%) | 32 (2.3%) |
| 30 to 34 Years | 96 (6.8%) | 41 (2.9%) |
| 35 to 39 Years | 94 (6.6%) | 186 (13.3%) |
| 40 to 44 Years | 74 (5.2%) | 62 (4.4%) |
| 45 to 49 Years | 73 (5.1%) | 65 (4.6%) |
| 50 to 54 Years | 53 (3.7%) | 33 (2.4%) |
| 55 to 59 Years | 46 (3.2%) | 126 (9.0%) |
| 60 to 64 Years | 183 (12.9%) | 147 (10.5%) |
| 65 to 69 Years | 111 (7.8%) | 55 (3.9%) |
| 70 to 74 Years | 94 (6.6%) | 98 (7.0%) |
| 75 to 79 Years | 32 (2.2%) | 119 (8.5%) |
| 80 to 84 Years | 19 (1.3%) | 106 (7.6%) |
| 85 Years and over | 45 (3.2%) | 44 (3.2%) |
| Total | 1,421 (100.0%) | 1,398 (100.0%) |
Families and Households in Kewaunee
Median Family Size in Kewaunee
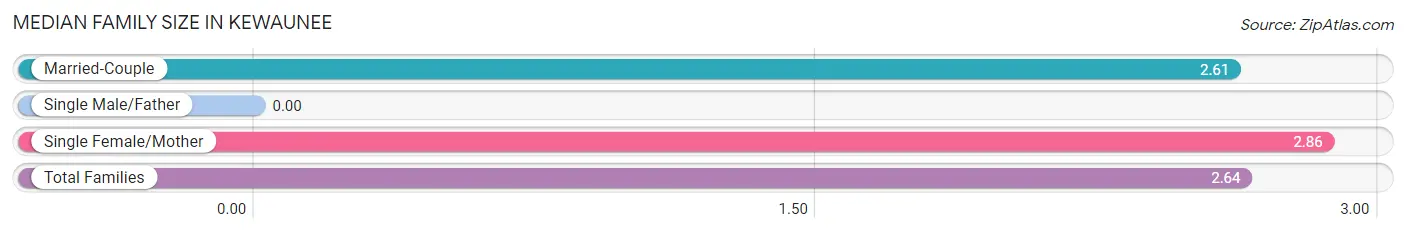
| Family Type | # Families | Family Size |
| Married-Couple | 697 (87.2%) | 2.61 |
| Single Male/Father | 0 (0.0%) | - |
| Single Female/Mother | 102 (12.8%) | 2.86 |
| Total Families | 799 (100.0%) | 2.64 |
Median Household Size in Kewaunee
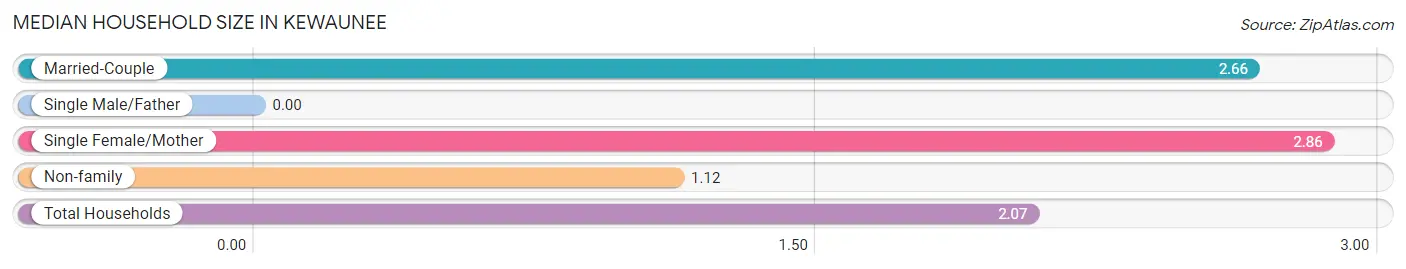
| Household Type | # Households | Household Size |
| Married-Couple | 697 (52.8%) | 2.66 |
| Single Male/Father | 0 (0.0%) | - |
| Single Female/Mother | 102 (7.7%) | 2.86 |
| Non-family | 521 (39.5%) | 1.12 |
| Total Households | 1,320 (100.0%) | 2.07 |
Household Size by Marriage Status in Kewaunee
Out of a total of 1,320 households in Kewaunee, 799 (60.5%) are family households, while 521 (39.5%) are nonfamily households. The most numerous type of family households are 2-person households, comprising 488, and the most common type of nonfamily households are 1-person households, comprising 480.
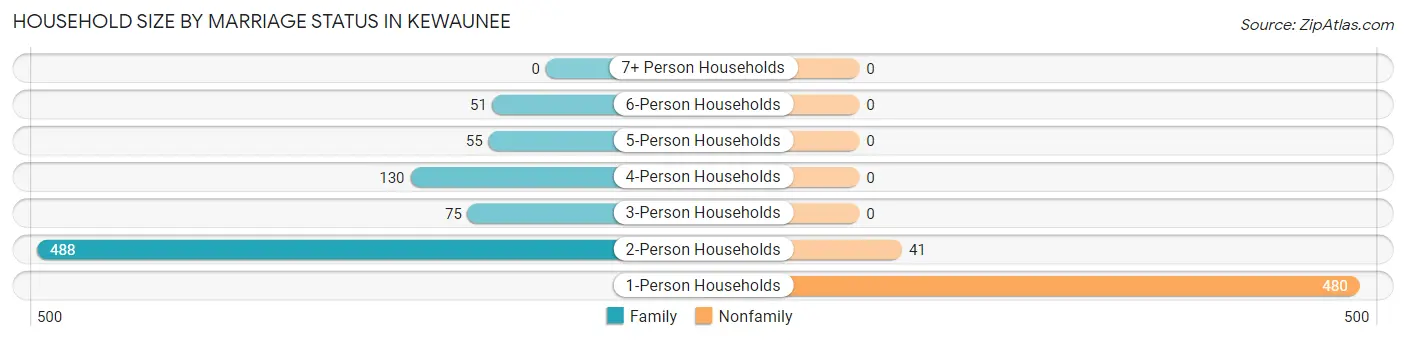
| Household Size | Family Households | Nonfamily Households |
| 1-Person Households | - | 480 (36.4%) |
| 2-Person Households | 488 (37.0%) | 41 (3.1%) |
| 3-Person Households | 75 (5.7%) | 0 (0.0%) |
| 4-Person Households | 130 (9.9%) | 0 (0.0%) |
| 5-Person Households | 55 (4.2%) | 0 (0.0%) |
| 6-Person Households | 51 (3.9%) | 0 (0.0%) |
| 7+ Person Households | 0 (0.0%) | 0 (0.0%) |
| Total | 799 (60.5%) | 521 (39.5%) |
Female Fertility in Kewaunee
Fertility by Age in Kewaunee
| Age Bracket | Women with Births | Births / 1,000 Women |
| 15 to 19 years | 0 (0.0%) | 0.0 |
| 20 to 34 years | 0 (0.0%) | 0.0 |
| 35 to 50 years | 0 (0.0%) | 0.0 |
| Total | 0 (0.0%) | 0.0 |
Fertility by Age by Marriage Status in Kewaunee
| Age Bracket | Married | Unmarried |
| 15 to 19 years | 0 (0.0%) | 0 (0.0%) |
| 20 to 34 years | 0 (0.0%) | 0 (0.0%) |
| 35 to 50 years | 0 (0.0%) | 0 (0.0%) |
| Total | 0 (0.0%) | 0 (0.0%) |
Fertility by Education in Kewaunee
| Educational Attainment | Women with Births | Births / 1,000 Women |
| Less than High School | 0 (0.0%) | 0.0 |
| High School Diploma | 0 (0.0%) | 0.0 |
| College or Associate's Degree | 0 (0.0%) | 0.0 |
| Bachelor's Degree | 0 (0.0%) | 0.0 |
| Graduate Degree | 0 (0.0%) | 0.0 |
| Total | 0 (0.0%) | 0.0 |
Fertility by Education by Marriage Status in Kewaunee
| Educational Attainment | Married | Unmarried |
| Less than High School | 0 (0.0%) | 0 (0.0%) |
| High School Diploma | 0 (0.0%) | 0 (0.0%) |
| College or Associate's Degree | 0 (0.0%) | 0 (0.0%) |
| Bachelor's Degree | 0 (0.0%) | 0 (0.0%) |
| Graduate Degree | 0 (0.0%) | 0 (0.0%) |
| Total | 0 (0.0%) | 0 (0.0%) |
Income in Kewaunee
Income Overview in Kewaunee
Per Capita Income in Kewaunee is $42,881, while median incomes of families and households are $83,250 and $64,643 respectively.
| Characteristic | Number | Measure |
| Per Capita Income | 2,819 | $42,881 |
| Median Family Income | 799 | $83,250 |
| Mean Family Income | 799 | $116,288 |
| Median Household Income | 1,320 | $64,643 |
| Mean Household Income | 1,320 | $92,365 |
| Income Deficit | 799 | $0 |
| Wage / Income Gap (%) | 2,819 | 25.63% |
| Wage / Income Gap ($) | 2,819 | 74.37¢ per $1 |
| Gini / Inequality Index | 2,819 | 0.44 |
Earnings by Sex in Kewaunee
Average Earnings in Kewaunee are $41,094, $44,003 for men and $32,725 for women, a difference of 25.6%.
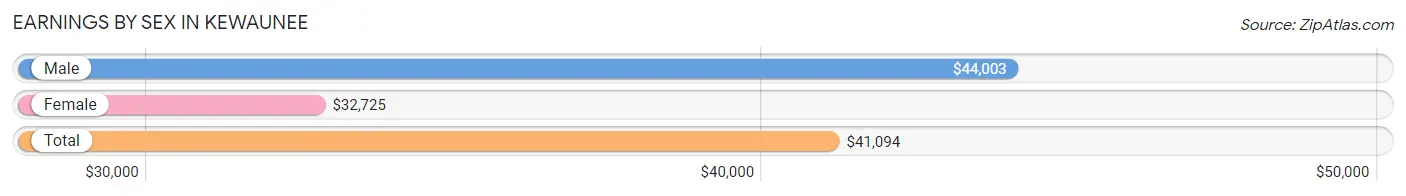
| Sex | Number | Average Earnings |
| Male | 859 (50.8%) | $44,003 |
| Female | 831 (49.2%) | $32,725 |
| Total | 1,690 (100.0%) | $41,094 |
Earnings by Sex by Income Bracket in Kewaunee
The most common earnings brackets in Kewaunee are $35,000 to $39,999 for men (131 | 15.2%) and $10,000 to $12,499 for women (127 | 15.3%).
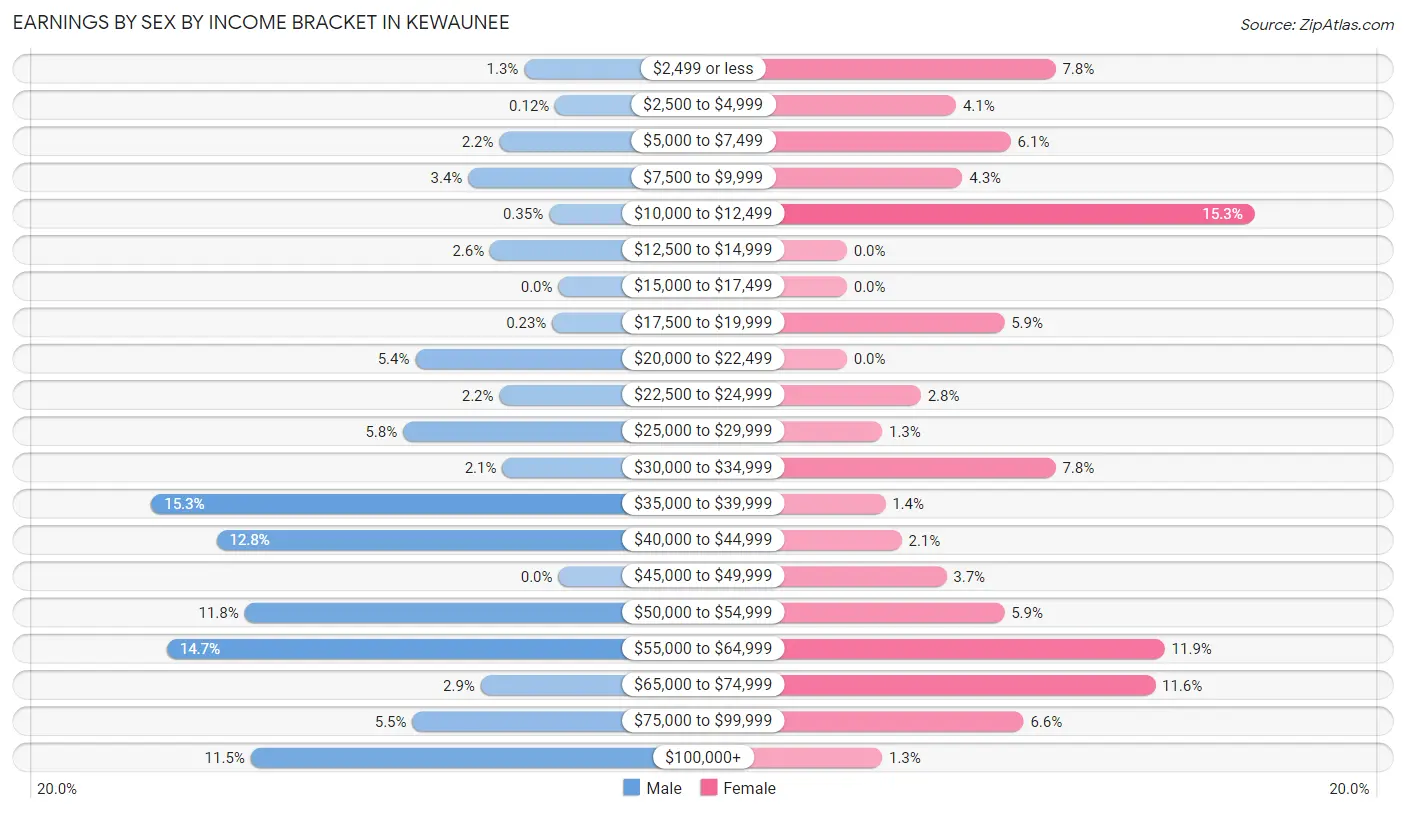
| Income | Male | Female |
| $2,499 or less | 11 (1.3%) | 65 (7.8%) |
| $2,500 to $4,999 | 1 (0.1%) | 34 (4.1%) |
| $5,000 to $7,499 | 19 (2.2%) | 51 (6.1%) |
| $7,500 to $9,999 | 29 (3.4%) | 36 (4.3%) |
| $10,000 to $12,499 | 3 (0.4%) | 127 (15.3%) |
| $12,500 to $14,999 | 22 (2.6%) | 0 (0.0%) |
| $15,000 to $17,499 | 0 (0.0%) | 0 (0.0%) |
| $17,500 to $19,999 | 2 (0.2%) | 49 (5.9%) |
| $20,000 to $22,499 | 46 (5.4%) | 0 (0.0%) |
| $22,500 to $24,999 | 19 (2.2%) | 23 (2.8%) |
| $25,000 to $29,999 | 50 (5.8%) | 11 (1.3%) |
| $30,000 to $34,999 | 18 (2.1%) | 65 (7.8%) |
| $35,000 to $39,999 | 131 (15.2%) | 12 (1.4%) |
| $40,000 to $44,999 | 110 (12.8%) | 17 (2.1%) |
| $45,000 to $49,999 | 0 (0.0%) | 31 (3.7%) |
| $50,000 to $54,999 | 101 (11.8%) | 49 (5.9%) |
| $55,000 to $64,999 | 126 (14.7%) | 99 (11.9%) |
| $65,000 to $74,999 | 25 (2.9%) | 96 (11.6%) |
| $75,000 to $99,999 | 47 (5.5%) | 55 (6.6%) |
| $100,000+ | 99 (11.5%) | 11 (1.3%) |
| Total | 859 (100.0%) | 831 (100.0%) |
Earnings by Sex by Educational Attainment in Kewaunee
Average earnings in Kewaunee are $44,984 for men and $39,375 for women, a difference of 12.5%. Men with an educational attainment of high school diploma enjoy the highest average annual earnings of $51,287, while those with college or associate's degree education earn the least with $43,576. Women with an educational attainment of bachelor's degree earn the most with the average annual earnings of $53,077, while those with high school diploma education have the smallest earnings of $31,500.
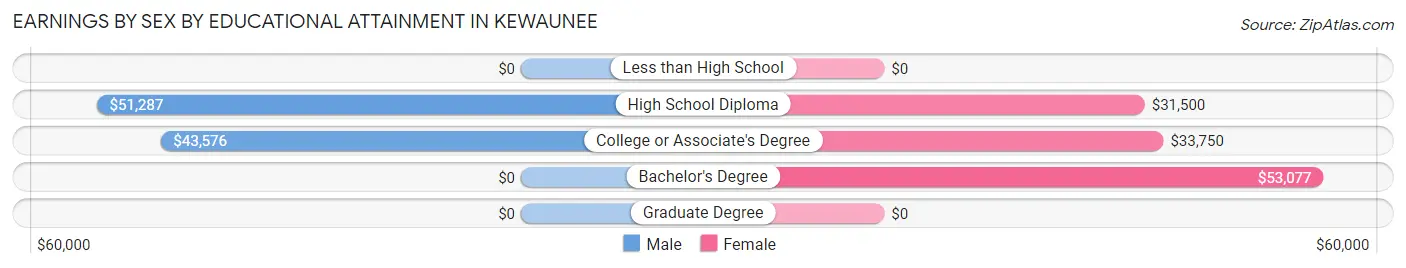
| Educational Attainment | Male Income | Female Income |
| Less than High School | - | - |
| High School Diploma | $51,287 | $31,500 |
| College or Associate's Degree | $43,576 | $33,750 |
| Bachelor's Degree | - | - |
| Graduate Degree | - | - |
| Total | $44,984 | $39,375 |
Family Income in Kewaunee
Family Income Brackets in Kewaunee
According to the Kewaunee family income data, there are 227 families falling into the $100,000 to $149,999 income range, which is the most common income bracket and makes up 28.4% of all families.
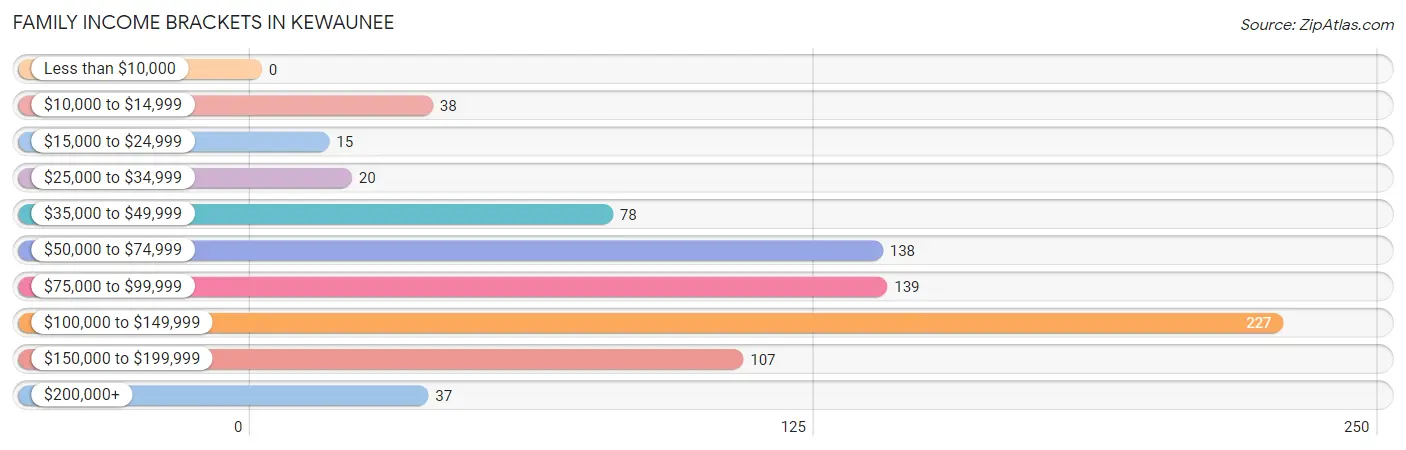
| Income Bracket | # Families | % Families |
| Less than $10,000 | 0 | 0.0% |
| $10,000 to $14,999 | 38 | 4.8% |
| $15,000 to $24,999 | 15 | 1.9% |
| $25,000 to $34,999 | 20 | 2.5% |
| $35,000 to $49,999 | 78 | 9.8% |
| $50,000 to $74,999 | 138 | 17.3% |
| $75,000 to $99,999 | 139 | 17.4% |
| $100,000 to $149,999 | 227 | 28.4% |
| $150,000 to $199,999 | 107 | 13.4% |
| $200,000+ | 37 | 4.6% |
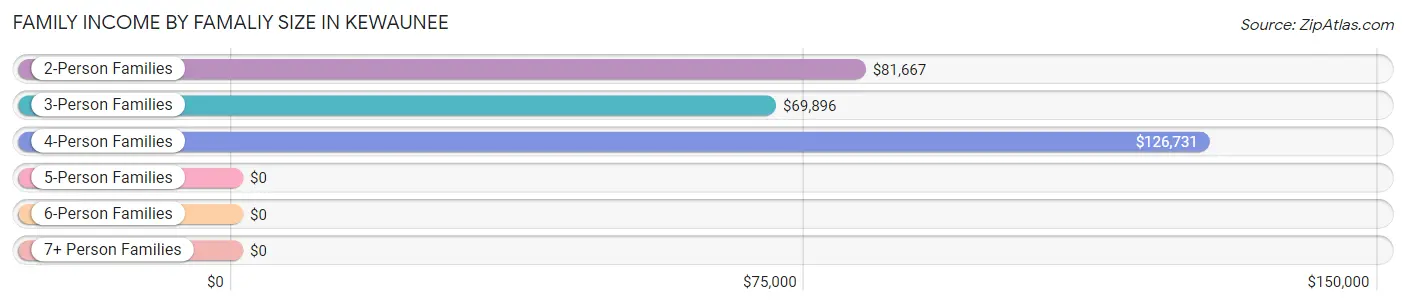
Family Income by Famaliy Size in Kewaunee
4-person families (162 | 20.3%) account for the highest median family income in Kewaunee with $126,731 per family, while 2-person families (488 | 61.1%) have the highest median income of $40,834 per family member.
| Income Bracket | # Families | Median Income |
| 2-Person Families | 488 (61.1%) | $81,667 |
| 3-Person Families | 75 (9.4%) | $69,896 |
| 4-Person Families | 162 (20.3%) | $126,731 |
| 5-Person Families | 23 (2.9%) | $0 |
| 6-Person Families | 51 (6.4%) | $0 |
| 7+ Person Families | 0 (0.0%) | $0 |
| Total | 799 (100.0%) | $83,250 |
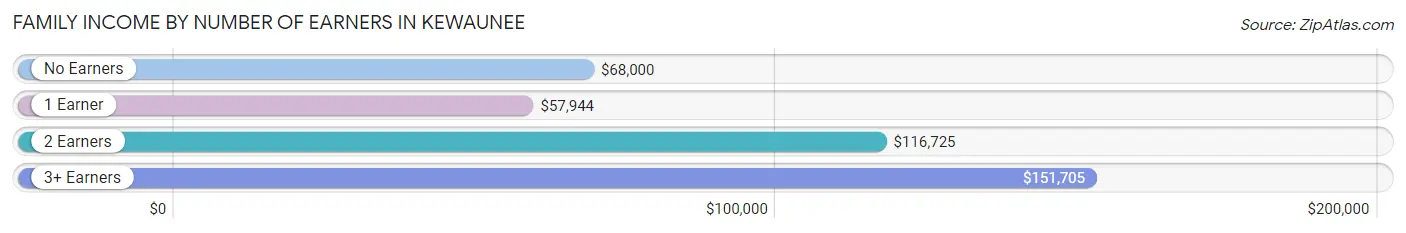
Family Income by Number of Earners in Kewaunee
The median family income in Kewaunee is $83,250, with families comprising 3+ earners (161) having the highest median family income of $151,705, while families with 1 earner (215) have the lowest median family income of $57,944, accounting for 20.2% and 26.9% of families, respectively.
| Number of Earners | # Families | Median Income |
| No Earners | 114 (14.3%) | $68,000 |
| 1 Earner | 215 (26.9%) | $57,944 |
| 2 Earners | 309 (38.7%) | $116,725 |
| 3+ Earners | 161 (20.2%) | $151,705 |
| Total | 799 (100.0%) | $83,250 |
Household Income in Kewaunee
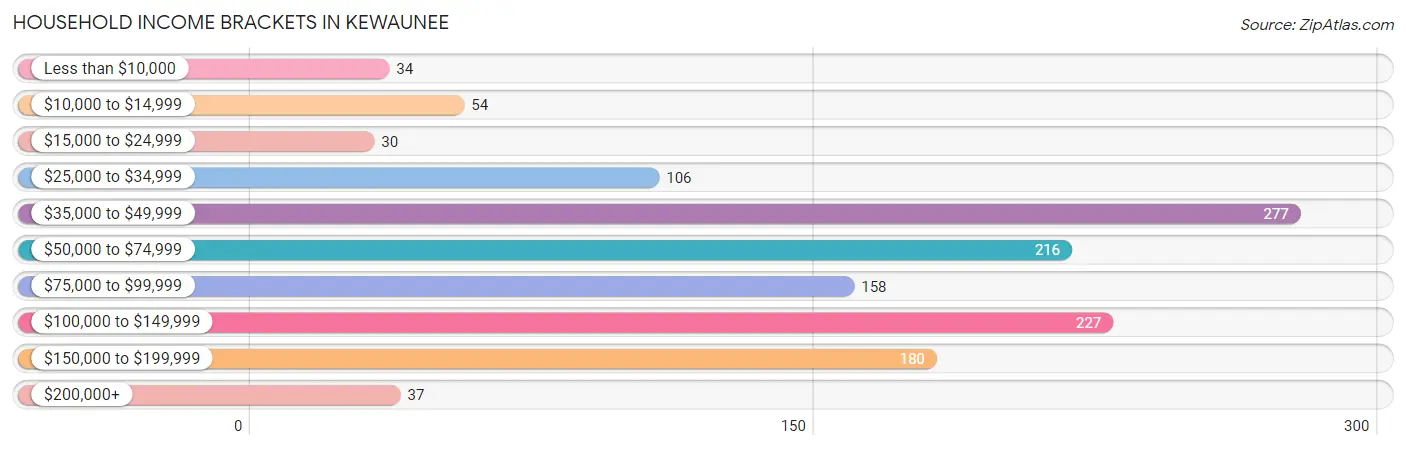
Household Income Brackets in Kewaunee
With 277 households falling in the category, the $35,000 to $49,999 income range is the most frequent in Kewaunee, accounting for 21.0% of all households. In contrast, only 30 households (2.3%) fall into the $15,000 to $24,999 income bracket, making it the least populous group.
| Income Bracket | # Households | % Households |
| Less than $10,000 | 34 | 2.6% |
| $10,000 to $14,999 | 54 | 4.1% |
| $15,000 to $24,999 | 30 | 2.3% |
| $25,000 to $34,999 | 106 | 8.0% |
| $35,000 to $49,999 | 277 | 21.0% |
| $50,000 to $74,999 | 216 | 16.4% |
| $75,000 to $99,999 | 158 | 12.0% |
| $100,000 to $149,999 | 227 | 17.2% |
| $150,000 to $199,999 | 180 | 13.6% |
| $200,000+ | 37 | 2.8% |
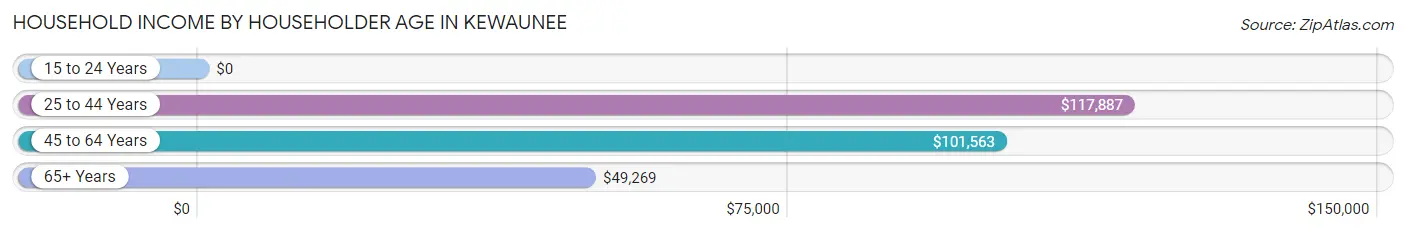
Household Income by Householder Age in Kewaunee
The median household income in Kewaunee is $64,643, with the highest median household income of $117,887 found in the 25 to 44 years age bracket for the primary householder. A total of 392 households (29.7%) fall into this category.
| Income Bracket | # Households | Median Income |
| 15 to 24 Years | 0 (0.0%) | $0 |
| 25 to 44 Years | 392 (29.7%) | $117,887 |
| 45 to 64 Years | 404 (30.6%) | $101,563 |
| 65+ Years | 524 (39.7%) | $49,269 |
| Total | 1,320 (100.0%) | $64,643 |
Poverty in Kewaunee
Income Below Poverty by Sex and Age in Kewaunee
With 8.1% poverty level for males and 6.1% for females among the residents of Kewaunee, 15 year old males and 45 to 54 year old females are the most vulnerable to poverty, with 59 males (100.0%) and 38 females (38.8%) in their respective age groups living below the poverty level.
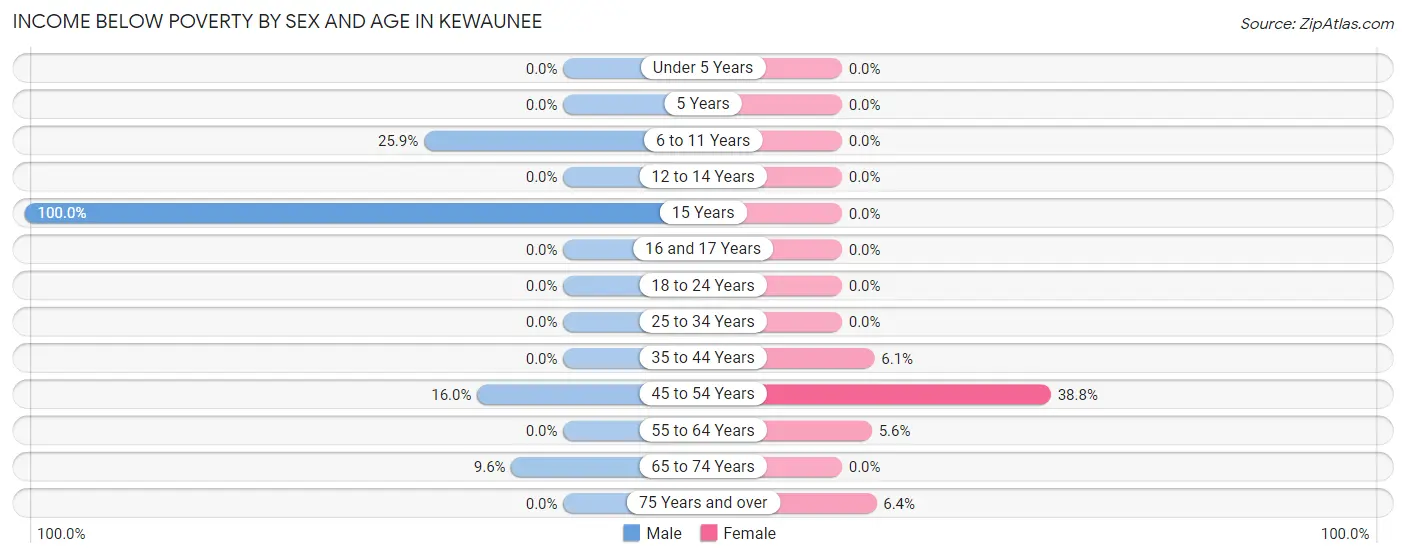
| Age Bracket | Male | Female |
| Under 5 Years | 0 (0.0%) | 0 (0.0%) |
| 5 Years | 0 (0.0%) | 0 (0.0%) |
| 6 to 11 Years | 15 (25.9%) | 0 (0.0%) |
| 12 to 14 Years | 0 (0.0%) | 0 (0.0%) |
| 15 Years | 59 (100.0%) | 0 (0.0%) |
| 16 and 17 Years | 0 (0.0%) | 0 (0.0%) |
| 18 to 24 Years | 0 (0.0%) | 0 (0.0%) |
| 25 to 34 Years | 0 (0.0%) | 0 (0.0%) |
| 35 to 44 Years | 0 (0.0%) | 15 (6.0%) |
| 45 to 54 Years | 19 (16.0%) | 38 (38.8%) |
| 55 to 64 Years | 0 (0.0%) | 15 (5.6%) |
| 65 to 74 Years | 19 (9.6%) | 0 (0.0%) |
| 75 Years and over | 0 (0.0%) | 16 (6.4%) |
| Total | 112 (8.1%) | 84 (6.1%) |
Income Above Poverty by Sex and Age in Kewaunee
According to the poverty statistics in Kewaunee, males aged under 5 years and females aged under 5 years are the age groups that are most secure financially, with 100.0% of males and 100.0% of females in these age groups living above the poverty line.
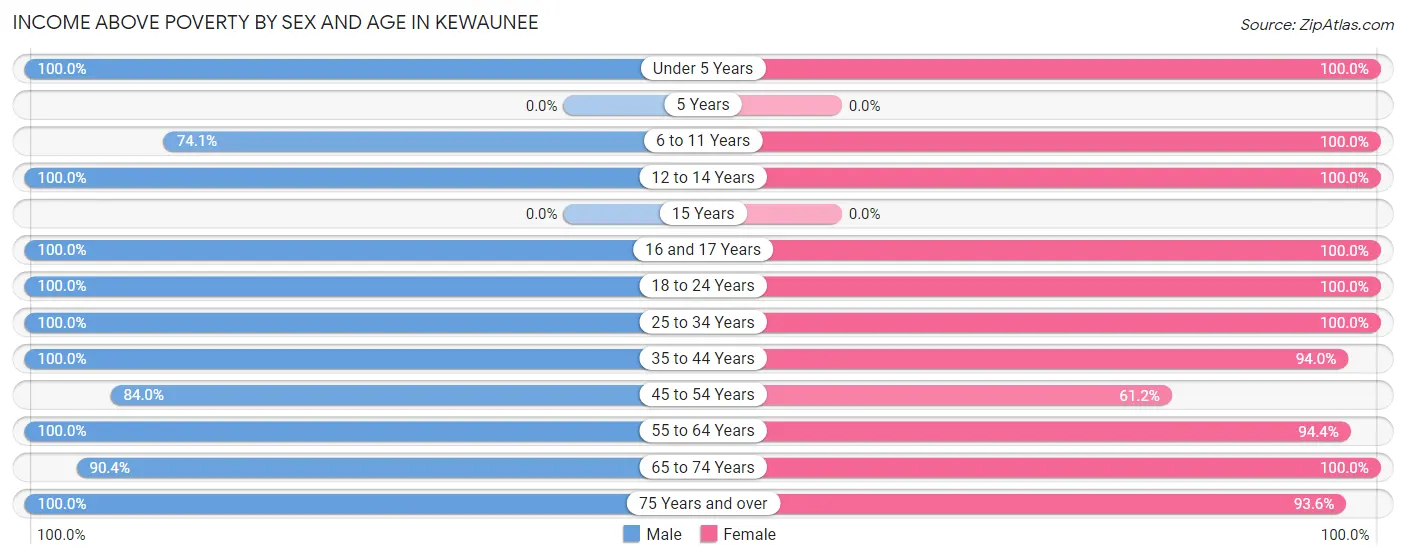
| Age Bracket | Male | Female |
| Under 5 Years | 71 (100.0%) | 2 (100.0%) |
| 5 Years | 0 (0.0%) | 0 (0.0%) |
| 6 to 11 Years | 43 (74.1%) | 54 (100.0%) |
| 12 to 14 Years | 41 (100.0%) | 101 (100.0%) |
| 15 Years | 0 (0.0%) | 0 (0.0%) |
| 16 and 17 Years | 27 (100.0%) | 52 (100.0%) |
| 18 to 24 Years | 65 (100.0%) | 75 (100.0%) |
| 25 to 34 Years | 267 (100.0%) | 73 (100.0%) |
| 35 to 44 Years | 162 (100.0%) | 233 (94.0%) |
| 45 to 54 Years | 100 (84.0%) | 60 (61.2%) |
| 55 to 64 Years | 228 (100.0%) | 255 (94.4%) |
| 65 to 74 Years | 178 (90.4%) | 147 (100.0%) |
| 75 Years and over | 86 (100.0%) | 234 (93.6%) |
| Total | 1,268 (91.9%) | 1,286 (93.9%) |
Income Below Poverty Among Married-Couple Families in Kewaunee
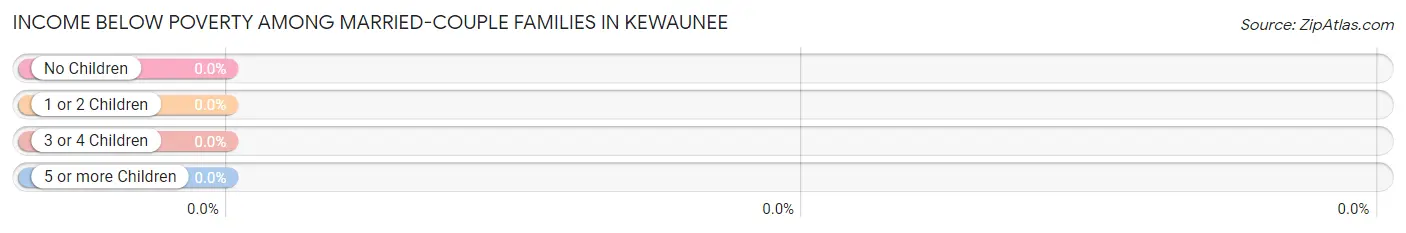
| Children | Above Poverty | Below Poverty |
| No Children | 543 (100.0%) | 0 (0.0%) |
| 1 or 2 Children | 80 (100.0%) | 0 (0.0%) |
| 3 or 4 Children | 74 (100.0%) | 0 (0.0%) |
| 5 or more Children | 0 (0.0%) | 0 (0.0%) |
| Total | 697 (100.0%) | 0 (0.0%) |
Income Below Poverty Among Single-Parent Households in Kewaunee
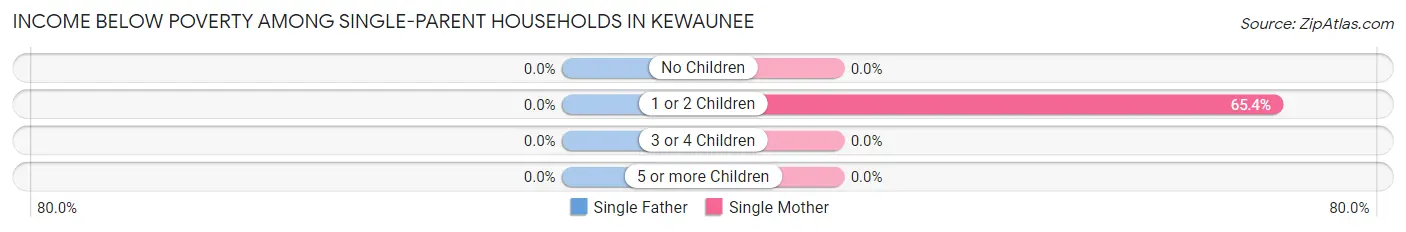
| Children | Single Father | Single Mother |
| No Children | 0 (0.0%) | 0 (0.0%) |
| 1 or 2 Children | 0 (0.0%) | 53 (65.4%) |
| 3 or 4 Children | 0 (0.0%) | 0 (0.0%) |
| 5 or more Children | 0 (0.0%) | 0 (0.0%) |
| Total | 0 (0.0%) | 53 (52.0%) |
Income Below Poverty Among Married-Couple vs Single-Parent Households in Kewaunee
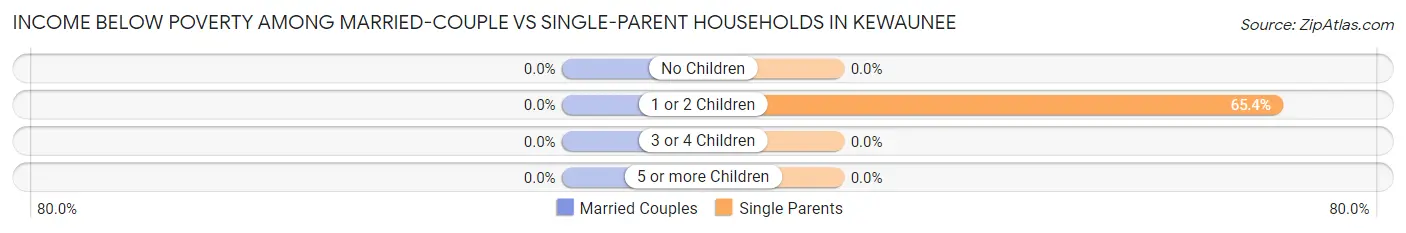
| Children | Married-Couple Families | Single-Parent Households |
| No Children | 0 (0.0%) | 0 (0.0%) |
| 1 or 2 Children | 0 (0.0%) | 53 (65.4%) |
| 3 or 4 Children | 0 (0.0%) | 0 (0.0%) |
| 5 or more Children | 0 (0.0%) | 0 (0.0%) |
| Total | 0 (0.0%) | 53 (52.0%) |
Employment Characteristics in Kewaunee
Employment by Class of Employer in Kewaunee
Among the 1,517 employed individuals in Kewaunee, private company employees (1,054 | 69.5%), self-employed (not incorporated) (132 | 8.7%), and local government employees (123 | 8.1%) make up the most common classes of employment.
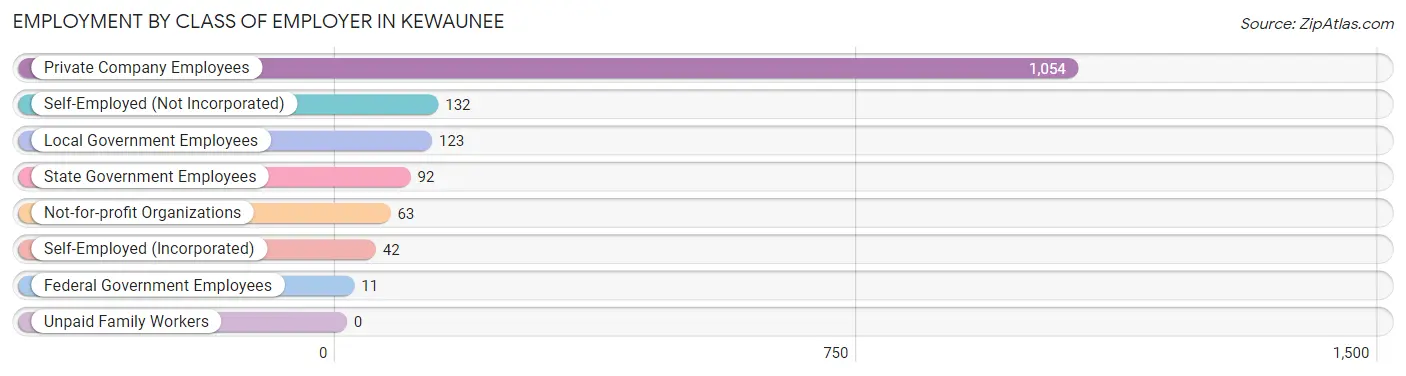
| Employer Class | # Employees | % Employees |
| Private Company Employees | 1,054 | 69.5% |
| Self-Employed (Incorporated) | 42 | 2.8% |
| Self-Employed (Not Incorporated) | 132 | 8.7% |
| Not-for-profit Organizations | 63 | 4.2% |
| Local Government Employees | 123 | 8.1% |
| State Government Employees | 92 | 6.1% |
| Federal Government Employees | 11 | 0.7% |
| Unpaid Family Workers | 0 | 0.0% |
| Total | 1,517 | 100.0% |
Employment Status by Age in Kewaunee
According to the labor force statistics for Kewaunee, out of the total population over 16 years of age (2,433), 64.0% or 1,557 individuals are in the labor force, with 0.3% or 5 of them unemployed. The age group with the highest labor force participation rate is 20 to 24 years, with 100.0% or 35 individuals in the labor force. Within the labor force, the 30 to 34 years age range has the highest percentage of unemployed individuals, with 4.2% or 4 of them being unemployed.
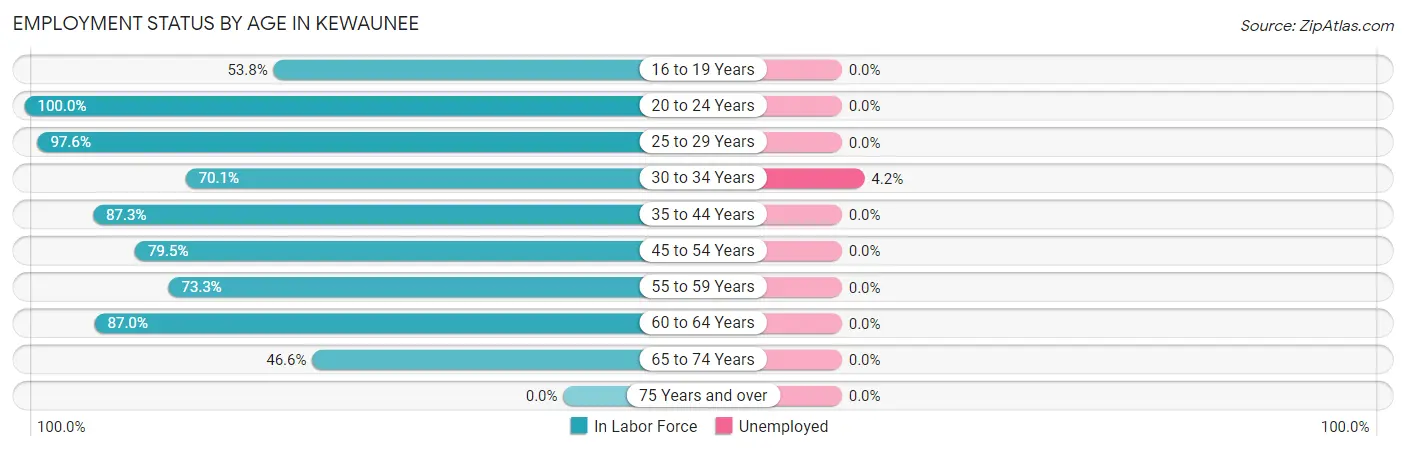
| Age Bracket | In Labor Force | Unemployed |
| 16 to 19 Years | 100 (53.8%) | 0 (0.0%) |
| 20 to 24 Years | 35 (100.0%) | 0 (0.0%) |
| 25 to 29 Years | 205 (97.6%) | 0 (0.0%) |
| 30 to 34 Years | 96 (70.1%) | 4 (4.2%) |
| 35 to 44 Years | 363 (87.3%) | 0 (0.0%) |
| 45 to 54 Years | 178 (79.5%) | 0 (0.0%) |
| 55 to 59 Years | 126 (73.3%) | 0 (0.0%) |
| 60 to 64 Years | 287 (87.0%) | 0 (0.0%) |
| 65 to 74 Years | 167 (46.6%) | 0 (0.0%) |
| 75 Years and over | 0 (0.0%) | 0 (0.0%) |
| Total | 1,557 (64.0%) | 5 (0.3%) |
Employment Status by Educational Attainment in Kewaunee
According to labor force statistics for Kewaunee, 84.3% of individuals (1,255) out of the total population between 25 and 64 years of age (1,489) are in the labor force, with 0.3% or 4 of them being unemployed. The group with the highest labor force participation rate are those with the educational attainment of bachelor's degree or higher, with 99.6% or 279 individuals in the labor force. Within the labor force, individuals with college / associate degree education have the highest percentage of unemployment, with 1.0% or 4 of them being unemployed.
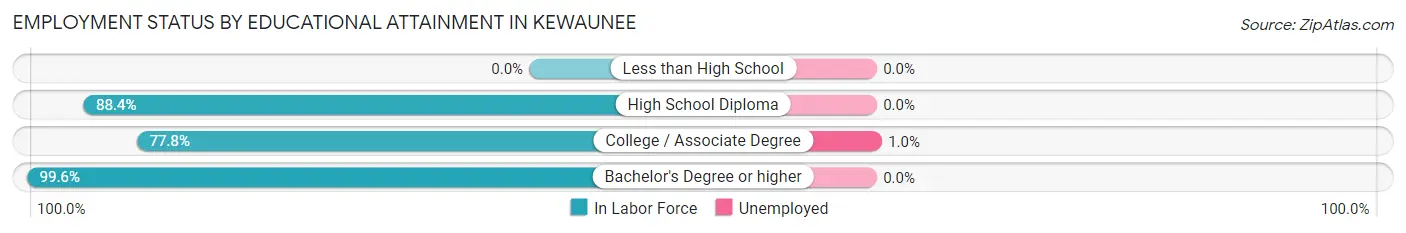
| Educational Attainment | In Labor Force | Unemployed |
| Less than High School | 0 (0.0%) | 0 (0.0%) |
| High School Diploma | 555 (88.4%) | 0 (0.0%) |
| College / Associate Degree | 421 (77.8%) | 5 (1.0%) |
| Bachelor's Degree or higher | 279 (99.6%) | 0 (0.0%) |
| Total | 1,255 (84.3%) | 4 (0.3%) |
Employment Occupations by Sex in Kewaunee
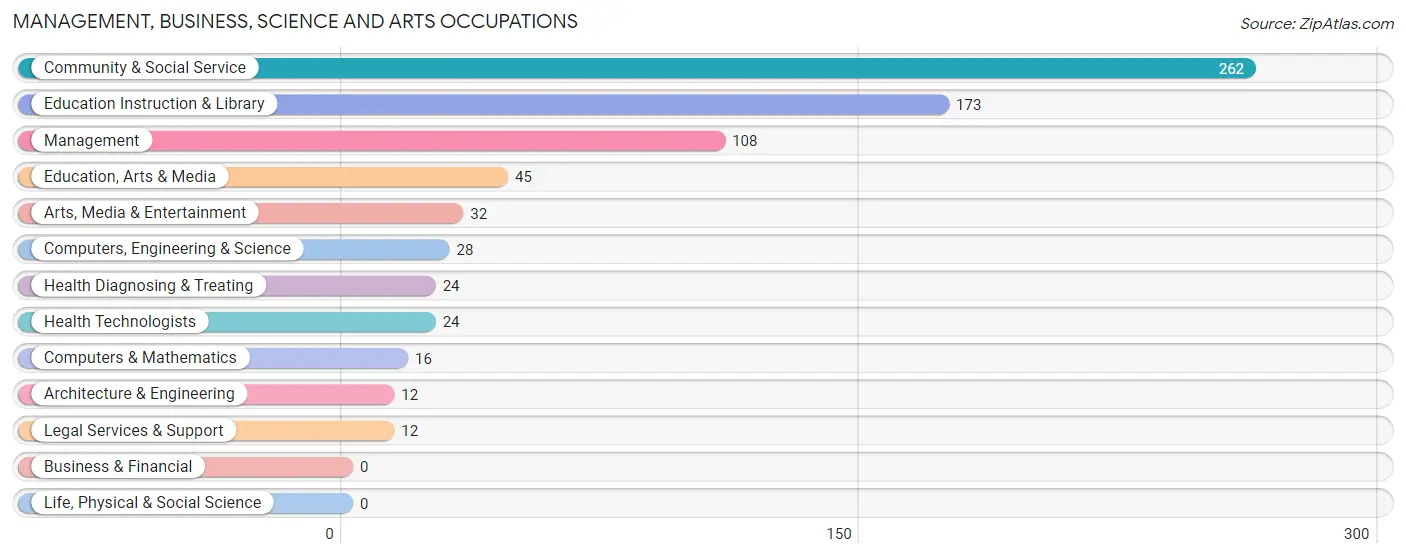
Management, Business, Science and Arts Occupations
The most common Management, Business, Science and Arts occupations in Kewaunee are Community & Social Service (262 | 16.9%), Education Instruction & Library (173 | 11.1%), Management (108 | 7.0%), Education, Arts & Media (45 | 2.9%), and Arts, Media & Entertainment (32 | 2.1%).
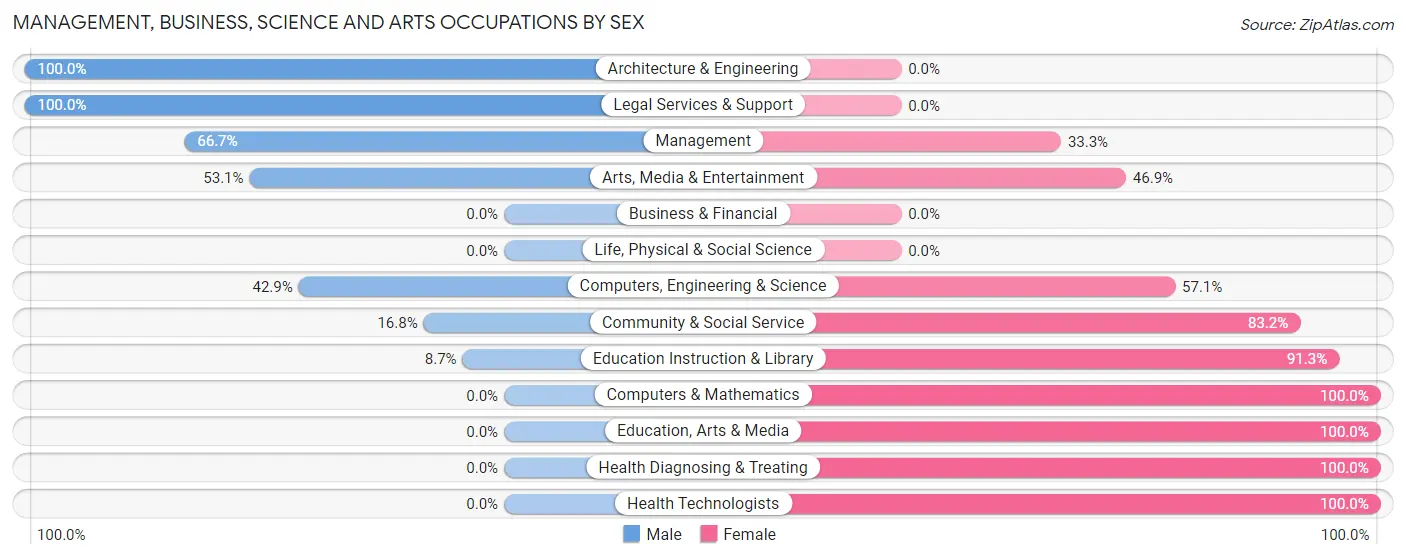
Management, Business, Science and Arts Occupations by Sex
Within the Management, Business, Science and Arts occupations in Kewaunee, the most male-oriented occupations are Architecture & Engineering (100.0%), Legal Services & Support (100.0%), and Management (66.7%), while the most female-oriented occupations are Computers & Mathematics (100.0%), Education, Arts & Media (100.0%), and Health Diagnosing & Treating (100.0%).
| Occupation | Male | Female |
| Management | 72 (66.7%) | 36 (33.3%) |
| Business & Financial | 0 (0.0%) | 0 (0.0%) |
| Computers, Engineering & Science | 12 (42.9%) | 16 (57.1%) |
| Computers & Mathematics | 0 (0.0%) | 16 (100.0%) |
| Architecture & Engineering | 12 (100.0%) | 0 (0.0%) |
| Life, Physical & Social Science | 0 (0.0%) | 0 (0.0%) |
| Community & Social Service | 44 (16.8%) | 218 (83.2%) |
| Education, Arts & Media | 0 (0.0%) | 45 (100.0%) |
| Legal Services & Support | 12 (100.0%) | 0 (0.0%) |
| Education Instruction & Library | 15 (8.7%) | 158 (91.3%) |
| Arts, Media & Entertainment | 17 (53.1%) | 15 (46.9%) |
| Health Diagnosing & Treating | 0 (0.0%) | 24 (100.0%) |
| Health Technologists | 0 (0.0%) | 24 (100.0%) |
| Total (Category) | 128 (30.3%) | 294 (69.7%) |
| Total (Overall) | 832 (53.6%) | 721 (46.4%) |
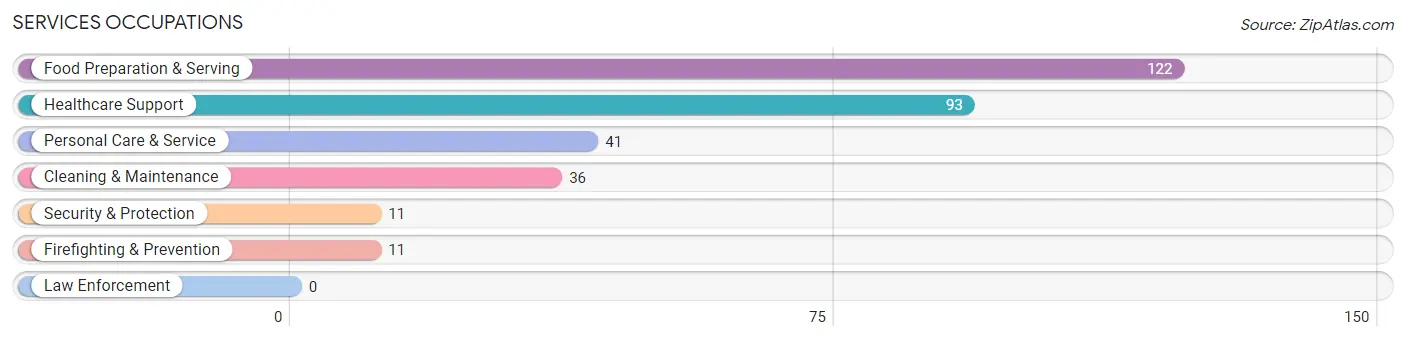
Services Occupations
The most common Services occupations in Kewaunee are Food Preparation & Serving (122 | 7.9%), Healthcare Support (93 | 6.0%), Personal Care & Service (41 | 2.6%), Cleaning & Maintenance (36 | 2.3%), and Security & Protection (11 | 0.7%).
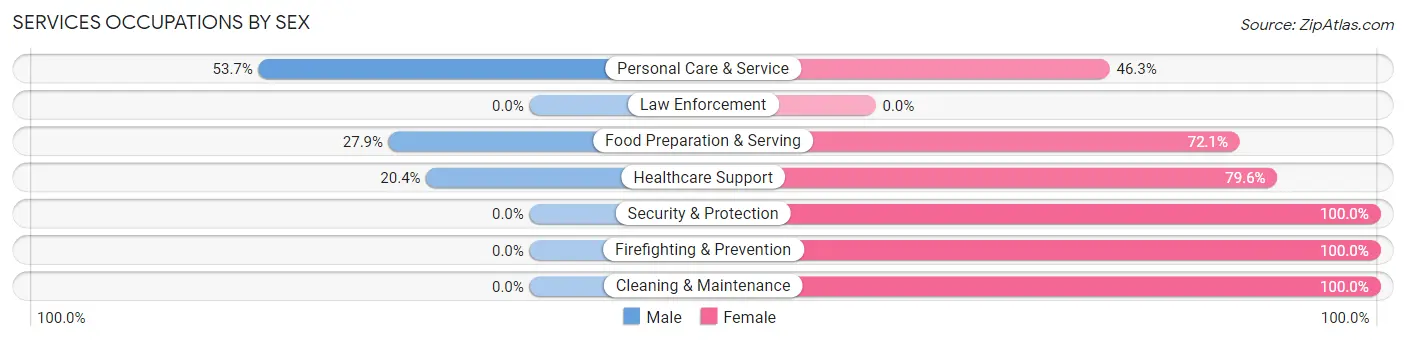
Services Occupations by Sex
Within the Services occupations in Kewaunee, the most male-oriented occupations are Personal Care & Service (53.7%), Food Preparation & Serving (27.9%), and Healthcare Support (20.4%), while the most female-oriented occupations are Security & Protection (100.0%), Firefighting & Prevention (100.0%), and Cleaning & Maintenance (100.0%).
| Occupation | Male | Female |
| Healthcare Support | 19 (20.4%) | 74 (79.6%) |
| Security & Protection | 0 (0.0%) | 11 (100.0%) |
| Firefighting & Prevention | 0 (0.0%) | 11 (100.0%) |
| Law Enforcement | 0 (0.0%) | 0 (0.0%) |
| Food Preparation & Serving | 34 (27.9%) | 88 (72.1%) |
| Cleaning & Maintenance | 0 (0.0%) | 36 (100.0%) |
| Personal Care & Service | 22 (53.7%) | 19 (46.3%) |
| Total (Category) | 75 (24.7%) | 228 (75.2%) |
| Total (Overall) | 832 (53.6%) | 721 (46.4%) |
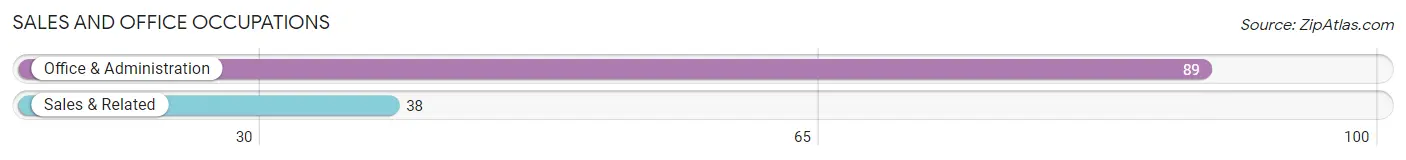
Sales and Office Occupations
The most common Sales and Office occupations in Kewaunee are Office & Administration (89 | 5.7%), and Sales & Related (38 | 2.5%).
Sales and Office Occupations by Sex
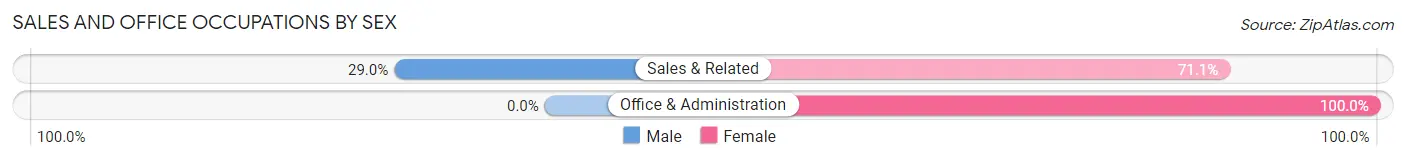
| Occupation | Male | Female |
| Sales & Related | 11 (28.9%) | 27 (71.1%) |
| Office & Administration | 0 (0.0%) | 89 (100.0%) |
| Total (Category) | 11 (8.7%) | 116 (91.3%) |
| Total (Overall) | 832 (53.6%) | 721 (46.4%) |
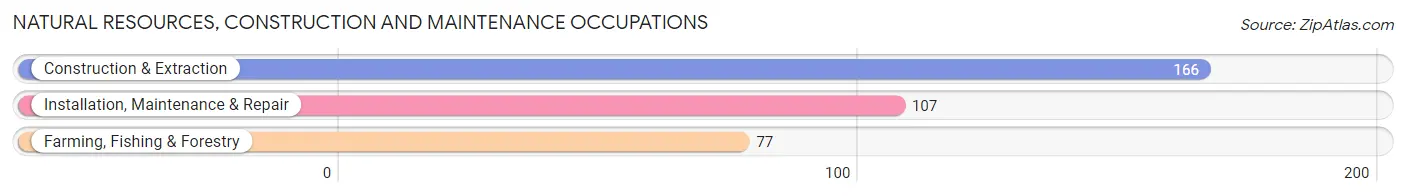
Natural Resources, Construction and Maintenance Occupations
The most common Natural Resources, Construction and Maintenance occupations in Kewaunee are Construction & Extraction (166 | 10.7%), Installation, Maintenance & Repair (107 | 6.9%), and Farming, Fishing & Forestry (77 | 5.0%).
Natural Resources, Construction and Maintenance Occupations by Sex
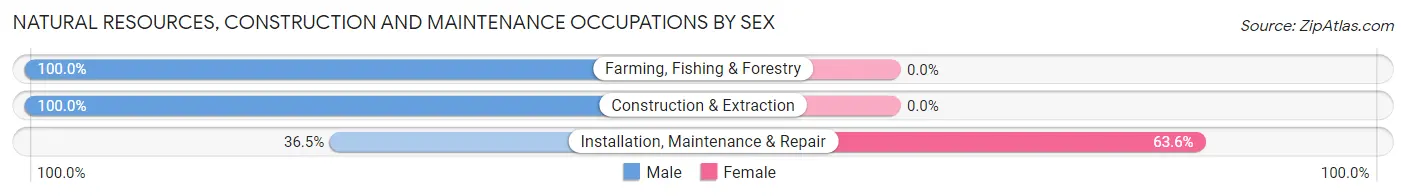
| Occupation | Male | Female |
| Farming, Fishing & Forestry | 77 (100.0%) | 0 (0.0%) |
| Construction & Extraction | 166 (100.0%) | 0 (0.0%) |
| Installation, Maintenance & Repair | 39 (36.4%) | 68 (63.5%) |
| Total (Category) | 282 (80.6%) | 68 (19.4%) |
| Total (Overall) | 832 (53.6%) | 721 (46.4%) |
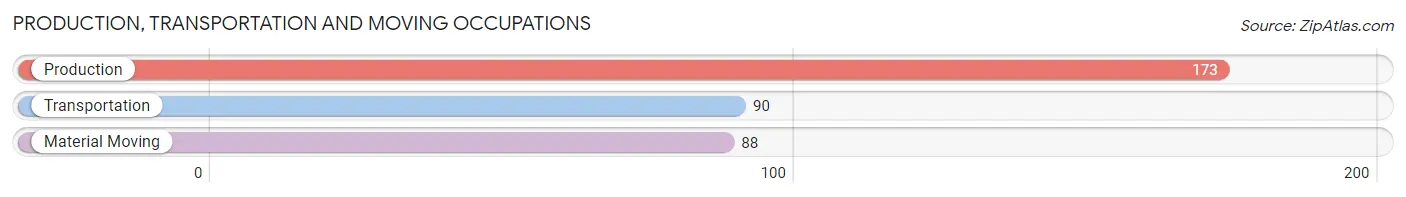
Production, Transportation and Moving Occupations
The most common Production, Transportation and Moving occupations in Kewaunee are Production (173 | 11.1%), Transportation (90 | 5.8%), and Material Moving (88 | 5.7%).
Production, Transportation and Moving Occupations by Sex
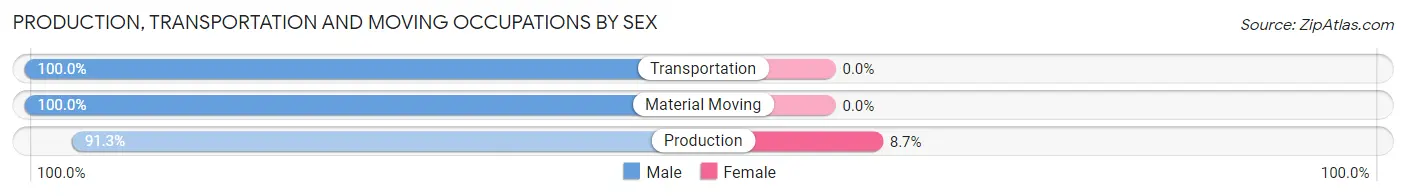
| Occupation | Male | Female |
| Production | 158 (91.3%) | 15 (8.7%) |
| Transportation | 90 (100.0%) | 0 (0.0%) |
| Material Moving | 88 (100.0%) | 0 (0.0%) |
| Total (Category) | 336 (95.7%) | 15 (4.3%) |
| Total (Overall) | 832 (53.6%) | 721 (46.4%) |
Employment Industries by Sex in Kewaunee
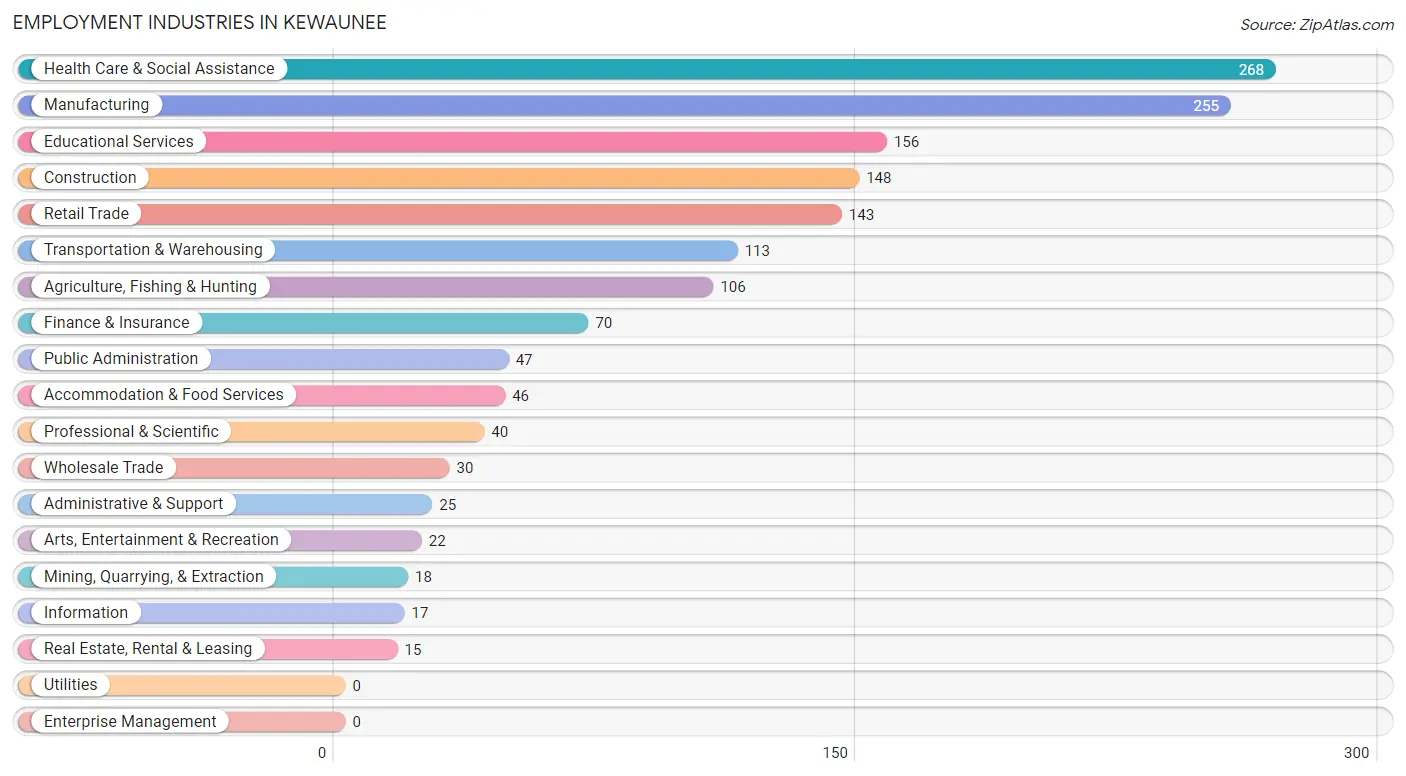
Employment Industries in Kewaunee
The major employment industries in Kewaunee include Health Care & Social Assistance (268 | 17.3%), Manufacturing (255 | 16.4%), Educational Services (156 | 10.1%), Construction (148 | 9.5%), and Retail Trade (143 | 9.2%).
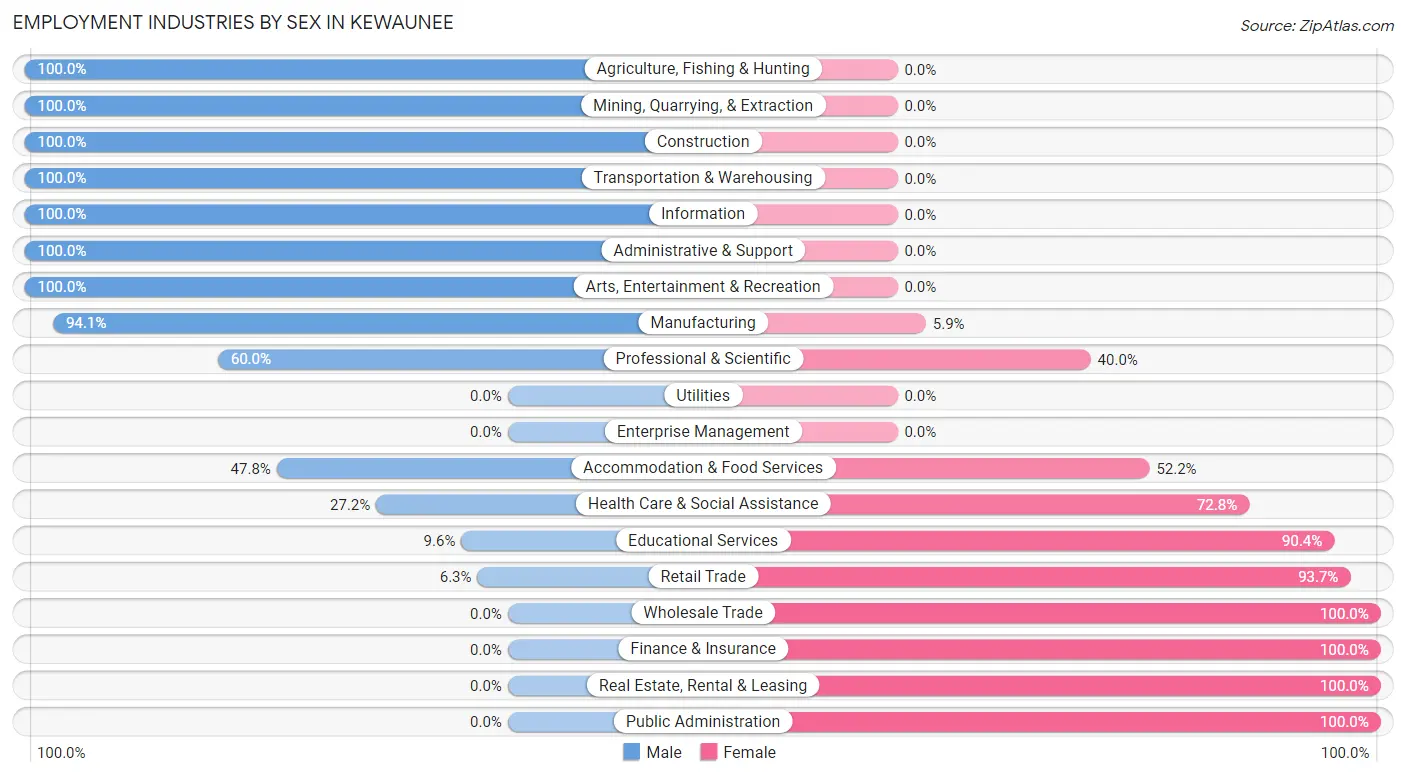
Employment Industries by Sex in Kewaunee
The Kewaunee industries that see more men than women are Agriculture, Fishing & Hunting (100.0%), Mining, Quarrying, & Extraction (100.0%), and Construction (100.0%), whereas the industries that tend to have a higher number of women are Wholesale Trade (100.0%), Finance & Insurance (100.0%), and Real Estate, Rental & Leasing (100.0%).
| Industry | Male | Female |
| Agriculture, Fishing & Hunting | 106 (100.0%) | 0 (0.0%) |
| Mining, Quarrying, & Extraction | 18 (100.0%) | 0 (0.0%) |
| Construction | 148 (100.0%) | 0 (0.0%) |
| Manufacturing | 240 (94.1%) | 15 (5.9%) |
| Wholesale Trade | 0 (0.0%) | 30 (100.0%) |
| Retail Trade | 9 (6.3%) | 134 (93.7%) |
| Transportation & Warehousing | 113 (100.0%) | 0 (0.0%) |
| Utilities | 0 (0.0%) | 0 (0.0%) |
| Information | 17 (100.0%) | 0 (0.0%) |
| Finance & Insurance | 0 (0.0%) | 70 (100.0%) |
| Real Estate, Rental & Leasing | 0 (0.0%) | 15 (100.0%) |
| Professional & Scientific | 24 (60.0%) | 16 (40.0%) |
| Enterprise Management | 0 (0.0%) | 0 (0.0%) |
| Administrative & Support | 25 (100.0%) | 0 (0.0%) |
| Educational Services | 15 (9.6%) | 141 (90.4%) |
| Health Care & Social Assistance | 73 (27.2%) | 195 (72.8%) |
| Arts, Entertainment & Recreation | 22 (100.0%) | 0 (0.0%) |
| Accommodation & Food Services | 22 (47.8%) | 24 (52.2%) |
| Public Administration | 0 (0.0%) | 47 (100.0%) |
| Total | 832 (53.6%) | 721 (46.4%) |
Education in Kewaunee
School Enrollment in Kewaunee
The most common levels of schooling among the 541 students in Kewaunee are high school (258 | 47.7%), middle school (134 | 24.8%), and elementary school (105 | 19.4%).
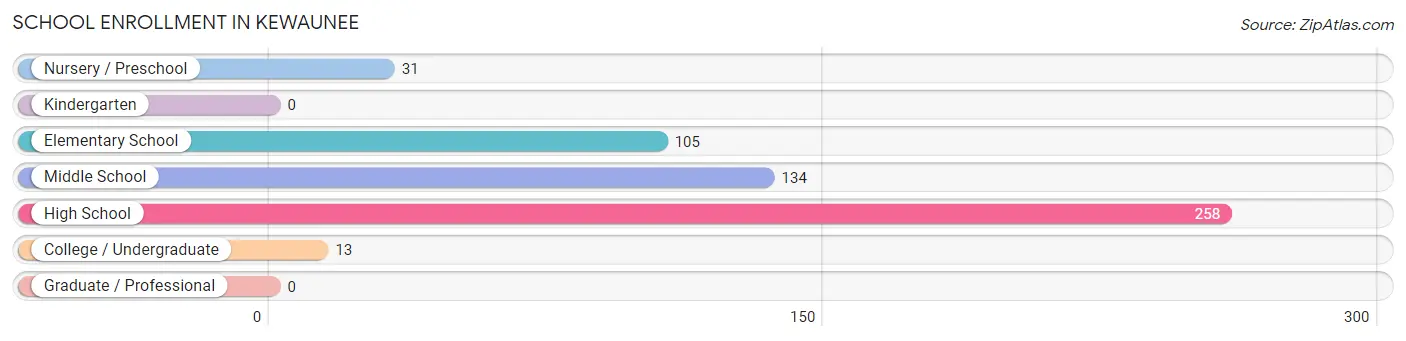
| School Level | # Students | % Students |
| Nursery / Preschool | 31 | 5.7% |
| Kindergarten | 0 | 0.0% |
| Elementary School | 105 | 19.4% |
| Middle School | 134 | 24.8% |
| High School | 258 | 47.7% |
| College / Undergraduate | 13 | 2.4% |
| Graduate / Professional | 0 | 0.0% |
| Total | 541 | 100.0% |
School Enrollment by Age by Funding Source in Kewaunee
Out of a total of 541 students who are enrolled in schools in Kewaunee, 144 (26.6%) attend a private institution, while the remaining 397 (73.4%) are enrolled in public schools. The age group of 20 to 24 year olds has the highest likelihood of being enrolled in private schools, with 13 (100.0% in the age bracket) enrolled. Conversely, the age group of 15 to 17 year olds has the lowest likelihood of being enrolled in a private school, with 138 (100.0% in the age bracket) attending a public institution.
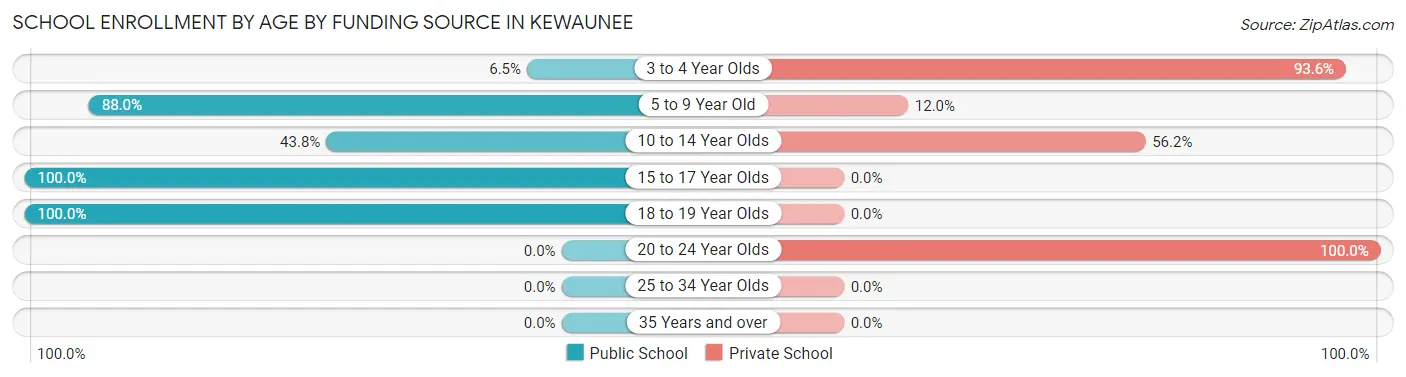
| Age Bracket | Public School | Private School |
| 3 to 4 Year Olds | 2 (6.5%) | 29 (93.5%) |
| 5 to 9 Year Old | 81 (88.0%) | 11 (12.0%) |
| 10 to 14 Year Olds | 71 (43.8%) | 91 (56.2%) |
| 15 to 17 Year Olds | 138 (100.0%) | 0 (0.0%) |
| 18 to 19 Year Olds | 105 (100.0%) | 0 (0.0%) |
| 20 to 24 Year Olds | 0 (0.0%) | 13 (100.0%) |
| 25 to 34 Year Olds | 0 (0.0%) | 0 (0.0%) |
| 35 Years and over | 0 (0.0%) | 0 (0.0%) |
| Total | 397 (73.4%) | 144 (26.6%) |
Educational Attainment by Field of Study in Kewaunee
Education (192 | 42.9%), arts & humanities (62 | 13.9%), business (36 | 8.1%), science & technology (30 | 6.7%), and liberal arts & history (29 | 6.5%) are the most common fields of study among 447 individuals in Kewaunee who have obtained a bachelor's degree or higher.
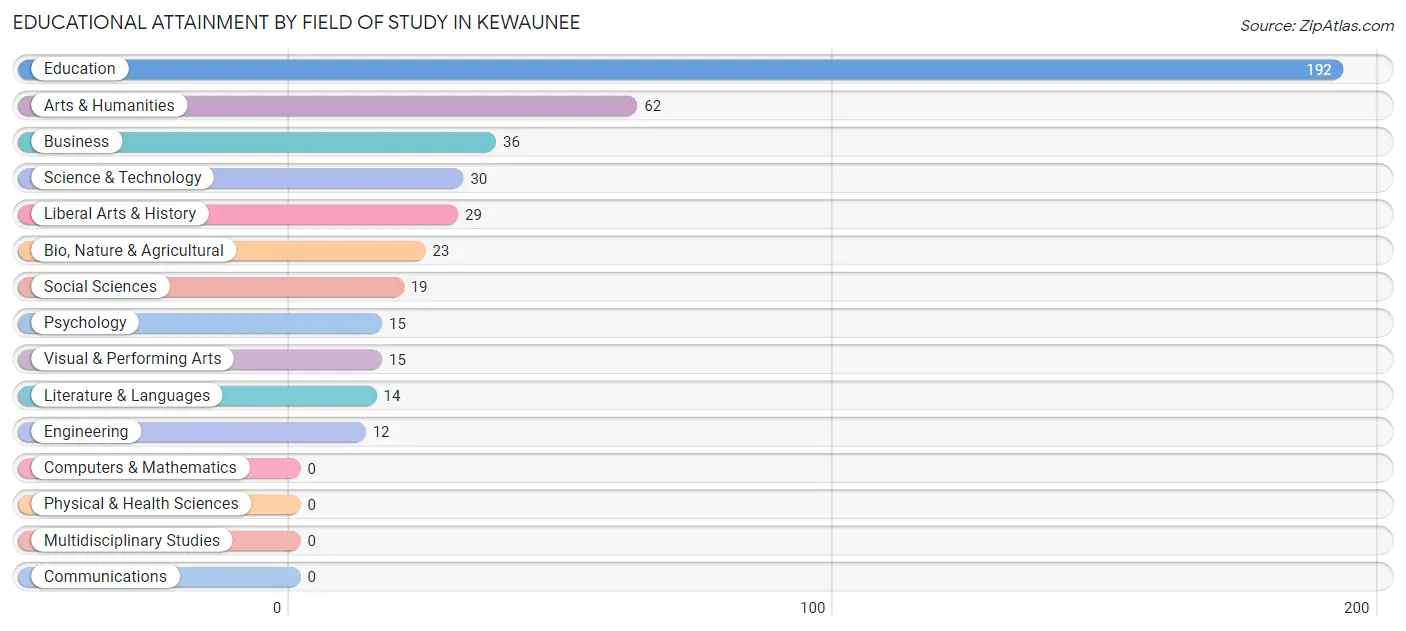
| Field of Study | # Graduates | % Graduates |
| Computers & Mathematics | 0 | 0.0% |
| Bio, Nature & Agricultural | 23 | 5.1% |
| Physical & Health Sciences | 0 | 0.0% |
| Psychology | 15 | 3.4% |
| Social Sciences | 19 | 4.3% |
| Engineering | 12 | 2.7% |
| Multidisciplinary Studies | 0 | 0.0% |
| Science & Technology | 30 | 6.7% |
| Business | 36 | 8.1% |
| Education | 192 | 42.9% |
| Literature & Languages | 14 | 3.1% |
| Liberal Arts & History | 29 | 6.5% |
| Visual & Performing Arts | 15 | 3.4% |
| Communications | 0 | 0.0% |
| Arts & Humanities | 62 | 13.9% |
| Total | 447 | 100.0% |
Transportation & Commute in Kewaunee
Vehicle Availability by Sex in Kewaunee
The most prevalent vehicle ownership categories in Kewaunee are males with 2 vehicles (428, accounting for 53.8%) and females with 2 vehicles (425, making up 59.4%).
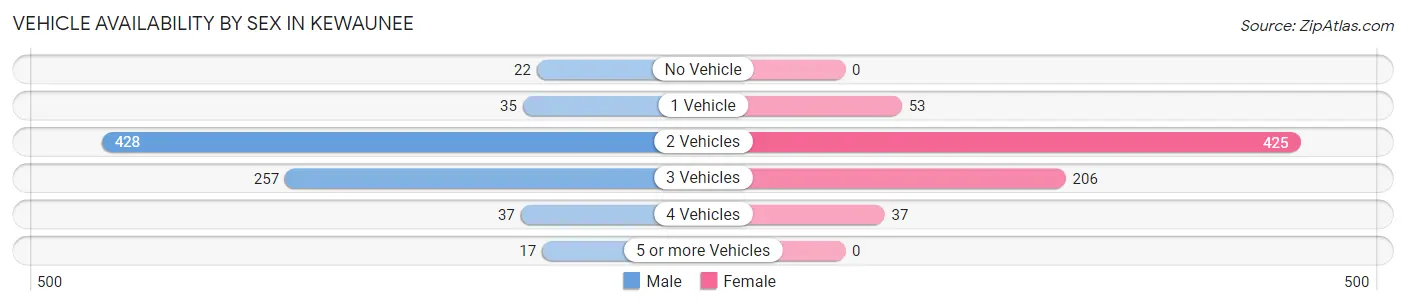
| Vehicles Available | Male | Female |
| No Vehicle | 22 (2.8%) | 0 (0.0%) |
| 1 Vehicle | 35 (4.4%) | 53 (7.3%) |
| 2 Vehicles | 428 (53.8%) | 425 (59.0%) |
| 3 Vehicles | 257 (32.3%) | 206 (28.6%) |
| 4 Vehicles | 37 (4.6%) | 37 (5.1%) |
| 5 or more Vehicles | 17 (2.1%) | 0 (0.0%) |
| Total | 796 (100.0%) | 721 (100.0%) |
Commute Time in Kewaunee
The most frequently occuring commute durations in Kewaunee are 5 to 9 minutes (307 commuters, 22.8%), less than 5 minutes (236 commuters, 17.5%), and 45 to 59 minutes (180 commuters, 13.4%).
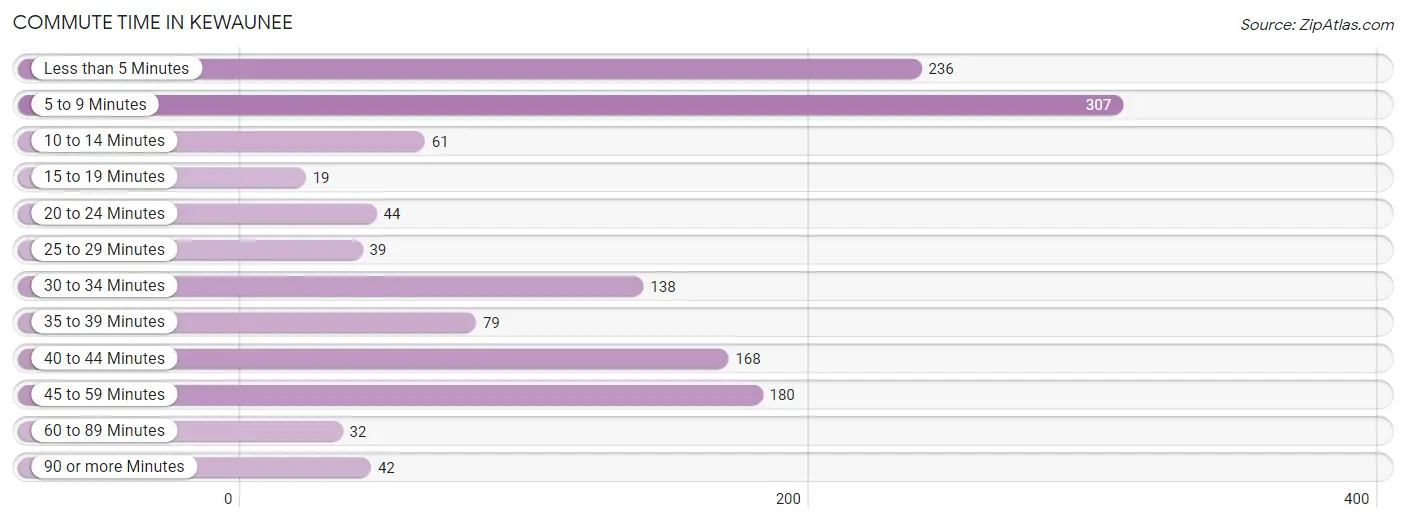
| Commute Time | # Commuters | % Commuters |
| Less than 5 Minutes | 236 | 17.5% |
| 5 to 9 Minutes | 307 | 22.8% |
| 10 to 14 Minutes | 61 | 4.5% |
| 15 to 19 Minutes | 19 | 1.4% |
| 20 to 24 Minutes | 44 | 3.3% |
| 25 to 29 Minutes | 39 | 2.9% |
| 30 to 34 Minutes | 138 | 10.3% |
| 35 to 39 Minutes | 79 | 5.9% |
| 40 to 44 Minutes | 168 | 12.5% |
| 45 to 59 Minutes | 180 | 13.4% |
| 60 to 89 Minutes | 32 | 2.4% |
| 90 or more Minutes | 42 | 3.1% |
Commute Time by Sex in Kewaunee
The most common commute times in Kewaunee are 40 to 44 minutes (168 commuters, 23.5%) for males and less than 5 minutes (192 commuters, 30.5%) for females.
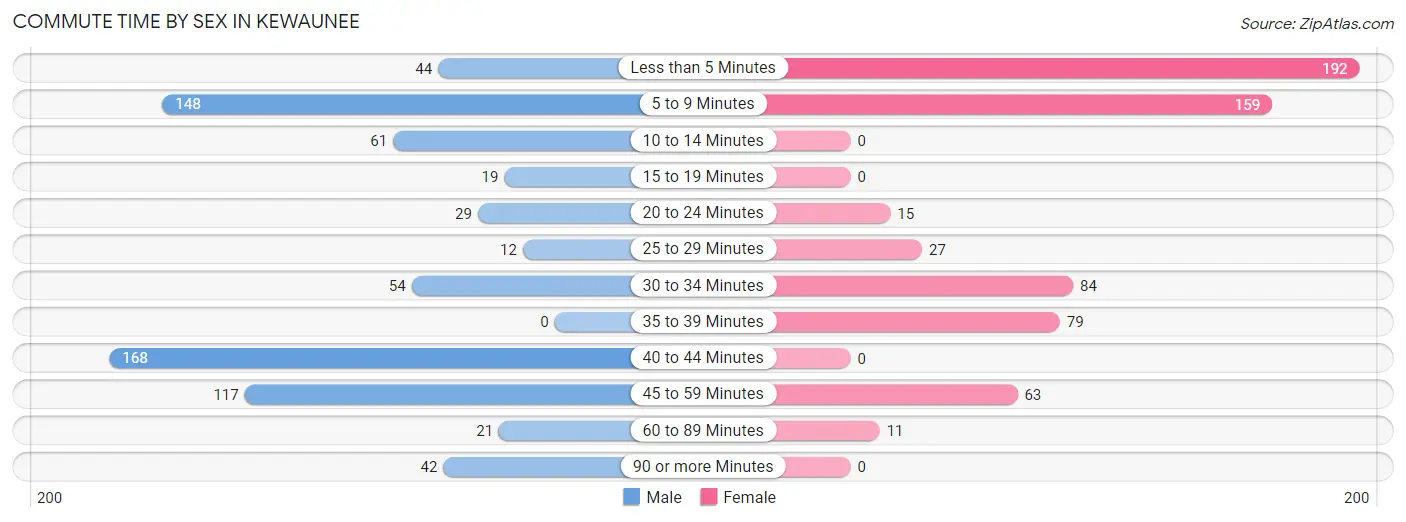
| Commute Time | Male | Female |
| Less than 5 Minutes | 44 (6.1%) | 192 (30.5%) |
| 5 to 9 Minutes | 148 (20.7%) | 159 (25.2%) |
| 10 to 14 Minutes | 61 (8.5%) | 0 (0.0%) |
| 15 to 19 Minutes | 19 (2.7%) | 0 (0.0%) |
| 20 to 24 Minutes | 29 (4.1%) | 15 (2.4%) |
| 25 to 29 Minutes | 12 (1.7%) | 27 (4.3%) |
| 30 to 34 Minutes | 54 (7.5%) | 84 (13.3%) |
| 35 to 39 Minutes | 0 (0.0%) | 79 (12.5%) |
| 40 to 44 Minutes | 168 (23.5%) | 0 (0.0%) |
| 45 to 59 Minutes | 117 (16.4%) | 63 (10.0%) |
| 60 to 89 Minutes | 21 (2.9%) | 11 (1.8%) |
| 90 or more Minutes | 42 (5.9%) | 0 (0.0%) |
Time of Departure to Work by Sex in Kewaunee
The most frequent times of departure to work in Kewaunee are 5:00 AM to 5:29 AM (172, 24.1%) for males and 7:00 AM to 7:29 AM (230, 36.5%) for females.
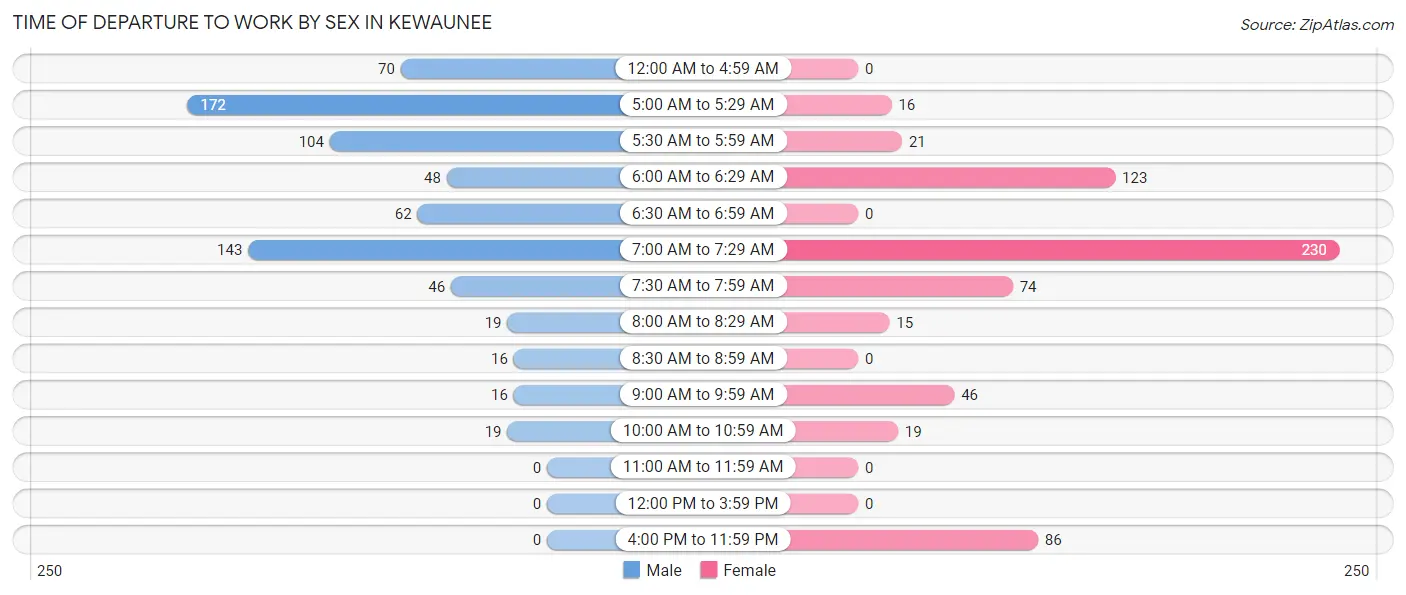
| Time of Departure | Male | Female |
| 12:00 AM to 4:59 AM | 70 (9.8%) | 0 (0.0%) |
| 5:00 AM to 5:29 AM | 172 (24.1%) | 16 (2.5%) |
| 5:30 AM to 5:59 AM | 104 (14.5%) | 21 (3.3%) |
| 6:00 AM to 6:29 AM | 48 (6.7%) | 123 (19.5%) |
| 6:30 AM to 6:59 AM | 62 (8.7%) | 0 (0.0%) |
| 7:00 AM to 7:29 AM | 143 (20.0%) | 230 (36.5%) |
| 7:30 AM to 7:59 AM | 46 (6.4%) | 74 (11.7%) |
| 8:00 AM to 8:29 AM | 19 (2.7%) | 15 (2.4%) |
| 8:30 AM to 8:59 AM | 16 (2.2%) | 0 (0.0%) |
| 9:00 AM to 9:59 AM | 16 (2.2%) | 46 (7.3%) |
| 10:00 AM to 10:59 AM | 19 (2.7%) | 19 (3.0%) |
| 11:00 AM to 11:59 AM | 0 (0.0%) | 0 (0.0%) |
| 12:00 PM to 3:59 PM | 0 (0.0%) | 0 (0.0%) |
| 4:00 PM to 11:59 PM | 0 (0.0%) | 86 (13.7%) |
| Total | 715 (100.0%) | 630 (100.0%) |
Housing Occupancy in Kewaunee
Occupancy by Ownership in Kewaunee
Of the total 1,320 dwellings in Kewaunee, owner-occupied units account for 1,081 (81.9%), while renter-occupied units make up 239 (18.1%).
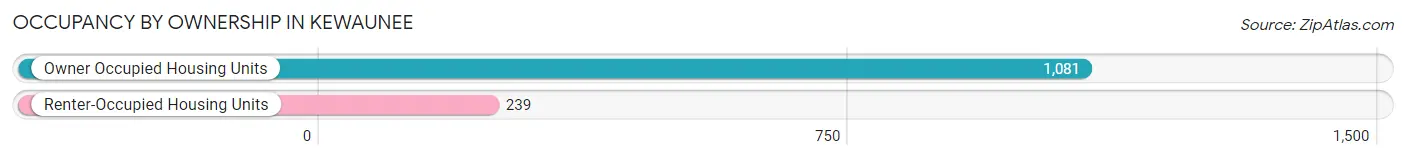
| Occupancy | # Housing Units | % Housing Units |
| Owner Occupied Housing Units | 1,081 | 81.9% |
| Renter-Occupied Housing Units | 239 | 18.1% |
| Total Occupied Housing Units | 1,320 | 100.0% |
Occupancy by Household Size in Kewaunee
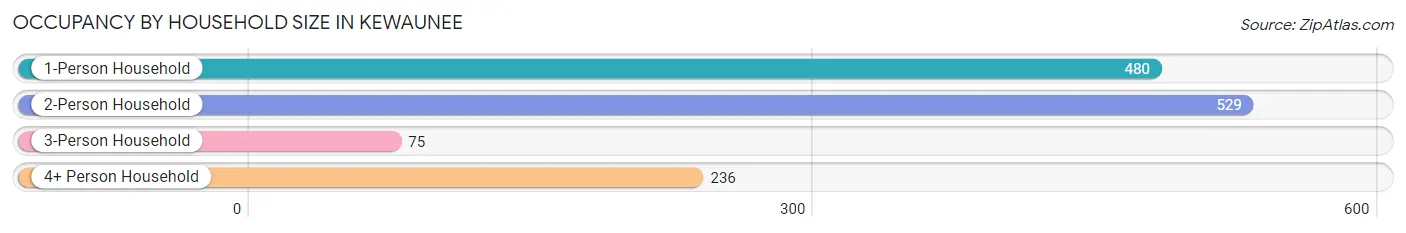
| Household Size | # Housing Units | % Housing Units |
| 1-Person Household | 480 | 36.4% |
| 2-Person Household | 529 | 40.1% |
| 3-Person Household | 75 | 5.7% |
| 4+ Person Household | 236 | 17.9% |
| Total Housing Units | 1,320 | 100.0% |
Occupancy by Ownership by Household Size in Kewaunee
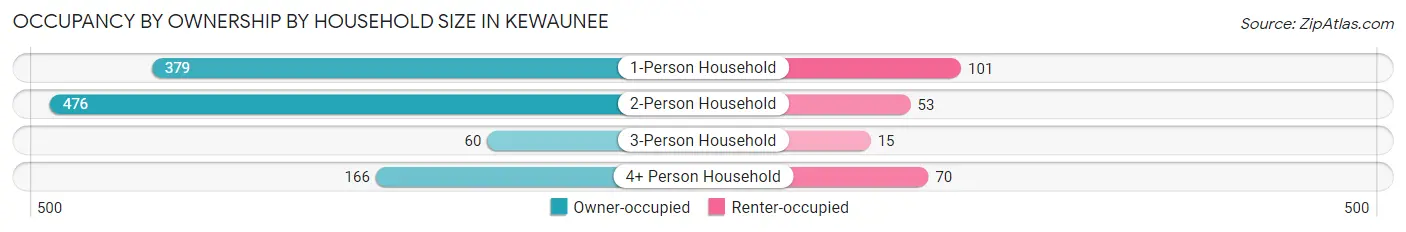
| Household Size | Owner-occupied | Renter-occupied |
| 1-Person Household | 379 (79.0%) | 101 (21.0%) |
| 2-Person Household | 476 (90.0%) | 53 (10.0%) |
| 3-Person Household | 60 (80.0%) | 15 (20.0%) |
| 4+ Person Household | 166 (70.3%) | 70 (29.7%) |
| Total Housing Units | 1,081 (81.9%) | 239 (18.1%) |
Occupancy by Educational Attainment in Kewaunee
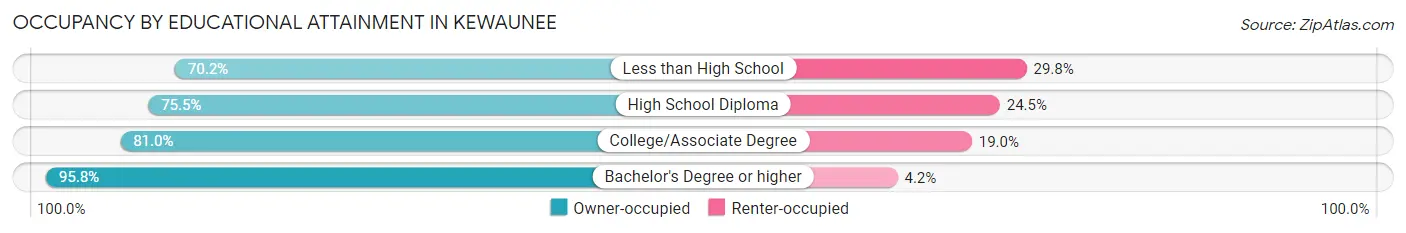
| Household Size | Owner-occupied | Renter-occupied |
| Less than High School | 73 (70.2%) | 31 (29.8%) |
| High School Diploma | 308 (75.5%) | 100 (24.5%) |
| College/Associate Degree | 406 (81.0%) | 95 (19.0%) |
| Bachelor's Degree or higher | 294 (95.8%) | 13 (4.2%) |
Occupancy by Age of Householder in Kewaunee
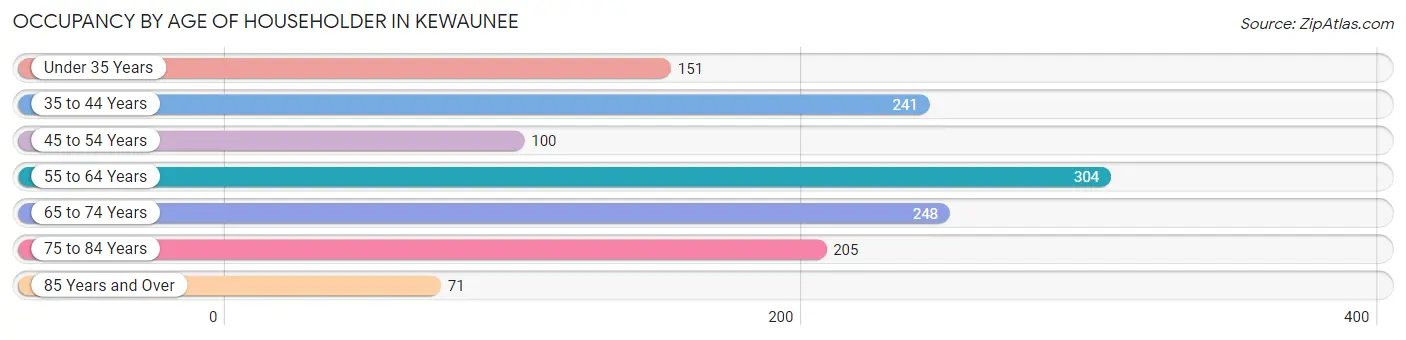
| Age Bracket | # Households | % Households |
| Under 35 Years | 151 | 11.4% |
| 35 to 44 Years | 241 | 18.3% |
| 45 to 54 Years | 100 | 7.6% |
| 55 to 64 Years | 304 | 23.0% |
| 65 to 74 Years | 248 | 18.8% |
| 75 to 84 Years | 205 | 15.5% |
| 85 Years and Over | 71 | 5.4% |
| Total | 1,320 | 100.0% |
Housing Finances in Kewaunee
Median Income by Occupancy in Kewaunee
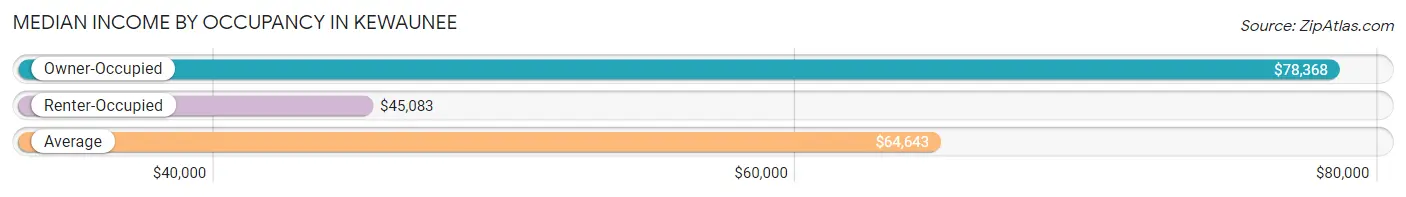
| Occupancy Type | # Households | Median Income |
| Owner-Occupied | 1,081 (81.9%) | $78,368 |
| Renter-Occupied | 239 (18.1%) | $45,083 |
| Average | 1,320 (100.0%) | $64,643 |
Occupancy by Householder Income Bracket in Kewaunee
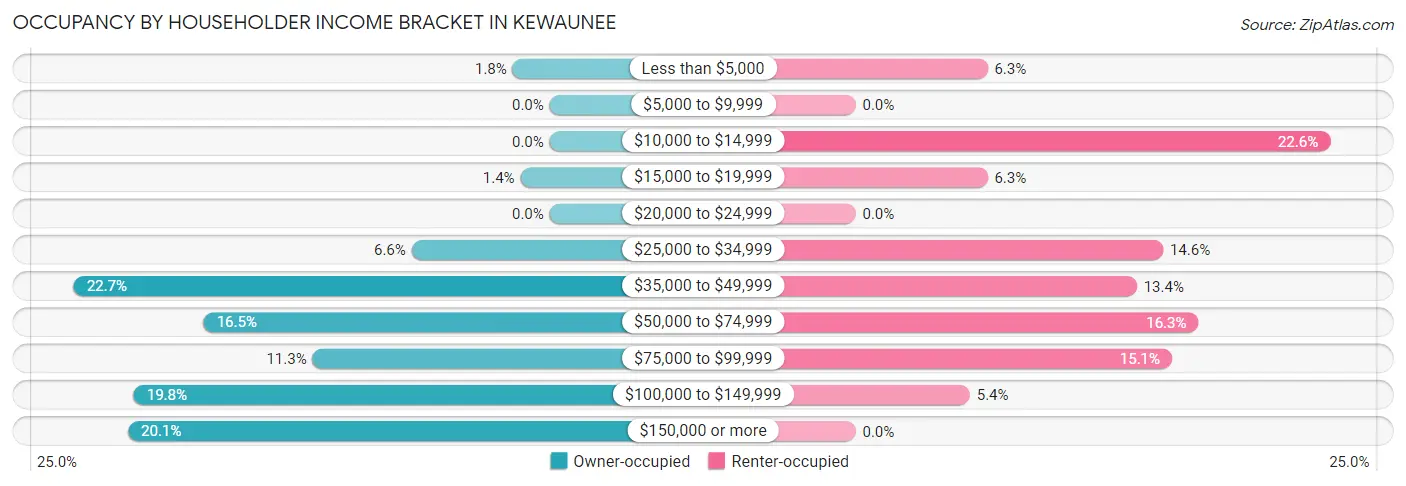
| Income Bracket | Owner-occupied | Renter-occupied |
| Less than $5,000 | 19 (1.8%) | 15 (6.3%) |
| $5,000 to $9,999 | 0 (0.0%) | 0 (0.0%) |
| $10,000 to $14,999 | 0 (0.0%) | 54 (22.6%) |
| $15,000 to $19,999 | 15 (1.4%) | 15 (6.3%) |
| $20,000 to $24,999 | 0 (0.0%) | 0 (0.0%) |
| $25,000 to $34,999 | 71 (6.6%) | 35 (14.6%) |
| $35,000 to $49,999 | 245 (22.7%) | 32 (13.4%) |
| $50,000 to $74,999 | 178 (16.5%) | 39 (16.3%) |
| $75,000 to $99,999 | 122 (11.3%) | 36 (15.1%) |
| $100,000 to $149,999 | 214 (19.8%) | 13 (5.4%) |
| $150,000 or more | 217 (20.1%) | 0 (0.0%) |
| Total | 1,081 (100.0%) | 239 (100.0%) |
Monthly Housing Cost Tiers in Kewaunee
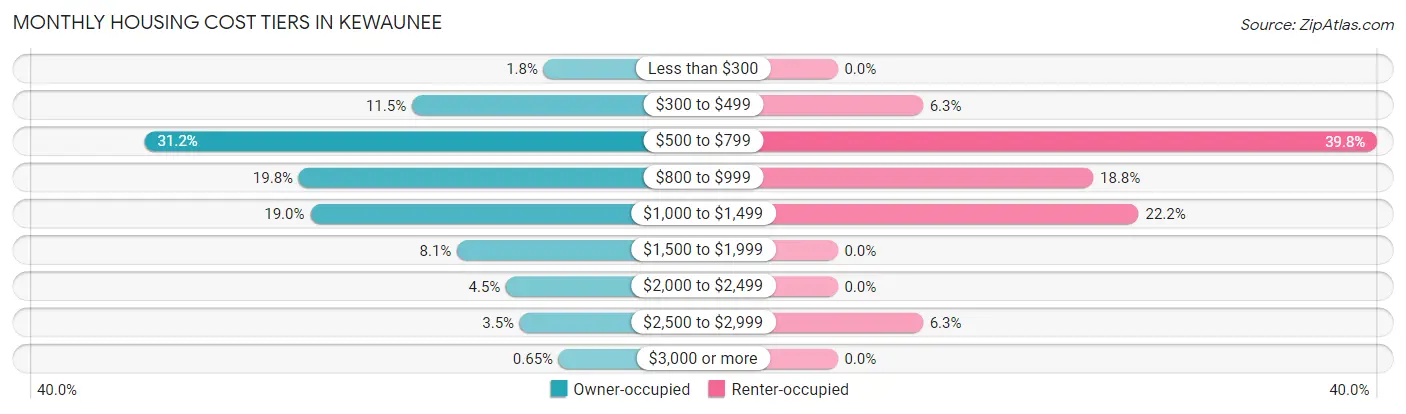
| Monthly Cost | Owner-occupied | Renter-occupied |
| Less than $300 | 19 (1.8%) | 0 (0.0%) |
| $300 to $499 | 124 (11.5%) | 15 (6.3%) |
| $500 to $799 | 337 (31.2%) | 95 (39.8%) |
| $800 to $999 | 214 (19.8%) | 45 (18.8%) |
| $1,000 to $1,499 | 205 (19.0%) | 53 (22.2%) |
| $1,500 to $1,999 | 88 (8.1%) | 0 (0.0%) |
| $2,000 to $2,499 | 49 (4.5%) | 0 (0.0%) |
| $2,500 to $2,999 | 38 (3.5%) | 15 (6.3%) |
| $3,000 or more | 7 (0.6%) | 0 (0.0%) |
| Total | 1,081 (100.0%) | 239 (100.0%) |
Physical Housing Characteristics in Kewaunee
Housing Structures in Kewaunee
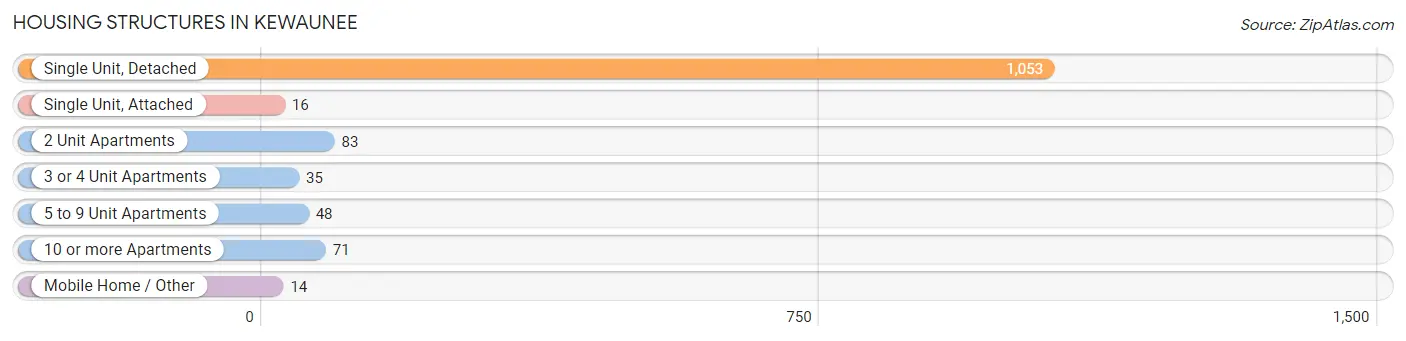
| Structure Type | # Housing Units | % Housing Units |
| Single Unit, Detached | 1,053 | 79.8% |
| Single Unit, Attached | 16 | 1.2% |
| 2 Unit Apartments | 83 | 6.3% |
| 3 or 4 Unit Apartments | 35 | 2.6% |
| 5 to 9 Unit Apartments | 48 | 3.6% |
| 10 or more Apartments | 71 | 5.4% |
| Mobile Home / Other | 14 | 1.1% |
| Total | 1,320 | 100.0% |
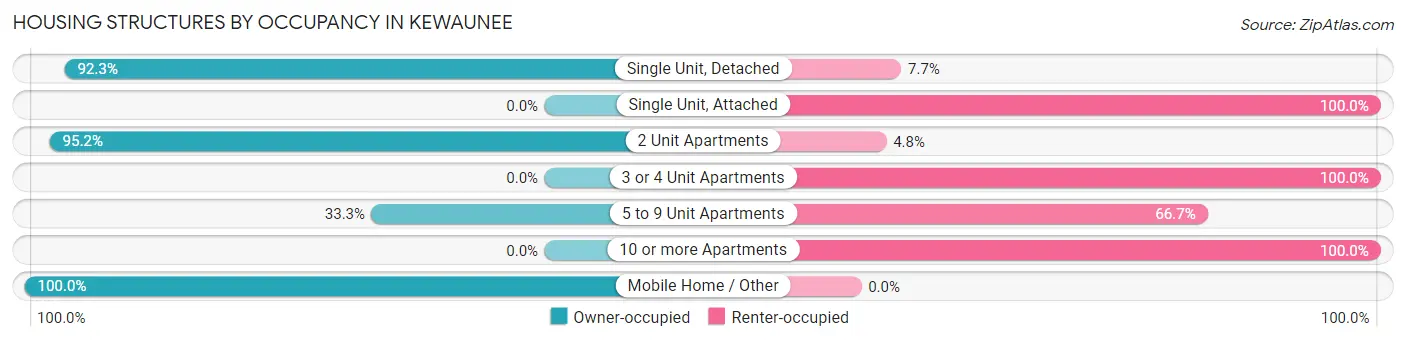
Housing Structures by Occupancy in Kewaunee
| Structure Type | Owner-occupied | Renter-occupied |
| Single Unit, Detached | 972 (92.3%) | 81 (7.7%) |
| Single Unit, Attached | 0 (0.0%) | 16 (100.0%) |
| 2 Unit Apartments | 79 (95.2%) | 4 (4.8%) |
| 3 or 4 Unit Apartments | 0 (0.0%) | 35 (100.0%) |
| 5 to 9 Unit Apartments | 16 (33.3%) | 32 (66.7%) |
| 10 or more Apartments | 0 (0.0%) | 71 (100.0%) |
| Mobile Home / Other | 14 (100.0%) | 0 (0.0%) |
| Total | 1,081 (81.9%) | 239 (18.1%) |
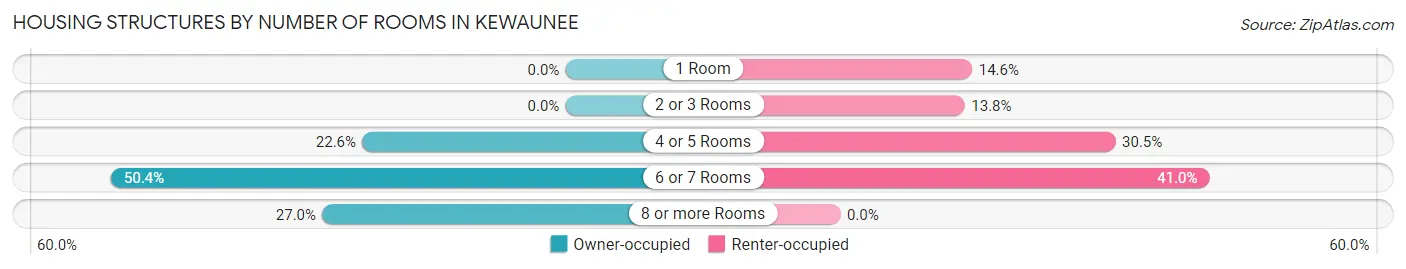
Housing Structures by Number of Rooms in Kewaunee
| Number of Rooms | Owner-occupied | Renter-occupied |
| 1 Room | 0 (0.0%) | 35 (14.6%) |
| 2 or 3 Rooms | 0 (0.0%) | 33 (13.8%) |
| 4 or 5 Rooms | 244 (22.6%) | 73 (30.5%) |
| 6 or 7 Rooms | 545 (50.4%) | 98 (41.0%) |
| 8 or more Rooms | 292 (27.0%) | 0 (0.0%) |
| Total | 1,081 (100.0%) | 239 (100.0%) |
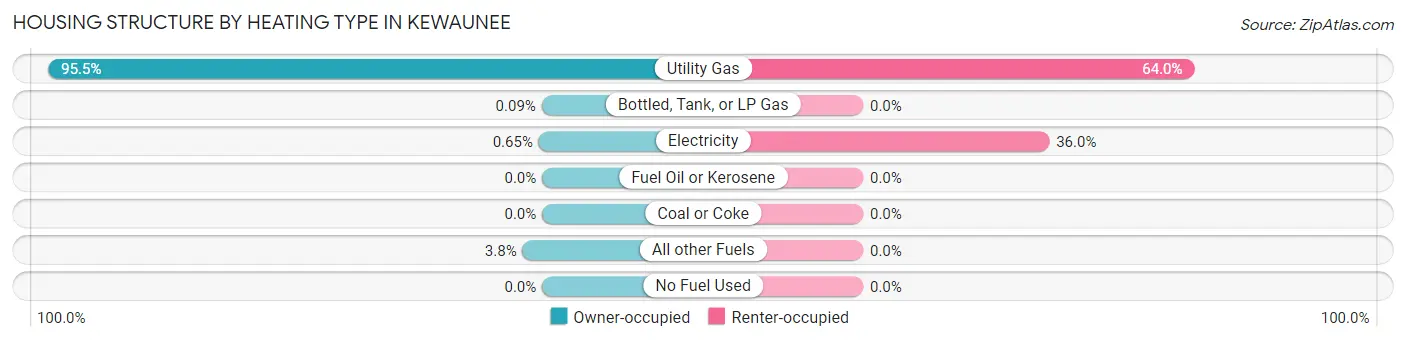
Housing Structure by Heating Type in Kewaunee
| Heating Type | Owner-occupied | Renter-occupied |
| Utility Gas | 1,032 (95.5%) | 153 (64.0%) |
| Bottled, Tank, or LP Gas | 1 (0.1%) | 0 (0.0%) |
| Electricity | 7 (0.6%) | 86 (36.0%) |
| Fuel Oil or Kerosene | 0 (0.0%) | 0 (0.0%) |
| Coal or Coke | 0 (0.0%) | 0 (0.0%) |
| All other Fuels | 41 (3.8%) | 0 (0.0%) |
| No Fuel Used | 0 (0.0%) | 0 (0.0%) |
| Total | 1,081 (100.0%) | 239 (100.0%) |
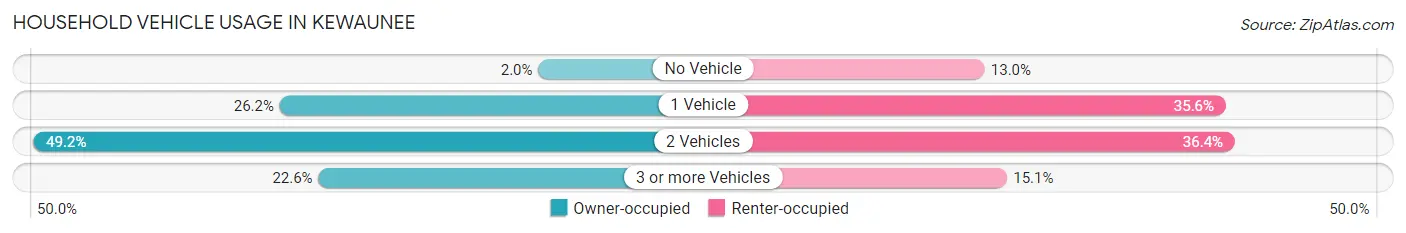
Household Vehicle Usage in Kewaunee
| Vehicles per Household | Owner-occupied | Renter-occupied |
| No Vehicle | 22 (2.0%) | 31 (13.0%) |
| 1 Vehicle | 283 (26.2%) | 85 (35.6%) |
| 2 Vehicles | 532 (49.2%) | 87 (36.4%) |
| 3 or more Vehicles | 244 (22.6%) | 36 (15.1%) |
| Total | 1,081 (100.0%) | 239 (100.0%) |
Real Estate & Mortgages in Kewaunee
Real Estate and Mortgage Overview in Kewaunee
| Characteristic | Without Mortgage | With Mortgage |
| Housing Units | 396 | 685 |
| Median Property Value | $89,000 | $138,100 |
| Median Household Income | $48,385 | $199 |
| Monthly Housing Costs | $539 | $7 |
| Real Estate Taxes | $2,353 | $0 |
Property Value by Mortgage Status in Kewaunee
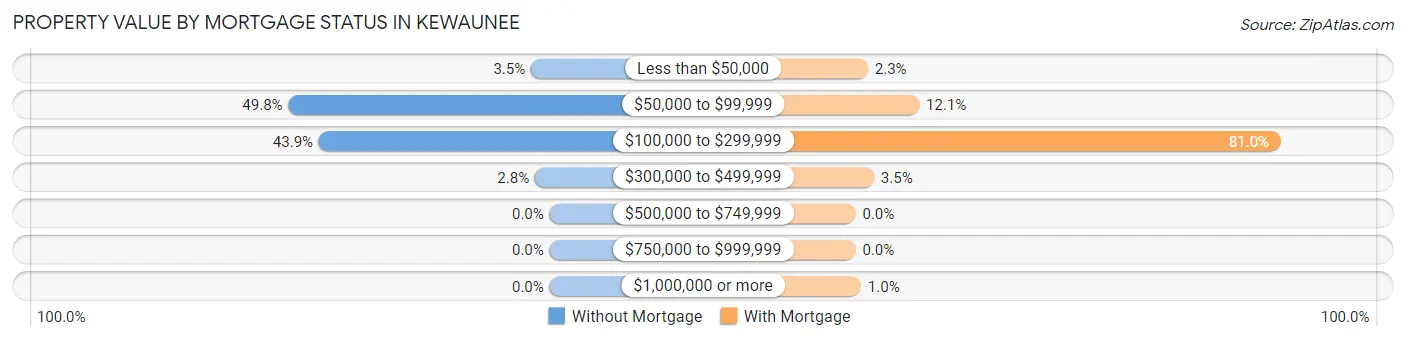
| Property Value | Without Mortgage | With Mortgage |
| Less than $50,000 | 14 (3.5%) | 16 (2.3%) |
| $50,000 to $99,999 | 197 (49.7%) | 83 (12.1%) |
| $100,000 to $299,999 | 174 (43.9%) | 555 (81.0%) |
| $300,000 to $499,999 | 11 (2.8%) | 24 (3.5%) |
| $500,000 to $749,999 | 0 (0.0%) | 0 (0.0%) |
| $750,000 to $999,999 | 0 (0.0%) | 0 (0.0%) |
| $1,000,000 or more | 0 (0.0%) | 7 (1.0%) |
| Total | 396 (100.0%) | 685 (100.0%) |
Household Income by Mortgage Status in Kewaunee
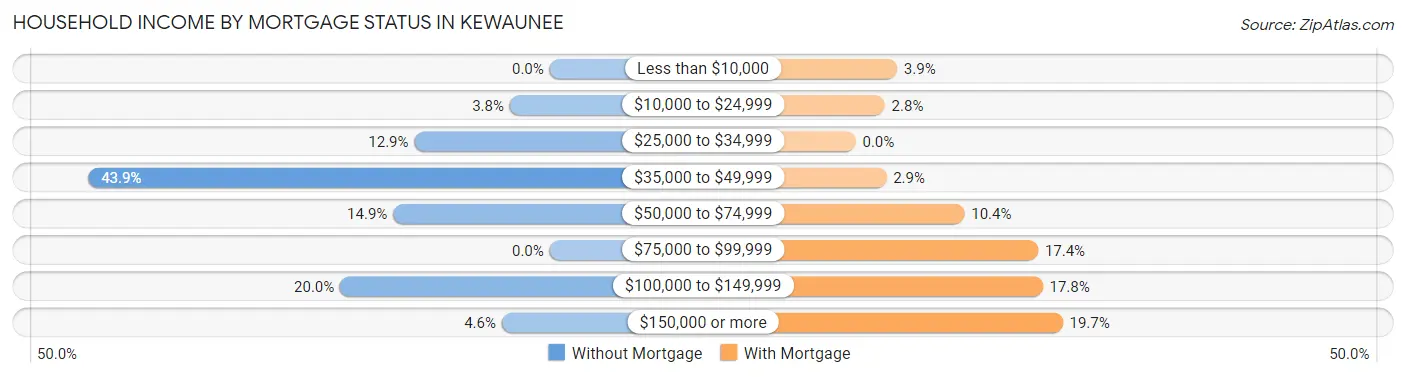
| Household Income | Without Mortgage | With Mortgage |
| Less than $10,000 | 0 (0.0%) | 27 (3.9%) |
| $10,000 to $24,999 | 15 (3.8%) | 19 (2.8%) |
| $25,000 to $34,999 | 51 (12.9%) | 0 (0.0%) |
| $35,000 to $49,999 | 174 (43.9%) | 20 (2.9%) |
| $50,000 to $74,999 | 59 (14.9%) | 71 (10.4%) |
| $75,000 to $99,999 | 0 (0.0%) | 119 (17.4%) |
| $100,000 to $149,999 | 79 (20.0%) | 122 (17.8%) |
| $150,000 or more | 18 (4.5%) | 135 (19.7%) |
| Total | 396 (100.0%) | 685 (100.0%) |
Property Value to Household Income Ratio in Kewaunee
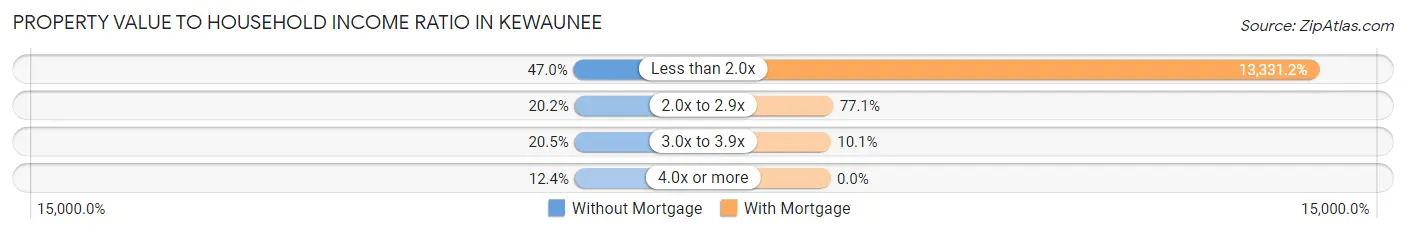
| Value-to-Income Ratio | Without Mortgage | With Mortgage |
| Less than 2.0x | 186 (47.0%) | 91,319 (13,331.2%) |
| 2.0x to 2.9x | 80 (20.2%) | 528 (77.1%) |
| 3.0x to 3.9x | 81 (20.4%) | 69 (10.1%) |
| 4.0x or more | 49 (12.4%) | 0 (0.0%) |
| Total | 396 (100.0%) | 685 (100.0%) |
Real Estate Taxes by Mortgage Status in Kewaunee
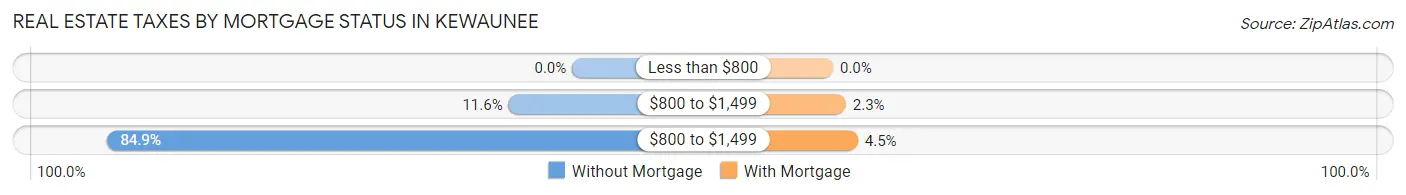
| Property Taxes | Without Mortgage | With Mortgage |
| Less than $800 | 0 (0.0%) | 0 (0.0%) |
| $800 to $1,499 | 46 (11.6%) | 16 (2.3%) |
| $800 to $1,499 | 336 (84.9%) | 31 (4.5%) |
| Total | 396 (100.0%) | 685 (100.0%) |
Health & Disability in Kewaunee
Health Insurance Coverage by Age in Kewaunee
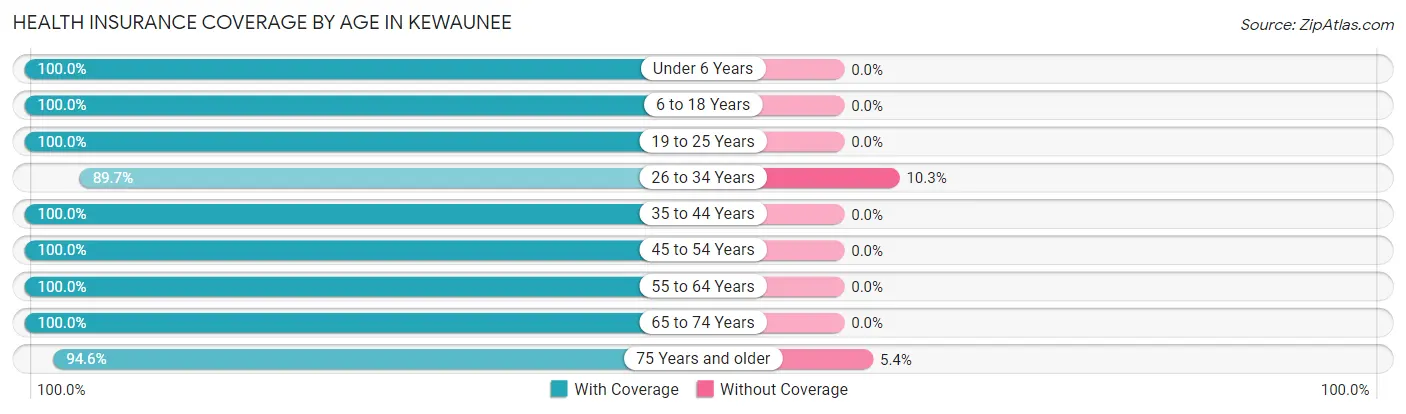
| Age Bracket | With Coverage | Without Coverage |
| Under 6 Years | 73 (100.0%) | 0 (0.0%) |
| 6 to 18 Years | 483 (100.0%) | 0 (0.0%) |
| 19 to 25 Years | 49 (100.0%) | 0 (0.0%) |
| 26 to 34 Years | 305 (89.7%) | 35 (10.3%) |
| 35 to 44 Years | 410 (100.0%) | 0 (0.0%) |
| 45 to 54 Years | 217 (100.0%) | 0 (0.0%) |
| 55 to 64 Years | 498 (100.0%) | 0 (0.0%) |
| 65 to 74 Years | 344 (100.0%) | 0 (0.0%) |
| 75 Years and older | 318 (94.6%) | 18 (5.4%) |
| Total | 2,697 (98.1%) | 53 (1.9%) |
Health Insurance Coverage by Citizenship Status in Kewaunee
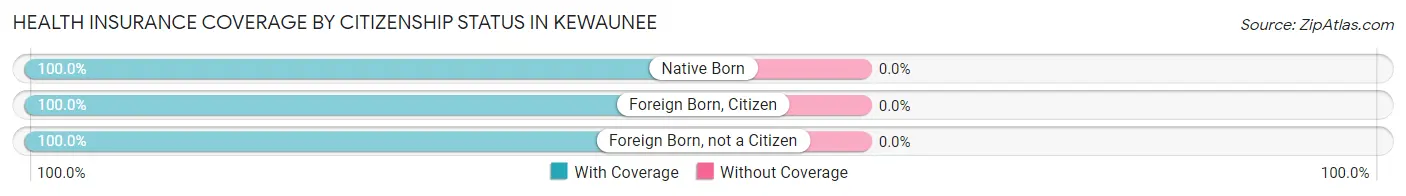
| Citizenship Status | With Coverage | Without Coverage |
| Native Born | 73 (100.0%) | 0 (0.0%) |
| Foreign Born, Citizen | 483 (100.0%) | 0 (0.0%) |
| Foreign Born, not a Citizen | 49 (100.0%) | 0 (0.0%) |
Health Insurance Coverage by Household Income in Kewaunee
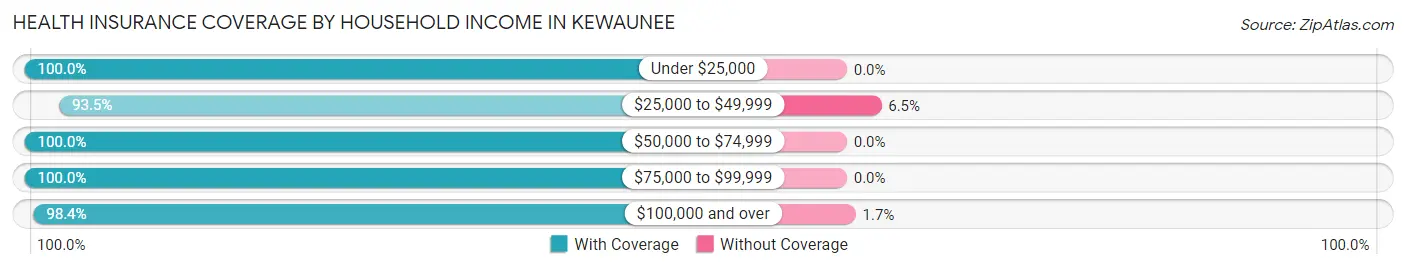
| Household Income | With Coverage | Without Coverage |
| Under $25,000 | 192 (100.0%) | 0 (0.0%) |
| $25,000 to $49,999 | 507 (93.5%) | 35 (6.5%) |
| $50,000 to $74,999 | 352 (100.0%) | 0 (0.0%) |
| $75,000 to $99,999 | 551 (100.0%) | 0 (0.0%) |
| $100,000 and over | 1,076 (98.4%) | 18 (1.7%) |
Public vs Private Health Insurance Coverage by Age in Kewaunee
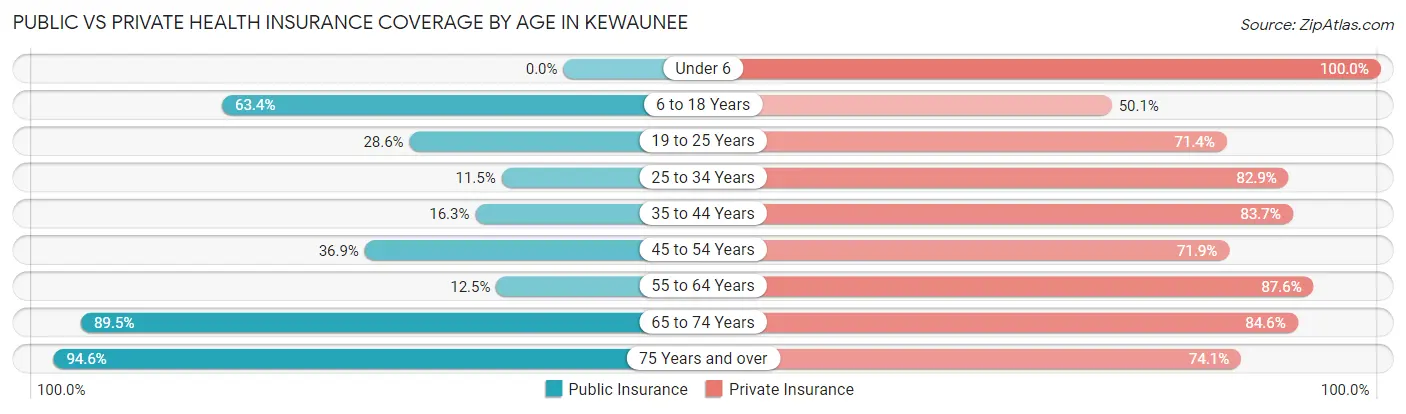
| Age Bracket | Public Insurance | Private Insurance |
| Under 6 | 0 (0.0%) | 73 (100.0%) |
| 6 to 18 Years | 306 (63.3%) | 242 (50.1%) |
| 19 to 25 Years | 14 (28.6%) | 35 (71.4%) |
| 25 to 34 Years | 39 (11.5%) | 282 (82.9%) |
| 35 to 44 Years | 67 (16.3%) | 343 (83.7%) |
| 45 to 54 Years | 80 (36.9%) | 156 (71.9%) |
| 55 to 64 Years | 62 (12.4%) | 436 (87.5%) |
| 65 to 74 Years | 308 (89.5%) | 291 (84.6%) |
| 75 Years and over | 318 (94.6%) | 249 (74.1%) |
| Total | 1,194 (43.4%) | 2,107 (76.6%) |
Disability Status by Sex by Age in Kewaunee
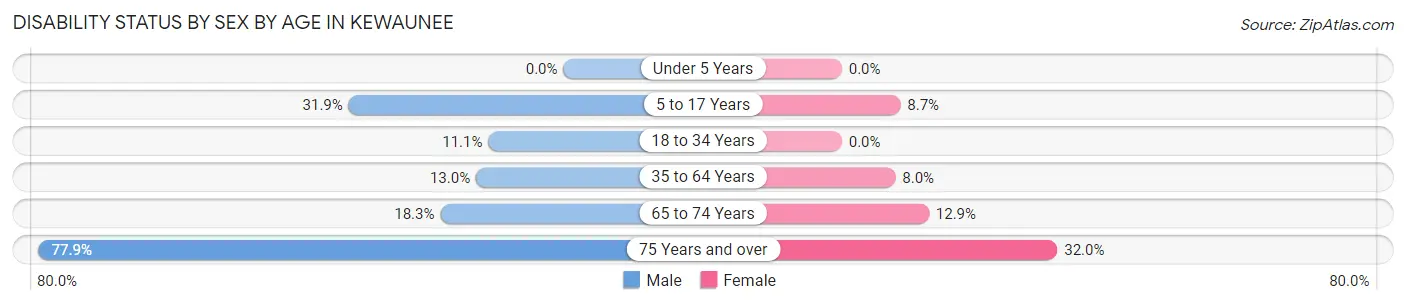
| Age Bracket | Male | Female |
| Under 5 Years | 0 (0.0%) | 0 (0.0%) |
| 5 to 17 Years | 59 (31.9%) | 18 (8.7%) |
| 18 to 34 Years | 37 (11.1%) | 0 (0.0%) |
| 35 to 64 Years | 66 (13.0%) | 49 (8.0%) |
| 65 to 74 Years | 36 (18.3%) | 19 (12.9%) |
| 75 Years and over | 67 (77.9%) | 80 (32.0%) |
Disability Class by Sex by Age in Kewaunee
Disability Class: Hearing Difficulty
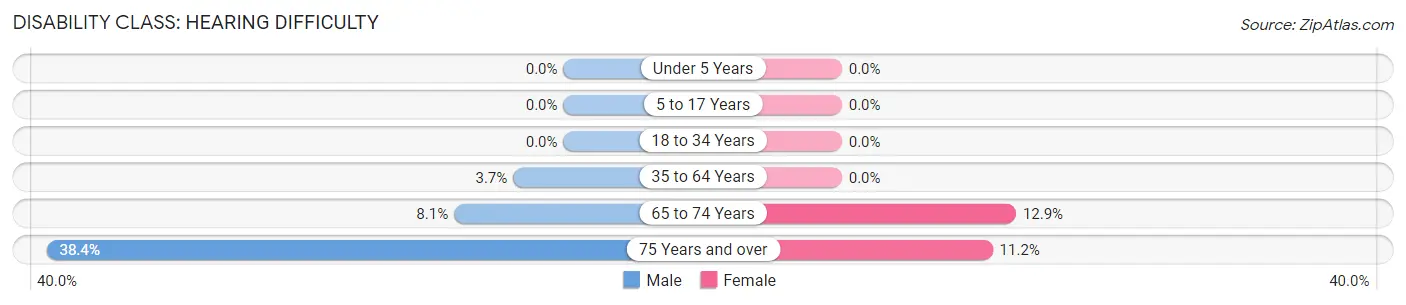
| Age Bracket | Male | Female |
| Under 5 Years | 0 (0.0%) | 0 (0.0%) |
| 5 to 17 Years | 0 (0.0%) | 0 (0.0%) |
| 18 to 34 Years | 0 (0.0%) | 0 (0.0%) |
| 35 to 64 Years | 19 (3.7%) | 0 (0.0%) |
| 65 to 74 Years | 16 (8.1%) | 19 (12.9%) |
| 75 Years and over | 33 (38.4%) | 28 (11.2%) |
Disability Class: Vision Difficulty
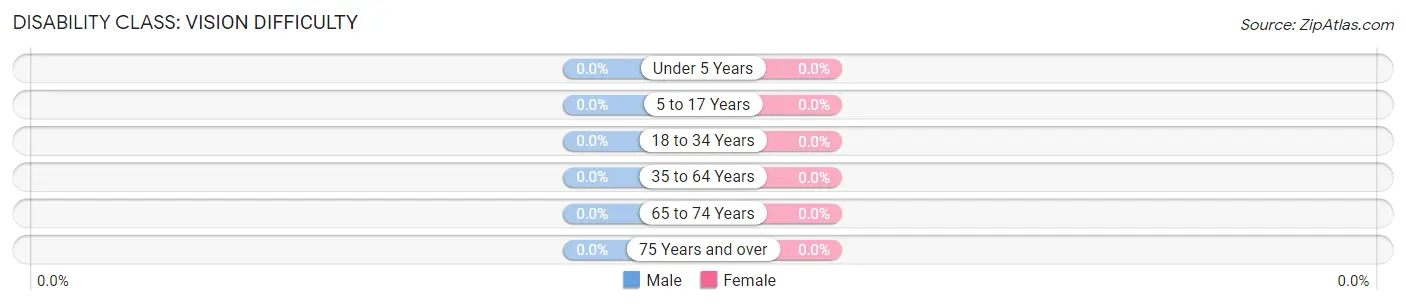
| Age Bracket | Male | Female |
| Under 5 Years | 0 (0.0%) | 0 (0.0%) |
| 5 to 17 Years | 0 (0.0%) | 0 (0.0%) |
| 18 to 34 Years | 0 (0.0%) | 0 (0.0%) |
| 35 to 64 Years | 0 (0.0%) | 0 (0.0%) |
| 65 to 74 Years | 0 (0.0%) | 0 (0.0%) |
| 75 Years and over | 0 (0.0%) | 0 (0.0%) |
Disability Class: Cognitive Difficulty
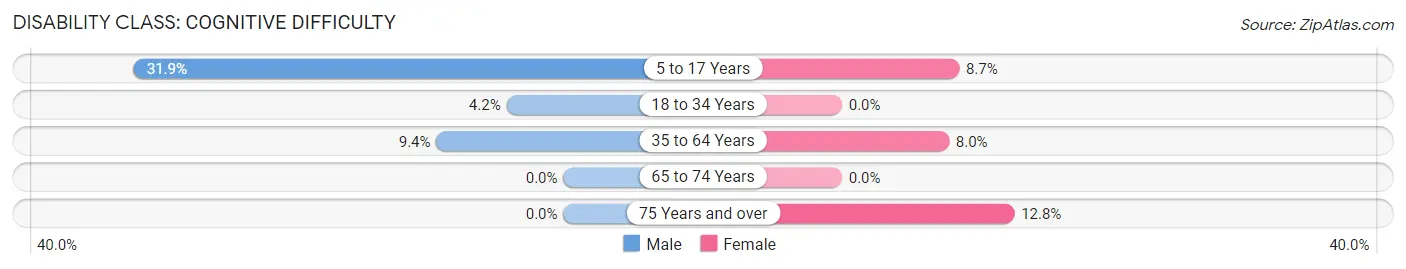
| Age Bracket | Male | Female |
| 5 to 17 Years | 59 (31.9%) | 18 (8.7%) |
| 18 to 34 Years | 14 (4.2%) | 0 (0.0%) |
| 35 to 64 Years | 48 (9.4%) | 49 (8.0%) |
| 65 to 74 Years | 0 (0.0%) | 0 (0.0%) |
| 75 Years and over | 0 (0.0%) | 32 (12.8%) |
Disability Class: Ambulatory Difficulty
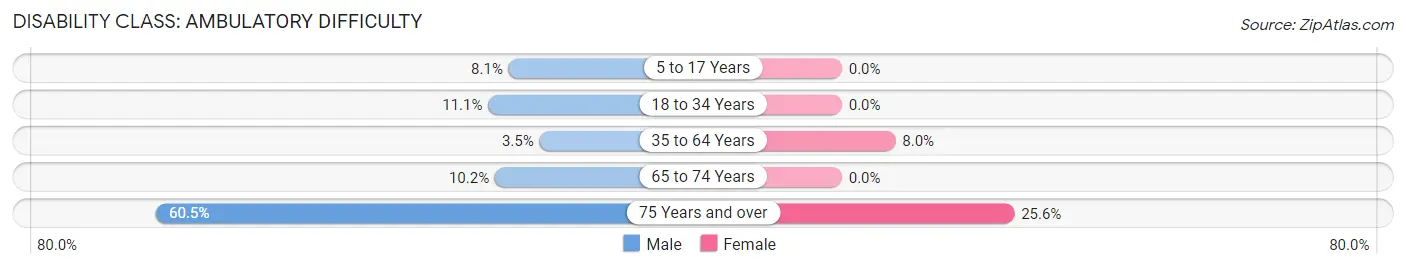
| Age Bracket | Male | Female |
| 5 to 17 Years | 15 (8.1%) | 0 (0.0%) |
| 18 to 34 Years | 37 (11.1%) | 0 (0.0%) |
| 35 to 64 Years | 18 (3.5%) | 49 (8.0%) |
| 65 to 74 Years | 20 (10.2%) | 0 (0.0%) |
| 75 Years and over | 52 (60.5%) | 64 (25.6%) |
Disability Class: Self-Care Difficulty
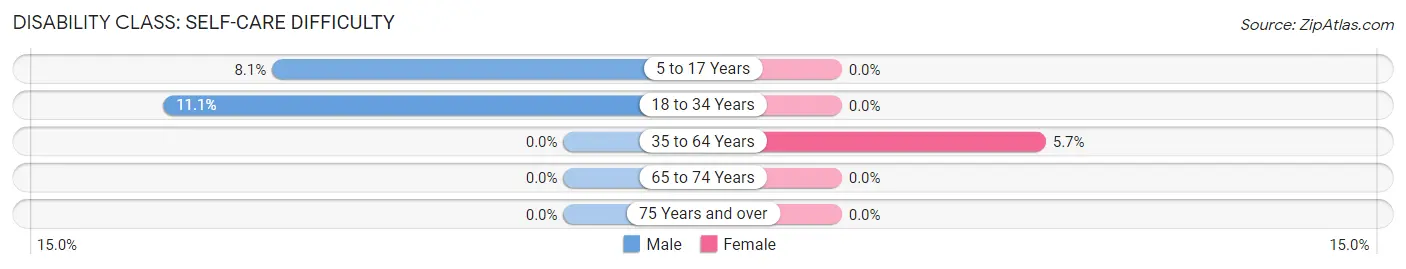
| Age Bracket | Male | Female |
| 5 to 17 Years | 15 (8.1%) | 0 (0.0%) |
| 18 to 34 Years | 37 (11.1%) | 0 (0.0%) |
| 35 to 64 Years | 0 (0.0%) | 35 (5.7%) |
| 65 to 74 Years | 0 (0.0%) | 0 (0.0%) |
| 75 Years and over | 0 (0.0%) | 0 (0.0%) |
Technology Access in Kewaunee
Computing Device Access in Kewaunee
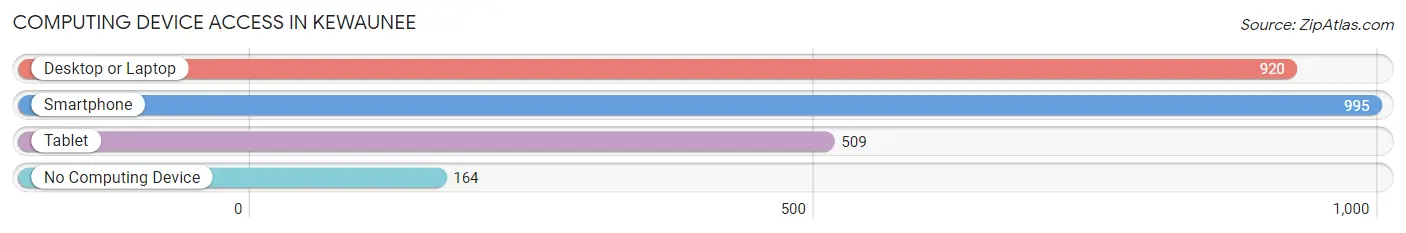
| Device Type | # Households | % Households |
| Desktop or Laptop | 920 | 69.7% |
| Smartphone | 995 | 75.4% |
| Tablet | 509 | 38.6% |
| No Computing Device | 164 | 12.4% |
| Total | 1,320 | 100.0% |
Internet Access in Kewaunee
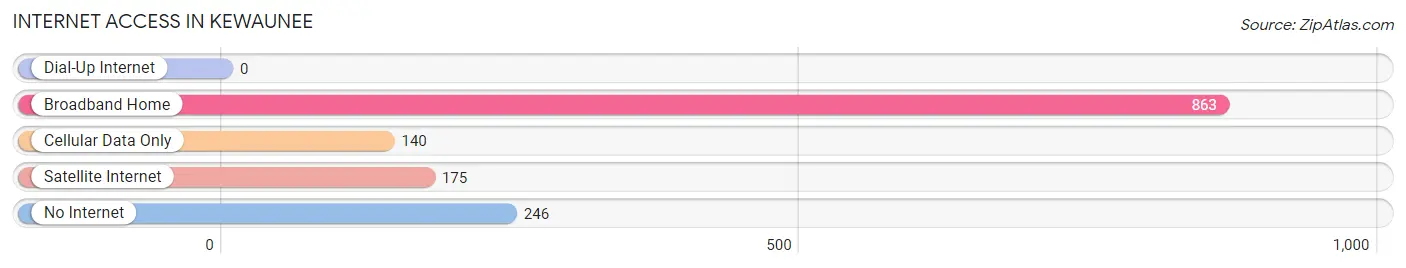
| Internet Type | # Households | % Households |
| Dial-Up Internet | 0 | 0.0% |
| Broadband Home | 863 | 65.4% |
| Cellular Data Only | 140 | 10.6% |
| Satellite Internet | 175 | 13.3% |
| No Internet | 246 | 18.6% |
| Total | 1,320 | 100.0% |
Kewaunee Summary
Kewaunee is a city located in Kewaunee County, Wisconsin, United States. The population was 2,952 at the 2010 census. It is the county seat of Kewaunee County.
History
Kewaunee was first settled in 1836 by a group of French-Canadian immigrants. The city was originally known as La Baie des Puants, which translates to "Stinking Bay". The name was changed to Kewaunee in 1851, after the Kewaunee River, which flows through the city. The city was incorporated in 1872.
Kewaunee was an important port city in the 19th century, and was home to several lumber mills and shipbuilding companies. The city was also home to the Kewaunee and Western Railroad, which operated from 1872 to 1891.
Geography
Kewaunee is located at 44°27′N 87°37′W (44.45, -87.62). According to the United States Census Bureau, the city has a total area of 2.2 square miles (5.7 km2), all of it land.
Economy
Kewaunee is home to several industries, including manufacturing, agriculture, and tourism. The city is home to several manufacturing companies, including Kewaunee Scientific Corporation, which manufactures laboratory furniture and equipment, and Kewaunee Fabricators, which manufactures metal products.
Agriculture is also an important part of the local economy. Kewaunee County is home to several dairy farms, as well as fruit and vegetable farms. The city is also home to several wineries and breweries.
Tourism is also an important part of the local economy. Kewaunee is home to several attractions, including the Kewaunee County Historical Museum, the Kewaunee County Fairgrounds, and the Kewaunee County Park.
Demographics
As of the census of 2010, there were 2,952 people, 1,220 households, and 745 families residing in the city. The population density was 1,323.2 people per square mile (510.7/km2). There were 1,320 housing units at an average density of 590.9 per square mile (228.2/km2). The racial makeup of the city was 97.2% White, 0.3% African American, 0.4% Native American, 0.5% Asian, 0.1% Pacific Islander, 0.6% from other races, and 0.9% from two or more races. Hispanic or Latino of any race were 2.2% of the population.
There were 1,220 households, out of which 28.2% had children under the age of 18 living with them, 46.2% were married couples living together, 11.2% had a female householder with no husband present, and 37.7% were non-families. 32.2% of all households were made up of individuals, and 15.2% had someone living alone who was 65 years of age or older. The average household size was 2.35 and the average family size was 2.94.
In the city, the population was spread out, with 24.2% under the age of 18, 7.2% from 18 to 24, 25.7% from 25 to 44, 22.7% from 45 to 64, and 20.2% who were 65 years of age or older. The median age was 40 years. For every 100 females, there were 91.2 males. For every 100 females age 18 and over, there were 87.2 males.
The median income for a household in the city was $37,917, and the median income for a family was $45,938. Males had a median income of $35,000 versus $22,500 for females. The per capita income for the city was $19,845. About 6.2% of families and 8.3% of the population were below the poverty line, including 10.2% of those under age 18 and 8.2% of those age 65 or over.
Common Questions
What is the Total Population of Kewaunee?
Total Population of Kewaunee is 2,819.
What is the Total Male Population of Kewaunee?
Total Male Population of Kewaunee is 1,421.
What is the Total Female Population of Kewaunee?
Total Female Population of Kewaunee is 1,398.
What is the Ratio of Males per 100 Females in Kewaunee?
There are 101.65 Males per 100 Females in Kewaunee.
What is the Ratio of Females per 100 Males in Kewaunee?
There are 98.38 Females per 100 Males in Kewaunee.
What is the Median Population Age in Kewaunee?
Median Population Age in Kewaunee is 45.7 Years.
What is the Average Family Size in Kewaunee
Average Family Size in Kewaunee is 2.6 People.
What is the Average Household Size in Kewaunee
Average Household Size in Kewaunee is 2.1 People.
What is Per Capita Income in Kewaunee?
Per Capita income in Kewaunee is $42,881.
What is the Median Family Income in Kewaunee?
Median Family Income in Kewaunee is $83,250.
What is the Median Household income in Kewaunee?
Median Household Income in Kewaunee is $64,643.
What is Income or Wage Gap in Kewaunee?
Income or Wage Gap in Kewaunee is 25.6%.
Women in Kewaunee earn 74.4 cents for every dollar earned by a man.
What is Inequality or Gini Index in Kewaunee?
Inequality or Gini Index in Kewaunee is 0.44.
How Large is the Labor Force in Kewaunee?
There are 1,557 People in the Labor Forcein in Kewaunee.
What is the Percentage of People in the Labor Force in Kewaunee?
64.0% of People are in the Labor Force in Kewaunee.
What is the Unemployment Rate in Kewaunee?
Unemployment Rate in Kewaunee is 0.3%.