Keshena, WI
Keshena Map
Keshena Overview
1,424
TOTAL POPULATION
732
MALE POPULATION
692
FEMALE POPULATION
105.78
MALES / 100 FEMALES
94.54
FEMALES / 100 MALES
20.7
MEDIAN AGE
4.3
AVG FAMILY SIZE
4.2
AVG HOUSEHOLD SIZE
$12,454
PER CAPITA INCOME
$41,944
AVG FAMILY INCOME
$43,000
AVG HOUSEHOLD INCOME
30.9%
WAGE / INCOME GAP [ % ]
69.1¢/ $1
WAGE / INCOME GAP [ $ ]
0.42
INEQUALITY / GINI INDEX
510
LABOR FORCE [ PEOPLE ]
56.3%
PERCENT IN LABOR FORCE
8.4%
UNEMPLOYMENT RATE
Keshena Zip Codes
Keshena Area Codes
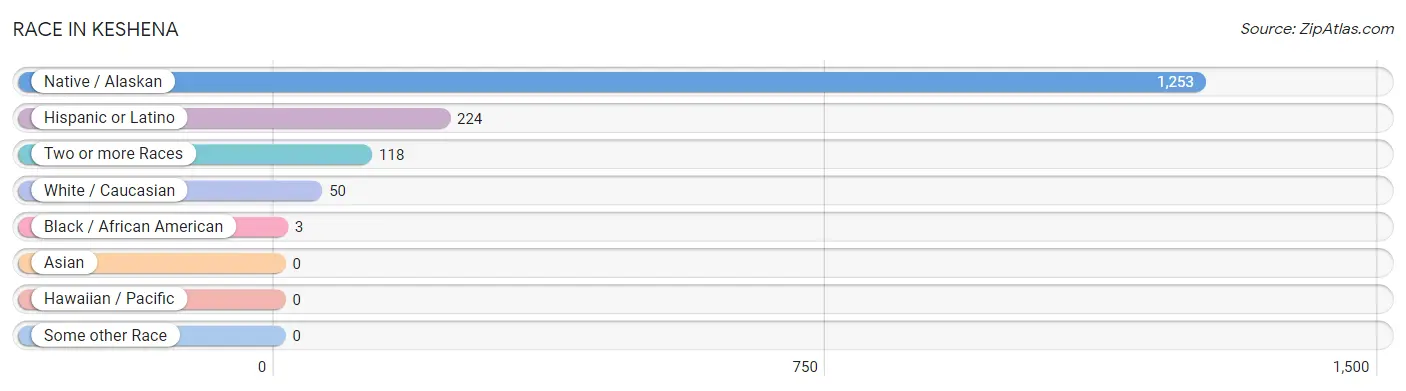
Race in Keshena
The most populous races in Keshena are Native / Alaskan (1,253 | 88.0%), Hispanic or Latino (224 | 15.7%), and Two or more Races (118 | 8.3%).
| Race | # Population | % Population |
| Asian | 0 | 0.0% |
| Black / African American | 3 | 0.2% |
| Hawaiian / Pacific | 0 | 0.0% |
| Hispanic or Latino | 224 | 15.7% |
| Native / Alaskan | 1,253 | 88.0% |
| White / Caucasian | 50 | 3.5% |
| Two or more Races | 118 | 8.3% |
| Some other Race | 0 | 0.0% |
| Total | 1,424 | 100.0% |
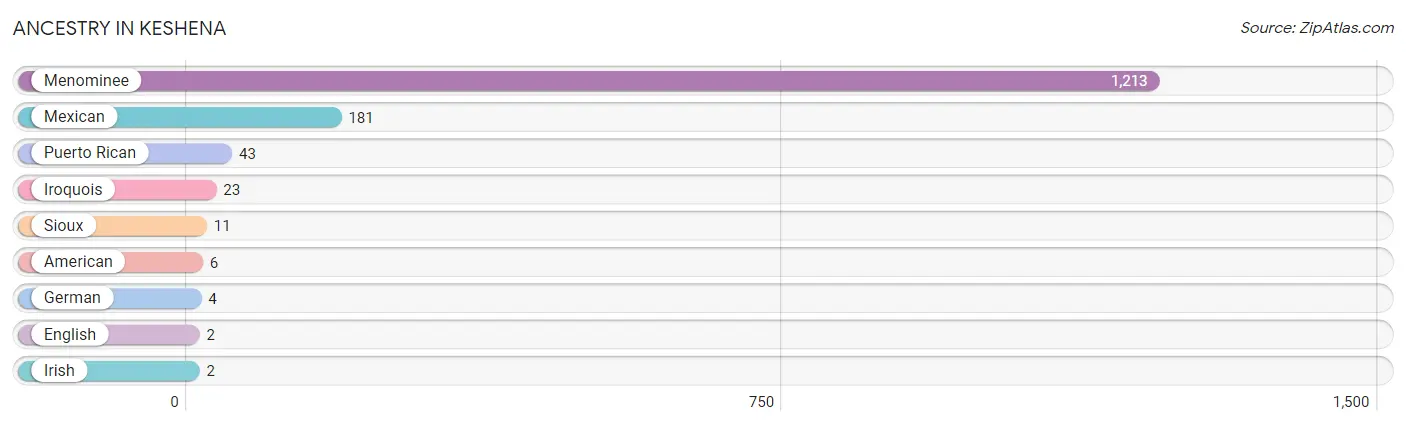
Ancestry in Keshena
The most populous ancestries reported in Keshena are Menominee (1,213 | 85.2%), Mexican (181 | 12.7%), Puerto Rican (43 | 3.0%), Iroquois (23 | 1.6%), and Sioux (11 | 0.8%), together accounting for 103.3% of all Keshena residents.
| Ancestry | # Population | % Population |
| American | 6 | 0.4% |
| English | 2 | 0.1% |
| German | 4 | 0.3% |
| Irish | 2 | 0.1% |
| Iroquois | 23 | 1.6% |
| Menominee | 1,213 | 85.2% |
| Mexican | 181 | 12.7% |
| Puerto Rican | 43 | 3.0% |
| Sioux | 11 | 0.8% | View All 9 Rows |
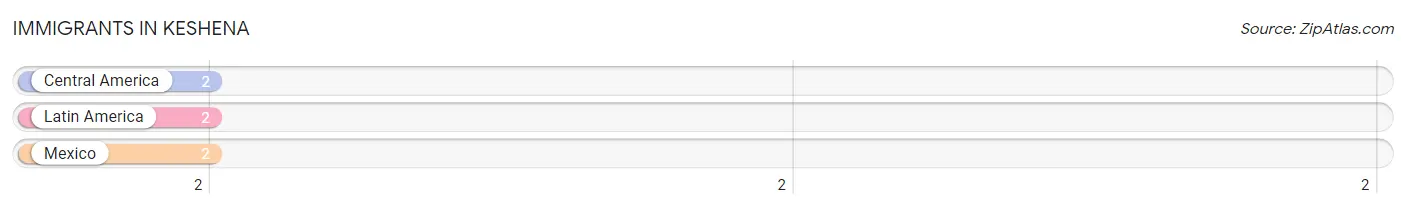
Immigrants in Keshena
The most numerous immigrant groups reported in Keshena came from Central America (2 | 0.1%), Latin America (2 | 0.1%), and Mexico (2 | 0.1%), together accounting for 0.4% of all Keshena residents.
| Immigration Origin | # Population | % Population |
| Central America | 2 | 0.1% |
| Latin America | 2 | 0.1% |
| Mexico | 2 | 0.1% | View All 3 Rows |
Sex and Age in Keshena
Sex and Age in Keshena
The most populous age groups in Keshena are 5 to 9 Years (119 | 16.3%) for men and 15 to 19 Years (96 | 13.9%) for women.
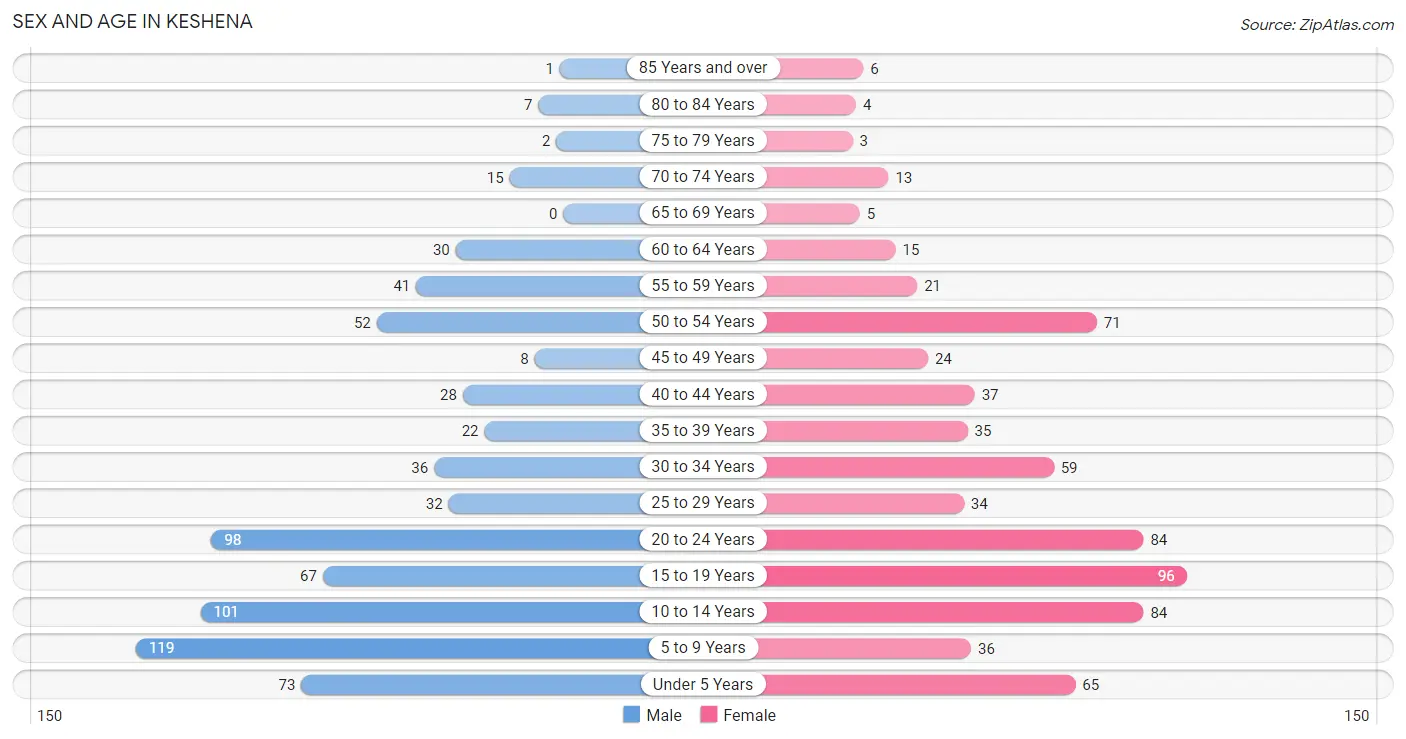
| Age Bracket | Male | Female |
| Under 5 Years | 73 (10.0%) | 65 (9.4%) |
| 5 to 9 Years | 119 (16.3%) | 36 (5.2%) |
| 10 to 14 Years | 101 (13.8%) | 84 (12.1%) |
| 15 to 19 Years | 67 (9.1%) | 96 (13.9%) |
| 20 to 24 Years | 98 (13.4%) | 84 (12.1%) |
| 25 to 29 Years | 32 (4.4%) | 34 (4.9%) |
| 30 to 34 Years | 36 (4.9%) | 59 (8.5%) |
| 35 to 39 Years | 22 (3.0%) | 35 (5.1%) |
| 40 to 44 Years | 28 (3.8%) | 37 (5.3%) |
| 45 to 49 Years | 8 (1.1%) | 24 (3.5%) |
| 50 to 54 Years | 52 (7.1%) | 71 (10.3%) |
| 55 to 59 Years | 41 (5.6%) | 21 (3.0%) |
| 60 to 64 Years | 30 (4.1%) | 15 (2.2%) |
| 65 to 69 Years | 0 (0.0%) | 5 (0.7%) |
| 70 to 74 Years | 15 (2.1%) | 13 (1.9%) |
| 75 to 79 Years | 2 (0.3%) | 3 (0.4%) |
| 80 to 84 Years | 7 (1.0%) | 4 (0.6%) |
| 85 Years and over | 1 (0.1%) | 6 (0.9%) |
| Total | 732 (100.0%) | 692 (100.0%) |
Families and Households in Keshena
Median Family Size in Keshena
The median family size in Keshena is 4.27 persons per family, with single female/mother families (109 | 35.4%) accounting for the largest median family size of 4.7 persons per family. On the other hand, single male/father families (94 | 30.5%) represent the smallest median family size with 3.61 persons per family.
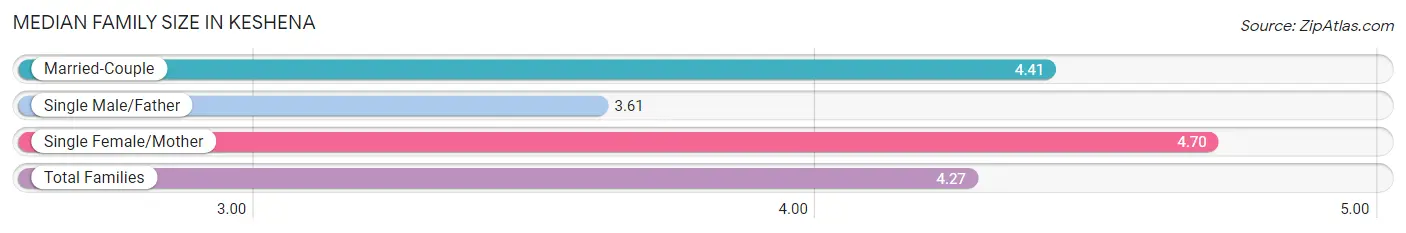
| Family Type | # Families | Family Size |
| Married-Couple | 105 (34.1%) | 4.41 |
| Single Male/Father | 94 (30.5%) | 3.61 |
| Single Female/Mother | 109 (35.4%) | 4.70 |
| Total Families | 308 (100.0%) | 4.27 |
Median Household Size in Keshena
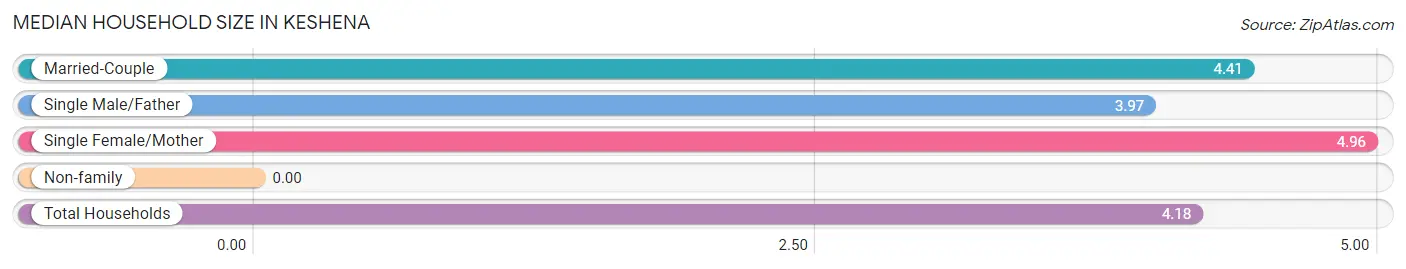
| Household Type | # Households | Household Size |
| Married-Couple | 105 (31.2%) | 4.41 |
| Single Male/Father | 94 (28.0%) | 3.97 |
| Single Female/Mother | 109 (32.4%) | 4.96 |
| Non-family | 28 (8.3%) | - |
| Total Households | 336 (100.0%) | 4.18 |
Household Size by Marriage Status in Keshena
Out of a total of 336 households in Keshena, 308 (91.7%) are family households, while 28 (8.3%) are nonfamily households. The most numerous type of family households are 7+ person households, comprising 61, and the most common type of nonfamily households are 1-person households, comprising 28.
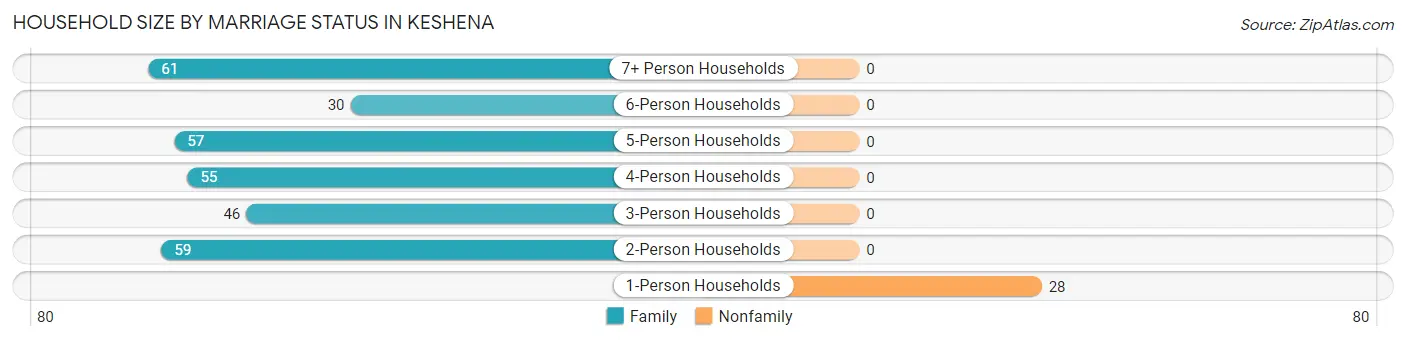
| Household Size | Family Households | Nonfamily Households |
| 1-Person Households | - | 28 (8.3%) |
| 2-Person Households | 59 (17.6%) | 0 (0.0%) |
| 3-Person Households | 46 (13.7%) | 0 (0.0%) |
| 4-Person Households | 55 (16.4%) | 0 (0.0%) |
| 5-Person Households | 57 (17.0%) | 0 (0.0%) |
| 6-Person Households | 30 (8.9%) | 0 (0.0%) |
| 7+ Person Households | 61 (18.1%) | 0 (0.0%) |
| Total | 308 (91.7%) | 28 (8.3%) |
Female Fertility in Keshena
Fertility by Age in Keshena
Average fertility rate in Keshena is 109.0 births per 1,000 women. Women in the age bracket of 20 to 34 years have the highest fertility rate with 186.0 births per 1,000 women. Women in the age bracket of 20 to 34 years acount for 80.5% of all women with births.
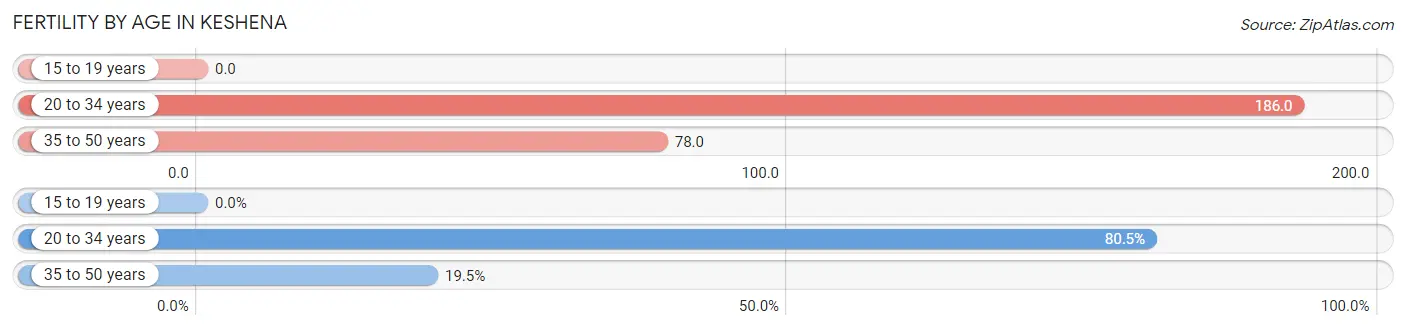
| Age Bracket | Women with Births | Births / 1,000 Women |
| 15 to 19 years | 0 (0.0%) | 0.0 |
| 20 to 34 years | 33 (80.5%) | 186.0 |
| 35 to 50 years | 8 (19.5%) | 78.0 |
| Total | 41 (100.0%) | 109.0 |
Fertility by Age by Marriage Status in Keshena
26.8% of women with births (41) in Keshena are married. The highest percentage of unmarried women with births falls into 35 to 50 years age bracket with 100.0% of them unmarried at the time of birth, while the lowest percentage of unmarried women with births belong to 20 to 34 years age bracket with 66.7% of them unmarried.
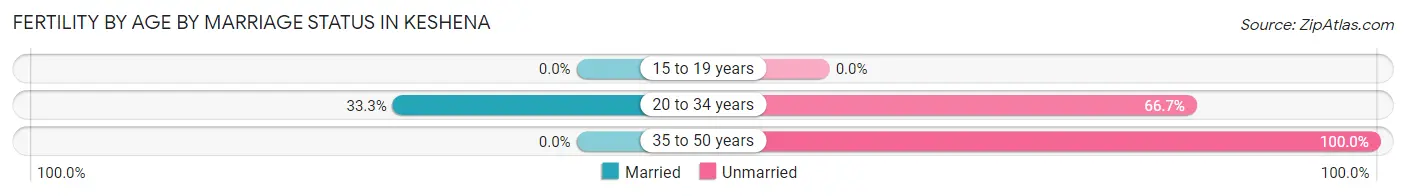
| Age Bracket | Married | Unmarried |
| 15 to 19 years | 0 (0.0%) | 0 (0.0%) |
| 20 to 34 years | 11 (33.3%) | 22 (66.7%) |
| 35 to 50 years | 0 (0.0%) | 8 (100.0%) |
| Total | 11 (26.8%) | 30 (73.2%) |
Fertility by Education in Keshena
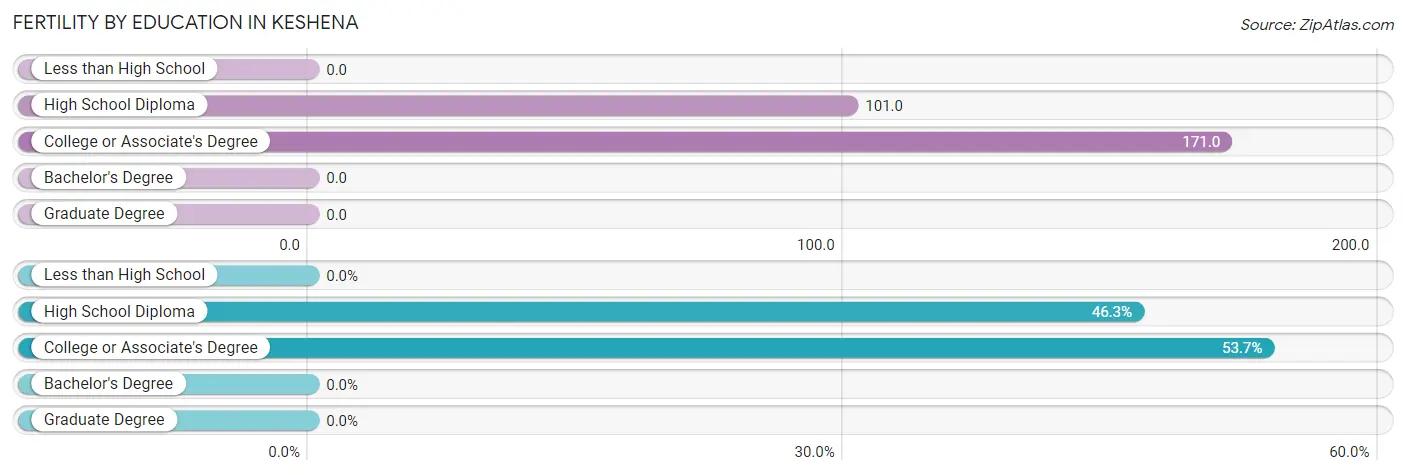
| Educational Attainment | Women with Births | Births / 1,000 Women |
| Less than High School | 0 (0.0%) | 0.0 |
| High School Diploma | 19 (46.3%) | 101.0 |
| College or Associate's Degree | 22 (53.7%) | 171.0 |
| Bachelor's Degree | 0 (0.0%) | 0.0 |
| Graduate Degree | 0 (0.0%) | 0.0 |
| Total | 41 (100.0%) | 109.0 |
Fertility by Education by Marriage Status in Keshena
73.2% of women with births in Keshena are unmarried. Women with the educational attainment of high school diploma are most likely to be married with 57.9% of them married at childbirth, while women with the educational attainment of college or associate's degree are least likely to be married with 100.0% of them unmarried at childbirth.
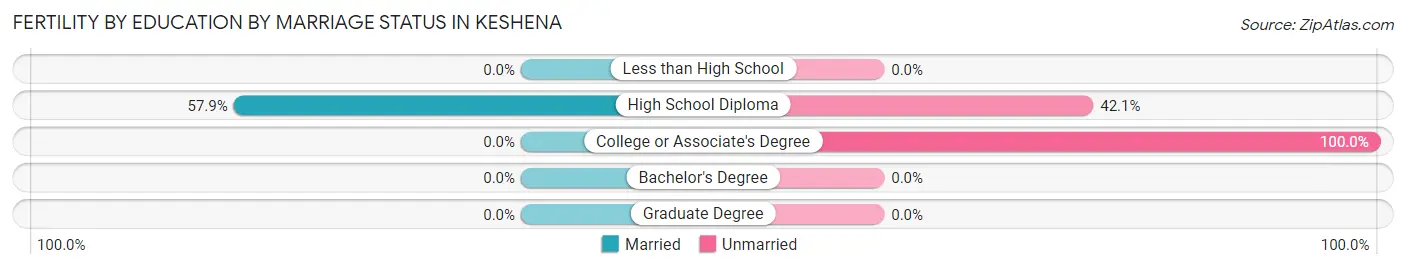
| Educational Attainment | Married | Unmarried |
| Less than High School | 0 (0.0%) | 0 (0.0%) |
| High School Diploma | 11 (57.9%) | 8 (42.1%) |
| College or Associate's Degree | 0 (0.0%) | 22 (100.0%) |
| Bachelor's Degree | 0 (0.0%) | 0 (0.0%) |
| Graduate Degree | 0 (0.0%) | 0 (0.0%) |
| Total | 11 (26.8%) | 30 (73.2%) |
Income in Keshena
Income Overview in Keshena
Per Capita Income in Keshena is $12,454, while median incomes of families and households are $41,944 and $43,000 respectively.
| Characteristic | Number | Measure |
| Per Capita Income | 1,424 | $12,454 |
| Median Family Income | 308 | $41,944 |
| Mean Family Income | 308 | $45,259 |
| Median Household Income | 336 | $43,000 |
| Mean Household Income | 336 | $50,295 |
| Income Deficit | 308 | $0 |
| Wage / Income Gap (%) | 1,424 | 30.86% |
| Wage / Income Gap ($) | 1,424 | 69.14¢ per $1 |
| Gini / Inequality Index | 1,424 | 0.42 |
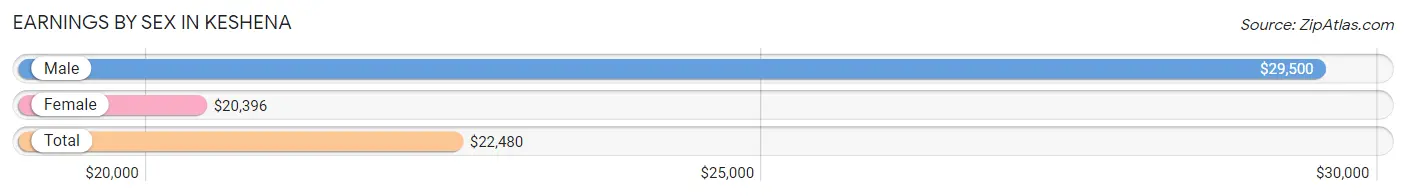
Earnings by Sex in Keshena
Average Earnings in Keshena are $22,480, $29,500 for men and $20,396 for women, a difference of 30.9%.
| Sex | Number | Average Earnings |
| Male | 208 (39.2%) | $29,500 |
| Female | 323 (60.8%) | $20,396 |
| Total | 531 (100.0%) | $22,480 |
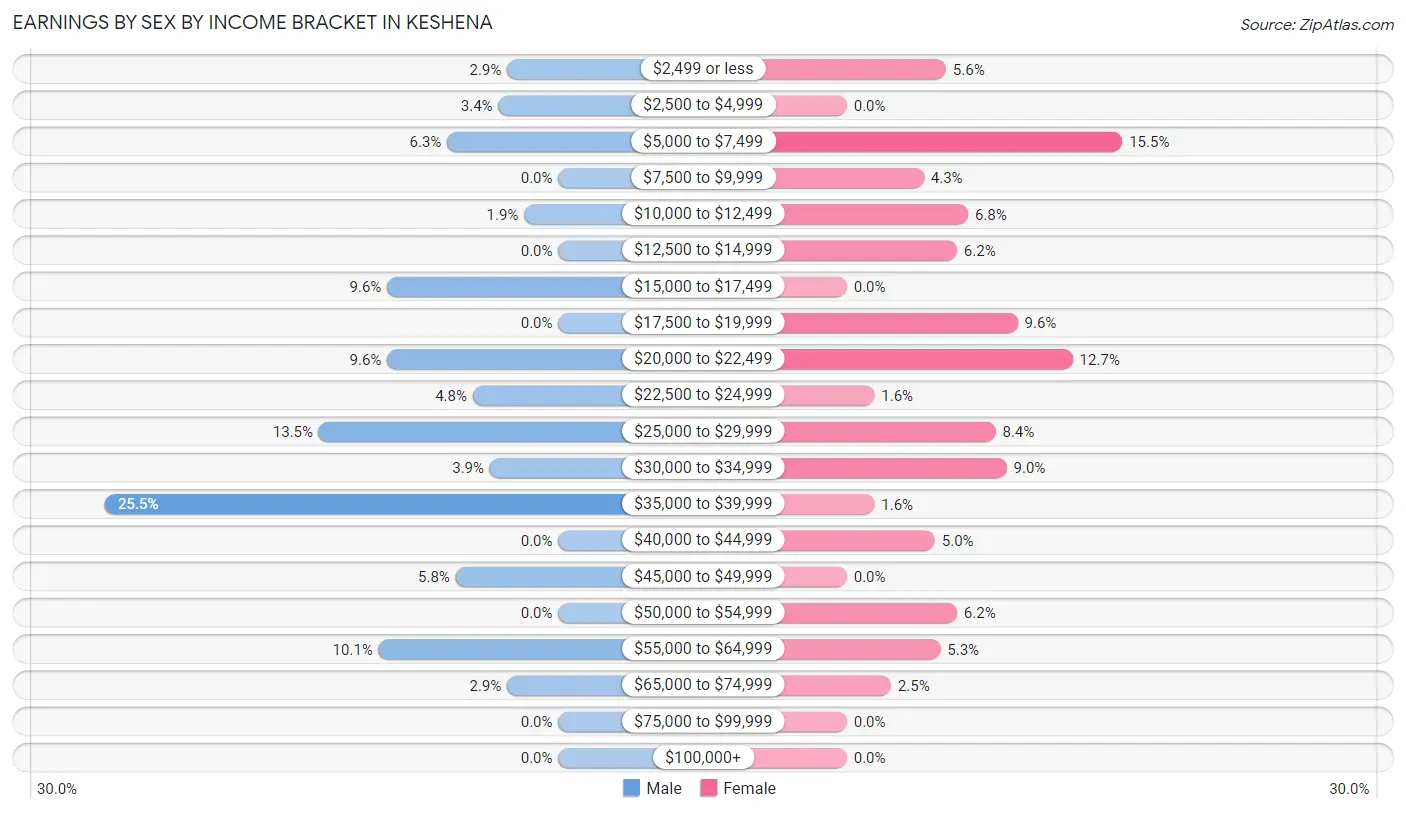
Earnings by Sex by Income Bracket in Keshena
The most common earnings brackets in Keshena are $35,000 to $39,999 for men (53 | 25.5%) and $5,000 to $7,499 for women (50 | 15.5%).
| Income | Male | Female |
| $2,499 or less | 6 (2.9%) | 18 (5.6%) |
| $2,500 to $4,999 | 7 (3.4%) | 0 (0.0%) |
| $5,000 to $7,499 | 13 (6.2%) | 50 (15.5%) |
| $7,500 to $9,999 | 0 (0.0%) | 14 (4.3%) |
| $10,000 to $12,499 | 4 (1.9%) | 22 (6.8%) |
| $12,500 to $14,999 | 0 (0.0%) | 20 (6.2%) |
| $15,000 to $17,499 | 20 (9.6%) | 0 (0.0%) |
| $17,500 to $19,999 | 0 (0.0%) | 31 (9.6%) |
| $20,000 to $22,499 | 20 (9.6%) | 41 (12.7%) |
| $22,500 to $24,999 | 10 (4.8%) | 5 (1.5%) |
| $25,000 to $29,999 | 28 (13.5%) | 27 (8.4%) |
| $30,000 to $34,999 | 8 (3.8%) | 29 (9.0%) |
| $35,000 to $39,999 | 53 (25.5%) | 5 (1.5%) |
| $40,000 to $44,999 | 0 (0.0%) | 16 (5.0%) |
| $45,000 to $49,999 | 12 (5.8%) | 0 (0.0%) |
| $50,000 to $54,999 | 0 (0.0%) | 20 (6.2%) |
| $55,000 to $64,999 | 21 (10.1%) | 17 (5.3%) |
| $65,000 to $74,999 | 6 (2.9%) | 8 (2.5%) |
| $75,000 to $99,999 | 0 (0.0%) | 0 (0.0%) |
| $100,000+ | 0 (0.0%) | 0 (0.0%) |
| Total | 208 (100.0%) | 323 (100.0%) |
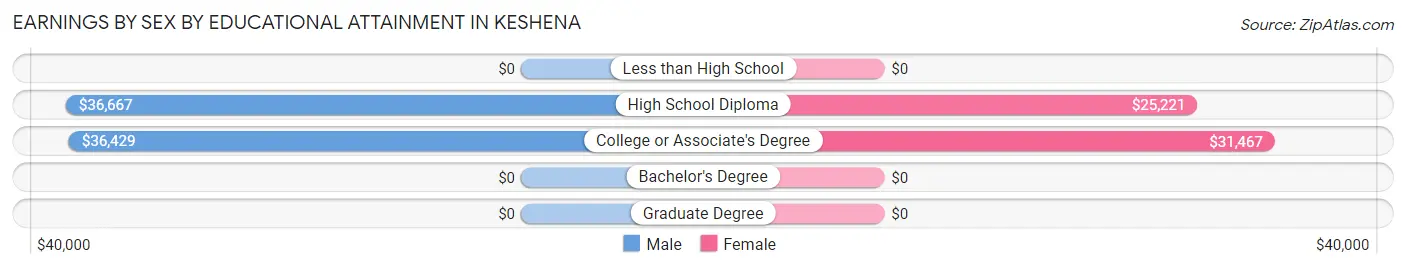
Earnings by Sex by Educational Attainment in Keshena
Average earnings in Keshena are $35,833 for men and $25,588 for women, a difference of 28.6%. Men with an educational attainment of high school diploma enjoy the highest average annual earnings of $36,667, while those with college or associate's degree education earn the least with $36,429. Women with an educational attainment of college or associate's degree earn the most with the average annual earnings of $31,467, while those with high school diploma education have the smallest earnings of $25,221.
| Educational Attainment | Male Income | Female Income |
| Less than High School | - | - |
| High School Diploma | $36,667 | $25,221 |
| College or Associate's Degree | $36,429 | $31,467 |
| Bachelor's Degree | - | - |
| Graduate Degree | - | - |
| Total | $35,833 | $25,588 |
Family Income in Keshena
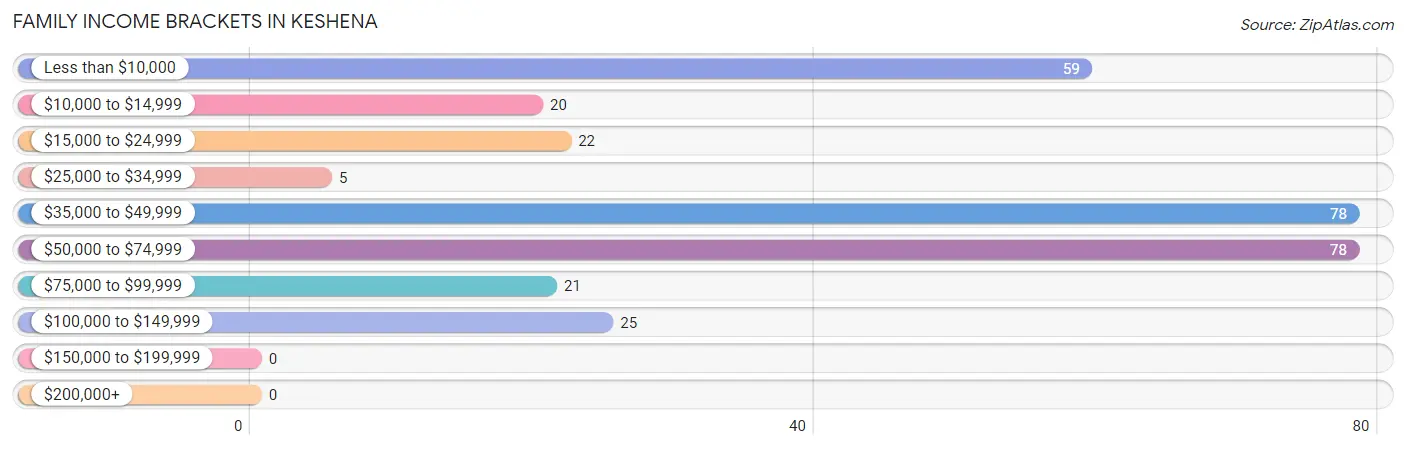
Family Income Brackets in Keshena
According to the Keshena family income data, there are 78 families falling into the $35,000 to $49,999 income range, which is the most common income bracket and makes up 25.3% of all families.
| Income Bracket | # Families | % Families |
| Less than $10,000 | 59 | 19.2% |
| $10,000 to $14,999 | 20 | 6.5% |
| $15,000 to $24,999 | 22 | 7.1% |
| $25,000 to $34,999 | 5 | 1.6% |
| $35,000 to $49,999 | 78 | 25.3% |
| $50,000 to $74,999 | 78 | 25.3% |
| $75,000 to $99,999 | 21 | 6.8% |
| $100,000 to $149,999 | 25 | 8.1% |
| $150,000 to $199,999 | 0 | 0.0% |
| $200,000+ | 0 | 0.0% |
Family Income by Famaliy Size in Keshena
2-person families (59 | 19.2%) account for the highest median family income in Keshena with $60,987 per family, while 2-person families (59 | 19.2%) have the highest median income of $30,494 per family member.
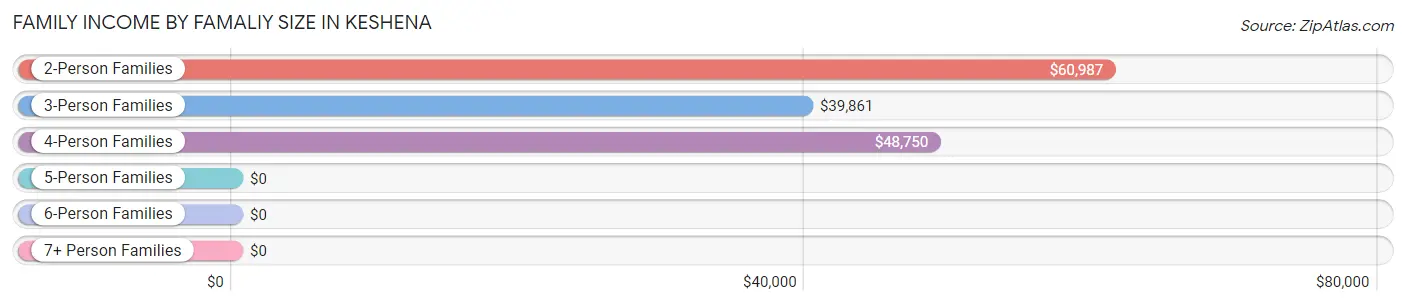
| Income Bracket | # Families | Median Income |
| 2-Person Families | 59 (19.2%) | $60,987 |
| 3-Person Families | 66 (21.4%) | $39,861 |
| 4-Person Families | 62 (20.1%) | $48,750 |
| 5-Person Families | 42 (13.6%) | $0 |
| 6-Person Families | 18 (5.8%) | $0 |
| 7+ Person Families | 61 (19.8%) | $0 |
| Total | 308 (100.0%) | $41,944 |
Family Income by Number of Earners in Keshena
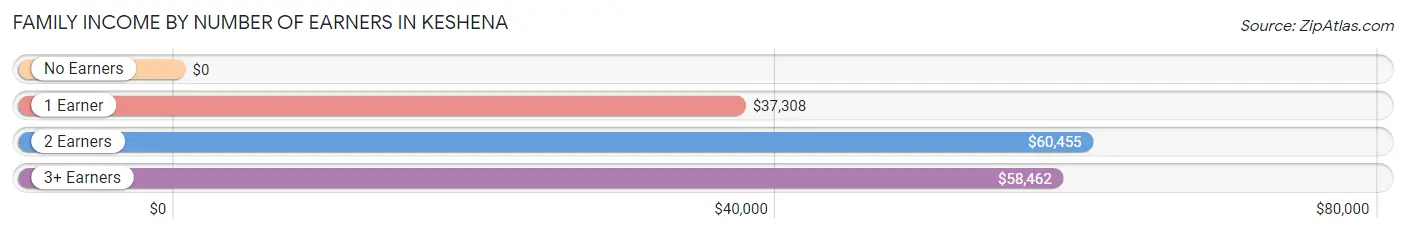
| Number of Earners | # Families | Median Income |
| No Earners | 30 (9.7%) | $0 |
| 1 Earner | 174 (56.5%) | $37,308 |
| 2 Earners | 74 (24.0%) | $60,455 |
| 3+ Earners | 30 (9.7%) | $58,462 |
| Total | 308 (100.0%) | $41,944 |
Household Income in Keshena
Household Income Brackets in Keshena
With 74 households falling in the category, the $35,000 to $49,999 income range is the most frequent in Keshena, accounting for 22.0% of all households.
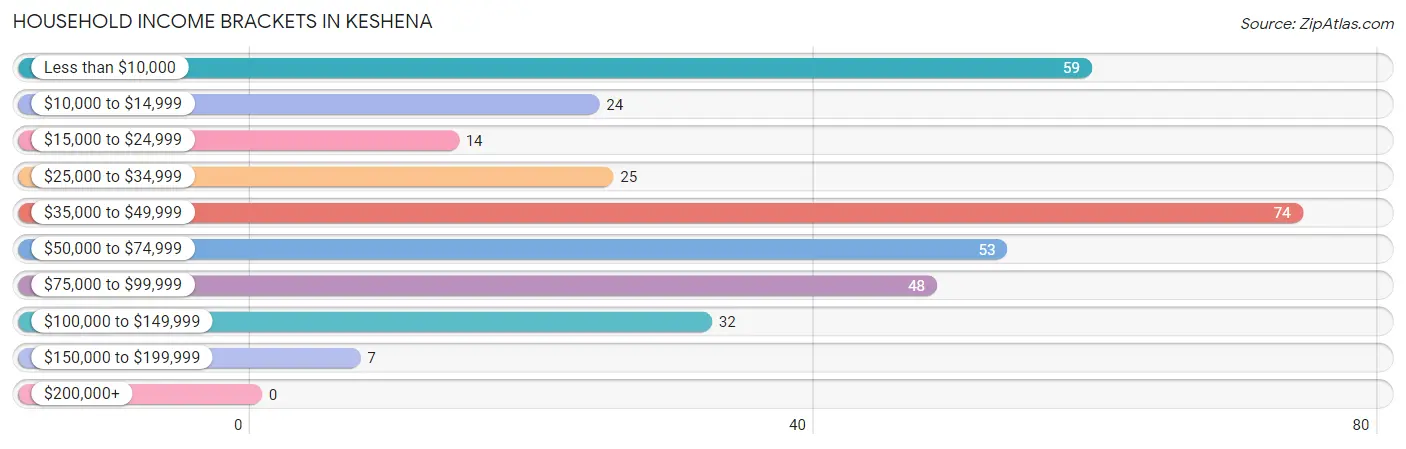
| Income Bracket | # Households | % Households |
| Less than $10,000 | 59 | 17.6% |
| $10,000 to $14,999 | 24 | 7.1% |
| $15,000 to $24,999 | 14 | 4.2% |
| $25,000 to $34,999 | 25 | 7.4% |
| $35,000 to $49,999 | 74 | 22.0% |
| $50,000 to $74,999 | 53 | 15.8% |
| $75,000 to $99,999 | 48 | 14.3% |
| $100,000 to $149,999 | 32 | 9.5% |
| $150,000 to $199,999 | 7 | 2.1% |
| $200,000+ | 0 | 0.0% |
Household Income by Householder Age in Keshena
The median household income in Keshena is $43,000, with the highest median household income of $48,750 found in the 65+ years age bracket for the primary householder. A total of 30 households (8.9%) fall into this category. Meanwhile, the 15 to 24 years age bracket for the primary householder has the lowest median household income of $24,615, with 22 households (6.6%) in this group.
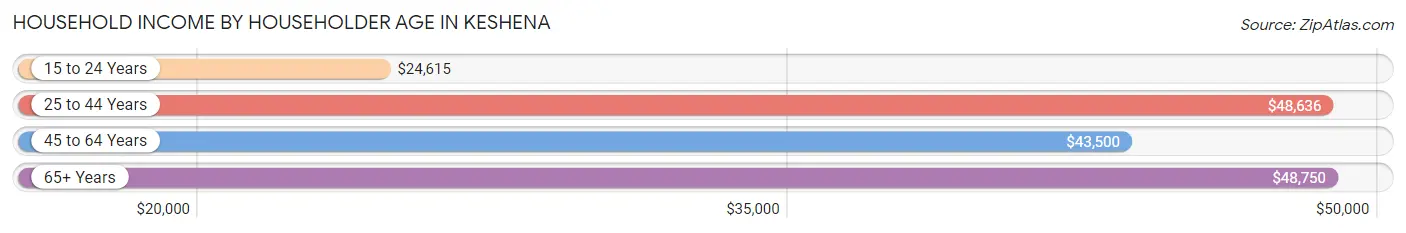
| Income Bracket | # Households | Median Income |
| 15 to 24 Years | 22 (6.6%) | $24,615 |
| 25 to 44 Years | 136 (40.5%) | $48,636 |
| 45 to 64 Years | 148 (44.1%) | $43,500 |
| 65+ Years | 30 (8.9%) | $48,750 |
| Total | 336 (100.0%) | $43,000 |
Poverty in Keshena
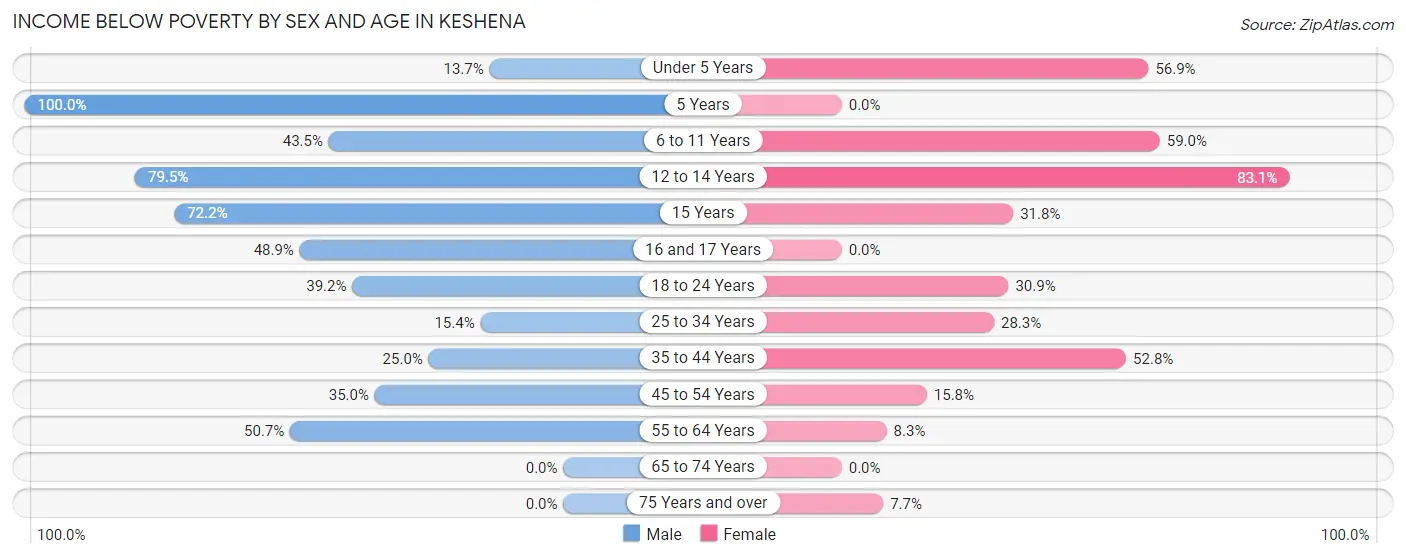
Income Below Poverty by Sex and Age in Keshena
With 40.5% poverty level for males and 36.9% for females among the residents of Keshena, 5 year old males and 12 to 14 year old females are the most vulnerable to poverty, with 34 males (100.0%) and 49 females (83.1%) in their respective age groups living below the poverty level.
| Age Bracket | Male | Female |
| Under 5 Years | 10 (13.7%) | 37 (56.9%) |
| 5 Years | 34 (100.0%) | 0 (0.0%) |
| 6 to 11 Years | 64 (43.5%) | 36 (59.0%) |
| 12 to 14 Years | 31 (79.5%) | 49 (83.1%) |
| 15 Years | 13 (72.2%) | 7 (31.8%) |
| 16 and 17 Years | 23 (48.9%) | 0 (0.0%) |
| 18 to 24 Years | 38 (39.2%) | 43 (30.9%) |
| 25 to 34 Years | 10 (15.4%) | 26 (28.3%) |
| 35 to 44 Years | 10 (25.0%) | 38 (52.8%) |
| 45 to 54 Years | 21 (35.0%) | 15 (15.8%) |
| 55 to 64 Years | 35 (50.7%) | 3 (8.3%) |
| 65 to 74 Years | 0 (0.0%) | 0 (0.0%) |
| 75 Years and over | 0 (0.0%) | 1 (7.7%) |
| Total | 289 (40.5%) | 255 (36.9%) |
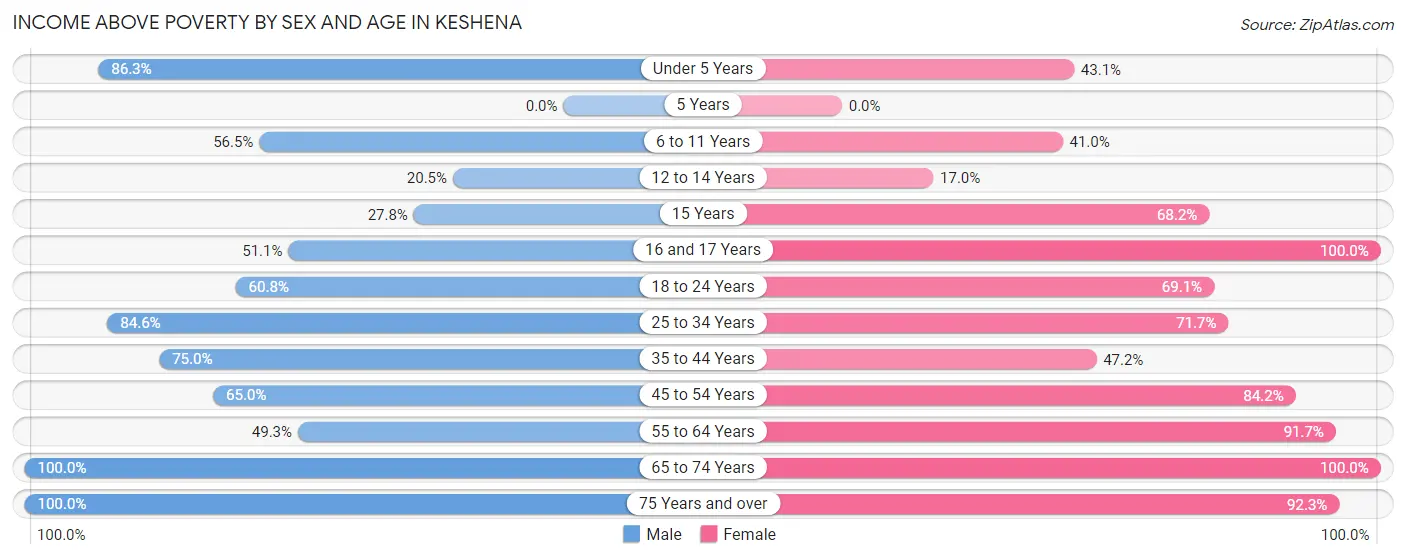
Income Above Poverty by Sex and Age in Keshena
According to the poverty statistics in Keshena, males aged 65 to 74 years and females aged 16 and 17 years are the age groups that are most secure financially, with 100.0% of males and 100.0% of females in these age groups living above the poverty line.
| Age Bracket | Male | Female |
| Under 5 Years | 63 (86.3%) | 28 (43.1%) |
| 5 Years | 0 (0.0%) | 0 (0.0%) |
| 6 to 11 Years | 83 (56.5%) | 25 (41.0%) |
| 12 to 14 Years | 8 (20.5%) | 10 (17.0%) |
| 15 Years | 5 (27.8%) | 15 (68.2%) |
| 16 and 17 Years | 24 (51.1%) | 19 (100.0%) |
| 18 to 24 Years | 59 (60.8%) | 96 (69.1%) |
| 25 to 34 Years | 55 (84.6%) | 66 (71.7%) |
| 35 to 44 Years | 30 (75.0%) | 34 (47.2%) |
| 45 to 54 Years | 39 (65.0%) | 80 (84.2%) |
| 55 to 64 Years | 34 (49.3%) | 33 (91.7%) |
| 65 to 74 Years | 15 (100.0%) | 18 (100.0%) |
| 75 Years and over | 10 (100.0%) | 12 (92.3%) |
| Total | 425 (59.5%) | 436 (63.1%) |
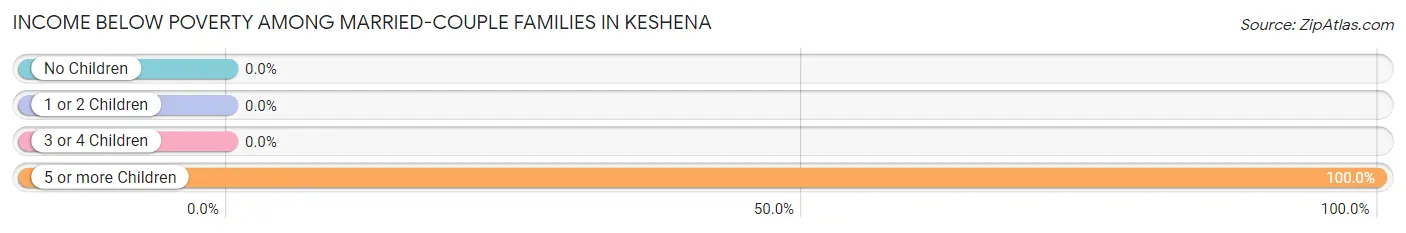
Income Below Poverty Among Married-Couple Families in Keshena
The poverty statistics for married-couple families in Keshena show that 9.5% or 10 of the total 105 families live below the poverty line. Families with 5 or more children have the highest poverty rate of 100.0%, comprising of 10 families. On the other hand, families with no children have the lowest poverty rate of 0.0%, which includes 0 families.
| Children | Above Poverty | Below Poverty |
| No Children | 38 (100.0%) | 0 (0.0%) |
| 1 or 2 Children | 36 (100.0%) | 0 (0.0%) |
| 3 or 4 Children | 21 (100.0%) | 0 (0.0%) |
| 5 or more Children | 0 (0.0%) | 10 (100.0%) |
| Total | 95 (90.5%) | 10 (9.5%) |
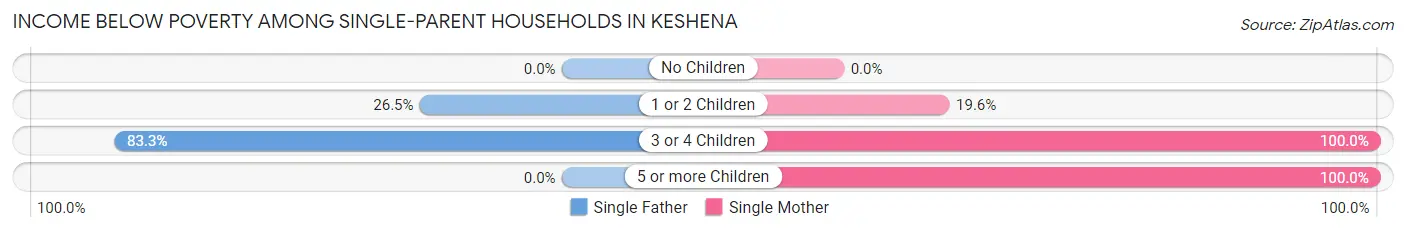
Income Below Poverty Among Single-Parent Households in Keshena
According to the poverty data in Keshena, 46.8% or 44 single-father households and 45.9% or 50 single-mother households are living below the poverty line. Among single-father households, those with 3 or 4 children have the highest poverty rate, with 35 households (83.3%) experiencing poverty. Likewise, among single-mother households, those with 3 or 4 children have the highest poverty rate, with 30 households (100.0%) falling below the poverty line.
| Children | Single Father | Single Mother |
| No Children | 0 (0.0%) | 0 (0.0%) |
| 1 or 2 Children | 9 (26.5%) | 11 (19.6%) |
| 3 or 4 Children | 35 (83.3%) | 30 (100.0%) |
| 5 or more Children | 0 (0.0%) | 9 (100.0%) |
| Total | 44 (46.8%) | 50 (45.9%) |
Income Below Poverty Among Married-Couple vs Single-Parent Households in Keshena
The poverty data for Keshena shows that 10 of the married-couple family households (9.5%) and 94 of the single-parent households (46.3%) are living below the poverty level. Within the married-couple family households, those with 5 or more children have the highest poverty rate, with 10 households (100.0%) falling below the poverty line. Among the single-parent households, those with 3 or 4 children have the highest poverty rate, with 65 household (90.3%) living below poverty.
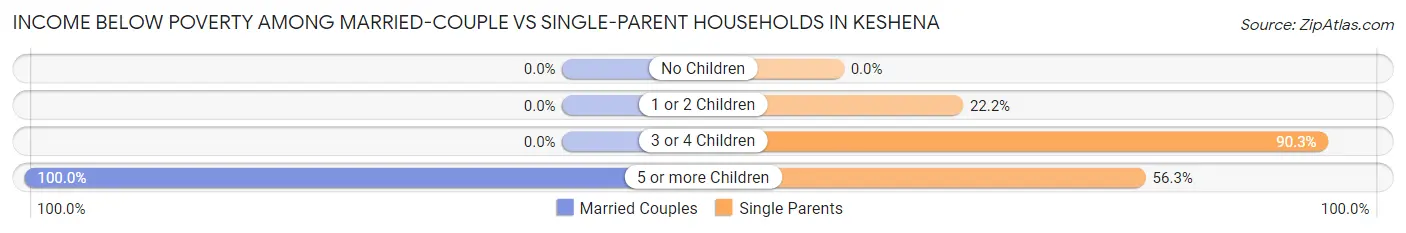
| Children | Married-Couple Families | Single-Parent Households |
| No Children | 0 (0.0%) | 0 (0.0%) |
| 1 or 2 Children | 0 (0.0%) | 20 (22.2%) |
| 3 or 4 Children | 0 (0.0%) | 65 (90.3%) |
| 5 or more Children | 10 (100.0%) | 9 (56.2%) |
| Total | 10 (9.5%) | 94 (46.3%) |
Employment Characteristics in Keshena
Employment by Class of Employer in Keshena
Among the 445 employed individuals in Keshena, local government employees (277 | 62.3%), private company employees (96 | 21.6%), and state government employees (28 | 6.3%) make up the most common classes of employment.
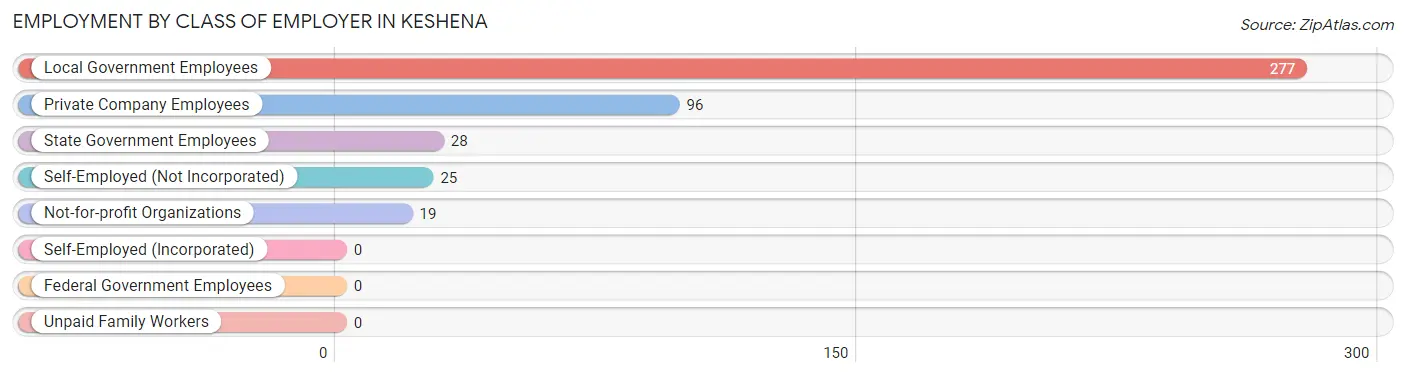
| Employer Class | # Employees | % Employees |
| Private Company Employees | 96 | 21.6% |
| Self-Employed (Incorporated) | 0 | 0.0% |
| Self-Employed (Not Incorporated) | 25 | 5.6% |
| Not-for-profit Organizations | 19 | 4.3% |
| Local Government Employees | 277 | 62.3% |
| State Government Employees | 28 | 6.3% |
| Federal Government Employees | 0 | 0.0% |
| Unpaid Family Workers | 0 | 0.0% |
| Total | 445 | 100.0% |
Employment Status by Age in Keshena
According to the labor force statistics for Keshena, out of the total population over 16 years of age (906), 56.3% or 510 individuals are in the labor force, with 8.4% or 43 of them unemployed. The age group with the highest labor force participation rate is 60 to 64 years, with 100.0% or 45 individuals in the labor force. Within the labor force, the 25 to 29 years age range has the highest percentage of unemployed individuals, with 41.5% or 27 of them being unemployed.
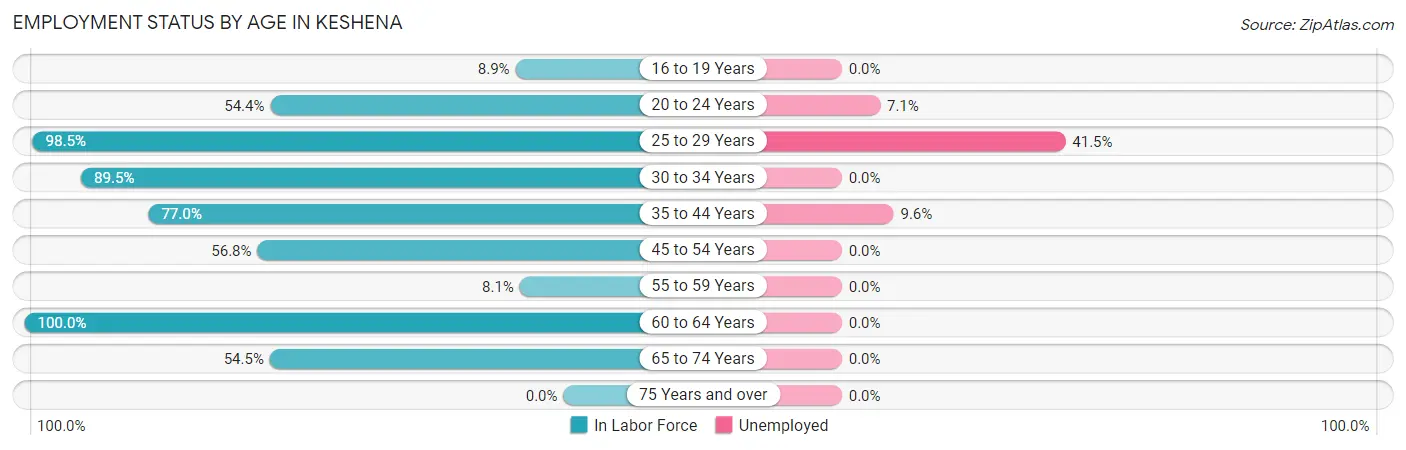
| Age Bracket | In Labor Force | Unemployed |
| 16 to 19 Years | 11 (8.9%) | 0 (0.0%) |
| 20 to 24 Years | 99 (54.4%) | 7 (7.1%) |
| 25 to 29 Years | 65 (98.5%) | 27 (41.5%) |
| 30 to 34 Years | 85 (89.5%) | 0 (0.0%) |
| 35 to 44 Years | 94 (77.0%) | 9 (9.6%) |
| 45 to 54 Years | 88 (56.8%) | 0 (0.0%) |
| 55 to 59 Years | 5 (8.1%) | 0 (0.0%) |
| 60 to 64 Years | 45 (100.0%) | 0 (0.0%) |
| 65 to 74 Years | 18 (54.5%) | 0 (0.0%) |
| 75 Years and over | 0 (0.0%) | 0 (0.0%) |
| Total | 510 (56.3%) | 43 (8.4%) |
Employment Status by Educational Attainment in Keshena
According to labor force statistics for Keshena, 70.1% of individuals (382) out of the total population between 25 and 64 years of age (545) are in the labor force, with 9.4% or 36 of them being unemployed. The group with the highest labor force participation rate are those with the educational attainment of bachelor's degree or higher, with 87.5% or 14 individuals in the labor force. Within the labor force, individuals with high school diploma education have the highest percentage of unemployment, with 11.3% or 20 of them being unemployed.
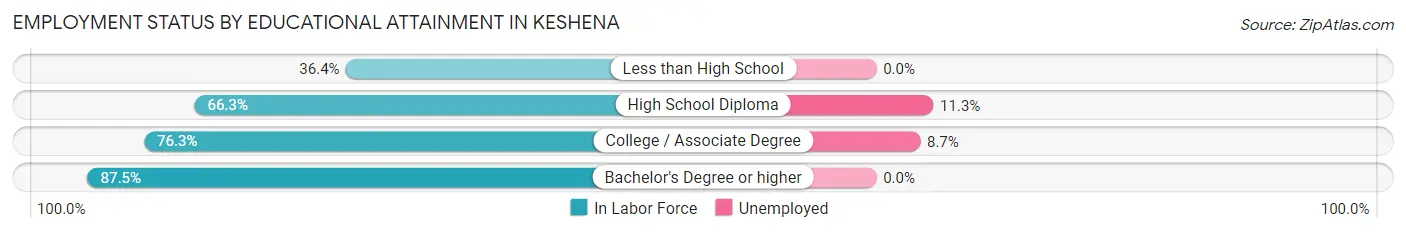
| Educational Attainment | In Labor Force | Unemployed |
| Less than High School | 8 (36.4%) | 0 (0.0%) |
| High School Diploma | 177 (66.3%) | 30 (11.3%) |
| College / Associate Degree | 183 (76.3%) | 21 (8.7%) |
| Bachelor's Degree or higher | 14 (87.5%) | 0 (0.0%) |
| Total | 382 (70.1%) | 51 (9.4%) |
Employment Occupations by Sex in Keshena
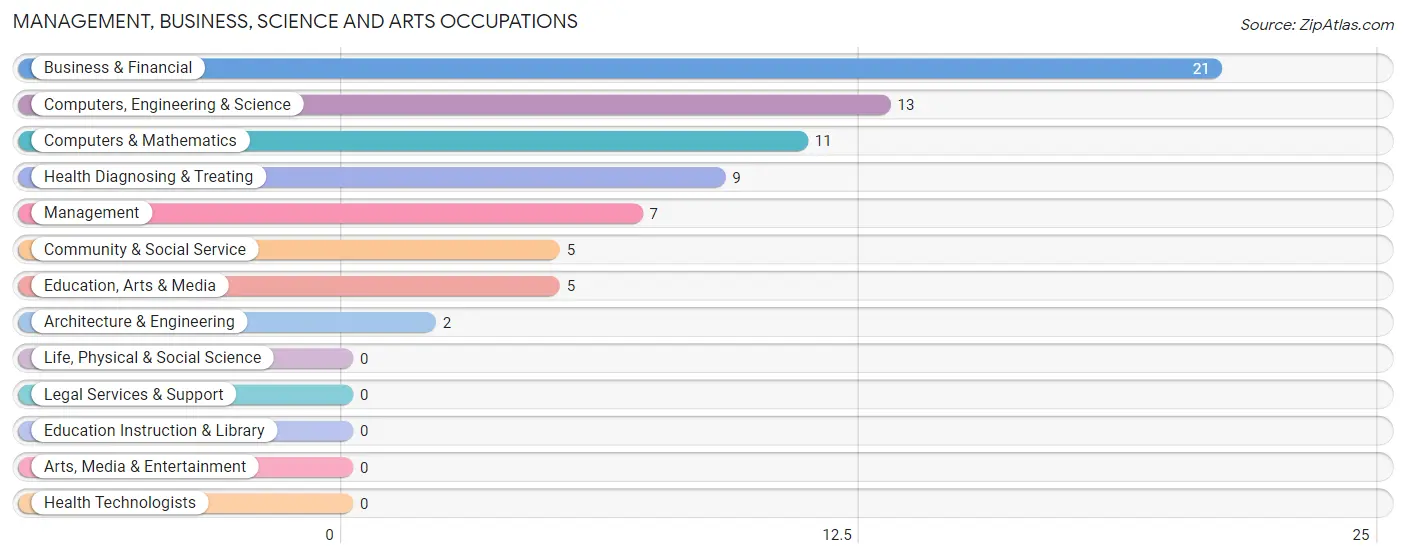
Management, Business, Science and Arts Occupations
The most common Management, Business, Science and Arts occupations in Keshena are Business & Financial (21 | 4.5%), Computers, Engineering & Science (13 | 2.8%), Computers & Mathematics (11 | 2.4%), Health Diagnosing & Treating (9 | 1.9%), and Management (7 | 1.5%).
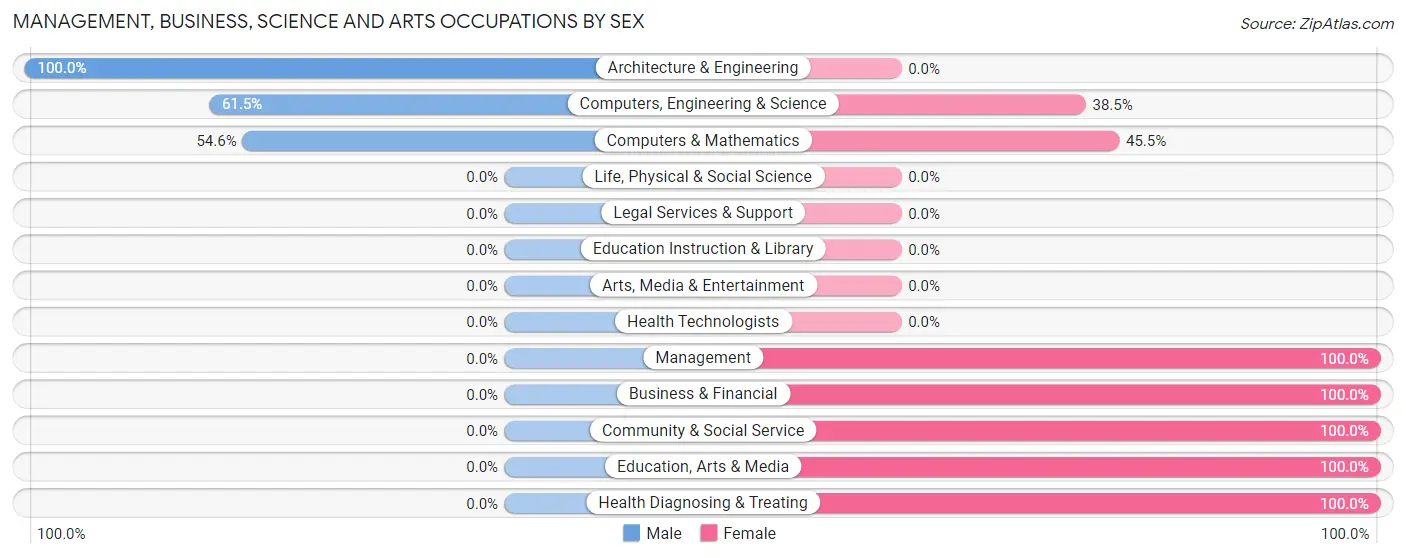
Management, Business, Science and Arts Occupations by Sex
Within the Management, Business, Science and Arts occupations in Keshena, the most male-oriented occupations are Architecture & Engineering (100.0%), Computers, Engineering & Science (61.5%), and Computers & Mathematics (54.5%), while the most female-oriented occupations are Management (100.0%), Business & Financial (100.0%), and Community & Social Service (100.0%).
| Occupation | Male | Female |
| Management | 0 (0.0%) | 7 (100.0%) |
| Business & Financial | 0 (0.0%) | 21 (100.0%) |
| Computers, Engineering & Science | 8 (61.5%) | 5 (38.5%) |
| Computers & Mathematics | 6 (54.5%) | 5 (45.5%) |
| Architecture & Engineering | 2 (100.0%) | 0 (0.0%) |
| Life, Physical & Social Science | 0 (0.0%) | 0 (0.0%) |
| Community & Social Service | 0 (0.0%) | 5 (100.0%) |
| Education, Arts & Media | 0 (0.0%) | 5 (100.0%) |
| Legal Services & Support | 0 (0.0%) | 0 (0.0%) |
| Education Instruction & Library | 0 (0.0%) | 0 (0.0%) |
| Arts, Media & Entertainment | 0 (0.0%) | 0 (0.0%) |
| Health Diagnosing & Treating | 0 (0.0%) | 9 (100.0%) |
| Health Technologists | 0 (0.0%) | 0 (0.0%) |
| Total (Category) | 8 (14.5%) | 47 (85.5%) |
| Total (Overall) | 149 (31.9%) | 318 (68.1%) |
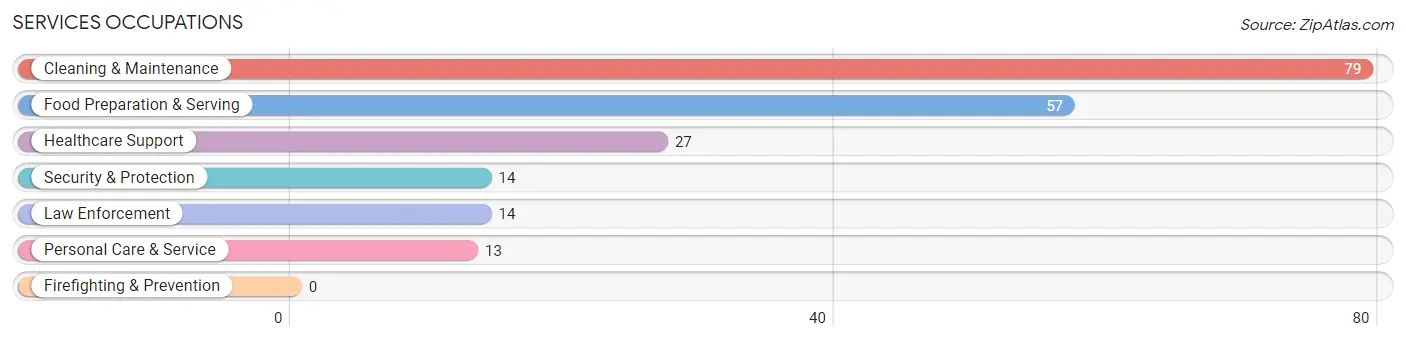
Services Occupations
The most common Services occupations in Keshena are Cleaning & Maintenance (79 | 16.9%), Food Preparation & Serving (57 | 12.2%), Healthcare Support (27 | 5.8%), Security & Protection (14 | 3.0%), and Law Enforcement (14 | 3.0%).
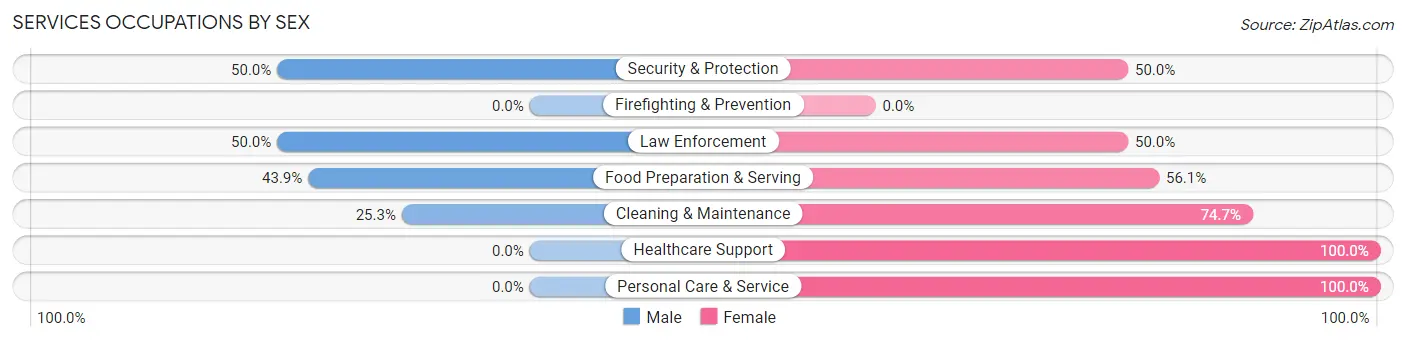
Services Occupations by Sex
Within the Services occupations in Keshena, the most male-oriented occupations are Security & Protection (50.0%), Law Enforcement (50.0%), and Food Preparation & Serving (43.9%), while the most female-oriented occupations are Healthcare Support (100.0%), Personal Care & Service (100.0%), and Cleaning & Maintenance (74.7%).
| Occupation | Male | Female |
| Healthcare Support | 0 (0.0%) | 27 (100.0%) |
| Security & Protection | 7 (50.0%) | 7 (50.0%) |
| Firefighting & Prevention | 0 (0.0%) | 0 (0.0%) |
| Law Enforcement | 7 (50.0%) | 7 (50.0%) |
| Food Preparation & Serving | 25 (43.9%) | 32 (56.1%) |
| Cleaning & Maintenance | 20 (25.3%) | 59 (74.7%) |
| Personal Care & Service | 0 (0.0%) | 13 (100.0%) |
| Total (Category) | 52 (27.4%) | 138 (72.6%) |
| Total (Overall) | 149 (31.9%) | 318 (68.1%) |
Sales and Office Occupations
The most common Sales and Office occupations in Keshena are Office & Administration (99 | 21.2%), and Sales & Related (15 | 3.2%).
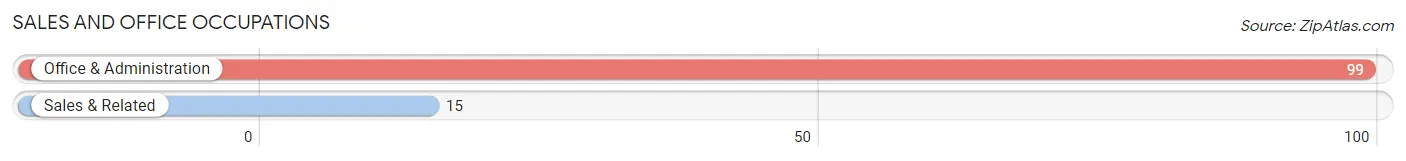
Sales and Office Occupations by Sex
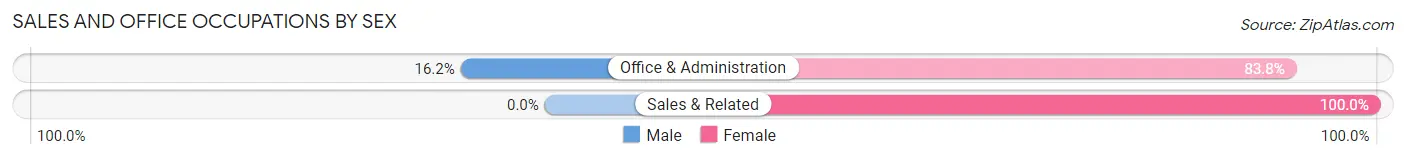
| Occupation | Male | Female |
| Sales & Related | 0 (0.0%) | 15 (100.0%) |
| Office & Administration | 16 (16.2%) | 83 (83.8%) |
| Total (Category) | 16 (14.0%) | 98 (86.0%) |
| Total (Overall) | 149 (31.9%) | 318 (68.1%) |
Natural Resources, Construction and Maintenance Occupations
The most common Natural Resources, Construction and Maintenance occupations in Keshena are , and Installation, Maintenance & Repair (37 | 7.9%).
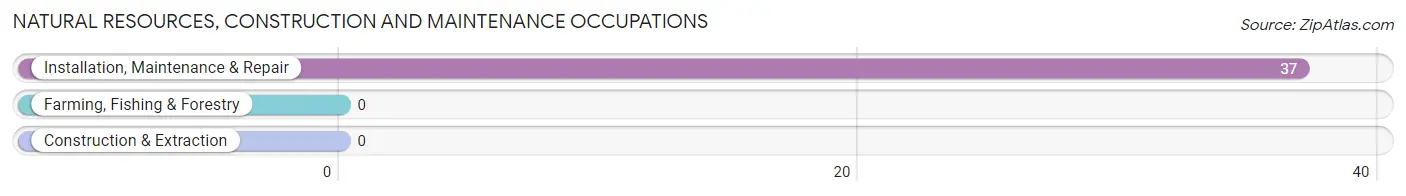
Natural Resources, Construction and Maintenance Occupations by Sex
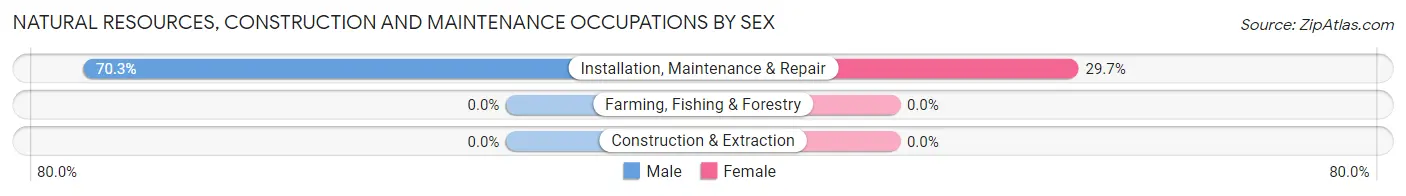
| Occupation | Male | Female |
| Farming, Fishing & Forestry | 0 (0.0%) | 0 (0.0%) |
| Construction & Extraction | 0 (0.0%) | 0 (0.0%) |
| Installation, Maintenance & Repair | 26 (70.3%) | 11 (29.7%) |
| Total (Category) | 26 (70.3%) | 11 (29.7%) |
| Total (Overall) | 149 (31.9%) | 318 (68.1%) |
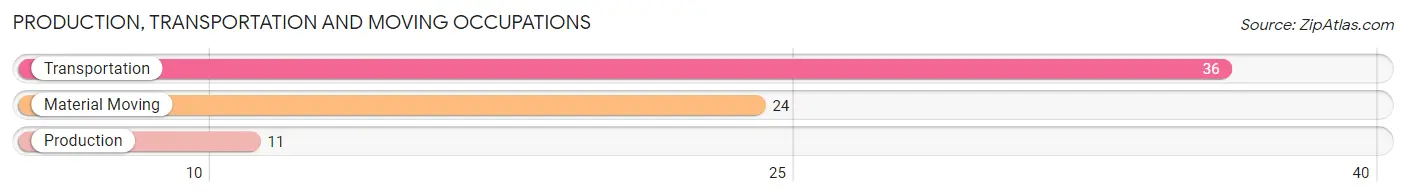
Production, Transportation and Moving Occupations
The most common Production, Transportation and Moving occupations in Keshena are Transportation (36 | 7.7%), Material Moving (24 | 5.1%), and Production (11 | 2.4%).
Production, Transportation and Moving Occupations by Sex
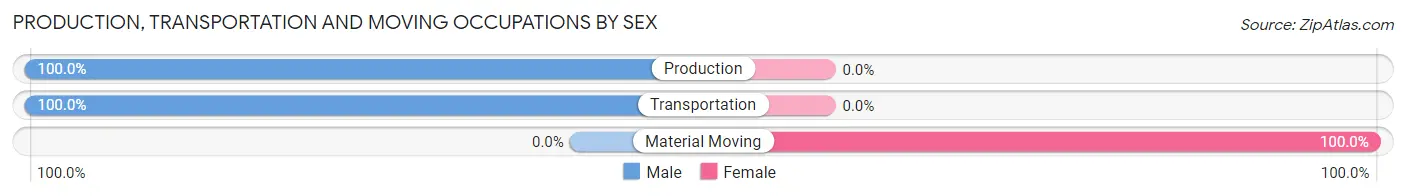
| Occupation | Male | Female |
| Production | 11 (100.0%) | 0 (0.0%) |
| Transportation | 36 (100.0%) | 0 (0.0%) |
| Material Moving | 0 (0.0%) | 24 (100.0%) |
| Total (Category) | 47 (66.2%) | 24 (33.8%) |
| Total (Overall) | 149 (31.9%) | 318 (68.1%) |
Employment Industries by Sex in Keshena
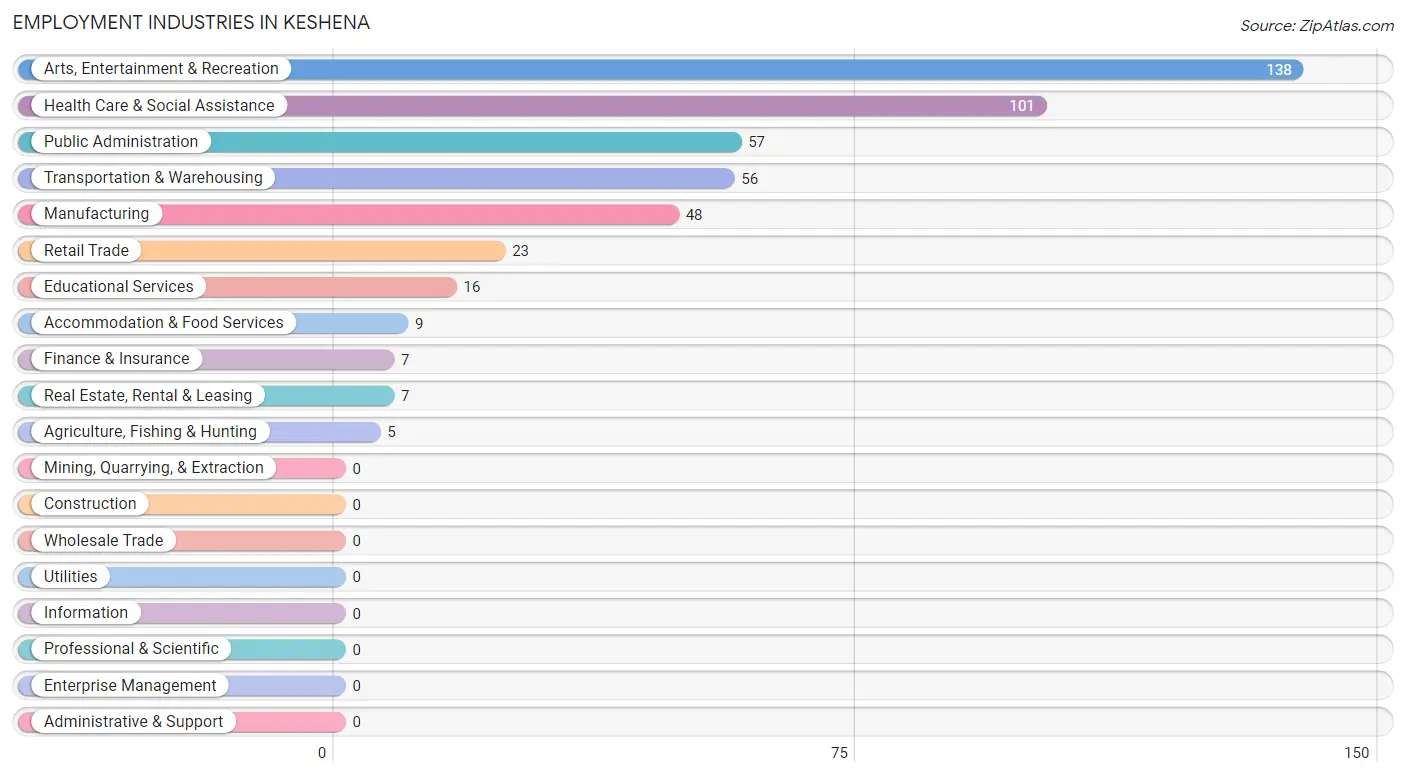
Employment Industries in Keshena
The major employment industries in Keshena include Arts, Entertainment & Recreation (138 | 29.5%), Health Care & Social Assistance (101 | 21.6%), Public Administration (57 | 12.2%), Transportation & Warehousing (56 | 12.0%), and Manufacturing (48 | 10.3%).
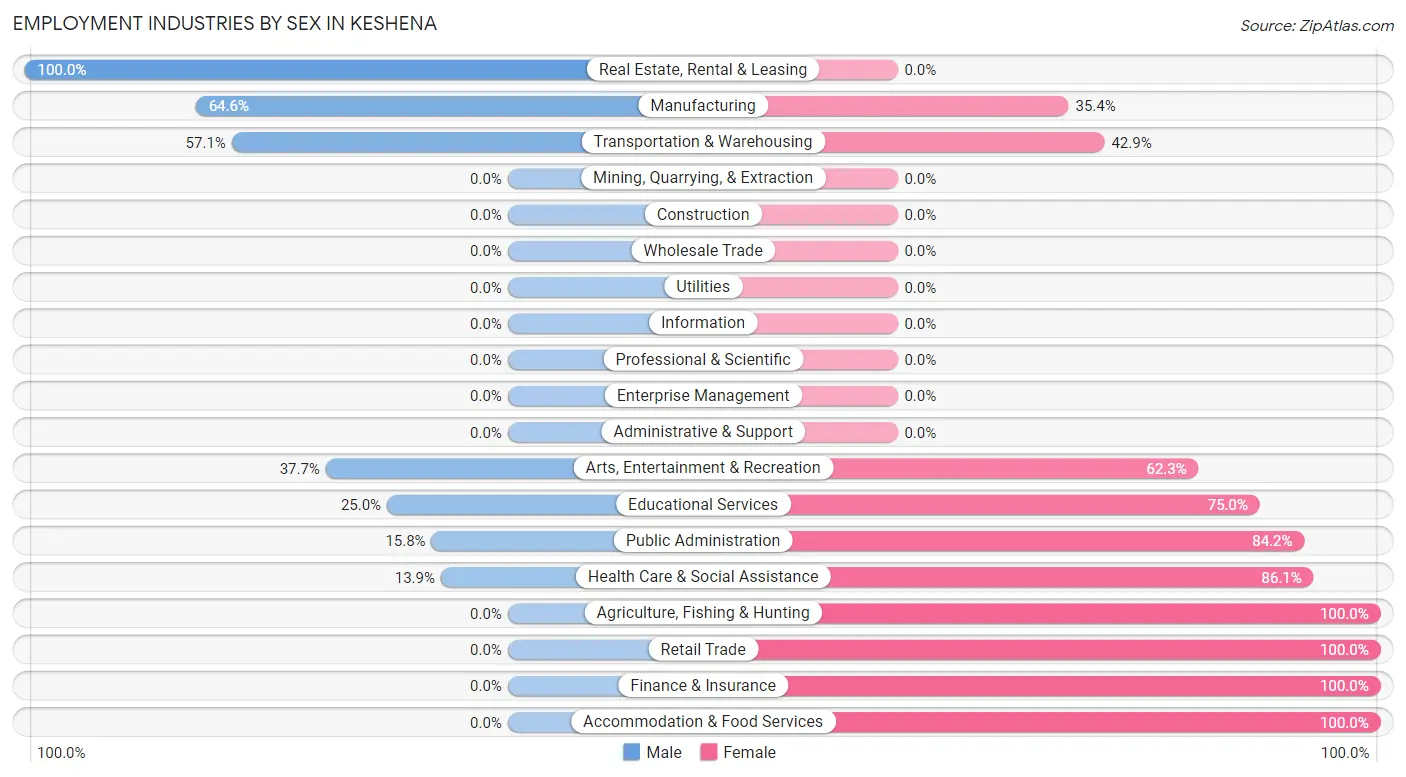
Employment Industries by Sex in Keshena
The Keshena industries that see more men than women are Real Estate, Rental & Leasing (100.0%), Manufacturing (64.6%), and Transportation & Warehousing (57.1%), whereas the industries that tend to have a higher number of women are Agriculture, Fishing & Hunting (100.0%), Retail Trade (100.0%), and Finance & Insurance (100.0%).
| Industry | Male | Female |
| Agriculture, Fishing & Hunting | 0 (0.0%) | 5 (100.0%) |
| Mining, Quarrying, & Extraction | 0 (0.0%) | 0 (0.0%) |
| Construction | 0 (0.0%) | 0 (0.0%) |
| Manufacturing | 31 (64.6%) | 17 (35.4%) |
| Wholesale Trade | 0 (0.0%) | 0 (0.0%) |
| Retail Trade | 0 (0.0%) | 23 (100.0%) |
| Transportation & Warehousing | 32 (57.1%) | 24 (42.9%) |
| Utilities | 0 (0.0%) | 0 (0.0%) |
| Information | 0 (0.0%) | 0 (0.0%) |
| Finance & Insurance | 0 (0.0%) | 7 (100.0%) |
| Real Estate, Rental & Leasing | 7 (100.0%) | 0 (0.0%) |
| Professional & Scientific | 0 (0.0%) | 0 (0.0%) |
| Enterprise Management | 0 (0.0%) | 0 (0.0%) |
| Administrative & Support | 0 (0.0%) | 0 (0.0%) |
| Educational Services | 4 (25.0%) | 12 (75.0%) |
| Health Care & Social Assistance | 14 (13.9%) | 87 (86.1%) |
| Arts, Entertainment & Recreation | 52 (37.7%) | 86 (62.3%) |
| Accommodation & Food Services | 0 (0.0%) | 9 (100.0%) |
| Public Administration | 9 (15.8%) | 48 (84.2%) |
| Total | 149 (31.9%) | 318 (68.1%) |
Education in Keshena
School Enrollment in Keshena
The most common levels of schooling among the 518 students in Keshena are elementary school (140 | 27.0%), high school (138 | 26.6%), and middle school (126 | 24.3%).
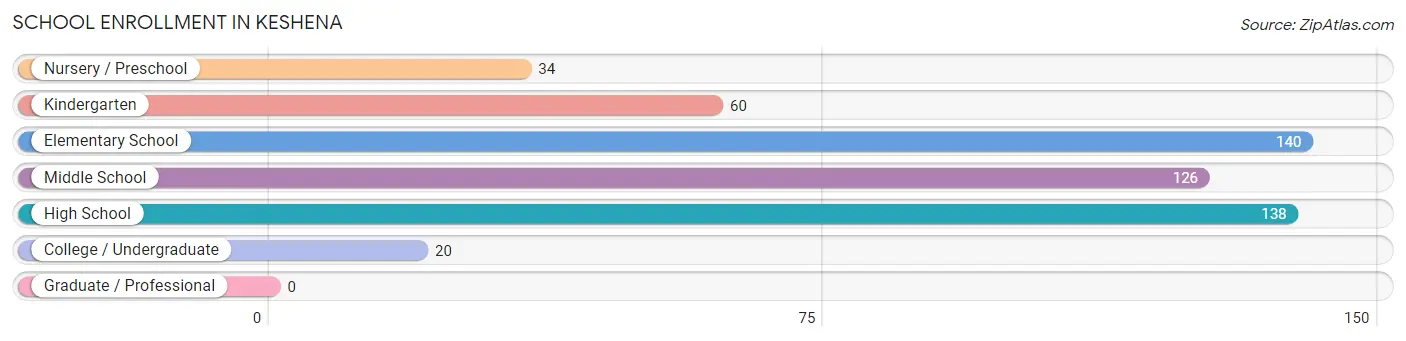
| School Level | # Students | % Students |
| Nursery / Preschool | 34 | 6.6% |
| Kindergarten | 60 | 11.6% |
| Elementary School | 140 | 27.0% |
| Middle School | 126 | 24.3% |
| High School | 138 | 26.6% |
| College / Undergraduate | 20 | 3.9% |
| Graduate / Professional | 0 | 0.0% |
| Total | 518 | 100.0% |
School Enrollment by Age by Funding Source in Keshena
Out of a total of 518 students who are enrolled in schools in Keshena, 18 (3.5%) attend a private institution, while the remaining 500 (96.5%) are enrolled in public schools. The age group of 10 to 14 year olds has the highest likelihood of being enrolled in private schools, with 10 (5.4% in the age bracket) enrolled. Conversely, the age group of 3 to 4 year olds has the lowest likelihood of being enrolled in a private school, with 42 (100.0% in the age bracket) attending a public institution.
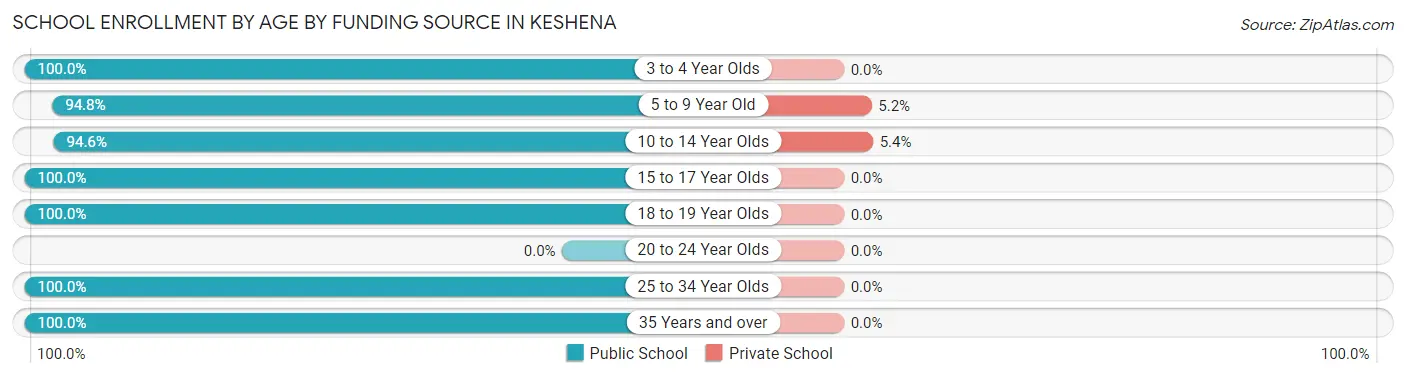
| Age Bracket | Public School | Private School |
| 3 to 4 Year Olds | 42 (100.0%) | 0 (0.0%) |
| 5 to 9 Year Old | 147 (94.8%) | 8 (5.2%) |
| 10 to 14 Year Olds | 175 (94.6%) | 10 (5.4%) |
| 15 to 17 Year Olds | 106 (100.0%) | 0 (0.0%) |
| 18 to 19 Year Olds | 10 (100.0%) | 0 (0.0%) |
| 20 to 24 Year Olds | 0 (0.0%) | 0 (0.0%) |
| 25 to 34 Year Olds | 12 (100.0%) | 0 (0.0%) |
| 35 Years and over | 8 (100.0%) | 0 (0.0%) |
| Total | 500 (96.5%) | 18 (3.5%) |
Educational Attainment by Field of Study in Keshena
Business (11 | 40.7%), education (7 | 25.9%), arts & humanities (5 | 18.5%), social sciences (2 | 7.4%), and liberal arts & history (2 | 7.4%) are the most common fields of study among 27 individuals in Keshena who have obtained a bachelor's degree or higher.
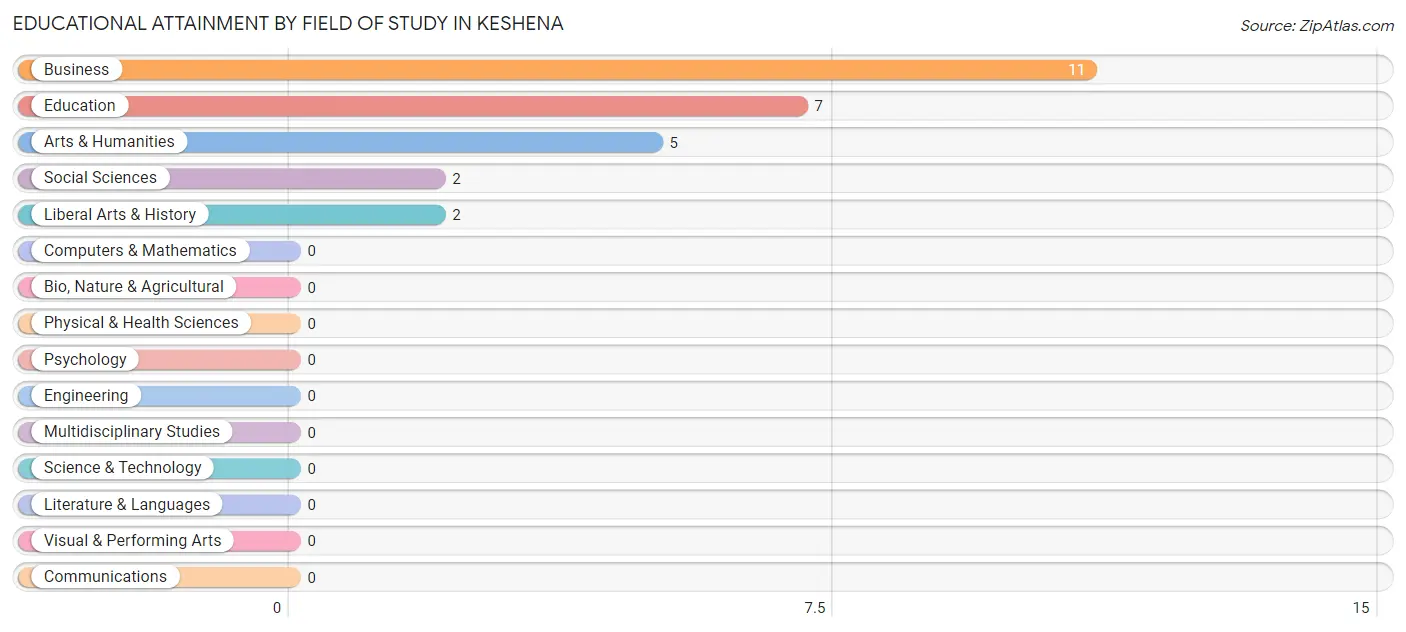
| Field of Study | # Graduates | % Graduates |
| Computers & Mathematics | 0 | 0.0% |
| Bio, Nature & Agricultural | 0 | 0.0% |
| Physical & Health Sciences | 0 | 0.0% |
| Psychology | 0 | 0.0% |
| Social Sciences | 2 | 7.4% |
| Engineering | 0 | 0.0% |
| Multidisciplinary Studies | 0 | 0.0% |
| Science & Technology | 0 | 0.0% |
| Business | 11 | 40.7% |
| Education | 7 | 25.9% |
| Literature & Languages | 0 | 0.0% |
| Liberal Arts & History | 2 | 7.4% |
| Visual & Performing Arts | 0 | 0.0% |
| Communications | 0 | 0.0% |
| Arts & Humanities | 5 | 18.5% |
| Total | 27 | 100.0% |
Transportation & Commute in Keshena
Vehicle Availability by Sex in Keshena
The most prevalent vehicle ownership categories in Keshena are males with 2 vehicles (94, accounting for 63.1%) and females with 2 vehicles (147, making up 31.8%).
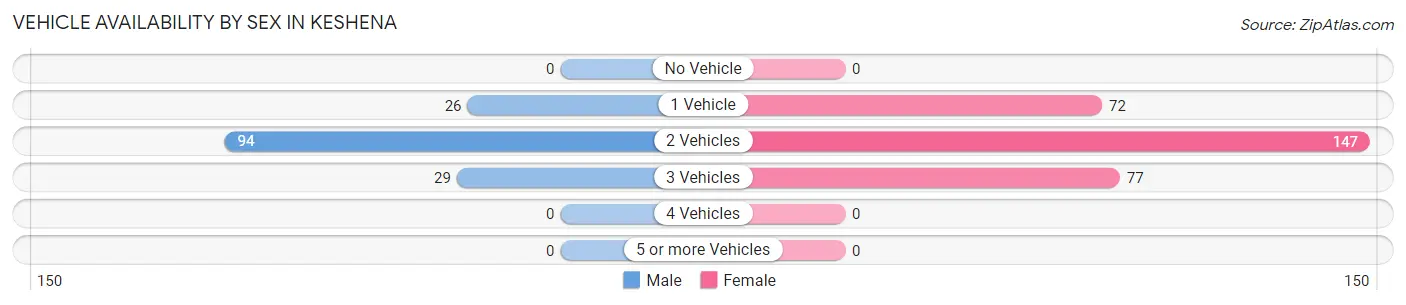
| Vehicles Available | Male | Female |
| No Vehicle | 0 (0.0%) | 0 (0.0%) |
| 1 Vehicle | 26 (17.4%) | 72 (24.3%) |
| 2 Vehicles | 94 (63.1%) | 147 (49.7%) |
| 3 Vehicles | 29 (19.5%) | 77 (26.0%) |
| 4 Vehicles | 0 (0.0%) | 0 (0.0%) |
| 5 or more Vehicles | 0 (0.0%) | 0 (0.0%) |
| Total | 149 (100.0%) | 296 (100.0%) |
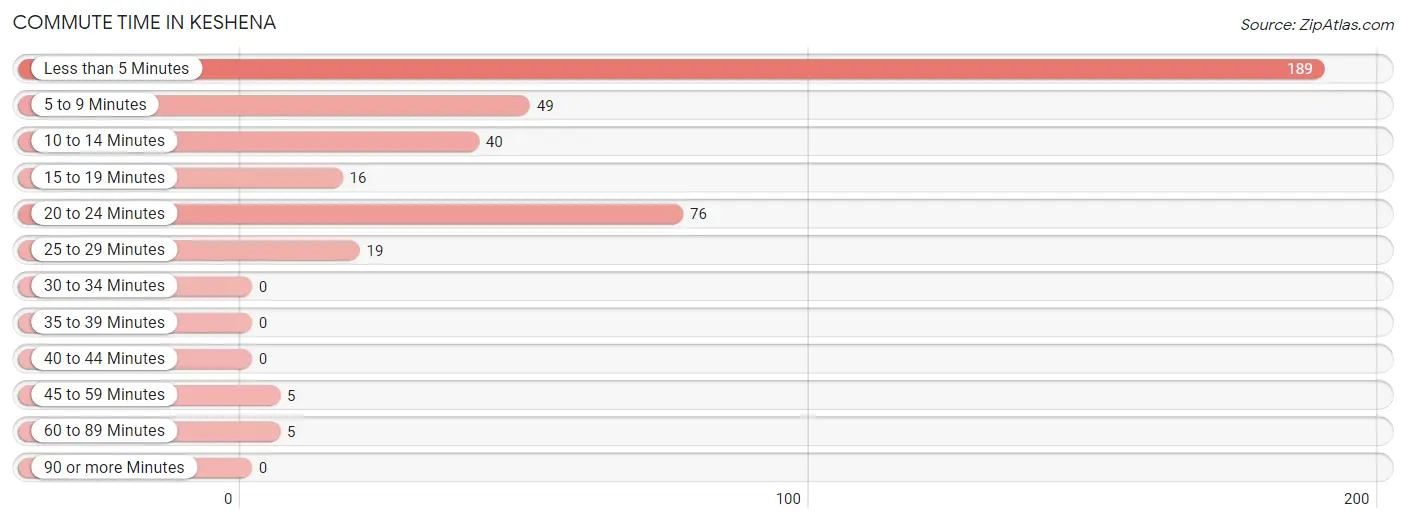
Commute Time in Keshena
The most frequently occuring commute durations in Keshena are less than 5 minutes (189 commuters, 47.4%), 20 to 24 minutes (76 commuters, 19.1%), and 5 to 9 minutes (49 commuters, 12.3%).
| Commute Time | # Commuters | % Commuters |
| Less than 5 Minutes | 189 | 47.4% |
| 5 to 9 Minutes | 49 | 12.3% |
| 10 to 14 Minutes | 40 | 10.0% |
| 15 to 19 Minutes | 16 | 4.0% |
| 20 to 24 Minutes | 76 | 19.1% |
| 25 to 29 Minutes | 19 | 4.8% |
| 30 to 34 Minutes | 0 | 0.0% |
| 35 to 39 Minutes | 0 | 0.0% |
| 40 to 44 Minutes | 0 | 0.0% |
| 45 to 59 Minutes | 5 | 1.3% |
| 60 to 89 Minutes | 5 | 1.3% |
| 90 or more Minutes | 0 | 0.0% |
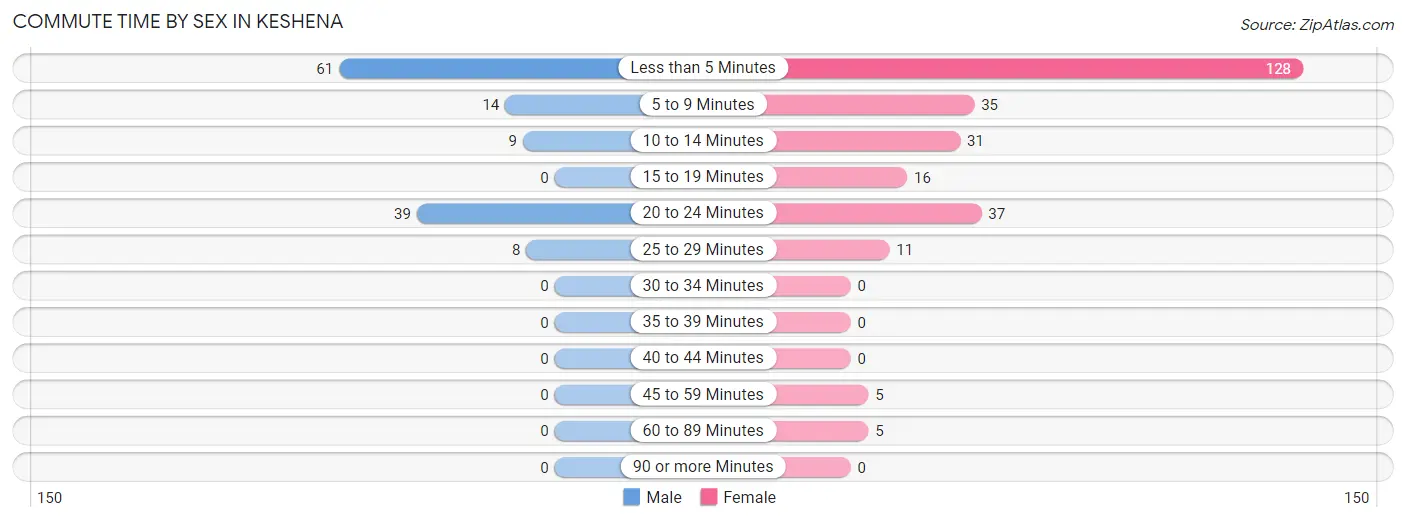
Commute Time by Sex in Keshena
The most common commute times in Keshena are less than 5 minutes (61 commuters, 46.6%) for males and less than 5 minutes (128 commuters, 47.8%) for females.
| Commute Time | Male | Female |
| Less than 5 Minutes | 61 (46.6%) | 128 (47.8%) |
| 5 to 9 Minutes | 14 (10.7%) | 35 (13.1%) |
| 10 to 14 Minutes | 9 (6.9%) | 31 (11.6%) |
| 15 to 19 Minutes | 0 (0.0%) | 16 (6.0%) |
| 20 to 24 Minutes | 39 (29.8%) | 37 (13.8%) |
| 25 to 29 Minutes | 8 (6.1%) | 11 (4.1%) |
| 30 to 34 Minutes | 0 (0.0%) | 0 (0.0%) |
| 35 to 39 Minutes | 0 (0.0%) | 0 (0.0%) |
| 40 to 44 Minutes | 0 (0.0%) | 0 (0.0%) |
| 45 to 59 Minutes | 0 (0.0%) | 5 (1.9%) |
| 60 to 89 Minutes | 0 (0.0%) | 5 (1.9%) |
| 90 or more Minutes | 0 (0.0%) | 0 (0.0%) |
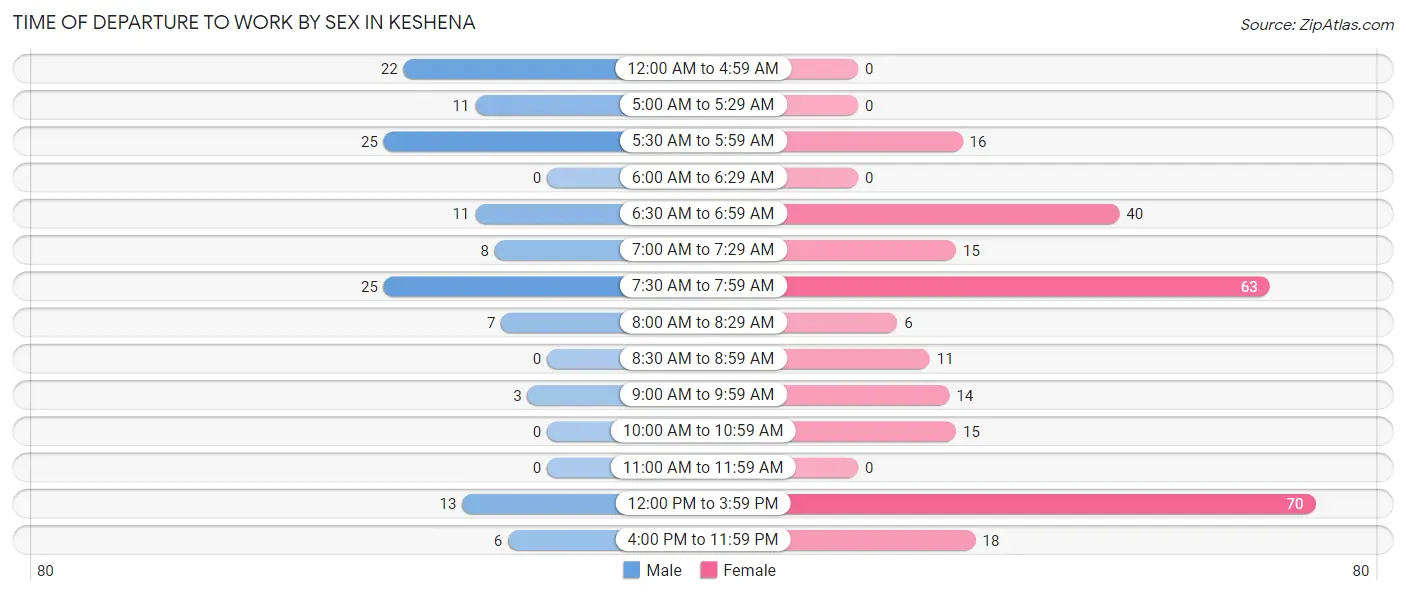
Time of Departure to Work by Sex in Keshena
The most frequent times of departure to work in Keshena are 5:30 AM to 5:59 AM (25, 19.1%) for males and 12:00 PM to 3:59 PM (70, 26.1%) for females.
| Time of Departure | Male | Female |
| 12:00 AM to 4:59 AM | 22 (16.8%) | 0 (0.0%) |
| 5:00 AM to 5:29 AM | 11 (8.4%) | 0 (0.0%) |
| 5:30 AM to 5:59 AM | 25 (19.1%) | 16 (6.0%) |
| 6:00 AM to 6:29 AM | 0 (0.0%) | 0 (0.0%) |
| 6:30 AM to 6:59 AM | 11 (8.4%) | 40 (14.9%) |
| 7:00 AM to 7:29 AM | 8 (6.1%) | 15 (5.6%) |
| 7:30 AM to 7:59 AM | 25 (19.1%) | 63 (23.5%) |
| 8:00 AM to 8:29 AM | 7 (5.3%) | 6 (2.2%) |
| 8:30 AM to 8:59 AM | 0 (0.0%) | 11 (4.1%) |
| 9:00 AM to 9:59 AM | 3 (2.3%) | 14 (5.2%) |
| 10:00 AM to 10:59 AM | 0 (0.0%) | 15 (5.6%) |
| 11:00 AM to 11:59 AM | 0 (0.0%) | 0 (0.0%) |
| 12:00 PM to 3:59 PM | 13 (9.9%) | 70 (26.1%) |
| 4:00 PM to 11:59 PM | 6 (4.6%) | 18 (6.7%) |
| Total | 131 (100.0%) | 268 (100.0%) |
Housing Occupancy in Keshena
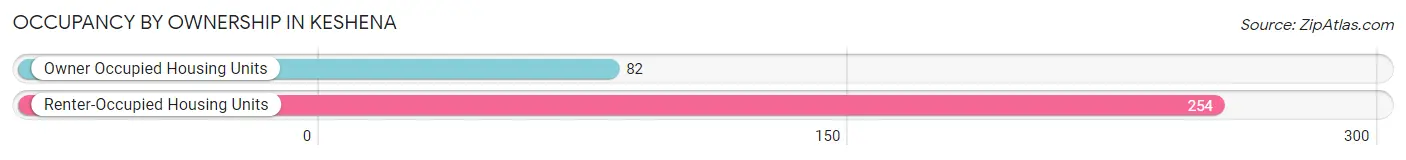
Occupancy by Ownership in Keshena
Of the total 336 dwellings in Keshena, owner-occupied units account for 82 (24.4%), while renter-occupied units make up 254 (75.6%).
| Occupancy | # Housing Units | % Housing Units |
| Owner Occupied Housing Units | 82 | 24.4% |
| Renter-Occupied Housing Units | 254 | 75.6% |
| Total Occupied Housing Units | 336 | 100.0% |
Occupancy by Household Size in Keshena
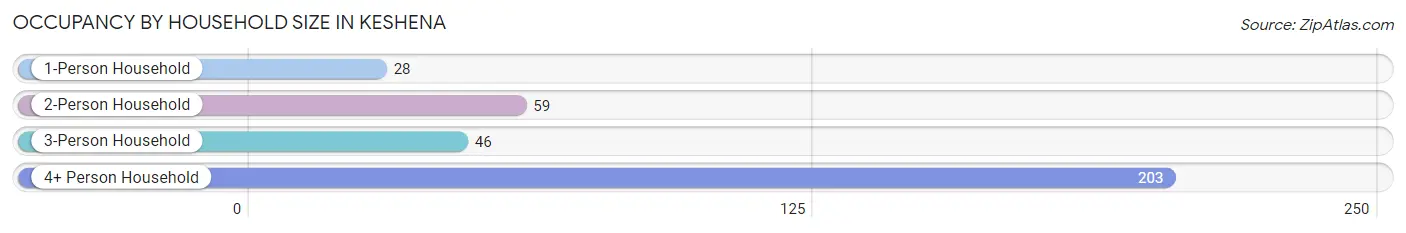
| Household Size | # Housing Units | % Housing Units |
| 1-Person Household | 28 | 8.3% |
| 2-Person Household | 59 | 17.6% |
| 3-Person Household | 46 | 13.7% |
| 4+ Person Household | 203 | 60.4% |
| Total Housing Units | 336 | 100.0% |
Occupancy by Ownership by Household Size in Keshena
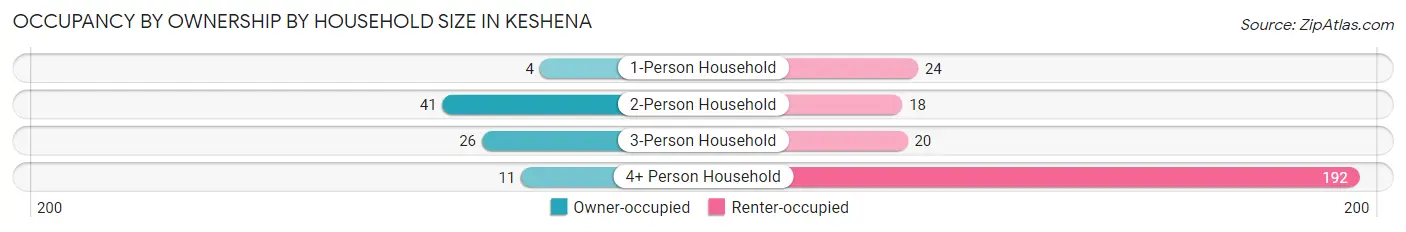
| Household Size | Owner-occupied | Renter-occupied |
| 1-Person Household | 4 (14.3%) | 24 (85.7%) |
| 2-Person Household | 41 (69.5%) | 18 (30.5%) |
| 3-Person Household | 26 (56.5%) | 20 (43.5%) |
| 4+ Person Household | 11 (5.4%) | 192 (94.6%) |
| Total Housing Units | 82 (24.4%) | 254 (75.6%) |
Occupancy by Educational Attainment in Keshena
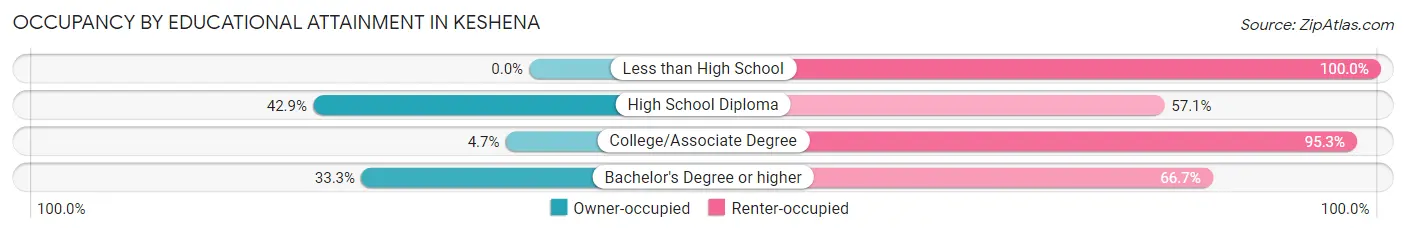
| Household Size | Owner-occupied | Renter-occupied |
| Less than High School | 0 (0.0%) | 8 (100.0%) |
| High School Diploma | 69 (42.9%) | 92 (57.1%) |
| College/Associate Degree | 7 (4.7%) | 142 (95.3%) |
| Bachelor's Degree or higher | 6 (33.3%) | 12 (66.7%) |
Occupancy by Age of Householder in Keshena
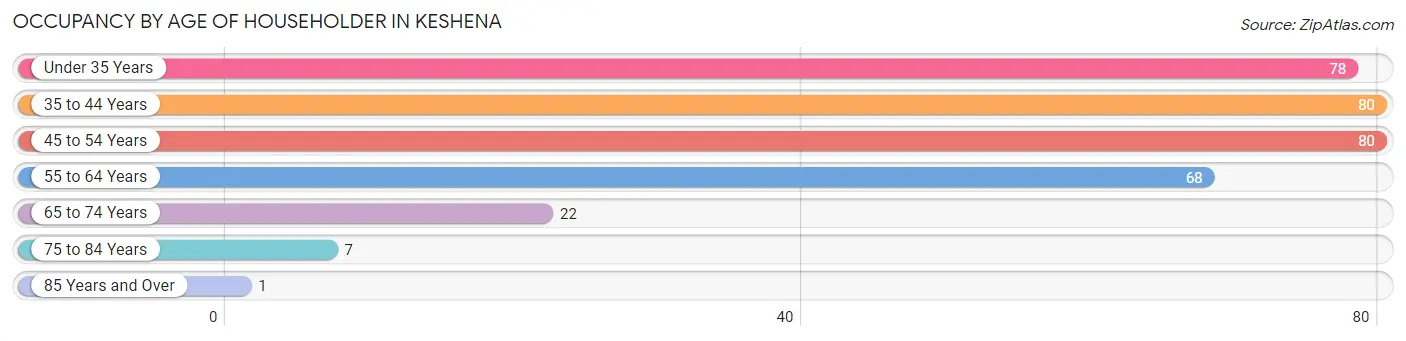
| Age Bracket | # Households | % Households |
| Under 35 Years | 78 | 23.2% |
| 35 to 44 Years | 80 | 23.8% |
| 45 to 54 Years | 80 | 23.8% |
| 55 to 64 Years | 68 | 20.2% |
| 65 to 74 Years | 22 | 6.6% |
| 75 to 84 Years | 7 | 2.1% |
| 85 Years and Over | 1 | 0.3% |
| Total | 336 | 100.0% |
Housing Finances in Keshena
Median Income by Occupancy in Keshena
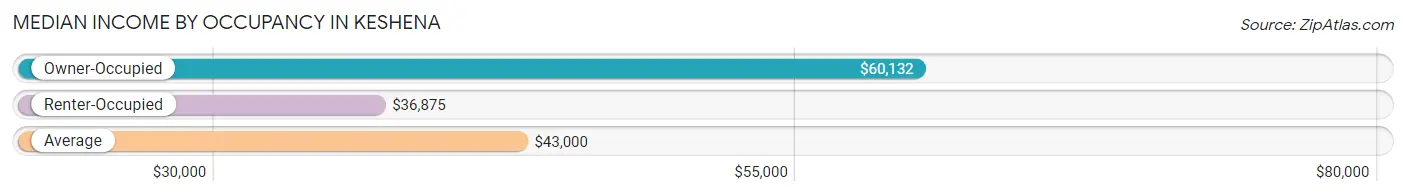
| Occupancy Type | # Households | Median Income |
| Owner-Occupied | 82 (24.4%) | $60,132 |
| Renter-Occupied | 254 (75.6%) | $36,875 |
| Average | 336 (100.0%) | $43,000 |
Occupancy by Householder Income Bracket in Keshena
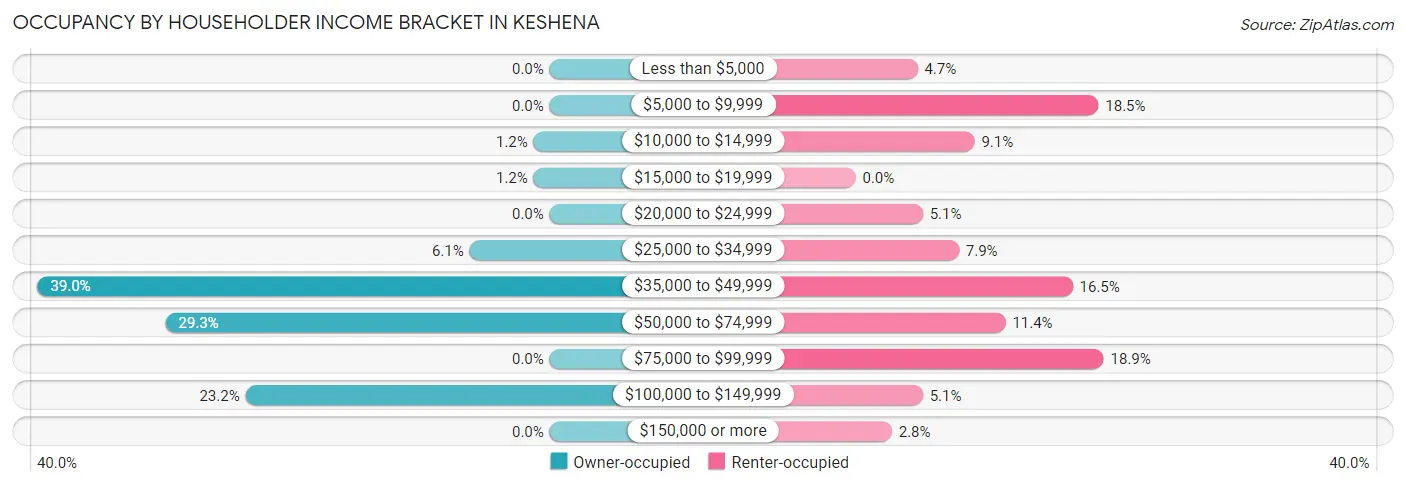
| Income Bracket | Owner-occupied | Renter-occupied |
| Less than $5,000 | 0 (0.0%) | 12 (4.7%) |
| $5,000 to $9,999 | 0 (0.0%) | 47 (18.5%) |
| $10,000 to $14,999 | 1 (1.2%) | 23 (9.1%) |
| $15,000 to $19,999 | 1 (1.2%) | 0 (0.0%) |
| $20,000 to $24,999 | 0 (0.0%) | 13 (5.1%) |
| $25,000 to $34,999 | 5 (6.1%) | 20 (7.9%) |
| $35,000 to $49,999 | 32 (39.0%) | 42 (16.5%) |
| $50,000 to $74,999 | 24 (29.3%) | 29 (11.4%) |
| $75,000 to $99,999 | 0 (0.0%) | 48 (18.9%) |
| $100,000 to $149,999 | 19 (23.2%) | 13 (5.1%) |
| $150,000 or more | 0 (0.0%) | 7 (2.8%) |
| Total | 82 (100.0%) | 254 (100.0%) |
Monthly Housing Cost Tiers in Keshena
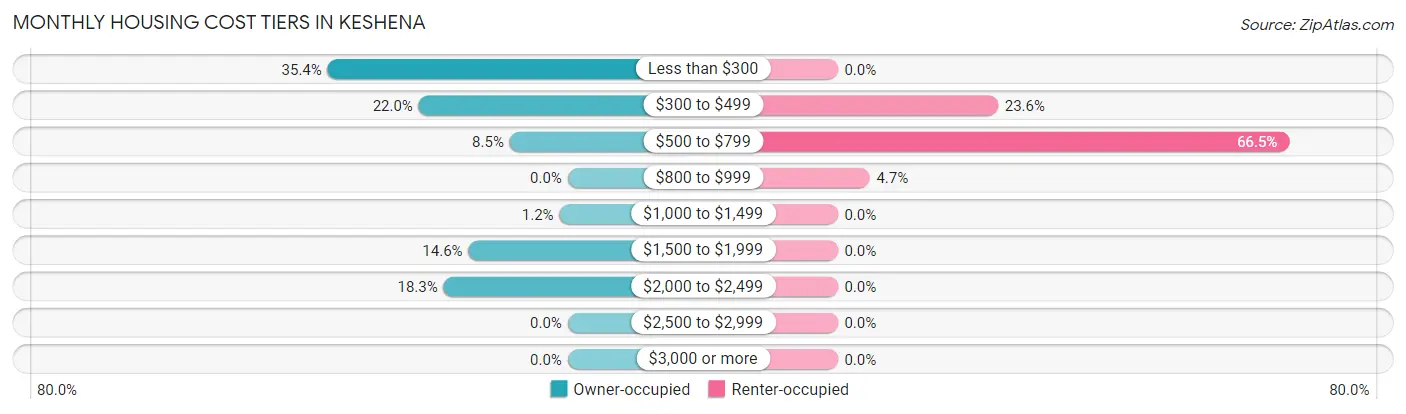
| Monthly Cost | Owner-occupied | Renter-occupied |
| Less than $300 | 29 (35.4%) | 0 (0.0%) |
| $300 to $499 | 18 (22.0%) | 60 (23.6%) |
| $500 to $799 | 7 (8.5%) | 169 (66.5%) |
| $800 to $999 | 0 (0.0%) | 12 (4.7%) |
| $1,000 to $1,499 | 1 (1.2%) | 0 (0.0%) |
| $1,500 to $1,999 | 12 (14.6%) | 0 (0.0%) |
| $2,000 to $2,499 | 15 (18.3%) | 0 (0.0%) |
| $2,500 to $2,999 | 0 (0.0%) | 0 (0.0%) |
| $3,000 or more | 0 (0.0%) | 0 (0.0%) |
| Total | 82 (100.0%) | 254 (100.0%) |
Physical Housing Characteristics in Keshena
Housing Structures in Keshena
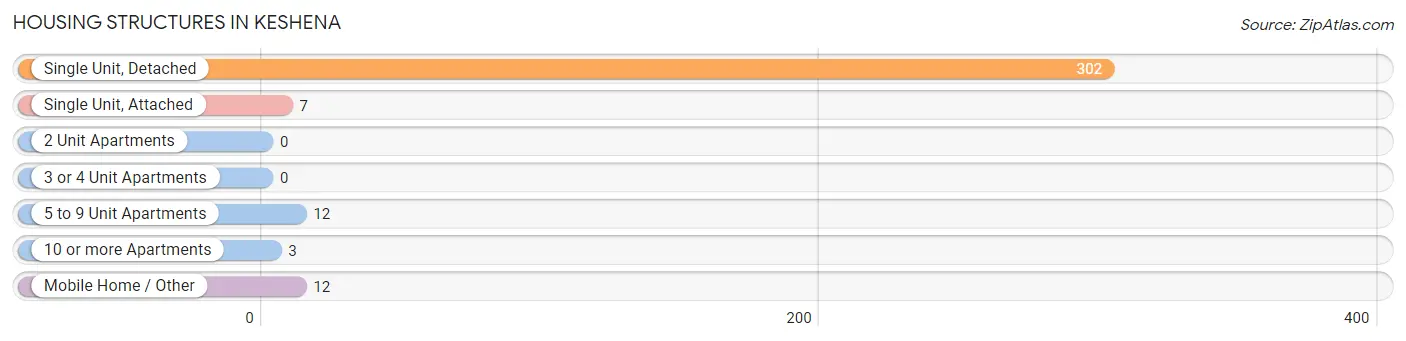
| Structure Type | # Housing Units | % Housing Units |
| Single Unit, Detached | 302 | 89.9% |
| Single Unit, Attached | 7 | 2.1% |
| 2 Unit Apartments | 0 | 0.0% |
| 3 or 4 Unit Apartments | 0 | 0.0% |
| 5 to 9 Unit Apartments | 12 | 3.6% |
| 10 or more Apartments | 3 | 0.9% |
| Mobile Home / Other | 12 | 3.6% |
| Total | 336 | 100.0% |
Housing Structures by Occupancy in Keshena
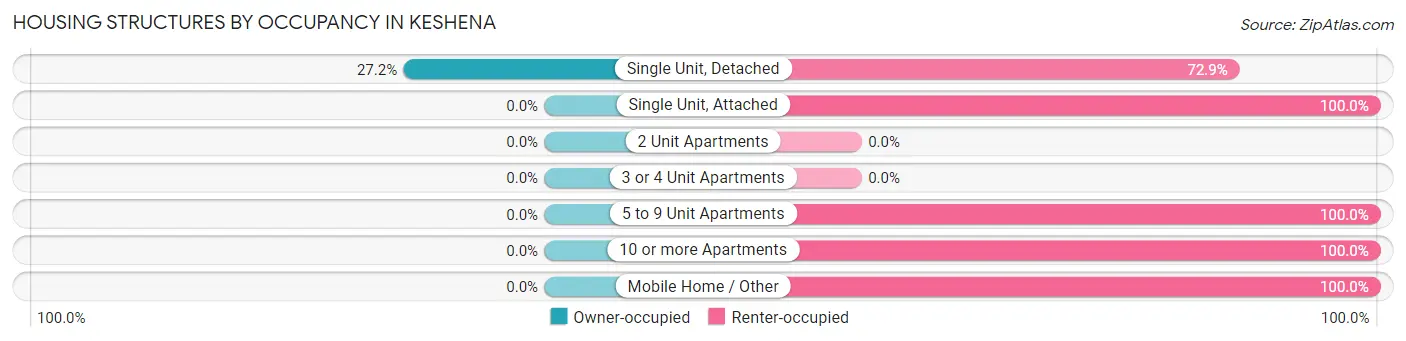
| Structure Type | Owner-occupied | Renter-occupied |
| Single Unit, Detached | 82 (27.2%) | 220 (72.9%) |
| Single Unit, Attached | 0 (0.0%) | 7 (100.0%) |
| 2 Unit Apartments | 0 (0.0%) | 0 (0.0%) |
| 3 or 4 Unit Apartments | 0 (0.0%) | 0 (0.0%) |
| 5 to 9 Unit Apartments | 0 (0.0%) | 12 (100.0%) |
| 10 or more Apartments | 0 (0.0%) | 3 (100.0%) |
| Mobile Home / Other | 0 (0.0%) | 12 (100.0%) |
| Total | 82 (24.4%) | 254 (75.6%) |
Housing Structures by Number of Rooms in Keshena
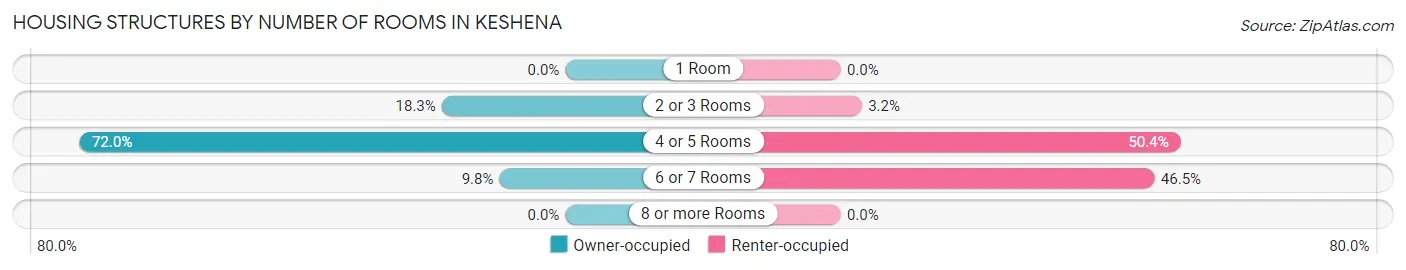
| Number of Rooms | Owner-occupied | Renter-occupied |
| 1 Room | 0 (0.0%) | 0 (0.0%) |
| 2 or 3 Rooms | 15 (18.3%) | 8 (3.2%) |
| 4 or 5 Rooms | 59 (72.0%) | 128 (50.4%) |
| 6 or 7 Rooms | 8 (9.8%) | 118 (46.5%) |
| 8 or more Rooms | 0 (0.0%) | 0 (0.0%) |
| Total | 82 (100.0%) | 254 (100.0%) |
Housing Structure by Heating Type in Keshena
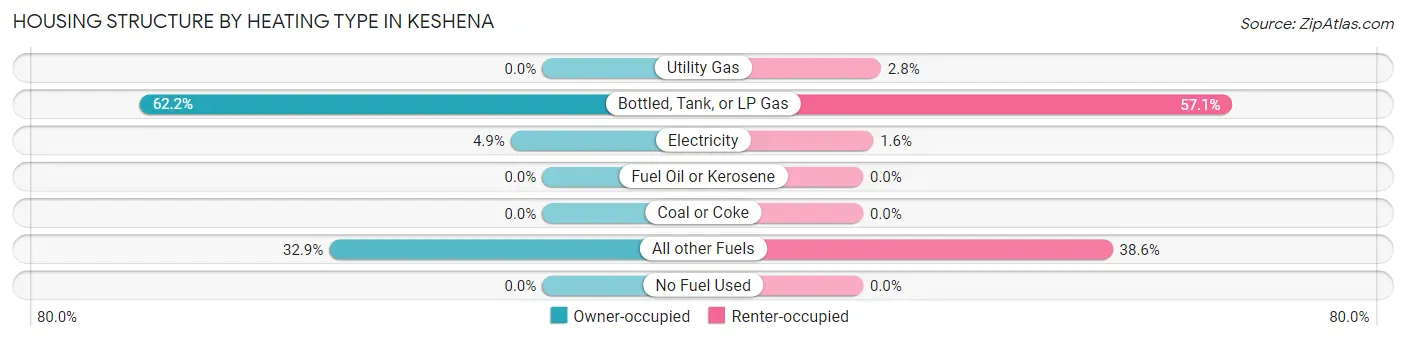
| Heating Type | Owner-occupied | Renter-occupied |
| Utility Gas | 0 (0.0%) | 7 (2.8%) |
| Bottled, Tank, or LP Gas | 51 (62.2%) | 145 (57.1%) |
| Electricity | 4 (4.9%) | 4 (1.6%) |
| Fuel Oil or Kerosene | 0 (0.0%) | 0 (0.0%) |
| Coal or Coke | 0 (0.0%) | 0 (0.0%) |
| All other Fuels | 27 (32.9%) | 98 (38.6%) |
| No Fuel Used | 0 (0.0%) | 0 (0.0%) |
| Total | 82 (100.0%) | 254 (100.0%) |
Household Vehicle Usage in Keshena
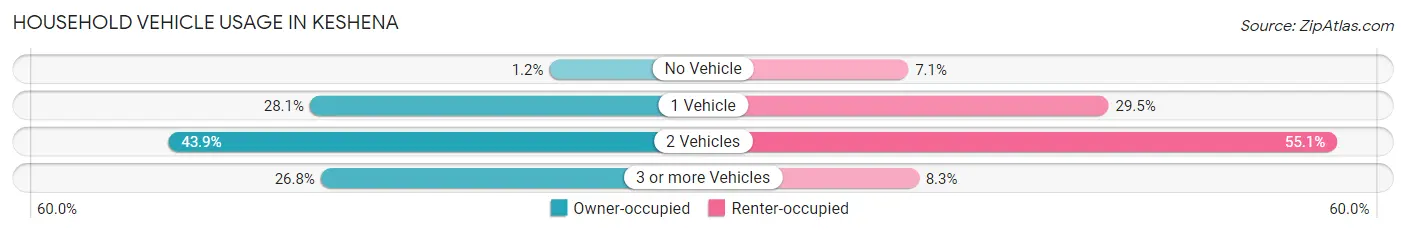
| Vehicles per Household | Owner-occupied | Renter-occupied |
| No Vehicle | 1 (1.2%) | 18 (7.1%) |
| 1 Vehicle | 23 (28.1%) | 75 (29.5%) |
| 2 Vehicles | 36 (43.9%) | 140 (55.1%) |
| 3 or more Vehicles | 22 (26.8%) | 21 (8.3%) |
| Total | 82 (100.0%) | 254 (100.0%) |
Real Estate & Mortgages in Keshena
Real Estate and Mortgage Overview in Keshena
| Characteristic | Without Mortgage | With Mortgage |
| Housing Units | 47 | 35 |
| Median Property Value | $92,500 | $145,200 |
| Median Household Income | $39,514 | $0 |
| Monthly Housing Costs | $289 | $0 |
| Real Estate Taxes | $717 | $0 |
Property Value by Mortgage Status in Keshena
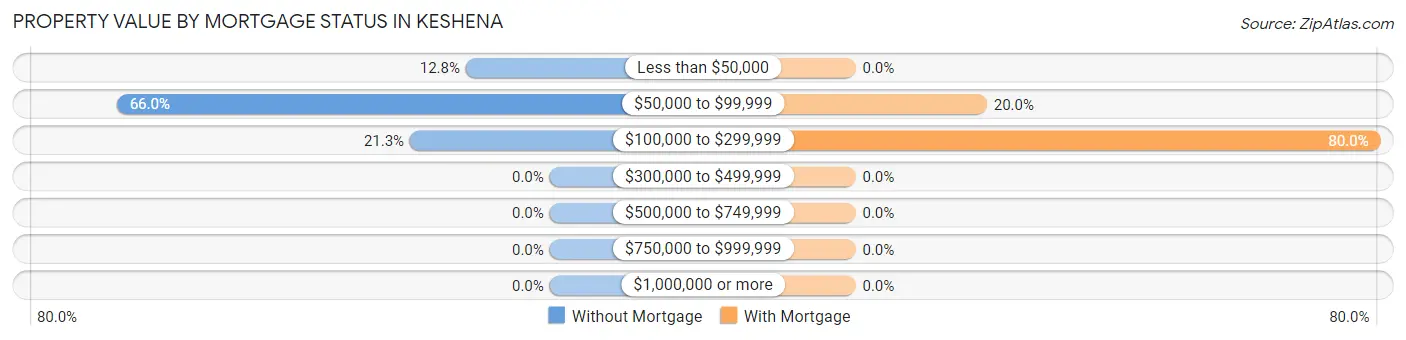
| Property Value | Without Mortgage | With Mortgage |
| Less than $50,000 | 6 (12.8%) | 0 (0.0%) |
| $50,000 to $99,999 | 31 (66.0%) | 7 (20.0%) |
| $100,000 to $299,999 | 10 (21.3%) | 28 (80.0%) |
| $300,000 to $499,999 | 0 (0.0%) | 0 (0.0%) |
| $500,000 to $749,999 | 0 (0.0%) | 0 (0.0%) |
| $750,000 to $999,999 | 0 (0.0%) | 0 (0.0%) |
| $1,000,000 or more | 0 (0.0%) | 0 (0.0%) |
| Total | 47 (100.0%) | 35 (100.0%) |
Household Income by Mortgage Status in Keshena
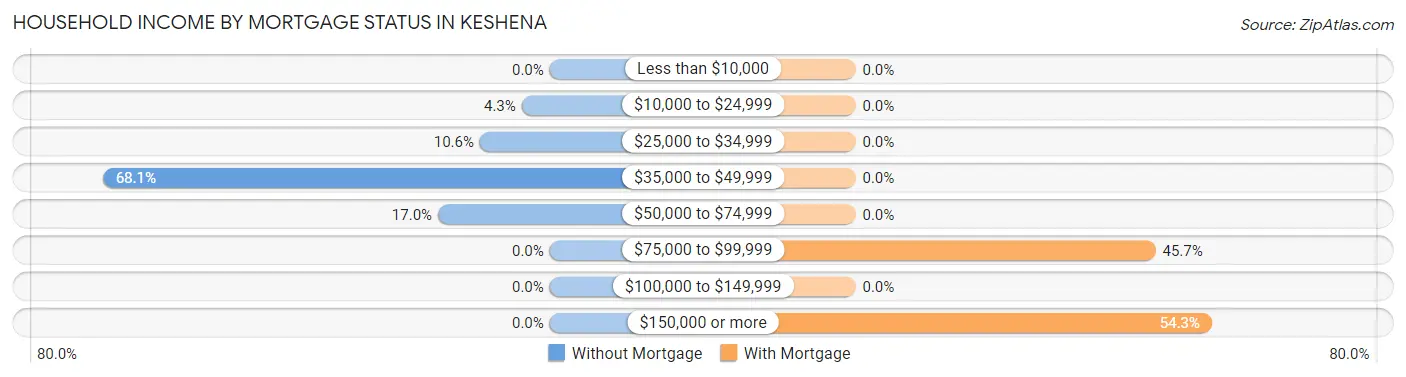
| Household Income | Without Mortgage | With Mortgage |
| Less than $10,000 | 0 (0.0%) | 0 (0.0%) |
| $10,000 to $24,999 | 2 (4.3%) | 0 (0.0%) |
| $25,000 to $34,999 | 5 (10.6%) | 0 (0.0%) |
| $35,000 to $49,999 | 32 (68.1%) | 0 (0.0%) |
| $50,000 to $74,999 | 8 (17.0%) | 0 (0.0%) |
| $75,000 to $99,999 | 0 (0.0%) | 16 (45.7%) |
| $100,000 to $149,999 | 0 (0.0%) | 0 (0.0%) |
| $150,000 or more | 0 (0.0%) | 19 (54.3%) |
| Total | 47 (100.0%) | 35 (100.0%) |
Property Value to Household Income Ratio in Keshena
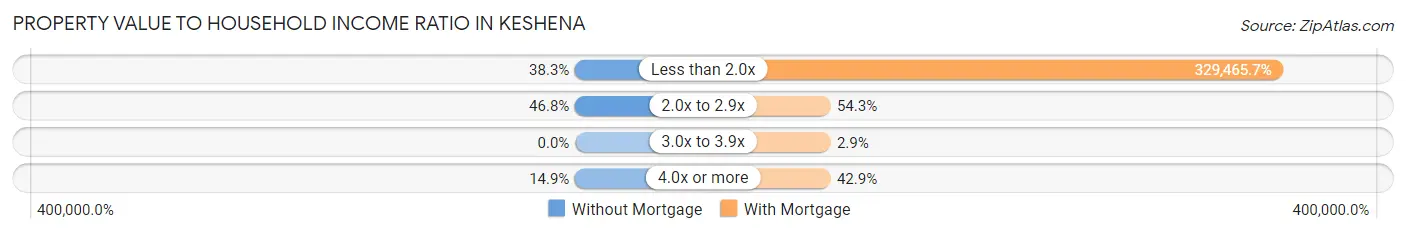
| Value-to-Income Ratio | Without Mortgage | With Mortgage |
| Less than 2.0x | 18 (38.3%) | 115,313 (329,465.7%) |
| 2.0x to 2.9x | 22 (46.8%) | 19 (54.3%) |
| 3.0x to 3.9x | 0 (0.0%) | 1 (2.9%) |
| 4.0x or more | 7 (14.9%) | 15 (42.9%) |
| Total | 47 (100.0%) | 35 (100.0%) |
Real Estate Taxes by Mortgage Status in Keshena
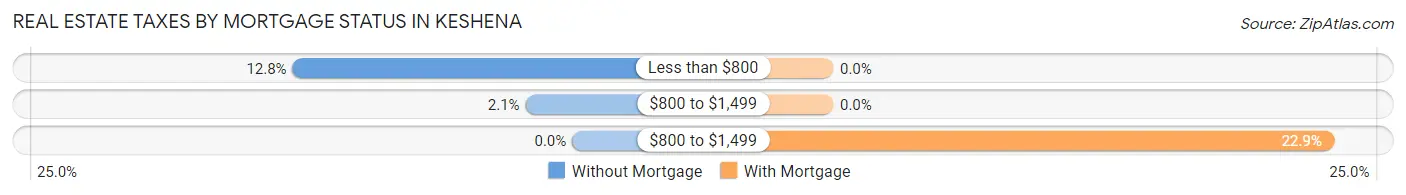
| Property Taxes | Without Mortgage | With Mortgage |
| Less than $800 | 6 (12.8%) | 0 (0.0%) |
| $800 to $1,499 | 1 (2.1%) | 0 (0.0%) |
| $800 to $1,499 | 0 (0.0%) | 8 (22.9%) |
| Total | 47 (100.0%) | 35 (100.0%) |
Health & Disability in Keshena
Health Insurance Coverage by Age in Keshena
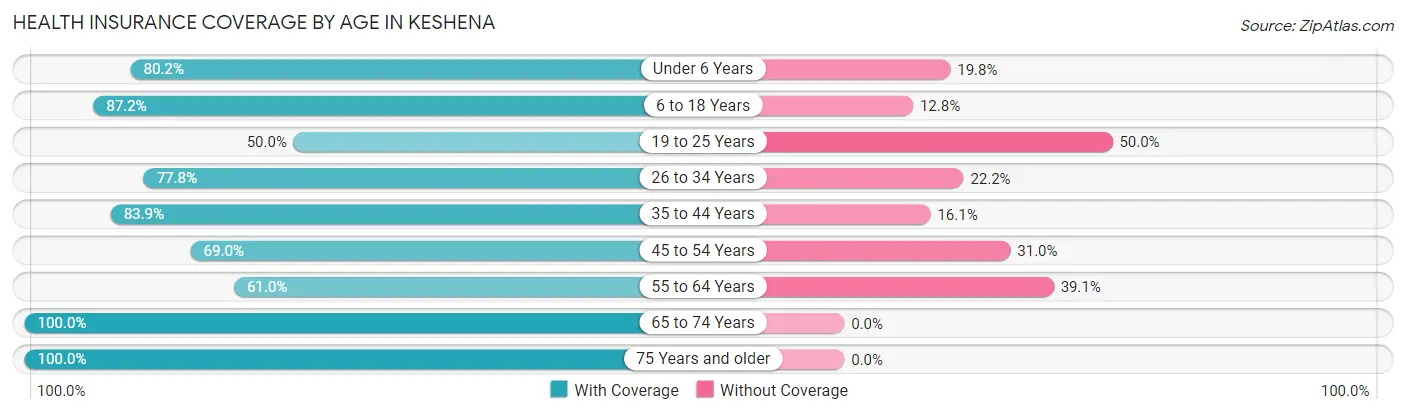
| Age Bracket | With Coverage | Without Coverage |
| Under 6 Years | 138 (80.2%) | 34 (19.8%) |
| 6 to 18 Years | 381 (87.2%) | 56 (12.8%) |
| 19 to 25 Years | 112 (50.0%) | 112 (50.0%) |
| 26 to 34 Years | 112 (77.8%) | 32 (22.2%) |
| 35 to 44 Years | 94 (83.9%) | 18 (16.1%) |
| 45 to 54 Years | 107 (69.0%) | 48 (31.0%) |
| 55 to 64 Years | 64 (61.0%) | 41 (39.1%) |
| 65 to 74 Years | 33 (100.0%) | 0 (0.0%) |
| 75 Years and older | 23 (100.0%) | 0 (0.0%) |
| Total | 1,064 (75.7%) | 341 (24.3%) |
Health Insurance Coverage by Citizenship Status in Keshena
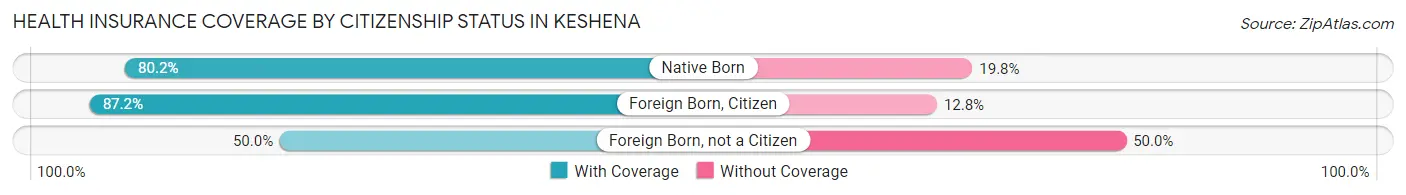
| Citizenship Status | With Coverage | Without Coverage |
| Native Born | 138 (80.2%) | 34 (19.8%) |
| Foreign Born, Citizen | 381 (87.2%) | 56 (12.8%) |
| Foreign Born, not a Citizen | 112 (50.0%) | 112 (50.0%) |
Health Insurance Coverage by Household Income in Keshena
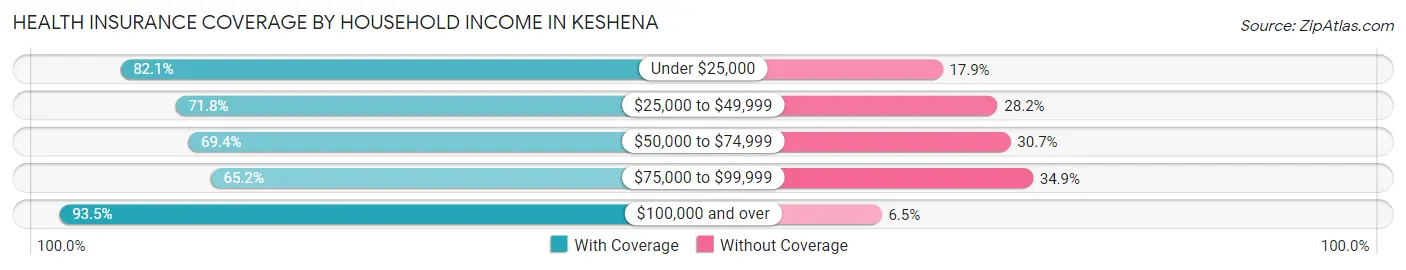
| Household Income | With Coverage | Without Coverage |
| Under $25,000 | 339 (82.1%) | 74 (17.9%) |
| $25,000 to $49,999 | 295 (71.8%) | 116 (28.2%) |
| $50,000 to $74,999 | 129 (69.4%) | 57 (30.6%) |
| $75,000 to $99,999 | 157 (65.1%) | 84 (34.8%) |
| $100,000 and over | 144 (93.5%) | 10 (6.5%) |
Public vs Private Health Insurance Coverage by Age in Keshena
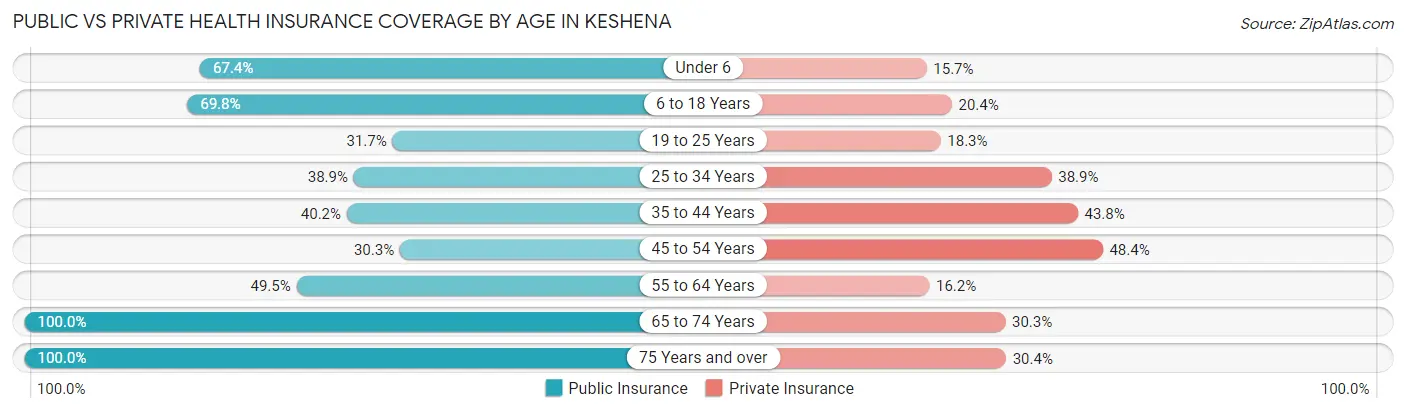
| Age Bracket | Public Insurance | Private Insurance |
| Under 6 | 116 (67.4%) | 27 (15.7%) |
| 6 to 18 Years | 305 (69.8%) | 89 (20.4%) |
| 19 to 25 Years | 71 (31.7%) | 41 (18.3%) |
| 25 to 34 Years | 56 (38.9%) | 56 (38.9%) |
| 35 to 44 Years | 45 (40.2%) | 49 (43.8%) |
| 45 to 54 Years | 47 (30.3%) | 75 (48.4%) |
| 55 to 64 Years | 52 (49.5%) | 17 (16.2%) |
| 65 to 74 Years | 33 (100.0%) | 10 (30.3%) |
| 75 Years and over | 23 (100.0%) | 7 (30.4%) |
| Total | 748 (53.2%) | 371 (26.4%) |
Disability Status by Sex by Age in Keshena
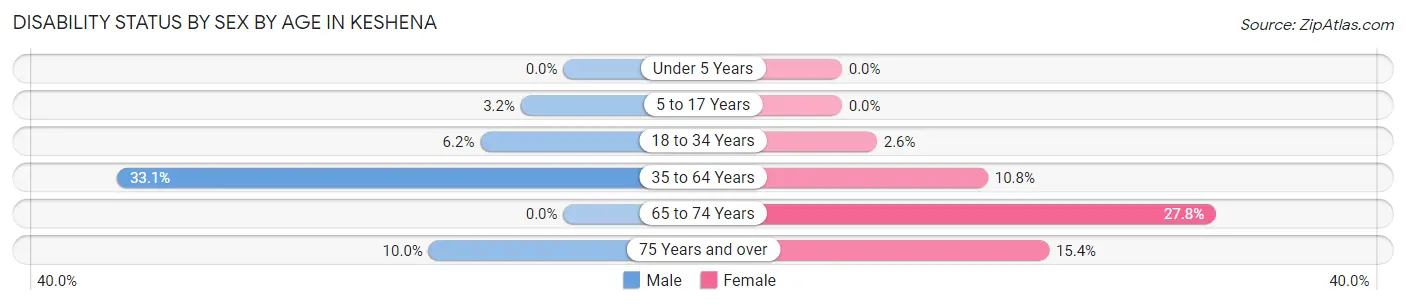
| Age Bracket | Male | Female |
| Under 5 Years | 0 (0.0%) | 0 (0.0%) |
| 5 to 17 Years | 9 (3.2%) | 0 (0.0%) |
| 18 to 34 Years | 10 (6.2%) | 6 (2.6%) |
| 35 to 64 Years | 56 (33.1%) | 22 (10.8%) |
| 65 to 74 Years | 0 (0.0%) | 5 (27.8%) |
| 75 Years and over | 1 (10.0%) | 2 (15.4%) |
Disability Class by Sex by Age in Keshena
Disability Class: Hearing Difficulty
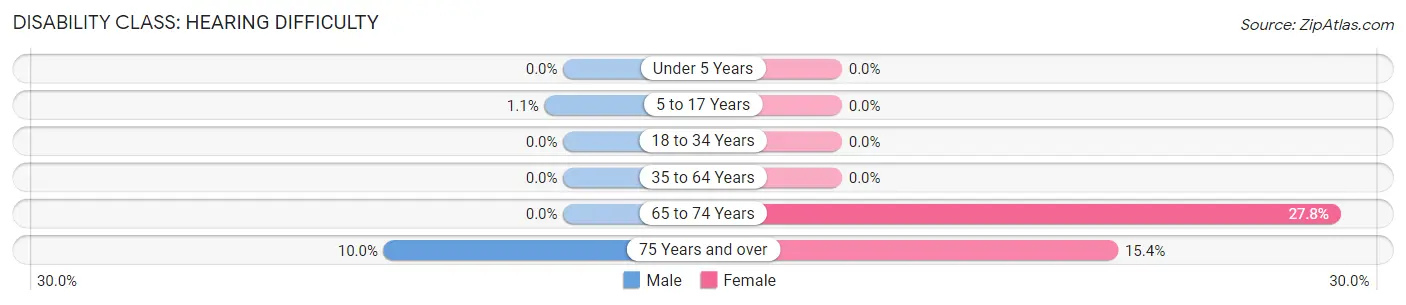
| Age Bracket | Male | Female |
| Under 5 Years | 0 (0.0%) | 0 (0.0%) |
| 5 to 17 Years | 3 (1.1%) | 0 (0.0%) |
| 18 to 34 Years | 0 (0.0%) | 0 (0.0%) |
| 35 to 64 Years | 0 (0.0%) | 0 (0.0%) |
| 65 to 74 Years | 0 (0.0%) | 5 (27.8%) |
| 75 Years and over | 1 (10.0%) | 2 (15.4%) |
Disability Class: Vision Difficulty
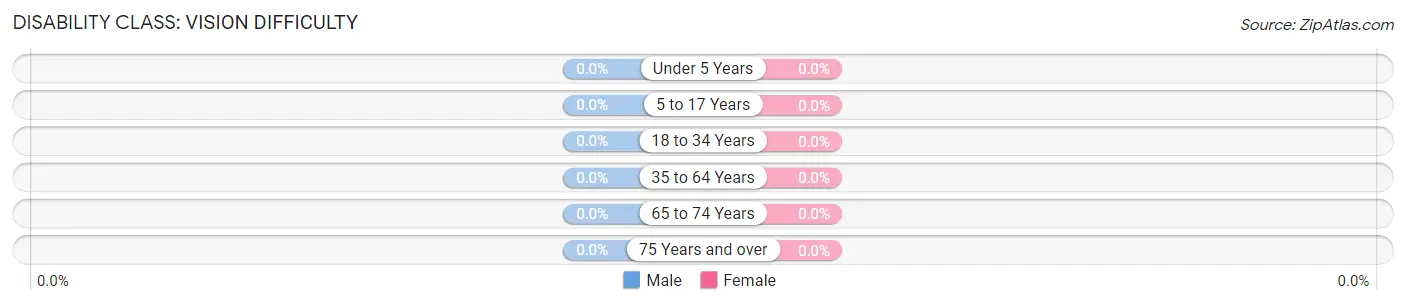
| Age Bracket | Male | Female |
| Under 5 Years | 0 (0.0%) | 0 (0.0%) |
| 5 to 17 Years | 0 (0.0%) | 0 (0.0%) |
| 18 to 34 Years | 0 (0.0%) | 0 (0.0%) |
| 35 to 64 Years | 0 (0.0%) | 0 (0.0%) |
| 65 to 74 Years | 0 (0.0%) | 0 (0.0%) |
| 75 Years and over | 0 (0.0%) | 0 (0.0%) |
Disability Class: Cognitive Difficulty
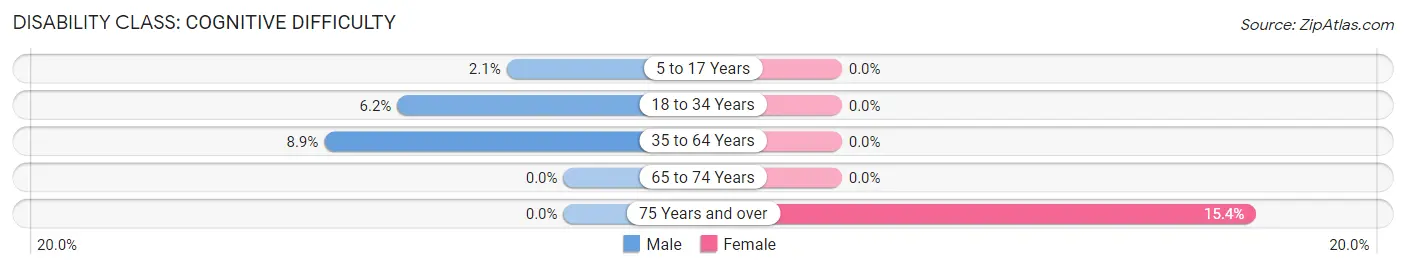
| Age Bracket | Male | Female |
| 5 to 17 Years | 6 (2.1%) | 0 (0.0%) |
| 18 to 34 Years | 10 (6.2%) | 0 (0.0%) |
| 35 to 64 Years | 15 (8.9%) | 0 (0.0%) |
| 65 to 74 Years | 0 (0.0%) | 0 (0.0%) |
| 75 Years and over | 0 (0.0%) | 2 (15.4%) |
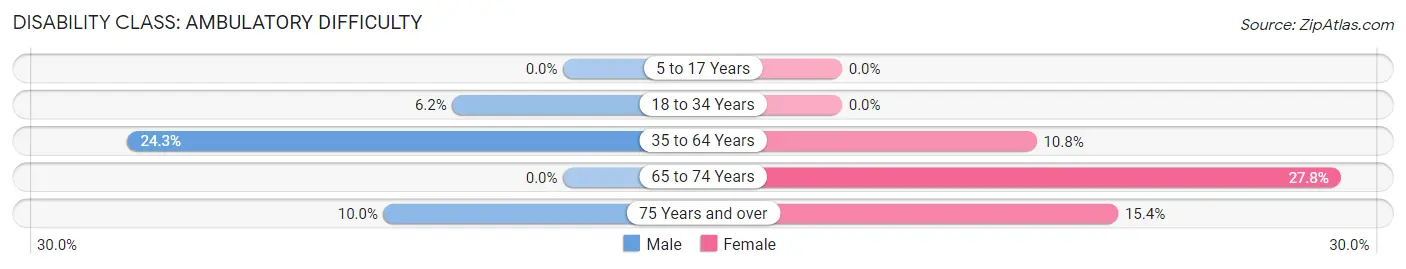
Disability Class: Ambulatory Difficulty
| Age Bracket | Male | Female |
| 5 to 17 Years | 0 (0.0%) | 0 (0.0%) |
| 18 to 34 Years | 10 (6.2%) | 0 (0.0%) |
| 35 to 64 Years | 41 (24.3%) | 22 (10.8%) |
| 65 to 74 Years | 0 (0.0%) | 5 (27.8%) |
| 75 Years and over | 1 (10.0%) | 2 (15.4%) |
Disability Class: Self-Care Difficulty
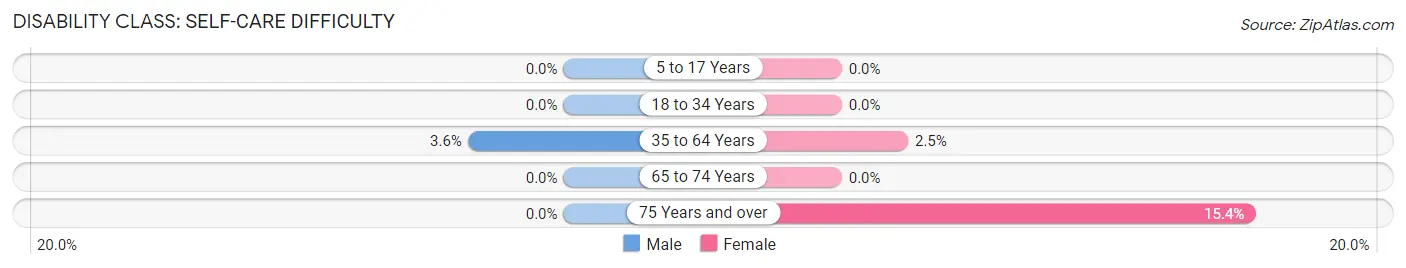
| Age Bracket | Male | Female |
| 5 to 17 Years | 0 (0.0%) | 0 (0.0%) |
| 18 to 34 Years | 0 (0.0%) | 0 (0.0%) |
| 35 to 64 Years | 6 (3.5%) | 5 (2.5%) |
| 65 to 74 Years | 0 (0.0%) | 0 (0.0%) |
| 75 Years and over | 0 (0.0%) | 2 (15.4%) |
Technology Access in Keshena
Computing Device Access in Keshena
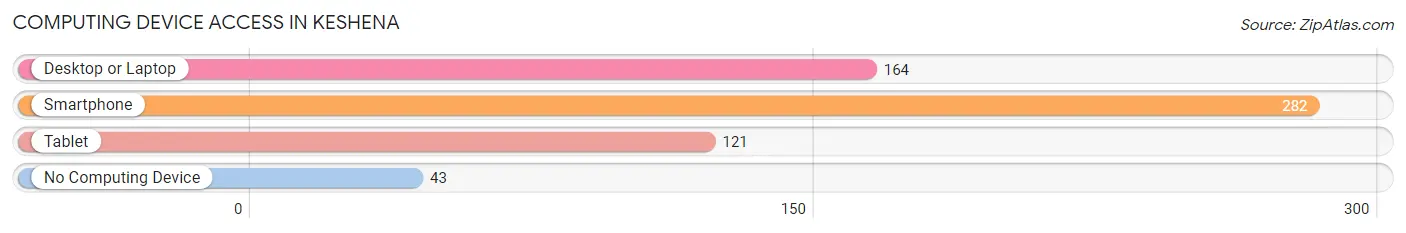
| Device Type | # Households | % Households |
| Desktop or Laptop | 164 | 48.8% |
| Smartphone | 282 | 83.9% |
| Tablet | 121 | 36.0% |
| No Computing Device | 43 | 12.8% |
| Total | 336 | 100.0% |
Internet Access in Keshena
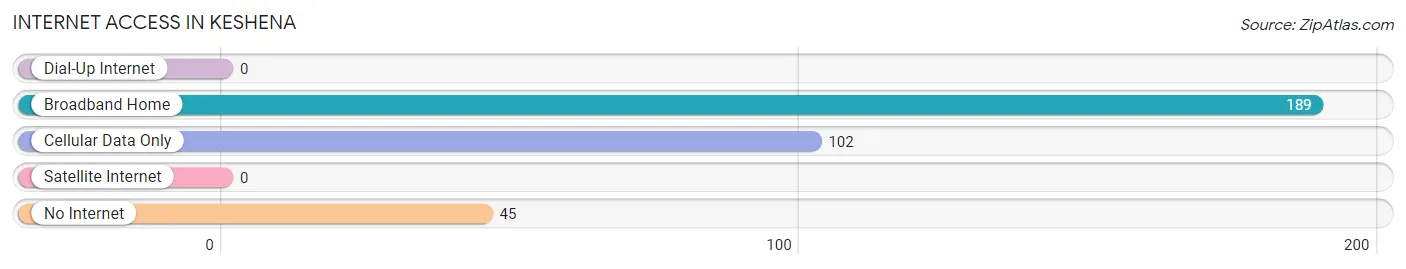
| Internet Type | # Households | % Households |
| Dial-Up Internet | 0 | 0.0% |
| Broadband Home | 189 | 56.2% |
| Cellular Data Only | 102 | 30.4% |
| Satellite Internet | 0 | 0.0% |
| No Internet | 45 | 13.4% |
| Total | 336 | 100.0% |
Keshena Summary
Keshena, Wisconsin is a small town located in Menominee County, Wisconsin. It is situated on the Menominee Indian Reservation, which is the only Indian reservation in the state of Wisconsin. The town is home to the Menominee Indian Tribe of Wisconsin, and is the tribal headquarters. The population of Keshena was 1,945 in the 2010 census, making it the largest community on the reservation.
History
Keshena was originally inhabited by the Menominee Indians, who were part of the Algonquin language family. The Menominee were a semi-nomadic people who lived in the area for thousands of years before the arrival of European settlers. The Menominee were known for their fishing and hunting skills, and for their ability to survive in the harsh environment of the Great Lakes region.
In the early 1800s, the Menominee were forced to cede their land to the United States government in exchange for a reservation. The Menominee Reservation was established in 1854, and Keshena was established as the tribal headquarters. The town was named after a Menominee chief, Keshena, who was a leader in the negotiations with the US government.
Geography
Keshena is located in the north-central part of Wisconsin, in Menominee County. It is situated on the Menominee Indian Reservation, which covers an area of approximately 200 square miles. The town is located on the Wolf River, which is a tributary of the Menominee River. The town is surrounded by forests and wetlands, and is home to a variety of wildlife, including deer, bear, and bald eagles.
The climate in Keshena is typical of the Great Lakes region, with cold winters and warm summers. The average temperature in January is around 20 degrees Fahrenheit, and the average temperature in July is around 70 degrees Fahrenheit.
Economy
Keshena’s economy is largely based on the Menominee Indian Tribe of Wisconsin. The tribe operates a variety of businesses, including a casino, a hotel, and a gas station. The tribe also operates a number of other businesses, including a lumber mill, a sawmill, and a fish hatchery.
In addition to the tribal businesses, Keshena is home to a number of small businesses, including restaurants, convenience stores, and a grocery store. The town also has a number of small manufacturing businesses, including a furniture factory and a woodworking shop.
Demographics
Keshena’s population was 1,945 in the 2010 census. The population is predominantly Native American, with 95.3% of the population identifying as Native American. The median age of the population is 33.7 years, and the median household income is $30,938.
Keshena is a small town with a rich history and culture. It is home to the Menominee Indian Tribe of Wisconsin, and is the tribal headquarters. The town is surrounded by forests and wetlands, and is home to a variety of wildlife. The economy is largely based on the tribal businesses, and the population is predominantly Native American. Keshena is a unique and vibrant community that is worth exploring.
Common Questions
What is the Total Population of Keshena?
Total Population of Keshena is 1,424.
What is the Total Male Population of Keshena?
Total Male Population of Keshena is 732.
What is the Total Female Population of Keshena?
Total Female Population of Keshena is 692.
What is the Ratio of Males per 100 Females in Keshena?
There are 105.78 Males per 100 Females in Keshena.
What is the Ratio of Females per 100 Males in Keshena?
There are 94.54 Females per 100 Males in Keshena.
What is the Median Population Age in Keshena?
Median Population Age in Keshena is 20.7 Years.
What is the Average Family Size in Keshena
Average Family Size in Keshena is 4.3 People.
What is the Average Household Size in Keshena
Average Household Size in Keshena is 4.2 People.
What is Per Capita Income in Keshena?
Per Capita income in Keshena is $12,454.
What is the Median Family Income in Keshena?
Median Family Income in Keshena is $41,944.
What is the Median Household income in Keshena?
Median Household Income in Keshena is $43,000.
What is Income or Wage Gap in Keshena?
Income or Wage Gap in Keshena is 30.9%.
Women in Keshena earn 69.1 cents for every dollar earned by a man.
What is Inequality or Gini Index in Keshena?
Inequality or Gini Index in Keshena is 0.42.
How Large is the Labor Force in Keshena?
There are 510 People in the Labor Forcein in Keshena.
What is the Percentage of People in the Labor Force in Keshena?
56.3% of People are in the Labor Force in Keshena.
What is the Unemployment Rate in Keshena?
Unemployment Rate in Keshena is 8.4%.