Green Valley, WI
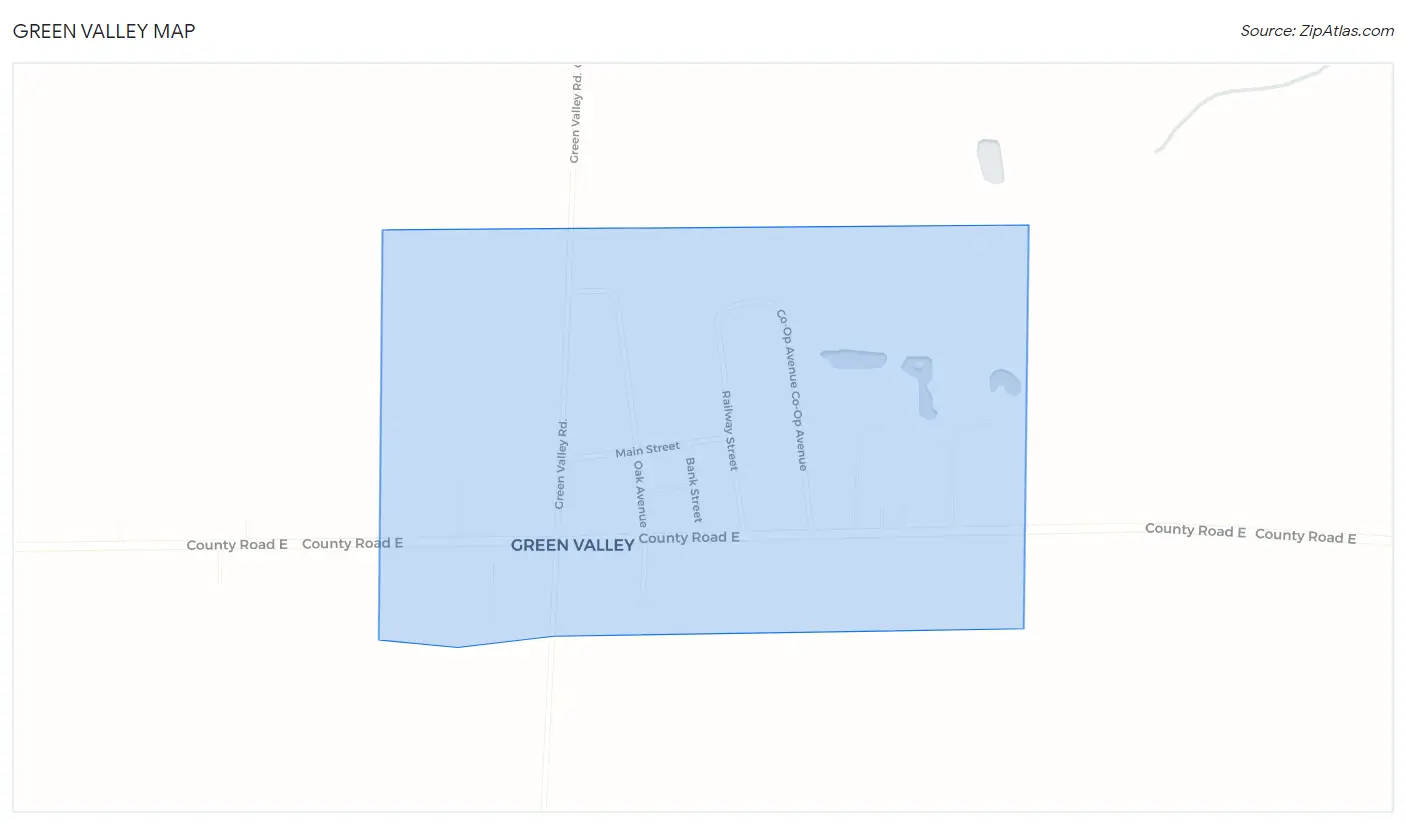
Green Valley Map
Green Valley Overview
59
TOTAL POPULATION
34
MALE POPULATION
25
FEMALE POPULATION
136.00
MALES / 100 FEMALES
73.53
FEMALES / 100 MALES
31.9
MEDIAN AGE
2.5
AVG FAMILY SIZE
2.3
AVG HOUSEHOLD SIZE
$43,786
PER CAPITA INCOME
$93,750
AVG HOUSEHOLD INCOME
0.38
INEQUALITY / GINI INDEX
41
LABOR FORCE [ PEOPLE ]
80.4%
PERCENT IN LABOR FORCE
14.6%
UNEMPLOYMENT RATE
Green Valley Zip Codes
Race in Green Valley
The most populous races in Green Valley are , and White / Caucasian (59 | 100.0%).
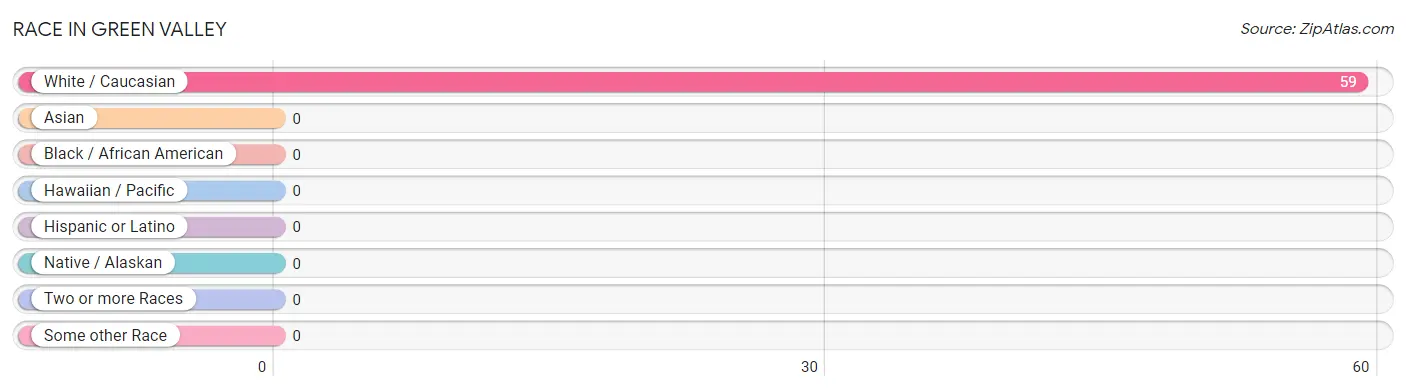
| Race | # Population | % Population |
| Asian | 0 | 0.0% |
| Black / African American | 0 | 0.0% |
| Hawaiian / Pacific | 0 | 0.0% |
| Hispanic or Latino | 0 | 0.0% |
| Native / Alaskan | 0 | 0.0% |
| White / Caucasian | 59 | 100.0% |
| Two or more Races | 0 | 0.0% |
| Some other Race | 0 | 0.0% |
| Total | 59 | 100.0% |
Ancestry in Green Valley
The most populous ancestries reported in Green Valley are German (38 | 64.4%), Irish (14 | 23.7%), Czech (6 | 10.2%), Norwegian (4 | 6.8%), and Italian (3 | 5.1%), together accounting for 110.2% of all Green Valley residents.
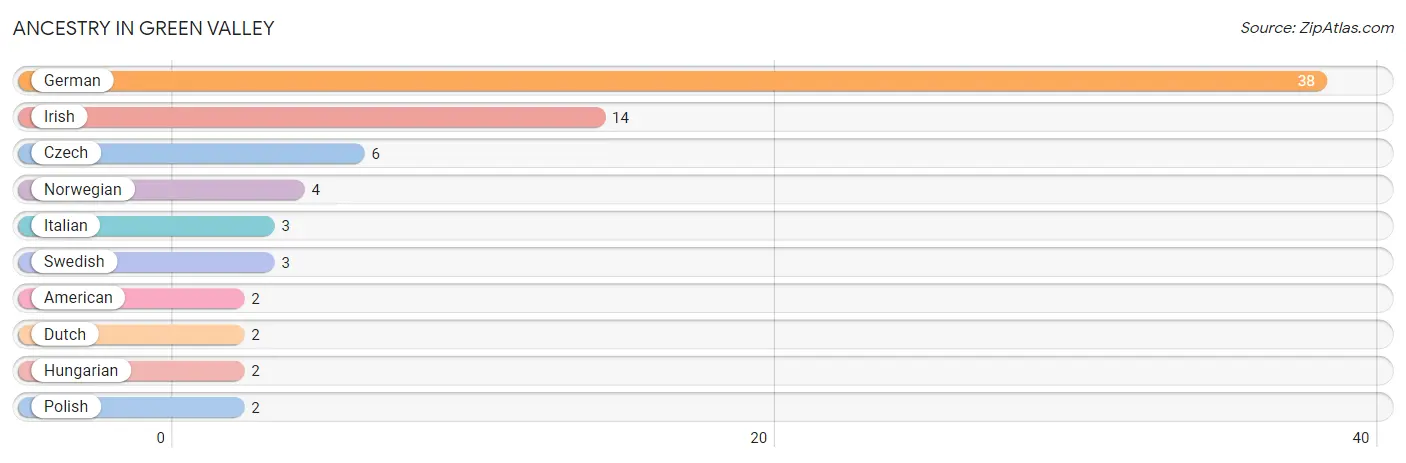
| Ancestry | # Population | % Population |
| American | 2 | 3.4% |
| Czech | 6 | 10.2% |
| Dutch | 2 | 3.4% |
| German | 38 | 64.4% |
| Hungarian | 2 | 3.4% |
| Irish | 14 | 23.7% |
| Italian | 3 | 5.1% |
| Norwegian | 4 | 6.8% |
| Polish | 2 | 3.4% |
| Swedish | 3 | 5.1% | View All 10 Rows |
Immigrants in Green Valley

| Immigration Origin | # Population | % Population | View All 0 Rows |
Sex and Age in Green Valley
Sex and Age in Green Valley
The most populous age groups in Green Valley are 30 to 34 Years (10 | 29.4%) for men and 30 to 34 Years (7 | 28.0%) for women.
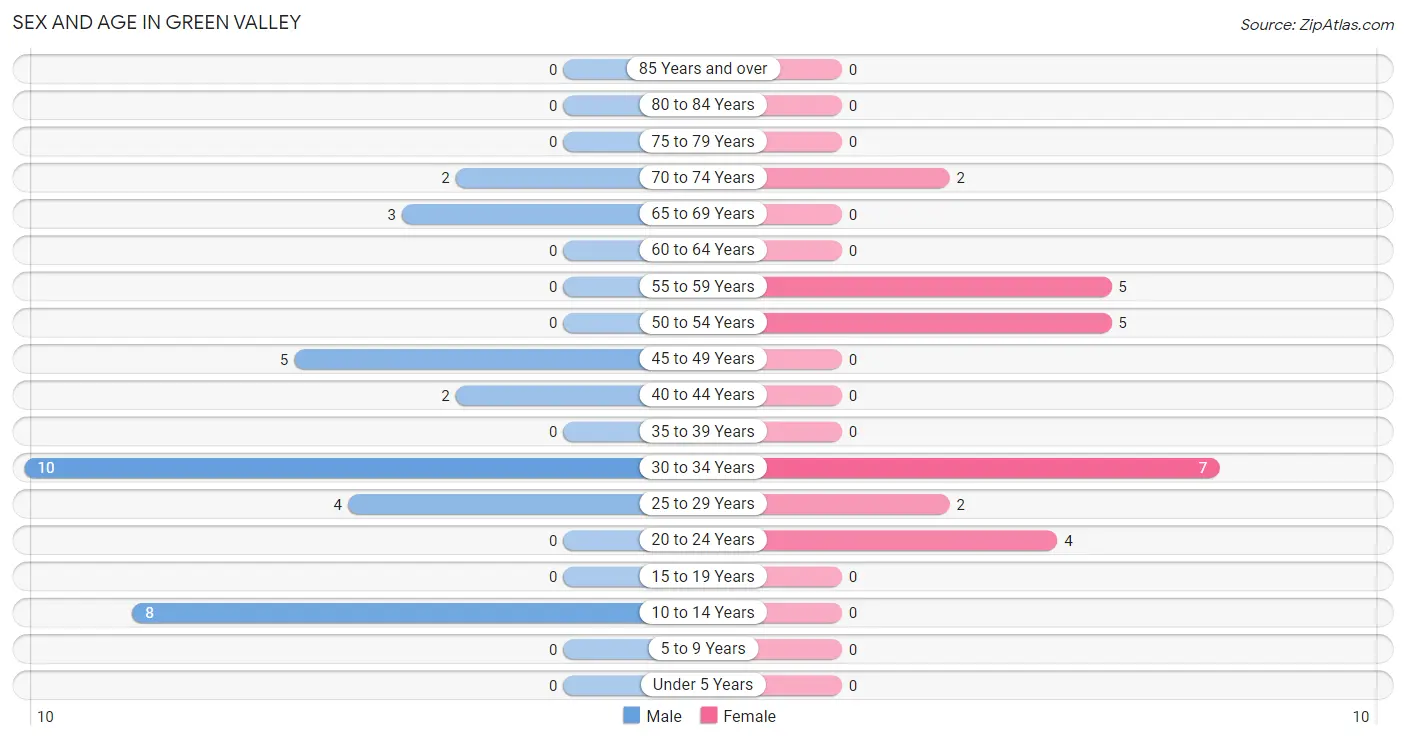
| Age Bracket | Male | Female |
| Under 5 Years | 0 (0.0%) | 0 (0.0%) |
| 5 to 9 Years | 0 (0.0%) | 0 (0.0%) |
| 10 to 14 Years | 8 (23.5%) | 0 (0.0%) |
| 15 to 19 Years | 0 (0.0%) | 0 (0.0%) |
| 20 to 24 Years | 0 (0.0%) | 4 (16.0%) |
| 25 to 29 Years | 4 (11.8%) | 2 (8.0%) |
| 30 to 34 Years | 10 (29.4%) | 7 (28.0%) |
| 35 to 39 Years | 0 (0.0%) | 0 (0.0%) |
| 40 to 44 Years | 2 (5.9%) | 0 (0.0%) |
| 45 to 49 Years | 5 (14.7%) | 0 (0.0%) |
| 50 to 54 Years | 0 (0.0%) | 5 (20.0%) |
| 55 to 59 Years | 0 (0.0%) | 5 (20.0%) |
| 60 to 64 Years | 0 (0.0%) | 0 (0.0%) |
| 65 to 69 Years | 3 (8.8%) | 0 (0.0%) |
| 70 to 74 Years | 2 (5.9%) | 2 (8.0%) |
| 75 to 79 Years | 0 (0.0%) | 0 (0.0%) |
| 80 to 84 Years | 0 (0.0%) | 0 (0.0%) |
| 85 Years and over | 0 (0.0%) | 0 (0.0%) |
| Total | 34 (100.0%) | 25 (100.0%) |
Families and Households in Green Valley
Median Family Size in Green Valley
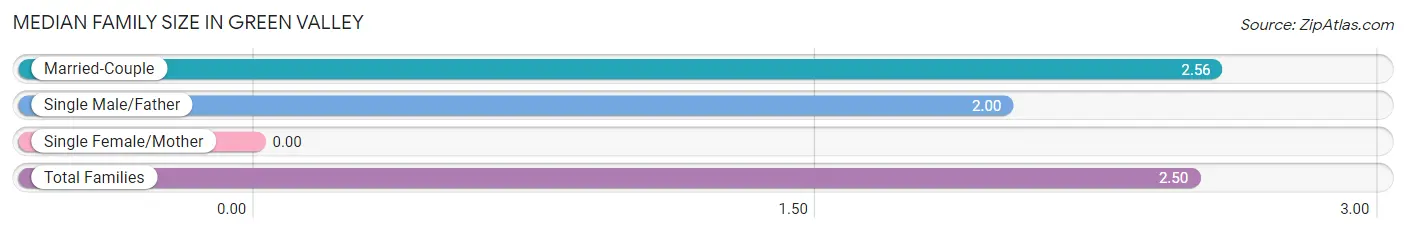
| Family Type | # Families | Family Size |
| Married-Couple | 16 (88.9%) | 2.56 |
| Single Male/Father | 2 (11.1%) | 2.00 |
| Single Female/Mother | 0 (0.0%) | - |
| Total Families | 18 (100.0%) | 2.50 |
Median Household Size in Green Valley
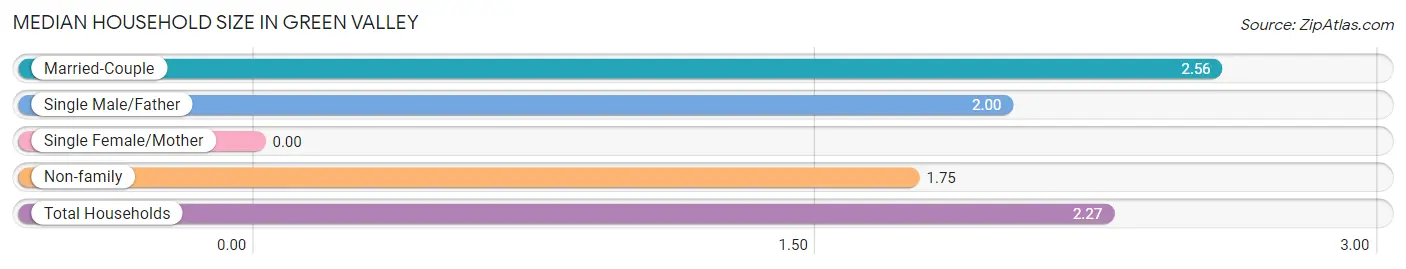
| Household Type | # Households | Household Size |
| Married-Couple | 16 (61.5%) | 2.56 |
| Single Male/Father | 2 (7.7%) | 2.00 |
| Single Female/Mother | 0 (0.0%) | - |
| Non-family | 8 (30.8%) | 1.75 |
| Total Households | 26 (100.0%) | 2.27 |
Household Size by Marriage Status in Green Valley
Out of a total of 26 households in Green Valley, 18 (69.2%) are family households, while 8 (30.8%) are nonfamily households. The most numerous type of family households are 2-person households, comprising 12, and the most common type of nonfamily households are 2-person households, comprising 6.
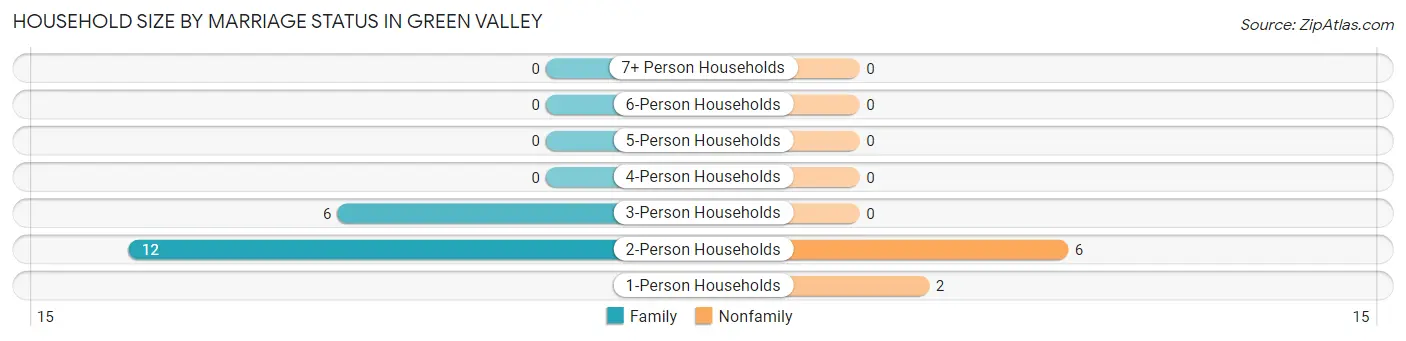
| Household Size | Family Households | Nonfamily Households |
| 1-Person Households | - | 2 (7.7%) |
| 2-Person Households | 12 (46.2%) | 6 (23.1%) |
| 3-Person Households | 6 (23.1%) | 0 (0.0%) |
| 4-Person Households | 0 (0.0%) | 0 (0.0%) |
| 5-Person Households | 0 (0.0%) | 0 (0.0%) |
| 6-Person Households | 0 (0.0%) | 0 (0.0%) |
| 7+ Person Households | 0 (0.0%) | 0 (0.0%) |
| Total | 18 (69.2%) | 8 (30.8%) |
Female Fertility in Green Valley
Fertility by Age in Green Valley
| Age Bracket | Women with Births | Births / 1,000 Women |
| 15 to 19 years | 0 (0.0%) | 0.0 |
| 20 to 34 years | 0 (0.0%) | 0.0 |
| 35 to 50 years | 0 (0.0%) | 0.0 |
| Total | 0 (0.0%) | 0.0 |
Fertility by Age by Marriage Status in Green Valley
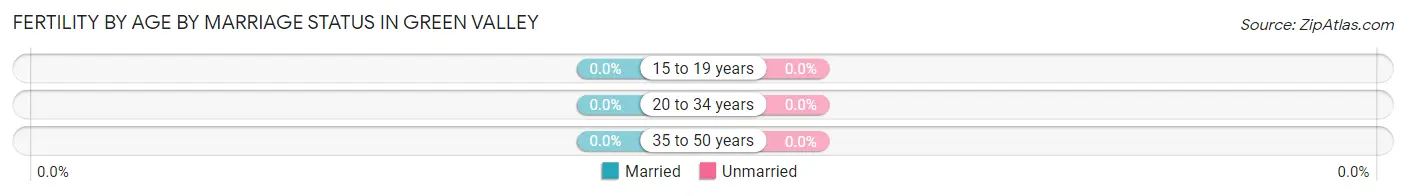
| Age Bracket | Married | Unmarried |
| 15 to 19 years | 0 (0.0%) | 0 (0.0%) |
| 20 to 34 years | 0 (0.0%) | 0 (0.0%) |
| 35 to 50 years | 0 (0.0%) | 0 (0.0%) |
| Total | 0 (0.0%) | 0 (0.0%) |
Fertility by Education in Green Valley

| Educational Attainment | Women with Births | Births / 1,000 Women |
| Less than High School | 0 (0.0%) | 0.0 |
| High School Diploma | 0 (0.0%) | 0.0 |
| College or Associate's Degree | 0 (0.0%) | 0.0 |
| Bachelor's Degree | 0 (0.0%) | 0.0 |
| Graduate Degree | 0 (0.0%) | 0.0 |
| Total | 0 (0.0%) | 0.0 |
Fertility by Education by Marriage Status in Green Valley
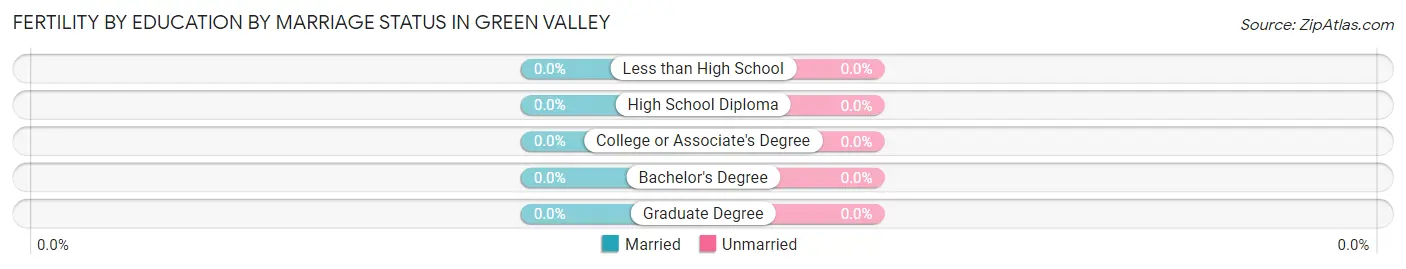
| Educational Attainment | Married | Unmarried |
| Less than High School | 0 (0.0%) | 0 (0.0%) |
| High School Diploma | 0 (0.0%) | 0 (0.0%) |
| College or Associate's Degree | 0 (0.0%) | 0 (0.0%) |
| Bachelor's Degree | 0 (0.0%) | 0 (0.0%) |
| Graduate Degree | 0 (0.0%) | 0 (0.0%) |
| Total | 0 (0.0%) | 0 (0.0%) |
Income in Green Valley
Income Overview in Green Valley
| Characteristic | Number | Measure |
| Per Capita Income | 59 | $43,786 |
| Median Family Income | 18 | $0 |
| Mean Family Income | 18 | $97,089 |
| Median Household Income | 26 | $93,750 |
| Mean Household Income | 26 | $98,165 |
| Income Deficit | 18 | $0 |
| Wage / Income Gap (%) | 59 | 0.00% |
| Wage / Income Gap ($) | 59 | 100.00¢ per $1 |
| Gini / Inequality Index | 59 | 0.38 |
Earnings by Sex in Green Valley
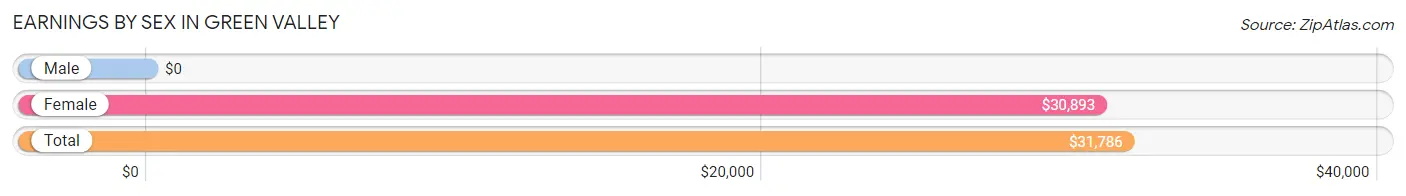
| Sex | Number | Average Earnings |
| Male | 23 (50.0%) | $0 |
| Female | 23 (50.0%) | $30,893 |
| Total | 46 (100.0%) | $31,786 |
Earnings by Sex by Income Bracket in Green Valley
The most common earnings brackets in Green Valley are $2,499 or less for men (7 | 30.4%) and $30,000 to $34,999 for women (7 | 30.4%).
| Income | Male | Female |
| $2,499 or less | 7 (30.4%) | 0 (0.0%) |
| $2,500 to $4,999 | 2 (8.7%) | 5 (21.7%) |
| $5,000 to $7,499 | 0 (0.0%) | 0 (0.0%) |
| $7,500 to $9,999 | 0 (0.0%) | 0 (0.0%) |
| $10,000 to $12,499 | 0 (0.0%) | 0 (0.0%) |
| $12,500 to $14,999 | 0 (0.0%) | 0 (0.0%) |
| $15,000 to $17,499 | 0 (0.0%) | 0 (0.0%) |
| $17,500 to $19,999 | 0 (0.0%) | 0 (0.0%) |
| $20,000 to $22,499 | 0 (0.0%) | 0 (0.0%) |
| $22,500 to $24,999 | 0 (0.0%) | 0 (0.0%) |
| $25,000 to $29,999 | 0 (0.0%) | 4 (17.4%) |
| $30,000 to $34,999 | 0 (0.0%) | 7 (30.4%) |
| $35,000 to $39,999 | 0 (0.0%) | 2 (8.7%) |
| $40,000 to $44,999 | 0 (0.0%) | 0 (0.0%) |
| $45,000 to $49,999 | 0 (0.0%) | 0 (0.0%) |
| $50,000 to $54,999 | 0 (0.0%) | 3 (13.0%) |
| $55,000 to $64,999 | 2 (8.7%) | 2 (8.7%) |
| $65,000 to $74,999 | 4 (17.4%) | 0 (0.0%) |
| $75,000 to $99,999 | 2 (8.7%) | 0 (0.0%) |
| $100,000+ | 6 (26.1%) | 0 (0.0%) |
| Total | 23 (100.0%) | 23 (100.0%) |
Earnings by Sex by Educational Attainment in Green Valley
| Educational Attainment | Male Income | Female Income |
| Less than High School | - | - |
| High School Diploma | - | - |
| College or Associate's Degree | - | - |
| Bachelor's Degree | - | - |
| Graduate Degree | - | - |
| Total | - | - |
Family Income in Green Valley
Family Income Brackets in Green Valley
According to the Green Valley family income data, there are 6 families falling into the $150,000 to $199,999 income range, which is the most common income bracket and makes up 33.3% of all families.
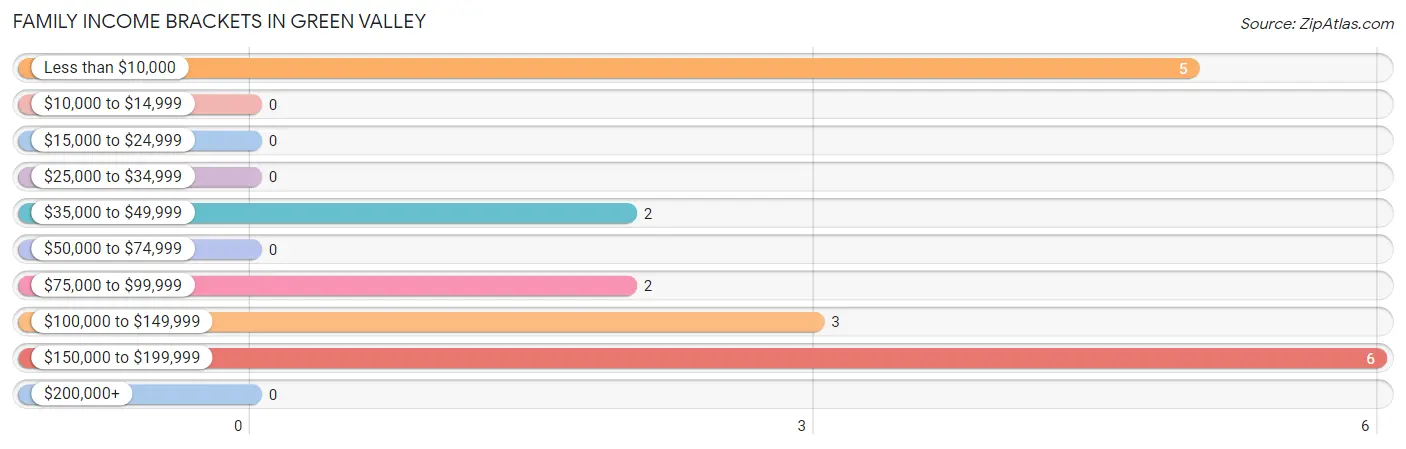
| Income Bracket | # Families | % Families |
| Less than $10,000 | 5 | 27.8% |
| $10,000 to $14,999 | 0 | 0.0% |
| $15,000 to $24,999 | 0 | 0.0% |
| $25,000 to $34,999 | 0 | 0.0% |
| $35,000 to $49,999 | 2 | 11.1% |
| $50,000 to $74,999 | 0 | 0.0% |
| $75,000 to $99,999 | 2 | 11.1% |
| $100,000 to $149,999 | 3 | 16.7% |
| $150,000 to $199,999 | 6 | 33.3% |
| $200,000+ | 0 | 0.0% |
Family Income by Famaliy Size in Green Valley
| Income Bracket | # Families | Median Income |
| 2-Person Families | 12 (66.7%) | $0 |
| 3-Person Families | 6 (33.3%) | $0 |
| 4-Person Families | 0 (0.0%) | $0 |
| 5-Person Families | 0 (0.0%) | $0 |
| 6-Person Families | 0 (0.0%) | $0 |
| 7+ Person Families | 0 (0.0%) | $0 |
| Total | 18 (100.0%) | $0 |
Family Income by Number of Earners in Green Valley
| Number of Earners | # Families | Median Income |
| No Earners | 0 (0.0%) | $0 |
| 1 Earner | 5 (27.8%) | $0 |
| 2 Earners | 13 (72.2%) | $0 |
| 3+ Earners | 0 (0.0%) | $0 |
| Total | 18 (100.0%) | $0 |
Household Income in Green Valley
Household Income Brackets in Green Valley
With 8 households falling in the category, the $150,000 to $199,999 income range is the most frequent in Green Valley, accounting for 30.8% of all households.
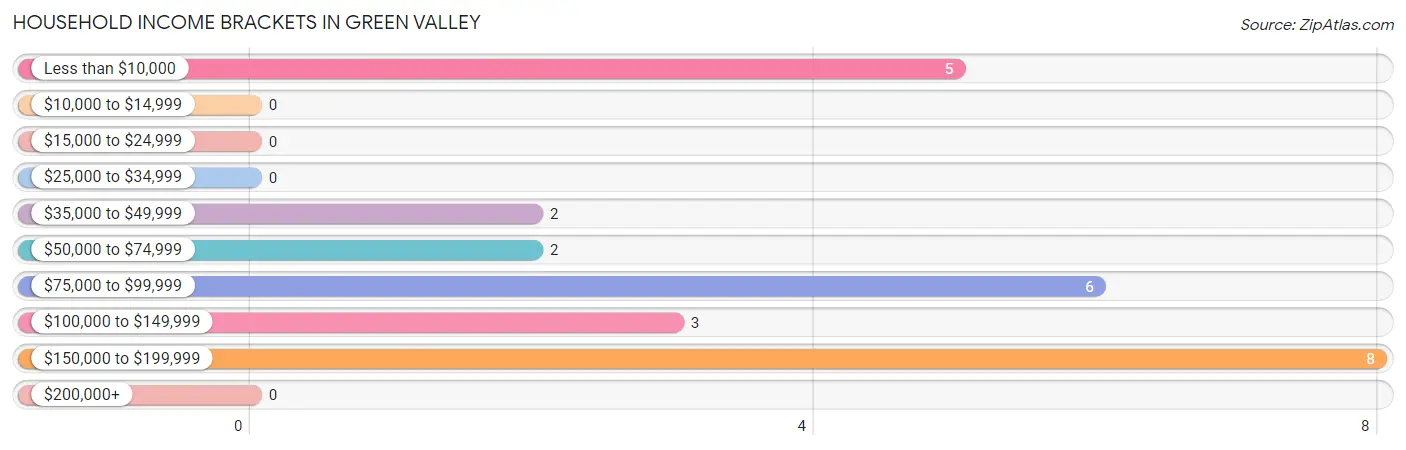
| Income Bracket | # Households | % Households |
| Less than $10,000 | 5 | 19.2% |
| $10,000 to $14,999 | 0 | 0.0% |
| $15,000 to $24,999 | 0 | 0.0% |
| $25,000 to $34,999 | 0 | 0.0% |
| $35,000 to $49,999 | 2 | 7.7% |
| $50,000 to $74,999 | 2 | 7.7% |
| $75,000 to $99,999 | 6 | 23.1% |
| $100,000 to $149,999 | 3 | 11.5% |
| $150,000 to $199,999 | 8 | 30.8% |
| $200,000+ | 0 | 0.0% |
Household Income by Householder Age in Green Valley
The median household income in Green Valley is $93,750, with the highest median household income of $122,500 found in the 25 to 44 years age bracket for the primary householder. A total of 16 households (61.5%) fall into this category.
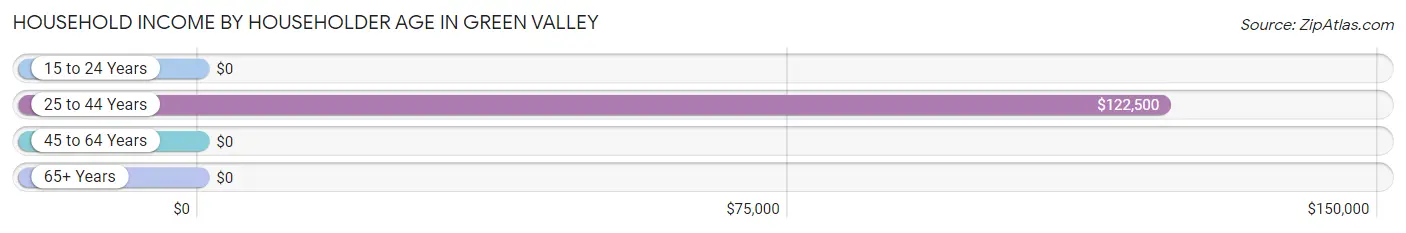
| Income Bracket | # Households | Median Income |
| 15 to 24 Years | 0 (0.0%) | $0 |
| 25 to 44 Years | 16 (61.5%) | $122,500 |
| 45 to 64 Years | 7 (26.9%) | $0 |
| 65+ Years | 3 (11.5%) | $0 |
| Total | 26 (100.0%) | $93,750 |
Poverty in Green Valley
Income Below Poverty by Sex and Age in Green Valley
With 14.7% poverty level for males and 20.0% for females among the residents of Green Valley, 45 to 54 year old males and 45 to 54 year old females are the most vulnerable to poverty, with 5 males (100.0%) and 5 females (100.0%) in their respective age groups living below the poverty level.
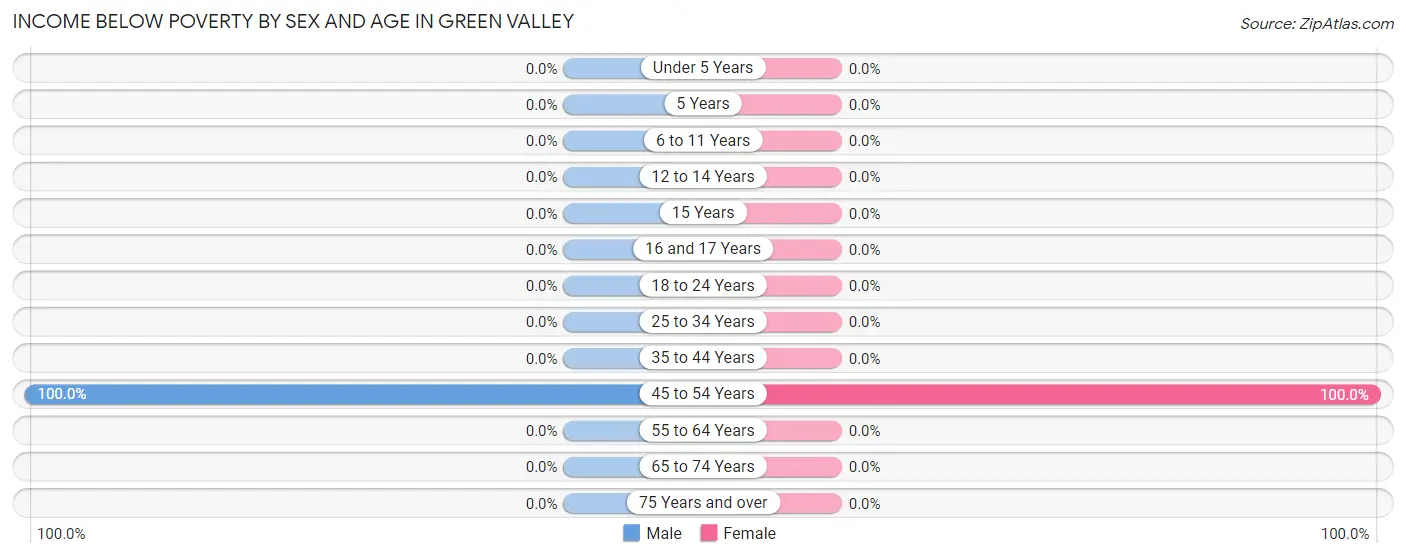
| Age Bracket | Male | Female |
| Under 5 Years | 0 (0.0%) | 0 (0.0%) |
| 5 Years | 0 (0.0%) | 0 (0.0%) |
| 6 to 11 Years | 0 (0.0%) | 0 (0.0%) |
| 12 to 14 Years | 0 (0.0%) | 0 (0.0%) |
| 15 Years | 0 (0.0%) | 0 (0.0%) |
| 16 and 17 Years | 0 (0.0%) | 0 (0.0%) |
| 18 to 24 Years | 0 (0.0%) | 0 (0.0%) |
| 25 to 34 Years | 0 (0.0%) | 0 (0.0%) |
| 35 to 44 Years | 0 (0.0%) | 0 (0.0%) |
| 45 to 54 Years | 5 (100.0%) | 5 (100.0%) |
| 55 to 64 Years | 0 (0.0%) | 0 (0.0%) |
| 65 to 74 Years | 0 (0.0%) | 0 (0.0%) |
| 75 Years and over | 0 (0.0%) | 0 (0.0%) |
| Total | 5 (14.7%) | 5 (20.0%) |
Income Above Poverty by Sex and Age in Green Valley
According to the poverty statistics in Green Valley, males aged 12 to 14 years and females aged 18 to 24 years are the age groups that are most secure financially, with 100.0% of males and 100.0% of females in these age groups living above the poverty line.
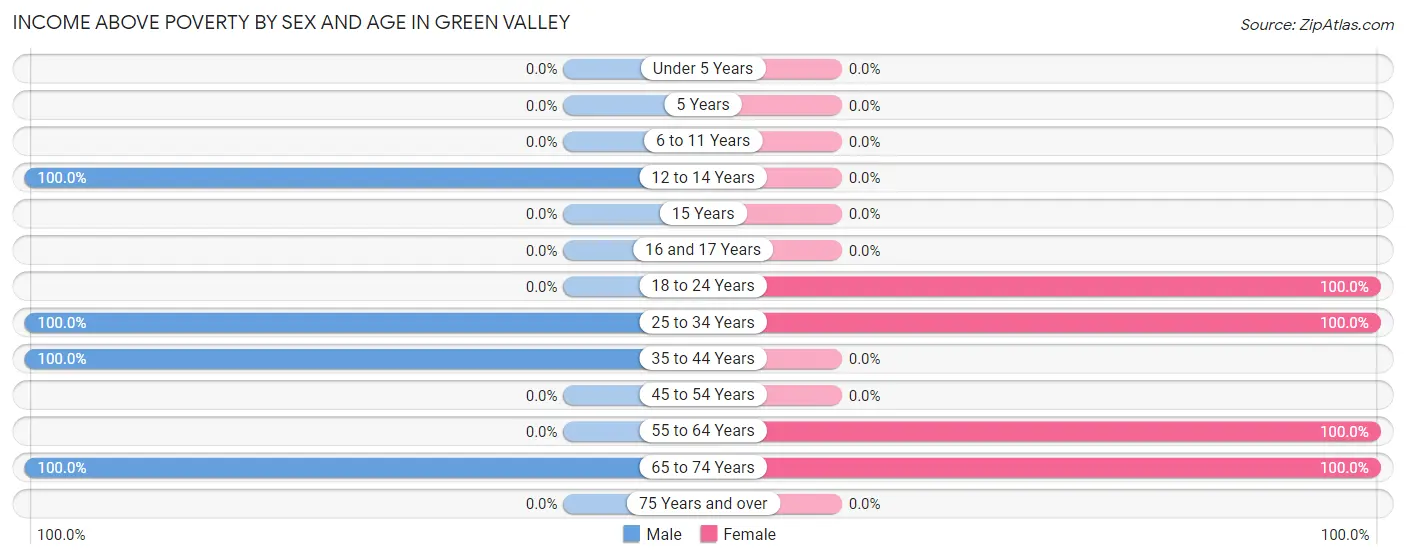
| Age Bracket | Male | Female |
| Under 5 Years | 0 (0.0%) | 0 (0.0%) |
| 5 Years | 0 (0.0%) | 0 (0.0%) |
| 6 to 11 Years | 0 (0.0%) | 0 (0.0%) |
| 12 to 14 Years | 8 (100.0%) | 0 (0.0%) |
| 15 Years | 0 (0.0%) | 0 (0.0%) |
| 16 and 17 Years | 0 (0.0%) | 0 (0.0%) |
| 18 to 24 Years | 0 (0.0%) | 4 (100.0%) |
| 25 to 34 Years | 14 (100.0%) | 9 (100.0%) |
| 35 to 44 Years | 2 (100.0%) | 0 (0.0%) |
| 45 to 54 Years | 0 (0.0%) | 0 (0.0%) |
| 55 to 64 Years | 0 (0.0%) | 5 (100.0%) |
| 65 to 74 Years | 5 (100.0%) | 2 (100.0%) |
| 75 Years and over | 0 (0.0%) | 0 (0.0%) |
| Total | 29 (85.3%) | 20 (80.0%) |
Income Below Poverty Among Married-Couple Families in Green Valley
The poverty statistics for married-couple families in Green Valley show that 31.2% or 5 of the total 16 families live below the poverty line. Families with no children have the highest poverty rate of 50.0%, comprising of 5 families. On the other hand, families with 1 or 2 children have the lowest poverty rate of 0.0%, which includes 0 families.
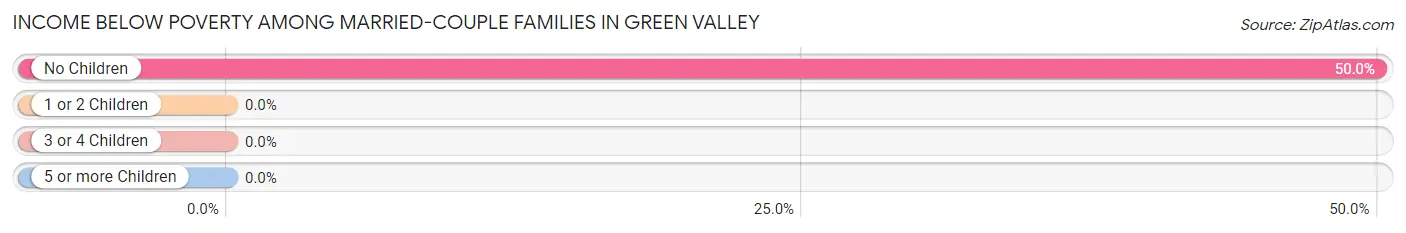
| Children | Above Poverty | Below Poverty |
| No Children | 5 (50.0%) | 5 (50.0%) |
| 1 or 2 Children | 6 (100.0%) | 0 (0.0%) |
| 3 or 4 Children | 0 (0.0%) | 0 (0.0%) |
| 5 or more Children | 0 (0.0%) | 0 (0.0%) |
| Total | 11 (68.8%) | 5 (31.2%) |
Income Below Poverty Among Single-Parent Households in Green Valley
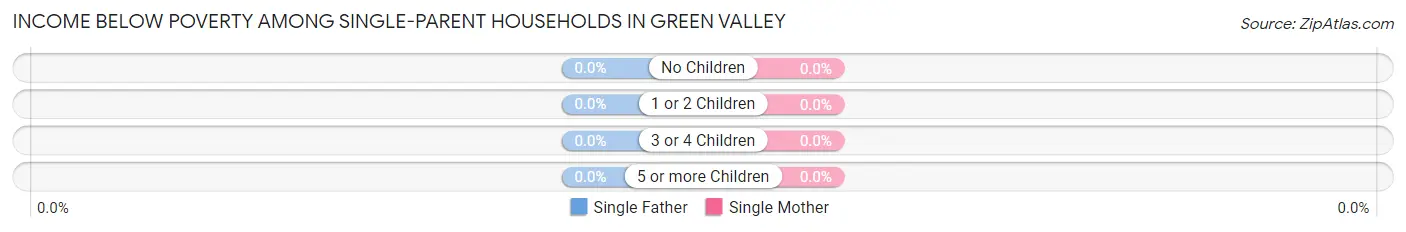
| Children | Single Father | Single Mother |
| No Children | 0 (0.0%) | 0 (0.0%) |
| 1 or 2 Children | 0 (0.0%) | 0 (0.0%) |
| 3 or 4 Children | 0 (0.0%) | 0 (0.0%) |
| 5 or more Children | 0 (0.0%) | 0 (0.0%) |
| Total | 0 (0.0%) | 0 (0.0%) |
Income Below Poverty Among Married-Couple vs Single-Parent Households in Green Valley
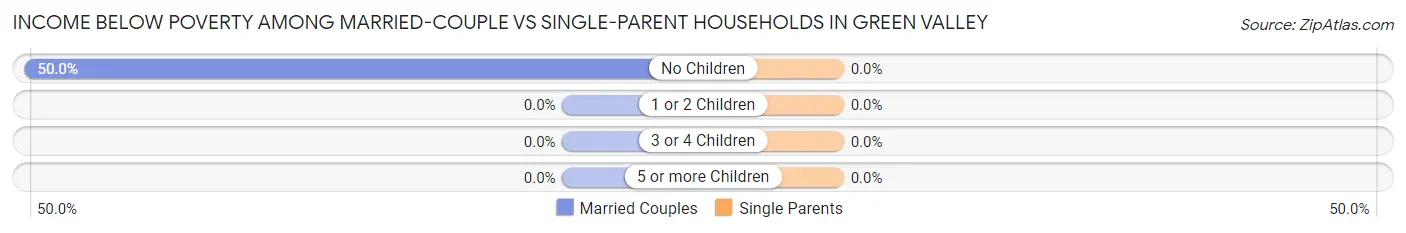
| Children | Married-Couple Families | Single-Parent Households |
| No Children | 5 (50.0%) | 0 (0.0%) |
| 1 or 2 Children | 0 (0.0%) | 0 (0.0%) |
| 3 or 4 Children | 0 (0.0%) | 0 (0.0%) |
| 5 or more Children | 0 (0.0%) | 0 (0.0%) |
| Total | 5 (31.2%) | 0 (0.0%) |
Employment Characteristics in Green Valley
Employment by Class of Employer in Green Valley
Among the 35 employed individuals in Green Valley, private company employees (28 | 80.0%), and self-employed (not incorporated) (7 | 20.0%) make up the most common classes of employment.
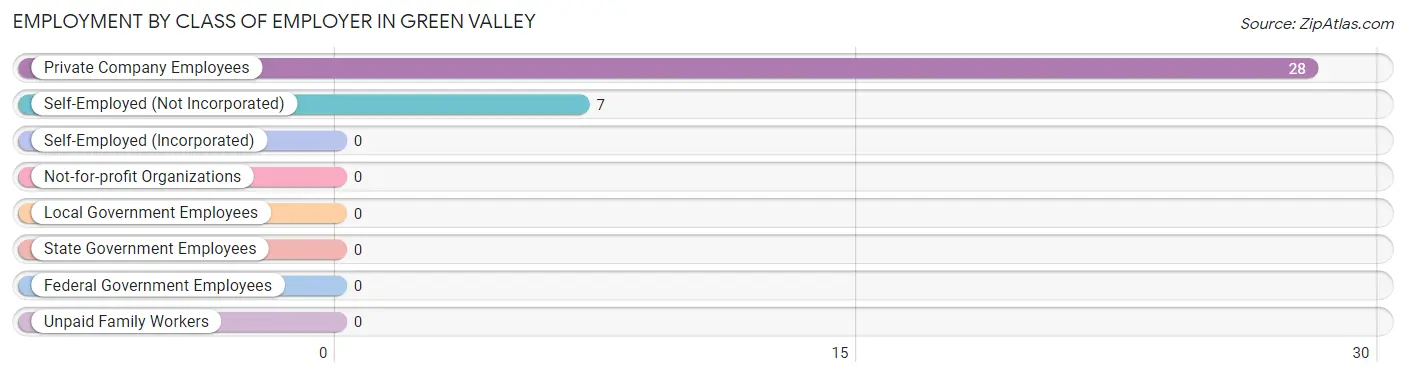
| Employer Class | # Employees | % Employees |
| Private Company Employees | 28 | 80.0% |
| Self-Employed (Incorporated) | 0 | 0.0% |
| Self-Employed (Not Incorporated) | 7 | 20.0% |
| Not-for-profit Organizations | 0 | 0.0% |
| Local Government Employees | 0 | 0.0% |
| State Government Employees | 0 | 0.0% |
| Federal Government Employees | 0 | 0.0% |
| Unpaid Family Workers | 0 | 0.0% |
| Total | 35 | 100.0% |
Employment Status by Age in Green Valley
According to the labor force statistics for Green Valley, out of the total population over 16 years of age (51), 80.4% or 41 individuals are in the labor force, with 14.6% or 6 of them unemployed. The age group with the highest labor force participation rate is 20 to 24 years, with 100.0% or 4 individuals in the labor force. Within the labor force, the 30 to 34 years age range has the highest percentage of unemployed individuals, with 35.3% or 6 of them being unemployed.
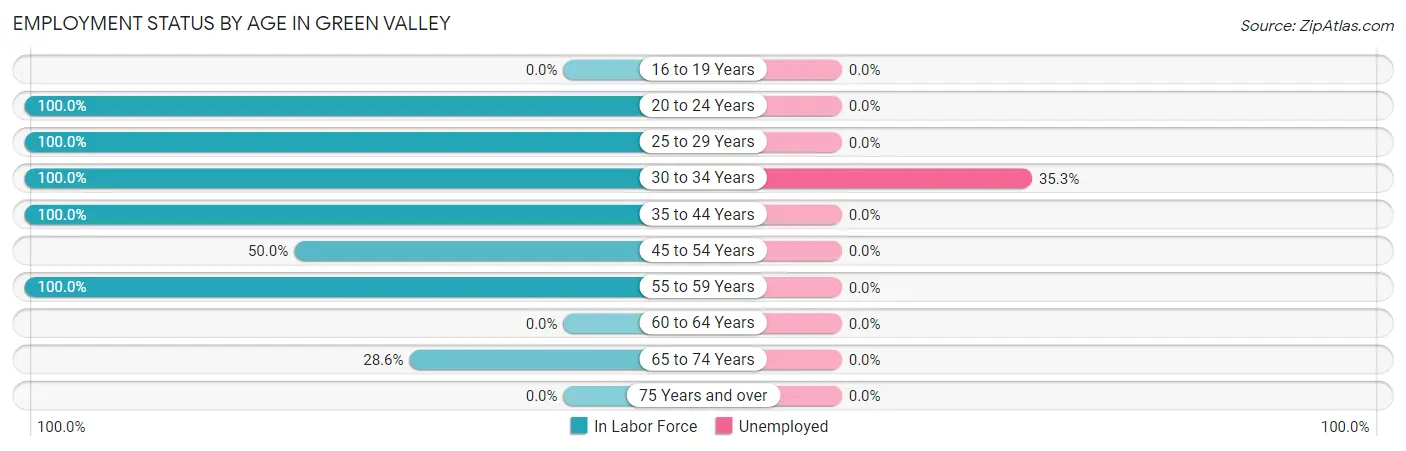
| Age Bracket | In Labor Force | Unemployed |
| 16 to 19 Years | 0 (0.0%) | 0 (0.0%) |
| 20 to 24 Years | 4 (100.0%) | 0 (0.0%) |
| 25 to 29 Years | 6 (100.0%) | 0 (0.0%) |
| 30 to 34 Years | 17 (100.0%) | 6 (35.3%) |
| 35 to 44 Years | 2 (100.0%) | 0 (0.0%) |
| 45 to 54 Years | 5 (50.0%) | 0 (0.0%) |
| 55 to 59 Years | 5 (100.0%) | 0 (0.0%) |
| 60 to 64 Years | 0 (0.0%) | 0 (0.0%) |
| 65 to 74 Years | 2 (28.6%) | 0 (0.0%) |
| 75 Years and over | 0 (0.0%) | 0 (0.0%) |
| Total | 41 (80.4%) | 6 (14.6%) |
Employment Status by Educational Attainment in Green Valley
According to labor force statistics for Green Valley, 87.5% of individuals (35) out of the total population between 25 and 64 years of age (40) are in the labor force, with 17.1% or 6 of them being unemployed. The group with the highest labor force participation rate are those with the educational attainment of less than high school, with 100.0% or 3 individuals in the labor force. Within the labor force, individuals with high school diploma education have the highest percentage of unemployment, with 25.0% or 6 of them being unemployed.
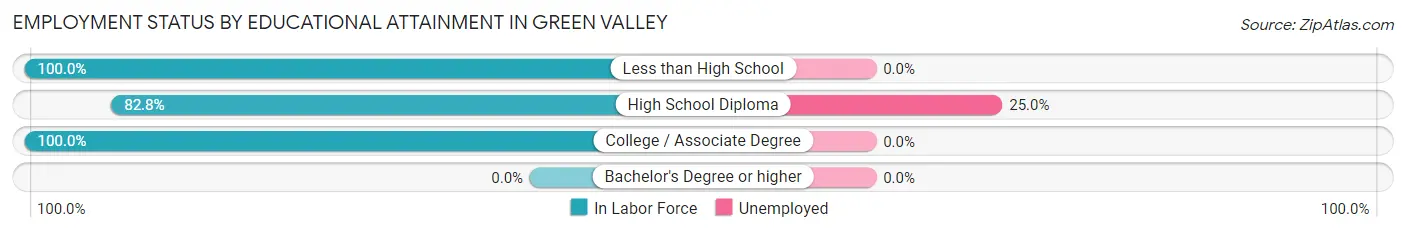
| Educational Attainment | In Labor Force | Unemployed |
| Less than High School | 3 (100.0%) | 0 (0.0%) |
| High School Diploma | 24 (82.8%) | 7 (25.0%) |
| College / Associate Degree | 8 (100.0%) | 0 (0.0%) |
| Bachelor's Degree or higher | 0 (0.0%) | 0 (0.0%) |
| Total | 35 (87.5%) | 7 (17.1%) |
Employment Occupations by Sex in Green Valley
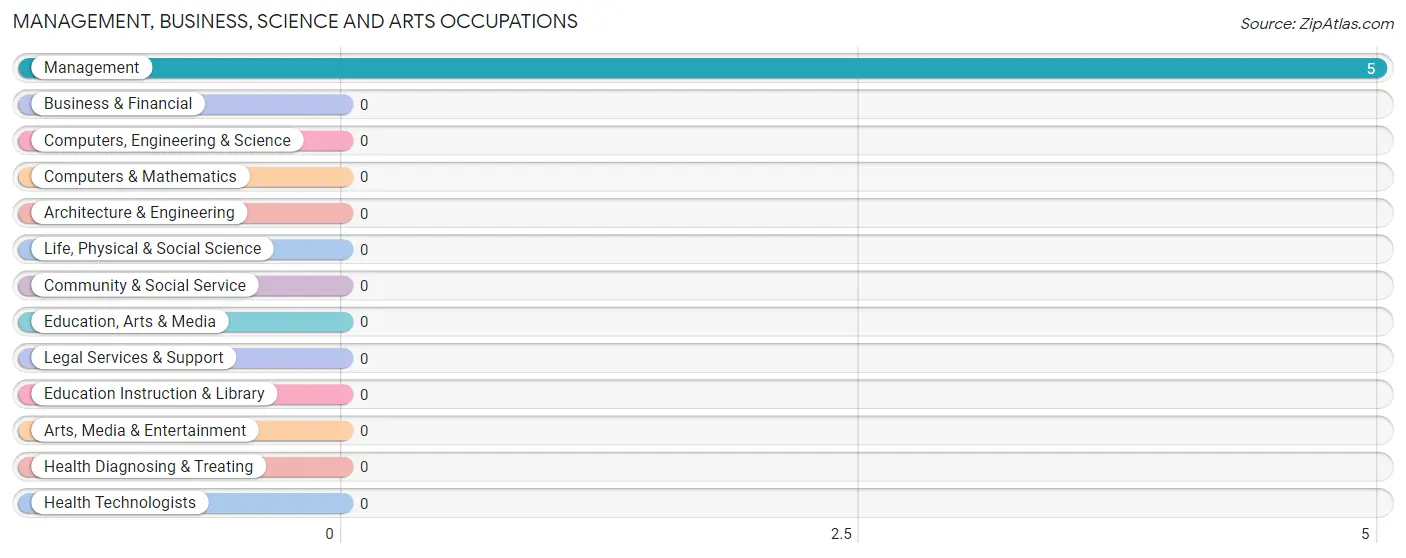
Management, Business, Science and Arts Occupations
The most common Management, Business, Science and Arts occupations in Green Valley are , and Management (5 | 14.3%).
Management, Business, Science and Arts Occupations by Sex
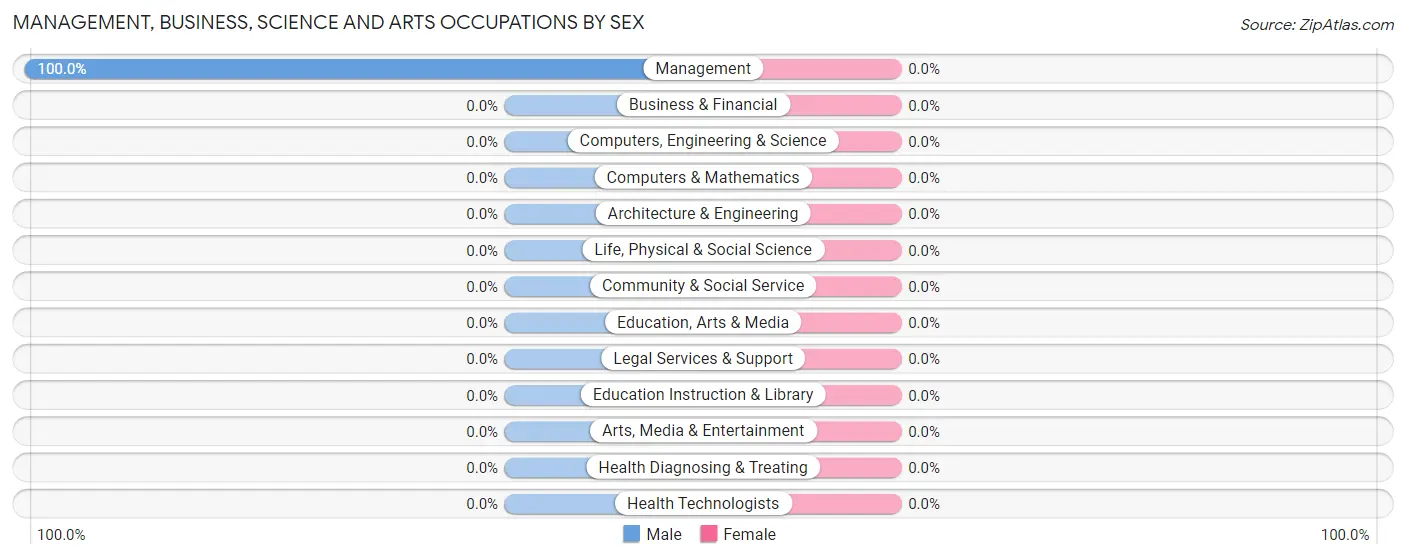
| Occupation | Male | Female |
| Management | 5 (100.0%) | 0 (0.0%) |
| Business & Financial | 0 (0.0%) | 0 (0.0%) |
| Computers, Engineering & Science | 0 (0.0%) | 0 (0.0%) |
| Computers & Mathematics | 0 (0.0%) | 0 (0.0%) |
| Architecture & Engineering | 0 (0.0%) | 0 (0.0%) |
| Life, Physical & Social Science | 0 (0.0%) | 0 (0.0%) |
| Community & Social Service | 0 (0.0%) | 0 (0.0%) |
| Education, Arts & Media | 0 (0.0%) | 0 (0.0%) |
| Legal Services & Support | 0 (0.0%) | 0 (0.0%) |
| Education Instruction & Library | 0 (0.0%) | 0 (0.0%) |
| Arts, Media & Entertainment | 0 (0.0%) | 0 (0.0%) |
| Health Diagnosing & Treating | 0 (0.0%) | 0 (0.0%) |
| Health Technologists | 0 (0.0%) | 0 (0.0%) |
| Total (Category) | 5 (100.0%) | 0 (0.0%) |
| Total (Overall) | 17 (48.6%) | 18 (51.4%) |
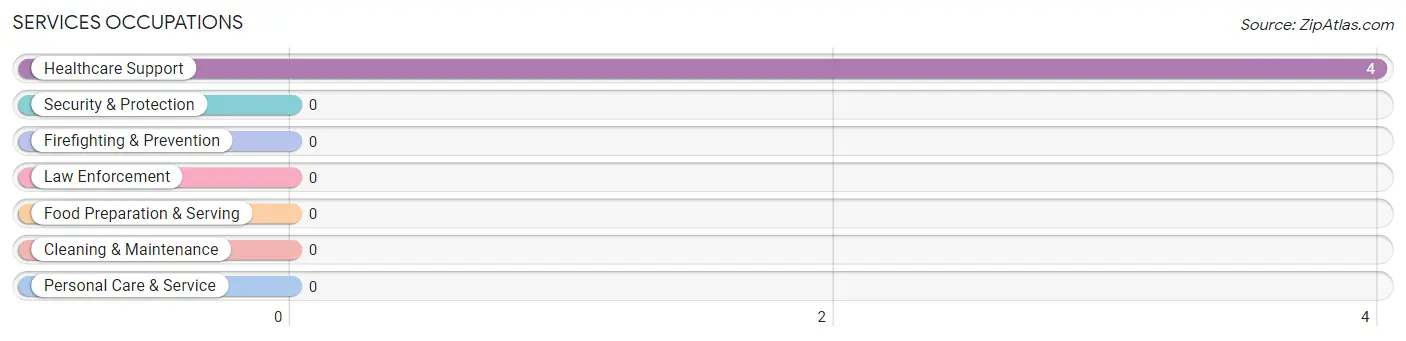
Services Occupations
The most common Services occupations in Green Valley are , and Healthcare Support (4 | 11.4%).
Services Occupations by Sex
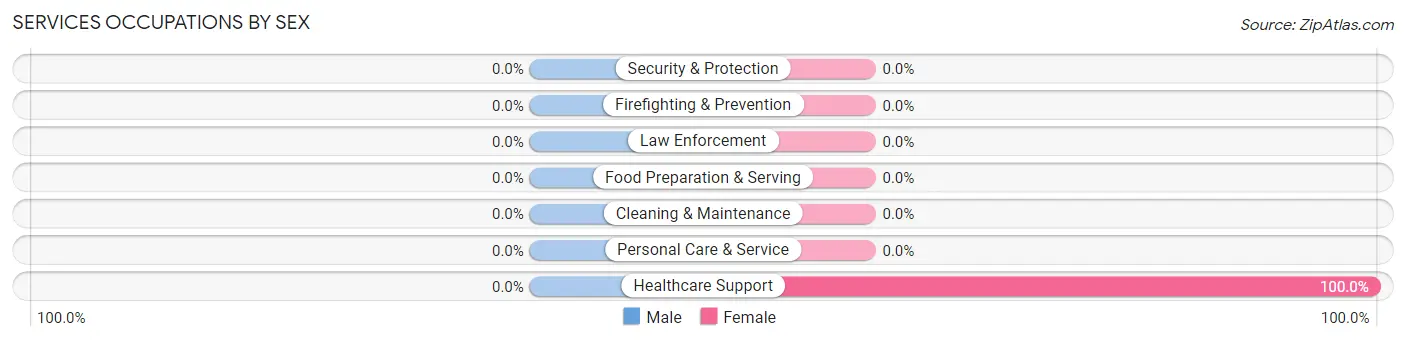
| Occupation | Male | Female |
| Healthcare Support | 0 (0.0%) | 4 (100.0%) |
| Security & Protection | 0 (0.0%) | 0 (0.0%) |
| Firefighting & Prevention | 0 (0.0%) | 0 (0.0%) |
| Law Enforcement | 0 (0.0%) | 0 (0.0%) |
| Food Preparation & Serving | 0 (0.0%) | 0 (0.0%) |
| Cleaning & Maintenance | 0 (0.0%) | 0 (0.0%) |
| Personal Care & Service | 0 (0.0%) | 0 (0.0%) |
| Total (Category) | 0 (0.0%) | 4 (100.0%) |
| Total (Overall) | 17 (48.6%) | 18 (51.4%) |
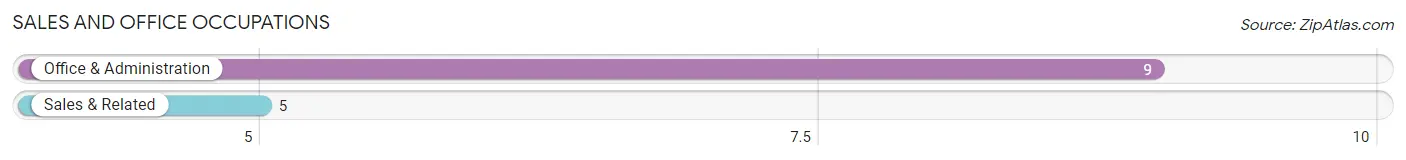
Sales and Office Occupations
The most common Sales and Office occupations in Green Valley are Office & Administration (9 | 25.7%), and Sales & Related (5 | 14.3%).
Sales and Office Occupations by Sex
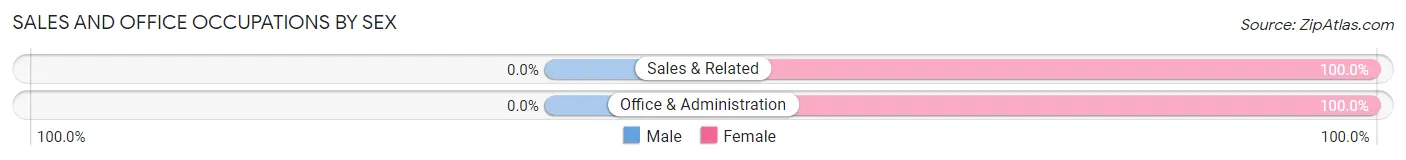
| Occupation | Male | Female |
| Sales & Related | 0 (0.0%) | 5 (100.0%) |
| Office & Administration | 0 (0.0%) | 9 (100.0%) |
| Total (Category) | 0 (0.0%) | 14 (100.0%) |
| Total (Overall) | 17 (48.6%) | 18 (51.4%) |
Natural Resources, Construction and Maintenance Occupations
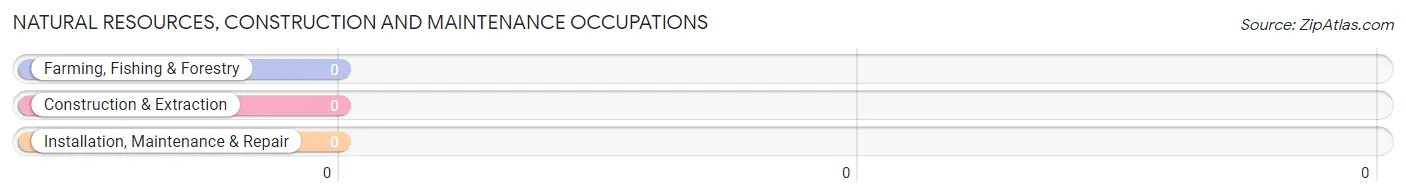
Natural Resources, Construction and Maintenance Occupations by Sex
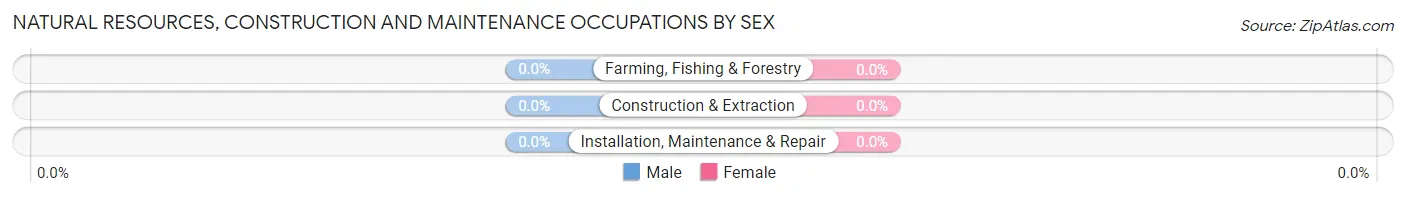
| Occupation | Male | Female |
| Farming, Fishing & Forestry | 0 (0.0%) | 0 (0.0%) |
| Construction & Extraction | 0 (0.0%) | 0 (0.0%) |
| Installation, Maintenance & Repair | 0 (0.0%) | 0 (0.0%) |
| Total (Category) | 0 (0.0%) | 0 (0.0%) |
| Total (Overall) | 17 (48.6%) | 18 (51.4%) |
Production, Transportation and Moving Occupations
The most common Production, Transportation and Moving occupations in Green Valley are Production (6 | 17.1%), and Material Moving (6 | 17.1%).
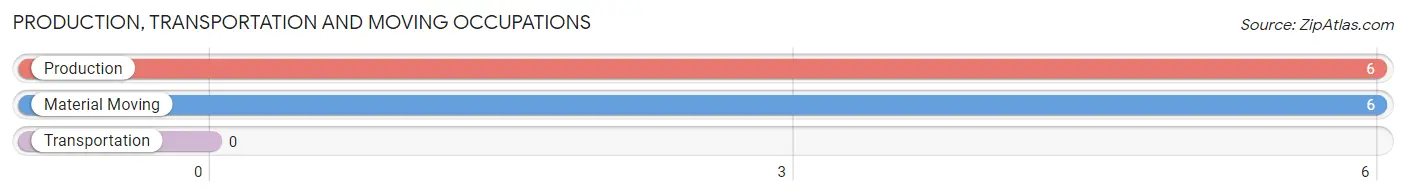
Production, Transportation and Moving Occupations by Sex
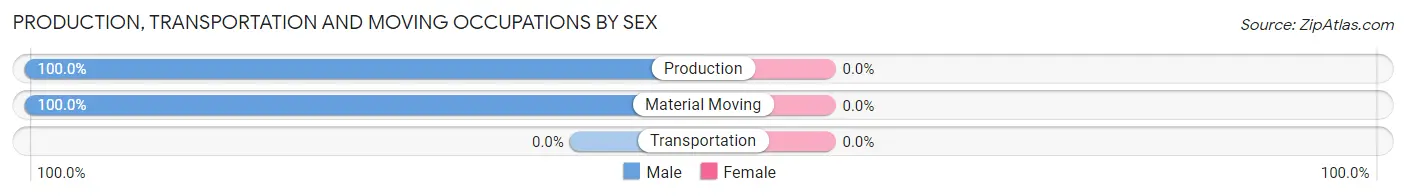
| Occupation | Male | Female |
| Production | 6 (100.0%) | 0 (0.0%) |
| Transportation | 0 (0.0%) | 0 (0.0%) |
| Material Moving | 6 (100.0%) | 0 (0.0%) |
| Total (Category) | 12 (100.0%) | 0 (0.0%) |
| Total (Overall) | 17 (48.6%) | 18 (51.4%) |
Employment Industries by Sex in Green Valley
Employment Industries in Green Valley
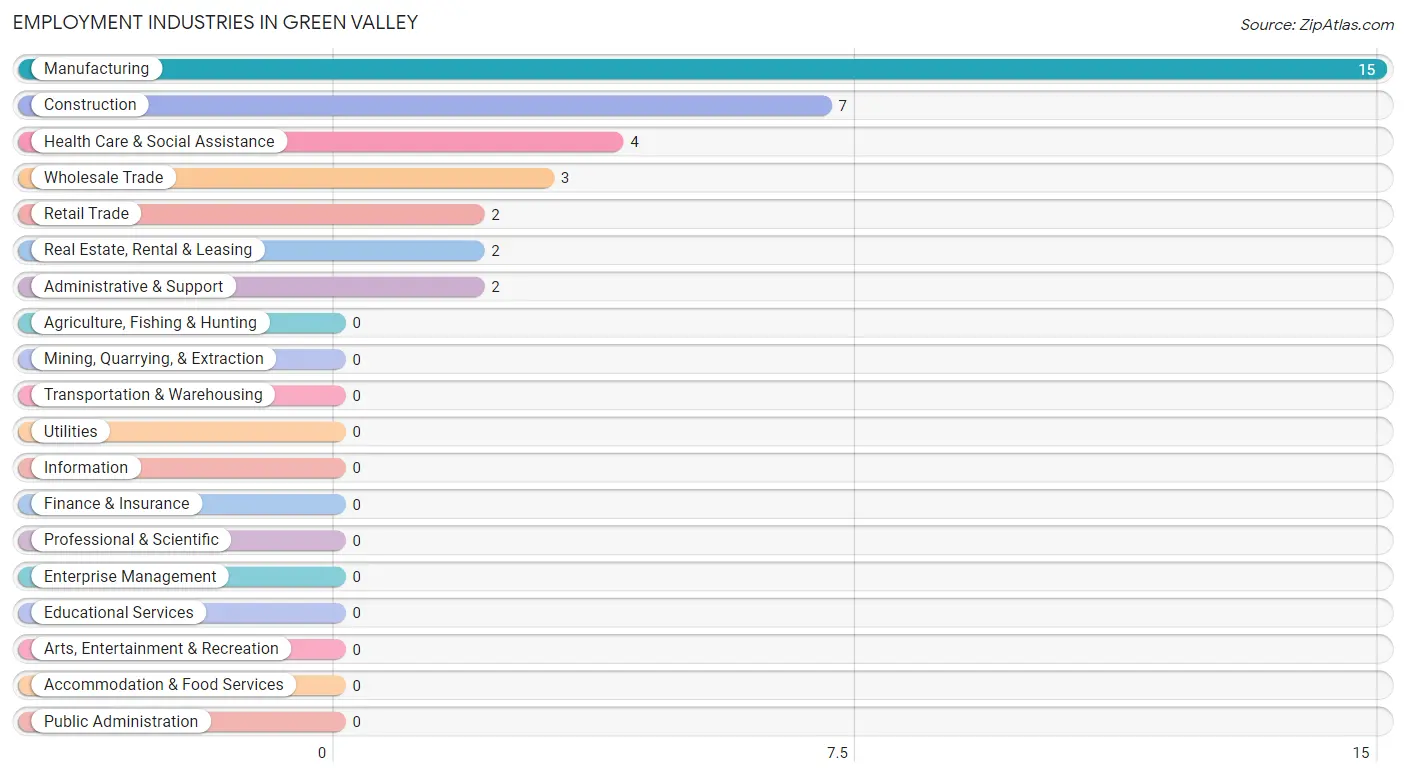
The major employment industries in Green Valley include Manufacturing (15 | 42.9%), Construction (7 | 20.0%), Health Care & Social Assistance (4 | 11.4%), Wholesale Trade (3 | 8.6%), and Retail Trade (2 | 5.7%).
Employment Industries by Sex in Green Valley
The Green Valley industries that see more men than women are Construction (100.0%), Retail Trade (100.0%), and Manufacturing (53.3%), whereas the industries that tend to have a higher number of women are Wholesale Trade (100.0%), Real Estate, Rental & Leasing (100.0%), and Administrative & Support (100.0%).
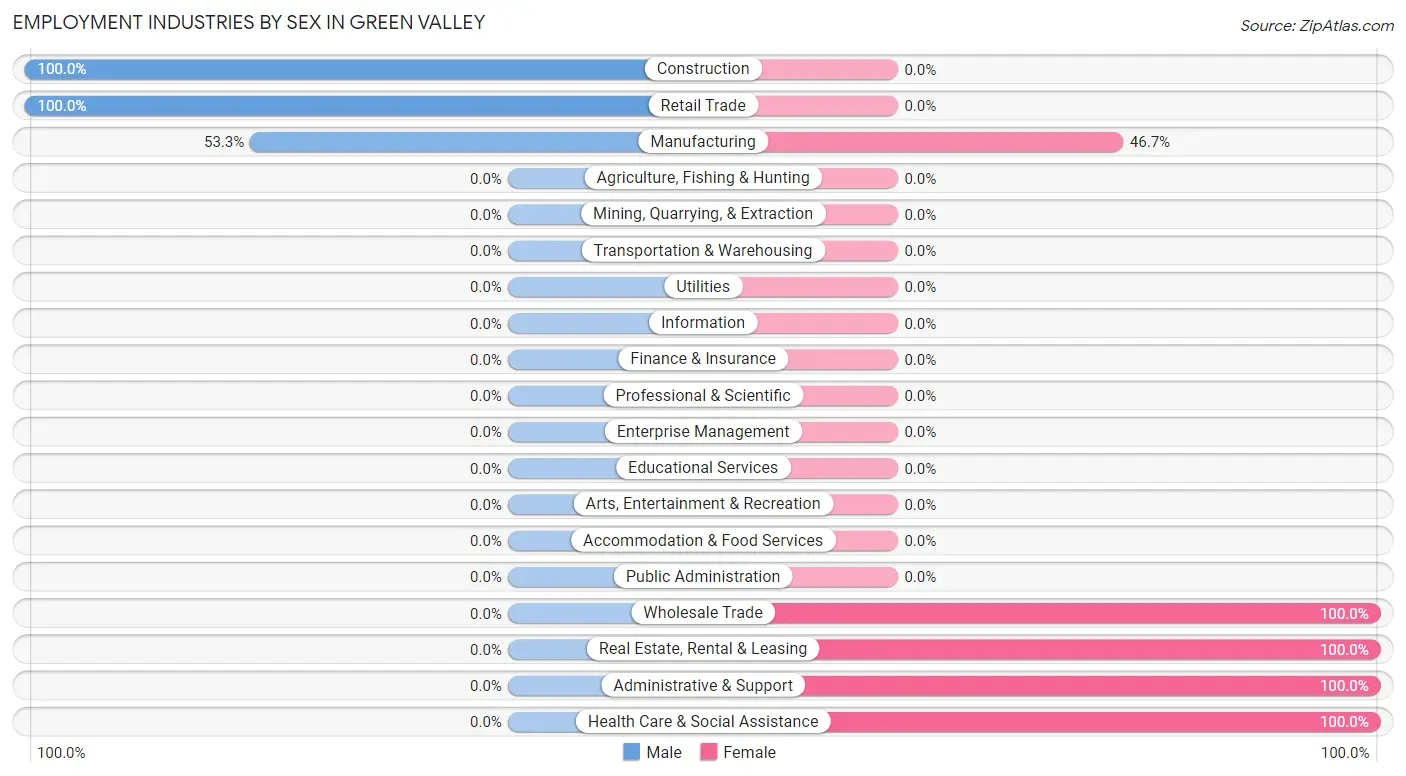
| Industry | Male | Female |
| Agriculture, Fishing & Hunting | 0 (0.0%) | 0 (0.0%) |
| Mining, Quarrying, & Extraction | 0 (0.0%) | 0 (0.0%) |
| Construction | 7 (100.0%) | 0 (0.0%) |
| Manufacturing | 8 (53.3%) | 7 (46.7%) |
| Wholesale Trade | 0 (0.0%) | 3 (100.0%) |
| Retail Trade | 2 (100.0%) | 0 (0.0%) |
| Transportation & Warehousing | 0 (0.0%) | 0 (0.0%) |
| Utilities | 0 (0.0%) | 0 (0.0%) |
| Information | 0 (0.0%) | 0 (0.0%) |
| Finance & Insurance | 0 (0.0%) | 0 (0.0%) |
| Real Estate, Rental & Leasing | 0 (0.0%) | 2 (100.0%) |
| Professional & Scientific | 0 (0.0%) | 0 (0.0%) |
| Enterprise Management | 0 (0.0%) | 0 (0.0%) |
| Administrative & Support | 0 (0.0%) | 2 (100.0%) |
| Educational Services | 0 (0.0%) | 0 (0.0%) |
| Health Care & Social Assistance | 0 (0.0%) | 4 (100.0%) |
| Arts, Entertainment & Recreation | 0 (0.0%) | 0 (0.0%) |
| Accommodation & Food Services | 0 (0.0%) | 0 (0.0%) |
| Public Administration | 0 (0.0%) | 0 (0.0%) |
| Total | 17 (48.6%) | 18 (51.4%) |
Education in Green Valley
School Enrollment in Green Valley
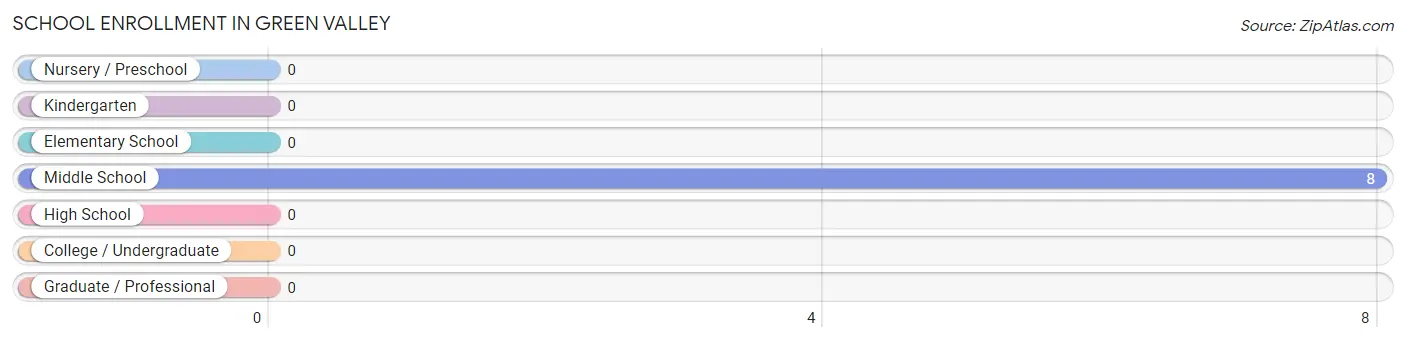
| School Level | # Students | % Students |
| Nursery / Preschool | 0 | 0.0% |
| Kindergarten | 0 | 0.0% |
| Elementary School | 0 | 0.0% |
| Middle School | 8 | 100.0% |
| High School | 0 | 0.0% |
| College / Undergraduate | 0 | 0.0% |
| Graduate / Professional | 0 | 0.0% |
| Total | 8 | 100.0% |
School Enrollment by Age by Funding Source in Green Valley
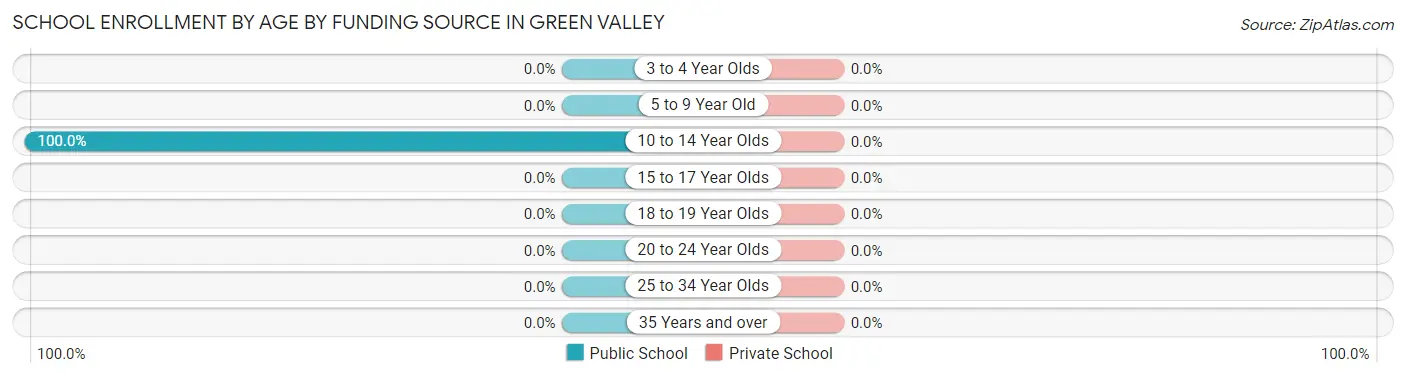
| Age Bracket | Public School | Private School |
| 3 to 4 Year Olds | 0 (0.0%) | 0 (0.0%) |
| 5 to 9 Year Old | 0 (0.0%) | 0 (0.0%) |
| 10 to 14 Year Olds | 8 (100.0%) | 0 (0.0%) |
| 15 to 17 Year Olds | 0 (0.0%) | 0 (0.0%) |
| 18 to 19 Year Olds | 0 (0.0%) | 0 (0.0%) |
| 20 to 24 Year Olds | 0 (0.0%) | 0 (0.0%) |
| 25 to 34 Year Olds | 0 (0.0%) | 0 (0.0%) |
| 35 Years and over | 0 (0.0%) | 0 (0.0%) |
| Total | 8 (100.0%) | 0 (0.0%) |
Educational Attainment by Field of Study in Green Valley
| Field of Study | # Graduates | % Graduates |
| Computers & Mathematics | 0 | 0.0% |
| Bio, Nature & Agricultural | 0 | 0.0% |
| Physical & Health Sciences | 0 | 0.0% |
| Psychology | 0 | 0.0% |
| Social Sciences | 0 | 0.0% |
| Engineering | 0 | 0.0% |
| Multidisciplinary Studies | 0 | 0.0% |
| Science & Technology | 0 | 0.0% |
| Business | 0 | 0.0% |
| Education | 0 | 0.0% |
| Literature & Languages | 0 | 0.0% |
| Liberal Arts & History | 0 | 0.0% |
| Visual & Performing Arts | 0 | 0.0% |
| Communications | 0 | 0.0% |
| Arts & Humanities | 0 | 0.0% |
| Total | 0 | 0.0% |
Transportation & Commute in Green Valley
Vehicle Availability by Sex in Green Valley
The most prevalent vehicle ownership categories in Green Valley are males with 3 vehicles (8, accounting for 47.1%) and females with 3 vehicles (8, making up 44.4%).
| Vehicles Available | Male | Female |
| No Vehicle | 0 (0.0%) | 0 (0.0%) |
| 1 Vehicle | 2 (11.8%) | 0 (0.0%) |
| 2 Vehicles | 7 (41.2%) | 7 (38.9%) |
| 3 Vehicles | 8 (47.1%) | 8 (44.4%) |
| 4 Vehicles | 0 (0.0%) | 3 (16.7%) |
| 5 or more Vehicles | 0 (0.0%) | 0 (0.0%) |
| Total | 17 (100.0%) | 18 (100.0%) |
Commute Time in Green Valley
The most frequently occuring commute durations in Green Valley are 15 to 19 minutes (7 commuters, 26.9%), 20 to 24 minutes (4 commuters, 15.4%), and 25 to 29 minutes (4 commuters, 15.4%).
| Commute Time | # Commuters | % Commuters |
| Less than 5 Minutes | 0 | 0.0% |
| 5 to 9 Minutes | 0 | 0.0% |
| 10 to 14 Minutes | 0 | 0.0% |
| 15 to 19 Minutes | 7 | 26.9% |
| 20 to 24 Minutes | 4 | 15.4% |
| 25 to 29 Minutes | 4 | 15.4% |
| 30 to 34 Minutes | 4 | 15.4% |
| 35 to 39 Minutes | 3 | 11.5% |
| 40 to 44 Minutes | 4 | 15.4% |
| 45 to 59 Minutes | 0 | 0.0% |
| 60 to 89 Minutes | 0 | 0.0% |
| 90 or more Minutes | 0 | 0.0% |
Commute Time by Sex in Green Valley
The most common commute times in Green Valley are 25 to 29 minutes (4 commuters, 33.3%) for males and 15 to 19 minutes (7 commuters, 50.0%) for females.
| Commute Time | Male | Female |
| Less than 5 Minutes | 0 (0.0%) | 0 (0.0%) |
| 5 to 9 Minutes | 0 (0.0%) | 0 (0.0%) |
| 10 to 14 Minutes | 0 (0.0%) | 0 (0.0%) |
| 15 to 19 Minutes | 0 (0.0%) | 7 (50.0%) |
| 20 to 24 Minutes | 0 (0.0%) | 4 (28.6%) |
| 25 to 29 Minutes | 4 (33.3%) | 0 (0.0%) |
| 30 to 34 Minutes | 4 (33.3%) | 0 (0.0%) |
| 35 to 39 Minutes | 0 (0.0%) | 3 (21.4%) |
| 40 to 44 Minutes | 4 (33.3%) | 0 (0.0%) |
| 45 to 59 Minutes | 0 (0.0%) | 0 (0.0%) |
| 60 to 89 Minutes | 0 (0.0%) | 0 (0.0%) |
| 90 or more Minutes | 0 (0.0%) | 0 (0.0%) |
Time of Departure to Work by Sex in Green Valley
The most frequent times of departure to work in Green Valley are 12:00 PM to 3:59 PM (6, 50.0%) for males and 6:00 AM to 6:29 AM (11, 78.6%) for females.
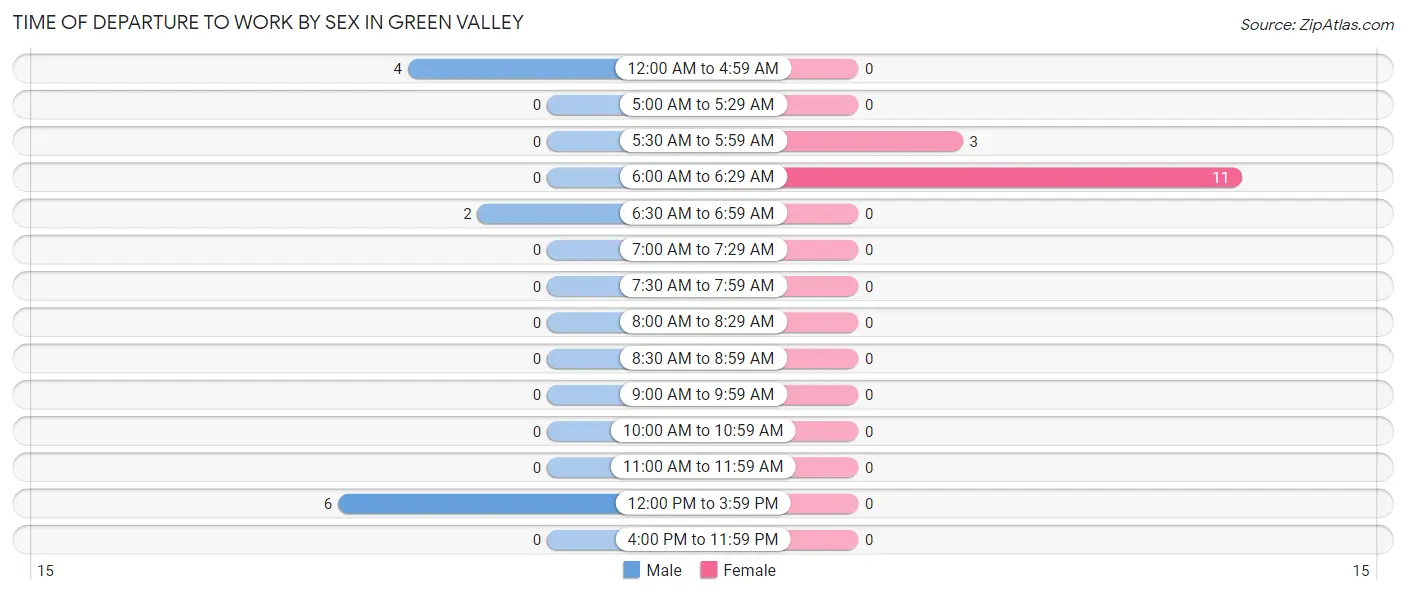
| Time of Departure | Male | Female |
| 12:00 AM to 4:59 AM | 4 (33.3%) | 0 (0.0%) |
| 5:00 AM to 5:29 AM | 0 (0.0%) | 0 (0.0%) |
| 5:30 AM to 5:59 AM | 0 (0.0%) | 3 (21.4%) |
| 6:00 AM to 6:29 AM | 0 (0.0%) | 11 (78.6%) |
| 6:30 AM to 6:59 AM | 2 (16.7%) | 0 (0.0%) |
| 7:00 AM to 7:29 AM | 0 (0.0%) | 0 (0.0%) |
| 7:30 AM to 7:59 AM | 0 (0.0%) | 0 (0.0%) |
| 8:00 AM to 8:29 AM | 0 (0.0%) | 0 (0.0%) |
| 8:30 AM to 8:59 AM | 0 (0.0%) | 0 (0.0%) |
| 9:00 AM to 9:59 AM | 0 (0.0%) | 0 (0.0%) |
| 10:00 AM to 10:59 AM | 0 (0.0%) | 0 (0.0%) |
| 11:00 AM to 11:59 AM | 0 (0.0%) | 0 (0.0%) |
| 12:00 PM to 3:59 PM | 6 (50.0%) | 0 (0.0%) |
| 4:00 PM to 11:59 PM | 0 (0.0%) | 0 (0.0%) |
| Total | 12 (100.0%) | 14 (100.0%) |
Housing Occupancy in Green Valley
Occupancy by Ownership in Green Valley
Of the total 26 dwellings in Green Valley, owner-occupied units account for 18 (69.2%), while renter-occupied units make up 8 (30.8%).
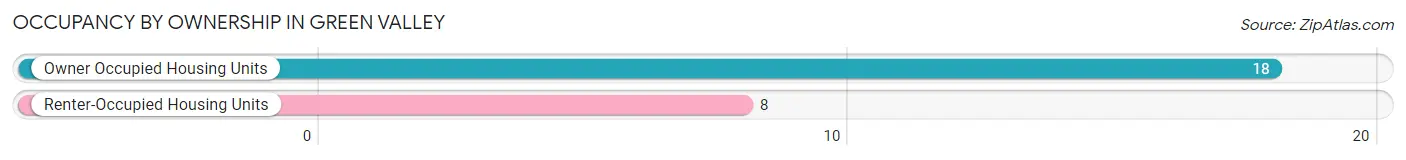
| Occupancy | # Housing Units | % Housing Units |
| Owner Occupied Housing Units | 18 | 69.2% |
| Renter-Occupied Housing Units | 8 | 30.8% |
| Total Occupied Housing Units | 26 | 100.0% |
Occupancy by Household Size in Green Valley
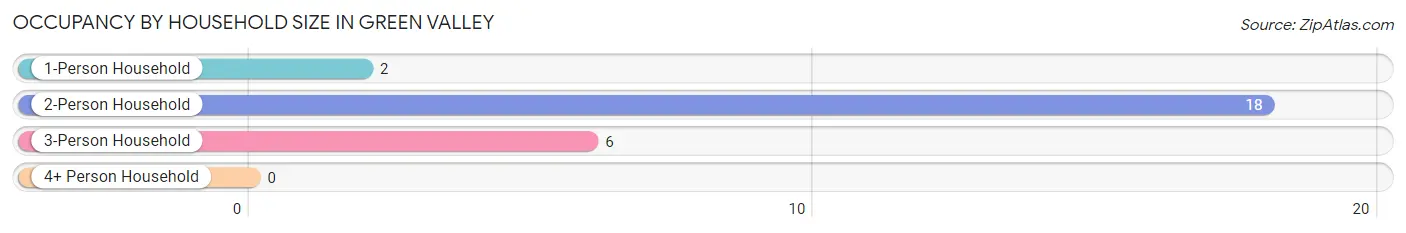
| Household Size | # Housing Units | % Housing Units |
| 1-Person Household | 2 | 7.7% |
| 2-Person Household | 18 | 69.2% |
| 3-Person Household | 6 | 23.1% |
| 4+ Person Household | 0 | 0.0% |
| Total Housing Units | 26 | 100.0% |
Occupancy by Ownership by Household Size in Green Valley
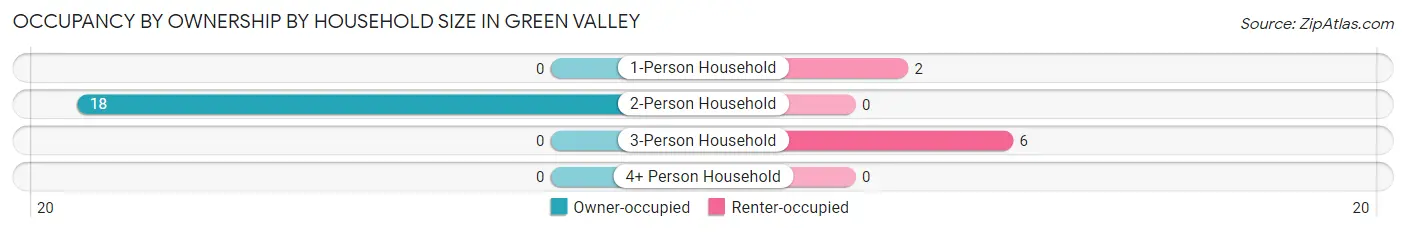
| Household Size | Owner-occupied | Renter-occupied |
| 1-Person Household | 0 (0.0%) | 2 (100.0%) |
| 2-Person Household | 18 (100.0%) | 0 (0.0%) |
| 3-Person Household | 0 (0.0%) | 6 (100.0%) |
| 4+ Person Household | 0 (0.0%) | 0 (0.0%) |
| Total Housing Units | 18 (69.2%) | 8 (30.8%) |
Occupancy by Educational Attainment in Green Valley
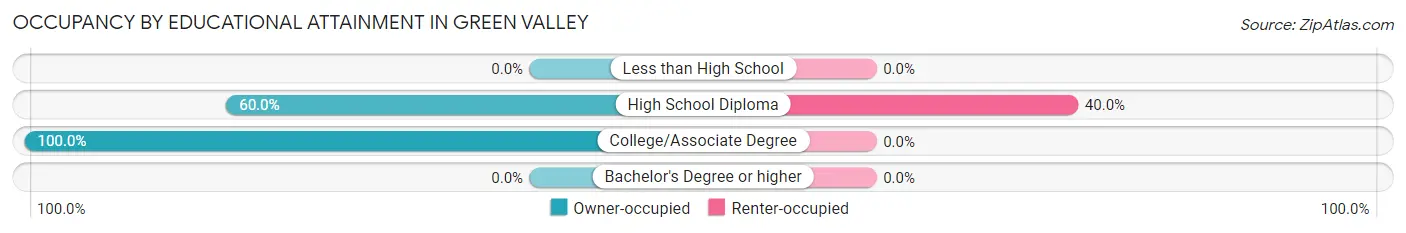
| Household Size | Owner-occupied | Renter-occupied |
| Less than High School | 0 (0.0%) | 0 (0.0%) |
| High School Diploma | 12 (60.0%) | 8 (40.0%) |
| College/Associate Degree | 6 (100.0%) | 0 (0.0%) |
| Bachelor's Degree or higher | 0 (0.0%) | 0 (0.0%) |
Occupancy by Age of Householder in Green Valley
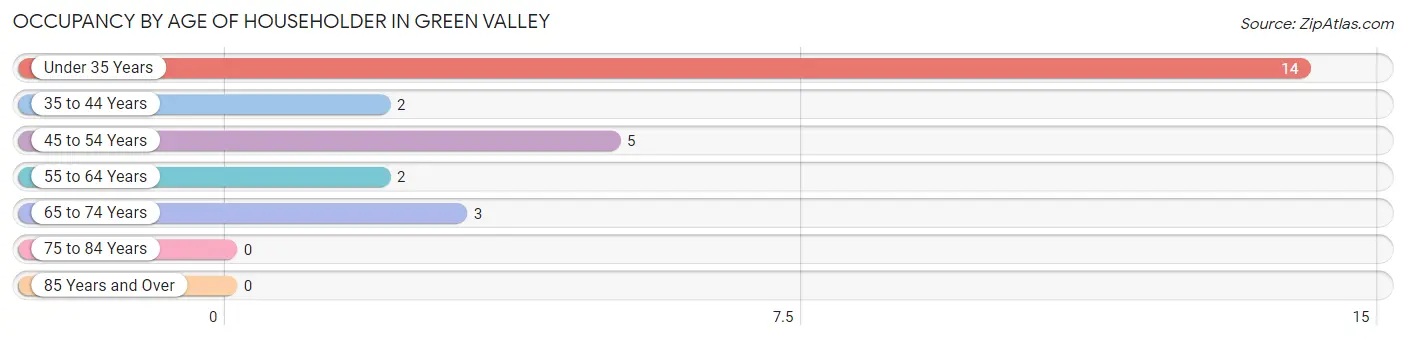
| Age Bracket | # Households | % Households |
| Under 35 Years | 14 | 53.8% |
| 35 to 44 Years | 2 | 7.7% |
| 45 to 54 Years | 5 | 19.2% |
| 55 to 64 Years | 2 | 7.7% |
| 65 to 74 Years | 3 | 11.5% |
| 75 to 84 Years | 0 | 0.0% |
| 85 Years and Over | 0 | 0.0% |
| Total | 26 | 100.0% |
Housing Finances in Green Valley
Median Income by Occupancy in Green Valley
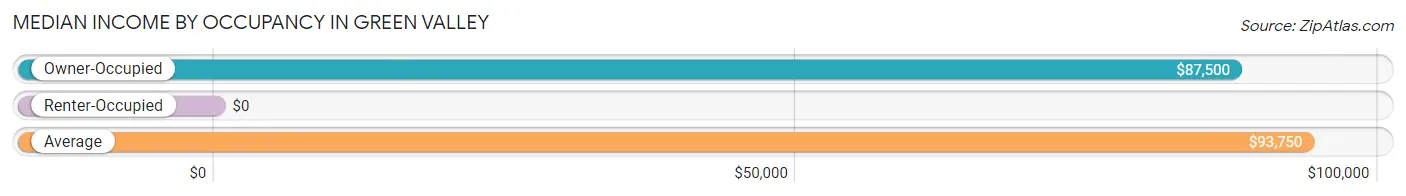
| Occupancy Type | # Households | Median Income |
| Owner-Occupied | 18 (69.2%) | $87,500 |
| Renter-Occupied | 8 (30.8%) | $0 |
| Average | 26 (100.0%) | $93,750 |
Occupancy by Householder Income Bracket in Green Valley
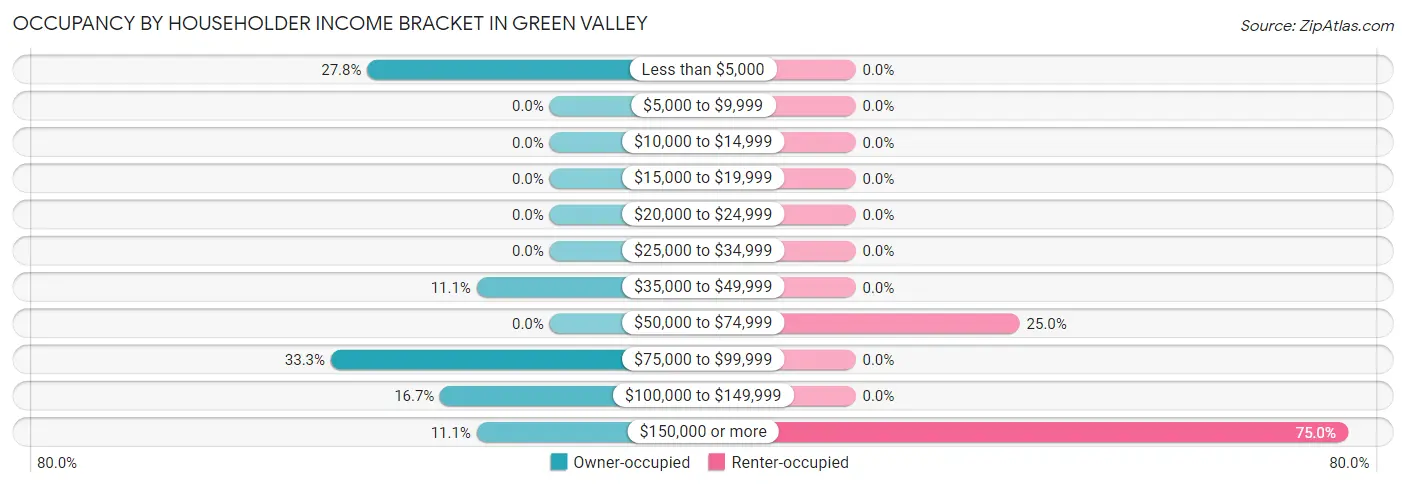
| Income Bracket | Owner-occupied | Renter-occupied |
| Less than $5,000 | 5 (27.8%) | 0 (0.0%) |
| $5,000 to $9,999 | 0 (0.0%) | 0 (0.0%) |
| $10,000 to $14,999 | 0 (0.0%) | 0 (0.0%) |
| $15,000 to $19,999 | 0 (0.0%) | 0 (0.0%) |
| $20,000 to $24,999 | 0 (0.0%) | 0 (0.0%) |
| $25,000 to $34,999 | 0 (0.0%) | 0 (0.0%) |
| $35,000 to $49,999 | 2 (11.1%) | 0 (0.0%) |
| $50,000 to $74,999 | 0 (0.0%) | 2 (25.0%) |
| $75,000 to $99,999 | 6 (33.3%) | 0 (0.0%) |
| $100,000 to $149,999 | 3 (16.7%) | 0 (0.0%) |
| $150,000 or more | 2 (11.1%) | 6 (75.0%) |
| Total | 18 (100.0%) | 8 (100.0%) |
Monthly Housing Cost Tiers in Green Valley
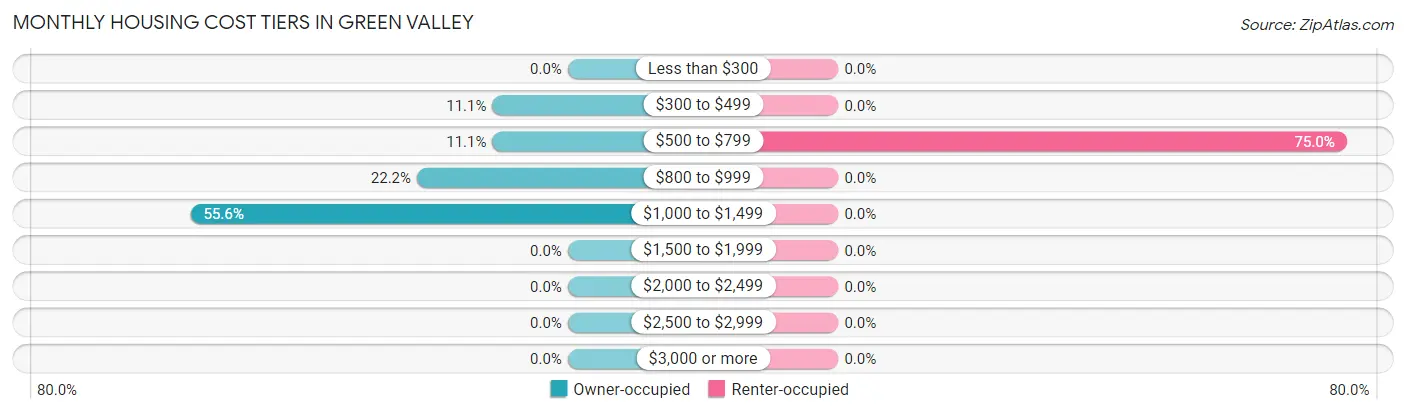
| Monthly Cost | Owner-occupied | Renter-occupied |
| Less than $300 | 0 (0.0%) | 0 (0.0%) |
| $300 to $499 | 2 (11.1%) | 0 (0.0%) |
| $500 to $799 | 2 (11.1%) | 6 (75.0%) |
| $800 to $999 | 4 (22.2%) | 0 (0.0%) |
| $1,000 to $1,499 | 10 (55.6%) | 0 (0.0%) |
| $1,500 to $1,999 | 0 (0.0%) | 0 (0.0%) |
| $2,000 to $2,499 | 0 (0.0%) | 0 (0.0%) |
| $2,500 to $2,999 | 0 (0.0%) | 0 (0.0%) |
| $3,000 or more | 0 (0.0%) | 0 (0.0%) |
| Total | 18 (100.0%) | 8 (100.0%) |
Physical Housing Characteristics in Green Valley
Housing Structures in Green Valley
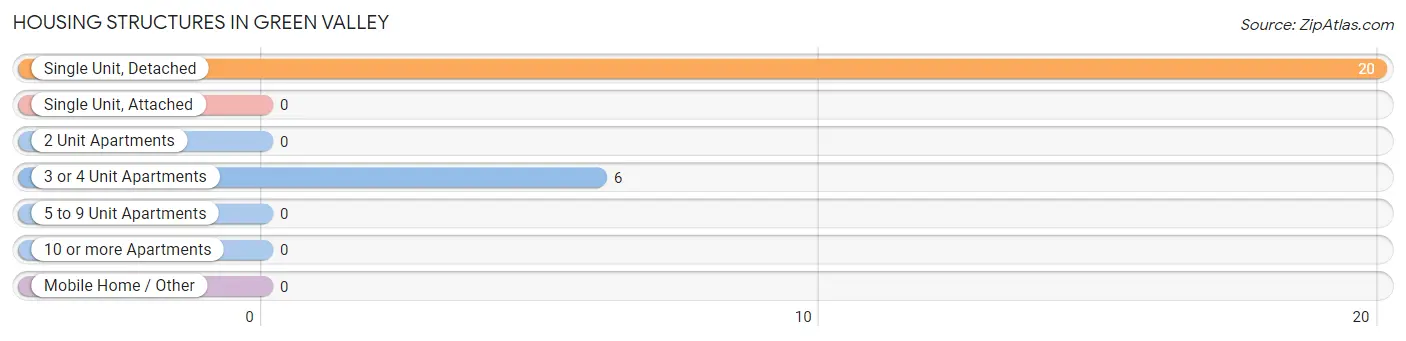
| Structure Type | # Housing Units | % Housing Units |
| Single Unit, Detached | 20 | 76.9% |
| Single Unit, Attached | 0 | 0.0% |
| 2 Unit Apartments | 0 | 0.0% |
| 3 or 4 Unit Apartments | 6 | 23.1% |
| 5 to 9 Unit Apartments | 0 | 0.0% |
| 10 or more Apartments | 0 | 0.0% |
| Mobile Home / Other | 0 | 0.0% |
| Total | 26 | 100.0% |
Housing Structures by Occupancy in Green Valley
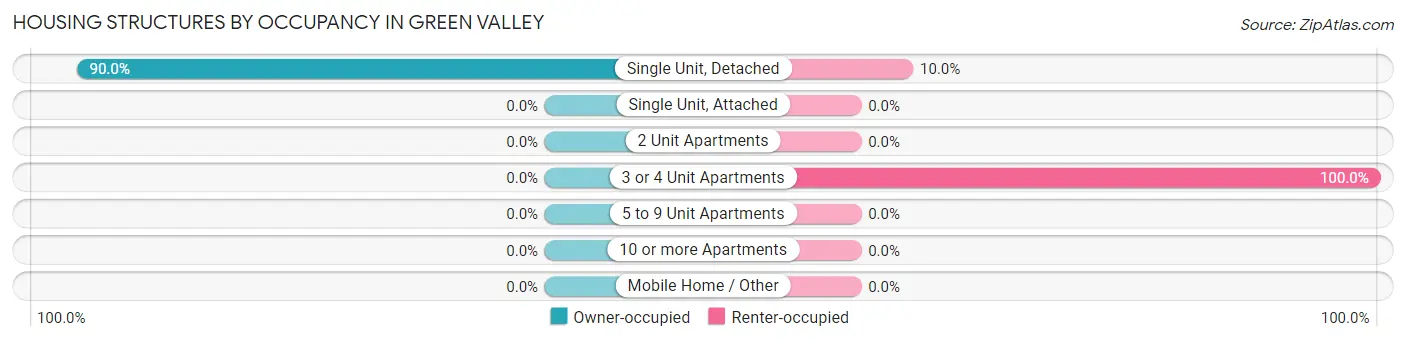
| Structure Type | Owner-occupied | Renter-occupied |
| Single Unit, Detached | 18 (90.0%) | 2 (10.0%) |
| Single Unit, Attached | 0 (0.0%) | 0 (0.0%) |
| 2 Unit Apartments | 0 (0.0%) | 0 (0.0%) |
| 3 or 4 Unit Apartments | 0 (0.0%) | 6 (100.0%) |
| 5 to 9 Unit Apartments | 0 (0.0%) | 0 (0.0%) |
| 10 or more Apartments | 0 (0.0%) | 0 (0.0%) |
| Mobile Home / Other | 0 (0.0%) | 0 (0.0%) |
| Total | 18 (69.2%) | 8 (30.8%) |
Housing Structures by Number of Rooms in Green Valley
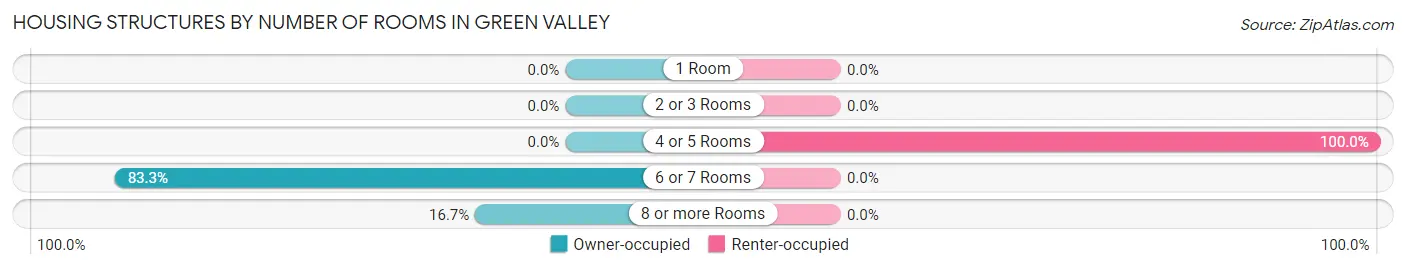
| Number of Rooms | Owner-occupied | Renter-occupied |
| 1 Room | 0 (0.0%) | 0 (0.0%) |
| 2 or 3 Rooms | 0 (0.0%) | 0 (0.0%) |
| 4 or 5 Rooms | 0 (0.0%) | 8 (100.0%) |
| 6 or 7 Rooms | 15 (83.3%) | 0 (0.0%) |
| 8 or more Rooms | 3 (16.7%) | 0 (0.0%) |
| Total | 18 (100.0%) | 8 (100.0%) |
Housing Structure by Heating Type in Green Valley
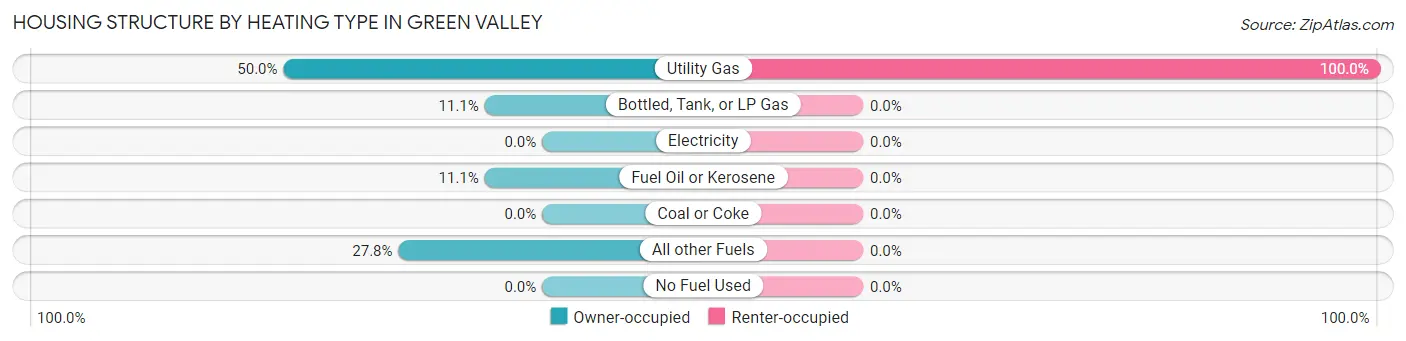
| Heating Type | Owner-occupied | Renter-occupied |
| Utility Gas | 9 (50.0%) | 8 (100.0%) |
| Bottled, Tank, or LP Gas | 2 (11.1%) | 0 (0.0%) |
| Electricity | 0 (0.0%) | 0 (0.0%) |
| Fuel Oil or Kerosene | 2 (11.1%) | 0 (0.0%) |
| Coal or Coke | 0 (0.0%) | 0 (0.0%) |
| All other Fuels | 5 (27.8%) | 0 (0.0%) |
| No Fuel Used | 0 (0.0%) | 0 (0.0%) |
| Total | 18 (100.0%) | 8 (100.0%) |
Household Vehicle Usage in Green Valley
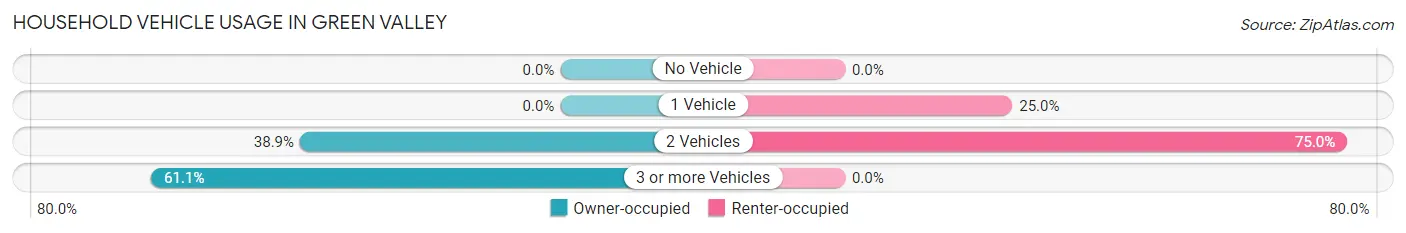
| Vehicles per Household | Owner-occupied | Renter-occupied |
| No Vehicle | 0 (0.0%) | 0 (0.0%) |
| 1 Vehicle | 0 (0.0%) | 2 (25.0%) |
| 2 Vehicles | 7 (38.9%) | 6 (75.0%) |
| 3 or more Vehicles | 11 (61.1%) | 0 (0.0%) |
| Total | 18 (100.0%) | 8 (100.0%) |
Real Estate & Mortgages in Green Valley
Real Estate and Mortgage Overview in Green Valley
| Characteristic | Without Mortgage | With Mortgage |
| Housing Units | 4 | 14 |
| Median Property Value | - | - |
| Median Household Income | - | - |
| Monthly Housing Costs | - | - |
| Real Estate Taxes | - | - |
Property Value by Mortgage Status in Green Valley
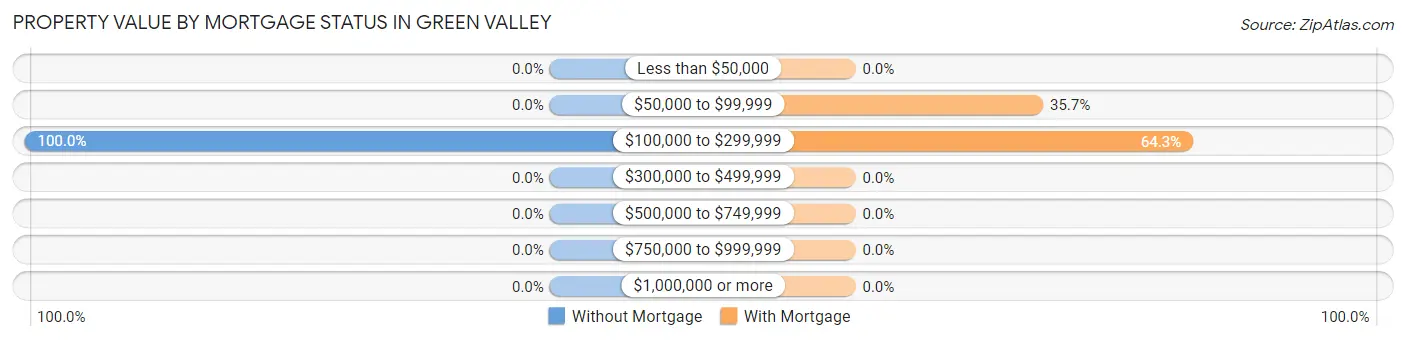
| Property Value | Without Mortgage | With Mortgage |
| Less than $50,000 | 0 (0.0%) | 0 (0.0%) |
| $50,000 to $99,999 | 0 (0.0%) | 5 (35.7%) |
| $100,000 to $299,999 | 4 (100.0%) | 9 (64.3%) |
| $300,000 to $499,999 | 0 (0.0%) | 0 (0.0%) |
| $500,000 to $749,999 | 0 (0.0%) | 0 (0.0%) |
| $750,000 to $999,999 | 0 (0.0%) | 0 (0.0%) |
| $1,000,000 or more | 0 (0.0%) | 0 (0.0%) |
| Total | 4 (100.0%) | 14 (100.0%) |
Household Income by Mortgage Status in Green Valley
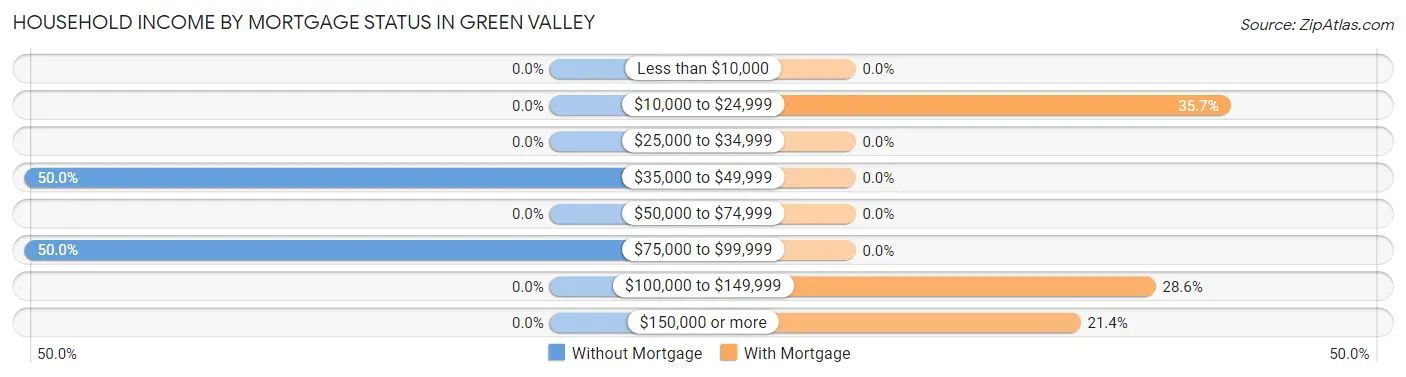
| Household Income | Without Mortgage | With Mortgage |
| Less than $10,000 | 0 (0.0%) | 0 (0.0%) |
| $10,000 to $24,999 | 0 (0.0%) | 5 (35.7%) |
| $25,000 to $34,999 | 0 (0.0%) | 0 (0.0%) |
| $35,000 to $49,999 | 2 (50.0%) | 0 (0.0%) |
| $50,000 to $74,999 | 0 (0.0%) | 0 (0.0%) |
| $75,000 to $99,999 | 2 (50.0%) | 0 (0.0%) |
| $100,000 to $149,999 | 0 (0.0%) | 4 (28.6%) |
| $150,000 or more | 0 (0.0%) | 3 (21.4%) |
| Total | 4 (100.0%) | 14 (100.0%) |
Property Value to Household Income Ratio in Green Valley
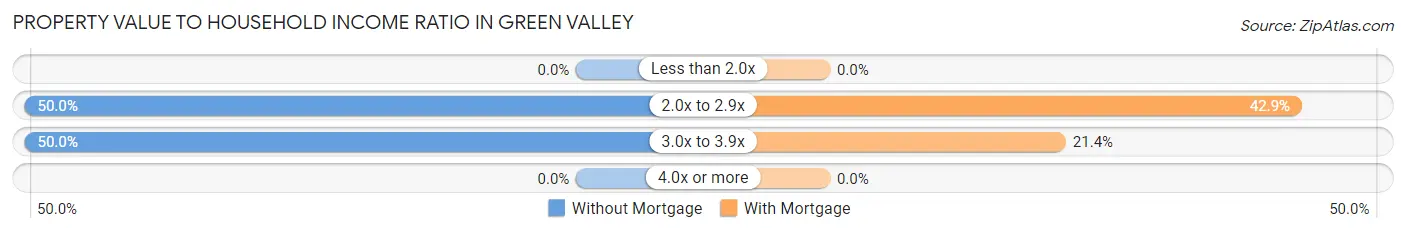
| Value-to-Income Ratio | Without Mortgage | With Mortgage |
| Less than 2.0x | 0 (0.0%) | 0 (0.0%) |
| 2.0x to 2.9x | 2 (50.0%) | 6 (42.9%) |
| 3.0x to 3.9x | 2 (50.0%) | 3 (21.4%) |
| 4.0x or more | 0 (0.0%) | 0 (0.0%) |
| Total | 4 (100.0%) | 14 (100.0%) |
Real Estate Taxes by Mortgage Status in Green Valley
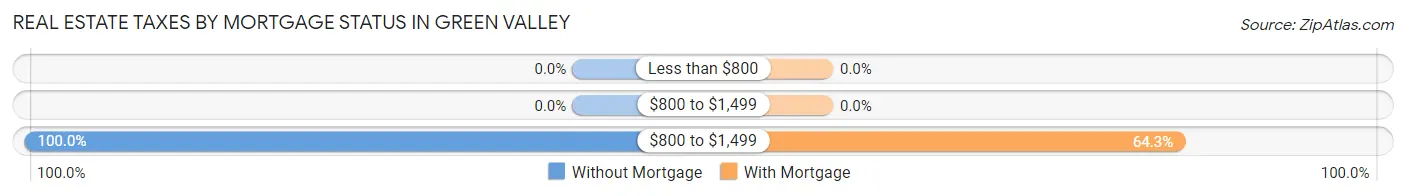
| Property Taxes | Without Mortgage | With Mortgage |
| Less than $800 | 0 (0.0%) | 0 (0.0%) |
| $800 to $1,499 | 0 (0.0%) | 0 (0.0%) |
| $800 to $1,499 | 4 (100.0%) | 9 (64.3%) |
| Total | 4 (100.0%) | 14 (100.0%) |
Health & Disability in Green Valley
Health Insurance Coverage by Age in Green Valley
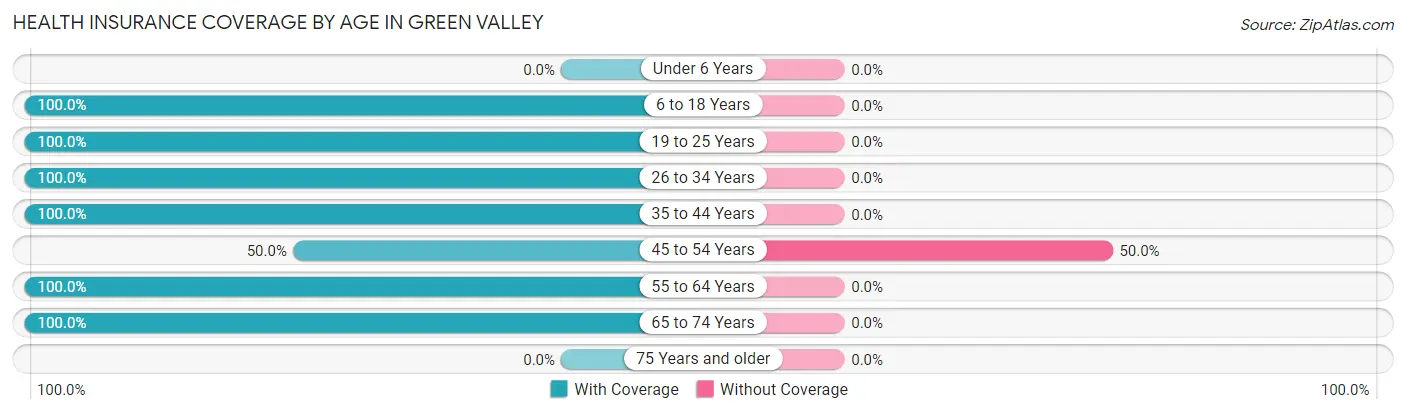
| Age Bracket | With Coverage | Without Coverage |
| Under 6 Years | 0 (0.0%) | 0 (0.0%) |
| 6 to 18 Years | 8 (100.0%) | 0 (0.0%) |
| 19 to 25 Years | 8 (100.0%) | 0 (0.0%) |
| 26 to 34 Years | 19 (100.0%) | 0 (0.0%) |
| 35 to 44 Years | 2 (100.0%) | 0 (0.0%) |
| 45 to 54 Years | 5 (50.0%) | 5 (50.0%) |
| 55 to 64 Years | 5 (100.0%) | 0 (0.0%) |
| 65 to 74 Years | 7 (100.0%) | 0 (0.0%) |
| 75 Years and older | 0 (0.0%) | 0 (0.0%) |
| Total | 54 (91.5%) | 5 (8.5%) |
Health Insurance Coverage by Citizenship Status in Green Valley
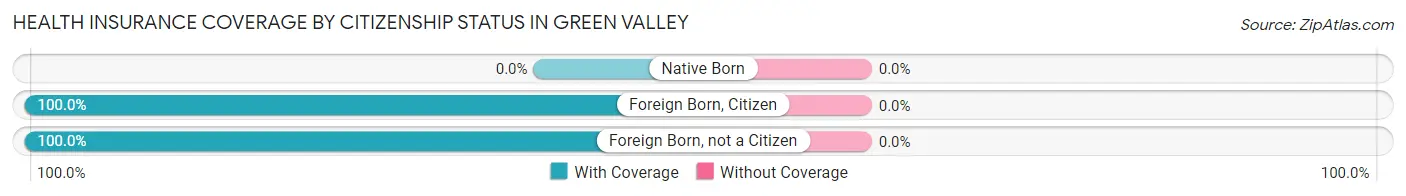
| Citizenship Status | With Coverage | Without Coverage |
| Native Born | 0 (0.0%) | 0 (0.0%) |
| Foreign Born, Citizen | 8 (100.0%) | 0 (0.0%) |
| Foreign Born, not a Citizen | 8 (100.0%) | 0 (0.0%) |
Health Insurance Coverage by Household Income in Green Valley
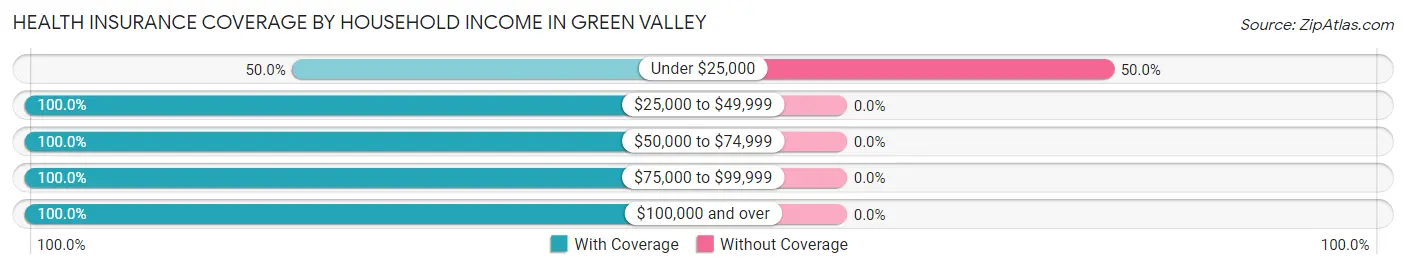
| Household Income | With Coverage | Without Coverage |
| Under $25,000 | 5 (50.0%) | 5 (50.0%) |
| $25,000 to $49,999 | 4 (100.0%) | 0 (0.0%) |
| $50,000 to $74,999 | 2 (100.0%) | 0 (0.0%) |
| $75,000 to $99,999 | 12 (100.0%) | 0 (0.0%) |
| $100,000 and over | 31 (100.0%) | 0 (0.0%) |
Public vs Private Health Insurance Coverage by Age in Green Valley
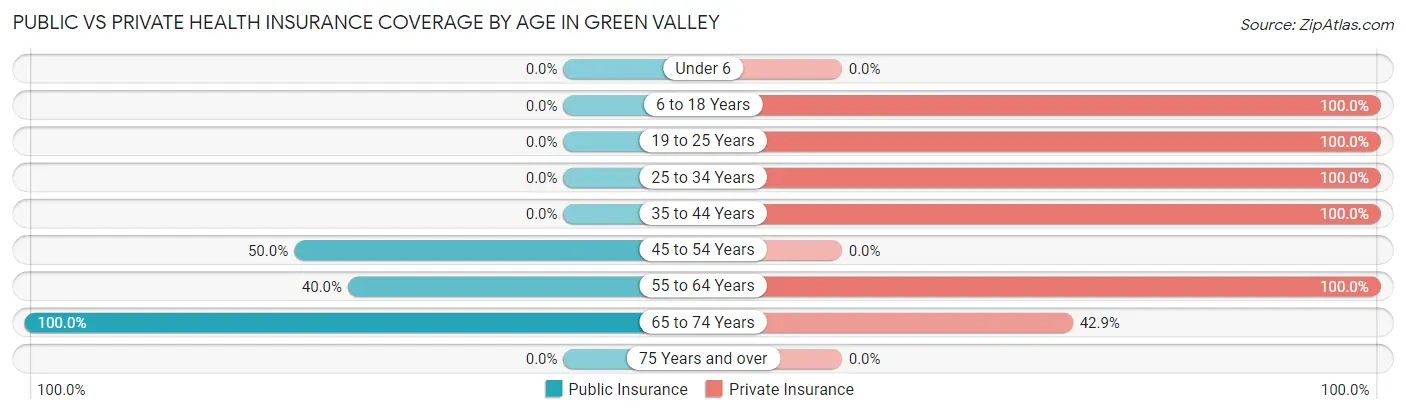
| Age Bracket | Public Insurance | Private Insurance |
| Under 6 | 0 (0.0%) | 0 (0.0%) |
| 6 to 18 Years | 0 (0.0%) | 8 (100.0%) |
| 19 to 25 Years | 0 (0.0%) | 8 (100.0%) |
| 25 to 34 Years | 0 (0.0%) | 19 (100.0%) |
| 35 to 44 Years | 0 (0.0%) | 2 (100.0%) |
| 45 to 54 Years | 5 (50.0%) | 0 (0.0%) |
| 55 to 64 Years | 2 (40.0%) | 5 (100.0%) |
| 65 to 74 Years | 7 (100.0%) | 3 (42.9%) |
| 75 Years and over | 0 (0.0%) | 0 (0.0%) |
| Total | 14 (23.7%) | 45 (76.3%) |
Disability Status by Sex by Age in Green Valley
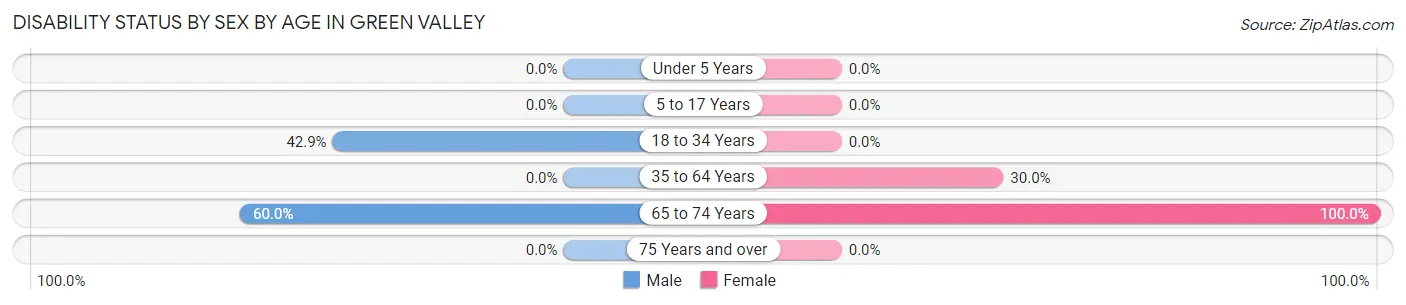
| Age Bracket | Male | Female |
| Under 5 Years | 0 (0.0%) | 0 (0.0%) |
| 5 to 17 Years | 0 (0.0%) | 0 (0.0%) |
| 18 to 34 Years | 6 (42.9%) | 0 (0.0%) |
| 35 to 64 Years | 0 (0.0%) | 3 (30.0%) |
| 65 to 74 Years | 3 (60.0%) | 2 (100.0%) |
| 75 Years and over | 0 (0.0%) | 0 (0.0%) |
Disability Class by Sex by Age in Green Valley
Disability Class: Hearing Difficulty
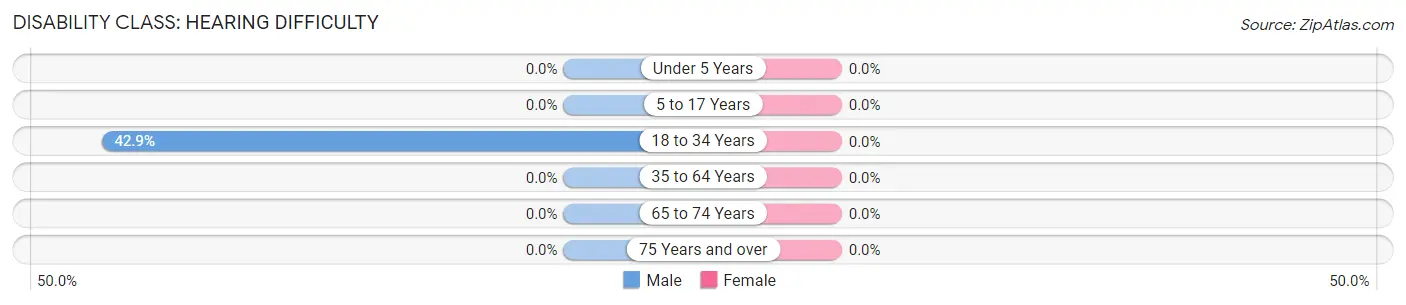
| Age Bracket | Male | Female |
| Under 5 Years | 0 (0.0%) | 0 (0.0%) |
| 5 to 17 Years | 0 (0.0%) | 0 (0.0%) |
| 18 to 34 Years | 6 (42.9%) | 0 (0.0%) |
| 35 to 64 Years | 0 (0.0%) | 0 (0.0%) |
| 65 to 74 Years | 0 (0.0%) | 0 (0.0%) |
| 75 Years and over | 0 (0.0%) | 0 (0.0%) |
Disability Class: Vision Difficulty
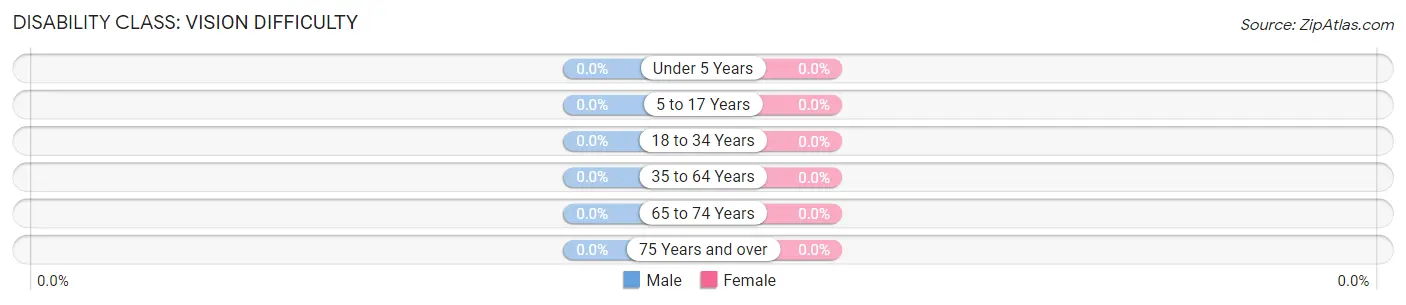
| Age Bracket | Male | Female |
| Under 5 Years | 0 (0.0%) | 0 (0.0%) |
| 5 to 17 Years | 0 (0.0%) | 0 (0.0%) |
| 18 to 34 Years | 0 (0.0%) | 0 (0.0%) |
| 35 to 64 Years | 0 (0.0%) | 0 (0.0%) |
| 65 to 74 Years | 0 (0.0%) | 0 (0.0%) |
| 75 Years and over | 0 (0.0%) | 0 (0.0%) |
Disability Class: Cognitive Difficulty
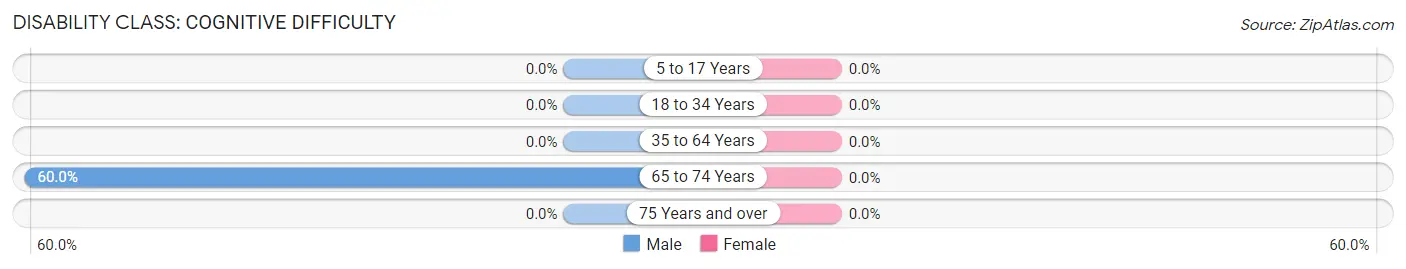
| Age Bracket | Male | Female |
| 5 to 17 Years | 0 (0.0%) | 0 (0.0%) |
| 18 to 34 Years | 0 (0.0%) | 0 (0.0%) |
| 35 to 64 Years | 0 (0.0%) | 0 (0.0%) |
| 65 to 74 Years | 3 (60.0%) | 0 (0.0%) |
| 75 Years and over | 0 (0.0%) | 0 (0.0%) |
Disability Class: Ambulatory Difficulty
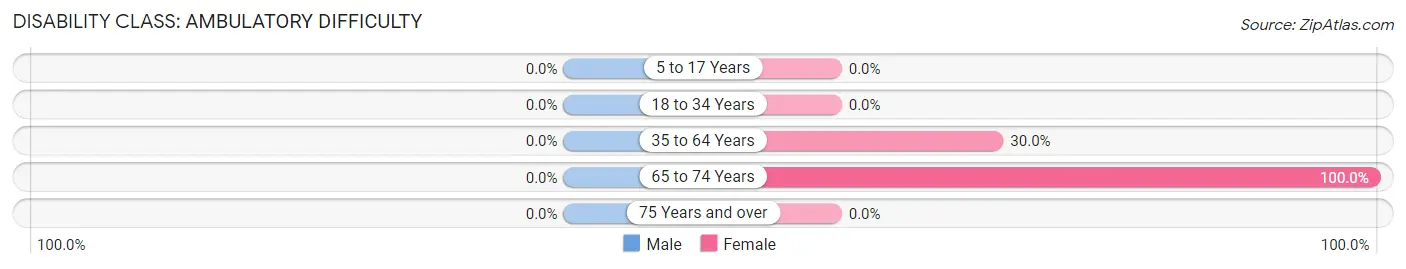
| Age Bracket | Male | Female |
| 5 to 17 Years | 0 (0.0%) | 0 (0.0%) |
| 18 to 34 Years | 0 (0.0%) | 0 (0.0%) |
| 35 to 64 Years | 0 (0.0%) | 3 (30.0%) |
| 65 to 74 Years | 0 (0.0%) | 2 (100.0%) |
| 75 Years and over | 0 (0.0%) | 0 (0.0%) |
Disability Class: Self-Care Difficulty
| Age Bracket | Male | Female |
| 5 to 17 Years | 0 (0.0%) | 0 (0.0%) |
| 18 to 34 Years | 0 (0.0%) | 0 (0.0%) |
| 35 to 64 Years | 0 (0.0%) | 0 (0.0%) |
| 65 to 74 Years | 0 (0.0%) | 0 (0.0%) |
| 75 Years and over | 0 (0.0%) | 0 (0.0%) |
Technology Access in Green Valley
Computing Device Access in Green Valley
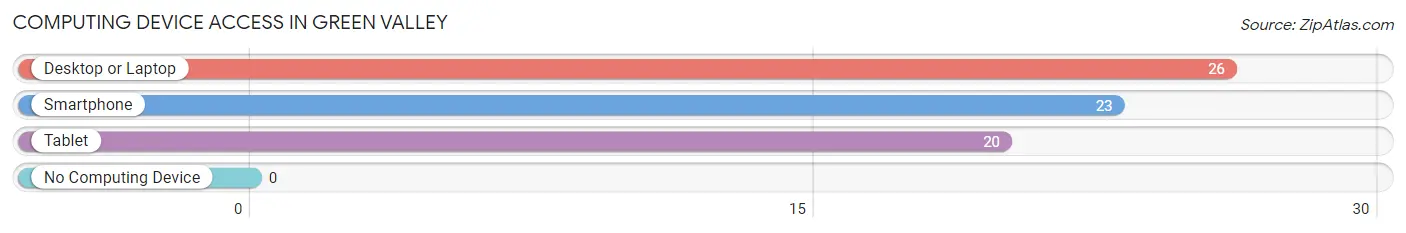
| Device Type | # Households | % Households |
| Desktop or Laptop | 26 | 100.0% |
| Smartphone | 23 | 88.5% |
| Tablet | 20 | 76.9% |
| No Computing Device | 0 | 0.0% |
| Total | 26 | 100.0% |
Internet Access in Green Valley
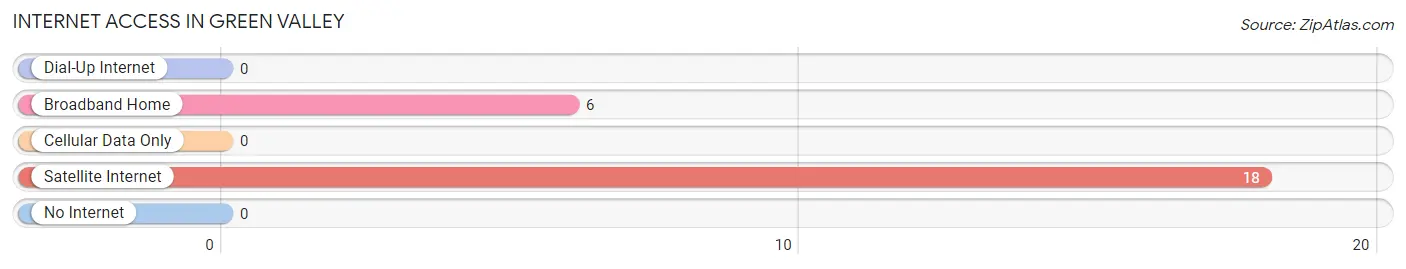
| Internet Type | # Households | % Households |
| Dial-Up Internet | 0 | 0.0% |
| Broadband Home | 6 | 23.1% |
| Cellular Data Only | 0 | 0.0% |
| Satellite Internet | 18 | 69.2% |
| No Internet | 0 | 0.0% |
| Total | 26 | 100.0% |
Green Valley Summary
History
Green Valley, Wisconsin is a small unincorporated community located in the town of Green Valley in Waukesha County, Wisconsin. The area was first settled in the early 1800s by German immigrants who were attracted to the area by its fertile soil and abundant natural resources. The first settlers built a log cabin and began farming the land. As the population grew, more settlers moved into the area and the community began to take shape.
In 1845, the first post office was established in Green Valley and the community was officially recognized as a village. The village was named after the nearby Green Valley Creek, which was named for its lush green vegetation.
The village grew steadily over the next few decades, and by the turn of the century, it had become a thriving agricultural community. The village was home to several businesses, including a general store, a blacksmith shop, a cheese factory, and a sawmill.
In the early 1900s, the village began to experience a period of growth and prosperity. The population increased and new businesses opened, including a bank, a hotel, and a movie theater. The village also became a popular tourist destination, as visitors came to enjoy the area’s natural beauty and outdoor activities.
In the 1950s, the village began to decline as many of its residents moved away in search of better economic opportunities. The population decreased and many of the businesses closed. However, the village has experienced a resurgence in recent years, as new businesses have opened and the population has grown.
Geography
Green Valley is located in the town of Green Valley in Waukesha County, Wisconsin. The village is situated on the banks of the Green Valley Creek, which flows through the area. The village is surrounded by rolling hills and lush green forests.
The climate in Green Valley is typical of the Midwest, with hot summers and cold winters. The average temperature in the summer is around 75 degrees Fahrenheit, while the average temperature in the winter is around 25 degrees Fahrenheit.
Economy
Green Valley’s economy is largely based on agriculture and tourism. The village is home to several farms, which produce a variety of crops, including corn, soybeans, and wheat. The village also has several wineries and breweries, which attract visitors from all over the region.
In addition to agriculture and tourism, Green Valley is home to several small businesses, including restaurants, shops, and a bank. The village also has a post office and a library.
Demographics
As of the 2010 census, the population of Green Valley was 1,845. The population is predominantly white (97.3%), with a small percentage of African Americans (1.2%) and Hispanics (1.5%). The median household income is $50,000, and the median age is 43.
Green Valley is a small, close-knit community with a strong sense of community and pride. The village is home to several churches, a volunteer fire department, and a community center. The village also hosts several annual events, including a Fourth of July parade and a Christmas tree lighting ceremony.
Common Questions
What is the Total Population of Green Valley?
Total Population of Green Valley is 59.
What is the Total Male Population of Green Valley?
Total Male Population of Green Valley is 34.
What is the Total Female Population of Green Valley?
Total Female Population of Green Valley is 25.
What is the Ratio of Males per 100 Females in Green Valley?
There are 136.00 Males per 100 Females in Green Valley.
What is the Ratio of Females per 100 Males in Green Valley?
There are 73.53 Females per 100 Males in Green Valley.
What is the Median Population Age in Green Valley?
Median Population Age in Green Valley is 31.9 Years.
What is the Average Family Size in Green Valley
Average Family Size in Green Valley is 2.5 People.
What is the Average Household Size in Green Valley
Average Household Size in Green Valley is 2.3 People.
What is Per Capita Income in Green Valley?
Per Capita income in Green Valley is $43,786.
What is the Median Household income in Green Valley?
Median Household Income in Green Valley is $93,750.
What is Inequality or Gini Index in Green Valley?
Inequality or Gini Index in Green Valley is 0.38.
How Large is the Labor Force in Green Valley?
There are 41 People in the Labor Forcein in Green Valley.
What is the Percentage of People in the Labor Force in Green Valley?
80.4% of People are in the Labor Force in Green Valley.
What is the Unemployment Rate in Green Valley?
Unemployment Rate in Green Valley is 14.6%.