Frederic, WI
Frederic Map
Frederic Overview
1,101
TOTAL POPULATION
608
MALE POPULATION
493
FEMALE POPULATION
123.33
MALES / 100 FEMALES
81.09
FEMALES / 100 MALES
44.6
MEDIAN AGE
3.2
AVG FAMILY SIZE
2.3
AVG HOUSEHOLD SIZE
$28,755
PER CAPITA INCOME
$69,886
AVG FAMILY INCOME
$50,250
AVG HOUSEHOLD INCOME
33.2%
WAGE / INCOME GAP [ % ]
66.8¢/ $1
WAGE / INCOME GAP [ $ ]
0.40
INEQUALITY / GINI INDEX
552
LABOR FORCE [ PEOPLE ]
61.4%
PERCENT IN LABOR FORCE
3.8%
UNEMPLOYMENT RATE
Frederic Zip Codes
Frederic Area Codes
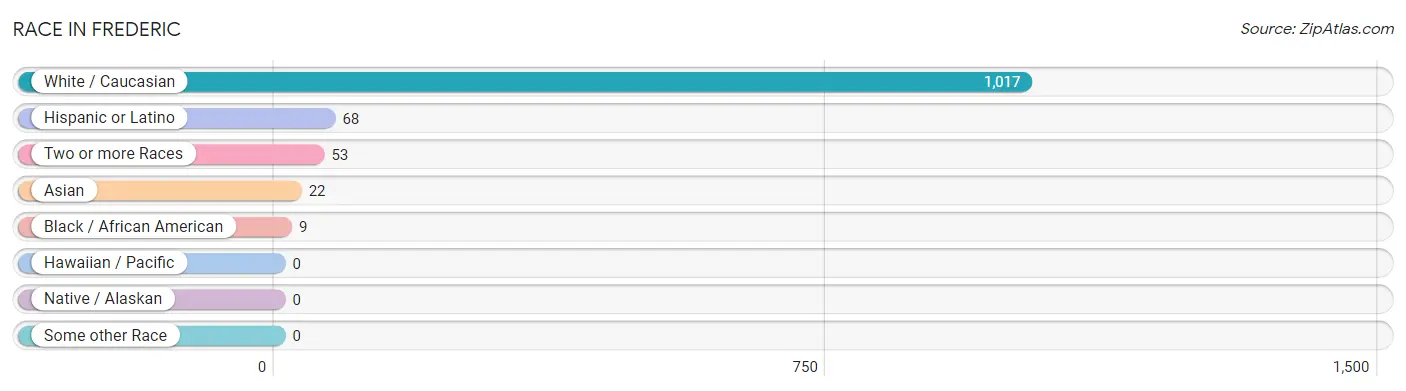
Race in Frederic
The most populous races in Frederic are White / Caucasian (1,017 | 92.4%), Hispanic or Latino (68 | 6.2%), and Two or more Races (53 | 4.8%).
| Race | # Population | % Population |
| Asian | 22 | 2.0% |
| Black / African American | 9 | 0.8% |
| Hawaiian / Pacific | 0 | 0.0% |
| Hispanic or Latino | 68 | 6.2% |
| Native / Alaskan | 0 | 0.0% |
| White / Caucasian | 1,017 | 92.4% |
| Two or more Races | 53 | 4.8% |
| Some other Race | 0 | 0.0% |
| Total | 1,101 | 100.0% |
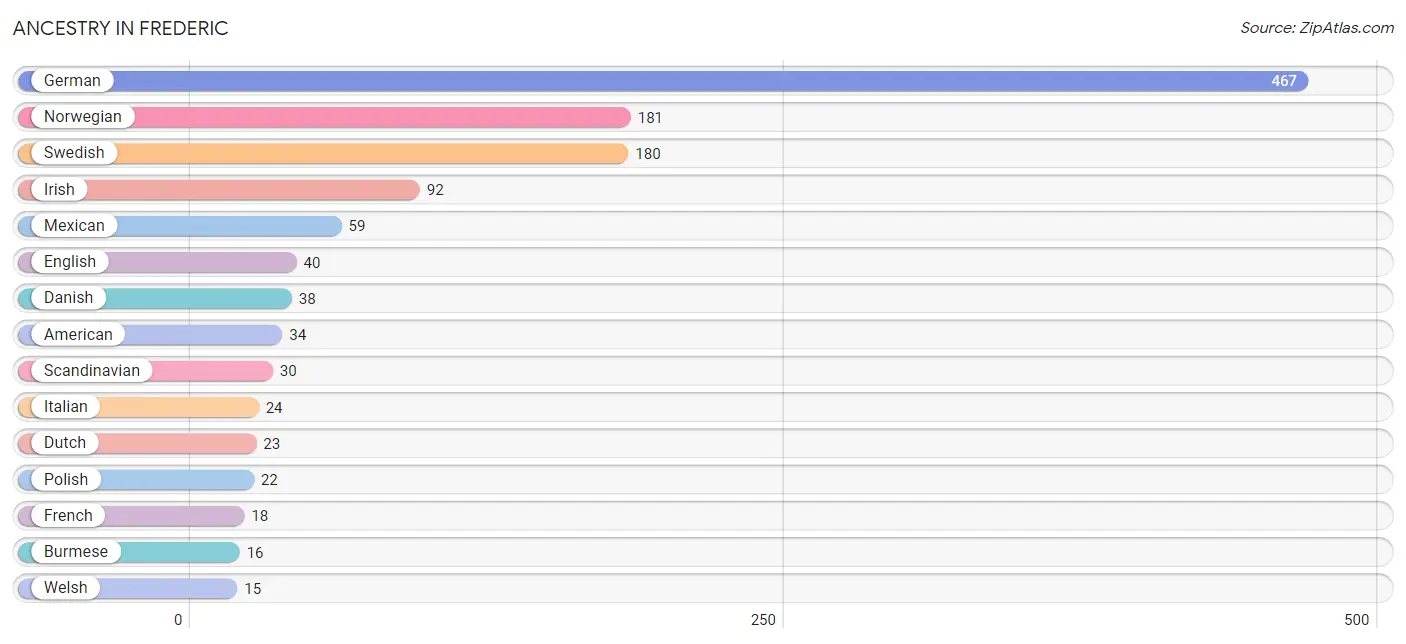
Ancestry in Frederic
The most populous ancestries reported in Frederic are German (467 | 42.4%), Norwegian (181 | 16.4%), Swedish (180 | 16.4%), Irish (92 | 8.4%), and Mexican (59 | 5.4%), together accounting for 88.9% of all Frederic residents.
| Ancestry | # Population | % Population |
| American | 34 | 3.1% |
| Burmese | 16 | 1.5% |
| Croatian | 5 | 0.4% |
| Cuban | 8 | 0.7% |
| Czech | 4 | 0.4% |
| Danish | 38 | 3.5% |
| Dutch | 23 | 2.1% |
| English | 40 | 3.6% |
| European | 2 | 0.2% |
| French | 18 | 1.6% |
| French Canadian | 6 | 0.5% |
| German | 467 | 42.4% |
| Irish | 92 | 8.4% |
| Italian | 24 | 2.2% |
| Mexican | 59 | 5.4% |
| Native Hawaiian | 2 | 0.2% |
| Northern European | 2 | 0.2% |
| Norwegian | 181 | 16.4% |
| Pennsylvania German | 2 | 0.2% |
| Polish | 22 | 2.0% |
| Puerto Rican | 1 | 0.1% |
| Russian | 9 | 0.8% |
| Scandinavian | 30 | 2.7% |
| Scotch-Irish | 8 | 0.7% |
| Scottish | 3 | 0.3% |
| Serbian | 3 | 0.3% |
| Slovak | 2 | 0.2% |
| Swedish | 180 | 16.4% |
| Thai | 6 | 0.5% |
| Ukrainian | 6 | 0.5% |
| Welsh | 15 | 1.4% | View All 31 Rows |
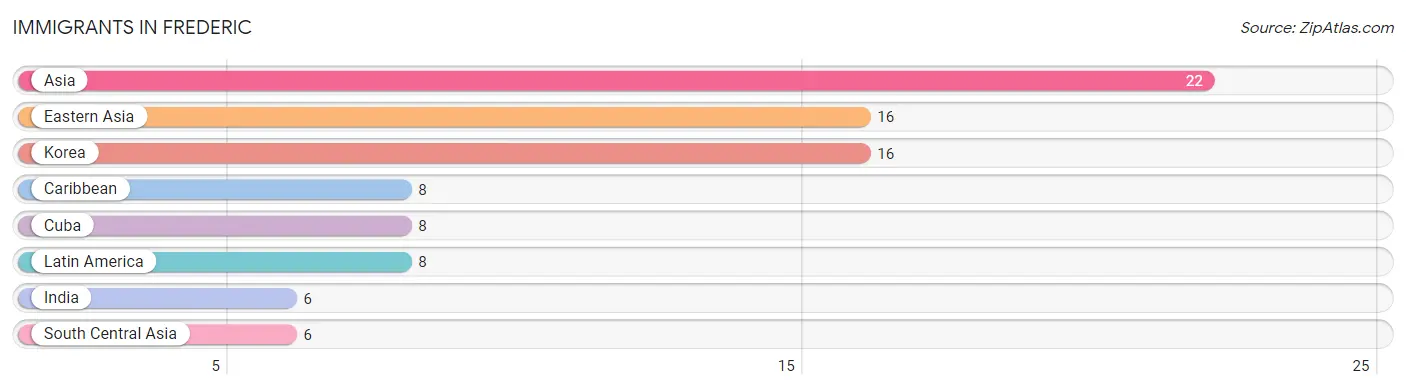
Immigrants in Frederic
The most numerous immigrant groups reported in Frederic came from Asia (22 | 2.0%), Eastern Asia (16 | 1.5%), Korea (16 | 1.5%), Caribbean (8 | 0.7%), and Cuba (8 | 0.7%), together accounting for 6.4% of all Frederic residents.
| Immigration Origin | # Population | % Population |
| Asia | 22 | 2.0% |
| Caribbean | 8 | 0.7% |
| Cuba | 8 | 0.7% |
| Eastern Asia | 16 | 1.5% |
| India | 6 | 0.5% |
| Korea | 16 | 1.5% |
| Latin America | 8 | 0.7% |
| South Central Asia | 6 | 0.5% | View All 8 Rows |
Sex and Age in Frederic
Sex and Age in Frederic
The most populous age groups in Frederic are 55 to 59 Years (67 | 11.0%) for men and 85 Years and over (56 | 11.4%) for women.
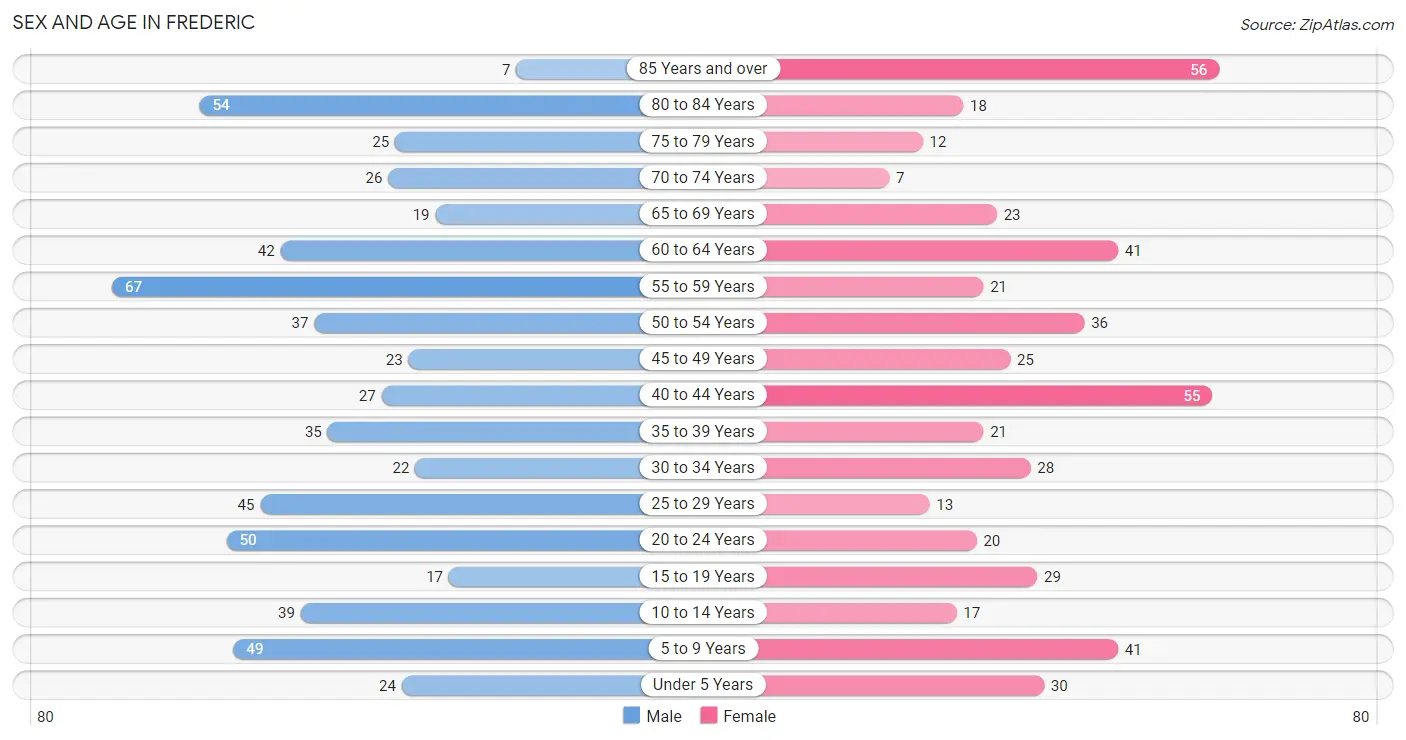
| Age Bracket | Male | Female |
| Under 5 Years | 24 (4.0%) | 30 (6.1%) |
| 5 to 9 Years | 49 (8.1%) | 41 (8.3%) |
| 10 to 14 Years | 39 (6.4%) | 17 (3.5%) |
| 15 to 19 Years | 17 (2.8%) | 29 (5.9%) |
| 20 to 24 Years | 50 (8.2%) | 20 (4.1%) |
| 25 to 29 Years | 45 (7.4%) | 13 (2.6%) |
| 30 to 34 Years | 22 (3.6%) | 28 (5.7%) |
| 35 to 39 Years | 35 (5.8%) | 21 (4.3%) |
| 40 to 44 Years | 27 (4.4%) | 55 (11.2%) |
| 45 to 49 Years | 23 (3.8%) | 25 (5.1%) |
| 50 to 54 Years | 37 (6.1%) | 36 (7.3%) |
| 55 to 59 Years | 67 (11.0%) | 21 (4.3%) |
| 60 to 64 Years | 42 (6.9%) | 41 (8.3%) |
| 65 to 69 Years | 19 (3.1%) | 23 (4.7%) |
| 70 to 74 Years | 26 (4.3%) | 7 (1.4%) |
| 75 to 79 Years | 25 (4.1%) | 12 (2.4%) |
| 80 to 84 Years | 54 (8.9%) | 18 (3.6%) |
| 85 Years and over | 7 (1.1%) | 56 (11.4%) |
| Total | 608 (100.0%) | 493 (100.0%) |
Families and Households in Frederic
Median Family Size in Frederic
The median family size in Frederic is 3.25 persons per family, with single male/father families (10 | 4.5%) accounting for the largest median family size of 4.9 persons per family. On the other hand, single female/mother families (45 | 20.2%) represent the smallest median family size with 3.11 persons per family.
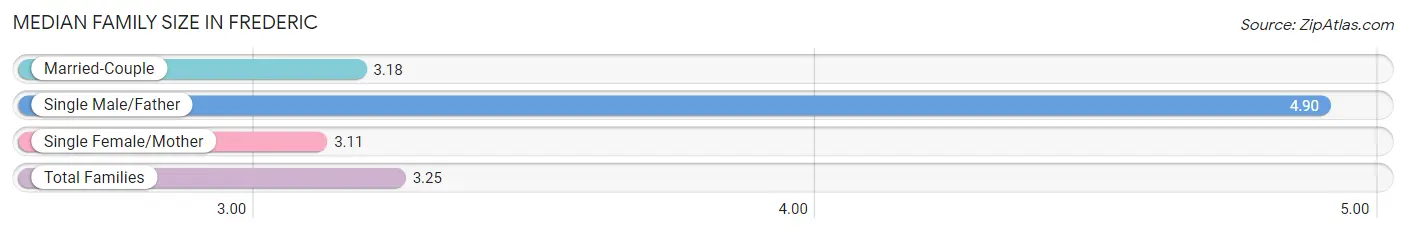
| Family Type | # Families | Family Size |
| Married-Couple | 168 (75.3%) | 3.18 |
| Single Male/Father | 10 (4.5%) | 4.90 |
| Single Female/Mother | 45 (20.2%) | 3.11 |
| Total Families | 223 (100.0%) | 3.25 |
Median Household Size in Frederic
The median household size in Frederic is 2.32 persons per household, with single male/father households (10 | 2.3%) accounting for the largest median household size of 5.1 persons per household. non-family households (219 | 49.5%) represent the smallest median household size with 1.25 persons per household.
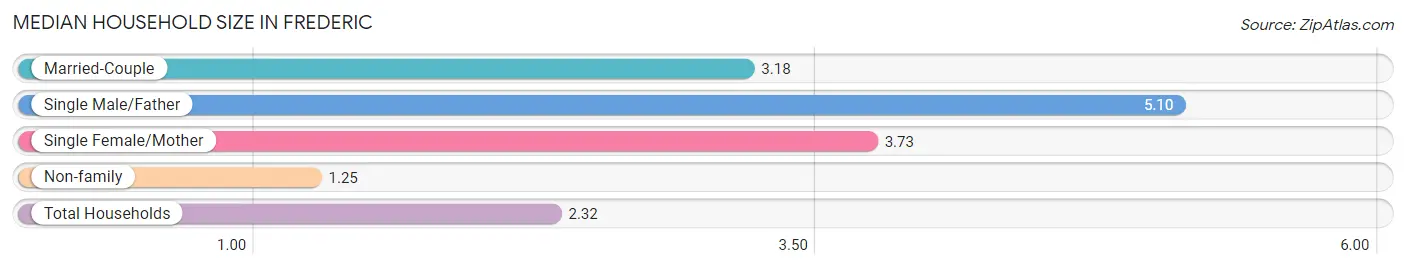
| Household Type | # Households | Household Size |
| Married-Couple | 168 (38.0%) | 3.18 |
| Single Male/Father | 10 (2.3%) | 5.10 |
| Single Female/Mother | 45 (10.2%) | 3.73 |
| Non-family | 219 (49.5%) | 1.25 |
| Total Households | 442 (100.0%) | 2.32 |
Household Size by Marriage Status in Frederic
Out of a total of 442 households in Frederic, 223 (50.4%) are family households, while 219 (49.5%) are nonfamily households. The most numerous type of family households are 2-person households, comprising 128, and the most common type of nonfamily households are 1-person households, comprising 177.
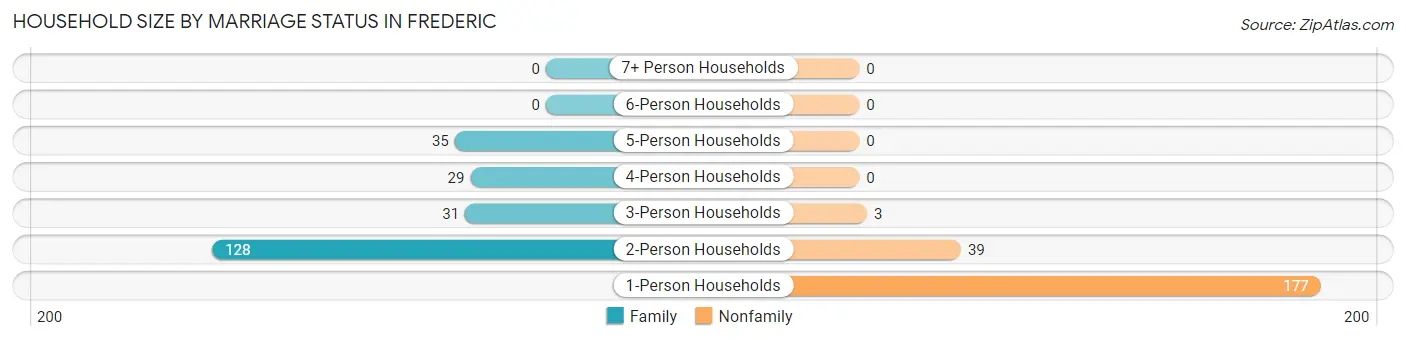
| Household Size | Family Households | Nonfamily Households |
| 1-Person Households | - | 177 (40.1%) |
| 2-Person Households | 128 (29.0%) | 39 (8.8%) |
| 3-Person Households | 31 (7.0%) | 3 (0.7%) |
| 4-Person Households | 29 (6.6%) | 0 (0.0%) |
| 5-Person Households | 35 (7.9%) | 0 (0.0%) |
| 6-Person Households | 0 (0.0%) | 0 (0.0%) |
| 7+ Person Households | 0 (0.0%) | 0 (0.0%) |
| Total | 223 (50.4%) | 219 (49.5%) |
Female Fertility in Frederic
Fertility by Age in Frederic
Average fertility rate in Frederic is 41.0 births per 1,000 women. Women in the age bracket of 20 to 34 years have the highest fertility rate with 131.0 births per 1,000 women. Women in the age bracket of 20 to 34 years acount for 100.0% of all women with births.
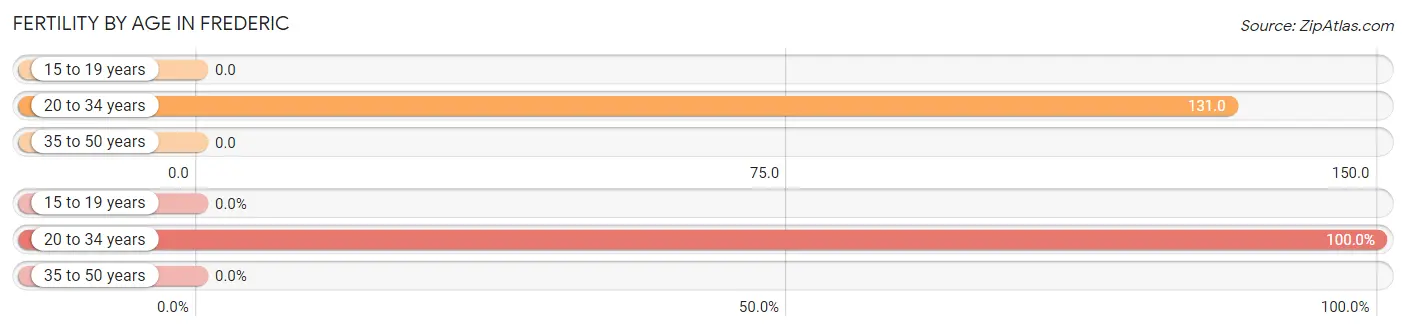
| Age Bracket | Women with Births | Births / 1,000 Women |
| 15 to 19 years | 0 (0.0%) | 0.0 |
| 20 to 34 years | 8 (100.0%) | 131.0 |
| 35 to 50 years | 0 (0.0%) | 0.0 |
| Total | 8 (100.0%) | 41.0 |
Fertility by Age by Marriage Status in Frederic
37.5% of women with births (8) in Frederic are married. The highest percentage of unmarried women with births falls into 20 to 34 years age bracket with 62.5% of them unmarried at the time of birth, while the lowest percentage of unmarried women with births belong to 20 to 34 years age bracket with 62.5% of them unmarried.
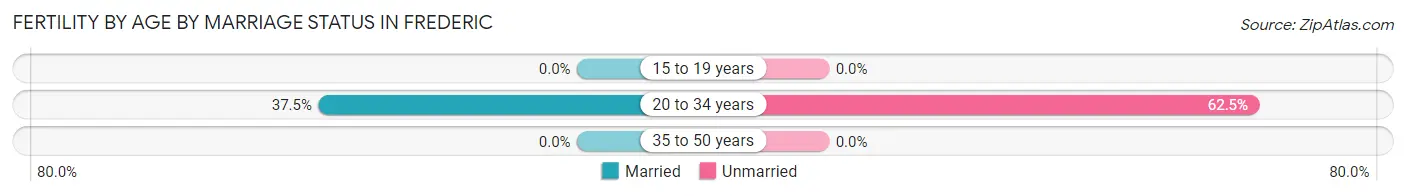
| Age Bracket | Married | Unmarried |
| 15 to 19 years | 0 (0.0%) | 0 (0.0%) |
| 20 to 34 years | 3 (37.5%) | 5 (62.5%) |
| 35 to 50 years | 0 (0.0%) | 0 (0.0%) |
| Total | 3 (37.5%) | 5 (62.5%) |
Fertility by Education in Frederic
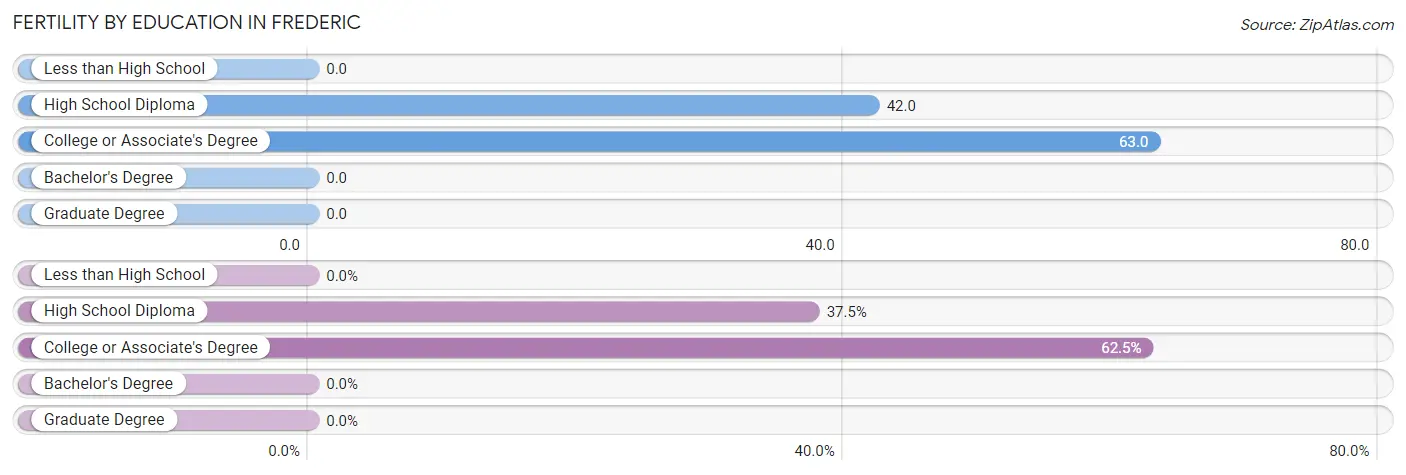
| Educational Attainment | Women with Births | Births / 1,000 Women |
| Less than High School | 0 (0.0%) | 0.0 |
| High School Diploma | 3 (37.5%) | 42.0 |
| College or Associate's Degree | 5 (62.5%) | 63.0 |
| Bachelor's Degree | 0 (0.0%) | 0.0 |
| Graduate Degree | 0 (0.0%) | 0.0 |
| Total | 8 (100.0%) | 41.0 |
Fertility by Education by Marriage Status in Frederic
62.5% of women with births in Frederic are unmarried. Women with the educational attainment of high school diploma are most likely to be married with 100.0% of them married at childbirth, while women with the educational attainment of college or associate's degree are least likely to be married with 100.0% of them unmarried at childbirth.
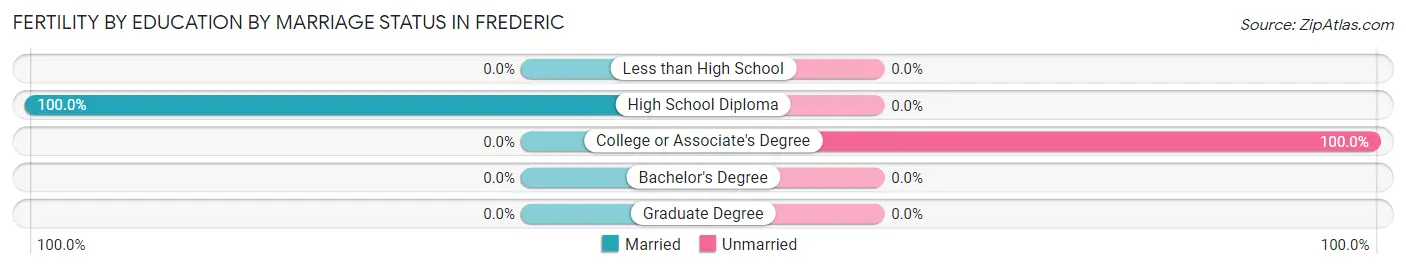
| Educational Attainment | Married | Unmarried |
| Less than High School | 0 (0.0%) | 0 (0.0%) |
| High School Diploma | 3 (100.0%) | 0 (0.0%) |
| College or Associate's Degree | 0 (0.0%) | 5 (100.0%) |
| Bachelor's Degree | 0 (0.0%) | 0 (0.0%) |
| Graduate Degree | 0 (0.0%) | 0 (0.0%) |
| Total | 3 (37.5%) | 5 (62.5%) |
Income in Frederic
Income Overview in Frederic
Per Capita Income in Frederic is $28,755, while median incomes of families and households are $69,886 and $50,250 respectively.
| Characteristic | Number | Measure |
| Per Capita Income | 1,101 | $28,755 |
| Median Family Income | 223 | $69,886 |
| Mean Family Income | 223 | $82,883 |
| Median Household Income | 442 | $50,250 |
| Mean Household Income | 442 | $62,969 |
| Income Deficit | 223 | $0 |
| Wage / Income Gap (%) | 1,101 | 33.24% |
| Wage / Income Gap ($) | 1,101 | 66.76¢ per $1 |
| Gini / Inequality Index | 1,101 | 0.40 |
Earnings by Sex in Frederic
Average Earnings in Frederic are $39,458, $44,000 for men and $29,375 for women, a difference of 33.2%.
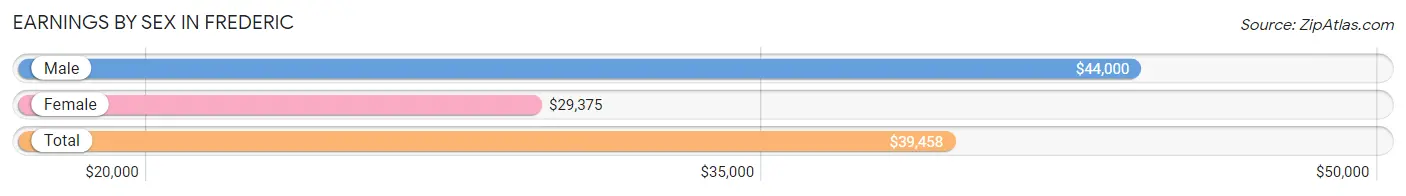
| Sex | Number | Average Earnings |
| Male | 332 (57.5%) | $44,000 |
| Female | 245 (42.5%) | $29,375 |
| Total | 577 (100.0%) | $39,458 |
Earnings by Sex by Income Bracket in Frederic
The most common earnings brackets in Frederic are $45,000 to $49,999 for men (39 | 11.7%) and $55,000 to $64,999 for women (39 | 15.9%).
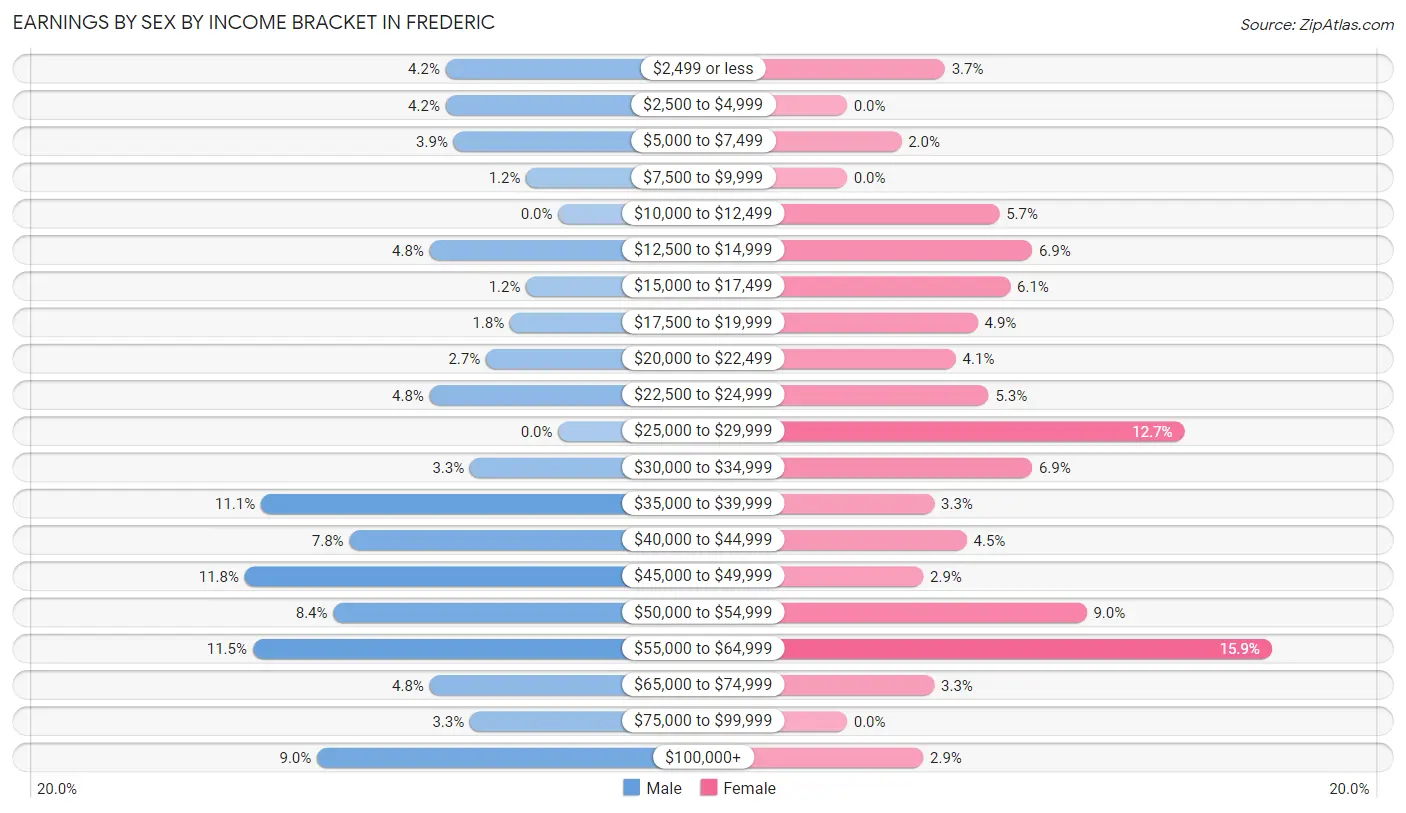
| Income | Male | Female |
| $2,499 or less | 14 (4.2%) | 9 (3.7%) |
| $2,500 to $4,999 | 14 (4.2%) | 0 (0.0%) |
| $5,000 to $7,499 | 13 (3.9%) | 5 (2.0%) |
| $7,500 to $9,999 | 4 (1.2%) | 0 (0.0%) |
| $10,000 to $12,499 | 0 (0.0%) | 14 (5.7%) |
| $12,500 to $14,999 | 16 (4.8%) | 17 (6.9%) |
| $15,000 to $17,499 | 4 (1.2%) | 15 (6.1%) |
| $17,500 to $19,999 | 6 (1.8%) | 12 (4.9%) |
| $20,000 to $22,499 | 9 (2.7%) | 10 (4.1%) |
| $22,500 to $24,999 | 16 (4.8%) | 13 (5.3%) |
| $25,000 to $29,999 | 0 (0.0%) | 31 (12.7%) |
| $30,000 to $34,999 | 11 (3.3%) | 17 (6.9%) |
| $35,000 to $39,999 | 37 (11.1%) | 8 (3.3%) |
| $40,000 to $44,999 | 26 (7.8%) | 11 (4.5%) |
| $45,000 to $49,999 | 39 (11.7%) | 7 (2.9%) |
| $50,000 to $54,999 | 28 (8.4%) | 22 (9.0%) |
| $55,000 to $64,999 | 38 (11.5%) | 39 (15.9%) |
| $65,000 to $74,999 | 16 (4.8%) | 8 (3.3%) |
| $75,000 to $99,999 | 11 (3.3%) | 0 (0.0%) |
| $100,000+ | 30 (9.0%) | 7 (2.9%) |
| Total | 332 (100.0%) | 245 (100.0%) |
Earnings by Sex by Educational Attainment in Frederic
Average earnings in Frederic are $45,764 for men and $33,846 for women, a difference of 26.0%. Men with an educational attainment of college or associate's degree enjoy the highest average annual earnings of $51,094, while those with less than high school education earn the least with $21,667. Women with an educational attainment of bachelor's degree earn the most with the average annual earnings of $53,250, while those with high school diploma education have the smallest earnings of $26,250.
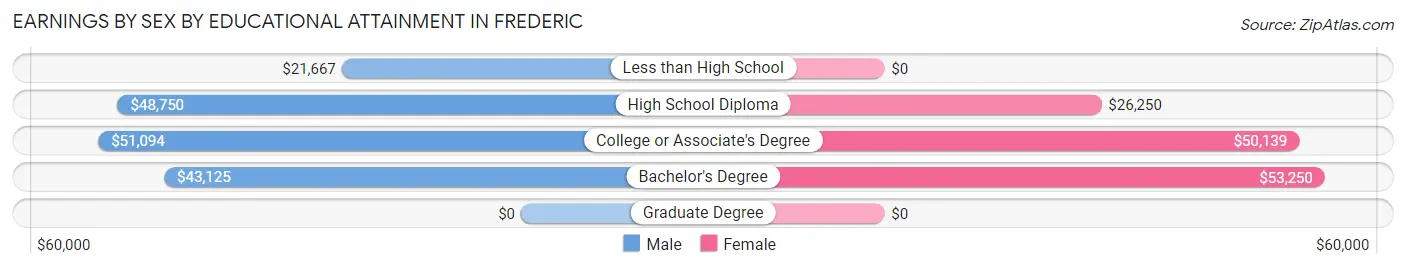
| Educational Attainment | Male Income | Female Income |
| Less than High School | $21,667 | $0 |
| High School Diploma | $48,750 | $26,250 |
| College or Associate's Degree | $51,094 | $50,139 |
| Bachelor's Degree | $43,125 | $53,250 |
| Graduate Degree | - | - |
| Total | $45,764 | $33,846 |
Family Income in Frederic
Family Income Brackets in Frederic
According to the Frederic family income data, there are 61 families falling into the $50,000 to $74,999 income range, which is the most common income bracket and makes up 27.4% of all families.
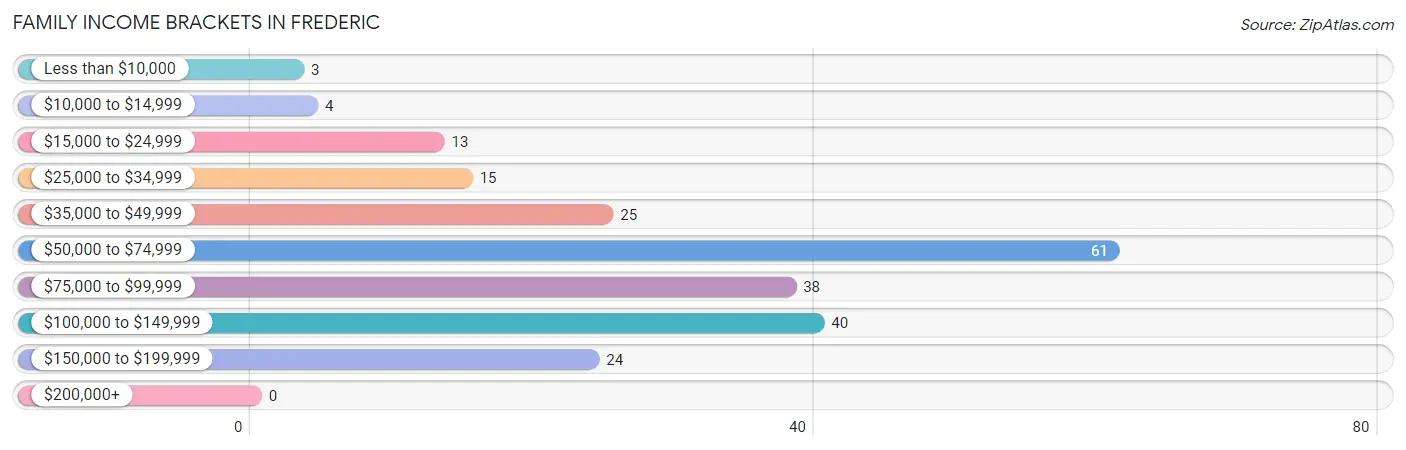
| Income Bracket | # Families | % Families |
| Less than $10,000 | 3 | 1.3% |
| $10,000 to $14,999 | 4 | 1.8% |
| $15,000 to $24,999 | 13 | 5.8% |
| $25,000 to $34,999 | 15 | 6.7% |
| $35,000 to $49,999 | 25 | 11.2% |
| $50,000 to $74,999 | 61 | 27.4% |
| $75,000 to $99,999 | 38 | 17.0% |
| $100,000 to $149,999 | 40 | 17.9% |
| $150,000 to $199,999 | 24 | 10.8% |
| $200,000+ | 0 | 0.0% |
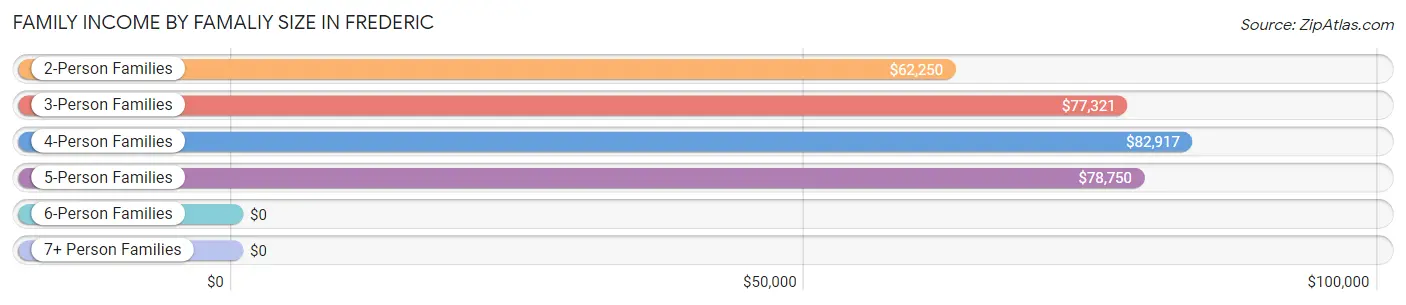
Family Income by Famaliy Size in Frederic
4-person families (37 | 16.6%) account for the highest median family income in Frederic with $82,917 per family, while 2-person families (131 | 58.7%) have the highest median income of $31,125 per family member.
| Income Bracket | # Families | Median Income |
| 2-Person Families | 131 (58.7%) | $62,250 |
| 3-Person Families | 35 (15.7%) | $77,321 |
| 4-Person Families | 37 (16.6%) | $82,917 |
| 5-Person Families | 20 (9.0%) | $78,750 |
| 6-Person Families | 0 (0.0%) | $0 |
| 7+ Person Families | 0 (0.0%) | $0 |
| Total | 223 (100.0%) | $69,886 |
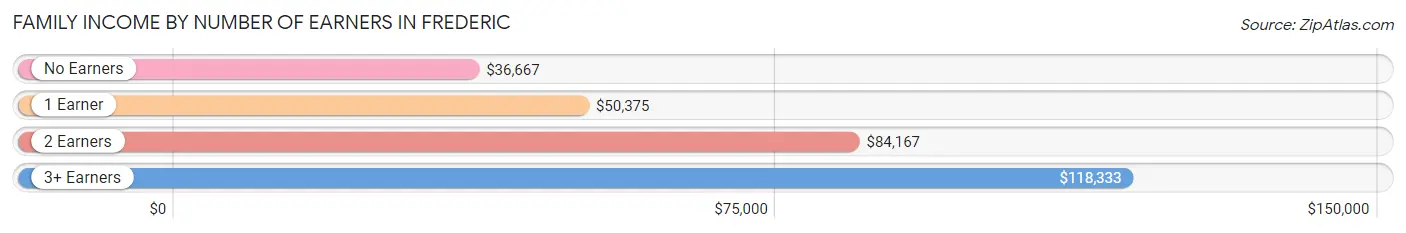
Family Income by Number of Earners in Frederic
The median family income in Frederic is $69,886, with families comprising 3+ earners (12) having the highest median family income of $118,333, while families with no earners (18) have the lowest median family income of $36,667, accounting for 5.4% and 8.1% of families, respectively.
| Number of Earners | # Families | Median Income |
| No Earners | 18 (8.1%) | $36,667 |
| 1 Earner | 65 (29.1%) | $50,375 |
| 2 Earners | 128 (57.4%) | $84,167 |
| 3+ Earners | 12 (5.4%) | $118,333 |
| Total | 223 (100.0%) | $69,886 |
Household Income in Frederic
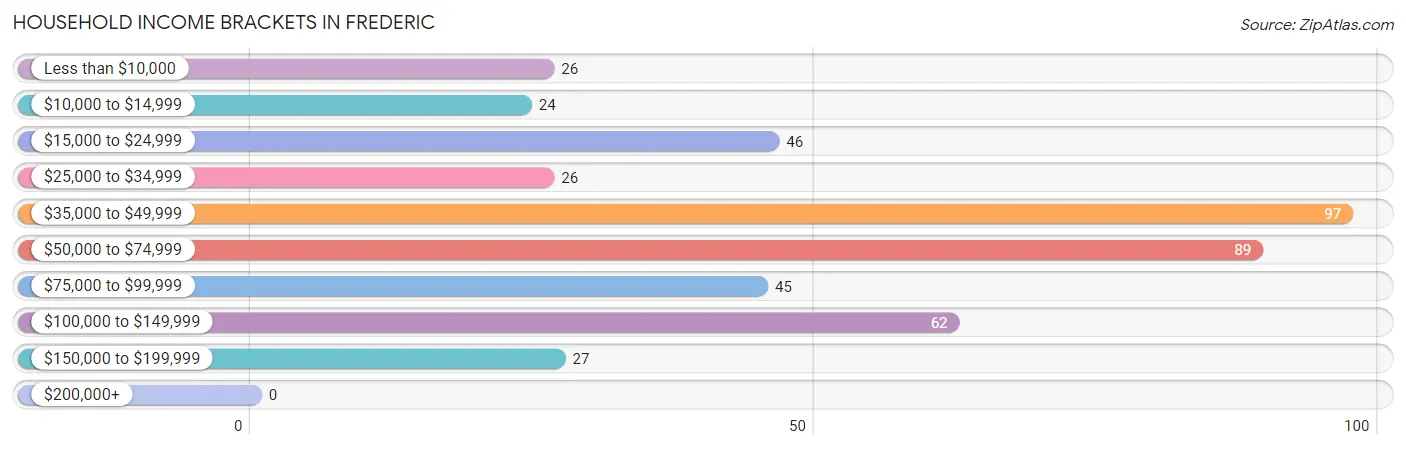
Household Income Brackets in Frederic
With 97 households falling in the category, the $35,000 to $49,999 income range is the most frequent in Frederic, accounting for 22.0% of all households.
| Income Bracket | # Households | % Households |
| Less than $10,000 | 26 | 5.9% |
| $10,000 to $14,999 | 24 | 5.4% |
| $15,000 to $24,999 | 46 | 10.4% |
| $25,000 to $34,999 | 26 | 5.9% |
| $35,000 to $49,999 | 97 | 21.9% |
| $50,000 to $74,999 | 89 | 20.1% |
| $75,000 to $99,999 | 45 | 10.2% |
| $100,000 to $149,999 | 62 | 14.0% |
| $150,000 to $199,999 | 27 | 6.1% |
| $200,000+ | 0 | 0.0% |
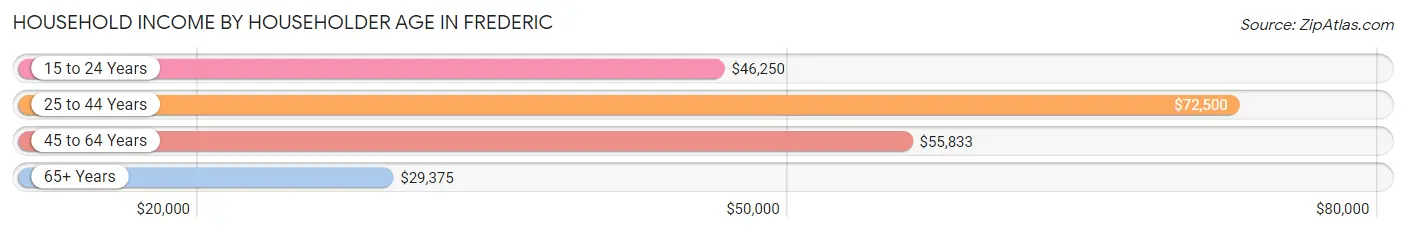
Household Income by Householder Age in Frederic
The median household income in Frederic is $50,250, with the highest median household income of $72,500 found in the 25 to 44 years age bracket for the primary householder. A total of 134 households (30.3%) fall into this category. Meanwhile, the 65+ years age bracket for the primary householder has the lowest median household income of $29,375, with 105 households (23.8%) in this group.
| Income Bracket | # Households | Median Income |
| 15 to 24 Years | 23 (5.2%) | $46,250 |
| 25 to 44 Years | 134 (30.3%) | $72,500 |
| 45 to 64 Years | 180 (40.7%) | $55,833 |
| 65+ Years | 105 (23.8%) | $29,375 |
| Total | 442 (100.0%) | $50,250 |
Poverty in Frederic
Income Below Poverty by Sex and Age in Frederic
With 11.8% poverty level for males and 27.0% for females among the residents of Frederic, 6 to 11 year old males and 5 year old females are the most vulnerable to poverty, with 27 males (38.6%) and 11 females (100.0%) in their respective age groups living below the poverty level.
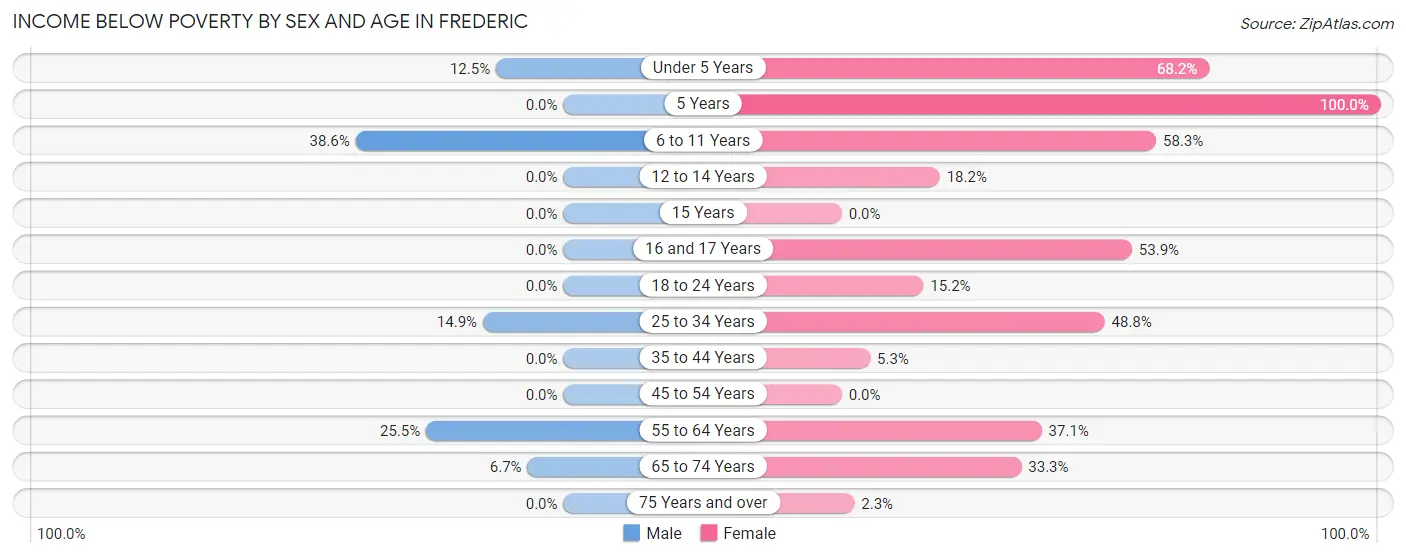
| Age Bracket | Male | Female |
| Under 5 Years | 3 (12.5%) | 15 (68.2%) |
| 5 Years | 0 (0.0%) | 11 (100.0%) |
| 6 to 11 Years | 27 (38.6%) | 21 (58.3%) |
| 12 to 14 Years | 0 (0.0%) | 2 (18.2%) |
| 15 Years | 0 (0.0%) | 0 (0.0%) |
| 16 and 17 Years | 0 (0.0%) | 7 (53.8%) |
| 18 to 24 Years | 0 (0.0%) | 5 (15.1%) |
| 25 to 34 Years | 10 (14.9%) | 20 (48.8%) |
| 35 to 44 Years | 0 (0.0%) | 4 (5.3%) |
| 45 to 54 Years | 0 (0.0%) | 0 (0.0%) |
| 55 to 64 Years | 26 (25.5%) | 23 (37.1%) |
| 65 to 74 Years | 3 (6.7%) | 10 (33.3%) |
| 75 Years and over | 0 (0.0%) | 1 (2.3%) |
| Total | 69 (11.8%) | 119 (27.0%) |
Income Above Poverty by Sex and Age in Frederic
According to the poverty statistics in Frederic, males aged 5 years and females aged 15 years are the age groups that are most secure financially, with 100.0% of males and 100.0% of females in these age groups living above the poverty line.
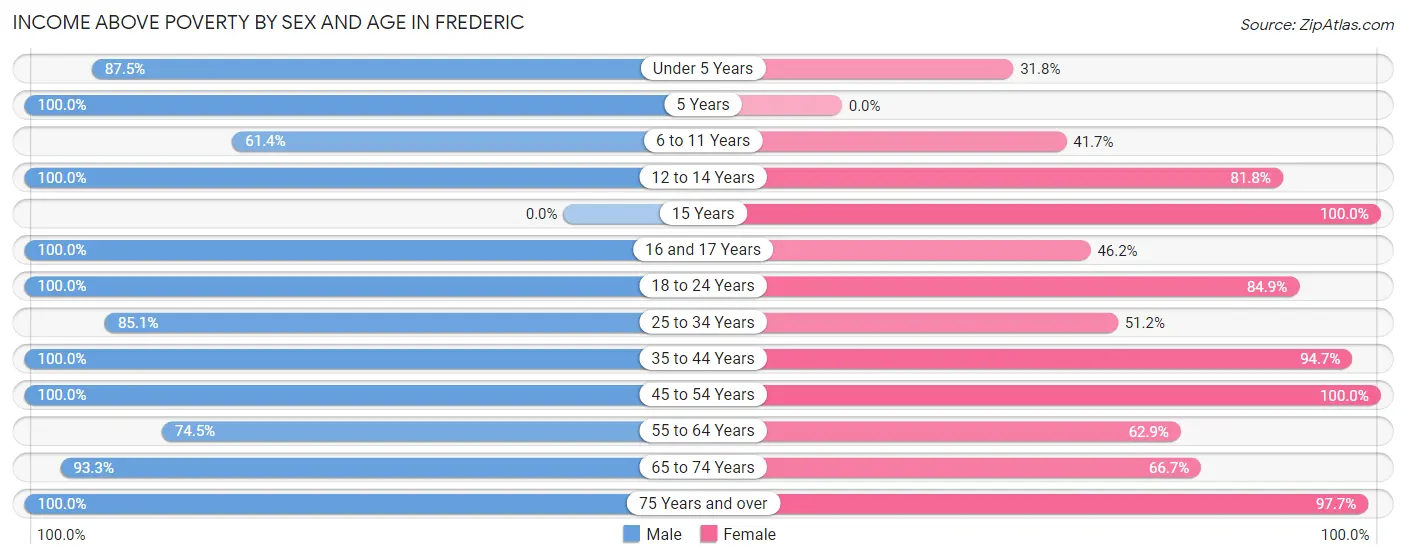
| Age Bracket | Male | Female |
| Under 5 Years | 21 (87.5%) | 7 (31.8%) |
| 5 Years | 3 (100.0%) | 0 (0.0%) |
| 6 to 11 Years | 43 (61.4%) | 15 (41.7%) |
| 12 to 14 Years | 12 (100.0%) | 9 (81.8%) |
| 15 Years | 0 (0.0%) | 2 (100.0%) |
| 16 and 17 Years | 8 (100.0%) | 6 (46.2%) |
| 18 to 24 Years | 58 (100.0%) | 28 (84.9%) |
| 25 to 34 Years | 57 (85.1%) | 21 (51.2%) |
| 35 to 44 Years | 62 (100.0%) | 72 (94.7%) |
| 45 to 54 Years | 60 (100.0%) | 61 (100.0%) |
| 55 to 64 Years | 76 (74.5%) | 39 (62.9%) |
| 65 to 74 Years | 42 (93.3%) | 20 (66.7%) |
| 75 Years and over | 74 (100.0%) | 42 (97.7%) |
| Total | 516 (88.2%) | 322 (73.0%) |
Income Below Poverty Among Married-Couple Families in Frederic
| Children | Above Poverty | Below Poverty |
| No Children | 115 (100.0%) | 0 (0.0%) |
| 1 or 2 Children | 42 (100.0%) | 0 (0.0%) |
| 3 or 4 Children | 11 (100.0%) | 0 (0.0%) |
| 5 or more Children | 0 (0.0%) | 0 (0.0%) |
| Total | 168 (100.0%) | 0 (0.0%) |
Income Below Poverty Among Single-Parent Households in Frederic
According to the poverty data in Frederic, 70.0% or 7 single-father households and 33.3% or 15 single-mother households are living below the poverty line. Among single-father households, those with 3 or 4 children have the highest poverty rate, with 7 households (100.0%) experiencing poverty. Likewise, among single-mother households, those with 3 or 4 children have the highest poverty rate, with 8 households (72.7%) falling below the poverty line.
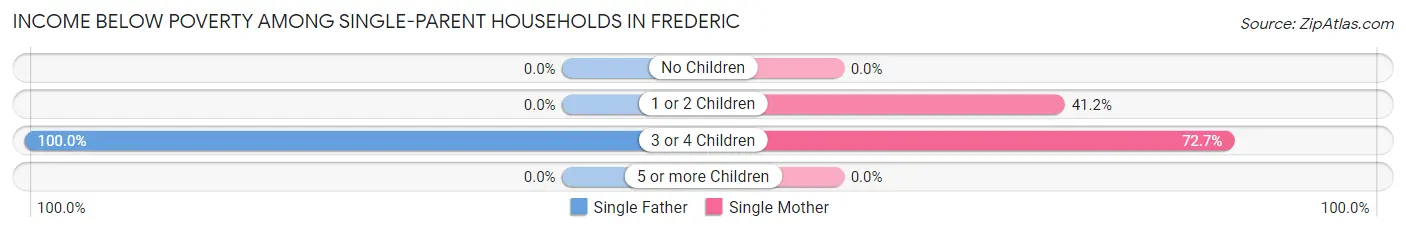
| Children | Single Father | Single Mother |
| No Children | 0 (0.0%) | 0 (0.0%) |
| 1 or 2 Children | 0 (0.0%) | 7 (41.2%) |
| 3 or 4 Children | 7 (100.0%) | 8 (72.7%) |
| 5 or more Children | 0 (0.0%) | 0 (0.0%) |
| Total | 7 (70.0%) | 15 (33.3%) |
Income Below Poverty Among Married-Couple vs Single-Parent Households in Frederic
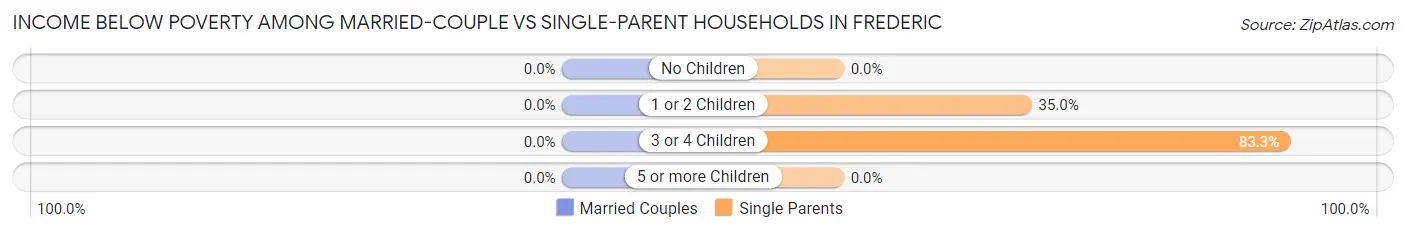
| Children | Married-Couple Families | Single-Parent Households |
| No Children | 0 (0.0%) | 0 (0.0%) |
| 1 or 2 Children | 0 (0.0%) | 7 (35.0%) |
| 3 or 4 Children | 0 (0.0%) | 15 (83.3%) |
| 5 or more Children | 0 (0.0%) | 0 (0.0%) |
| Total | 0 (0.0%) | 22 (40.0%) |
Employment Characteristics in Frederic
Employment by Class of Employer in Frederic
Among the 505 employed individuals in Frederic, private company employees (308 | 61.0%), not-for-profit organizations (58 | 11.5%), and local government employees (56 | 11.1%) make up the most common classes of employment.
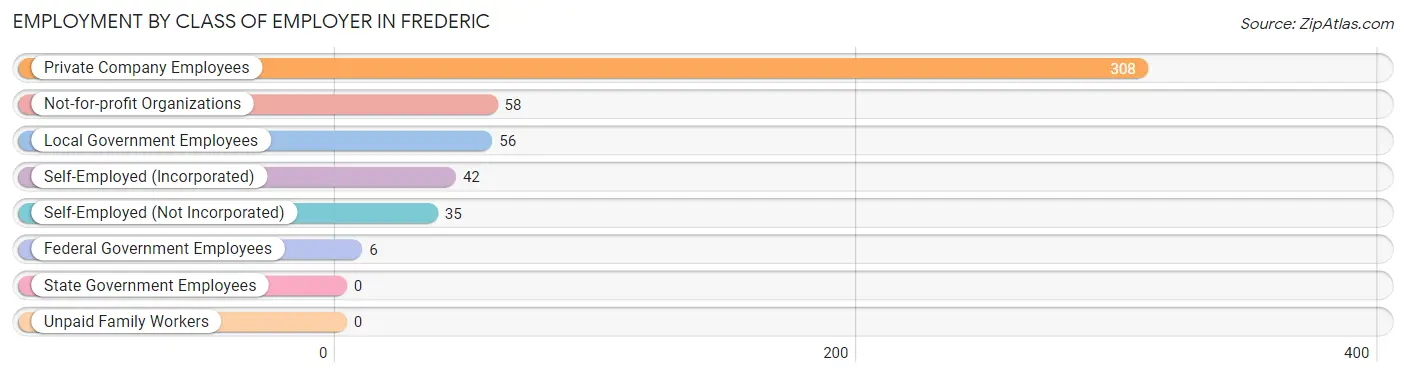
| Employer Class | # Employees | % Employees |
| Private Company Employees | 308 | 61.0% |
| Self-Employed (Incorporated) | 42 | 8.3% |
| Self-Employed (Not Incorporated) | 35 | 6.9% |
| Not-for-profit Organizations | 58 | 11.5% |
| Local Government Employees | 56 | 11.1% |
| State Government Employees | 0 | 0.0% |
| Federal Government Employees | 6 | 1.2% |
| Unpaid Family Workers | 0 | 0.0% |
| Total | 505 | 100.0% |
Employment Status by Age in Frederic
According to the labor force statistics for Frederic, out of the total population over 16 years of age (899), 61.4% or 552 individuals are in the labor force, with 3.8% or 21 of them unemployed. The age group with the highest labor force participation rate is 20 to 24 years, with 100.0% or 70 individuals in the labor force. Within the labor force, the 30 to 34 years age range has the highest percentage of unemployed individuals, with 29.8% or 14 of them being unemployed.
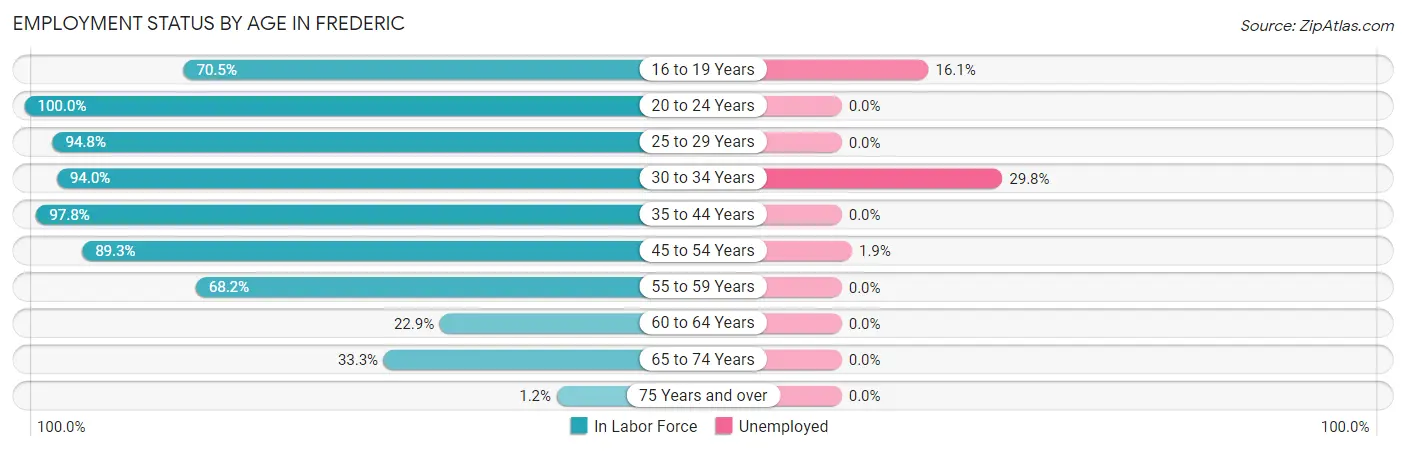
| Age Bracket | In Labor Force | Unemployed |
| 16 to 19 Years | 31 (70.5%) | 5 (16.1%) |
| 20 to 24 Years | 70 (100.0%) | 0 (0.0%) |
| 25 to 29 Years | 55 (94.8%) | 0 (0.0%) |
| 30 to 34 Years | 47 (94.0%) | 14 (29.8%) |
| 35 to 44 Years | 135 (97.8%) | 0 (0.0%) |
| 45 to 54 Years | 108 (89.3%) | 2 (1.9%) |
| 55 to 59 Years | 60 (68.2%) | 0 (0.0%) |
| 60 to 64 Years | 19 (22.9%) | 0 (0.0%) |
| 65 to 74 Years | 25 (33.3%) | 0 (0.0%) |
| 75 Years and over | 2 (1.2%) | 0 (0.0%) |
| Total | 552 (61.4%) | 21 (3.8%) |
Employment Status by Educational Attainment in Frederic
According to labor force statistics for Frederic, 78.8% of individuals (424) out of the total population between 25 and 64 years of age (538) are in the labor force, with 3.8% or 16 of them being unemployed. The group with the highest labor force participation rate are those with the educational attainment of high school diploma, with 87.4% or 187 individuals in the labor force. Within the labor force, individuals with high school diploma education have the highest percentage of unemployment, with 7.5% or 14 of them being unemployed.
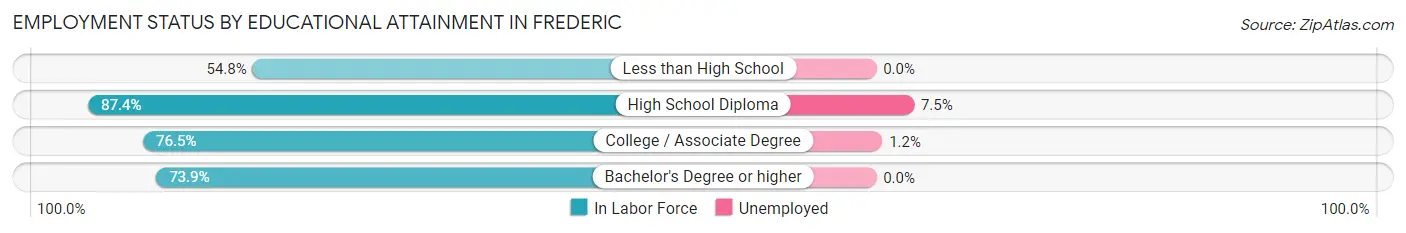
| Educational Attainment | In Labor Force | Unemployed |
| Less than High School | 23 (54.8%) | 0 (0.0%) |
| High School Diploma | 187 (87.4%) | 16 (7.5%) |
| College / Associate Degree | 163 (76.5%) | 3 (1.2%) |
| Bachelor's Degree or higher | 51 (73.9%) | 0 (0.0%) |
| Total | 424 (78.8%) | 20 (3.8%) |
Employment Occupations by Sex in Frederic
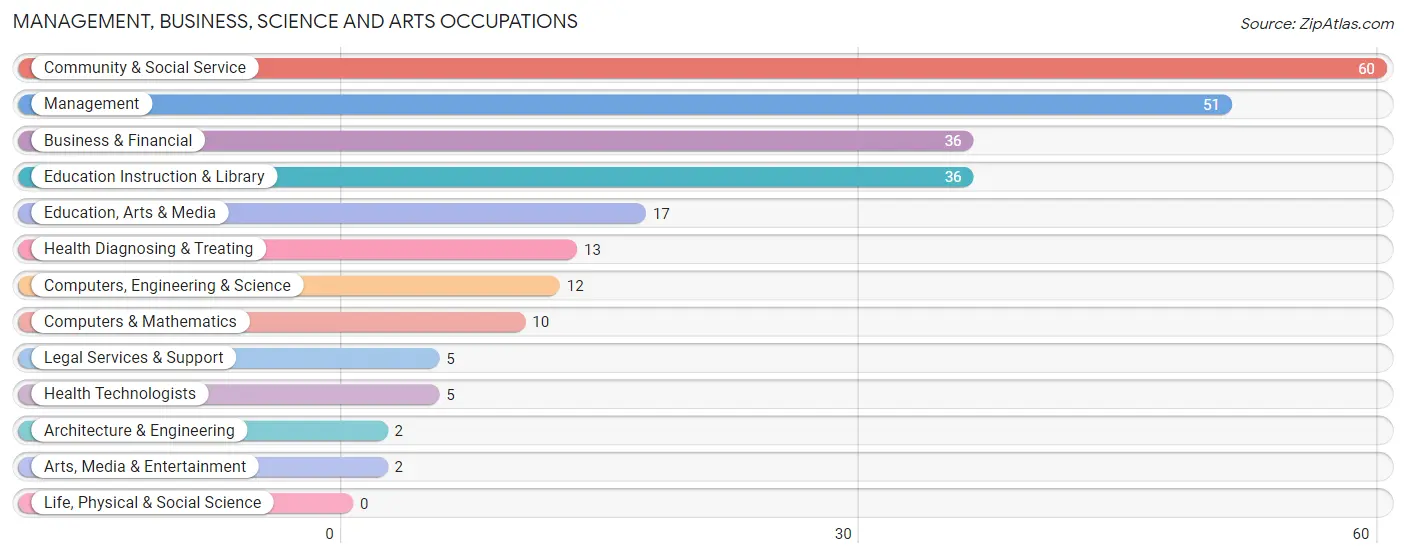
Management, Business, Science and Arts Occupations
The most common Management, Business, Science and Arts occupations in Frederic are Community & Social Service (60 | 11.3%), Management (51 | 9.6%), Business & Financial (36 | 6.8%), Education Instruction & Library (36 | 6.8%), and Education, Arts & Media (17 | 3.2%).
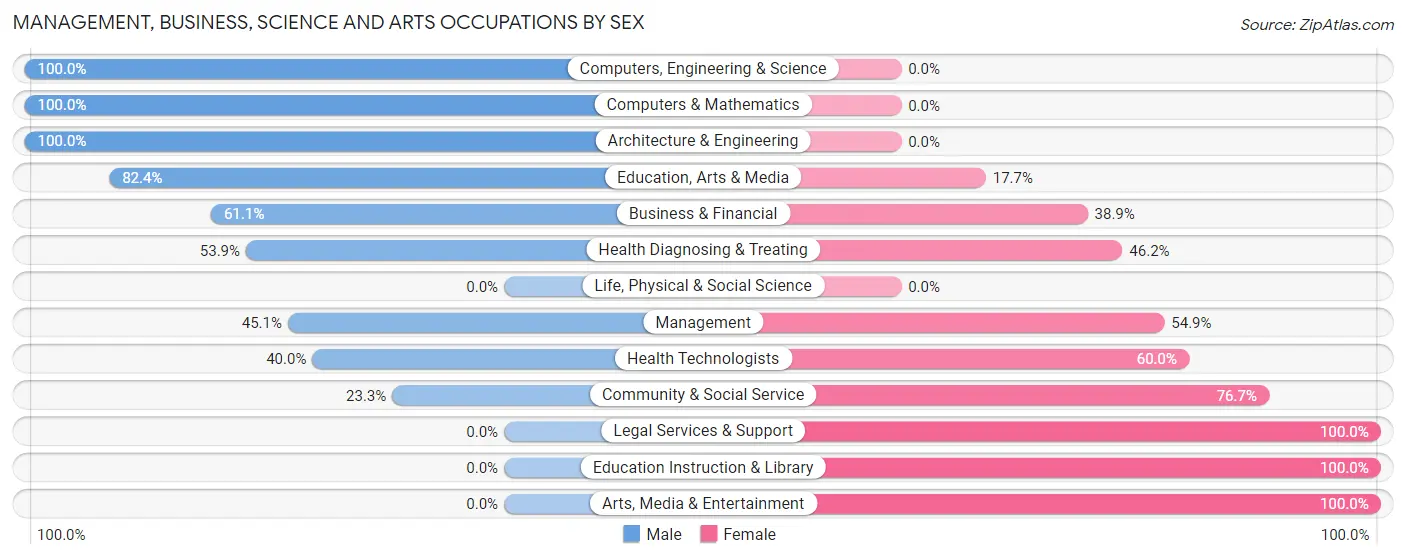
Management, Business, Science and Arts Occupations by Sex
Within the Management, Business, Science and Arts occupations in Frederic, the most male-oriented occupations are Computers, Engineering & Science (100.0%), Computers & Mathematics (100.0%), and Architecture & Engineering (100.0%), while the most female-oriented occupations are Legal Services & Support (100.0%), Education Instruction & Library (100.0%), and Arts, Media & Entertainment (100.0%).
| Occupation | Male | Female |
| Management | 23 (45.1%) | 28 (54.9%) |
| Business & Financial | 22 (61.1%) | 14 (38.9%) |
| Computers, Engineering & Science | 12 (100.0%) | 0 (0.0%) |
| Computers & Mathematics | 10 (100.0%) | 0 (0.0%) |
| Architecture & Engineering | 2 (100.0%) | 0 (0.0%) |
| Life, Physical & Social Science | 0 (0.0%) | 0 (0.0%) |
| Community & Social Service | 14 (23.3%) | 46 (76.7%) |
| Education, Arts & Media | 14 (82.4%) | 3 (17.6%) |
| Legal Services & Support | 0 (0.0%) | 5 (100.0%) |
| Education Instruction & Library | 0 (0.0%) | 36 (100.0%) |
| Arts, Media & Entertainment | 0 (0.0%) | 2 (100.0%) |
| Health Diagnosing & Treating | 7 (53.8%) | 6 (46.2%) |
| Health Technologists | 2 (40.0%) | 3 (60.0%) |
| Total (Category) | 78 (45.4%) | 94 (54.6%) |
| Total (Overall) | 313 (59.0%) | 218 (41.0%) |
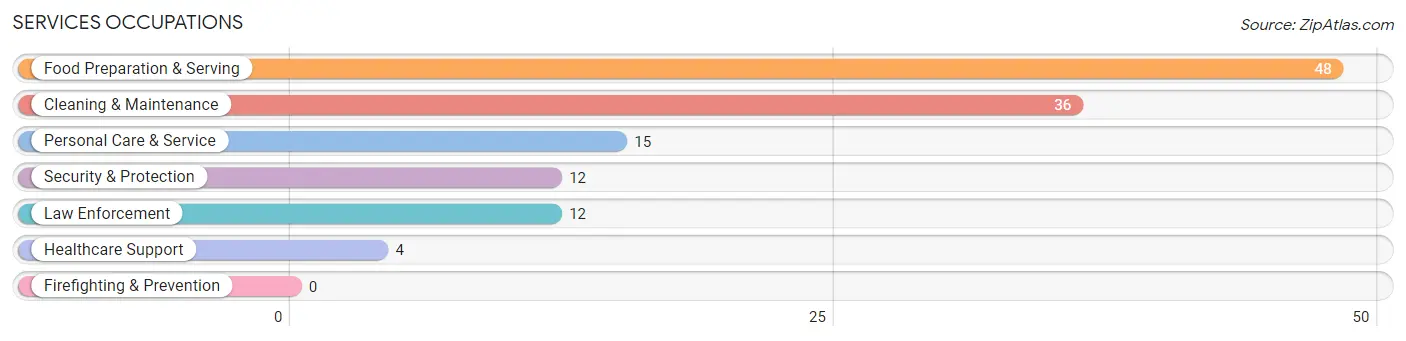
Services Occupations
The most common Services occupations in Frederic are Food Preparation & Serving (48 | 9.0%), Cleaning & Maintenance (36 | 6.8%), Personal Care & Service (15 | 2.8%), Security & Protection (12 | 2.3%), and Law Enforcement (12 | 2.3%).
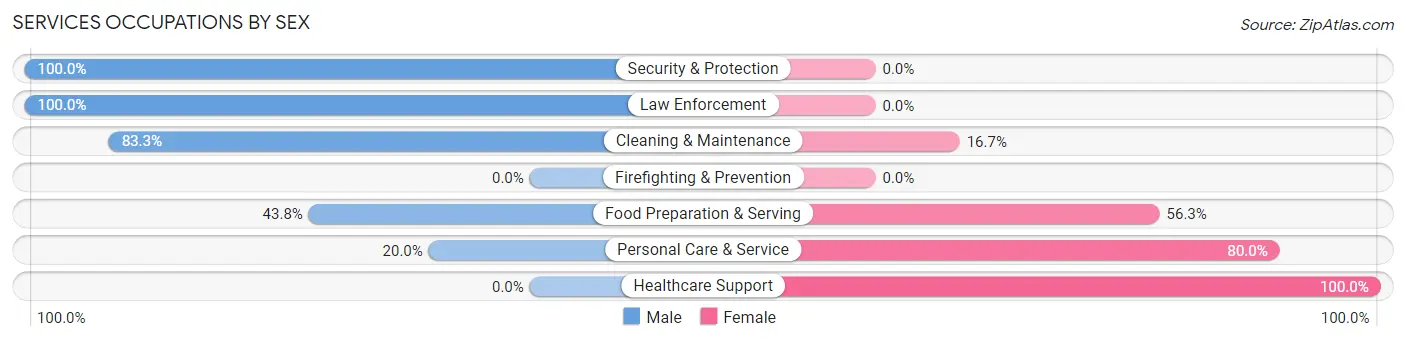
Services Occupations by Sex
Within the Services occupations in Frederic, the most male-oriented occupations are Security & Protection (100.0%), Law Enforcement (100.0%), and Cleaning & Maintenance (83.3%), while the most female-oriented occupations are Healthcare Support (100.0%), Personal Care & Service (80.0%), and Food Preparation & Serving (56.2%).
| Occupation | Male | Female |
| Healthcare Support | 0 (0.0%) | 4 (100.0%) |
| Security & Protection | 12 (100.0%) | 0 (0.0%) |
| Firefighting & Prevention | 0 (0.0%) | 0 (0.0%) |
| Law Enforcement | 12 (100.0%) | 0 (0.0%) |
| Food Preparation & Serving | 21 (43.8%) | 27 (56.2%) |
| Cleaning & Maintenance | 30 (83.3%) | 6 (16.7%) |
| Personal Care & Service | 3 (20.0%) | 12 (80.0%) |
| Total (Category) | 66 (57.4%) | 49 (42.6%) |
| Total (Overall) | 313 (59.0%) | 218 (41.0%) |
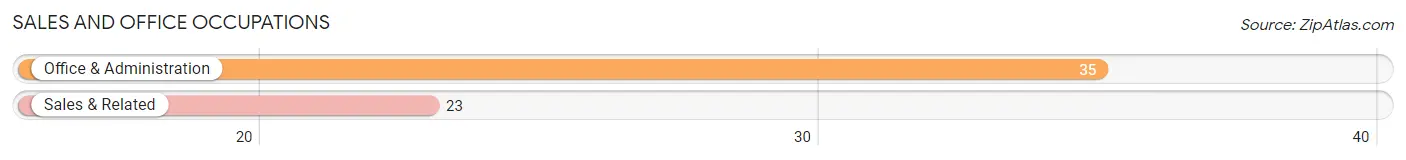
Sales and Office Occupations
The most common Sales and Office occupations in Frederic are Office & Administration (35 | 6.6%), and Sales & Related (23 | 4.3%).
Sales and Office Occupations by Sex
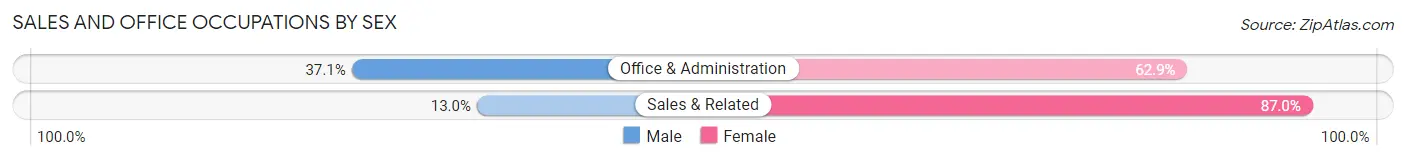
| Occupation | Male | Female |
| Sales & Related | 3 (13.0%) | 20 (87.0%) |
| Office & Administration | 13 (37.1%) | 22 (62.9%) |
| Total (Category) | 16 (27.6%) | 42 (72.4%) |
| Total (Overall) | 313 (59.0%) | 218 (41.0%) |
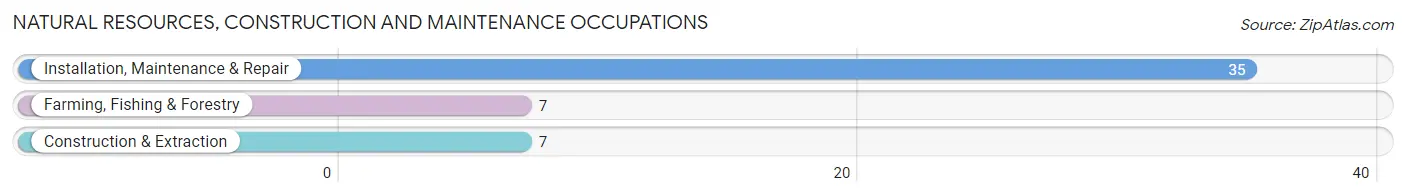
Natural Resources, Construction and Maintenance Occupations
The most common Natural Resources, Construction and Maintenance occupations in Frederic are Installation, Maintenance & Repair (35 | 6.6%), Farming, Fishing & Forestry (7 | 1.3%), and Construction & Extraction (7 | 1.3%).
Natural Resources, Construction and Maintenance Occupations by Sex
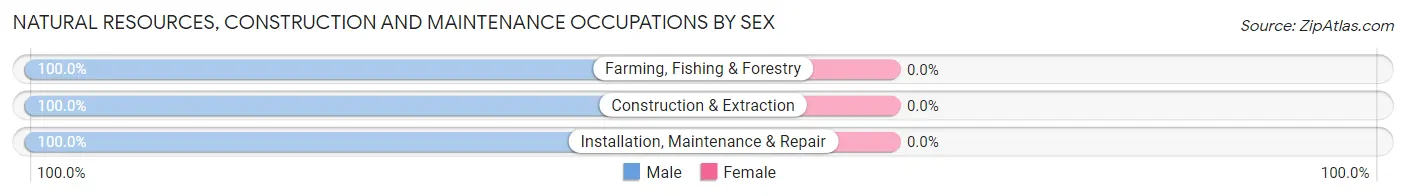
| Occupation | Male | Female |
| Farming, Fishing & Forestry | 7 (100.0%) | 0 (0.0%) |
| Construction & Extraction | 7 (100.0%) | 0 (0.0%) |
| Installation, Maintenance & Repair | 35 (100.0%) | 0 (0.0%) |
| Total (Category) | 49 (100.0%) | 0 (0.0%) |
| Total (Overall) | 313 (59.0%) | 218 (41.0%) |
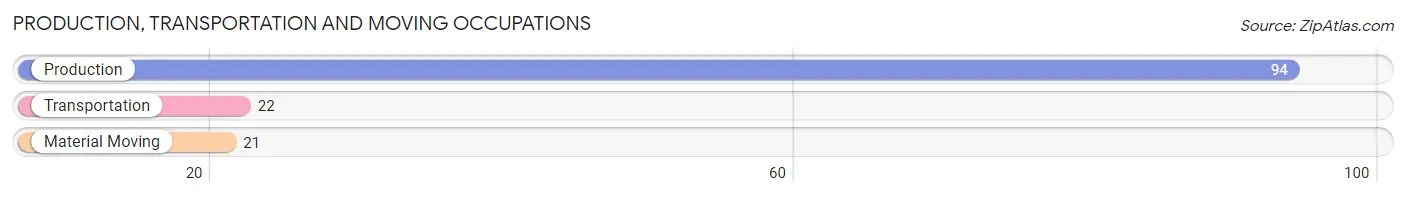
Production, Transportation and Moving Occupations
The most common Production, Transportation and Moving occupations in Frederic are Production (94 | 17.7%), Transportation (22 | 4.1%), and Material Moving (21 | 4.0%).
Production, Transportation and Moving Occupations by Sex
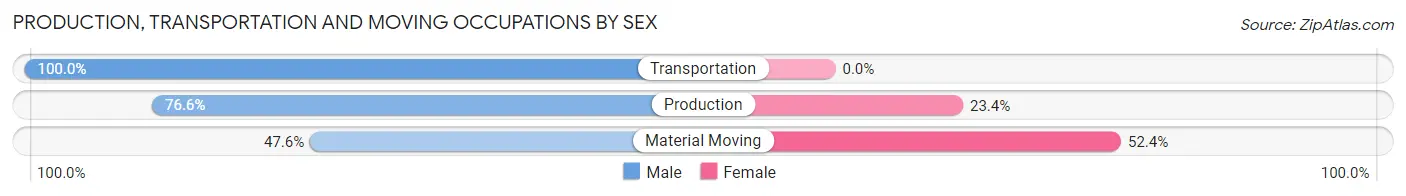
| Occupation | Male | Female |
| Production | 72 (76.6%) | 22 (23.4%) |
| Transportation | 22 (100.0%) | 0 (0.0%) |
| Material Moving | 10 (47.6%) | 11 (52.4%) |
| Total (Category) | 104 (75.9%) | 33 (24.1%) |
| Total (Overall) | 313 (59.0%) | 218 (41.0%) |
Employment Industries by Sex in Frederic
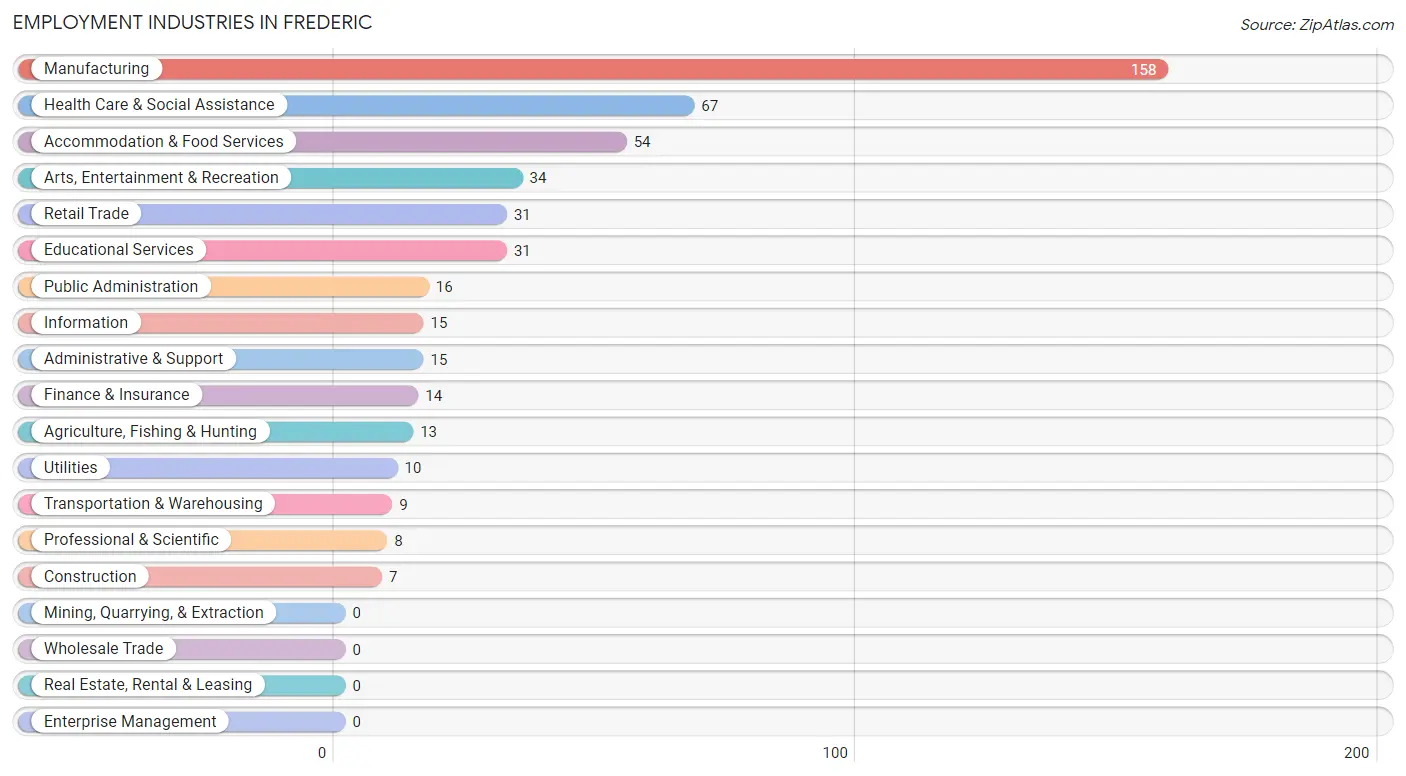
Employment Industries in Frederic
The major employment industries in Frederic include Manufacturing (158 | 29.8%), Health Care & Social Assistance (67 | 12.6%), Accommodation & Food Services (54 | 10.2%), Arts, Entertainment & Recreation (34 | 6.4%), and Retail Trade (31 | 5.8%).
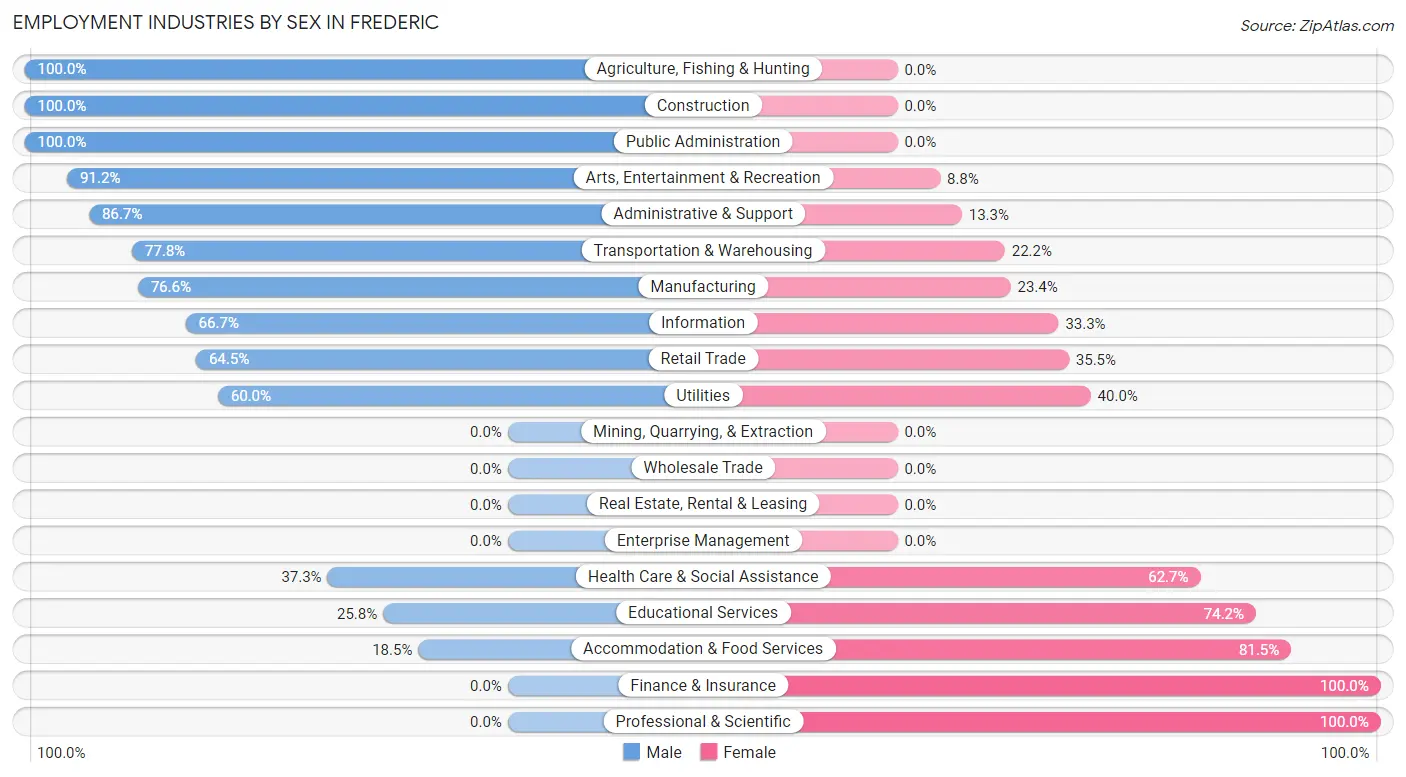
Employment Industries by Sex in Frederic
The Frederic industries that see more men than women are Agriculture, Fishing & Hunting (100.0%), Construction (100.0%), and Public Administration (100.0%), whereas the industries that tend to have a higher number of women are Finance & Insurance (100.0%), Professional & Scientific (100.0%), and Accommodation & Food Services (81.5%).
| Industry | Male | Female |
| Agriculture, Fishing & Hunting | 13 (100.0%) | 0 (0.0%) |
| Mining, Quarrying, & Extraction | 0 (0.0%) | 0 (0.0%) |
| Construction | 7 (100.0%) | 0 (0.0%) |
| Manufacturing | 121 (76.6%) | 37 (23.4%) |
| Wholesale Trade | 0 (0.0%) | 0 (0.0%) |
| Retail Trade | 20 (64.5%) | 11 (35.5%) |
| Transportation & Warehousing | 7 (77.8%) | 2 (22.2%) |
| Utilities | 6 (60.0%) | 4 (40.0%) |
| Information | 10 (66.7%) | 5 (33.3%) |
| Finance & Insurance | 0 (0.0%) | 14 (100.0%) |
| Real Estate, Rental & Leasing | 0 (0.0%) | 0 (0.0%) |
| Professional & Scientific | 0 (0.0%) | 8 (100.0%) |
| Enterprise Management | 0 (0.0%) | 0 (0.0%) |
| Administrative & Support | 13 (86.7%) | 2 (13.3%) |
| Educational Services | 8 (25.8%) | 23 (74.2%) |
| Health Care & Social Assistance | 25 (37.3%) | 42 (62.7%) |
| Arts, Entertainment & Recreation | 31 (91.2%) | 3 (8.8%) |
| Accommodation & Food Services | 10 (18.5%) | 44 (81.5%) |
| Public Administration | 16 (100.0%) | 0 (0.0%) |
| Total | 313 (59.0%) | 218 (41.0%) |
Education in Frederic
School Enrollment in Frederic
The most common levels of schooling among the 211 students in Frederic are elementary school (74 | 35.1%), high school (39 | 18.5%), and middle school (30 | 14.2%).
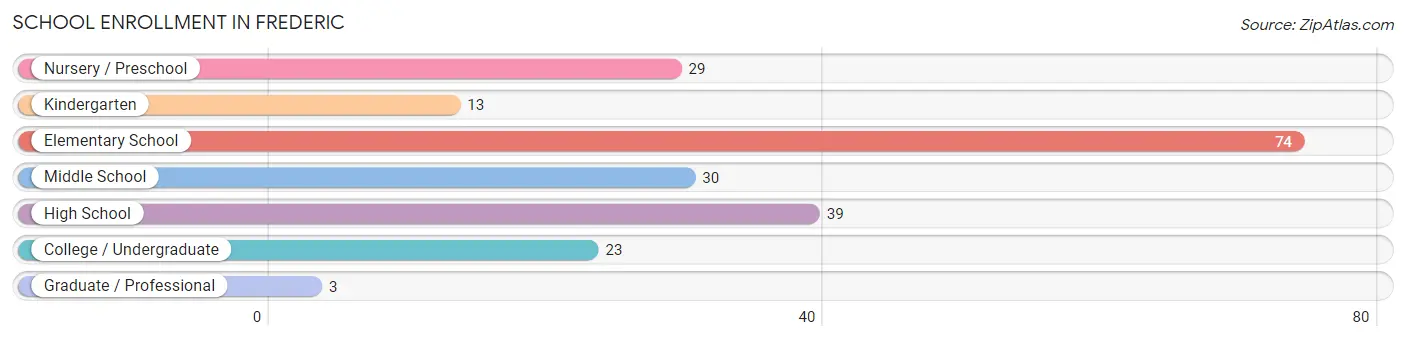
| School Level | # Students | % Students |
| Nursery / Preschool | 29 | 13.7% |
| Kindergarten | 13 | 6.2% |
| Elementary School | 74 | 35.1% |
| Middle School | 30 | 14.2% |
| High School | 39 | 18.5% |
| College / Undergraduate | 23 | 10.9% |
| Graduate / Professional | 3 | 1.4% |
| Total | 211 | 100.0% |
School Enrollment by Age by Funding Source in Frederic
Out of a total of 211 students who are enrolled in schools in Frederic, 8 (3.8%) attend a private institution, while the remaining 203 (96.2%) are enrolled in public schools. The age group of 15 to 17 year olds has the highest likelihood of being enrolled in private schools, with 5 (20.8% in the age bracket) enrolled. Conversely, the age group of 3 to 4 year olds has the lowest likelihood of being enrolled in a private school, with 18 (100.0% in the age bracket) attending a public institution.
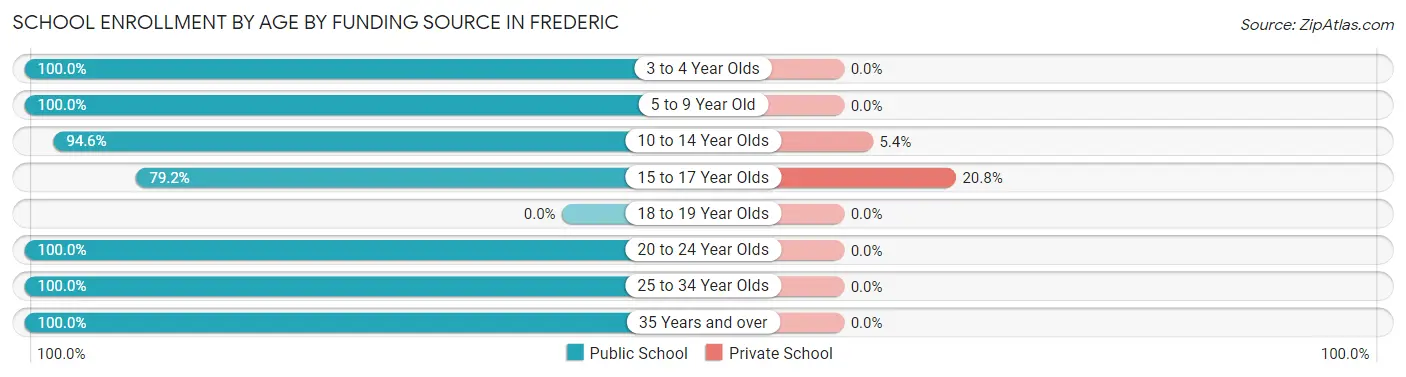
| Age Bracket | Public School | Private School |
| 3 to 4 Year Olds | 18 (100.0%) | 0 (0.0%) |
| 5 to 9 Year Old | 80 (100.0%) | 0 (0.0%) |
| 10 to 14 Year Olds | 53 (94.6%) | 3 (5.4%) |
| 15 to 17 Year Olds | 19 (79.2%) | 5 (20.8%) |
| 18 to 19 Year Olds | 0 (0.0%) | 0 (0.0%) |
| 20 to 24 Year Olds | 4 (100.0%) | 0 (0.0%) |
| 25 to 34 Year Olds | 7 (100.0%) | 0 (0.0%) |
| 35 Years and over | 22 (100.0%) | 0 (0.0%) |
| Total | 203 (96.2%) | 8 (3.8%) |
Educational Attainment by Field of Study in Frederic
Education (19 | 18.4%), business (18 | 17.5%), liberal arts & history (12 | 11.7%), visual & performing arts (9 | 8.7%), and arts & humanities (9 | 8.7%) are the most common fields of study among 103 individuals in Frederic who have obtained a bachelor's degree or higher.
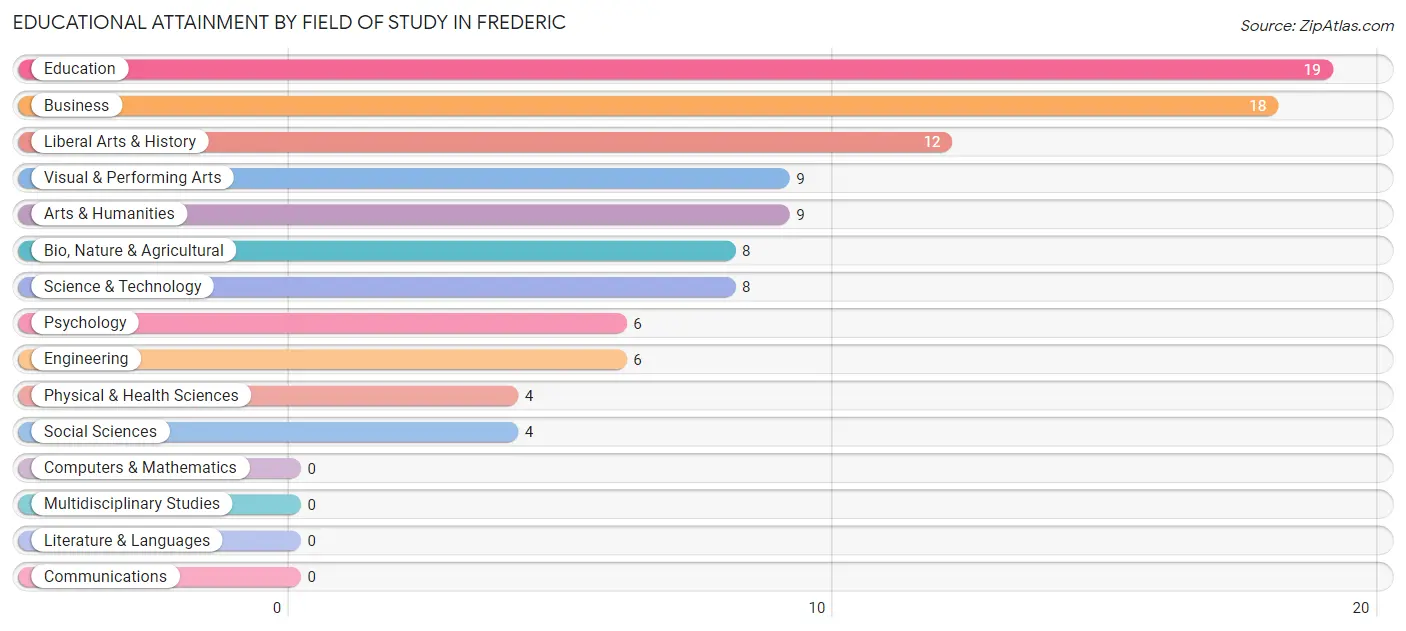
| Field of Study | # Graduates | % Graduates |
| Computers & Mathematics | 0 | 0.0% |
| Bio, Nature & Agricultural | 8 | 7.8% |
| Physical & Health Sciences | 4 | 3.9% |
| Psychology | 6 | 5.8% |
| Social Sciences | 4 | 3.9% |
| Engineering | 6 | 5.8% |
| Multidisciplinary Studies | 0 | 0.0% |
| Science & Technology | 8 | 7.8% |
| Business | 18 | 17.5% |
| Education | 19 | 18.4% |
| Literature & Languages | 0 | 0.0% |
| Liberal Arts & History | 12 | 11.7% |
| Visual & Performing Arts | 9 | 8.7% |
| Communications | 0 | 0.0% |
| Arts & Humanities | 9 | 8.7% |
| Total | 103 | 100.0% |
Transportation & Commute in Frederic
Vehicle Availability by Sex in Frederic
The most prevalent vehicle ownership categories in Frederic are males with 3 vehicles (91, accounting for 30.5%) and females with 3 vehicles (67, making up 44.8%).
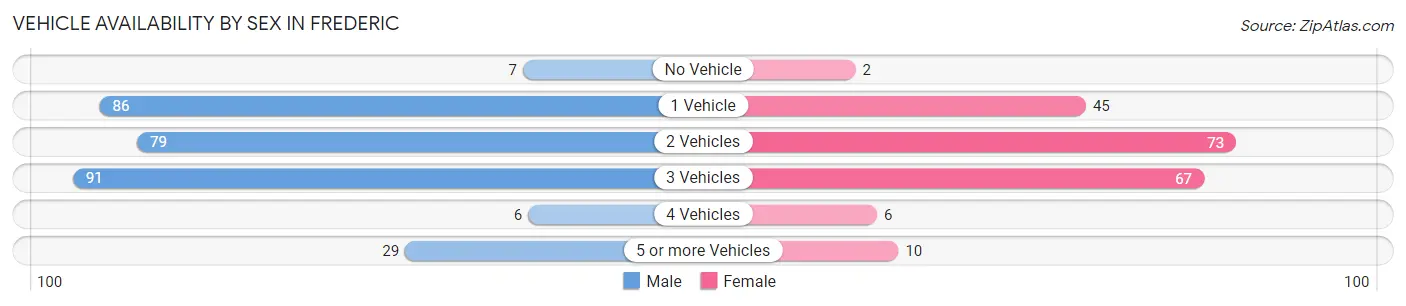
| Vehicles Available | Male | Female |
| No Vehicle | 7 (2.4%) | 2 (1.0%) |
| 1 Vehicle | 86 (28.9%) | 45 (22.2%) |
| 2 Vehicles | 79 (26.5%) | 73 (36.0%) |
| 3 Vehicles | 91 (30.5%) | 67 (33.0%) |
| 4 Vehicles | 6 (2.0%) | 6 (3.0%) |
| 5 or more Vehicles | 29 (9.7%) | 10 (4.9%) |
| Total | 298 (100.0%) | 203 (100.0%) |
Commute Time in Frederic
The most frequently occuring commute durations in Frederic are 5 to 9 minutes (75 commuters, 15.0%), 15 to 19 minutes (75 commuters, 15.0%), and 10 to 14 minutes (70 commuters, 14.0%).
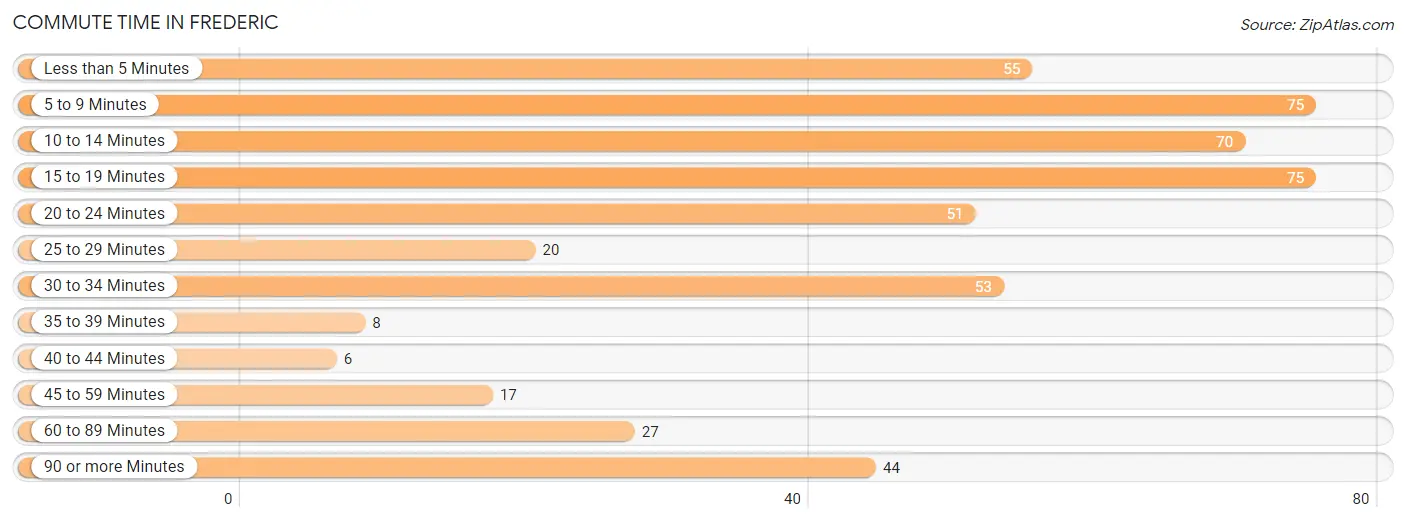
| Commute Time | # Commuters | % Commuters |
| Less than 5 Minutes | 55 | 11.0% |
| 5 to 9 Minutes | 75 | 15.0% |
| 10 to 14 Minutes | 70 | 14.0% |
| 15 to 19 Minutes | 75 | 15.0% |
| 20 to 24 Minutes | 51 | 10.2% |
| 25 to 29 Minutes | 20 | 4.0% |
| 30 to 34 Minutes | 53 | 10.6% |
| 35 to 39 Minutes | 8 | 1.6% |
| 40 to 44 Minutes | 6 | 1.2% |
| 45 to 59 Minutes | 17 | 3.4% |
| 60 to 89 Minutes | 27 | 5.4% |
| 90 or more Minutes | 44 | 8.8% |
Commute Time by Sex in Frederic
The most common commute times in Frederic are 5 to 9 minutes (43 commuters, 14.3%) for males and 15 to 19 minutes (39 commuters, 19.4%) for females.
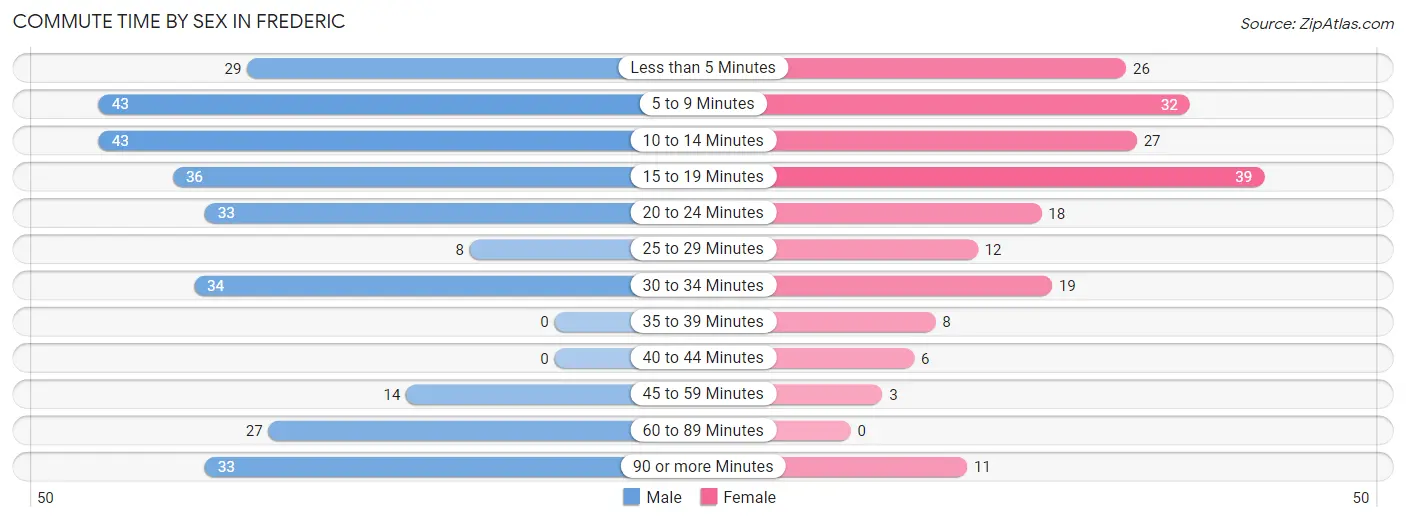
| Commute Time | Male | Female |
| Less than 5 Minutes | 29 (9.7%) | 26 (12.9%) |
| 5 to 9 Minutes | 43 (14.3%) | 32 (15.9%) |
| 10 to 14 Minutes | 43 (14.3%) | 27 (13.4%) |
| 15 to 19 Minutes | 36 (12.0%) | 39 (19.4%) |
| 20 to 24 Minutes | 33 (11.0%) | 18 (9.0%) |
| 25 to 29 Minutes | 8 (2.7%) | 12 (6.0%) |
| 30 to 34 Minutes | 34 (11.3%) | 19 (9.5%) |
| 35 to 39 Minutes | 0 (0.0%) | 8 (4.0%) |
| 40 to 44 Minutes | 0 (0.0%) | 6 (3.0%) |
| 45 to 59 Minutes | 14 (4.7%) | 3 (1.5%) |
| 60 to 89 Minutes | 27 (9.0%) | 0 (0.0%) |
| 90 or more Minutes | 33 (11.0%) | 11 (5.5%) |
Time of Departure to Work by Sex in Frederic
The most frequent times of departure to work in Frederic are 5:00 AM to 5:29 AM (69, 23.0%) for males and 7:30 AM to 7:59 AM (40, 19.9%) for females.
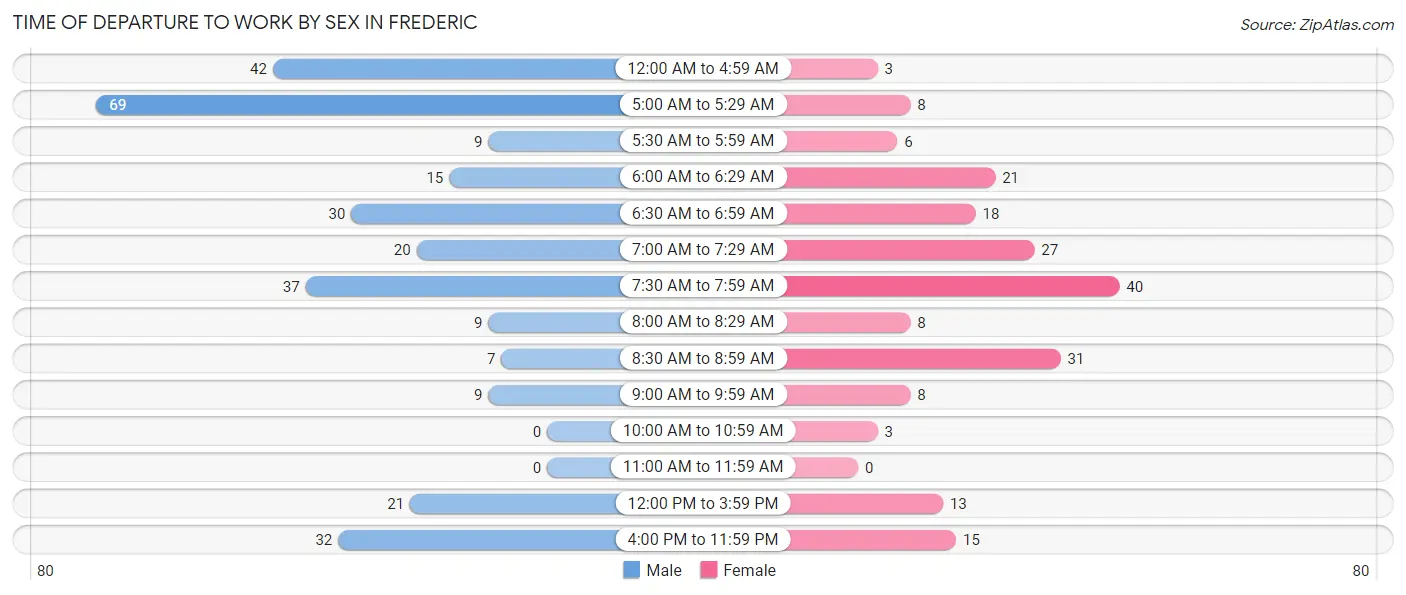
| Time of Departure | Male | Female |
| 12:00 AM to 4:59 AM | 42 (14.0%) | 3 (1.5%) |
| 5:00 AM to 5:29 AM | 69 (23.0%) | 8 (4.0%) |
| 5:30 AM to 5:59 AM | 9 (3.0%) | 6 (3.0%) |
| 6:00 AM to 6:29 AM | 15 (5.0%) | 21 (10.4%) |
| 6:30 AM to 6:59 AM | 30 (10.0%) | 18 (9.0%) |
| 7:00 AM to 7:29 AM | 20 (6.7%) | 27 (13.4%) |
| 7:30 AM to 7:59 AM | 37 (12.3%) | 40 (19.9%) |
| 8:00 AM to 8:29 AM | 9 (3.0%) | 8 (4.0%) |
| 8:30 AM to 8:59 AM | 7 (2.3%) | 31 (15.4%) |
| 9:00 AM to 9:59 AM | 9 (3.0%) | 8 (4.0%) |
| 10:00 AM to 10:59 AM | 0 (0.0%) | 3 (1.5%) |
| 11:00 AM to 11:59 AM | 0 (0.0%) | 0 (0.0%) |
| 12:00 PM to 3:59 PM | 21 (7.0%) | 13 (6.5%) |
| 4:00 PM to 11:59 PM | 32 (10.7%) | 15 (7.5%) |
| Total | 300 (100.0%) | 201 (100.0%) |
Housing Occupancy in Frederic
Occupancy by Ownership in Frederic
Of the total 442 dwellings in Frederic, owner-occupied units account for 273 (61.8%), while renter-occupied units make up 169 (38.2%).
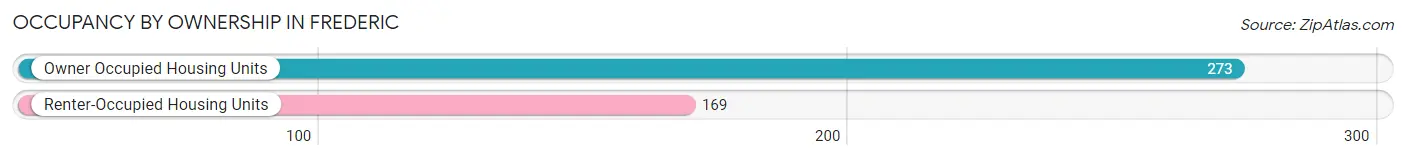
| Occupancy | # Housing Units | % Housing Units |
| Owner Occupied Housing Units | 273 | 61.8% |
| Renter-Occupied Housing Units | 169 | 38.2% |
| Total Occupied Housing Units | 442 | 100.0% |
Occupancy by Household Size in Frederic
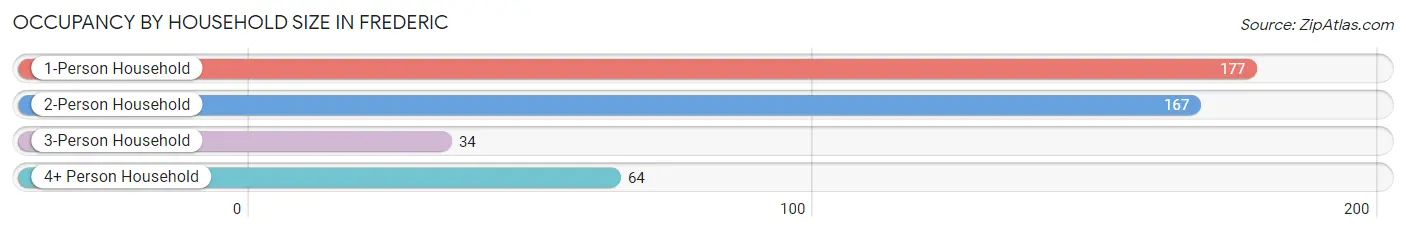
| Household Size | # Housing Units | % Housing Units |
| 1-Person Household | 177 | 40.1% |
| 2-Person Household | 167 | 37.8% |
| 3-Person Household | 34 | 7.7% |
| 4+ Person Household | 64 | 14.5% |
| Total Housing Units | 442 | 100.0% |
Occupancy by Ownership by Household Size in Frederic
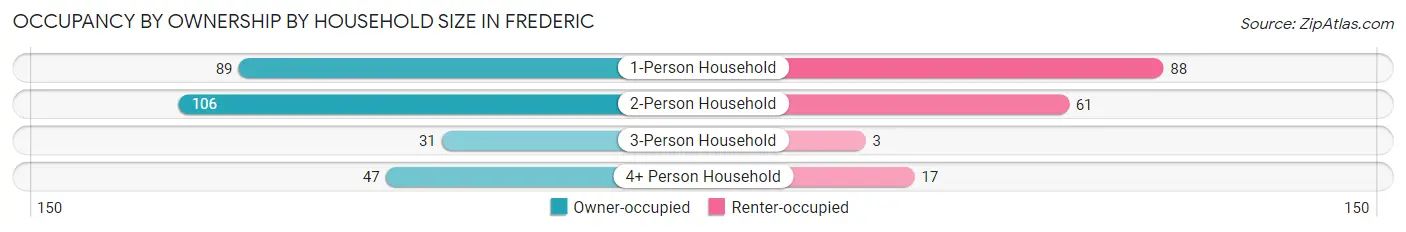
| Household Size | Owner-occupied | Renter-occupied |
| 1-Person Household | 89 (50.3%) | 88 (49.7%) |
| 2-Person Household | 106 (63.5%) | 61 (36.5%) |
| 3-Person Household | 31 (91.2%) | 3 (8.8%) |
| 4+ Person Household | 47 (73.4%) | 17 (26.6%) |
| Total Housing Units | 273 (61.8%) | 169 (38.2%) |
Occupancy by Educational Attainment in Frederic
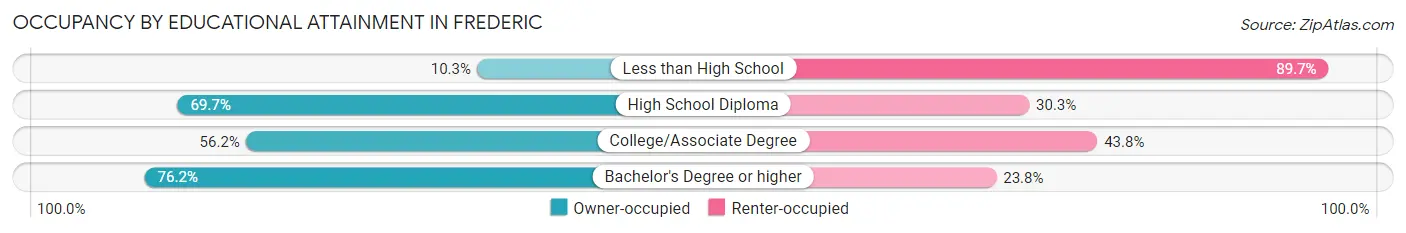
| Household Size | Owner-occupied | Renter-occupied |
| Less than High School | 3 (10.3%) | 26 (89.7%) |
| High School Diploma | 131 (69.7%) | 57 (30.3%) |
| College/Associate Degree | 91 (56.2%) | 71 (43.8%) |
| Bachelor's Degree or higher | 48 (76.2%) | 15 (23.8%) |
Occupancy by Age of Householder in Frederic
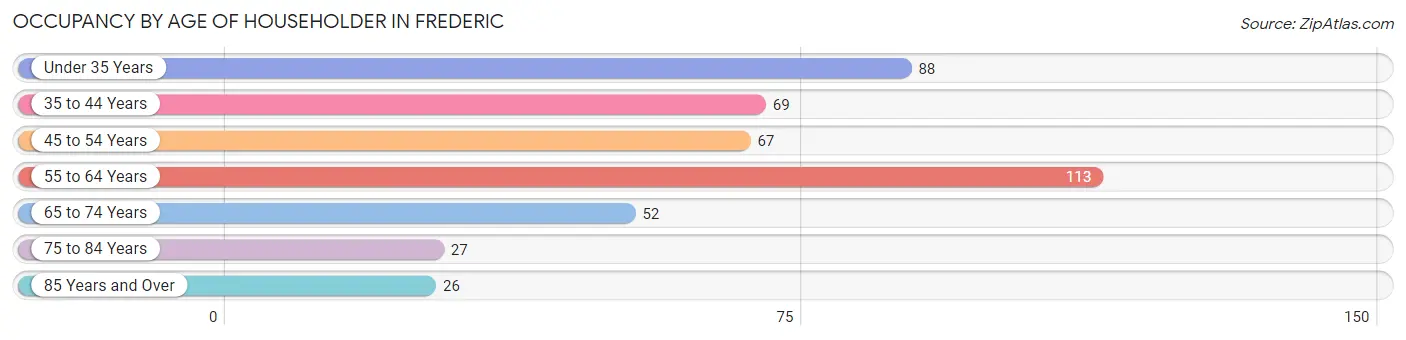
| Age Bracket | # Households | % Households |
| Under 35 Years | 88 | 19.9% |
| 35 to 44 Years | 69 | 15.6% |
| 45 to 54 Years | 67 | 15.2% |
| 55 to 64 Years | 113 | 25.6% |
| 65 to 74 Years | 52 | 11.8% |
| 75 to 84 Years | 27 | 6.1% |
| 85 Years and Over | 26 | 5.9% |
| Total | 442 | 100.0% |
Housing Finances in Frederic
Median Income by Occupancy in Frederic
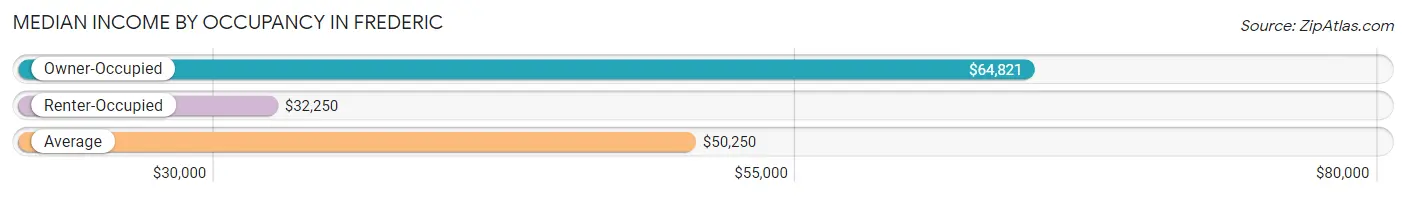
| Occupancy Type | # Households | Median Income |
| Owner-Occupied | 273 (61.8%) | $64,821 |
| Renter-Occupied | 169 (38.2%) | $32,250 |
| Average | 442 (100.0%) | $50,250 |
Occupancy by Householder Income Bracket in Frederic
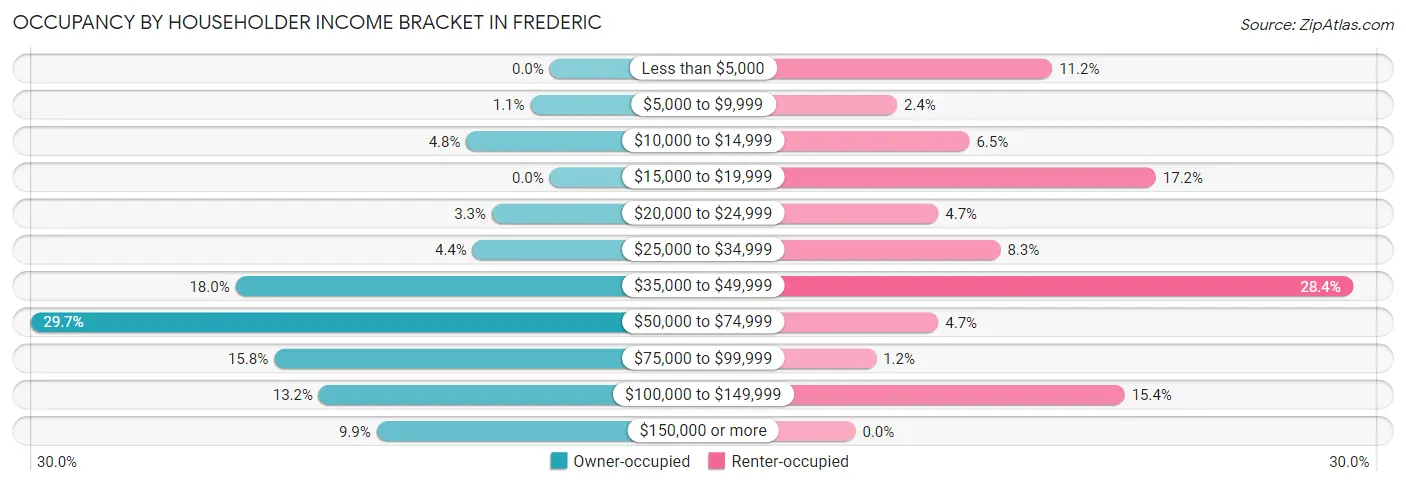
| Income Bracket | Owner-occupied | Renter-occupied |
| Less than $5,000 | 0 (0.0%) | 19 (11.2%) |
| $5,000 to $9,999 | 3 (1.1%) | 4 (2.4%) |
| $10,000 to $14,999 | 13 (4.8%) | 11 (6.5%) |
| $15,000 to $19,999 | 0 (0.0%) | 29 (17.2%) |
| $20,000 to $24,999 | 9 (3.3%) | 8 (4.7%) |
| $25,000 to $34,999 | 12 (4.4%) | 14 (8.3%) |
| $35,000 to $49,999 | 49 (17.9%) | 48 (28.4%) |
| $50,000 to $74,999 | 81 (29.7%) | 8 (4.7%) |
| $75,000 to $99,999 | 43 (15.8%) | 2 (1.2%) |
| $100,000 to $149,999 | 36 (13.2%) | 26 (15.4%) |
| $150,000 or more | 27 (9.9%) | 0 (0.0%) |
| Total | 273 (100.0%) | 169 (100.0%) |
Monthly Housing Cost Tiers in Frederic
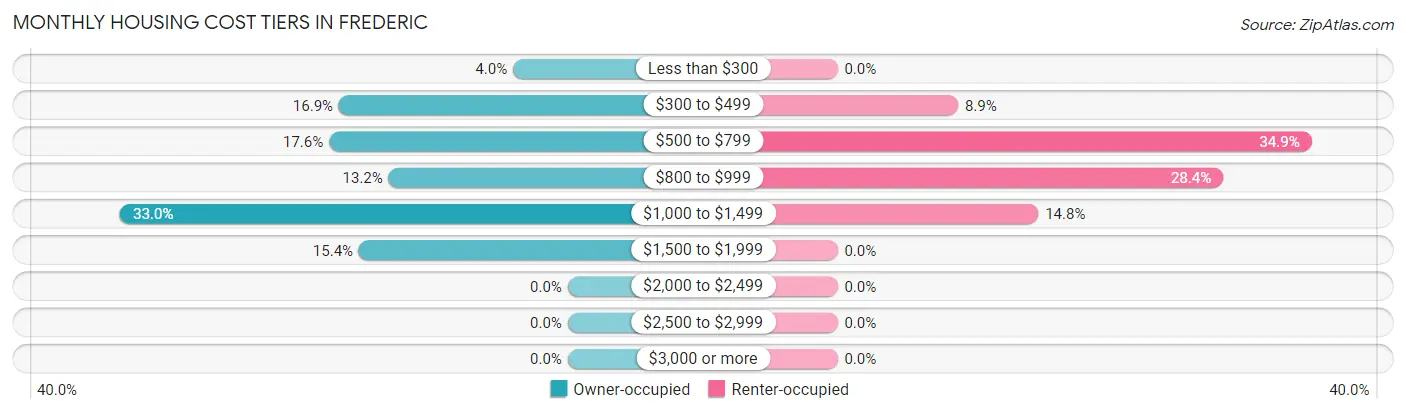
| Monthly Cost | Owner-occupied | Renter-occupied |
| Less than $300 | 11 (4.0%) | 0 (0.0%) |
| $300 to $499 | 46 (16.9%) | 15 (8.9%) |
| $500 to $799 | 48 (17.6%) | 59 (34.9%) |
| $800 to $999 | 36 (13.2%) | 48 (28.4%) |
| $1,000 to $1,499 | 90 (33.0%) | 25 (14.8%) |
| $1,500 to $1,999 | 42 (15.4%) | 0 (0.0%) |
| $2,000 to $2,499 | 0 (0.0%) | 0 (0.0%) |
| $2,500 to $2,999 | 0 (0.0%) | 0 (0.0%) |
| $3,000 or more | 0 (0.0%) | 0 (0.0%) |
| Total | 273 (100.0%) | 169 (100.0%) |
Physical Housing Characteristics in Frederic
Housing Structures in Frederic
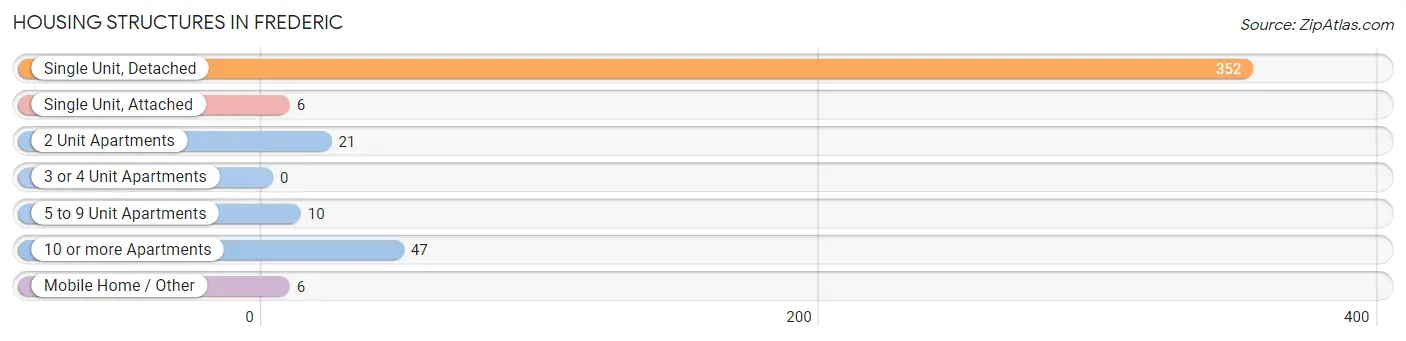
| Structure Type | # Housing Units | % Housing Units |
| Single Unit, Detached | 352 | 79.6% |
| Single Unit, Attached | 6 | 1.4% |
| 2 Unit Apartments | 21 | 4.8% |
| 3 or 4 Unit Apartments | 0 | 0.0% |
| 5 to 9 Unit Apartments | 10 | 2.3% |
| 10 or more Apartments | 47 | 10.6% |
| Mobile Home / Other | 6 | 1.4% |
| Total | 442 | 100.0% |
Housing Structures by Occupancy in Frederic
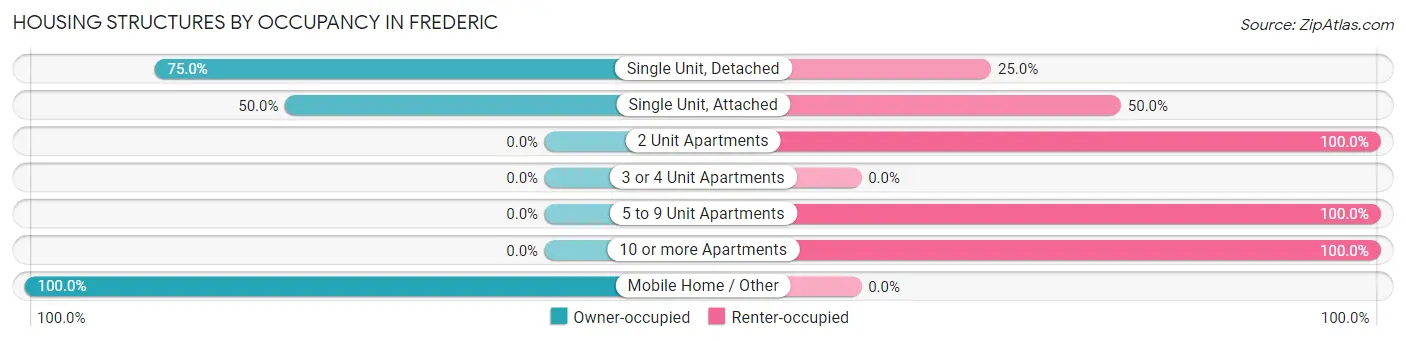
| Structure Type | Owner-occupied | Renter-occupied |
| Single Unit, Detached | 264 (75.0%) | 88 (25.0%) |
| Single Unit, Attached | 3 (50.0%) | 3 (50.0%) |
| 2 Unit Apartments | 0 (0.0%) | 21 (100.0%) |
| 3 or 4 Unit Apartments | 0 (0.0%) | 0 (0.0%) |
| 5 to 9 Unit Apartments | 0 (0.0%) | 10 (100.0%) |
| 10 or more Apartments | 0 (0.0%) | 47 (100.0%) |
| Mobile Home / Other | 6 (100.0%) | 0 (0.0%) |
| Total | 273 (61.8%) | 169 (38.2%) |
Housing Structures by Number of Rooms in Frederic
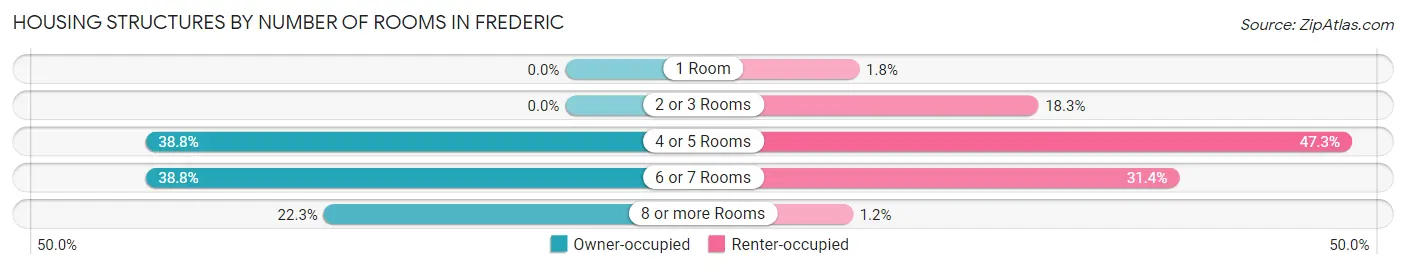
| Number of Rooms | Owner-occupied | Renter-occupied |
| 1 Room | 0 (0.0%) | 3 (1.8%) |
| 2 or 3 Rooms | 0 (0.0%) | 31 (18.3%) |
| 4 or 5 Rooms | 106 (38.8%) | 80 (47.3%) |
| 6 or 7 Rooms | 106 (38.8%) | 53 (31.4%) |
| 8 or more Rooms | 61 (22.3%) | 2 (1.2%) |
| Total | 273 (100.0%) | 169 (100.0%) |
Housing Structure by Heating Type in Frederic
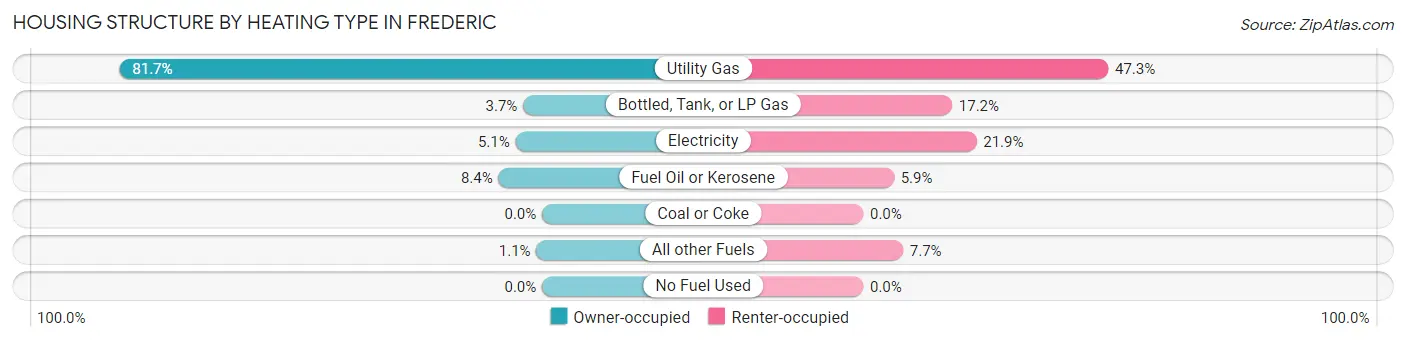
| Heating Type | Owner-occupied | Renter-occupied |
| Utility Gas | 223 (81.7%) | 80 (47.3%) |
| Bottled, Tank, or LP Gas | 10 (3.7%) | 29 (17.2%) |
| Electricity | 14 (5.1%) | 37 (21.9%) |
| Fuel Oil or Kerosene | 23 (8.4%) | 10 (5.9%) |
| Coal or Coke | 0 (0.0%) | 0 (0.0%) |
| All other Fuels | 3 (1.1%) | 13 (7.7%) |
| No Fuel Used | 0 (0.0%) | 0 (0.0%) |
| Total | 273 (100.0%) | 169 (100.0%) |
Household Vehicle Usage in Frederic
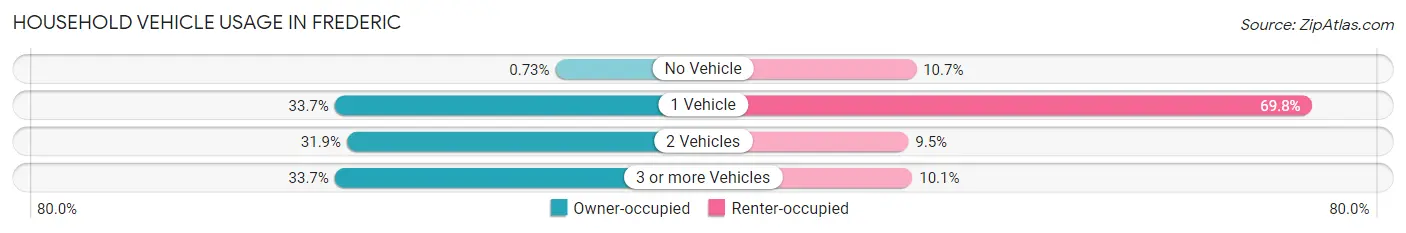
| Vehicles per Household | Owner-occupied | Renter-occupied |
| No Vehicle | 2 (0.7%) | 18 (10.6%) |
| 1 Vehicle | 92 (33.7%) | 118 (69.8%) |
| 2 Vehicles | 87 (31.9%) | 16 (9.5%) |
| 3 or more Vehicles | 92 (33.7%) | 17 (10.1%) |
| Total | 273 (100.0%) | 169 (100.0%) |
Real Estate & Mortgages in Frederic
Real Estate and Mortgage Overview in Frederic
| Characteristic | Without Mortgage | With Mortgage |
| Housing Units | 51 | 222 |
| Median Property Value | $112,500 | $124,200 |
| Median Household Income | $49,205 | $25 |
| Monthly Housing Costs | $397 | $0 |
| Real Estate Taxes | $1,375 | $0 |
Property Value by Mortgage Status in Frederic
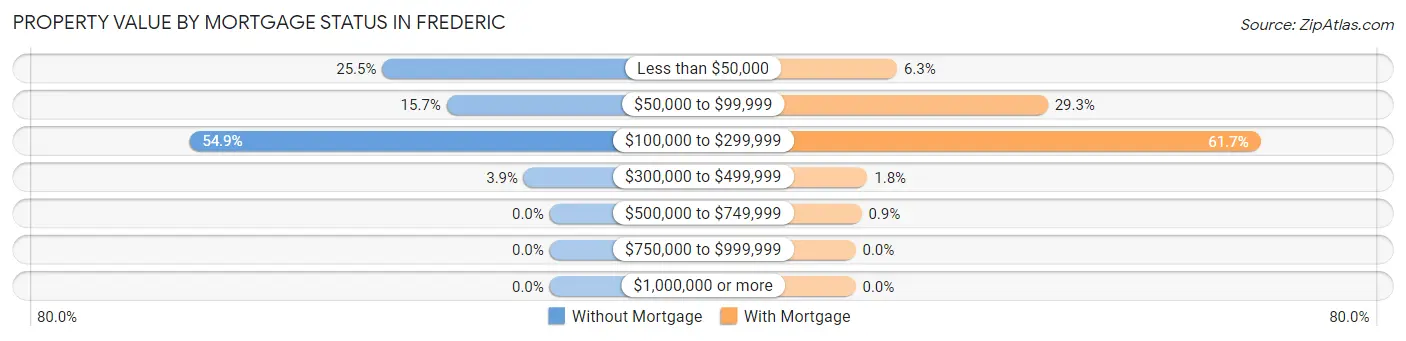
| Property Value | Without Mortgage | With Mortgage |
| Less than $50,000 | 13 (25.5%) | 14 (6.3%) |
| $50,000 to $99,999 | 8 (15.7%) | 65 (29.3%) |
| $100,000 to $299,999 | 28 (54.9%) | 137 (61.7%) |
| $300,000 to $499,999 | 2 (3.9%) | 4 (1.8%) |
| $500,000 to $749,999 | 0 (0.0%) | 2 (0.9%) |
| $750,000 to $999,999 | 0 (0.0%) | 0 (0.0%) |
| $1,000,000 or more | 0 (0.0%) | 0 (0.0%) |
| Total | 51 (100.0%) | 222 (100.0%) |
Household Income by Mortgage Status in Frederic
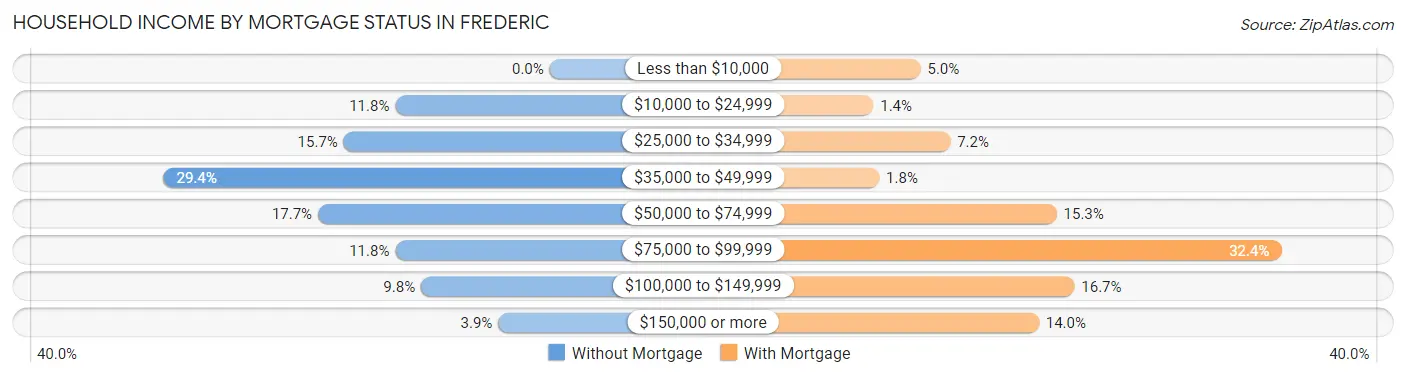
| Household Income | Without Mortgage | With Mortgage |
| Less than $10,000 | 0 (0.0%) | 11 (5.0%) |
| $10,000 to $24,999 | 6 (11.8%) | 3 (1.3%) |
| $25,000 to $34,999 | 8 (15.7%) | 16 (7.2%) |
| $35,000 to $49,999 | 15 (29.4%) | 4 (1.8%) |
| $50,000 to $74,999 | 9 (17.6%) | 34 (15.3%) |
| $75,000 to $99,999 | 6 (11.8%) | 72 (32.4%) |
| $100,000 to $149,999 | 5 (9.8%) | 37 (16.7%) |
| $150,000 or more | 2 (3.9%) | 31 (14.0%) |
| Total | 51 (100.0%) | 222 (100.0%) |
Property Value to Household Income Ratio in Frederic
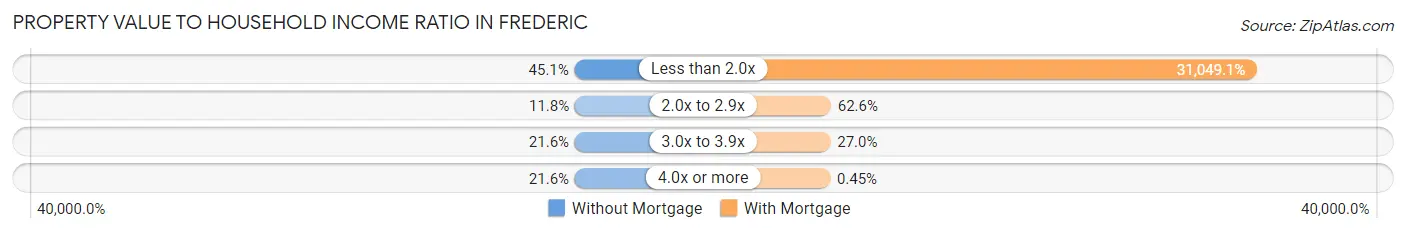
| Value-to-Income Ratio | Without Mortgage | With Mortgage |
| Less than 2.0x | 23 (45.1%) | 68,929 (31,049.1%) |
| 2.0x to 2.9x | 6 (11.8%) | 139 (62.6%) |
| 3.0x to 3.9x | 11 (21.6%) | 60 (27.0%) |
| 4.0x or more | 11 (21.6%) | 1 (0.4%) |
| Total | 51 (100.0%) | 222 (100.0%) |
Real Estate Taxes by Mortgage Status in Frederic
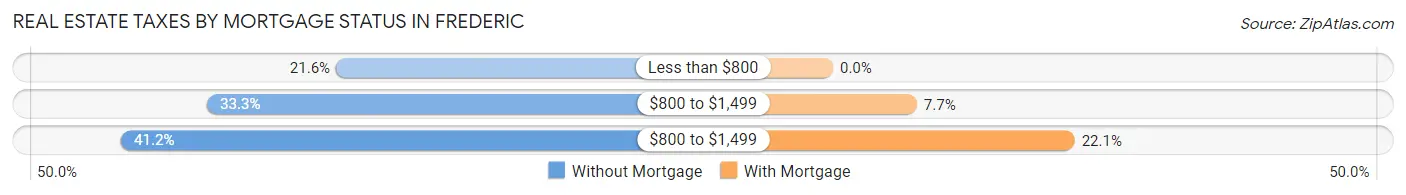
| Property Taxes | Without Mortgage | With Mortgage |
| Less than $800 | 11 (21.6%) | 0 (0.0%) |
| $800 to $1,499 | 17 (33.3%) | 17 (7.7%) |
| $800 to $1,499 | 21 (41.2%) | 49 (22.1%) |
| Total | 51 (100.0%) | 222 (100.0%) |
Health & Disability in Frederic
Health Insurance Coverage by Age in Frederic
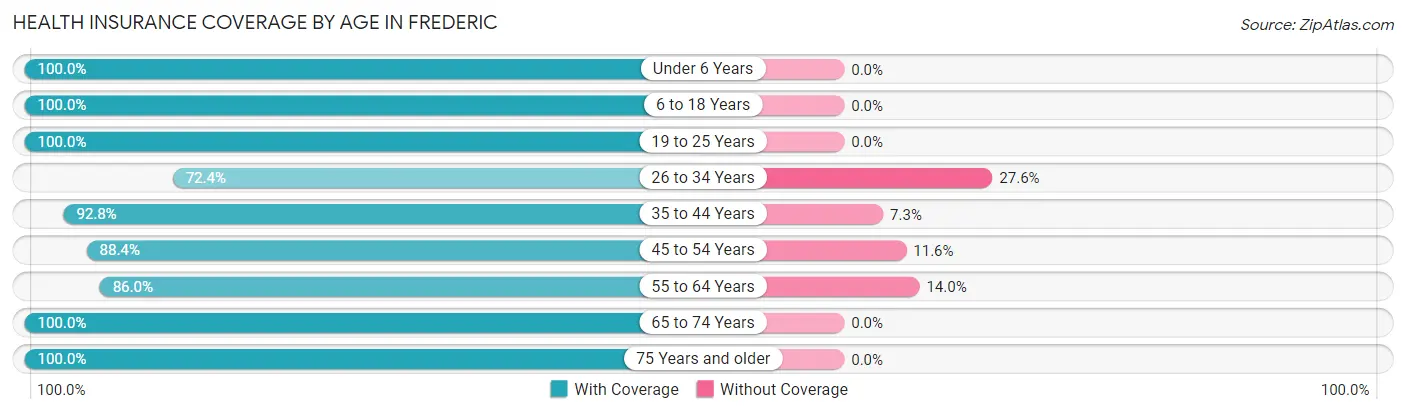
| Age Bracket | With Coverage | Without Coverage |
| Under 6 Years | 68 (100.0%) | 0 (0.0%) |
| 6 to 18 Years | 152 (100.0%) | 0 (0.0%) |
| 19 to 25 Years | 94 (100.0%) | 0 (0.0%) |
| 26 to 34 Years | 76 (72.4%) | 29 (27.6%) |
| 35 to 44 Years | 128 (92.7%) | 10 (7.2%) |
| 45 to 54 Years | 107 (88.4%) | 14 (11.6%) |
| 55 to 64 Years | 141 (86.0%) | 23 (14.0%) |
| 65 to 74 Years | 75 (100.0%) | 0 (0.0%) |
| 75 Years and older | 117 (100.0%) | 0 (0.0%) |
| Total | 958 (92.6%) | 76 (7.3%) |
Health Insurance Coverage by Citizenship Status in Frederic
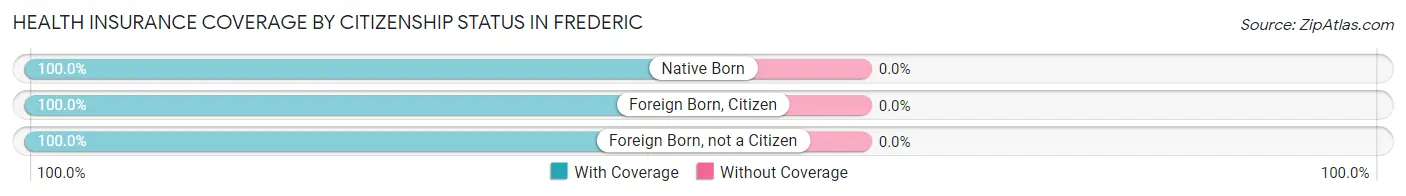
| Citizenship Status | With Coverage | Without Coverage |
| Native Born | 68 (100.0%) | 0 (0.0%) |
| Foreign Born, Citizen | 152 (100.0%) | 0 (0.0%) |
| Foreign Born, not a Citizen | 94 (100.0%) | 0 (0.0%) |
Health Insurance Coverage by Household Income in Frederic
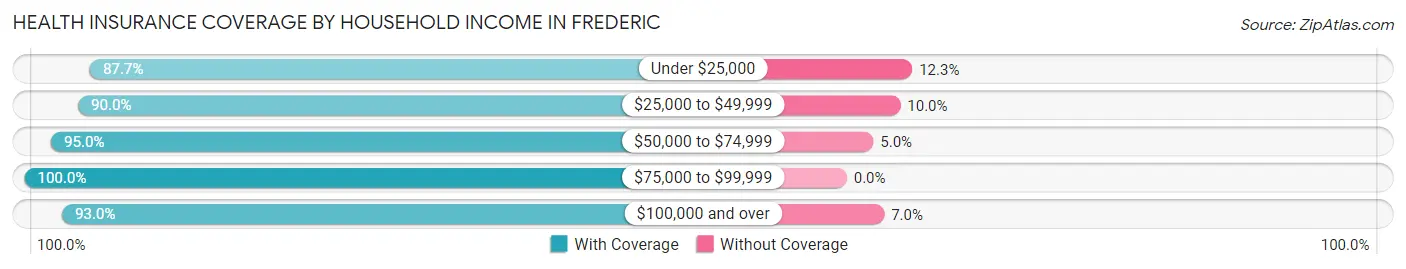
| Household Income | With Coverage | Without Coverage |
| Under $25,000 | 136 (87.7%) | 19 (12.3%) |
| $25,000 to $49,999 | 215 (90.0%) | 24 (10.0%) |
| $50,000 to $74,999 | 191 (95.0%) | 10 (5.0%) |
| $75,000 to $99,999 | 161 (100.0%) | 0 (0.0%) |
| $100,000 and over | 252 (93.0%) | 19 (7.0%) |
Public vs Private Health Insurance Coverage by Age in Frederic
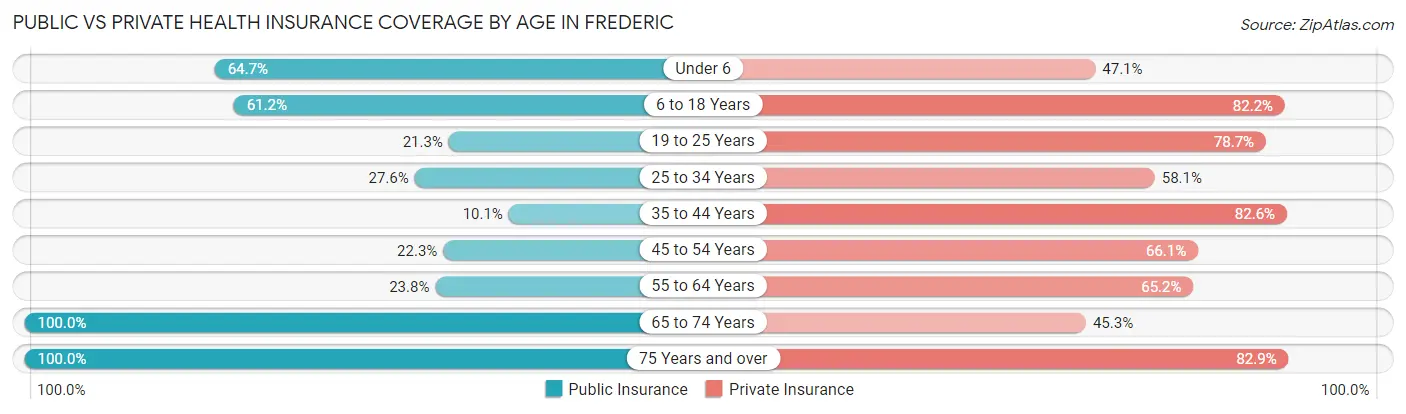
| Age Bracket | Public Insurance | Private Insurance |
| Under 6 | 44 (64.7%) | 32 (47.1%) |
| 6 to 18 Years | 93 (61.2%) | 125 (82.2%) |
| 19 to 25 Years | 20 (21.3%) | 74 (78.7%) |
| 25 to 34 Years | 29 (27.6%) | 61 (58.1%) |
| 35 to 44 Years | 14 (10.1%) | 114 (82.6%) |
| 45 to 54 Years | 27 (22.3%) | 80 (66.1%) |
| 55 to 64 Years | 39 (23.8%) | 107 (65.2%) |
| 65 to 74 Years | 75 (100.0%) | 34 (45.3%) |
| 75 Years and over | 117 (100.0%) | 97 (82.9%) |
| Total | 458 (44.3%) | 724 (70.0%) |
Disability Status by Sex by Age in Frederic
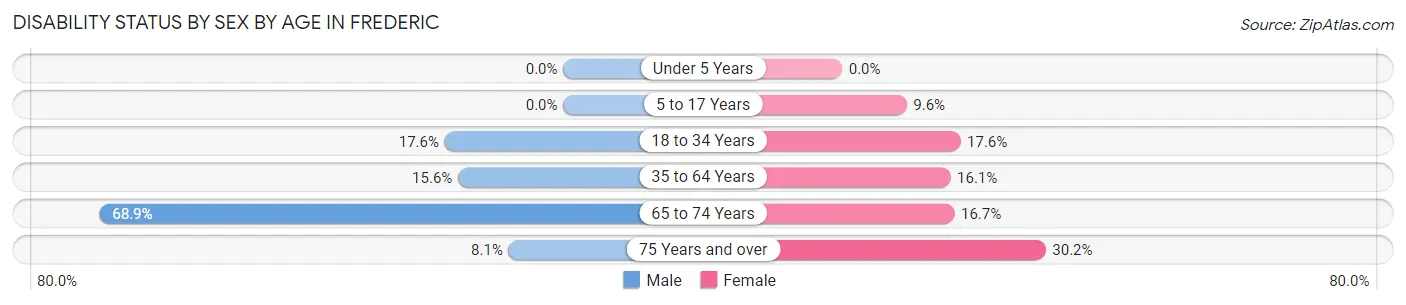
| Age Bracket | Male | Female |
| Under 5 Years | 0 (0.0%) | 0 (0.0%) |
| 5 to 17 Years | 0 (0.0%) | 7 (9.6%) |
| 18 to 34 Years | 22 (17.6%) | 13 (17.6%) |
| 35 to 64 Years | 35 (15.6%) | 32 (16.1%) |
| 65 to 74 Years | 31 (68.9%) | 5 (16.7%) |
| 75 Years and over | 6 (8.1%) | 13 (30.2%) |
Disability Class by Sex by Age in Frederic
Disability Class: Hearing Difficulty
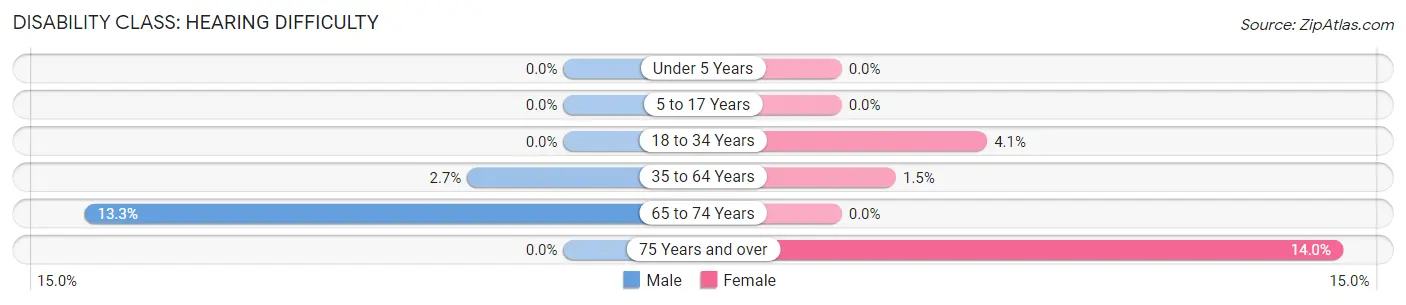
| Age Bracket | Male | Female |
| Under 5 Years | 0 (0.0%) | 0 (0.0%) |
| 5 to 17 Years | 0 (0.0%) | 0 (0.0%) |
| 18 to 34 Years | 0 (0.0%) | 3 (4.1%) |
| 35 to 64 Years | 6 (2.7%) | 3 (1.5%) |
| 65 to 74 Years | 6 (13.3%) | 0 (0.0%) |
| 75 Years and over | 0 (0.0%) | 6 (14.0%) |
Disability Class: Vision Difficulty
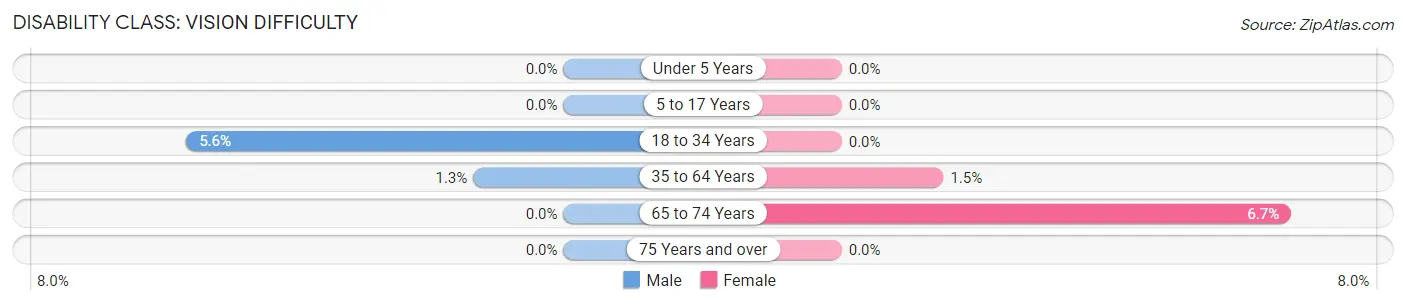
| Age Bracket | Male | Female |
| Under 5 Years | 0 (0.0%) | 0 (0.0%) |
| 5 to 17 Years | 0 (0.0%) | 0 (0.0%) |
| 18 to 34 Years | 7 (5.6%) | 0 (0.0%) |
| 35 to 64 Years | 3 (1.3%) | 3 (1.5%) |
| 65 to 74 Years | 0 (0.0%) | 2 (6.7%) |
| 75 Years and over | 0 (0.0%) | 0 (0.0%) |
Disability Class: Cognitive Difficulty
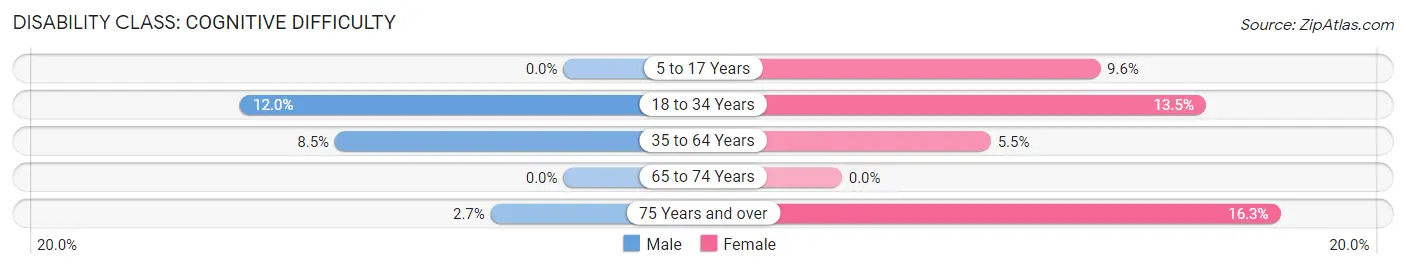
| Age Bracket | Male | Female |
| 5 to 17 Years | 0 (0.0%) | 7 (9.6%) |
| 18 to 34 Years | 15 (12.0%) | 10 (13.5%) |
| 35 to 64 Years | 19 (8.5%) | 11 (5.5%) |
| 65 to 74 Years | 0 (0.0%) | 0 (0.0%) |
| 75 Years and over | 2 (2.7%) | 7 (16.3%) |
Disability Class: Ambulatory Difficulty
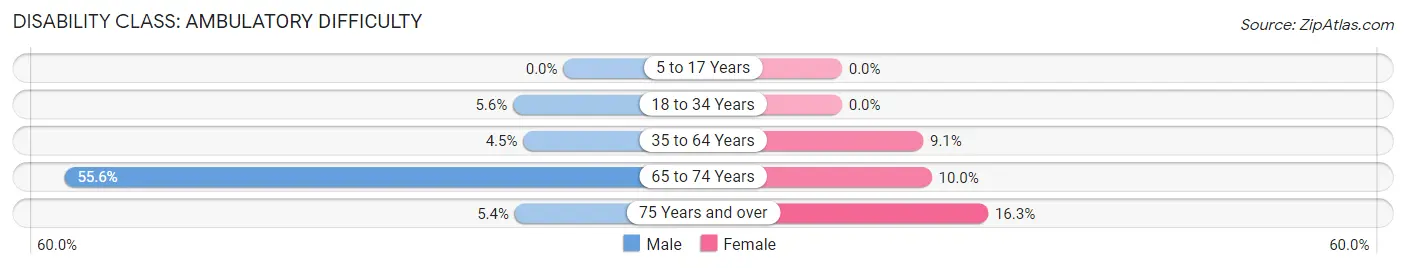
| Age Bracket | Male | Female |
| 5 to 17 Years | 0 (0.0%) | 0 (0.0%) |
| 18 to 34 Years | 7 (5.6%) | 0 (0.0%) |
| 35 to 64 Years | 10 (4.5%) | 18 (9.0%) |
| 65 to 74 Years | 25 (55.6%) | 3 (10.0%) |
| 75 Years and over | 4 (5.4%) | 7 (16.3%) |
Disability Class: Self-Care Difficulty
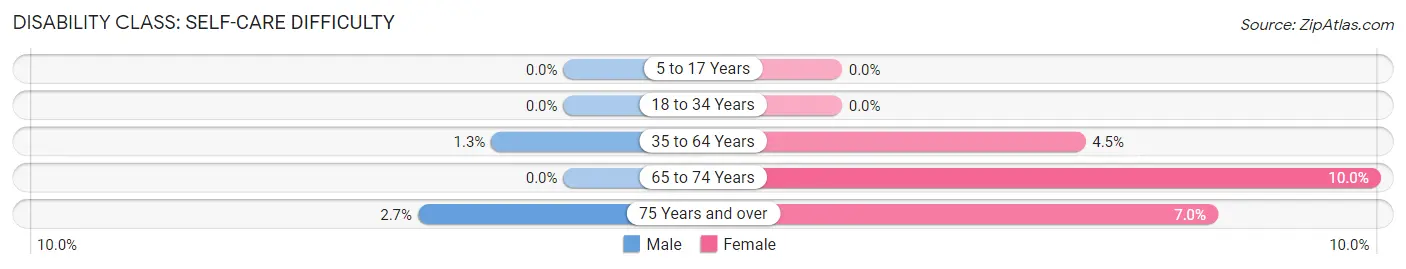
| Age Bracket | Male | Female |
| 5 to 17 Years | 0 (0.0%) | 0 (0.0%) |
| 18 to 34 Years | 0 (0.0%) | 0 (0.0%) |
| 35 to 64 Years | 3 (1.3%) | 9 (4.5%) |
| 65 to 74 Years | 0 (0.0%) | 3 (10.0%) |
| 75 Years and over | 2 (2.7%) | 3 (7.0%) |
Technology Access in Frederic
Computing Device Access in Frederic
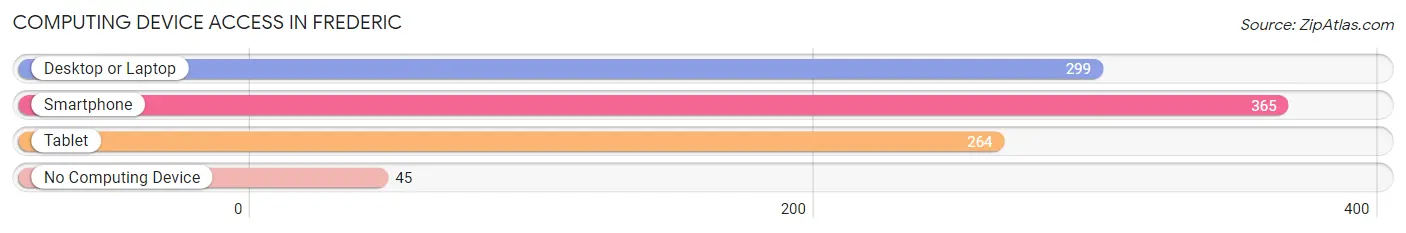
| Device Type | # Households | % Households |
| Desktop or Laptop | 299 | 67.6% |
| Smartphone | 365 | 82.6% |
| Tablet | 264 | 59.7% |
| No Computing Device | 45 | 10.2% |
| Total | 442 | 100.0% |
Internet Access in Frederic
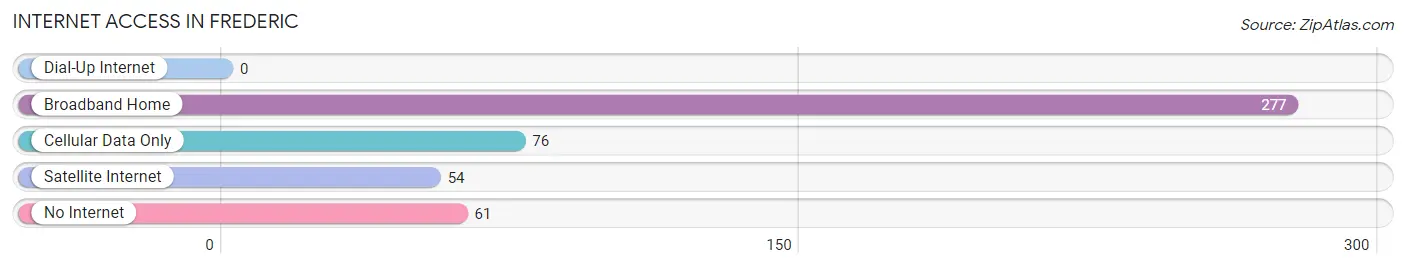
| Internet Type | # Households | % Households |
| Dial-Up Internet | 0 | 0.0% |
| Broadband Home | 277 | 62.7% |
| Cellular Data Only | 76 | 17.2% |
| Satellite Internet | 54 | 12.2% |
| No Internet | 61 | 13.8% |
| Total | 442 | 100.0% |
Frederic Summary
Frederic, Wisconsin is a small village located in Polk County, Wisconsin. It is situated on the banks of the Apple River and is home to a population of just over 1,000 people. The village is known for its rural charm and its close proximity to the St. Croix National Scenic Riverway.
History
Frederic was founded in 1872 by a group of Norwegian immigrants. The village was named after Frederic, Norway, the hometown of the immigrants. The village was originally a logging town, and the first sawmill was built in 1873. The village grew quickly, and by the early 1900s, it had become a thriving community.
In the early 1900s, the village was home to a variety of businesses, including a hotel, a bank, a general store, a blacksmith shop, and a post office. The village also had a school, a church, and a library.
In the 1920s, the village began to decline as the logging industry moved away from the area. The village was also affected by the Great Depression, and many of the businesses closed. However, the village was able to survive and remain a small, rural community.
Geography
Frederic is located in the northwest corner of Polk County, Wisconsin. It is situated on the banks of the Apple River, which flows through the village. The village is surrounded by rolling hills and forests, and is located near the St. Croix National Scenic Riverway.
The village has a total area of 1.2 square miles, all of which is land. The village is located about 30 miles north of Eau Claire, Wisconsin, and about 50 miles east of Minneapolis, Minnesota.
Economy
The economy of Frederic is largely based on tourism and agriculture. The village is home to several small businesses, including a grocery store, a hardware store, a restaurant, and a gas station. The village also has a few small manufacturing businesses.
The village is also home to a number of farms, which produce a variety of crops, including corn, soybeans, and hay. The village also has a number of apple orchards, which produce apples for local consumption and for sale at local farmers markets.
Demographics
As of the 2010 census, the population of Frederic was 1,072. The population is largely white (97.2%), with a small percentage of African Americans (0.7%) and Native Americans (0.3%). The median household income is $45,000, and the median age is 44.
The village is home to a number of churches, including the Frederic United Methodist Church, the Frederic Lutheran Church, and the Frederic Baptist Church. The village also has a public library, a post office, and a fire department.
Conclusion
Frederic, Wisconsin is a small village located in Polk County, Wisconsin. It is situated on the banks of the Apple River and is home to a population of just over 1,000 people. The village is known for its rural charm and its close proximity to the St. Croix National Scenic Riverway. The economy of Frederic is largely based on tourism and agriculture, and the village is home to a variety of small businesses and farms. The population is largely white, with a small percentage of African Americans and Native Americans. The village is home to a number of churches, a public library, a post office, and a fire department.
Common Questions
What is the Total Population of Frederic?
Total Population of Frederic is 1,101.
What is the Total Male Population of Frederic?
Total Male Population of Frederic is 608.
What is the Total Female Population of Frederic?
Total Female Population of Frederic is 493.
What is the Ratio of Males per 100 Females in Frederic?
There are 123.33 Males per 100 Females in Frederic.
What is the Ratio of Females per 100 Males in Frederic?
There are 81.09 Females per 100 Males in Frederic.
What is the Median Population Age in Frederic?
Median Population Age in Frederic is 44.6 Years.
What is the Average Family Size in Frederic
Average Family Size in Frederic is 3.2 People.
What is the Average Household Size in Frederic
Average Household Size in Frederic is 2.3 People.
What is Per Capita Income in Frederic?
Per Capita income in Frederic is $28,755.
What is the Median Family Income in Frederic?
Median Family Income in Frederic is $69,886.
What is the Median Household income in Frederic?
Median Household Income in Frederic is $50,250.
What is Income or Wage Gap in Frederic?
Income or Wage Gap in Frederic is 33.2%.
Women in Frederic earn 66.8 cents for every dollar earned by a man.
What is Inequality or Gini Index in Frederic?
Inequality or Gini Index in Frederic is 0.40.
How Large is the Labor Force in Frederic?
There are 552 People in the Labor Forcein in Frederic.
What is the Percentage of People in the Labor Force in Frederic?
61.4% of People are in the Labor Force in Frederic.
What is the Unemployment Rate in Frederic?
Unemployment Rate in Frederic is 3.8%.