Ellison Bay, WI
Ellison Bay Map
Ellison Bay Overview
142
TOTAL POPULATION
59
MALE POPULATION
83
FEMALE POPULATION
71.08
MALES / 100 FEMALES
140.68
FEMALES / 100 MALES
57.4
MEDIAN AGE
2.6
AVG FAMILY SIZE
2.0
AVG HOUSEHOLD SIZE
$52,971
PER CAPITA INCOME
$119,250
AVG FAMILY INCOME
$83,000
AVG HOUSEHOLD INCOME
0.36
INEQUALITY / GINI INDEX
76
LABOR FORCE [ PEOPLE ]
65.5%
PERCENT IN LABOR FORCE
Ellison Bay Zip Codes
Ellison Bay Area Codes
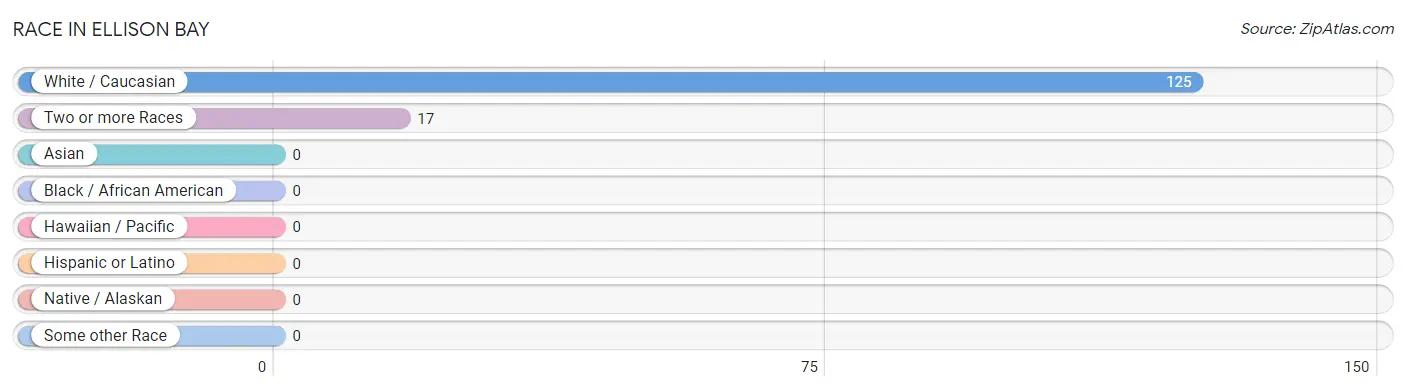
Race in Ellison Bay
The most populous races in Ellison Bay are White / Caucasian (125 | 88.0%), and Two or more Races (17 | 12.0%).
| Race | # Population | % Population |
| Asian | 0 | 0.0% |
| Black / African American | 0 | 0.0% |
| Hawaiian / Pacific | 0 | 0.0% |
| Hispanic or Latino | 0 | 0.0% |
| Native / Alaskan | 0 | 0.0% |
| White / Caucasian | 125 | 88.0% |
| Two or more Races | 17 | 12.0% |
| Some other Race | 0 | 0.0% |
| Total | 142 | 100.0% |
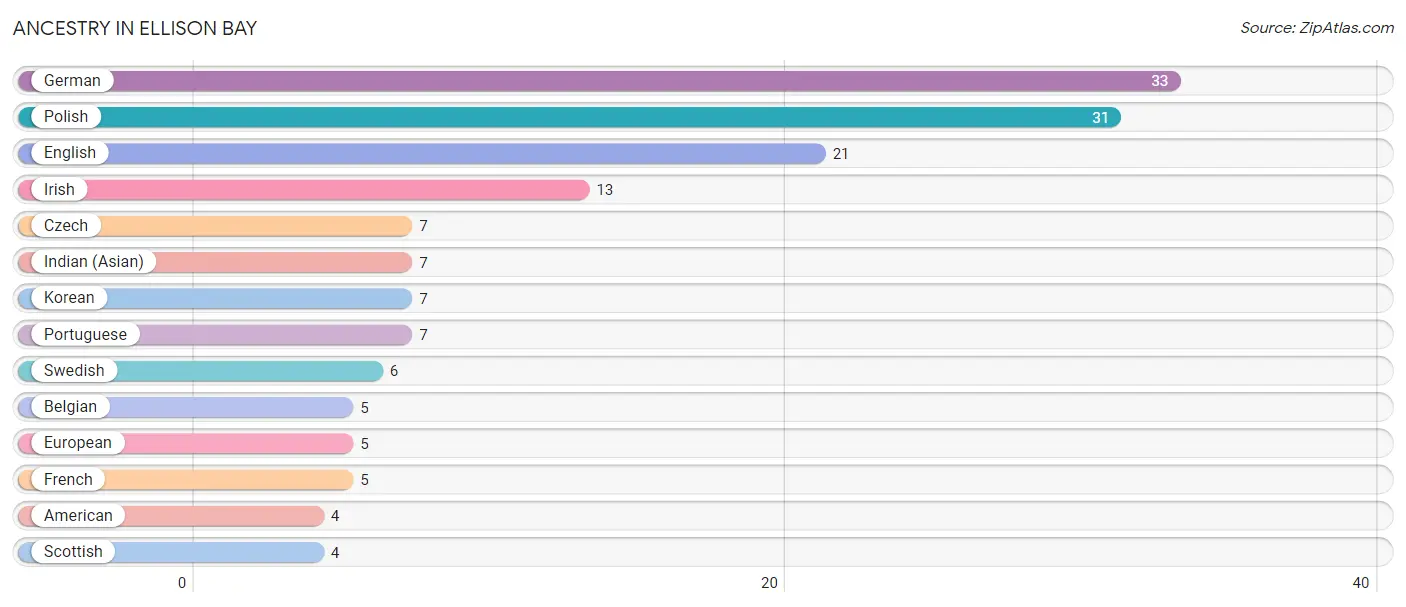
Ancestry in Ellison Bay
The most populous ancestries reported in Ellison Bay are German (33 | 23.2%), Polish (31 | 21.8%), English (21 | 14.8%), Irish (13 | 9.1%), and Czech (7 | 4.9%), together accounting for 73.9% of all Ellison Bay residents.
| Ancestry | # Population | % Population |
| American | 4 | 2.8% |
| Belgian | 5 | 3.5% |
| Czech | 7 | 4.9% |
| English | 21 | 14.8% |
| European | 5 | 3.5% |
| French | 5 | 3.5% |
| German | 33 | 23.2% |
| Indian (Asian) | 7 | 4.9% |
| Irish | 13 | 9.1% |
| Korean | 7 | 4.9% |
| Polish | 31 | 21.8% |
| Portuguese | 7 | 4.9% |
| Scottish | 4 | 2.8% |
| Swedish | 6 | 4.2% | View All 14 Rows |
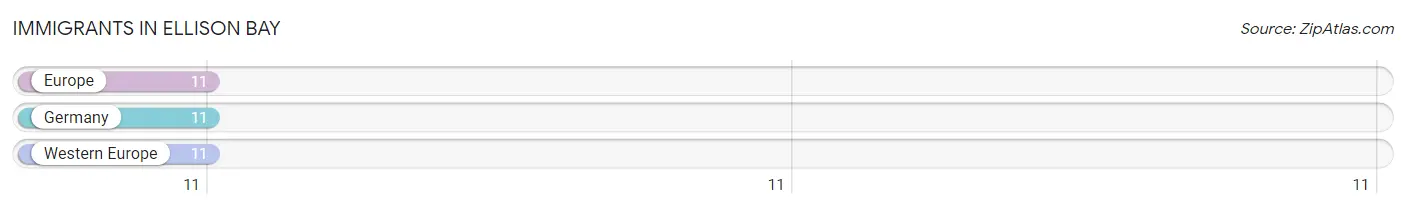
Immigrants in Ellison Bay
The most numerous immigrant groups reported in Ellison Bay came from Europe (11 | 7.7%), Germany (11 | 7.7%), and Western Europe (11 | 7.7%), together accounting for 23.2% of all Ellison Bay residents.
| Immigration Origin | # Population | % Population |
| Europe | 11 | 7.7% |
| Germany | 11 | 7.7% |
| Western Europe | 11 | 7.7% | View All 3 Rows |
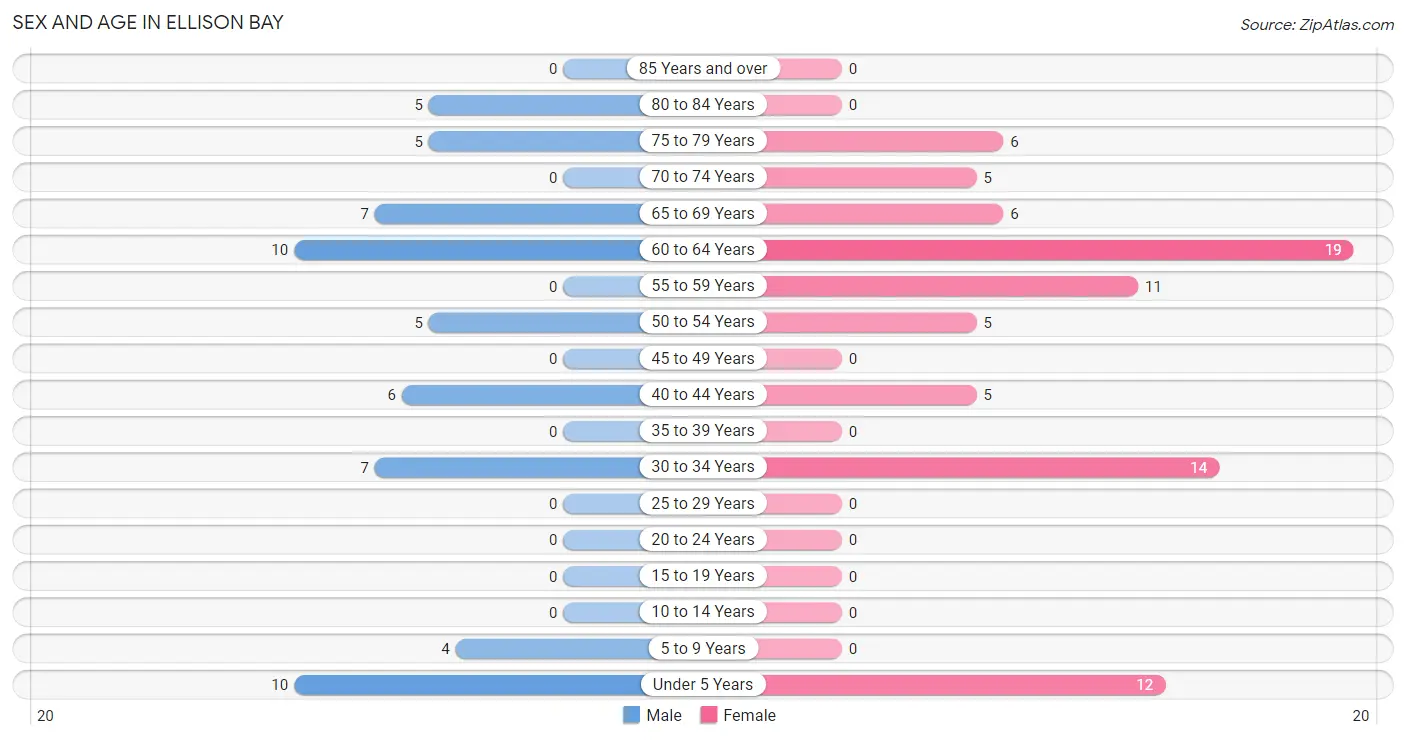
Sex and Age in Ellison Bay
Sex and Age in Ellison Bay
The most populous age groups in Ellison Bay are Under 5 Years (10 | 17.0%) for men and 60 to 64 Years (19 | 22.9%) for women.
| Age Bracket | Male | Female |
| Under 5 Years | 10 (17.0%) | 12 (14.5%) |
| 5 to 9 Years | 4 (6.8%) | 0 (0.0%) |
| 10 to 14 Years | 0 (0.0%) | 0 (0.0%) |
| 15 to 19 Years | 0 (0.0%) | 0 (0.0%) |
| 20 to 24 Years | 0 (0.0%) | 0 (0.0%) |
| 25 to 29 Years | 0 (0.0%) | 0 (0.0%) |
| 30 to 34 Years | 7 (11.9%) | 14 (16.9%) |
| 35 to 39 Years | 0 (0.0%) | 0 (0.0%) |
| 40 to 44 Years | 6 (10.2%) | 5 (6.0%) |
| 45 to 49 Years | 0 (0.0%) | 0 (0.0%) |
| 50 to 54 Years | 5 (8.5%) | 5 (6.0%) |
| 55 to 59 Years | 0 (0.0%) | 11 (13.3%) |
| 60 to 64 Years | 10 (17.0%) | 19 (22.9%) |
| 65 to 69 Years | 7 (11.9%) | 6 (7.2%) |
| 70 to 74 Years | 0 (0.0%) | 5 (6.0%) |
| 75 to 79 Years | 5 (8.5%) | 6 (7.2%) |
| 80 to 84 Years | 5 (8.5%) | 0 (0.0%) |
| 85 Years and over | 0 (0.0%) | 0 (0.0%) |
| Total | 59 (100.0%) | 83 (100.0%) |
Families and Households in Ellison Bay
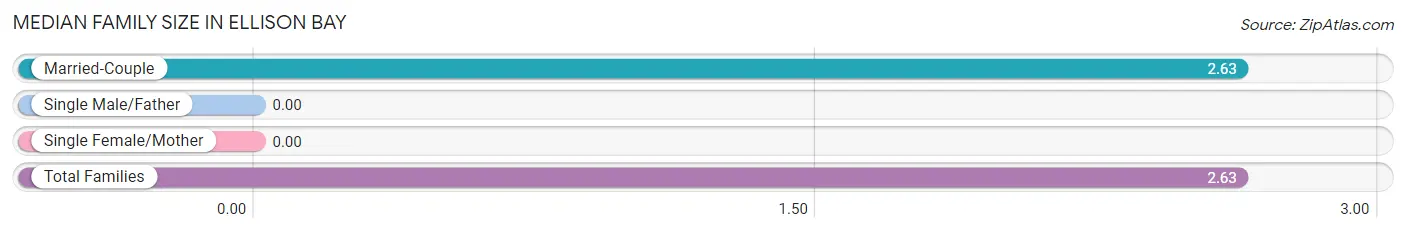
Median Family Size in Ellison Bay
| Family Type | # Families | Family Size |
| Married-Couple | 43 (100.0%) | 2.63 |
| Single Male/Father | 0 (0.0%) | - |
| Single Female/Mother | 0 (0.0%) | - |
| Total Families | 43 (100.0%) | 2.63 |
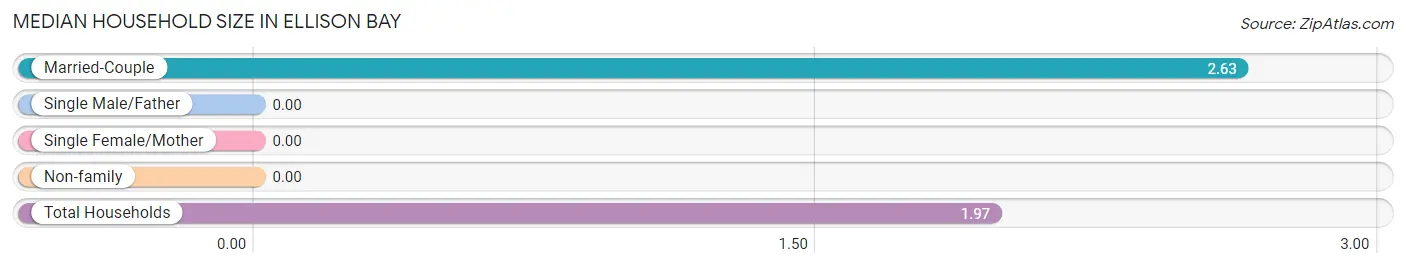
Median Household Size in Ellison Bay
| Household Type | # Households | Household Size |
| Married-Couple | 43 (59.7%) | 2.63 |
| Single Male/Father | 0 (0.0%) | - |
| Single Female/Mother | 0 (0.0%) | - |
| Non-family | 29 (40.3%) | - |
| Total Households | 72 (100.0%) | 1.97 |
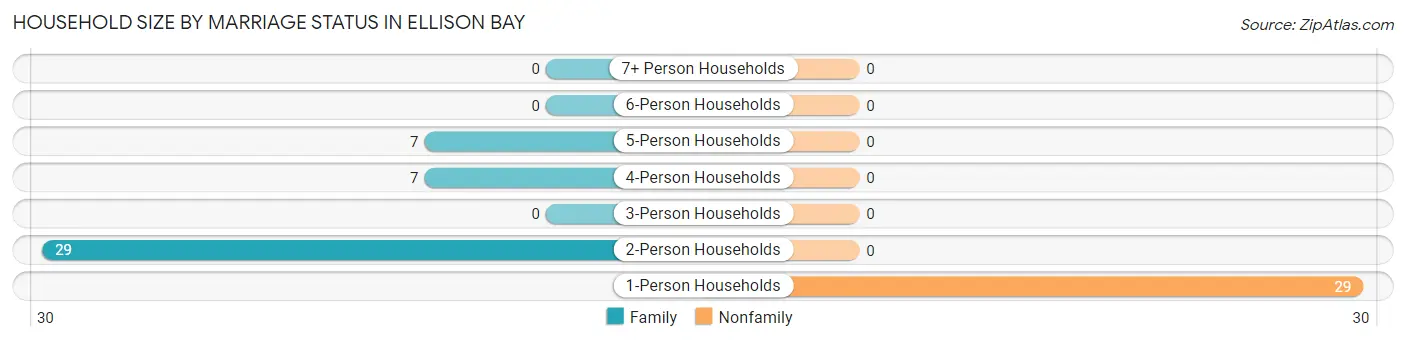
Household Size by Marriage Status in Ellison Bay
Out of a total of 72 households in Ellison Bay, 43 (59.7%) are family households, while 29 (40.3%) are nonfamily households. The most numerous type of family households are 2-person households, comprising 29, and the most common type of nonfamily households are 1-person households, comprising 29.
| Household Size | Family Households | Nonfamily Households |
| 1-Person Households | - | 29 (40.3%) |
| 2-Person Households | 29 (40.3%) | 0 (0.0%) |
| 3-Person Households | 0 (0.0%) | 0 (0.0%) |
| 4-Person Households | 7 (9.7%) | 0 (0.0%) |
| 5-Person Households | 7 (9.7%) | 0 (0.0%) |
| 6-Person Households | 0 (0.0%) | 0 (0.0%) |
| 7+ Person Households | 0 (0.0%) | 0 (0.0%) |
| Total | 43 (59.7%) | 29 (40.3%) |
Female Fertility in Ellison Bay
Fertility by Age in Ellison Bay
Average fertility rate in Ellison Bay is 368.0 births per 1,000 women. Women in the age bracket of 20 to 34 years have the highest fertility rate with 500.0 births per 1,000 women. Women in the age bracket of 20 to 34 years acount for 100.0% of all women with births.
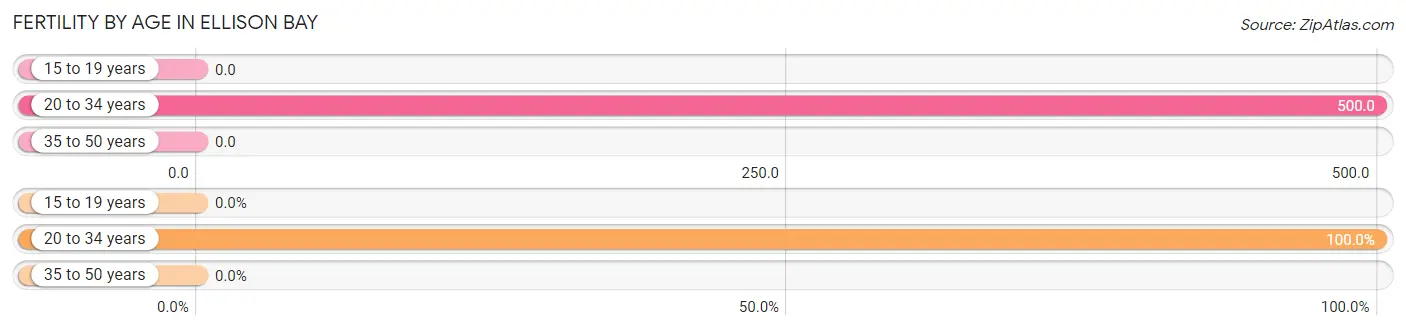
| Age Bracket | Women with Births | Births / 1,000 Women |
| 15 to 19 years | 0 (0.0%) | 0.0 |
| 20 to 34 years | 7 (100.0%) | 500.0 |
| 35 to 50 years | 0 (0.0%) | 0.0 |
| Total | 7 (100.0%) | 368.0 |
Fertility by Age by Marriage Status in Ellison Bay
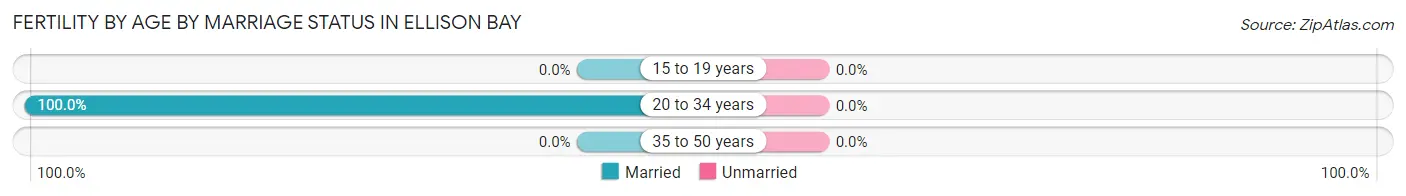
| Age Bracket | Married | Unmarried |
| 15 to 19 years | 0 (0.0%) | 0 (0.0%) |
| 20 to 34 years | 7 (100.0%) | 0 (0.0%) |
| 35 to 50 years | 0 (0.0%) | 0 (0.0%) |
| Total | 7 (100.0%) | 0 (0.0%) |
Fertility by Education in Ellison Bay
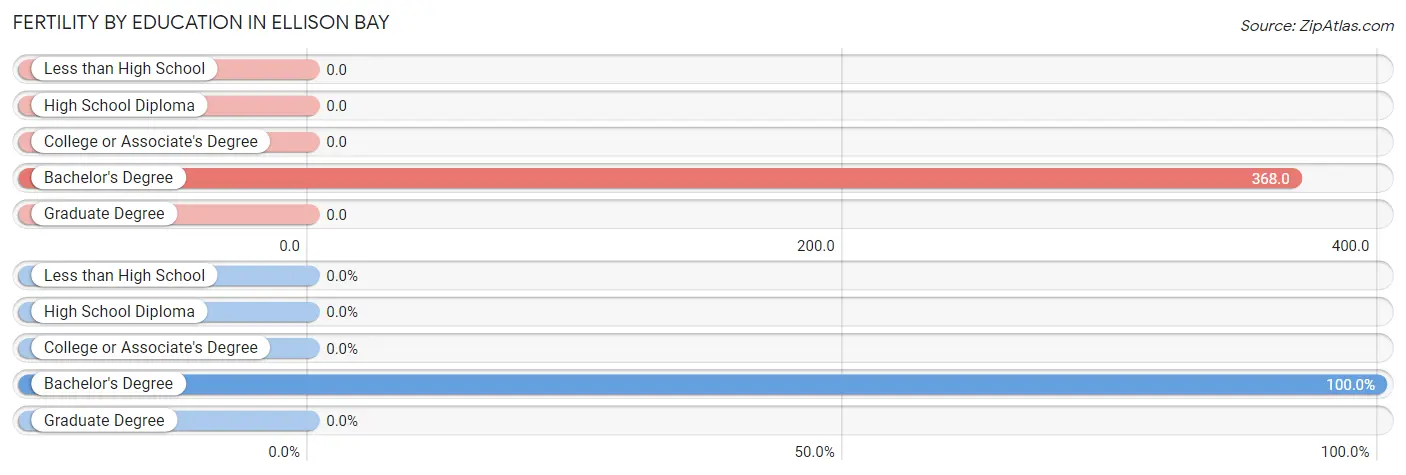
| Educational Attainment | Women with Births | Births / 1,000 Women |
| Less than High School | 0 (0.0%) | 0.0 |
| High School Diploma | 0 (0.0%) | 0.0 |
| College or Associate's Degree | 0 (0.0%) | 0.0 |
| Bachelor's Degree | 7 (100.0%) | 368.0 |
| Graduate Degree | 0 (0.0%) | 0.0 |
| Total | 7 (100.0%) | 368.0 |
Fertility by Education by Marriage Status in Ellison Bay
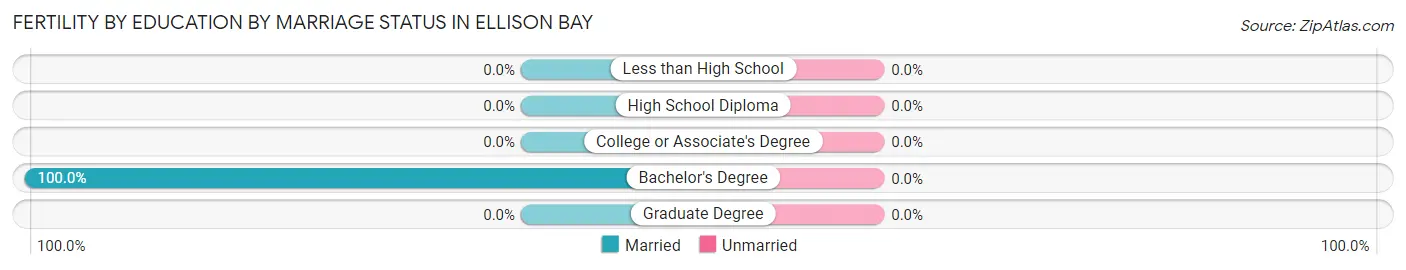
| Educational Attainment | Married | Unmarried |
| Less than High School | 0 (0.0%) | 0 (0.0%) |
| High School Diploma | 0 (0.0%) | 0 (0.0%) |
| College or Associate's Degree | 0 (0.0%) | 0 (0.0%) |
| Bachelor's Degree | 7 (100.0%) | 0 (0.0%) |
| Graduate Degree | 0 (0.0%) | 0 (0.0%) |
| Total | 7 (100.0%) | 0 (0.0%) |
Income in Ellison Bay
Income Overview in Ellison Bay
Per Capita Income in Ellison Bay is $52,971, while median incomes of families and households are $119,250 and $83,000 respectively.
| Characteristic | Number | Measure |
| Per Capita Income | 142 | $52,971 |
| Median Family Income | 43 | $119,250 |
| Mean Family Income | 43 | $141,144 |
| Median Household Income | 72 | $83,000 |
| Mean Household Income | 72 | $103,260 |
| Income Deficit | 43 | $0 |
| Wage / Income Gap (%) | 142 | 0.00% |
| Wage / Income Gap ($) | 142 | 100.00¢ per $1 |
| Gini / Inequality Index | 142 | 0.36 |
Earnings by Sex in Ellison Bay
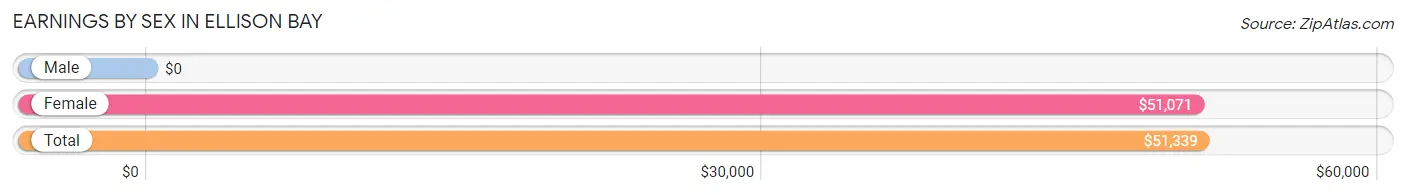
| Sex | Number | Average Earnings |
| Male | 33 (40.7%) | $0 |
| Female | 48 (59.3%) | $51,071 |
| Total | 81 (100.0%) | $51,339 |
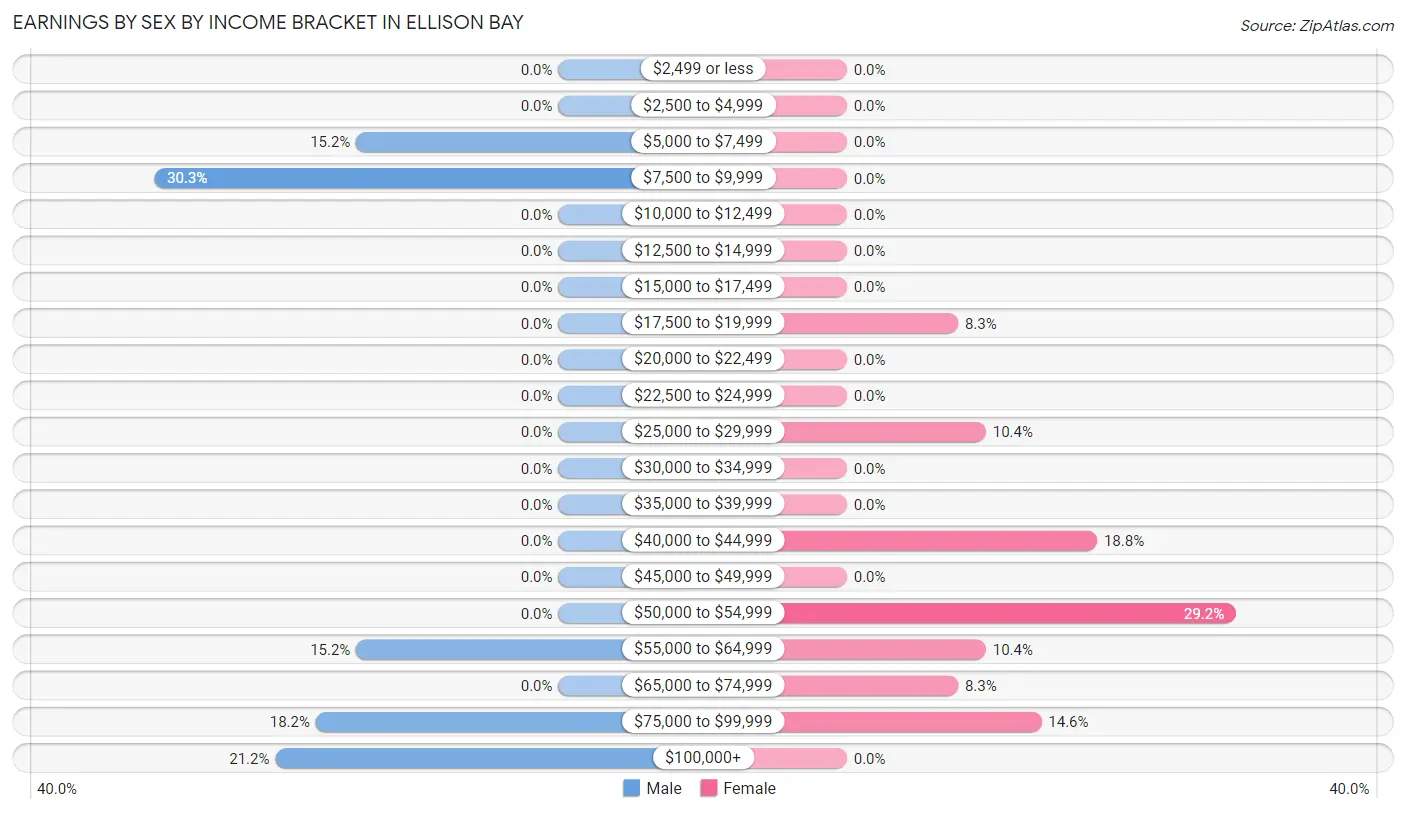
Earnings by Sex by Income Bracket in Ellison Bay
The most common earnings brackets in Ellison Bay are $7,500 to $9,999 for men (10 | 30.3%) and $50,000 to $54,999 for women (14 | 29.2%).
| Income | Male | Female |
| $2,499 or less | 0 (0.0%) | 0 (0.0%) |
| $2,500 to $4,999 | 0 (0.0%) | 0 (0.0%) |
| $5,000 to $7,499 | 5 (15.1%) | 0 (0.0%) |
| $7,500 to $9,999 | 10 (30.3%) | 0 (0.0%) |
| $10,000 to $12,499 | 0 (0.0%) | 0 (0.0%) |
| $12,500 to $14,999 | 0 (0.0%) | 0 (0.0%) |
| $15,000 to $17,499 | 0 (0.0%) | 0 (0.0%) |
| $17,500 to $19,999 | 0 (0.0%) | 4 (8.3%) |
| $20,000 to $22,499 | 0 (0.0%) | 0 (0.0%) |
| $22,500 to $24,999 | 0 (0.0%) | 0 (0.0%) |
| $25,000 to $29,999 | 0 (0.0%) | 5 (10.4%) |
| $30,000 to $34,999 | 0 (0.0%) | 0 (0.0%) |
| $35,000 to $39,999 | 0 (0.0%) | 0 (0.0%) |
| $40,000 to $44,999 | 0 (0.0%) | 9 (18.8%) |
| $45,000 to $49,999 | 0 (0.0%) | 0 (0.0%) |
| $50,000 to $54,999 | 0 (0.0%) | 14 (29.2%) |
| $55,000 to $64,999 | 5 (15.1%) | 5 (10.4%) |
| $65,000 to $74,999 | 0 (0.0%) | 4 (8.3%) |
| $75,000 to $99,999 | 6 (18.2%) | 7 (14.6%) |
| $100,000+ | 7 (21.2%) | 0 (0.0%) |
| Total | 33 (100.0%) | 48 (100.0%) |
Earnings by Sex by Educational Attainment in Ellison Bay
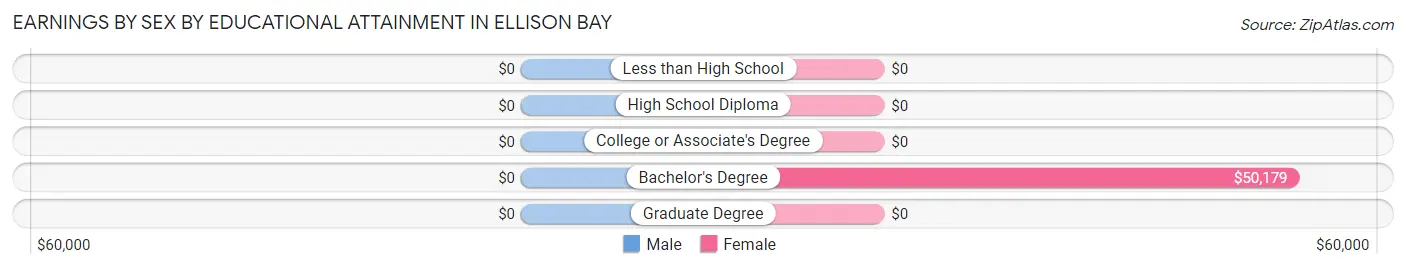
| Educational Attainment | Male Income | Female Income |
| Less than High School | - | - |
| High School Diploma | - | - |
| College or Associate's Degree | - | - |
| Bachelor's Degree | - | - |
| Graduate Degree | - | - |
| Total | - | - |
Family Income in Ellison Bay
Family Income Brackets in Ellison Bay
According to the Ellison Bay family income data, there are 15 families falling into the $150,000 to $199,999 income range, which is the most common income bracket and makes up 34.9% of all families.
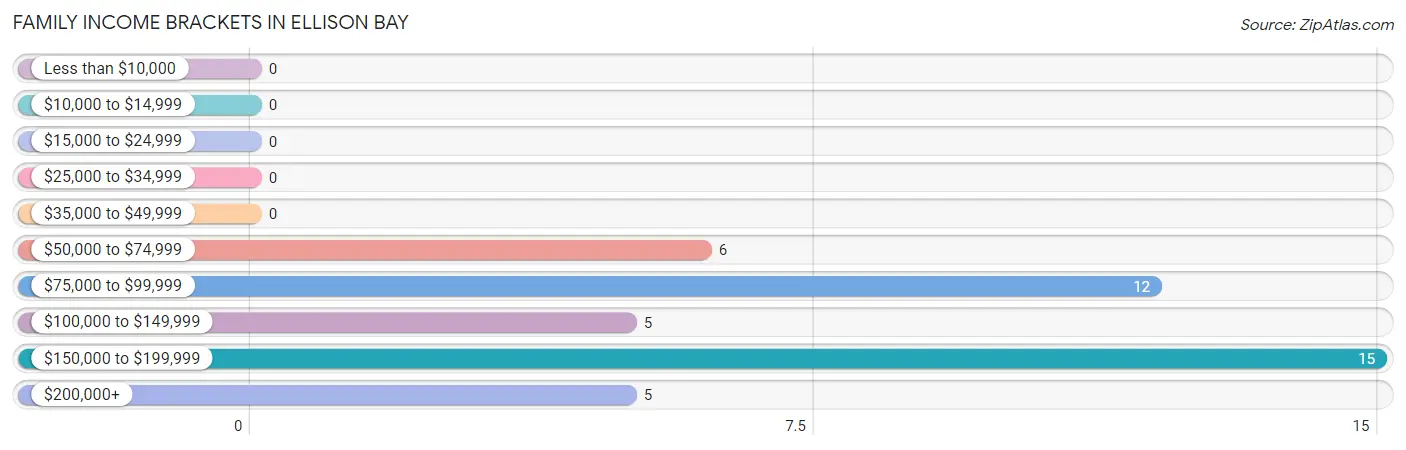
| Income Bracket | # Families | % Families |
| Less than $10,000 | 0 | 0.0% |
| $10,000 to $14,999 | 0 | 0.0% |
| $15,000 to $24,999 | 0 | 0.0% |
| $25,000 to $34,999 | 0 | 0.0% |
| $35,000 to $49,999 | 0 | 0.0% |
| $50,000 to $74,999 | 6 | 14.0% |
| $75,000 to $99,999 | 12 | 27.9% |
| $100,000 to $149,999 | 5 | 11.6% |
| $150,000 to $199,999 | 15 | 34.9% |
| $200,000+ | 5 | 11.6% |
Family Income by Famaliy Size in Ellison Bay
2-person families (29 | 67.4%) account for the highest median family income in Ellison Bay with $86,250 per family, while 2-person families (29 | 67.4%) have the highest median income of $43,125 per family member.
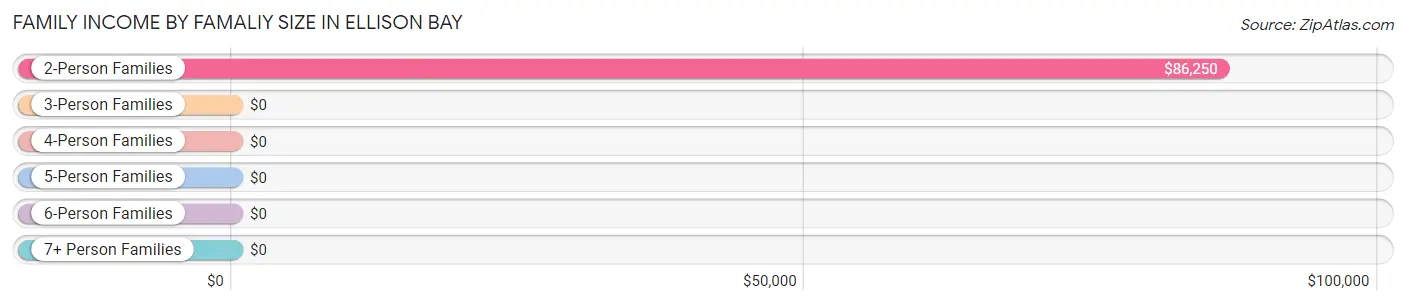
| Income Bracket | # Families | Median Income |
| 2-Person Families | 29 (67.4%) | $86,250 |
| 3-Person Families | 0 (0.0%) | $0 |
| 4-Person Families | 7 (16.3%) | $0 |
| 5-Person Families | 7 (16.3%) | $0 |
| 6-Person Families | 0 (0.0%) | $0 |
| 7+ Person Families | 0 (0.0%) | $0 |
| Total | 43 (100.0%) | $119,250 |
Family Income by Number of Earners in Ellison Bay
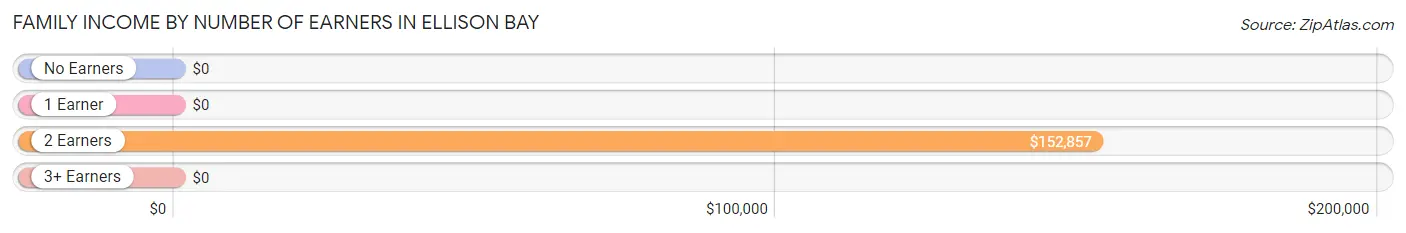
| Number of Earners | # Families | Median Income |
| No Earners | 1 (2.3%) | $0 |
| 1 Earner | 16 (37.2%) | $0 |
| 2 Earners | 26 (60.5%) | $152,857 |
| 3+ Earners | 0 (0.0%) | $0 |
| Total | 43 (100.0%) | $119,250 |
Household Income in Ellison Bay
Household Income Brackets in Ellison Bay
With 21 households falling in the category, the $50,000 to $74,999 income range is the most frequent in Ellison Bay, accounting for 29.2% of all households.
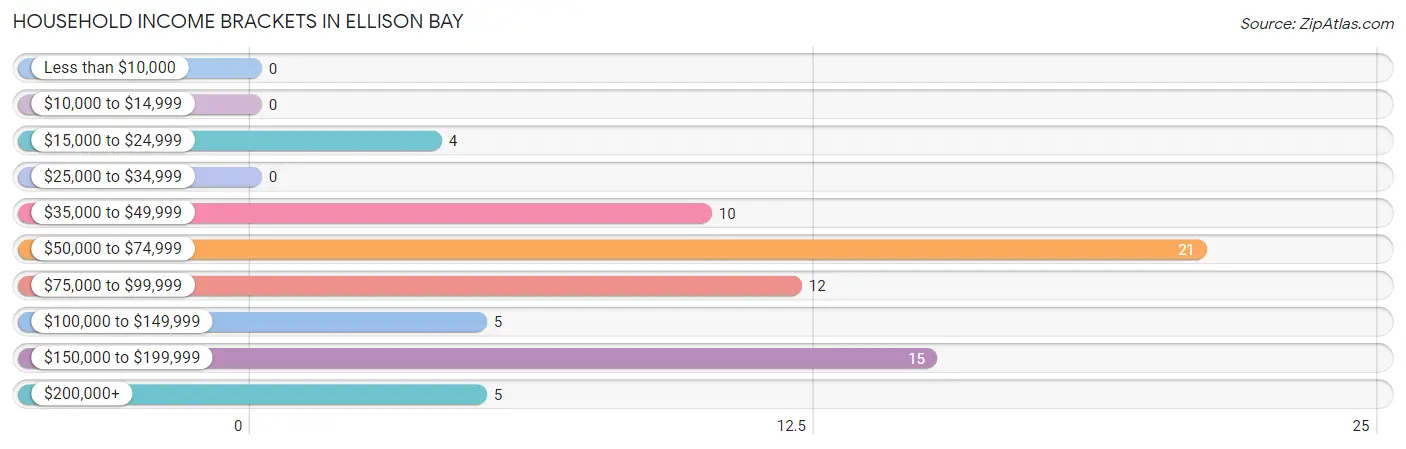
| Income Bracket | # Households | % Households |
| Less than $10,000 | 0 | 0.0% |
| $10,000 to $14,999 | 0 | 0.0% |
| $15,000 to $24,999 | 4 | 5.6% |
| $25,000 to $34,999 | 0 | 0.0% |
| $35,000 to $49,999 | 10 | 13.9% |
| $50,000 to $74,999 | 21 | 29.2% |
| $75,000 to $99,999 | 12 | 16.7% |
| $100,000 to $149,999 | 5 | 6.9% |
| $150,000 to $199,999 | 15 | 20.8% |
| $200,000+ | 5 | 6.9% |
Household Income by Householder Age in Ellison Bay
The median household income in Ellison Bay is $83,000, with the highest median household income of $154,107 found in the 25 to 44 years age bracket for the primary householder. A total of 19 households (26.4%) fall into this category.
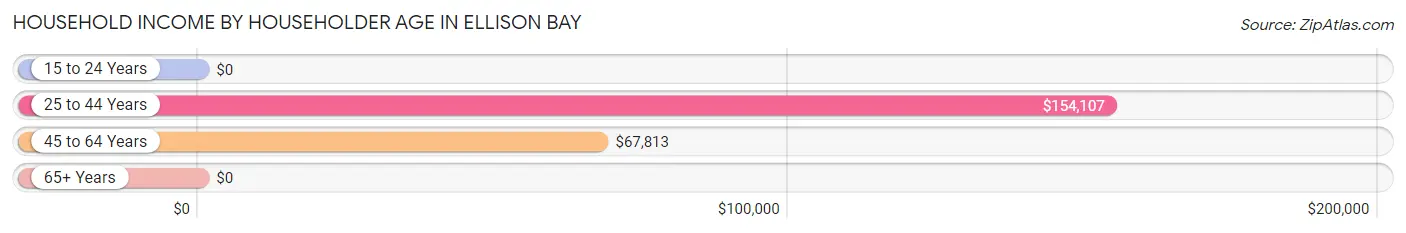
| Income Bracket | # Households | Median Income |
| 15 to 24 Years | 0 (0.0%) | $0 |
| 25 to 44 Years | 19 (26.4%) | $154,107 |
| 45 to 64 Years | 31 (43.1%) | $67,813 |
| 65+ Years | 22 (30.6%) | $0 |
| Total | 72 (100.0%) | $83,000 |
Poverty in Ellison Bay
Income Below Poverty by Sex and Age in Ellison Bay
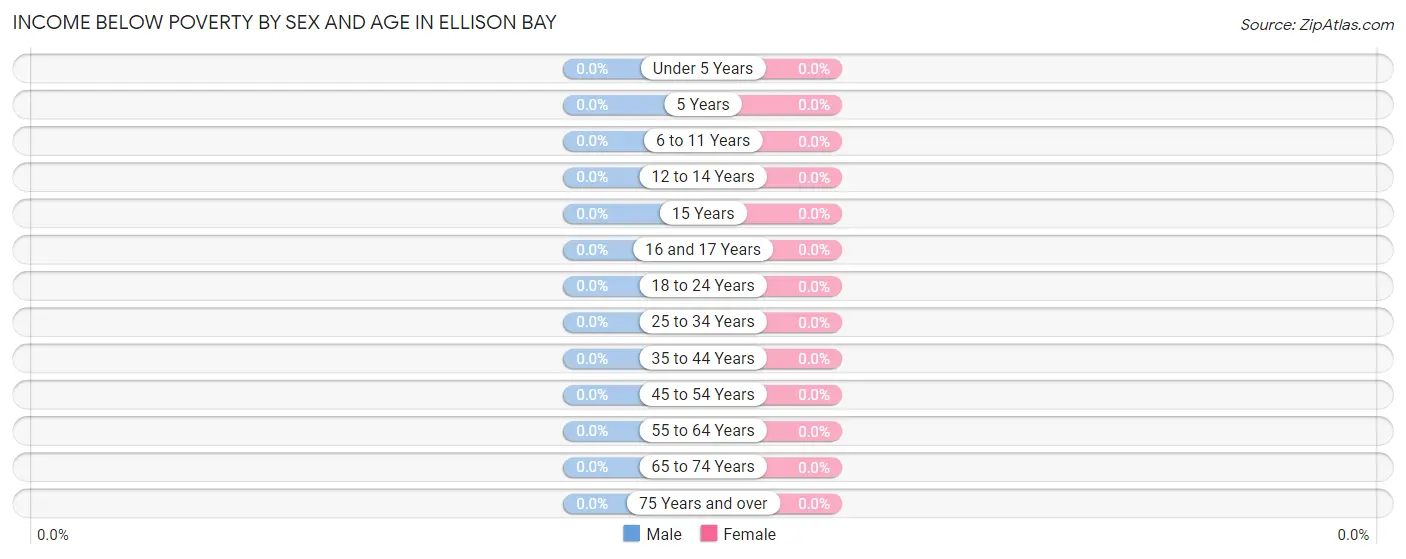
| Age Bracket | Male | Female |
| Under 5 Years | 0 (0.0%) | 0 (0.0%) |
| 5 Years | 0 (0.0%) | 0 (0.0%) |
| 6 to 11 Years | 0 (0.0%) | 0 (0.0%) |
| 12 to 14 Years | 0 (0.0%) | 0 (0.0%) |
| 15 Years | 0 (0.0%) | 0 (0.0%) |
| 16 and 17 Years | 0 (0.0%) | 0 (0.0%) |
| 18 to 24 Years | 0 (0.0%) | 0 (0.0%) |
| 25 to 34 Years | 0 (0.0%) | 0 (0.0%) |
| 35 to 44 Years | 0 (0.0%) | 0 (0.0%) |
| 45 to 54 Years | 0 (0.0%) | 0 (0.0%) |
| 55 to 64 Years | 0 (0.0%) | 0 (0.0%) |
| 65 to 74 Years | 0 (0.0%) | 0 (0.0%) |
| 75 Years and over | 0 (0.0%) | 0 (0.0%) |
| Total | 0 (0.0%) | 0 (0.0%) |
Income Above Poverty by Sex and Age in Ellison Bay
According to the poverty statistics in Ellison Bay, males aged under 5 years and females aged under 5 years are the age groups that are most secure financially, with 100.0% of males and 100.0% of females in these age groups living above the poverty line.
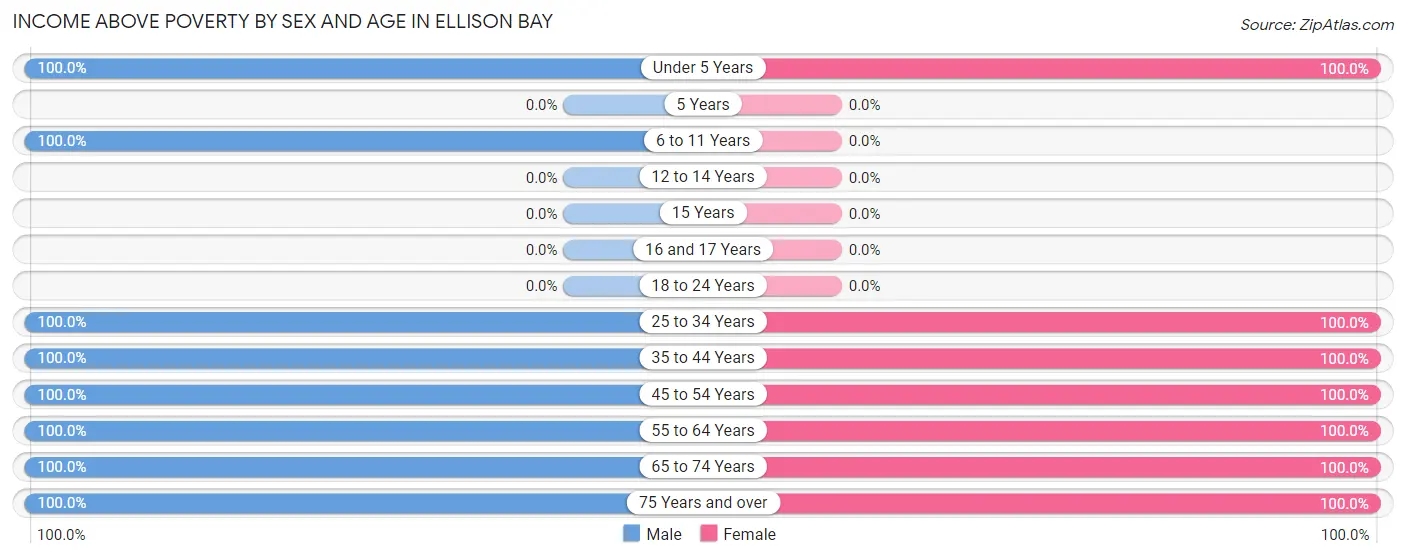
| Age Bracket | Male | Female |
| Under 5 Years | 10 (100.0%) | 12 (100.0%) |
| 5 Years | 0 (0.0%) | 0 (0.0%) |
| 6 to 11 Years | 4 (100.0%) | 0 (0.0%) |
| 12 to 14 Years | 0 (0.0%) | 0 (0.0%) |
| 15 Years | 0 (0.0%) | 0 (0.0%) |
| 16 and 17 Years | 0 (0.0%) | 0 (0.0%) |
| 18 to 24 Years | 0 (0.0%) | 0 (0.0%) |
| 25 to 34 Years | 7 (100.0%) | 14 (100.0%) |
| 35 to 44 Years | 6 (100.0%) | 5 (100.0%) |
| 45 to 54 Years | 5 (100.0%) | 5 (100.0%) |
| 55 to 64 Years | 10 (100.0%) | 30 (100.0%) |
| 65 to 74 Years | 7 (100.0%) | 11 (100.0%) |
| 75 Years and over | 10 (100.0%) | 6 (100.0%) |
| Total | 59 (100.0%) | 83 (100.0%) |
Income Below Poverty Among Married-Couple Families in Ellison Bay
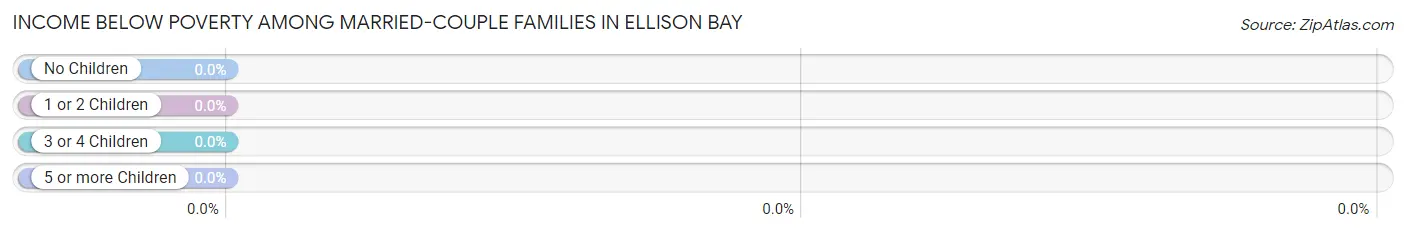
| Children | Above Poverty | Below Poverty |
| No Children | 29 (100.0%) | 0 (0.0%) |
| 1 or 2 Children | 7 (100.0%) | 0 (0.0%) |
| 3 or 4 Children | 7 (100.0%) | 0 (0.0%) |
| 5 or more Children | 0 (0.0%) | 0 (0.0%) |
| Total | 43 (100.0%) | 0 (0.0%) |
Income Below Poverty Among Single-Parent Households in Ellison Bay
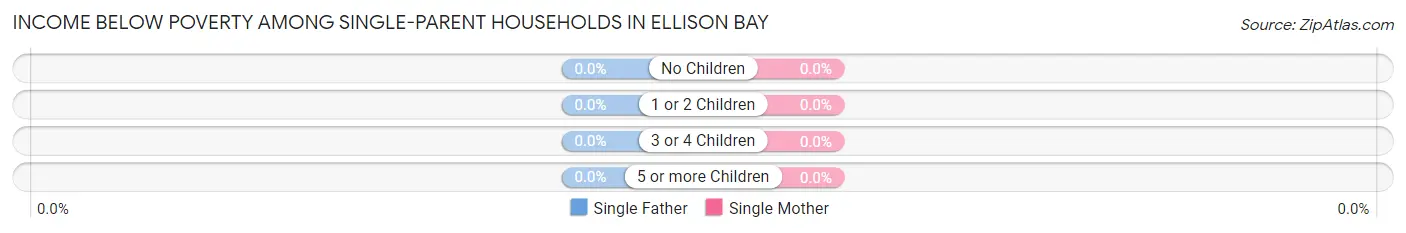
| Children | Single Father | Single Mother |
| No Children | 0 (0.0%) | 0 (0.0%) |
| 1 or 2 Children | 0 (0.0%) | 0 (0.0%) |
| 3 or 4 Children | 0 (0.0%) | 0 (0.0%) |
| 5 or more Children | 0 (0.0%) | 0 (0.0%) |
| Total | 0 (0.0%) | 0 (0.0%) |
Income Below Poverty Among Married-Couple vs Single-Parent Households in Ellison Bay
| Children | Married-Couple Families | Single-Parent Households |
| No Children | 0 (0.0%) | 0 (0.0%) |
| 1 or 2 Children | 0 (0.0%) | 0 (0.0%) |
| 3 or 4 Children | 0 (0.0%) | 0 (0.0%) |
| 5 or more Children | 0 (0.0%) | 0 (0.0%) |
| Total | 0 (0.0%) | 0 (0.0%) |
Employment Characteristics in Ellison Bay
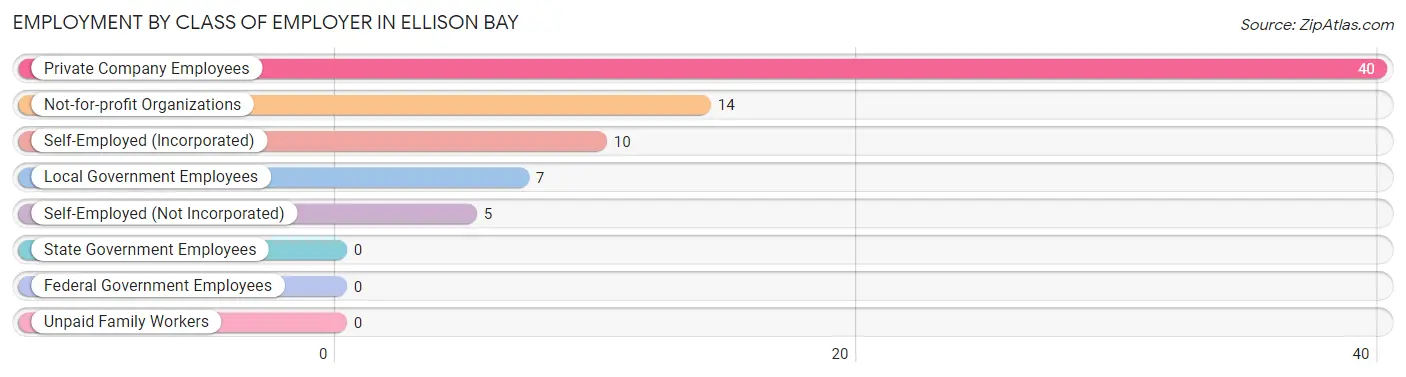
Employment by Class of Employer in Ellison Bay
Among the 76 employed individuals in Ellison Bay, private company employees (40 | 52.6%), not-for-profit organizations (14 | 18.4%), and self-employed (incorporated) (10 | 13.2%) make up the most common classes of employment.
| Employer Class | # Employees | % Employees |
| Private Company Employees | 40 | 52.6% |
| Self-Employed (Incorporated) | 10 | 13.2% |
| Self-Employed (Not Incorporated) | 5 | 6.6% |
| Not-for-profit Organizations | 14 | 18.4% |
| Local Government Employees | 7 | 9.2% |
| State Government Employees | 0 | 0.0% |
| Federal Government Employees | 0 | 0.0% |
| Unpaid Family Workers | 0 | 0.0% |
| Total | 76 | 100.0% |
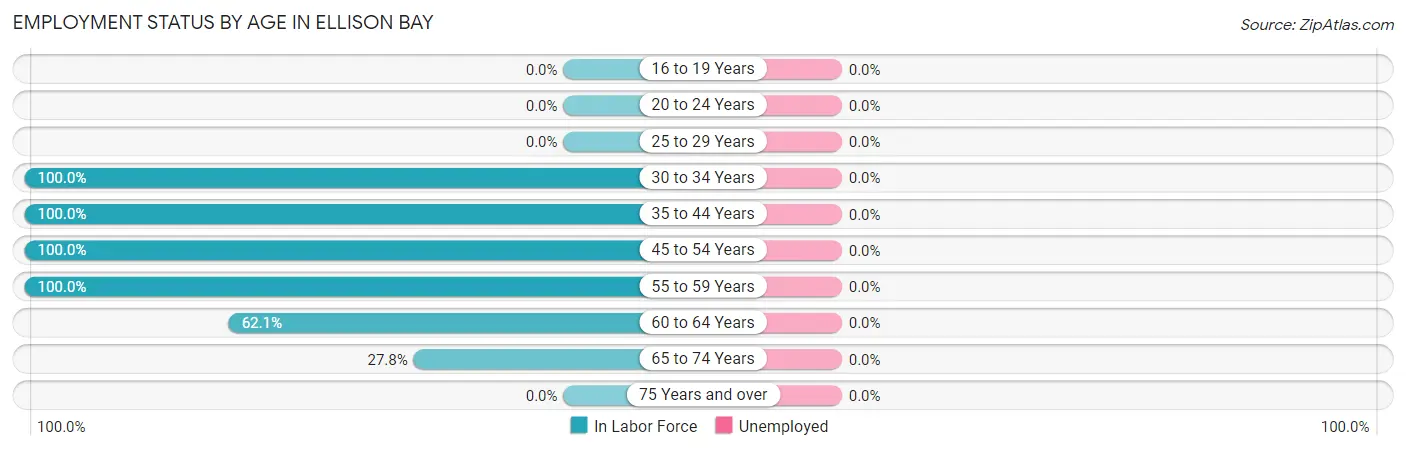
Employment Status by Age in Ellison Bay
| Age Bracket | In Labor Force | Unemployed |
| 16 to 19 Years | 0 (0.0%) | 0 (0.0%) |
| 20 to 24 Years | 0 (0.0%) | 0 (0.0%) |
| 25 to 29 Years | 0 (0.0%) | 0 (0.0%) |
| 30 to 34 Years | 21 (100.0%) | 0 (0.0%) |
| 35 to 44 Years | 11 (100.0%) | 0 (0.0%) |
| 45 to 54 Years | 10 (100.0%) | 0 (0.0%) |
| 55 to 59 Years | 11 (100.0%) | 0 (0.0%) |
| 60 to 64 Years | 18 (62.1%) | 0 (0.0%) |
| 65 to 74 Years | 5 (27.8%) | 0 (0.0%) |
| 75 Years and over | 0 (0.0%) | 0 (0.0%) |
| Total | 76 (65.5%) | 0 (0.0%) |
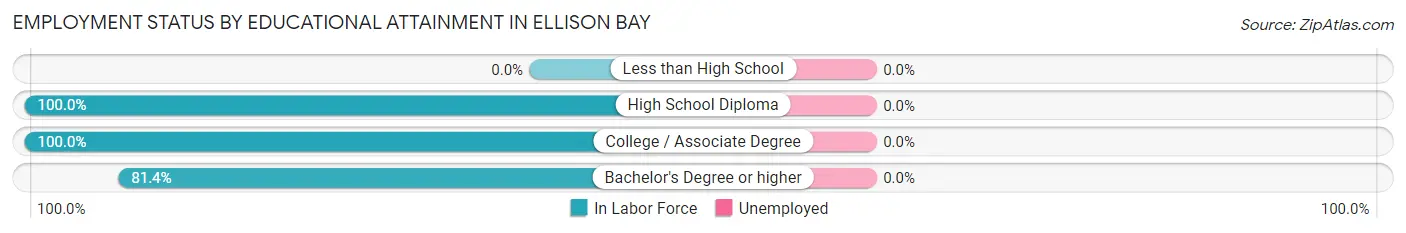
Employment Status by Educational Attainment in Ellison Bay
| Educational Attainment | In Labor Force | Unemployed |
| Less than High School | 0 (0.0%) | 0 (0.0%) |
| High School Diploma | 10 (100.0%) | 0 (0.0%) |
| College / Associate Degree | 13 (100.0%) | 0 (0.0%) |
| Bachelor's Degree or higher | 48 (81.4%) | 0 (0.0%) |
| Total | 71 (86.6%) | 0 (0.0%) |
Employment Occupations by Sex in Ellison Bay
Management, Business, Science and Arts Occupations
The most common Management, Business, Science and Arts occupations in Ellison Bay are Management (40 | 52.6%), Community & Social Service (12 | 15.8%), Education Instruction & Library (7 | 9.2%), and Legal Services & Support (5 | 6.6%).
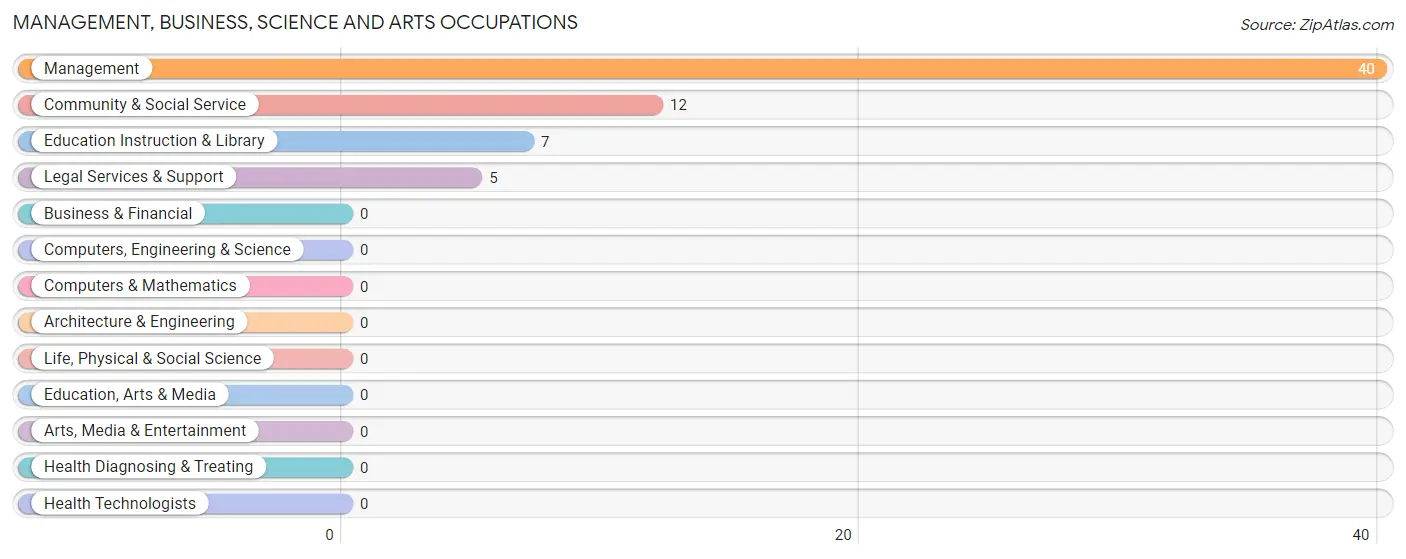
Management, Business, Science and Arts Occupations by Sex
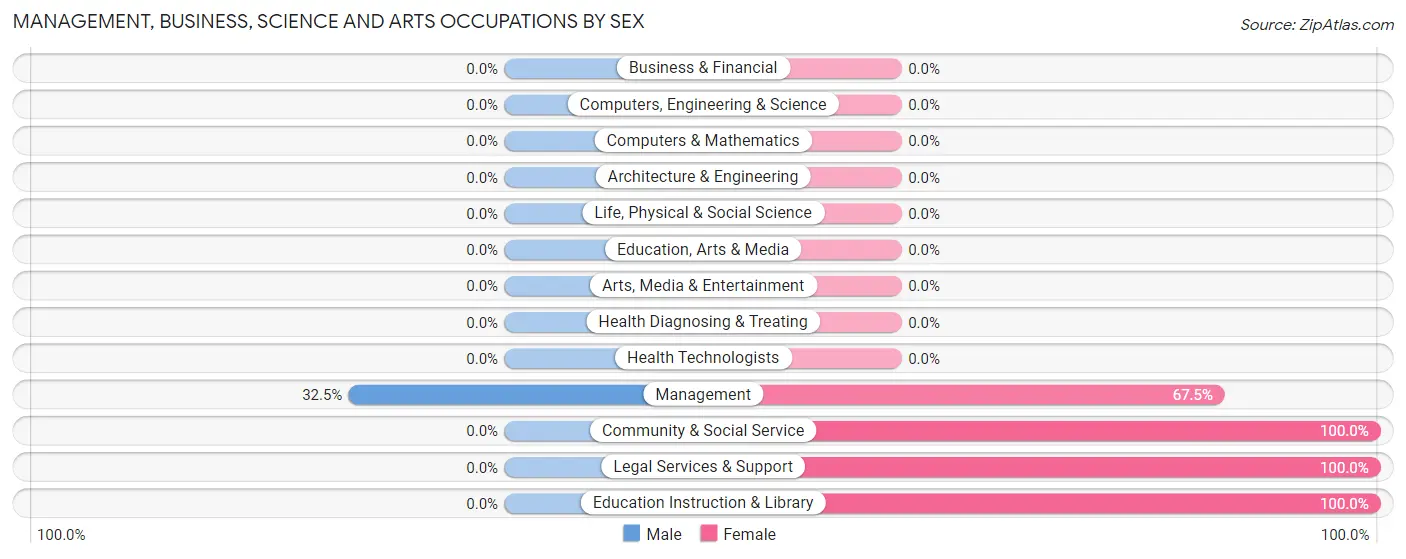
| Occupation | Male | Female |
| Management | 13 (32.5%) | 27 (67.5%) |
| Business & Financial | 0 (0.0%) | 0 (0.0%) |
| Computers, Engineering & Science | 0 (0.0%) | 0 (0.0%) |
| Computers & Mathematics | 0 (0.0%) | 0 (0.0%) |
| Architecture & Engineering | 0 (0.0%) | 0 (0.0%) |
| Life, Physical & Social Science | 0 (0.0%) | 0 (0.0%) |
| Community & Social Service | 0 (0.0%) | 12 (100.0%) |
| Education, Arts & Media | 0 (0.0%) | 0 (0.0%) |
| Legal Services & Support | 0 (0.0%) | 5 (100.0%) |
| Education Instruction & Library | 0 (0.0%) | 7 (100.0%) |
| Arts, Media & Entertainment | 0 (0.0%) | 0 (0.0%) |
| Health Diagnosing & Treating | 0 (0.0%) | 0 (0.0%) |
| Health Technologists | 0 (0.0%) | 0 (0.0%) |
| Total (Category) | 13 (25.0%) | 39 (75.0%) |
| Total (Overall) | 28 (36.8%) | 48 (63.2%) |
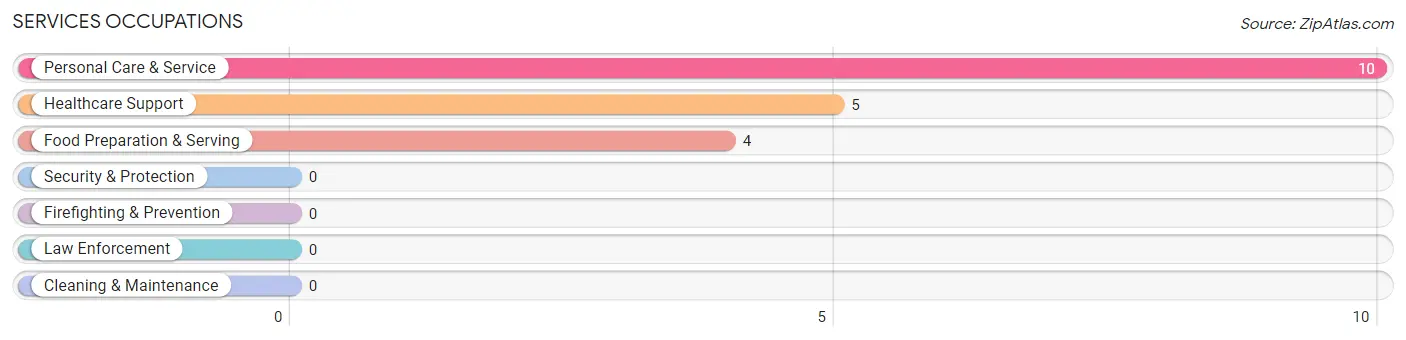
Services Occupations
The most common Services occupations in Ellison Bay are Personal Care & Service (10 | 13.2%), Healthcare Support (5 | 6.6%), and Food Preparation & Serving (4 | 5.3%).
Services Occupations by Sex
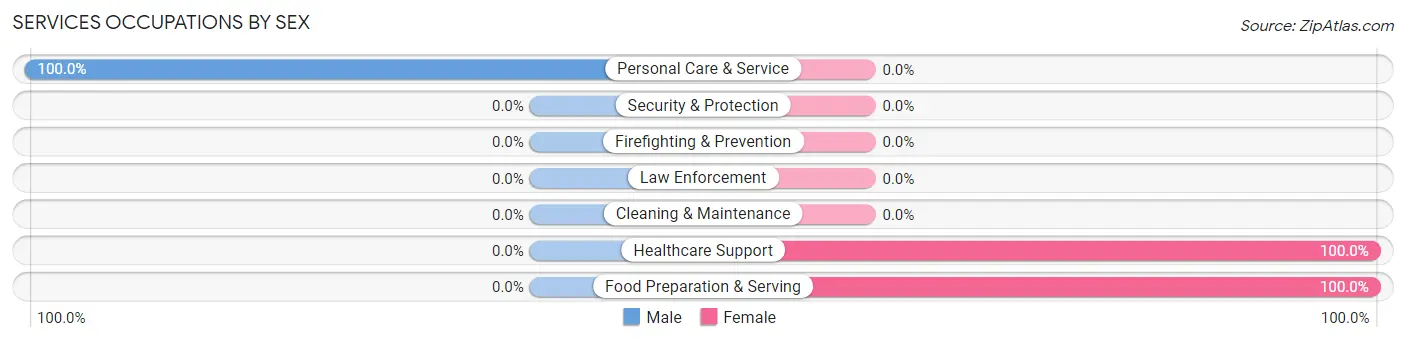
| Occupation | Male | Female |
| Healthcare Support | 0 (0.0%) | 5 (100.0%) |
| Security & Protection | 0 (0.0%) | 0 (0.0%) |
| Firefighting & Prevention | 0 (0.0%) | 0 (0.0%) |
| Law Enforcement | 0 (0.0%) | 0 (0.0%) |
| Food Preparation & Serving | 0 (0.0%) | 4 (100.0%) |
| Cleaning & Maintenance | 0 (0.0%) | 0 (0.0%) |
| Personal Care & Service | 10 (100.0%) | 0 (0.0%) |
| Total (Category) | 10 (52.6%) | 9 (47.4%) |
| Total (Overall) | 28 (36.8%) | 48 (63.2%) |
Sales and Office Occupations
Sales and Office Occupations by Sex
| Occupation | Male | Female |
| Sales & Related | 0 (0.0%) | 0 (0.0%) |
| Office & Administration | 0 (0.0%) | 0 (0.0%) |
| Total (Category) | 0 (0.0%) | 0 (0.0%) |
| Total (Overall) | 28 (36.8%) | 48 (63.2%) |
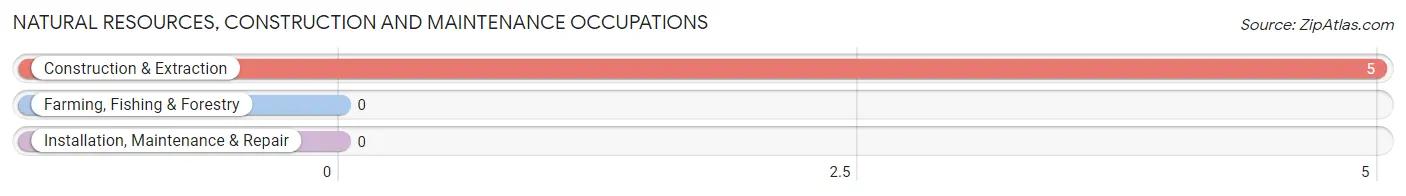
Natural Resources, Construction and Maintenance Occupations
The most common Natural Resources, Construction and Maintenance occupations in Ellison Bay are , and Construction & Extraction (5 | 6.6%).
Natural Resources, Construction and Maintenance Occupations by Sex
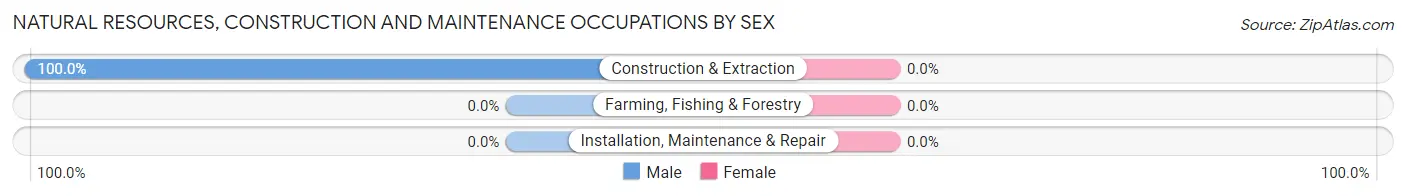
| Occupation | Male | Female |
| Farming, Fishing & Forestry | 0 (0.0%) | 0 (0.0%) |
| Construction & Extraction | 5 (100.0%) | 0 (0.0%) |
| Installation, Maintenance & Repair | 0 (0.0%) | 0 (0.0%) |
| Total (Category) | 5 (100.0%) | 0 (0.0%) |
| Total (Overall) | 28 (36.8%) | 48 (63.2%) |
Production, Transportation and Moving Occupations
Production, Transportation and Moving Occupations by Sex
| Occupation | Male | Female |
| Production | 0 (0.0%) | 0 (0.0%) |
| Transportation | 0 (0.0%) | 0 (0.0%) |
| Material Moving | 0 (0.0%) | 0 (0.0%) |
| Total (Category) | 0 (0.0%) | 0 (0.0%) |
| Total (Overall) | 28 (36.8%) | 48 (63.2%) |
Employment Industries by Sex in Ellison Bay
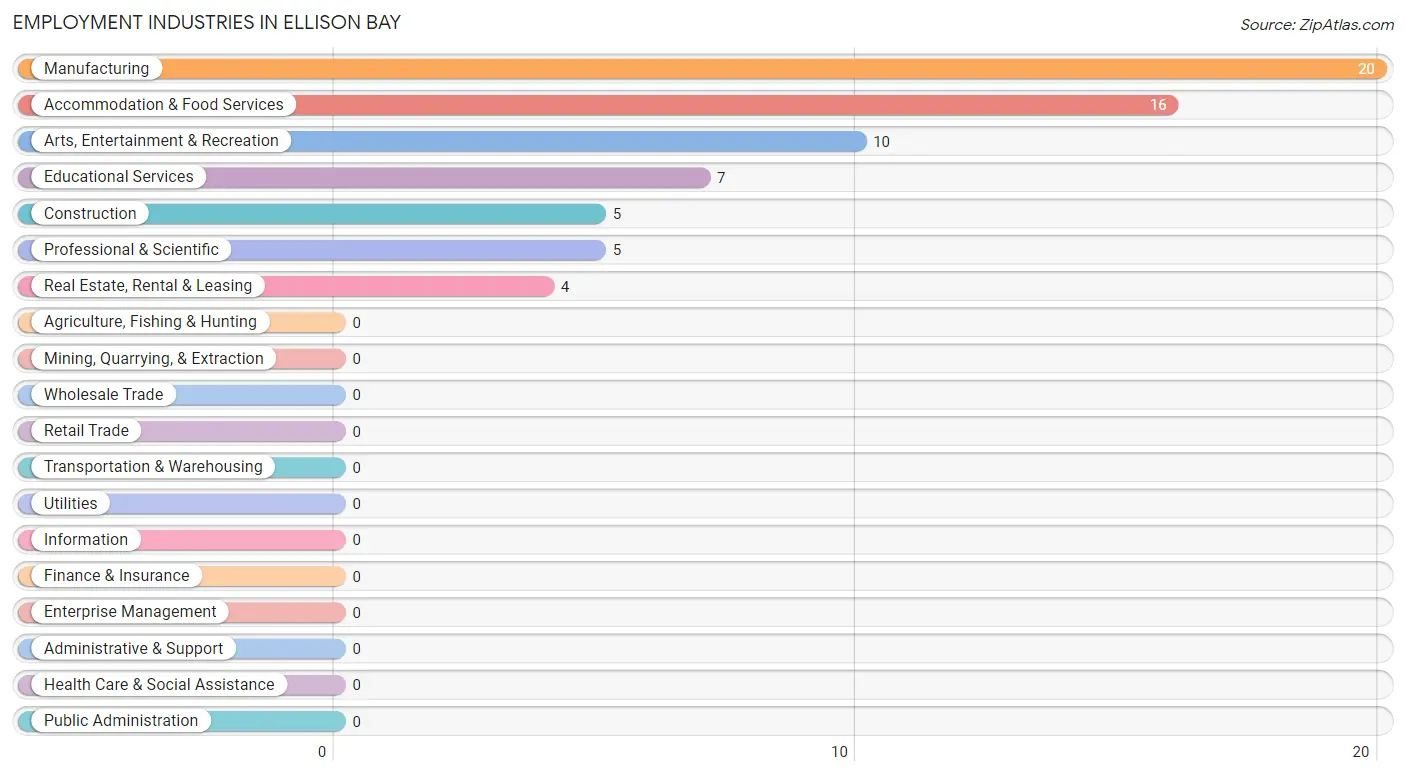
Employment Industries in Ellison Bay
The major employment industries in Ellison Bay include Manufacturing (20 | 26.3%), Accommodation & Food Services (16 | 21.0%), Arts, Entertainment & Recreation (10 | 13.2%), Educational Services (7 | 9.2%), and Construction (5 | 6.6%).
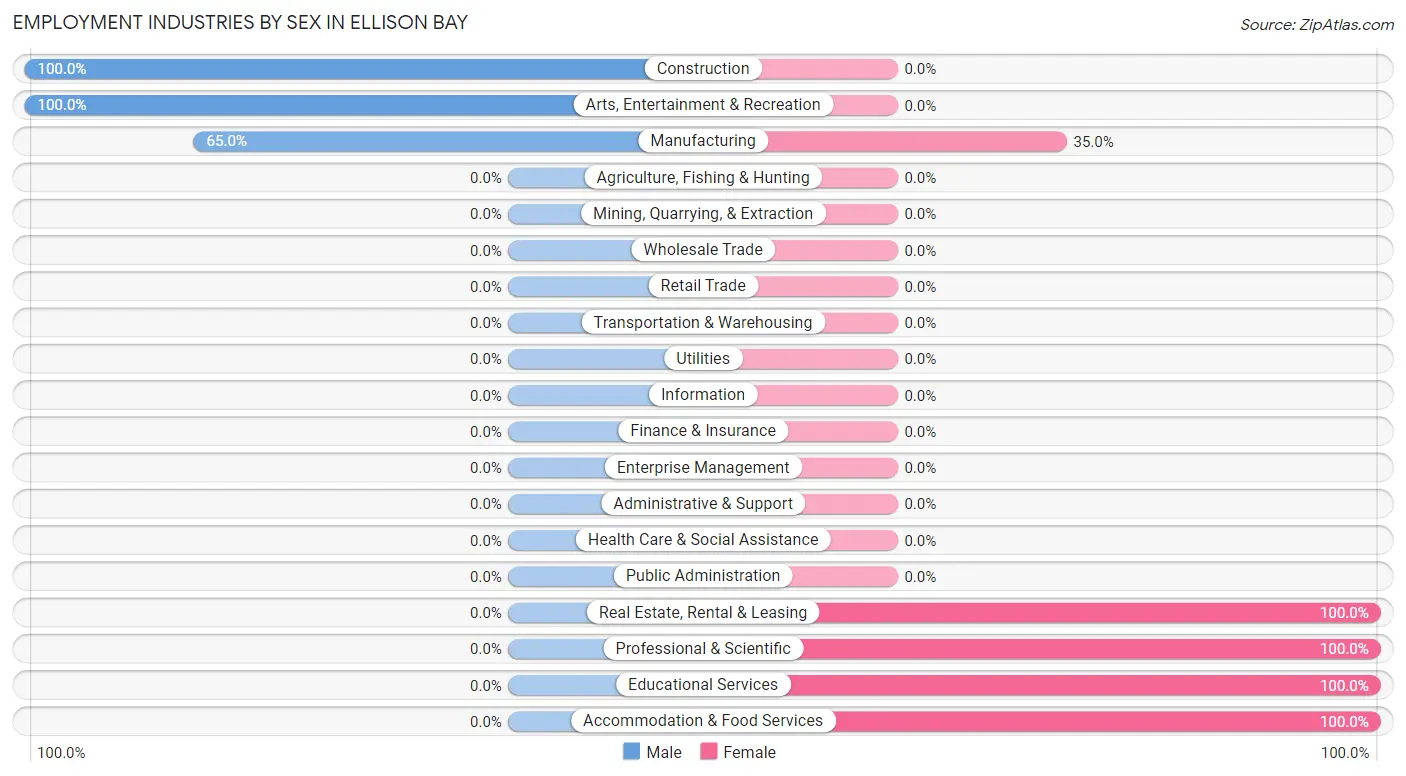
Employment Industries by Sex in Ellison Bay
The Ellison Bay industries that see more men than women are Construction (100.0%), Arts, Entertainment & Recreation (100.0%), and Manufacturing (65.0%), whereas the industries that tend to have a higher number of women are Real Estate, Rental & Leasing (100.0%), Professional & Scientific (100.0%), and Educational Services (100.0%).
| Industry | Male | Female |
| Agriculture, Fishing & Hunting | 0 (0.0%) | 0 (0.0%) |
| Mining, Quarrying, & Extraction | 0 (0.0%) | 0 (0.0%) |
| Construction | 5 (100.0%) | 0 (0.0%) |
| Manufacturing | 13 (65.0%) | 7 (35.0%) |
| Wholesale Trade | 0 (0.0%) | 0 (0.0%) |
| Retail Trade | 0 (0.0%) | 0 (0.0%) |
| Transportation & Warehousing | 0 (0.0%) | 0 (0.0%) |
| Utilities | 0 (0.0%) | 0 (0.0%) |
| Information | 0 (0.0%) | 0 (0.0%) |
| Finance & Insurance | 0 (0.0%) | 0 (0.0%) |
| Real Estate, Rental & Leasing | 0 (0.0%) | 4 (100.0%) |
| Professional & Scientific | 0 (0.0%) | 5 (100.0%) |
| Enterprise Management | 0 (0.0%) | 0 (0.0%) |
| Administrative & Support | 0 (0.0%) | 0 (0.0%) |
| Educational Services | 0 (0.0%) | 7 (100.0%) |
| Health Care & Social Assistance | 0 (0.0%) | 0 (0.0%) |
| Arts, Entertainment & Recreation | 10 (100.0%) | 0 (0.0%) |
| Accommodation & Food Services | 0 (0.0%) | 16 (100.0%) |
| Public Administration | 0 (0.0%) | 0 (0.0%) |
| Total | 28 (36.8%) | 48 (63.2%) |
Education in Ellison Bay
School Enrollment in Ellison Bay
The most common levels of schooling among the 18 students in Ellison Bay are nursery / preschool (10 | 55.6%), elementary school (4 | 22.2%), and college / undergraduate (4 | 22.2%).
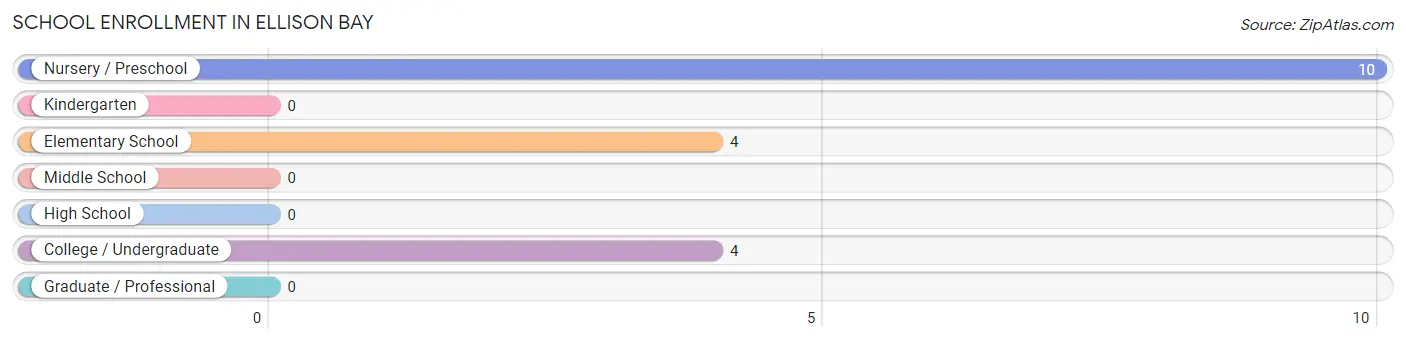
| School Level | # Students | % Students |
| Nursery / Preschool | 10 | 55.6% |
| Kindergarten | 0 | 0.0% |
| Elementary School | 4 | 22.2% |
| Middle School | 0 | 0.0% |
| High School | 0 | 0.0% |
| College / Undergraduate | 4 | 22.2% |
| Graduate / Professional | 0 | 0.0% |
| Total | 18 | 100.0% |
School Enrollment by Age by Funding Source in Ellison Bay
Out of a total of 18 students who are enrolled in schools in Ellison Bay, 10 (55.6%) attend a private institution, while the remaining 8 (44.4%) are enrolled in public schools. The age group of 3 to 4 year olds has the highest likelihood of being enrolled in private schools, with 10 (100.0% in the age bracket) enrolled. Conversely, the age group of 5 to 9 year old has the lowest likelihood of being enrolled in a private school, with 4 (100.0% in the age bracket) attending a public institution.
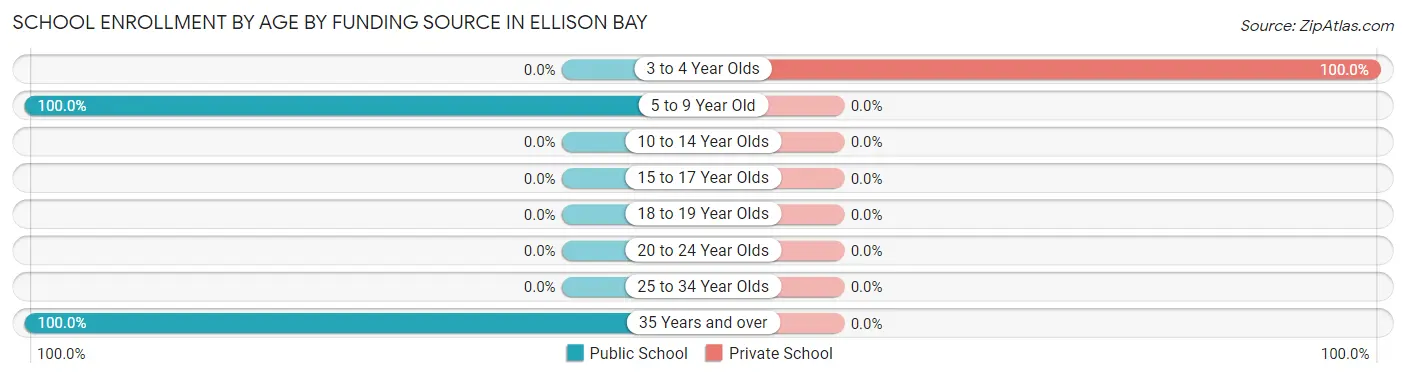
| Age Bracket | Public School | Private School |
| 3 to 4 Year Olds | 0 (0.0%) | 10 (100.0%) |
| 5 to 9 Year Old | 4 (100.0%) | 0 (0.0%) |
| 10 to 14 Year Olds | 0 (0.0%) | 0 (0.0%) |
| 15 to 17 Year Olds | 0 (0.0%) | 0 (0.0%) |
| 18 to 19 Year Olds | 0 (0.0%) | 0 (0.0%) |
| 20 to 24 Year Olds | 0 (0.0%) | 0 (0.0%) |
| 25 to 34 Year Olds | 0 (0.0%) | 0 (0.0%) |
| 35 Years and over | 4 (100.0%) | 0 (0.0%) |
| Total | 8 (44.4%) | 10 (55.6%) |
Educational Attainment by Field of Study in Ellison Bay
Business (25 | 27.2%), bio, nature & agricultural (17 | 18.5%), education (15 | 16.3%), science & technology (11 | 12.0%), and psychology (7 | 7.6%) are the most common fields of study among 92 individuals in Ellison Bay who have obtained a bachelor's degree or higher.
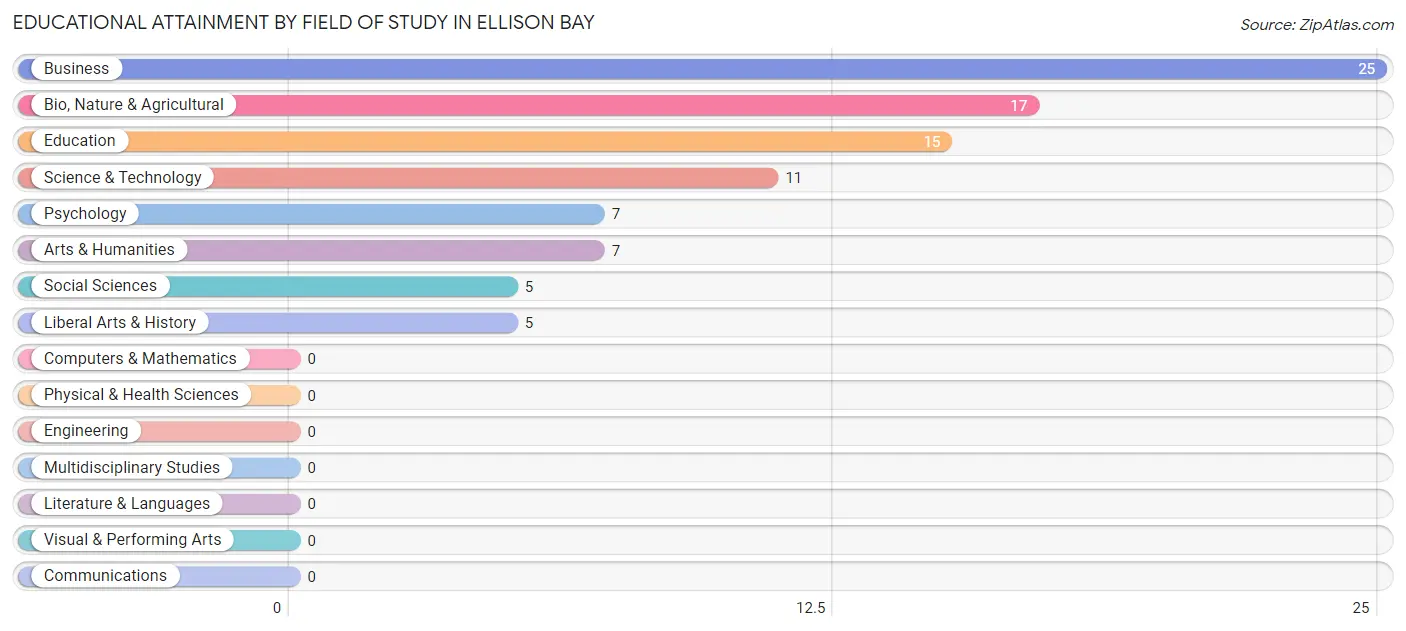
| Field of Study | # Graduates | % Graduates |
| Computers & Mathematics | 0 | 0.0% |
| Bio, Nature & Agricultural | 17 | 18.5% |
| Physical & Health Sciences | 0 | 0.0% |
| Psychology | 7 | 7.6% |
| Social Sciences | 5 | 5.4% |
| Engineering | 0 | 0.0% |
| Multidisciplinary Studies | 0 | 0.0% |
| Science & Technology | 11 | 12.0% |
| Business | 25 | 27.2% |
| Education | 15 | 16.3% |
| Literature & Languages | 0 | 0.0% |
| Liberal Arts & History | 5 | 5.4% |
| Visual & Performing Arts | 0 | 0.0% |
| Communications | 0 | 0.0% |
| Arts & Humanities | 7 | 7.6% |
| Total | 92 | 100.0% |
Transportation & Commute in Ellison Bay
Vehicle Availability by Sex in Ellison Bay
The most prevalent vehicle ownership categories in Ellison Bay are males with 3 vehicles (22, accounting for 78.6%) and females with 3 vehicles (19, making up 45.8%).
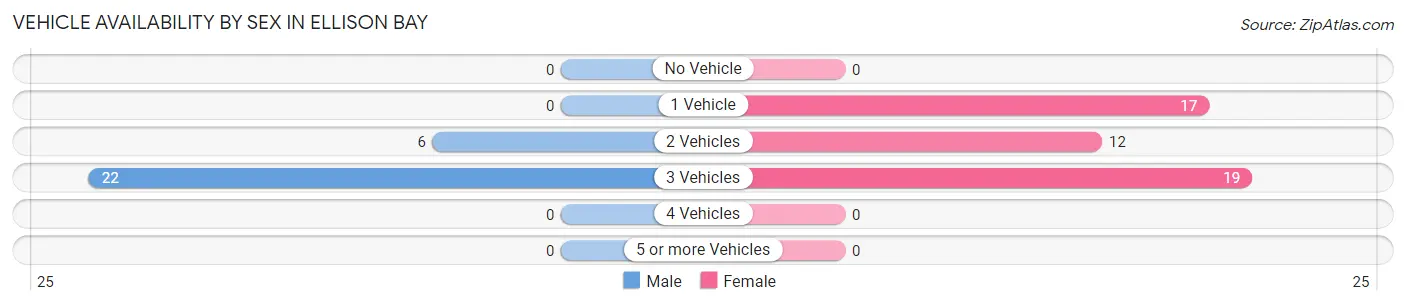
| Vehicles Available | Male | Female |
| No Vehicle | 0 (0.0%) | 0 (0.0%) |
| 1 Vehicle | 0 (0.0%) | 17 (35.4%) |
| 2 Vehicles | 6 (21.4%) | 12 (25.0%) |
| 3 Vehicles | 22 (78.6%) | 19 (39.6%) |
| 4 Vehicles | 0 (0.0%) | 0 (0.0%) |
| 5 or more Vehicles | 0 (0.0%) | 0 (0.0%) |
| Total | 28 (100.0%) | 48 (100.0%) |
Commute Time in Ellison Bay
The most frequently occuring commute durations in Ellison Bay are 10 to 14 minutes (33 commuters, 49.2%), less than 5 minutes (18 commuters, 26.9%), and 30 to 34 minutes (12 commuters, 17.9%).
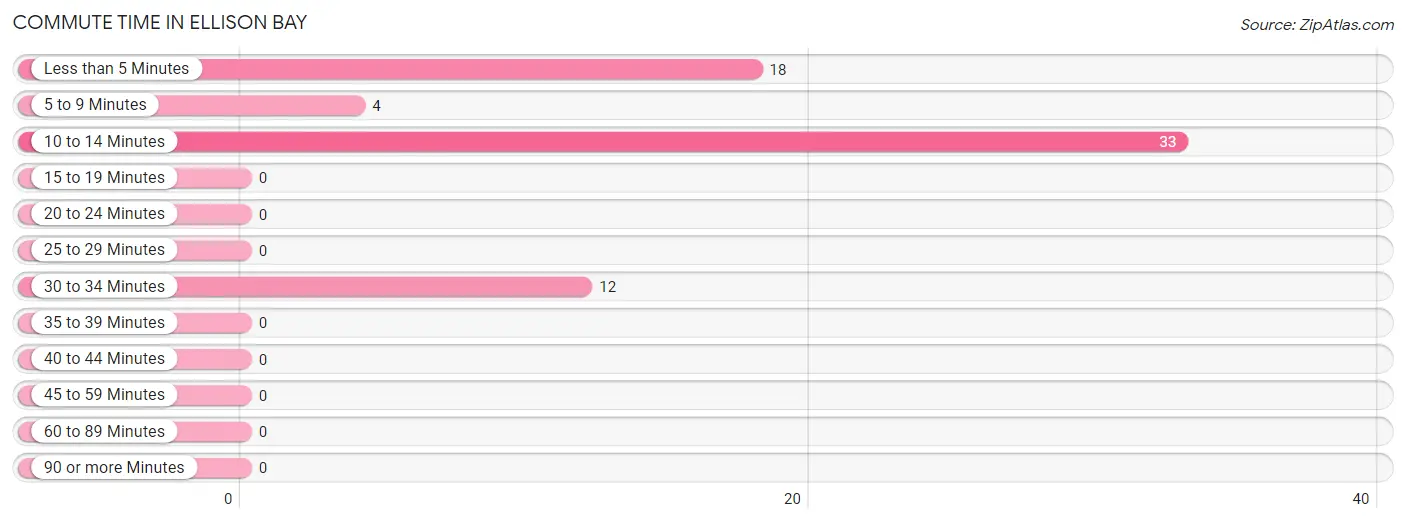
| Commute Time | # Commuters | % Commuters |
| Less than 5 Minutes | 18 | 26.9% |
| 5 to 9 Minutes | 4 | 6.0% |
| 10 to 14 Minutes | 33 | 49.2% |
| 15 to 19 Minutes | 0 | 0.0% |
| 20 to 24 Minutes | 0 | 0.0% |
| 25 to 29 Minutes | 0 | 0.0% |
| 30 to 34 Minutes | 12 | 17.9% |
| 35 to 39 Minutes | 0 | 0.0% |
| 40 to 44 Minutes | 0 | 0.0% |
| 45 to 59 Minutes | 0 | 0.0% |
| 60 to 89 Minutes | 0 | 0.0% |
| 90 or more Minutes | 0 | 0.0% |
Commute Time by Sex in Ellison Bay
The most common commute times in Ellison Bay are 30 to 34 minutes (12 commuters, 42.9%) for males and 10 to 14 minutes (23 commuters, 59.0%) for females.
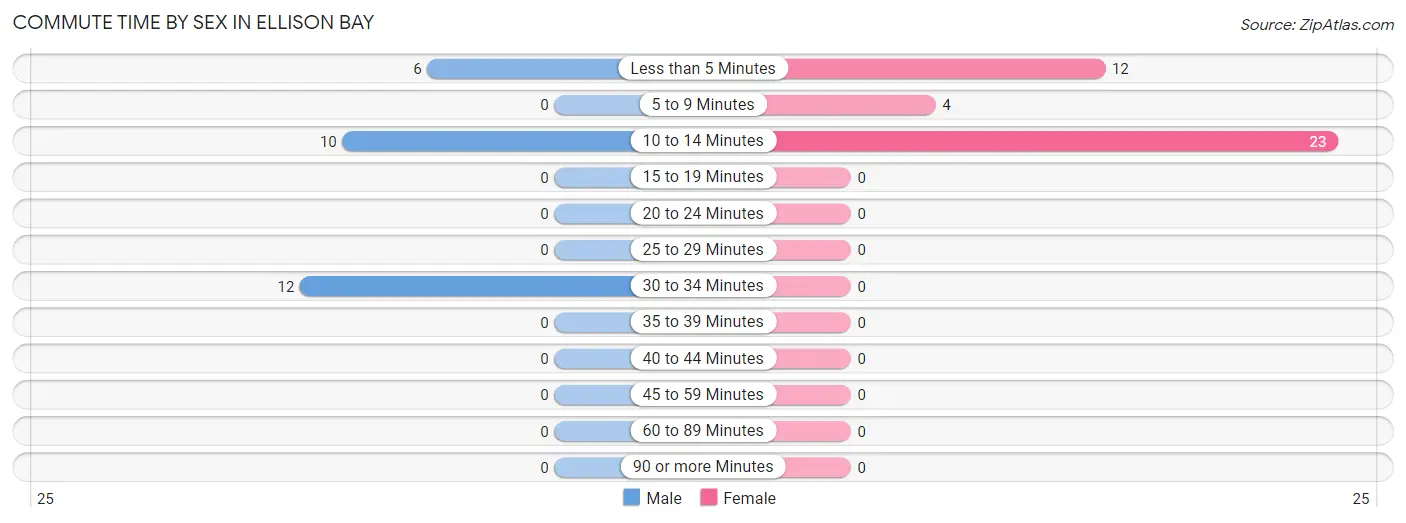
| Commute Time | Male | Female |
| Less than 5 Minutes | 6 (21.4%) | 12 (30.8%) |
| 5 to 9 Minutes | 0 (0.0%) | 4 (10.3%) |
| 10 to 14 Minutes | 10 (35.7%) | 23 (59.0%) |
| 15 to 19 Minutes | 0 (0.0%) | 0 (0.0%) |
| 20 to 24 Minutes | 0 (0.0%) | 0 (0.0%) |
| 25 to 29 Minutes | 0 (0.0%) | 0 (0.0%) |
| 30 to 34 Minutes | 12 (42.9%) | 0 (0.0%) |
| 35 to 39 Minutes | 0 (0.0%) | 0 (0.0%) |
| 40 to 44 Minutes | 0 (0.0%) | 0 (0.0%) |
| 45 to 59 Minutes | 0 (0.0%) | 0 (0.0%) |
| 60 to 89 Minutes | 0 (0.0%) | 0 (0.0%) |
| 90 or more Minutes | 0 (0.0%) | 0 (0.0%) |
Time of Departure to Work by Sex in Ellison Bay
The most frequent times of departure to work in Ellison Bay are 10:00 AM to 10:59 AM (16, 57.1%) for males and 9:00 AM to 9:59 AM (12, 30.8%) for females.
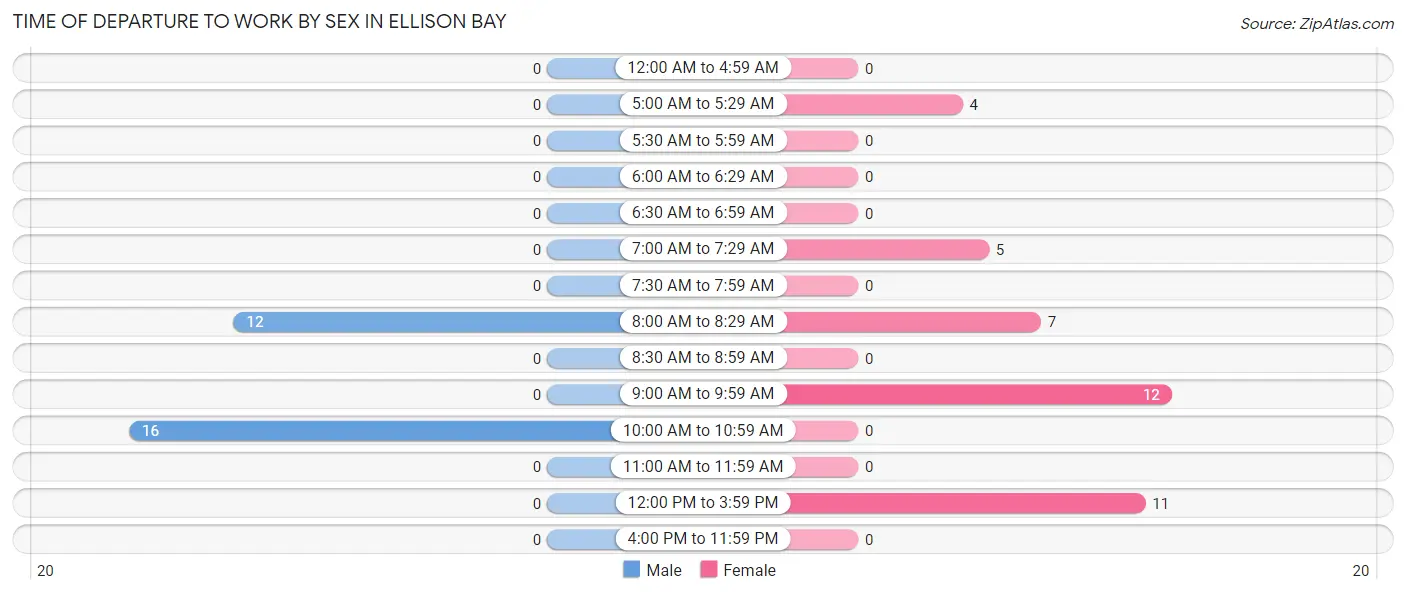
| Time of Departure | Male | Female |
| 12:00 AM to 4:59 AM | 0 (0.0%) | 0 (0.0%) |
| 5:00 AM to 5:29 AM | 0 (0.0%) | 4 (10.3%) |
| 5:30 AM to 5:59 AM | 0 (0.0%) | 0 (0.0%) |
| 6:00 AM to 6:29 AM | 0 (0.0%) | 0 (0.0%) |
| 6:30 AM to 6:59 AM | 0 (0.0%) | 0 (0.0%) |
| 7:00 AM to 7:29 AM | 0 (0.0%) | 5 (12.8%) |
| 7:30 AM to 7:59 AM | 0 (0.0%) | 0 (0.0%) |
| 8:00 AM to 8:29 AM | 12 (42.9%) | 7 (17.9%) |
| 8:30 AM to 8:59 AM | 0 (0.0%) | 0 (0.0%) |
| 9:00 AM to 9:59 AM | 0 (0.0%) | 12 (30.8%) |
| 10:00 AM to 10:59 AM | 16 (57.1%) | 0 (0.0%) |
| 11:00 AM to 11:59 AM | 0 (0.0%) | 0 (0.0%) |
| 12:00 PM to 3:59 PM | 0 (0.0%) | 11 (28.2%) |
| 4:00 PM to 11:59 PM | 0 (0.0%) | 0 (0.0%) |
| Total | 28 (100.0%) | 39 (100.0%) |
Housing Occupancy in Ellison Bay
Occupancy by Ownership in Ellison Bay
Of the total 72 dwellings in Ellison Bay, owner-occupied units account for 67 (93.1%), while renter-occupied units make up 5 (6.9%).
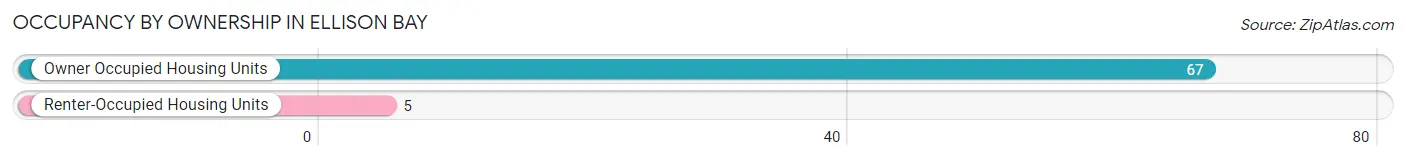
| Occupancy | # Housing Units | % Housing Units |
| Owner Occupied Housing Units | 67 | 93.1% |
| Renter-Occupied Housing Units | 5 | 6.9% |
| Total Occupied Housing Units | 72 | 100.0% |
Occupancy by Household Size in Ellison Bay
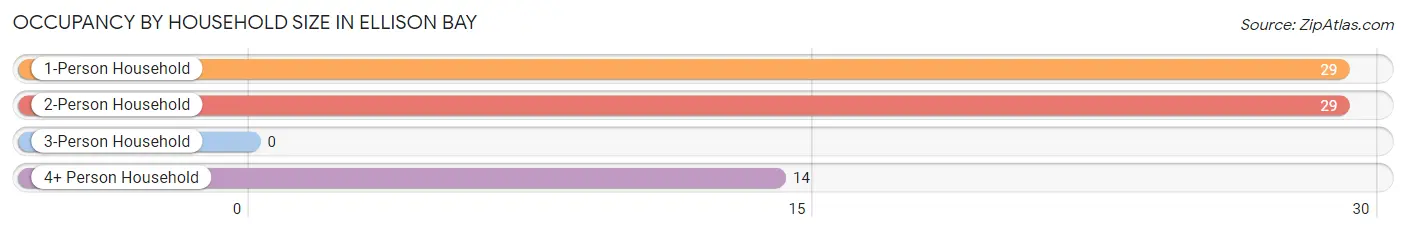
| Household Size | # Housing Units | % Housing Units |
| 1-Person Household | 29 | 40.3% |
| 2-Person Household | 29 | 40.3% |
| 3-Person Household | 0 | 0.0% |
| 4+ Person Household | 14 | 19.4% |
| Total Housing Units | 72 | 100.0% |
Occupancy by Ownership by Household Size in Ellison Bay
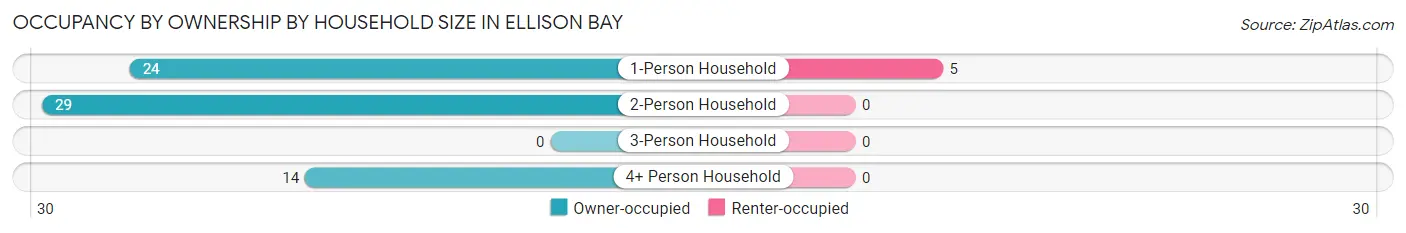
| Household Size | Owner-occupied | Renter-occupied |
| 1-Person Household | 24 (82.8%) | 5 (17.2%) |
| 2-Person Household | 29 (100.0%) | 0 (0.0%) |
| 3-Person Household | 0 (0.0%) | 0 (0.0%) |
| 4+ Person Household | 14 (100.0%) | 0 (0.0%) |
| Total Housing Units | 67 (93.1%) | 5 (6.9%) |
Occupancy by Educational Attainment in Ellison Bay
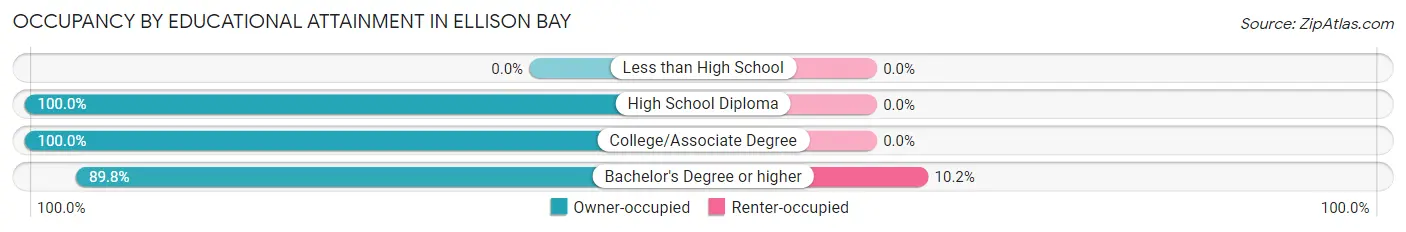
| Household Size | Owner-occupied | Renter-occupied |
| Less than High School | 0 (0.0%) | 0 (0.0%) |
| High School Diploma | 10 (100.0%) | 0 (0.0%) |
| College/Associate Degree | 13 (100.0%) | 0 (0.0%) |
| Bachelor's Degree or higher | 44 (89.8%) | 5 (10.2%) |
Occupancy by Age of Householder in Ellison Bay
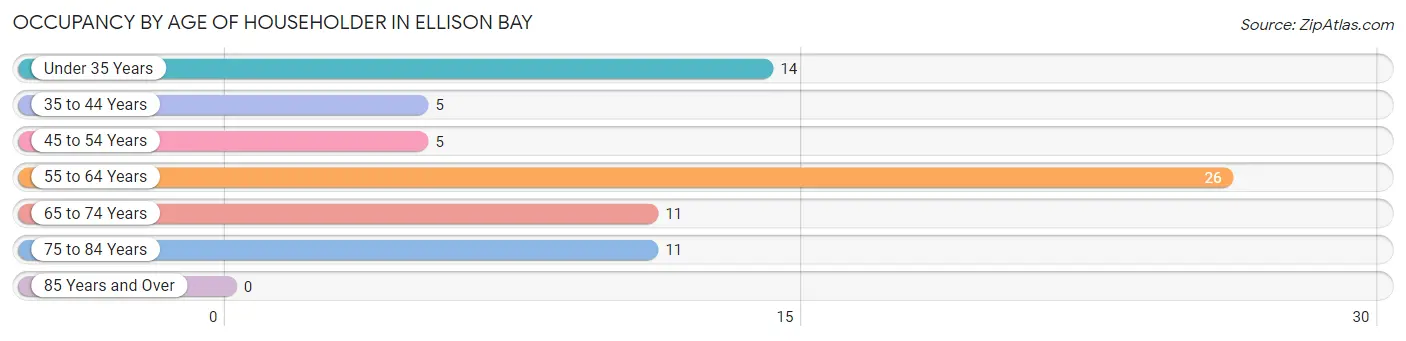
| Age Bracket | # Households | % Households |
| Under 35 Years | 14 | 19.4% |
| 35 to 44 Years | 5 | 6.9% |
| 45 to 54 Years | 5 | 6.9% |
| 55 to 64 Years | 26 | 36.1% |
| 65 to 74 Years | 11 | 15.3% |
| 75 to 84 Years | 11 | 15.3% |
| 85 Years and Over | 0 | 0.0% |
| Total | 72 | 100.0% |
Housing Finances in Ellison Bay
Median Income by Occupancy in Ellison Bay
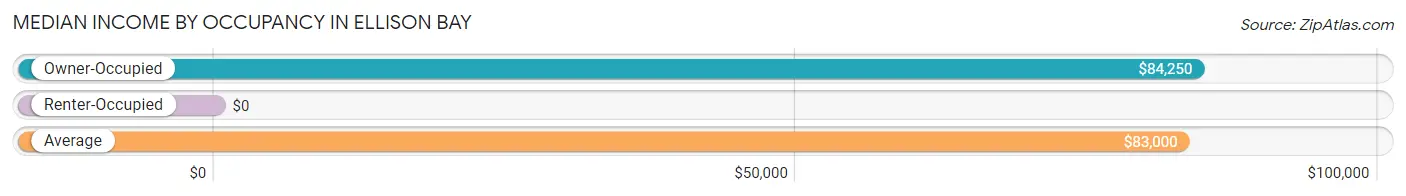
| Occupancy Type | # Households | Median Income |
| Owner-Occupied | 67 (93.1%) | $84,250 |
| Renter-Occupied | 5 (6.9%) | $0 |
| Average | 72 (100.0%) | $83,000 |
Occupancy by Householder Income Bracket in Ellison Bay
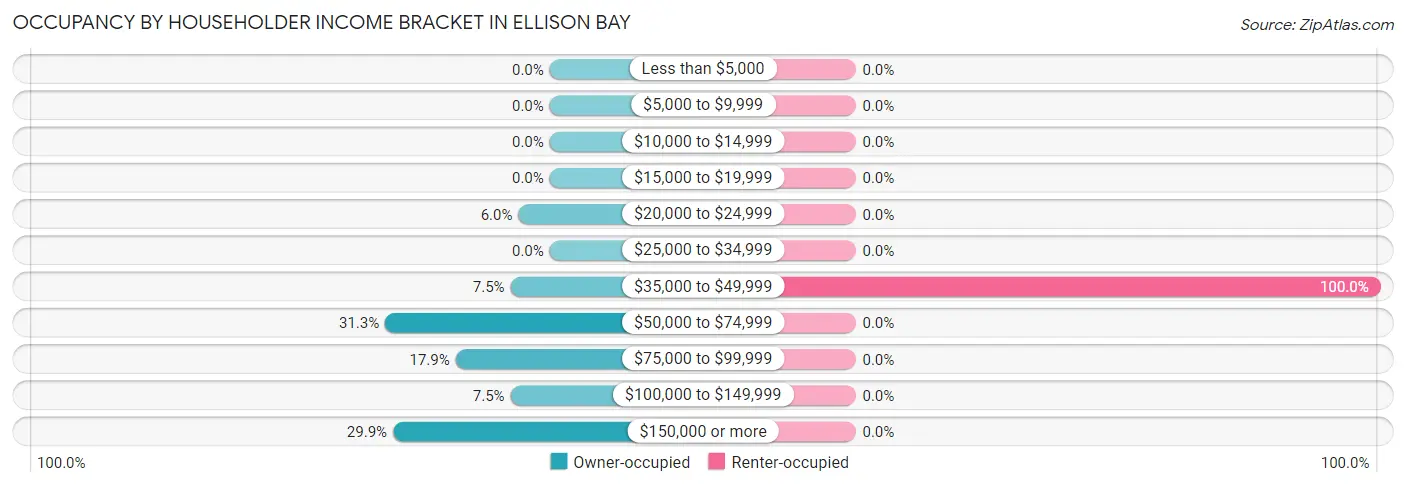
| Income Bracket | Owner-occupied | Renter-occupied |
| Less than $5,000 | 0 (0.0%) | 0 (0.0%) |
| $5,000 to $9,999 | 0 (0.0%) | 0 (0.0%) |
| $10,000 to $14,999 | 0 (0.0%) | 0 (0.0%) |
| $15,000 to $19,999 | 0 (0.0%) | 0 (0.0%) |
| $20,000 to $24,999 | 4 (6.0%) | 0 (0.0%) |
| $25,000 to $34,999 | 0 (0.0%) | 0 (0.0%) |
| $35,000 to $49,999 | 5 (7.5%) | 5 (100.0%) |
| $50,000 to $74,999 | 21 (31.3%) | 0 (0.0%) |
| $75,000 to $99,999 | 12 (17.9%) | 0 (0.0%) |
| $100,000 to $149,999 | 5 (7.5%) | 0 (0.0%) |
| $150,000 or more | 20 (29.8%) | 0 (0.0%) |
| Total | 67 (100.0%) | 5 (100.0%) |
Monthly Housing Cost Tiers in Ellison Bay
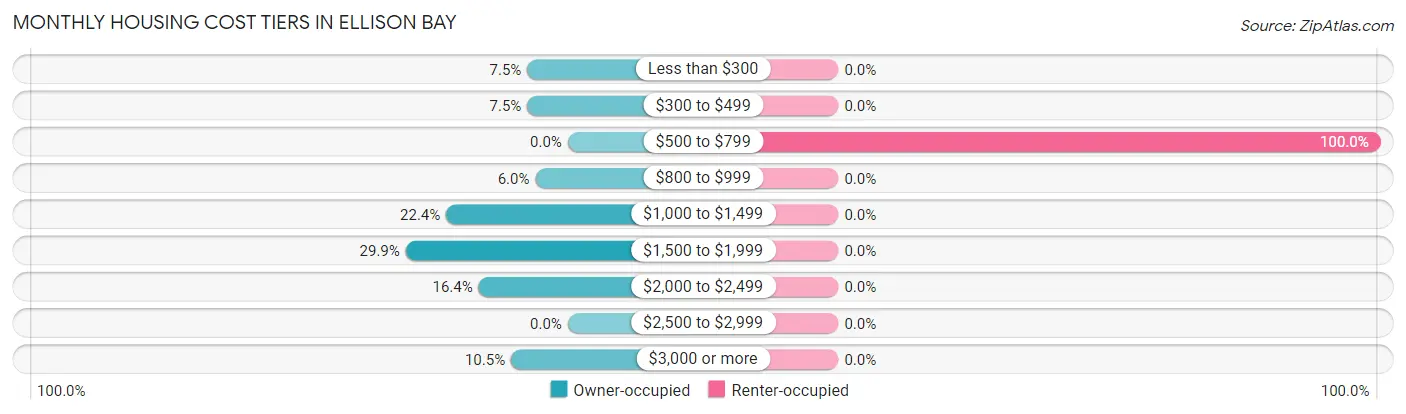
| Monthly Cost | Owner-occupied | Renter-occupied |
| Less than $300 | 5 (7.5%) | 0 (0.0%) |
| $300 to $499 | 5 (7.5%) | 0 (0.0%) |
| $500 to $799 | 0 (0.0%) | 5 (100.0%) |
| $800 to $999 | 4 (6.0%) | 0 (0.0%) |
| $1,000 to $1,499 | 15 (22.4%) | 0 (0.0%) |
| $1,500 to $1,999 | 20 (29.8%) | 0 (0.0%) |
| $2,000 to $2,499 | 11 (16.4%) | 0 (0.0%) |
| $2,500 to $2,999 | 0 (0.0%) | 0 (0.0%) |
| $3,000 or more | 7 (10.4%) | 0 (0.0%) |
| Total | 67 (100.0%) | 5 (100.0%) |
Physical Housing Characteristics in Ellison Bay
Housing Structures in Ellison Bay
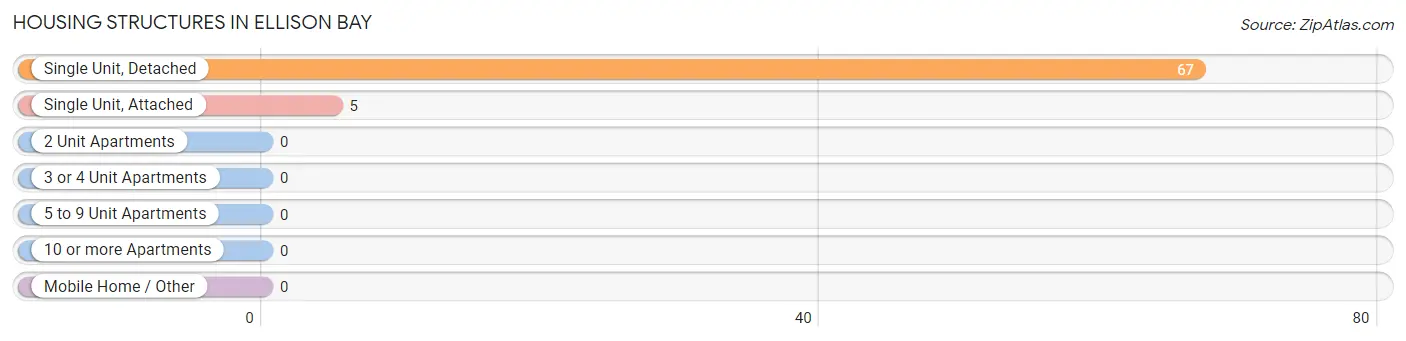
| Structure Type | # Housing Units | % Housing Units |
| Single Unit, Detached | 67 | 93.1% |
| Single Unit, Attached | 5 | 6.9% |
| 2 Unit Apartments | 0 | 0.0% |
| 3 or 4 Unit Apartments | 0 | 0.0% |
| 5 to 9 Unit Apartments | 0 | 0.0% |
| 10 or more Apartments | 0 | 0.0% |
| Mobile Home / Other | 0 | 0.0% |
| Total | 72 | 100.0% |
Housing Structures by Occupancy in Ellison Bay
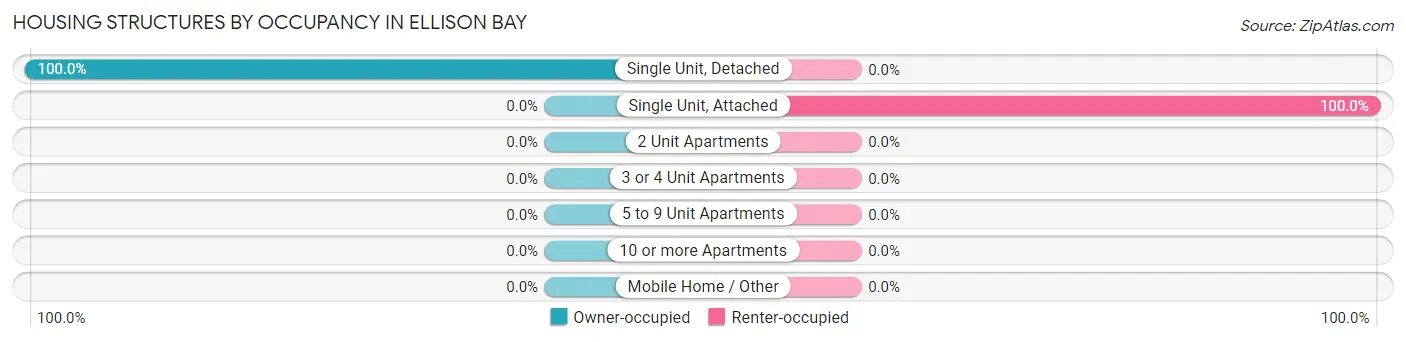
| Structure Type | Owner-occupied | Renter-occupied |
| Single Unit, Detached | 67 (100.0%) | 0 (0.0%) |
| Single Unit, Attached | 0 (0.0%) | 5 (100.0%) |
| 2 Unit Apartments | 0 (0.0%) | 0 (0.0%) |
| 3 or 4 Unit Apartments | 0 (0.0%) | 0 (0.0%) |
| 5 to 9 Unit Apartments | 0 (0.0%) | 0 (0.0%) |
| 10 or more Apartments | 0 (0.0%) | 0 (0.0%) |
| Mobile Home / Other | 0 (0.0%) | 0 (0.0%) |
| Total | 67 (93.1%) | 5 (6.9%) |
Housing Structures by Number of Rooms in Ellison Bay
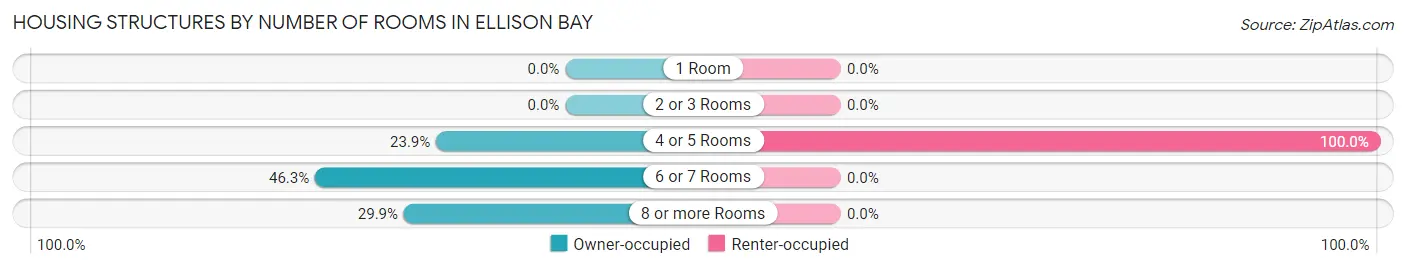
| Number of Rooms | Owner-occupied | Renter-occupied |
| 1 Room | 0 (0.0%) | 0 (0.0%) |
| 2 or 3 Rooms | 0 (0.0%) | 0 (0.0%) |
| 4 or 5 Rooms | 16 (23.9%) | 5 (100.0%) |
| 6 or 7 Rooms | 31 (46.3%) | 0 (0.0%) |
| 8 or more Rooms | 20 (29.8%) | 0 (0.0%) |
| Total | 67 (100.0%) | 5 (100.0%) |
Housing Structure by Heating Type in Ellison Bay
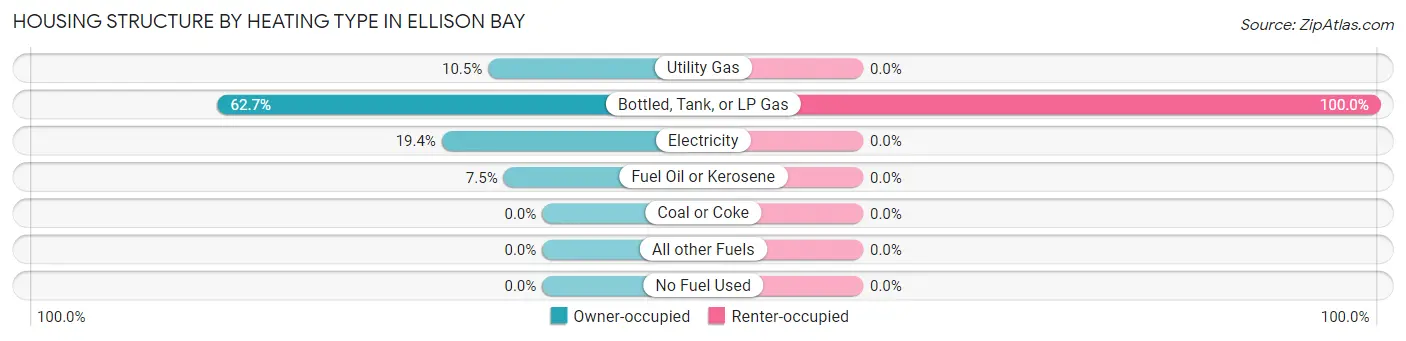
| Heating Type | Owner-occupied | Renter-occupied |
| Utility Gas | 7 (10.4%) | 0 (0.0%) |
| Bottled, Tank, or LP Gas | 42 (62.7%) | 5 (100.0%) |
| Electricity | 13 (19.4%) | 0 (0.0%) |
| Fuel Oil or Kerosene | 5 (7.5%) | 0 (0.0%) |
| Coal or Coke | 0 (0.0%) | 0 (0.0%) |
| All other Fuels | 0 (0.0%) | 0 (0.0%) |
| No Fuel Used | 0 (0.0%) | 0 (0.0%) |
| Total | 67 (100.0%) | 5 (100.0%) |
Household Vehicle Usage in Ellison Bay
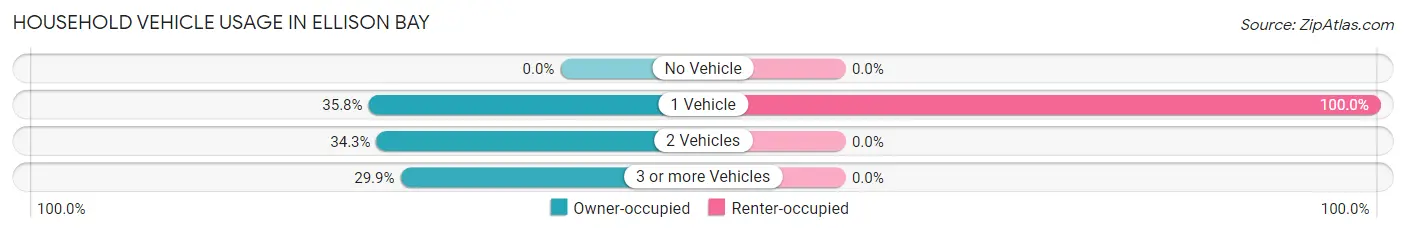
| Vehicles per Household | Owner-occupied | Renter-occupied |
| No Vehicle | 0 (0.0%) | 0 (0.0%) |
| 1 Vehicle | 24 (35.8%) | 5 (100.0%) |
| 2 Vehicles | 23 (34.3%) | 0 (0.0%) |
| 3 or more Vehicles | 20 (29.8%) | 0 (0.0%) |
| Total | 67 (100.0%) | 5 (100.0%) |
Real Estate & Mortgages in Ellison Bay
Real Estate and Mortgage Overview in Ellison Bay
| Characteristic | Without Mortgage | With Mortgage |
| Housing Units | 15 | 52 |
| Median Property Value | - | - |
| Median Household Income | - | - |
| Monthly Housing Costs | - | - |
| Real Estate Taxes | - | - |
Property Value by Mortgage Status in Ellison Bay
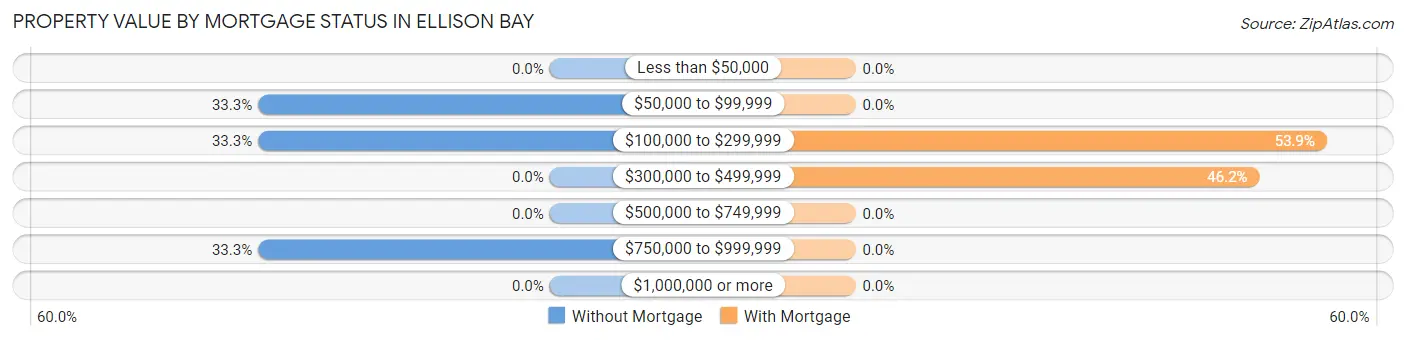
| Property Value | Without Mortgage | With Mortgage |
| Less than $50,000 | 0 (0.0%) | 0 (0.0%) |
| $50,000 to $99,999 | 5 (33.3%) | 0 (0.0%) |
| $100,000 to $299,999 | 5 (33.3%) | 28 (53.8%) |
| $300,000 to $499,999 | 0 (0.0%) | 24 (46.2%) |
| $500,000 to $749,999 | 0 (0.0%) | 0 (0.0%) |
| $750,000 to $999,999 | 5 (33.3%) | 0 (0.0%) |
| $1,000,000 or more | 0 (0.0%) | 0 (0.0%) |
| Total | 15 (100.0%) | 52 (100.0%) |
Household Income by Mortgage Status in Ellison Bay
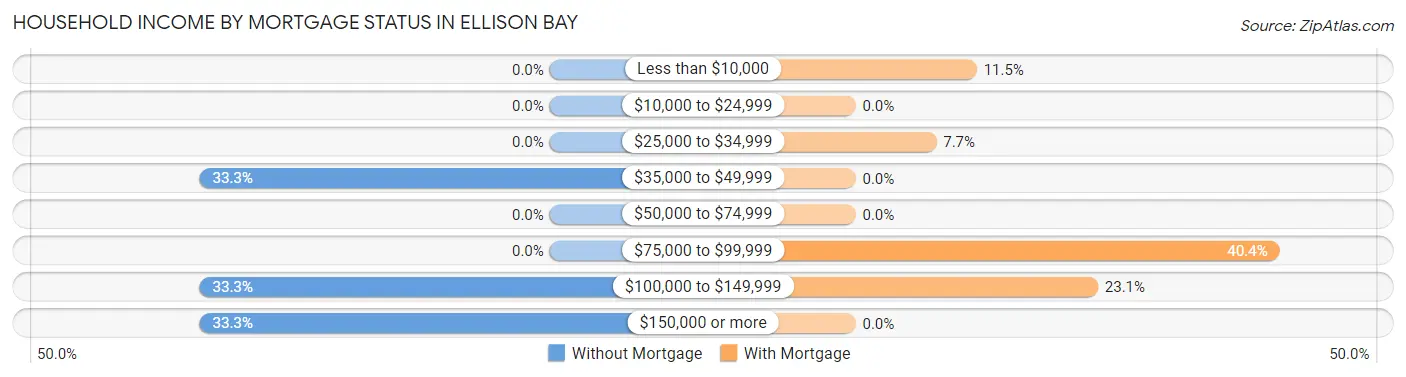
| Household Income | Without Mortgage | With Mortgage |
| Less than $10,000 | 0 (0.0%) | 6 (11.5%) |
| $10,000 to $24,999 | 0 (0.0%) | 0 (0.0%) |
| $25,000 to $34,999 | 0 (0.0%) | 4 (7.7%) |
| $35,000 to $49,999 | 5 (33.3%) | 0 (0.0%) |
| $50,000 to $74,999 | 0 (0.0%) | 0 (0.0%) |
| $75,000 to $99,999 | 0 (0.0%) | 21 (40.4%) |
| $100,000 to $149,999 | 5 (33.3%) | 12 (23.1%) |
| $150,000 or more | 5 (33.3%) | 0 (0.0%) |
| Total | 15 (100.0%) | 52 (100.0%) |
Property Value to Household Income Ratio in Ellison Bay
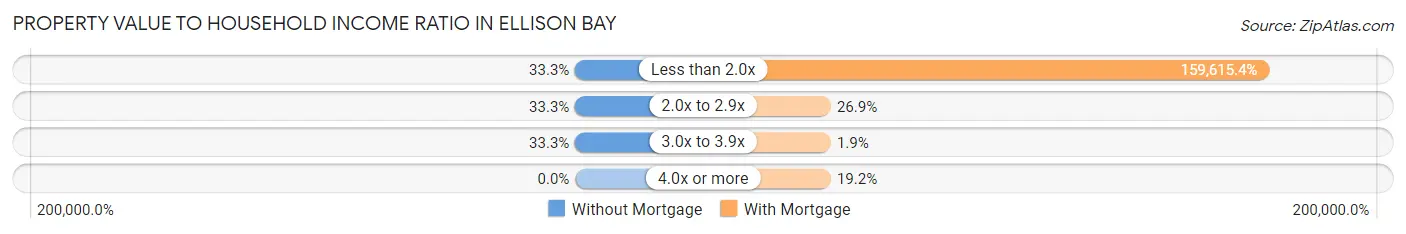
| Value-to-Income Ratio | Without Mortgage | With Mortgage |
| Less than 2.0x | 5 (33.3%) | 83,000 (159,615.4%) |
| 2.0x to 2.9x | 5 (33.3%) | 14 (26.9%) |
| 3.0x to 3.9x | 5 (33.3%) | 1 (1.9%) |
| 4.0x or more | 0 (0.0%) | 10 (19.2%) |
| Total | 15 (100.0%) | 52 (100.0%) |
Real Estate Taxes by Mortgage Status in Ellison Bay
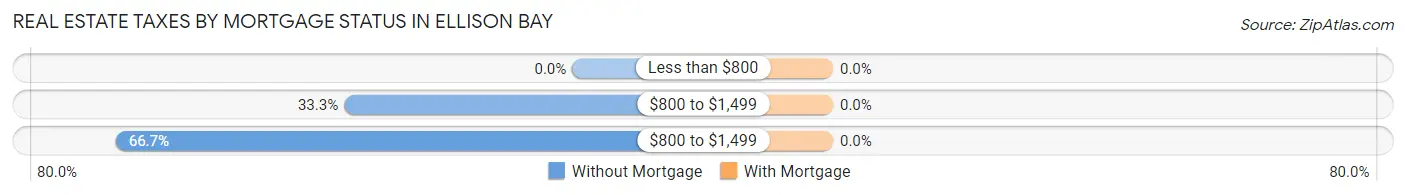
| Property Taxes | Without Mortgage | With Mortgage |
| Less than $800 | 0 (0.0%) | 0 (0.0%) |
| $800 to $1,499 | 5 (33.3%) | 0 (0.0%) |
| $800 to $1,499 | 10 (66.7%) | 0 (0.0%) |
| Total | 15 (100.0%) | 52 (100.0%) |
Health & Disability in Ellison Bay
Health Insurance Coverage by Age in Ellison Bay
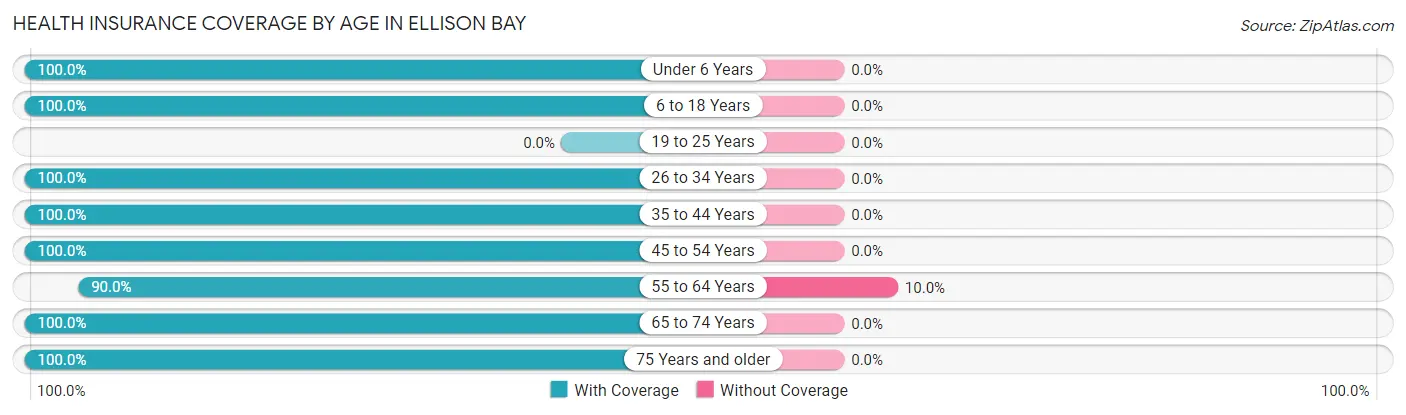
| Age Bracket | With Coverage | Without Coverage |
| Under 6 Years | 22 (100.0%) | 0 (0.0%) |
| 6 to 18 Years | 4 (100.0%) | 0 (0.0%) |
| 19 to 25 Years | 0 (0.0%) | 0 (0.0%) |
| 26 to 34 Years | 21 (100.0%) | 0 (0.0%) |
| 35 to 44 Years | 11 (100.0%) | 0 (0.0%) |
| 45 to 54 Years | 10 (100.0%) | 0 (0.0%) |
| 55 to 64 Years | 36 (90.0%) | 4 (10.0%) |
| 65 to 74 Years | 18 (100.0%) | 0 (0.0%) |
| 75 Years and older | 16 (100.0%) | 0 (0.0%) |
| Total | 138 (97.2%) | 4 (2.8%) |
Health Insurance Coverage by Citizenship Status in Ellison Bay
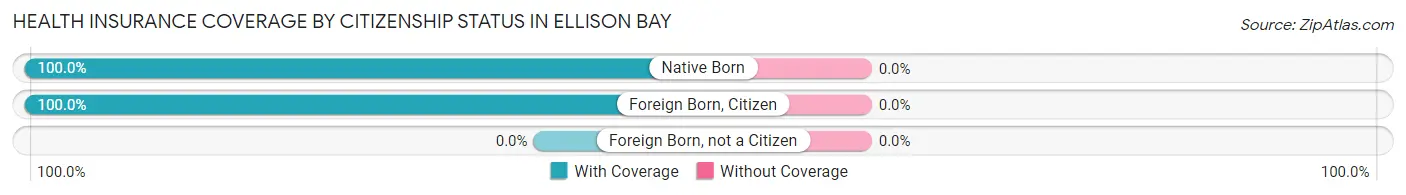
| Citizenship Status | With Coverage | Without Coverage |
| Native Born | 22 (100.0%) | 0 (0.0%) |
| Foreign Born, Citizen | 4 (100.0%) | 0 (0.0%) |
| Foreign Born, not a Citizen | 0 (0.0%) | 0 (0.0%) |
Health Insurance Coverage by Household Income in Ellison Bay
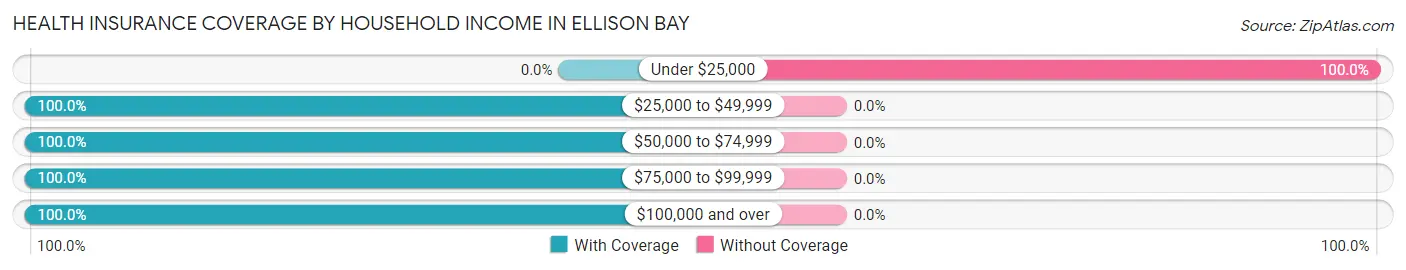
| Household Income | With Coverage | Without Coverage |
| Under $25,000 | 0 (0.0%) | 4 (100.0%) |
| $25,000 to $49,999 | 10 (100.0%) | 0 (0.0%) |
| $50,000 to $74,999 | 26 (100.0%) | 0 (0.0%) |
| $75,000 to $99,999 | 27 (100.0%) | 0 (0.0%) |
| $100,000 and over | 75 (100.0%) | 0 (0.0%) |
Public vs Private Health Insurance Coverage by Age in Ellison Bay
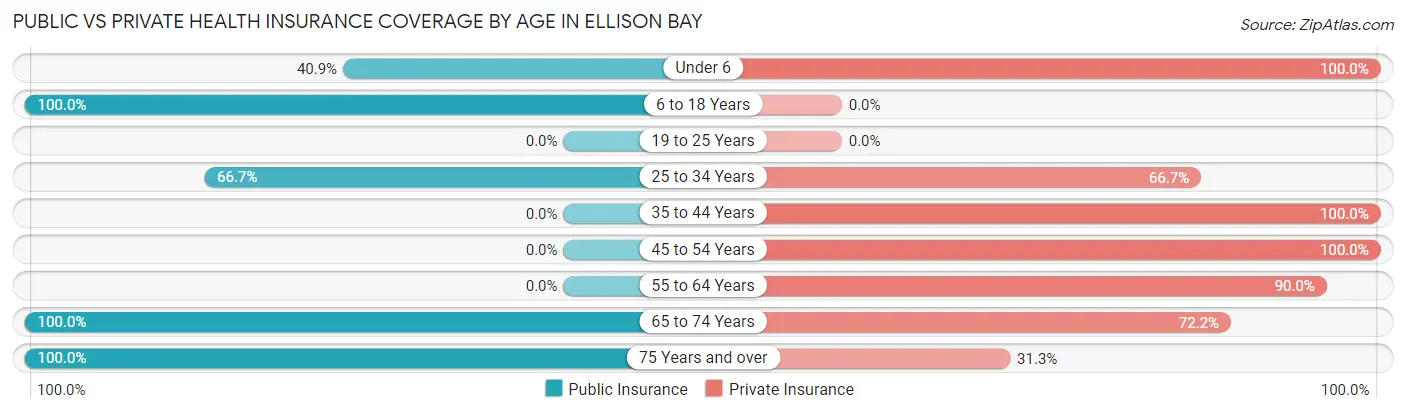
| Age Bracket | Public Insurance | Private Insurance |
| Under 6 | 9 (40.9%) | 22 (100.0%) |
| 6 to 18 Years | 4 (100.0%) | 0 (0.0%) |
| 19 to 25 Years | 0 (0.0%) | 0 (0.0%) |
| 25 to 34 Years | 14 (66.7%) | 14 (66.7%) |
| 35 to 44 Years | 0 (0.0%) | 11 (100.0%) |
| 45 to 54 Years | 0 (0.0%) | 10 (100.0%) |
| 55 to 64 Years | 0 (0.0%) | 36 (90.0%) |
| 65 to 74 Years | 18 (100.0%) | 13 (72.2%) |
| 75 Years and over | 16 (100.0%) | 5 (31.2%) |
| Total | 61 (43.0%) | 111 (78.2%) |
Disability Status by Sex by Age in Ellison Bay
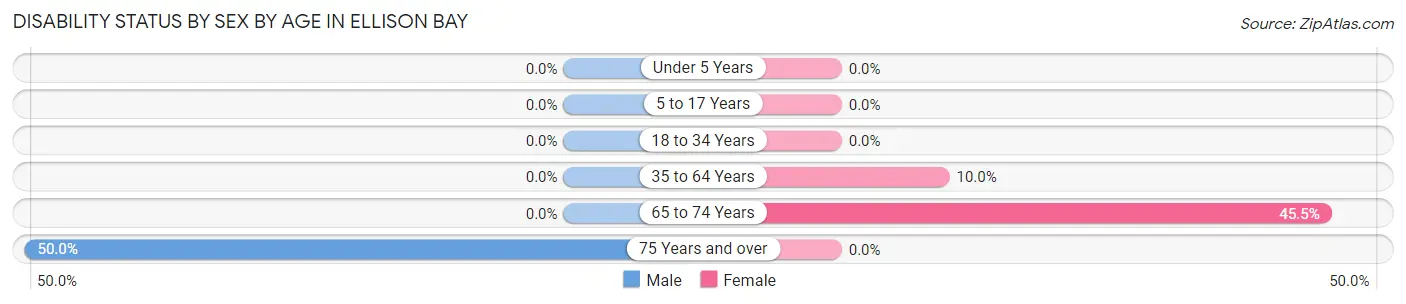
| Age Bracket | Male | Female |
| Under 5 Years | 0 (0.0%) | 0 (0.0%) |
| 5 to 17 Years | 0 (0.0%) | 0 (0.0%) |
| 18 to 34 Years | 0 (0.0%) | 0 (0.0%) |
| 35 to 64 Years | 0 (0.0%) | 4 (10.0%) |
| 65 to 74 Years | 0 (0.0%) | 5 (45.5%) |
| 75 Years and over | 5 (50.0%) | 0 (0.0%) |
Disability Class by Sex by Age in Ellison Bay
Disability Class: Hearing Difficulty
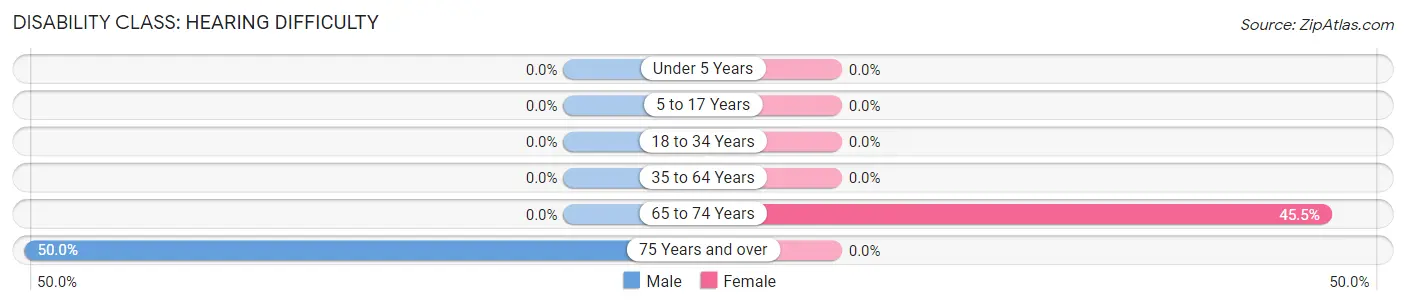
| Age Bracket | Male | Female |
| Under 5 Years | 0 (0.0%) | 0 (0.0%) |
| 5 to 17 Years | 0 (0.0%) | 0 (0.0%) |
| 18 to 34 Years | 0 (0.0%) | 0 (0.0%) |
| 35 to 64 Years | 0 (0.0%) | 0 (0.0%) |
| 65 to 74 Years | 0 (0.0%) | 5 (45.5%) |
| 75 Years and over | 5 (50.0%) | 0 (0.0%) |
Disability Class: Vision Difficulty
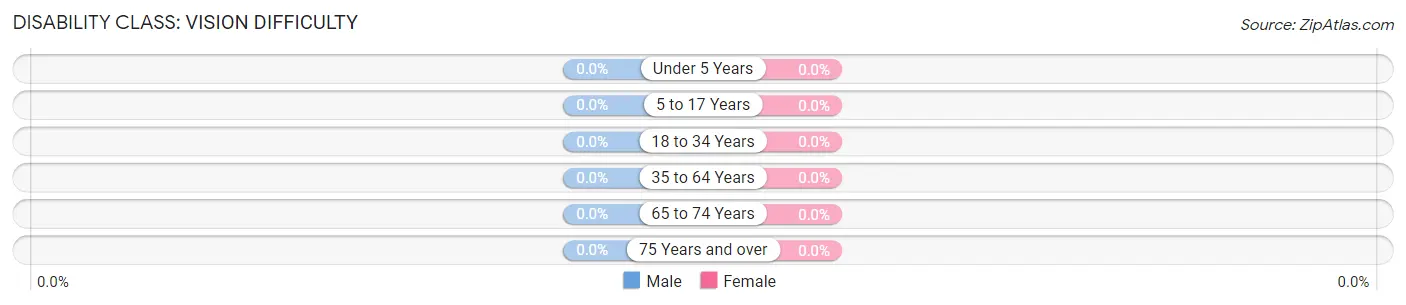
| Age Bracket | Male | Female |
| Under 5 Years | 0 (0.0%) | 0 (0.0%) |
| 5 to 17 Years | 0 (0.0%) | 0 (0.0%) |
| 18 to 34 Years | 0 (0.0%) | 0 (0.0%) |
| 35 to 64 Years | 0 (0.0%) | 0 (0.0%) |
| 65 to 74 Years | 0 (0.0%) | 0 (0.0%) |
| 75 Years and over | 0 (0.0%) | 0 (0.0%) |
Disability Class: Cognitive Difficulty
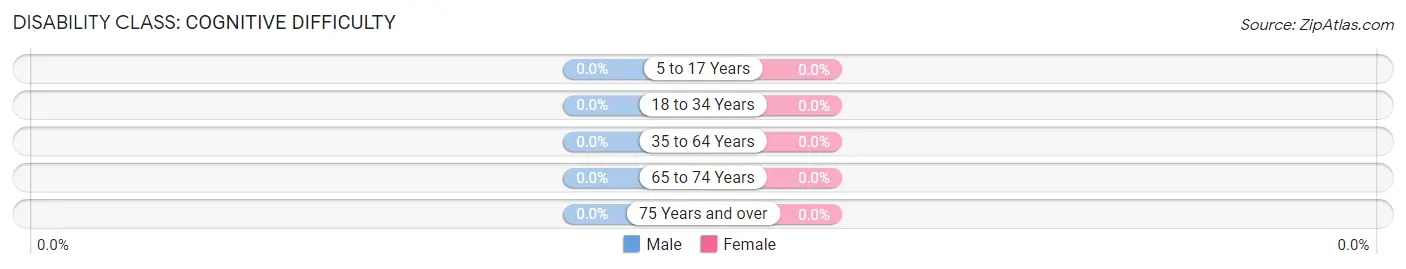
| Age Bracket | Male | Female |
| 5 to 17 Years | 0 (0.0%) | 0 (0.0%) |
| 18 to 34 Years | 0 (0.0%) | 0 (0.0%) |
| 35 to 64 Years | 0 (0.0%) | 0 (0.0%) |
| 65 to 74 Years | 0 (0.0%) | 0 (0.0%) |
| 75 Years and over | 0 (0.0%) | 0 (0.0%) |
Disability Class: Ambulatory Difficulty
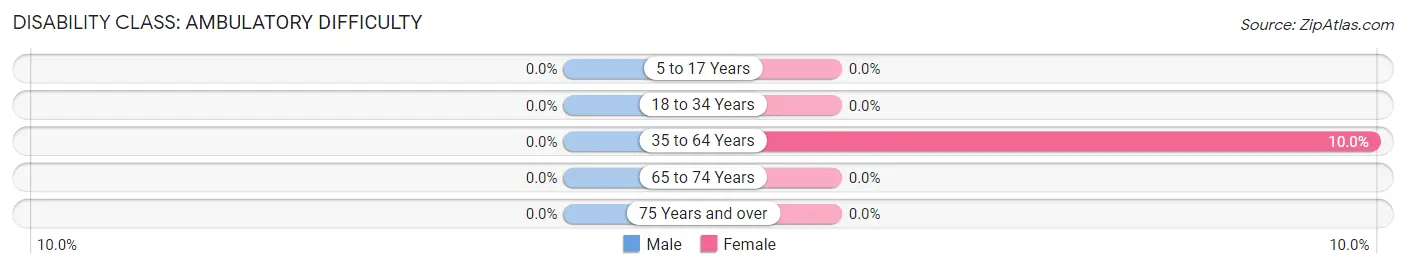
| Age Bracket | Male | Female |
| 5 to 17 Years | 0 (0.0%) | 0 (0.0%) |
| 18 to 34 Years | 0 (0.0%) | 0 (0.0%) |
| 35 to 64 Years | 0 (0.0%) | 4 (10.0%) |
| 65 to 74 Years | 0 (0.0%) | 0 (0.0%) |
| 75 Years and over | 0 (0.0%) | 0 (0.0%) |
Disability Class: Self-Care Difficulty
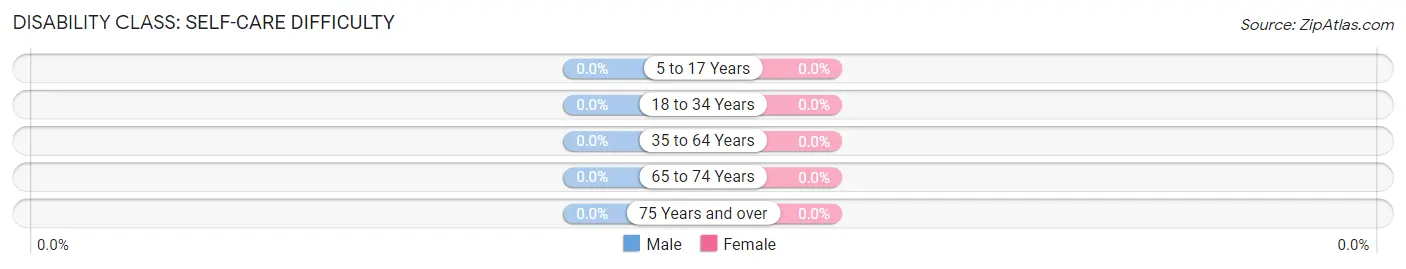
| Age Bracket | Male | Female |
| 5 to 17 Years | 0 (0.0%) | 0 (0.0%) |
| 18 to 34 Years | 0 (0.0%) | 0 (0.0%) |
| 35 to 64 Years | 0 (0.0%) | 0 (0.0%) |
| 65 to 74 Years | 0 (0.0%) | 0 (0.0%) |
| 75 Years and over | 0 (0.0%) | 0 (0.0%) |
Technology Access in Ellison Bay
Computing Device Access in Ellison Bay
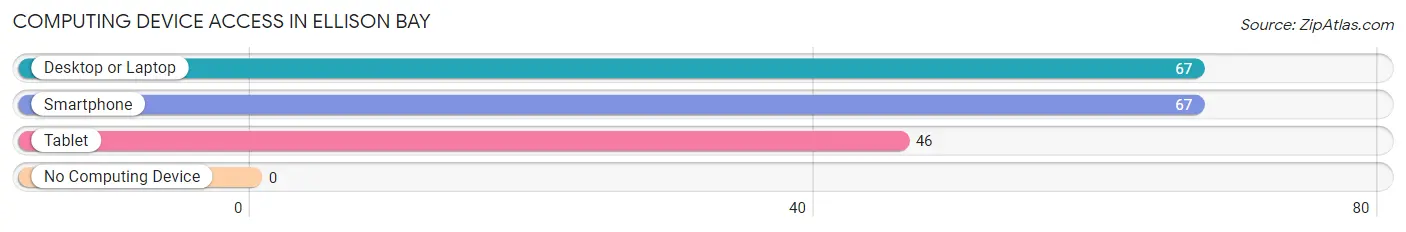
| Device Type | # Households | % Households |
| Desktop or Laptop | 67 | 93.1% |
| Smartphone | 67 | 93.1% |
| Tablet | 46 | 63.9% |
| No Computing Device | 0 | 0.0% |
| Total | 72 | 100.0% |
Internet Access in Ellison Bay
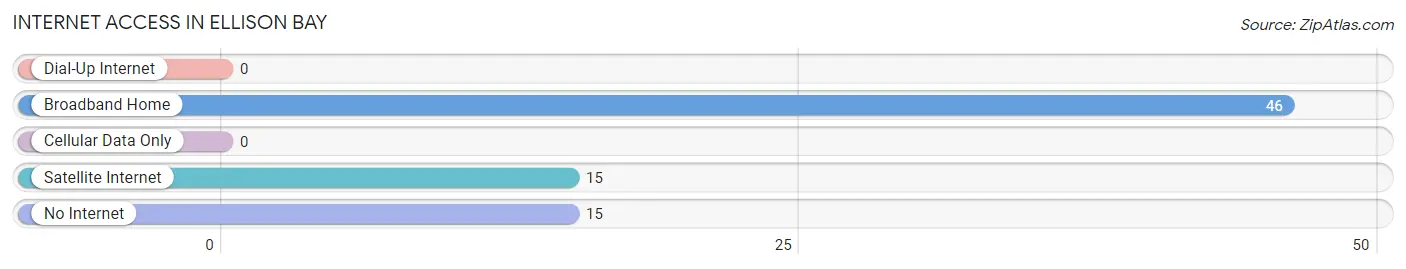
| Internet Type | # Households | % Households |
| Dial-Up Internet | 0 | 0.0% |
| Broadband Home | 46 | 63.9% |
| Cellular Data Only | 0 | 0.0% |
| Satellite Internet | 15 | 20.8% |
| No Internet | 15 | 20.8% |
| Total | 72 | 100.0% |
Ellison Bay Summary
Ellison Bay is a small unincorporated community located in Door County, Wisconsin. It is situated on the northern shore of Green Bay, and is part of the Town of Liberty Grove. The population of Ellison Bay was estimated to be around 590 in 2020.
History
The area that is now Ellison Bay was first settled by French fur traders in the late 1700s. The first permanent settlers arrived in the early 1800s, and the area was known as “Little Sturgeon Bay”. In 1851, the area was renamed “Ellison Bay” after the Ellison family, who had moved to the area from New York.
The town was originally a fishing and logging community, and the first sawmill was built in 1854. The town was also home to a number of resorts, which attracted visitors from all over the Midwest. In the late 1800s, the town was home to a number of businesses, including a general store, a blacksmith, a post office, and a hotel.
In the early 1900s, the town began to experience a decline in population as people moved away to larger cities. However, the town was revitalized in the 1950s when it became a popular tourist destination. The town is now home to a number of resorts, restaurants, and shops, and is a popular destination for tourists and locals alike.
Geography
Ellison Bay is located on the northern shore of Green Bay, in Door County, Wisconsin. The town is situated on a peninsula, and is surrounded by the waters of Green Bay and Lake Michigan. The town is located approximately 25 miles north of Sturgeon Bay, and is about a two-hour drive from Milwaukee.
The town is home to a number of parks and beaches, including Ellison Bay Beach, Ellison Bluff State Natural Area, and Ellison Bay Park. The town is also home to a number of marinas, which provide access to the waters of Green Bay and Lake Michigan.
Economy
The economy of Ellison Bay is largely based on tourism. The town is home to a number of resorts, restaurants, and shops, which attract visitors from all over the Midwest. The town is also home to a number of marinas, which provide access to the waters of Green Bay and Lake Michigan.
The town is also home to a number of businesses, including a general store, a blacksmith, a post office, and a hotel. The town is also home to a number of art galleries, which showcase the work of local artists.
Demographics
The population of Ellison Bay was estimated to be around 590 in 2020. The town is predominantly white, with approximately 95% of the population identifying as white. The median household income in the town is approximately $50,000, and the median home value is approximately $200,000. The town is home to a number of churches, including the Ellison Bay United Methodist Church and the Ellison Bay Lutheran Church.
Conclusion
Ellison Bay is a small unincorporated community located in Door County, Wisconsin. It is situated on the northern shore of Green Bay, and is part of the Town of Liberty Grove. The town is home to a number of resorts, restaurants, and shops, and is a popular destination for tourists and locals alike. The economy of the town is largely based on tourism, and the population of the town was estimated to be around 590 in 2020. The town is predominantly white, with approximately 95% of the population identifying as white. The median household income in the town is approximately $50,000, and the median home value is approximately $200,000.
Common Questions
What is the Total Population of Ellison Bay?
Total Population of Ellison Bay is 142.
What is the Total Male Population of Ellison Bay?
Total Male Population of Ellison Bay is 59.
What is the Total Female Population of Ellison Bay?
Total Female Population of Ellison Bay is 83.
What is the Ratio of Males per 100 Females in Ellison Bay?
There are 71.08 Males per 100 Females in Ellison Bay.
What is the Ratio of Females per 100 Males in Ellison Bay?
There are 140.68 Females per 100 Males in Ellison Bay.
What is the Median Population Age in Ellison Bay?
Median Population Age in Ellison Bay is 57.4 Years.
What is the Average Family Size in Ellison Bay
Average Family Size in Ellison Bay is 2.6 People.
What is the Average Household Size in Ellison Bay
Average Household Size in Ellison Bay is 2.0 People.
What is Per Capita Income in Ellison Bay?
Per Capita income in Ellison Bay is $52,971.
What is the Median Family Income in Ellison Bay?
Median Family Income in Ellison Bay is $119,250.
What is the Median Household income in Ellison Bay?
Median Household Income in Ellison Bay is $83,000.
What is Inequality or Gini Index in Ellison Bay?
Inequality or Gini Index in Ellison Bay is 0.36.
How Large is the Labor Force in Ellison Bay?
There are 76 People in the Labor Forcein in Ellison Bay.
What is the Percentage of People in the Labor Force in Ellison Bay?
65.5% of People are in the Labor Force in Ellison Bay.