Delavan Lake, WI
Delavan Lake Map
Delavan Lake Overview
2,926
TOTAL POPULATION
1,618
MALE POPULATION
1,308
FEMALE POPULATION
123.70
MALES / 100 FEMALES
80.84
FEMALES / 100 MALES
48.7
MEDIAN AGE
3.1
AVG FAMILY SIZE
2.4
AVG HOUSEHOLD SIZE
$41,689
PER CAPITA INCOME
$100,048
AVG FAMILY INCOME
$66,667
AVG HOUSEHOLD INCOME
24.5%
WAGE / INCOME GAP [ % ]
75.5¢/ $1
WAGE / INCOME GAP [ $ ]
0.47
INEQUALITY / GINI INDEX
1,435
LABOR FORCE [ PEOPLE ]
57.4%
PERCENT IN LABOR FORCE
2.2%
UNEMPLOYMENT RATE
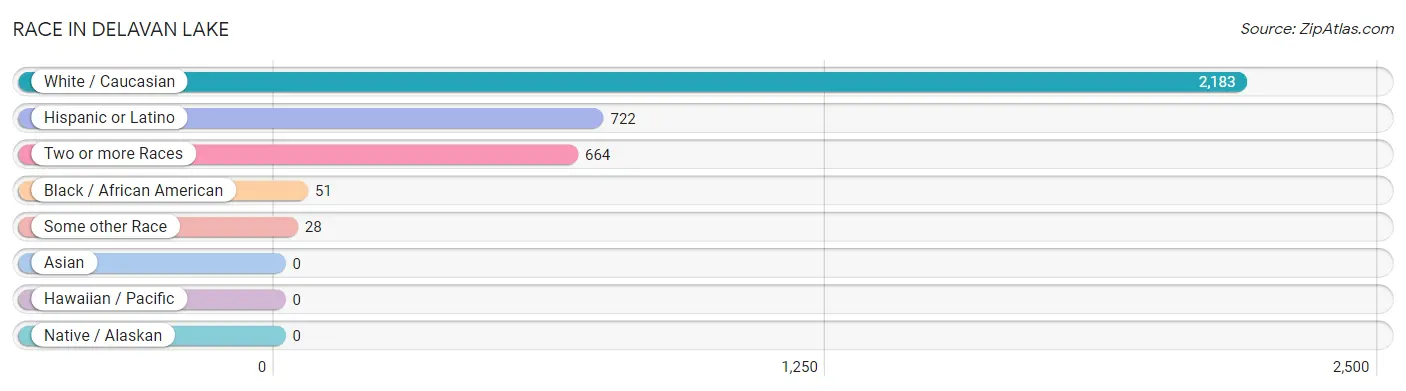
Race in Delavan Lake
The most populous races in Delavan Lake are White / Caucasian (2,183 | 74.6%), Hispanic or Latino (722 | 24.7%), and Two or more Races (664 | 22.7%).
| Race | # Population | % Population |
| Asian | 0 | 0.0% |
| Black / African American | 51 | 1.7% |
| Hawaiian / Pacific | 0 | 0.0% |
| Hispanic or Latino | 722 | 24.7% |
| Native / Alaskan | 0 | 0.0% |
| White / Caucasian | 2,183 | 74.6% |
| Two or more Races | 664 | 22.7% |
| Some other Race | 28 | 1.0% |
| Total | 2,926 | 100.0% |
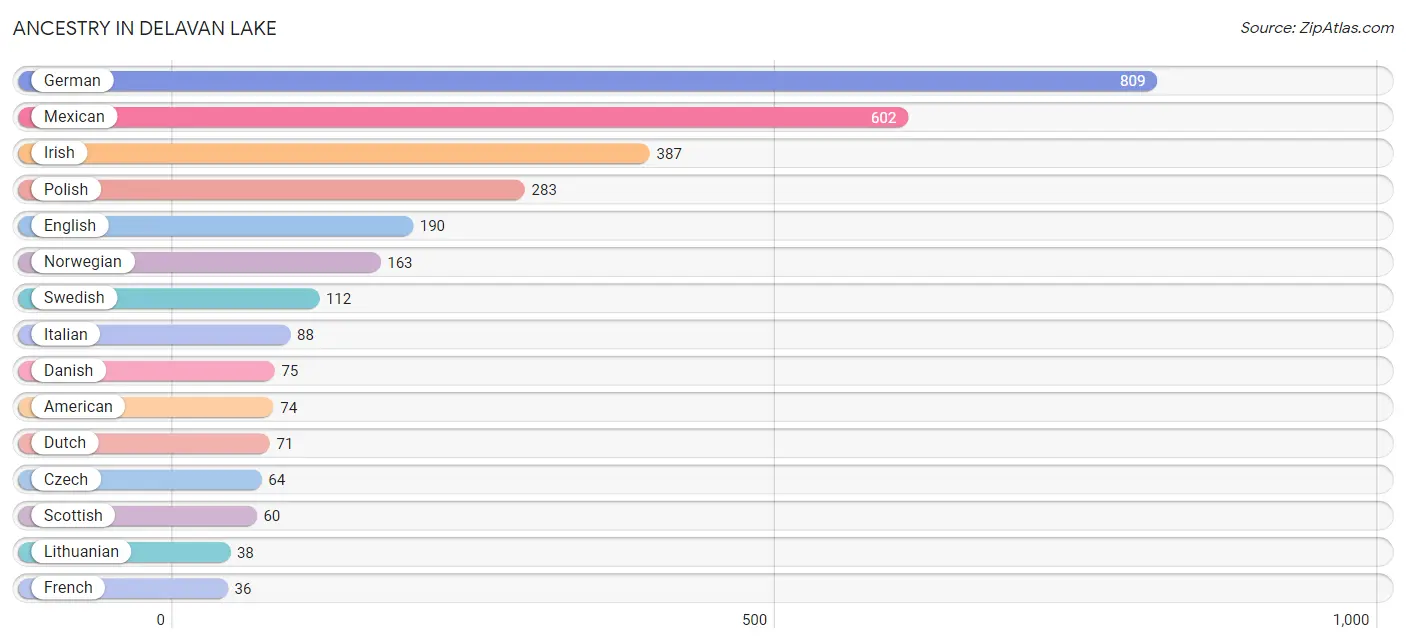
Ancestry in Delavan Lake
The most populous ancestries reported in Delavan Lake are German (809 | 27.7%), Mexican (602 | 20.6%), Irish (387 | 13.2%), Polish (283 | 9.7%), and English (190 | 6.5%), together accounting for 77.6% of all Delavan Lake residents.
| Ancestry | # Population | % Population |
| American | 74 | 2.5% |
| Austrian | 12 | 0.4% |
| Cuban | 4 | 0.1% |
| Czech | 64 | 2.2% |
| Danish | 75 | 2.6% |
| Delaware | 5 | 0.2% |
| Dutch | 71 | 2.4% |
| English | 190 | 6.5% |
| European | 35 | 1.2% |
| Finnish | 10 | 0.3% |
| French | 36 | 1.2% |
| French Canadian | 10 | 0.3% |
| German | 809 | 27.7% |
| Greek | 25 | 0.9% |
| Hungarian | 6 | 0.2% |
| Irish | 387 | 13.2% |
| Italian | 88 | 3.0% |
| Lithuanian | 38 | 1.3% |
| Mexican | 602 | 20.6% |
| Norwegian | 163 | 5.6% |
| Polish | 283 | 9.7% |
| Puerto Rican | 6 | 0.2% |
| Romanian | 1 | 0.0% |
| Russian | 21 | 0.7% |
| Scotch-Irish | 24 | 0.8% |
| Scottish | 60 | 2.1% |
| Swedish | 112 | 3.8% |
| Swiss | 27 | 0.9% |
| Ukrainian | 12 | 0.4% |
| Welsh | 5 | 0.2% | View All 30 Rows |
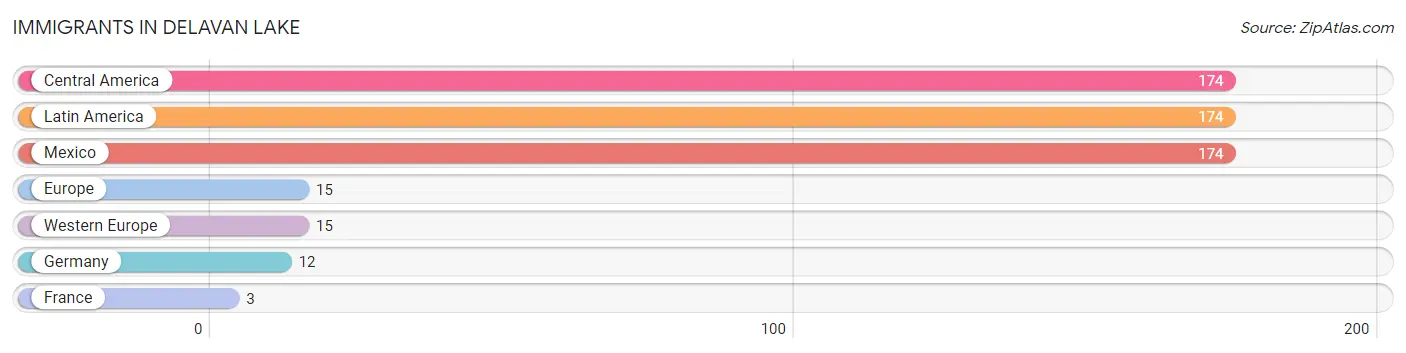
Immigrants in Delavan Lake
The most numerous immigrant groups reported in Delavan Lake came from Central America (174 | 5.9%), Latin America (174 | 5.9%), Mexico (174 | 5.9%), Europe (15 | 0.5%), and Western Europe (15 | 0.5%), together accounting for 18.9% of all Delavan Lake residents.
| Immigration Origin | # Population | % Population |
| Central America | 174 | 5.9% |
| Europe | 15 | 0.5% |
| France | 3 | 0.1% |
| Germany | 12 | 0.4% |
| Latin America | 174 | 5.9% |
| Mexico | 174 | 5.9% |
| Western Europe | 15 | 0.5% | View All 7 Rows |
Sex and Age in Delavan Lake
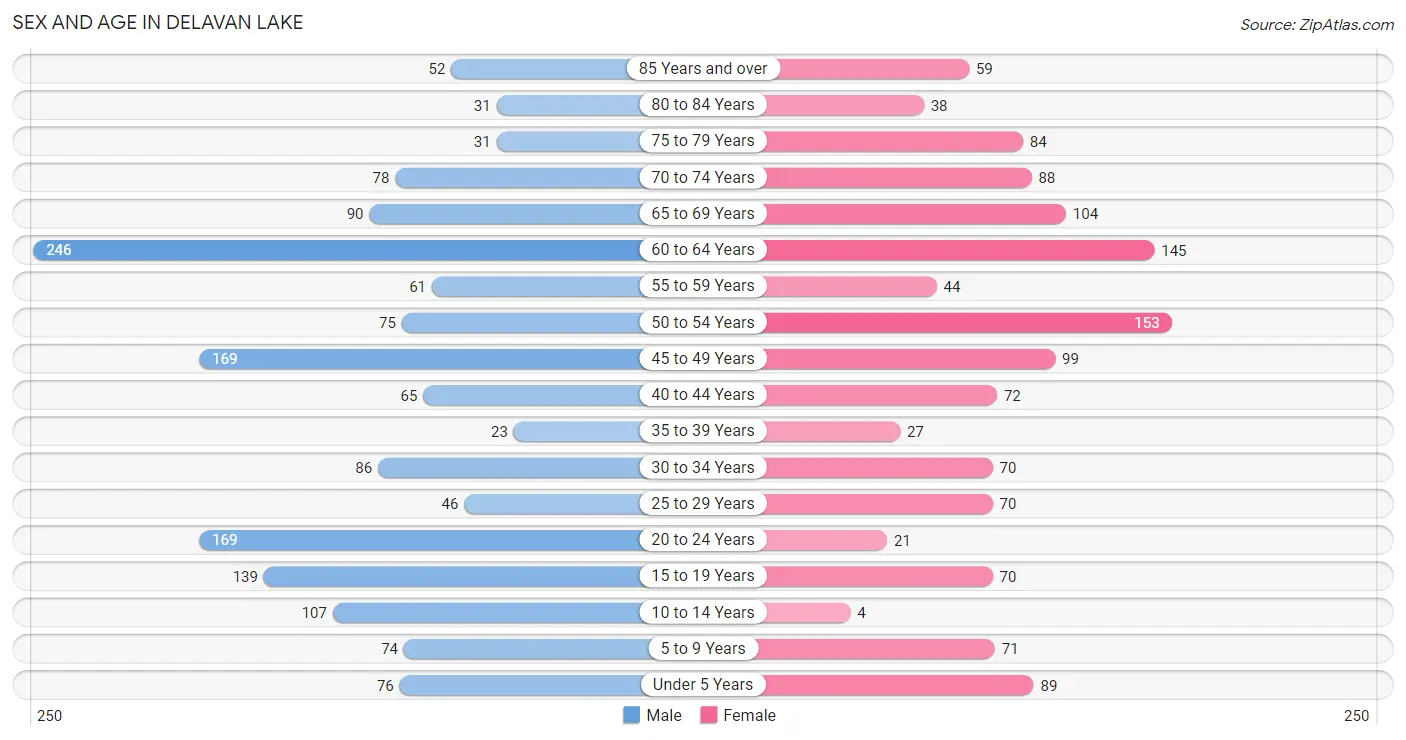
Sex and Age in Delavan Lake
The most populous age groups in Delavan Lake are 60 to 64 Years (246 | 15.2%) for men and 50 to 54 Years (153 | 11.7%) for women.
| Age Bracket | Male | Female |
| Under 5 Years | 76 (4.7%) | 89 (6.8%) |
| 5 to 9 Years | 74 (4.6%) | 71 (5.4%) |
| 10 to 14 Years | 107 (6.6%) | 4 (0.3%) |
| 15 to 19 Years | 139 (8.6%) | 70 (5.3%) |
| 20 to 24 Years | 169 (10.4%) | 21 (1.6%) |
| 25 to 29 Years | 46 (2.8%) | 70 (5.3%) |
| 30 to 34 Years | 86 (5.3%) | 70 (5.3%) |
| 35 to 39 Years | 23 (1.4%) | 27 (2.1%) |
| 40 to 44 Years | 65 (4.0%) | 72 (5.5%) |
| 45 to 49 Years | 169 (10.4%) | 99 (7.6%) |
| 50 to 54 Years | 75 (4.6%) | 153 (11.7%) |
| 55 to 59 Years | 61 (3.8%) | 44 (3.4%) |
| 60 to 64 Years | 246 (15.2%) | 145 (11.1%) |
| 65 to 69 Years | 90 (5.6%) | 104 (8.0%) |
| 70 to 74 Years | 78 (4.8%) | 88 (6.7%) |
| 75 to 79 Years | 31 (1.9%) | 84 (6.4%) |
| 80 to 84 Years | 31 (1.9%) | 38 (2.9%) |
| 85 Years and over | 52 (3.2%) | 59 (4.5%) |
| Total | 1,618 (100.0%) | 1,308 (100.0%) |
Families and Households in Delavan Lake
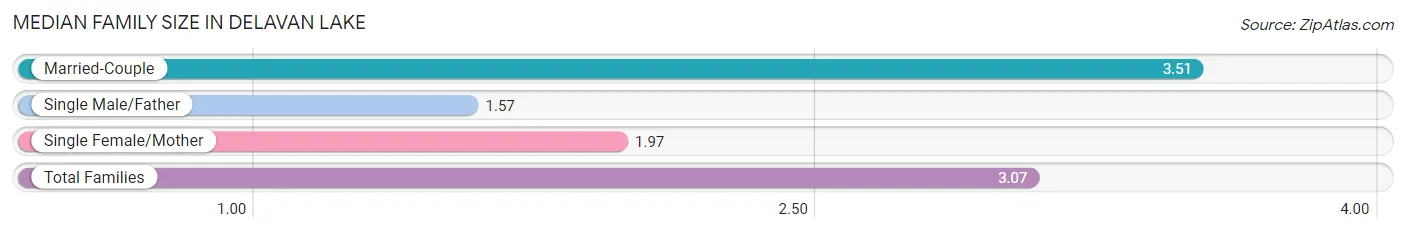
Median Family Size in Delavan Lake
The median family size in Delavan Lake is 3.07 persons per family, with married-couple families (575 | 75.2%) accounting for the largest median family size of 3.51 persons per family. On the other hand, single male/father families (115 | 15.0%) represent the smallest median family size with 1.57 persons per family.
| Family Type | # Families | Family Size |
| Married-Couple | 575 (75.2%) | 3.51 |
| Single Male/Father | 115 (15.0%) | 1.57 |
| Single Female/Mother | 75 (9.8%) | 1.97 |
| Total Families | 765 (100.0%) | 3.07 |
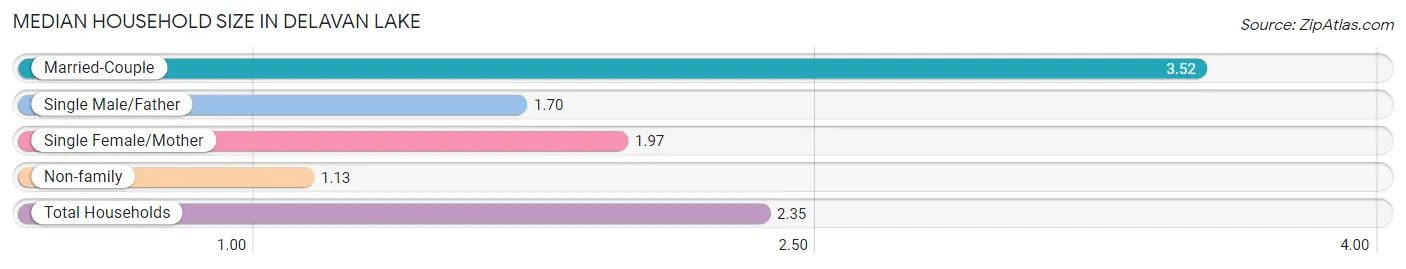
Median Household Size in Delavan Lake
The median household size in Delavan Lake is 2.35 persons per household, with married-couple households (575 | 46.7%) accounting for the largest median household size of 3.52 persons per household. non-family households (467 | 37.9%) represent the smallest median household size with 1.13 persons per household.
| Household Type | # Households | Household Size |
| Married-Couple | 575 (46.7%) | 3.52 |
| Single Male/Father | 115 (9.3%) | 1.70 |
| Single Female/Mother | 75 (6.1%) | 1.97 |
| Non-family | 467 (37.9%) | 1.13 |
| Total Households | 1,232 (100.0%) | 2.35 |
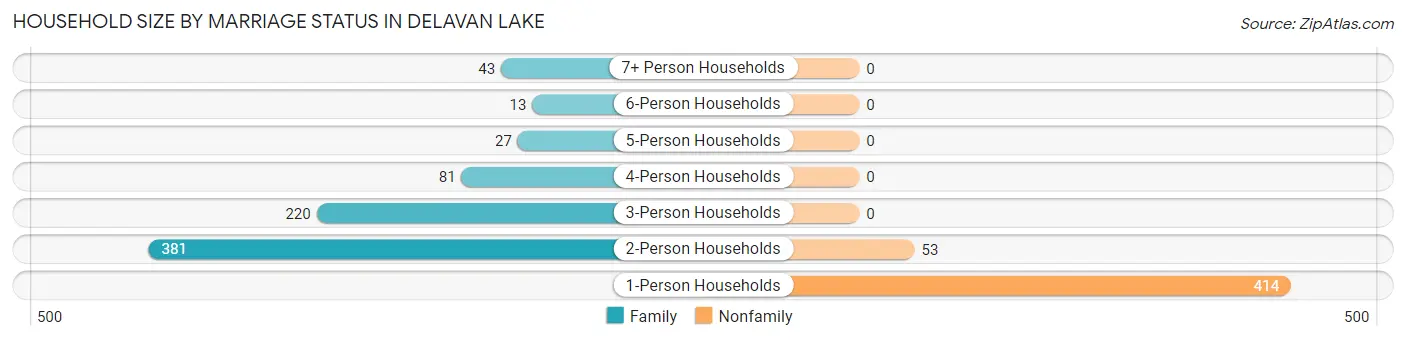
Household Size by Marriage Status in Delavan Lake
Out of a total of 1,232 households in Delavan Lake, 765 (62.1%) are family households, while 467 (37.9%) are nonfamily households. The most numerous type of family households are 2-person households, comprising 381, and the most common type of nonfamily households are 1-person households, comprising 414.
| Household Size | Family Households | Nonfamily Households |
| 1-Person Households | - | 414 (33.6%) |
| 2-Person Households | 381 (30.9%) | 53 (4.3%) |
| 3-Person Households | 220 (17.9%) | 0 (0.0%) |
| 4-Person Households | 81 (6.6%) | 0 (0.0%) |
| 5-Person Households | 27 (2.2%) | 0 (0.0%) |
| 6-Person Households | 13 (1.1%) | 0 (0.0%) |
| 7+ Person Households | 43 (3.5%) | 0 (0.0%) |
| Total | 765 (62.1%) | 467 (37.9%) |
Female Fertility in Delavan Lake
Fertility by Age in Delavan Lake
Average fertility rate in Delavan Lake is 24.0 births per 1,000 women. Women in the age bracket of 20 to 34 years have the highest fertility rate with 81.0 births per 1,000 women. Women in the age bracket of 20 to 34 years acount for 100.0% of all women with births.
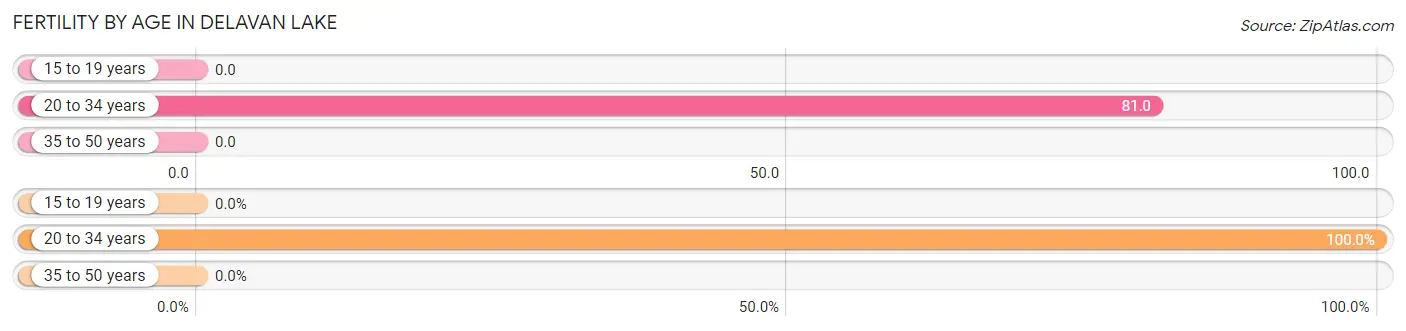
| Age Bracket | Women with Births | Births / 1,000 Women |
| 15 to 19 years | 0 (0.0%) | 0.0 |
| 20 to 34 years | 13 (100.0%) | 81.0 |
| 35 to 50 years | 0 (0.0%) | 0.0 |
| Total | 13 (100.0%) | 24.0 |
Fertility by Age by Marriage Status in Delavan Lake
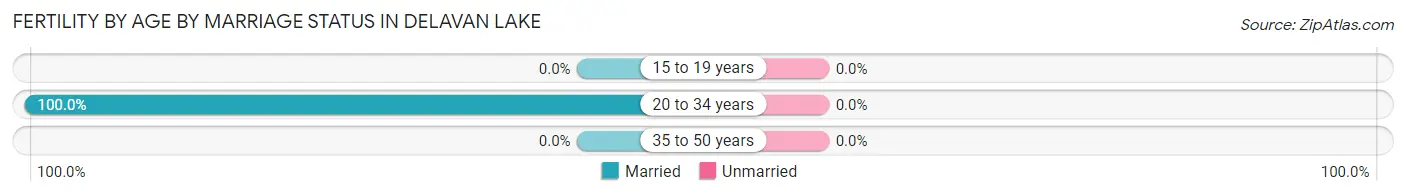
| Age Bracket | Married | Unmarried |
| 15 to 19 years | 0 (0.0%) | 0 (0.0%) |
| 20 to 34 years | 13 (100.0%) | 0 (0.0%) |
| 35 to 50 years | 0 (0.0%) | 0 (0.0%) |
| Total | 13 (100.0%) | 0 (0.0%) |
Fertility by Education in Delavan Lake
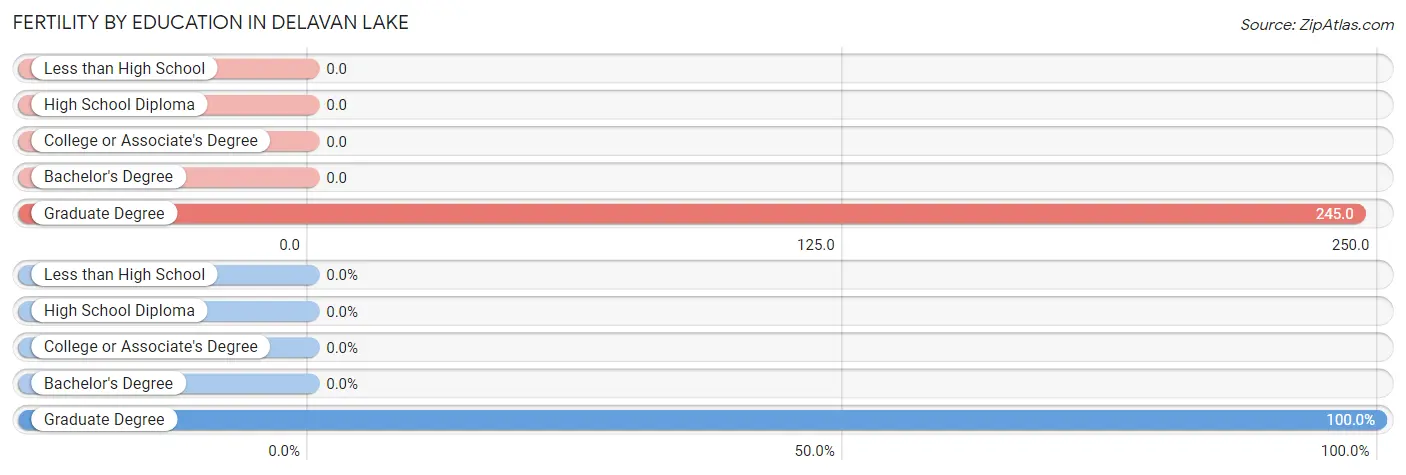
| Educational Attainment | Women with Births | Births / 1,000 Women |
| Less than High School | 0 (0.0%) | 0.0 |
| High School Diploma | 0 (0.0%) | 0.0 |
| College or Associate's Degree | 0 (0.0%) | 0.0 |
| Bachelor's Degree | 0 (0.0%) | 0.0 |
| Graduate Degree | 13 (100.0%) | 245.0 |
| Total | 13 (100.0%) | 24.0 |
Fertility by Education by Marriage Status in Delavan Lake
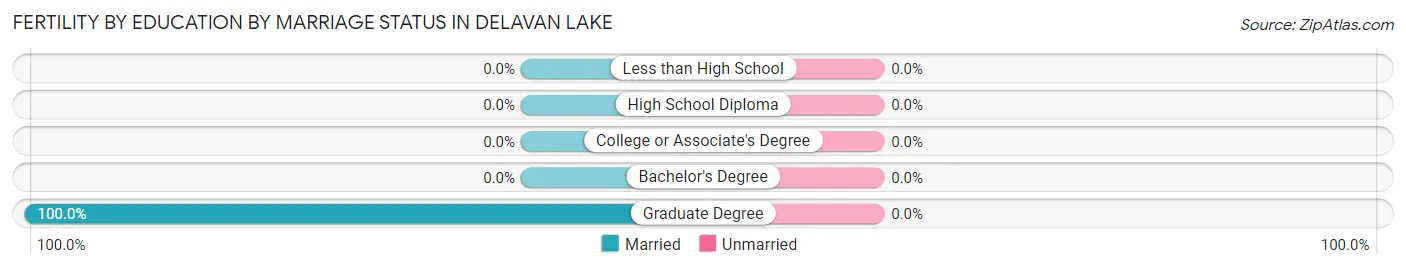
| Educational Attainment | Married | Unmarried |
| Less than High School | 0 (0.0%) | 0 (0.0%) |
| High School Diploma | 0 (0.0%) | 0 (0.0%) |
| College or Associate's Degree | 0 (0.0%) | 0 (0.0%) |
| Bachelor's Degree | 0 (0.0%) | 0 (0.0%) |
| Graduate Degree | 13 (100.0%) | 0 (0.0%) |
| Total | 13 (100.0%) | 0 (0.0%) |
Income in Delavan Lake
Income Overview in Delavan Lake
Per Capita Income in Delavan Lake is $41,689, while median incomes of families and households are $100,048 and $66,667 respectively.
| Characteristic | Number | Measure |
| Per Capita Income | 2,926 | $41,689 |
| Median Family Income | 765 | $100,048 |
| Mean Family Income | 765 | $122,576 |
| Median Household Income | 1,232 | $66,667 |
| Mean Household Income | 1,232 | $98,497 |
| Income Deficit | 765 | $0 |
| Wage / Income Gap (%) | 2,926 | 24.52% |
| Wage / Income Gap ($) | 2,926 | 75.48¢ per $1 |
| Gini / Inequality Index | 2,926 | 0.47 |
Earnings by Sex in Delavan Lake
Average Earnings in Delavan Lake are $37,970, $42,550 for men and $32,117 for women, a difference of 24.5%.
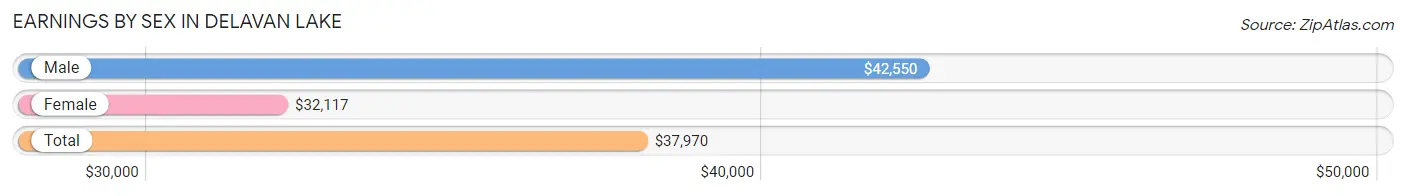
| Sex | Number | Average Earnings |
| Male | 831 (54.0%) | $42,550 |
| Female | 709 (46.0%) | $32,117 |
| Total | 1,540 (100.0%) | $37,970 |
Earnings by Sex by Income Bracket in Delavan Lake
The most common earnings brackets in Delavan Lake are $100,000+ for men (157 | 18.9%) and $30,000 to $34,999 for women (121 | 17.1%).
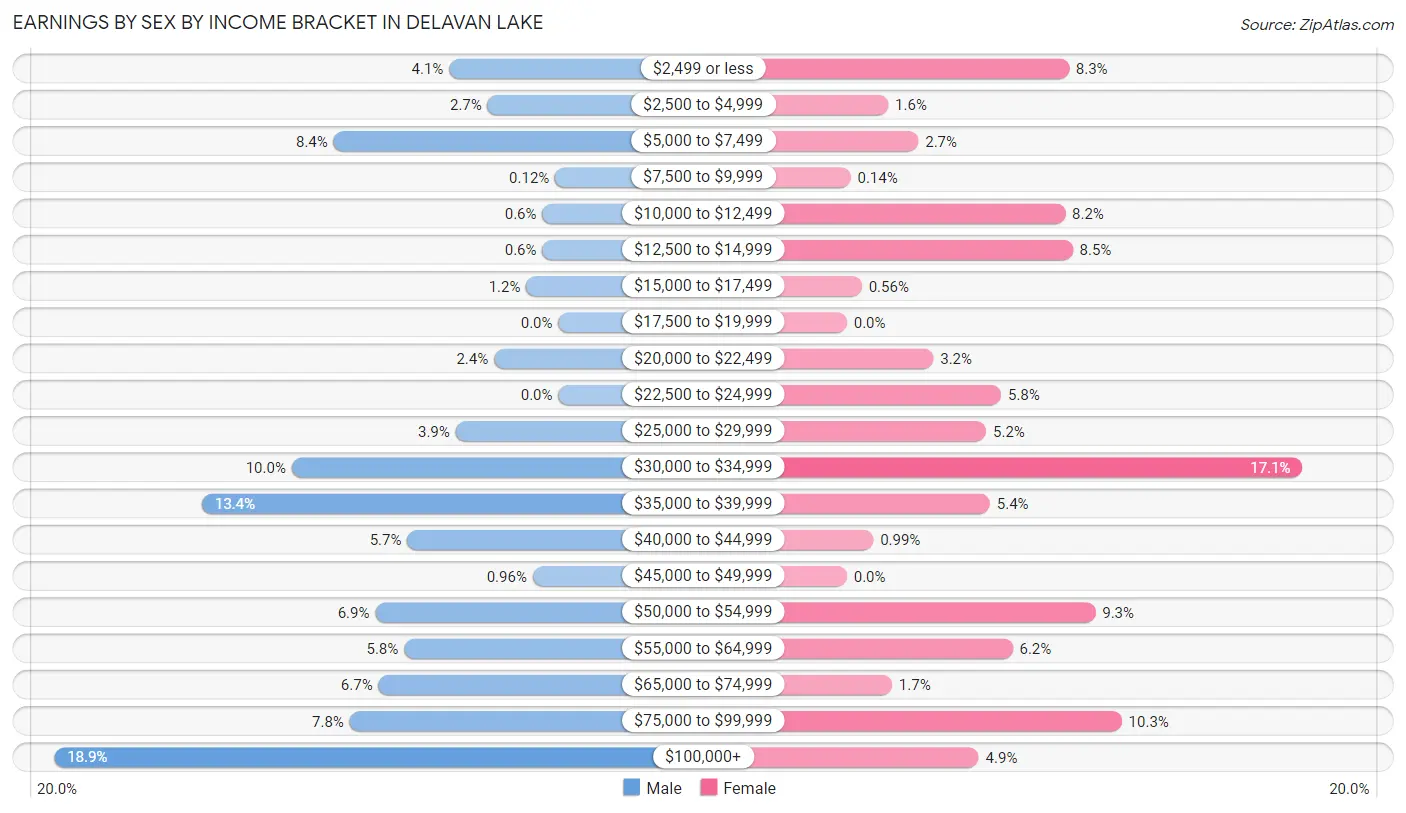
| Income | Male | Female |
| $2,499 or less | 34 (4.1%) | 59 (8.3%) |
| $2,500 to $4,999 | 22 (2.6%) | 11 (1.5%) |
| $5,000 to $7,499 | 70 (8.4%) | 19 (2.7%) |
| $7,500 to $9,999 | 1 (0.1%) | 1 (0.1%) |
| $10,000 to $12,499 | 5 (0.6%) | 58 (8.2%) |
| $12,500 to $14,999 | 5 (0.6%) | 60 (8.5%) |
| $15,000 to $17,499 | 10 (1.2%) | 4 (0.6%) |
| $17,500 to $19,999 | 0 (0.0%) | 0 (0.0%) |
| $20,000 to $22,499 | 20 (2.4%) | 23 (3.2%) |
| $22,500 to $24,999 | 0 (0.0%) | 41 (5.8%) |
| $25,000 to $29,999 | 32 (3.8%) | 37 (5.2%) |
| $30,000 to $34,999 | 83 (10.0%) | 121 (17.1%) |
| $35,000 to $39,999 | 111 (13.4%) | 38 (5.4%) |
| $40,000 to $44,999 | 47 (5.7%) | 7 (1.0%) |
| $45,000 to $49,999 | 8 (1.0%) | 0 (0.0%) |
| $50,000 to $54,999 | 57 (6.9%) | 66 (9.3%) |
| $55,000 to $64,999 | 48 (5.8%) | 44 (6.2%) |
| $65,000 to $74,999 | 56 (6.7%) | 12 (1.7%) |
| $75,000 to $99,999 | 65 (7.8%) | 73 (10.3%) |
| $100,000+ | 157 (18.9%) | 35 (4.9%) |
| Total | 831 (100.0%) | 709 (100.0%) |
Earnings by Sex by Educational Attainment in Delavan Lake
Average earnings in Delavan Lake are $52,973 for men and $33,681 for women, a difference of 36.4%. Men with an educational attainment of graduate degree enjoy the highest average annual earnings of $250,001, while those with less than high school education earn the least with $38,464. Women with an educational attainment of graduate degree earn the most with the average annual earnings of $79,444, while those with college or associate's degree education have the smallest earnings of $22,333.
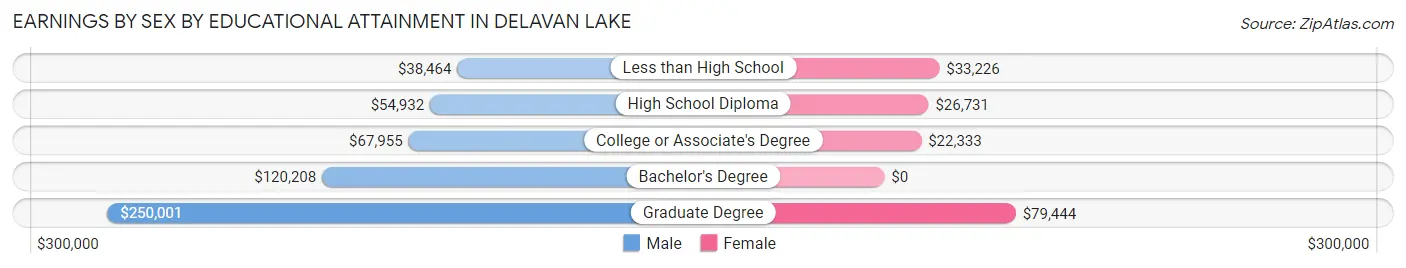
| Educational Attainment | Male Income | Female Income |
| Less than High School | $38,464 | $33,226 |
| High School Diploma | $54,932 | $26,731 |
| College or Associate's Degree | $67,955 | $22,333 |
| Bachelor's Degree | $120,208 | $0 |
| Graduate Degree | $250,001 | $79,444 |
| Total | $52,973 | $33,681 |
Family Income in Delavan Lake
Family Income Brackets in Delavan Lake
According to the Delavan Lake family income data, there are 147 families falling into the $150,000 to $199,999 income range, which is the most common income bracket and makes up 19.2% of all families.
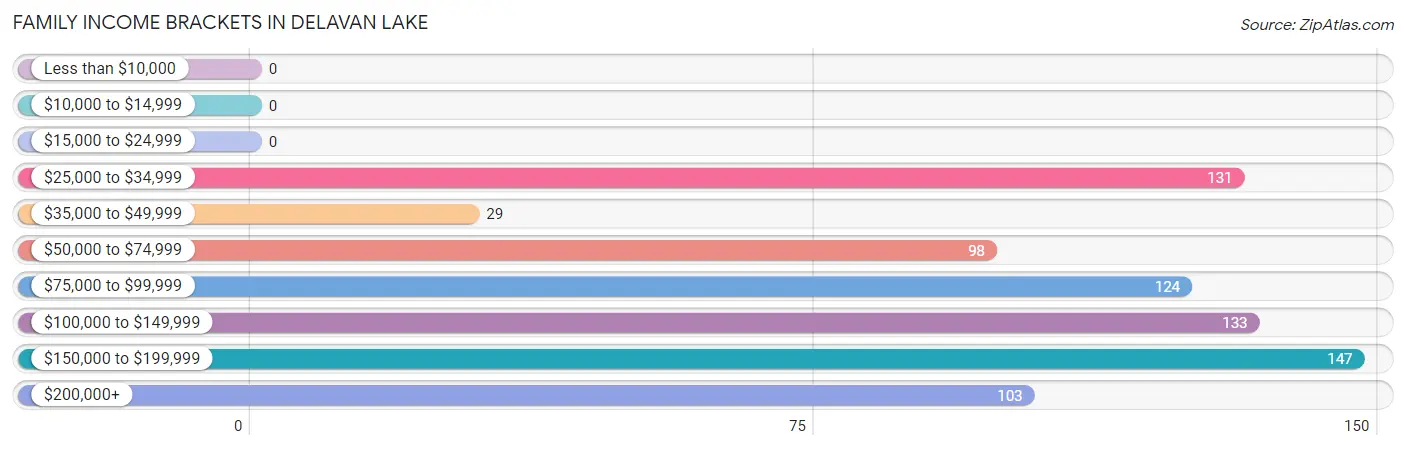
| Income Bracket | # Families | % Families |
| Less than $10,000 | 0 | 0.0% |
| $10,000 to $14,999 | 0 | 0.0% |
| $15,000 to $24,999 | 0 | 0.0% |
| $25,000 to $34,999 | 131 | 17.1% |
| $35,000 to $49,999 | 29 | 3.8% |
| $50,000 to $74,999 | 98 | 12.8% |
| $75,000 to $99,999 | 124 | 16.2% |
| $100,000 to $149,999 | 133 | 17.4% |
| $150,000 to $199,999 | 147 | 19.2% |
| $200,000+ | 103 | 13.5% |
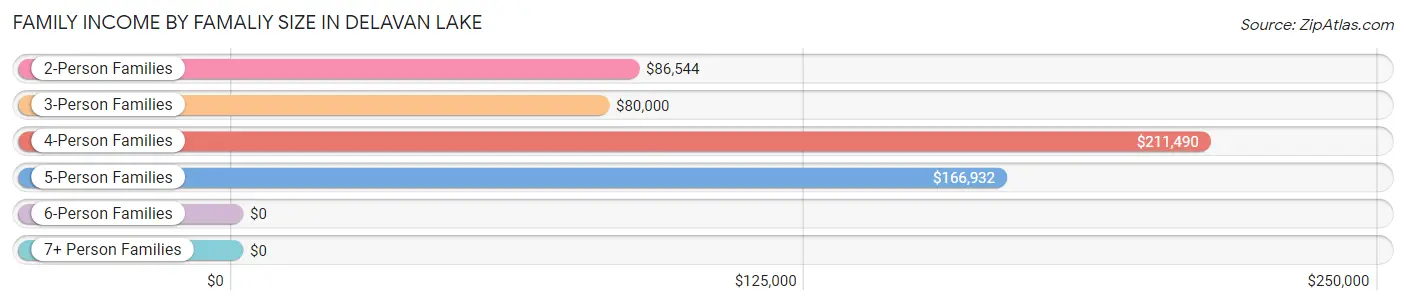
Family Income by Famaliy Size in Delavan Lake
4-person families (65 | 8.5%) account for the highest median family income in Delavan Lake with $211,490 per family, while 4-person families (65 | 8.5%) have the highest median income of $52,872 per family member.
| Income Bracket | # Families | Median Income |
| 2-Person Families | 381 (49.8%) | $86,544 |
| 3-Person Families | 236 (30.8%) | $80,000 |
| 4-Person Families | 65 (8.5%) | $211,490 |
| 5-Person Families | 31 (4.1%) | $166,932 |
| 6-Person Families | 9 (1.2%) | $0 |
| 7+ Person Families | 43 (5.6%) | $0 |
| Total | 765 (100.0%) | $100,048 |
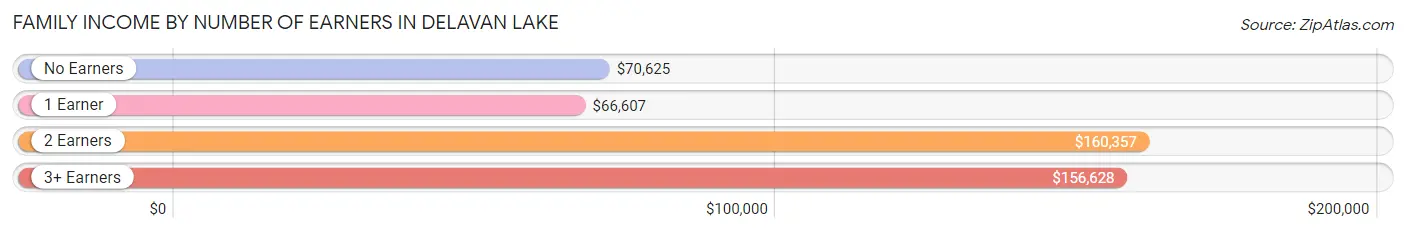
Family Income by Number of Earners in Delavan Lake
The median family income in Delavan Lake is $100,048, with families comprising 2 earners (228) having the highest median family income of $160,357, while families with 1 earner (309) have the lowest median family income of $66,607, accounting for 29.8% and 40.4% of families, respectively.
| Number of Earners | # Families | Median Income |
| No Earners | 106 (13.9%) | $70,625 |
| 1 Earner | 309 (40.4%) | $66,607 |
| 2 Earners | 228 (29.8%) | $160,357 |
| 3+ Earners | 122 (16.0%) | $156,628 |
| Total | 765 (100.0%) | $100,048 |
Household Income in Delavan Lake
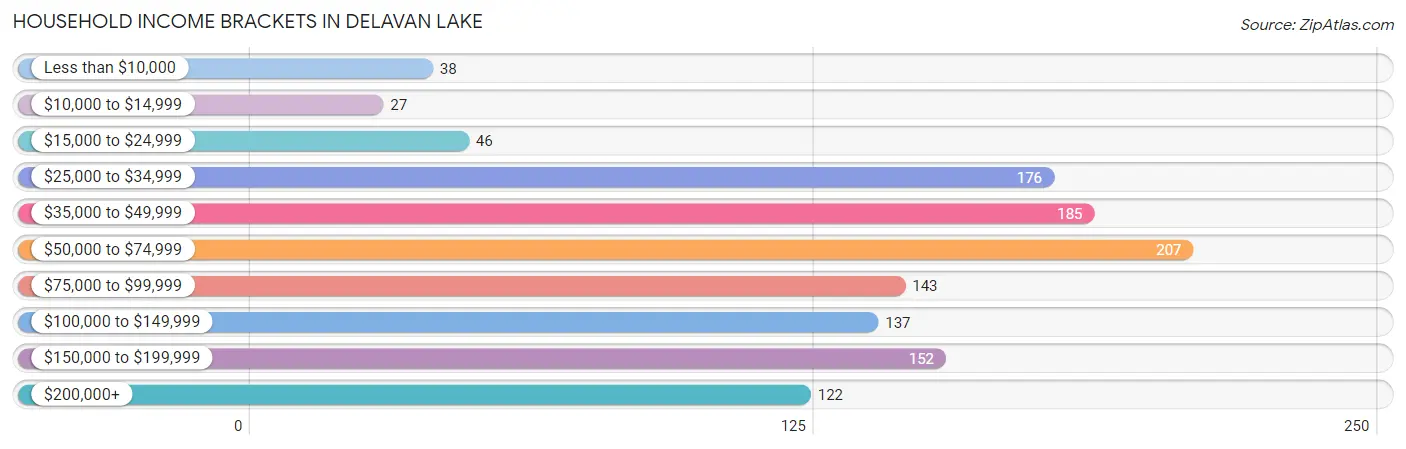
Household Income Brackets in Delavan Lake
With 207 households falling in the category, the $50,000 to $74,999 income range is the most frequent in Delavan Lake, accounting for 16.8% of all households. In contrast, only 27 households (2.2%) fall into the $10,000 to $14,999 income bracket, making it the least populous group.
| Income Bracket | # Households | % Households |
| Less than $10,000 | 38 | 3.1% |
| $10,000 to $14,999 | 27 | 2.2% |
| $15,000 to $24,999 | 46 | 3.7% |
| $25,000 to $34,999 | 176 | 14.3% |
| $35,000 to $49,999 | 185 | 15.0% |
| $50,000 to $74,999 | 207 | 16.8% |
| $75,000 to $99,999 | 143 | 11.6% |
| $100,000 to $149,999 | 137 | 11.1% |
| $150,000 to $199,999 | 152 | 12.3% |
| $200,000+ | 122 | 9.9% |
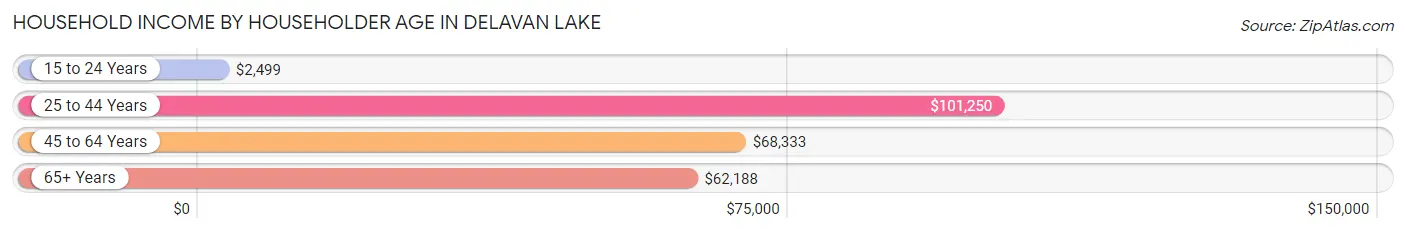
Household Income by Householder Age in Delavan Lake
The median household income in Delavan Lake is $66,667, with the highest median household income of $101,250 found in the 25 to 44 years age bracket for the primary householder. A total of 161 households (13.1%) fall into this category. Meanwhile, the 15 to 24 years age bracket for the primary householder has the lowest median household income of $2,499, with 47 households (3.8%) in this group.
| Income Bracket | # Households | Median Income |
| 15 to 24 Years | 47 (3.8%) | $2,499 |
| 25 to 44 Years | 161 (13.1%) | $101,250 |
| 45 to 64 Years | 584 (47.4%) | $68,333 |
| 65+ Years | 440 (35.7%) | $62,188 |
| Total | 1,232 (100.0%) | $66,667 |
Poverty in Delavan Lake
Income Below Poverty by Sex and Age in Delavan Lake
With 4.2% poverty level for males and 6.4% for females among the residents of Delavan Lake, 45 to 54 year old males and 45 to 54 year old females are the most vulnerable to poverty, with 26 males (10.7%) and 50 females (19.8%) in their respective age groups living below the poverty level.
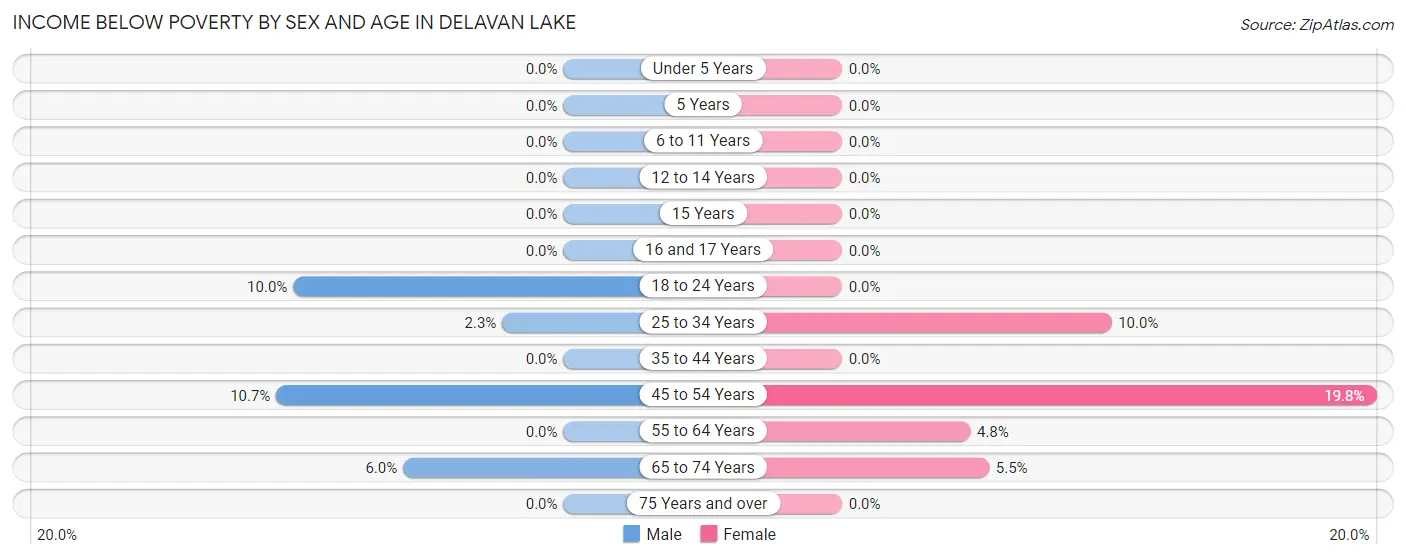
| Age Bracket | Male | Female |
| Under 5 Years | 0 (0.0%) | 0 (0.0%) |
| 5 Years | 0 (0.0%) | 0 (0.0%) |
| 6 to 11 Years | 0 (0.0%) | 0 (0.0%) |
| 12 to 14 Years | 0 (0.0%) | 0 (0.0%) |
| 15 Years | 0 (0.0%) | 0 (0.0%) |
| 16 and 17 Years | 0 (0.0%) | 0 (0.0%) |
| 18 to 24 Years | 29 (10.0%) | 0 (0.0%) |
| 25 to 34 Years | 3 (2.3%) | 14 (10.0%) |
| 35 to 44 Years | 0 (0.0%) | 0 (0.0%) |
| 45 to 54 Years | 26 (10.7%) | 50 (19.8%) |
| 55 to 64 Years | 0 (0.0%) | 9 (4.8%) |
| 65 to 74 Years | 10 (5.9%) | 10 (5.5%) |
| 75 Years and over | 0 (0.0%) | 0 (0.0%) |
| Total | 68 (4.2%) | 83 (6.4%) |
Income Above Poverty by Sex and Age in Delavan Lake
According to the poverty statistics in Delavan Lake, males aged under 5 years and females aged under 5 years are the age groups that are most secure financially, with 100.0% of males and 100.0% of females in these age groups living above the poverty line.
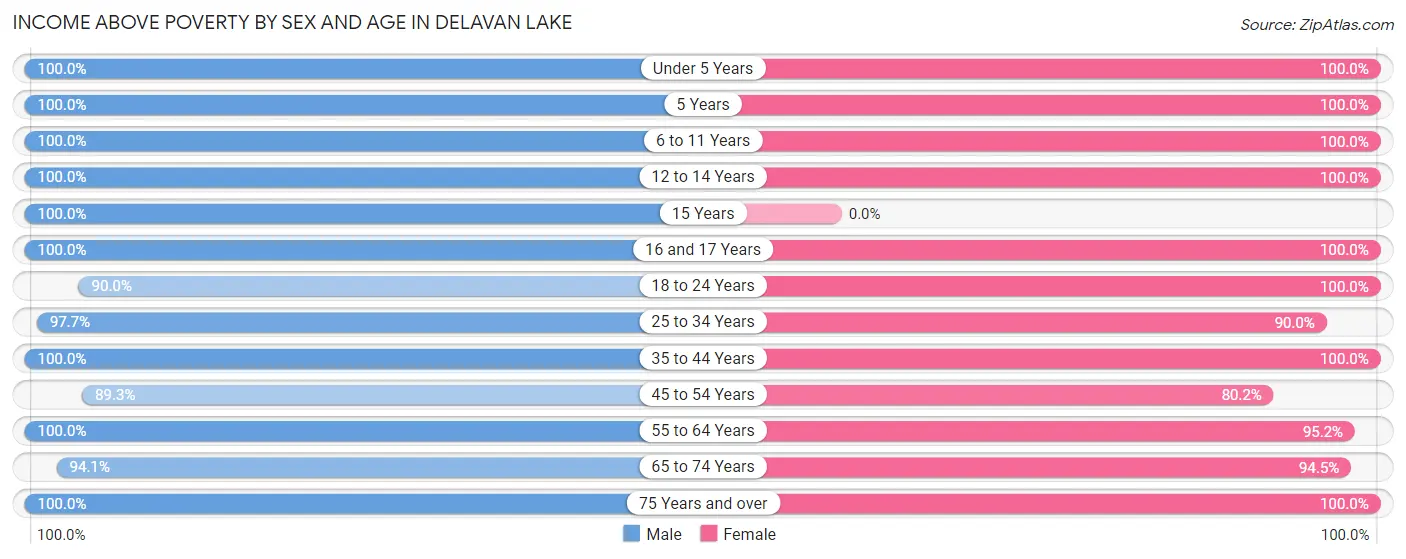
| Age Bracket | Male | Female |
| Under 5 Years | 76 (100.0%) | 89 (100.0%) |
| 5 Years | 3 (100.0%) | 14 (100.0%) |
| 6 to 11 Years | 145 (100.0%) | 57 (100.0%) |
| 12 to 14 Years | 33 (100.0%) | 4 (100.0%) |
| 15 Years | 5 (100.0%) | 0 (0.0%) |
| 16 and 17 Years | 14 (100.0%) | 23 (100.0%) |
| 18 to 24 Years | 260 (90.0%) | 68 (100.0%) |
| 25 to 34 Years | 129 (97.7%) | 126 (90.0%) |
| 35 to 44 Years | 88 (100.0%) | 99 (100.0%) |
| 45 to 54 Years | 218 (89.3%) | 202 (80.2%) |
| 55 to 64 Years | 307 (100.0%) | 180 (95.2%) |
| 65 to 74 Years | 158 (94.1%) | 173 (94.5%) |
| 75 Years and over | 114 (100.0%) | 170 (100.0%) |
| Total | 1,550 (95.8%) | 1,205 (93.6%) |
Income Below Poverty Among Married-Couple Families in Delavan Lake
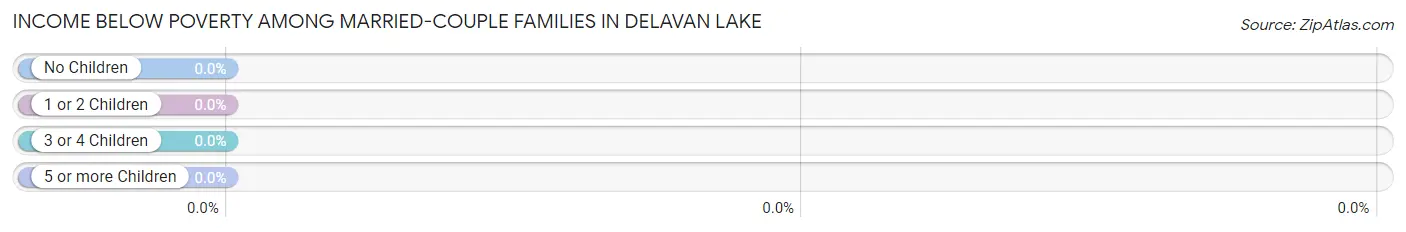
| Children | Above Poverty | Below Poverty |
| No Children | 412 (100.0%) | 0 (0.0%) |
| 1 or 2 Children | 84 (100.0%) | 0 (0.0%) |
| 3 or 4 Children | 79 (100.0%) | 0 (0.0%) |
| 5 or more Children | 0 (0.0%) | 0 (0.0%) |
| Total | 575 (100.0%) | 0 (0.0%) |
Income Below Poverty Among Single-Parent Households in Delavan Lake
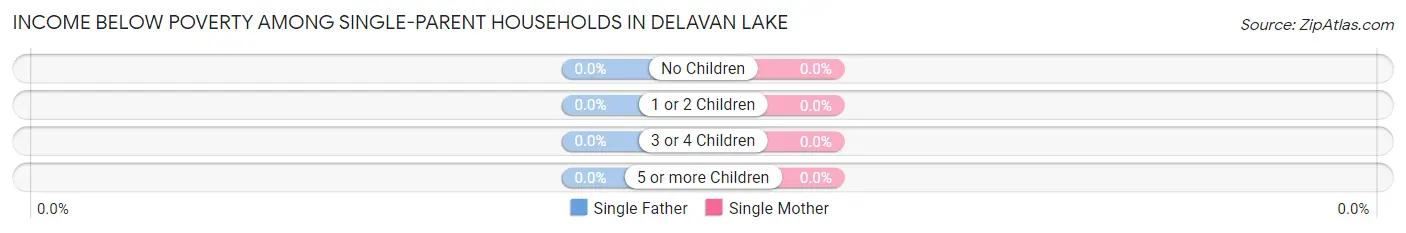
| Children | Single Father | Single Mother |
| No Children | 0 (0.0%) | 0 (0.0%) |
| 1 or 2 Children | 0 (0.0%) | 0 (0.0%) |
| 3 or 4 Children | 0 (0.0%) | 0 (0.0%) |
| 5 or more Children | 0 (0.0%) | 0 (0.0%) |
| Total | 0 (0.0%) | 0 (0.0%) |
Income Below Poverty Among Married-Couple vs Single-Parent Households in Delavan Lake
| Children | Married-Couple Families | Single-Parent Households |
| No Children | 0 (0.0%) | 0 (0.0%) |
| 1 or 2 Children | 0 (0.0%) | 0 (0.0%) |
| 3 or 4 Children | 0 (0.0%) | 0 (0.0%) |
| 5 or more Children | 0 (0.0%) | 0 (0.0%) |
| Total | 0 (0.0%) | 0 (0.0%) |
Employment Characteristics in Delavan Lake
Employment by Class of Employer in Delavan Lake
Among the 1,384 employed individuals in Delavan Lake, private company employees (1,067 | 77.1%), local government employees (106 | 7.7%), and self-employed (not incorporated) (76 | 5.5%) make up the most common classes of employment.
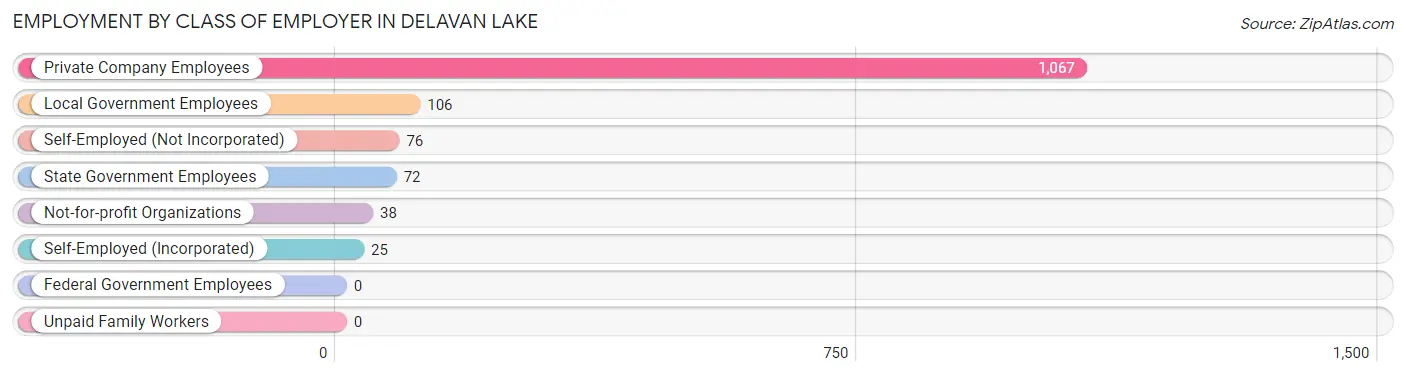
| Employer Class | # Employees | % Employees |
| Private Company Employees | 1,067 | 77.1% |
| Self-Employed (Incorporated) | 25 | 1.8% |
| Self-Employed (Not Incorporated) | 76 | 5.5% |
| Not-for-profit Organizations | 38 | 2.8% |
| Local Government Employees | 106 | 7.7% |
| State Government Employees | 72 | 5.2% |
| Federal Government Employees | 0 | 0.0% |
| Unpaid Family Workers | 0 | 0.0% |
| Total | 1,384 | 100.0% |
Employment Status by Age in Delavan Lake
According to the labor force statistics for Delavan Lake, out of the total population over 16 years of age (2,500), 57.4% or 1,435 individuals are in the labor force, with 2.2% or 32 of them unemployed. The age group with the highest labor force participation rate is 30 to 34 years, with 100.0% or 156 individuals in the labor force. Within the labor force, the 65 to 74 years age range has the highest percentage of unemployed individuals, with 6.5% or 8 of them being unemployed.
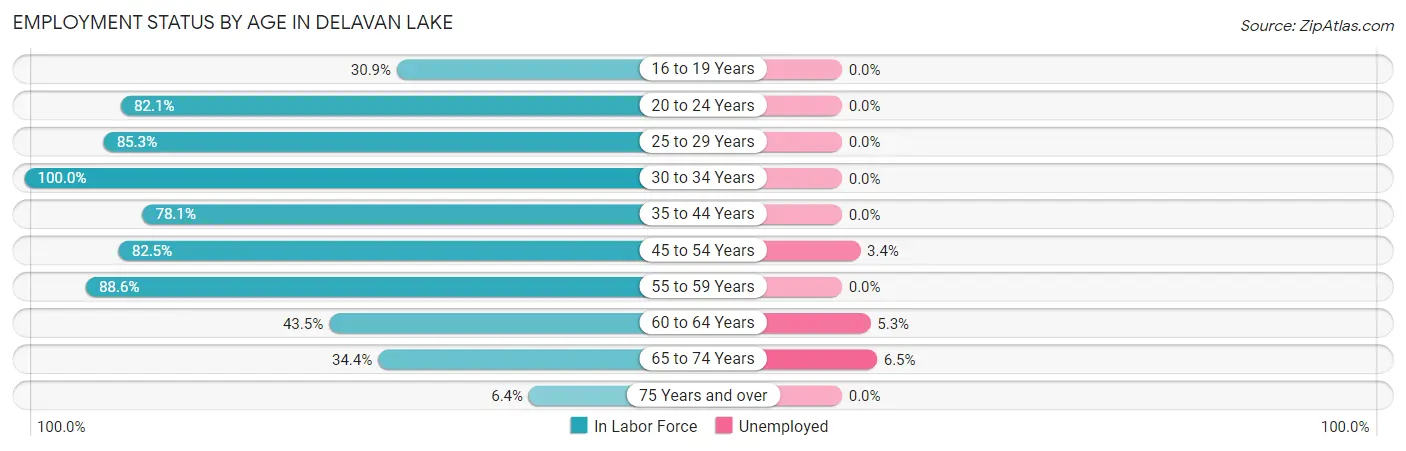
| Age Bracket | In Labor Force | Unemployed |
| 16 to 19 Years | 63 (30.9%) | 0 (0.0%) |
| 20 to 24 Years | 156 (82.1%) | 0 (0.0%) |
| 25 to 29 Years | 99 (85.3%) | 0 (0.0%) |
| 30 to 34 Years | 156 (100.0%) | 0 (0.0%) |
| 35 to 44 Years | 146 (78.1%) | 0 (0.0%) |
| 45 to 54 Years | 409 (82.5%) | 14 (3.4%) |
| 55 to 59 Years | 93 (88.6%) | 0 (0.0%) |
| 60 to 64 Years | 170 (43.5%) | 9 (5.3%) |
| 65 to 74 Years | 124 (34.4%) | 8 (6.5%) |
| 75 Years and over | 19 (6.4%) | 0 (0.0%) |
| Total | 1,435 (57.4%) | 32 (2.2%) |
Employment Status by Educational Attainment in Delavan Lake
According to labor force statistics for Delavan Lake, 73.9% of individuals (1,072) out of the total population between 25 and 64 years of age (1,451) are in the labor force, with 2.1% or 23 of them being unemployed. The group with the highest labor force participation rate are those with the educational attainment of bachelor's degree or higher, with 93.9% or 291 individuals in the labor force. Within the labor force, individuals with high school diploma education have the highest percentage of unemployment, with 5.3% or 14 of them being unemployed.
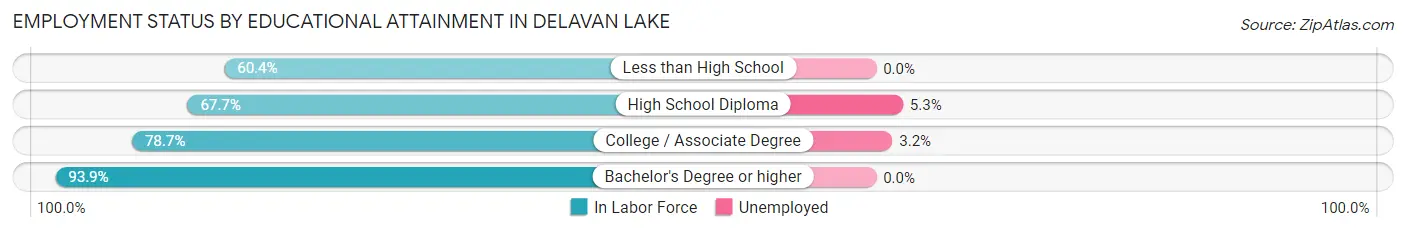
| Educational Attainment | In Labor Force | Unemployed |
| Less than High School | 239 (60.4%) | 0 (0.0%) |
| High School Diploma | 266 (67.7%) | 21 (5.3%) |
| College / Associate Degree | 277 (78.7%) | 11 (3.2%) |
| Bachelor's Degree or higher | 291 (93.9%) | 0 (0.0%) |
| Total | 1,072 (73.9%) | 30 (2.1%) |
Employment Occupations by Sex in Delavan Lake
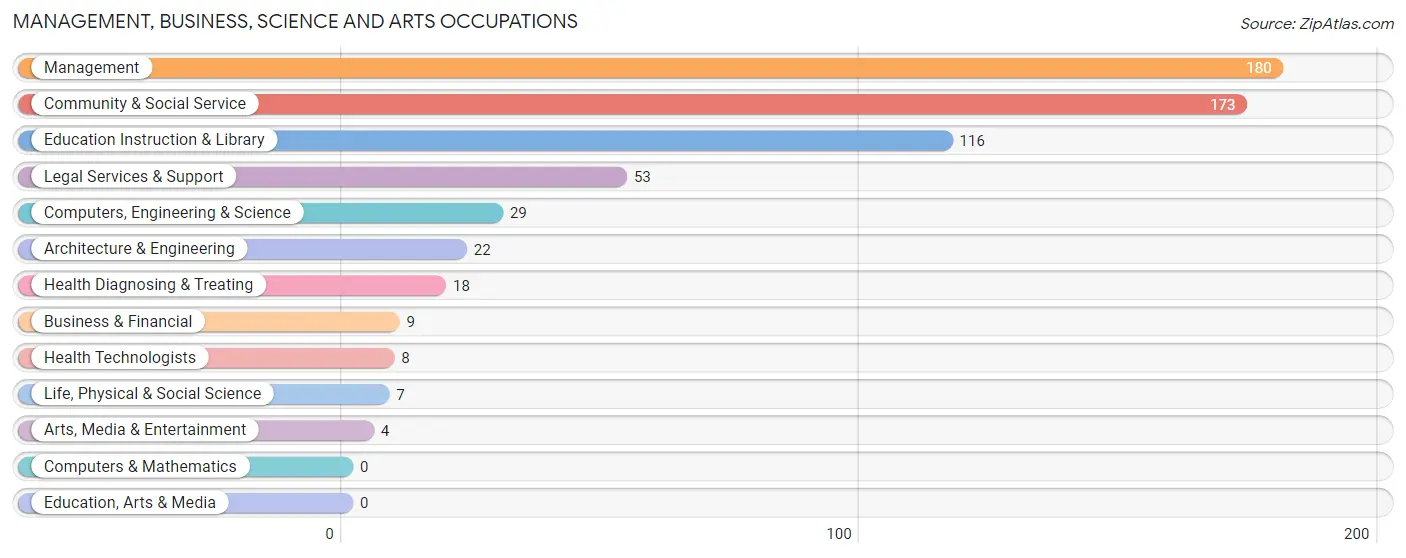
Management, Business, Science and Arts Occupations
The most common Management, Business, Science and Arts occupations in Delavan Lake are Management (180 | 12.8%), Community & Social Service (173 | 12.3%), Education Instruction & Library (116 | 8.3%), Legal Services & Support (53 | 3.8%), and Computers, Engineering & Science (29 | 2.1%).
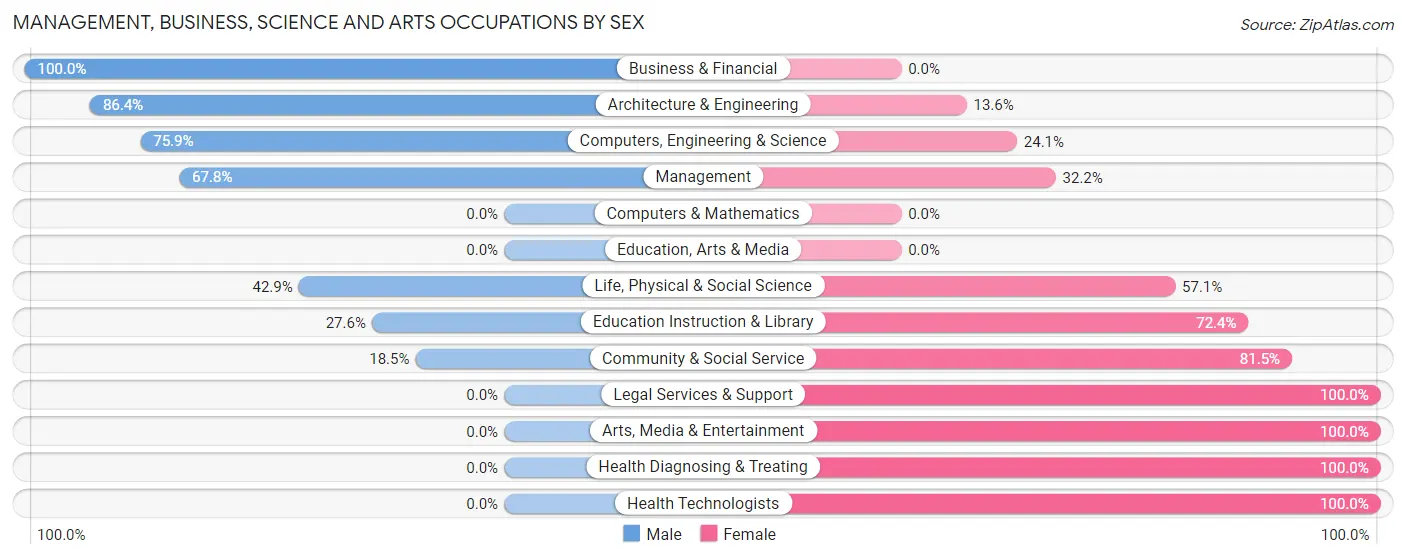
Management, Business, Science and Arts Occupations by Sex
Within the Management, Business, Science and Arts occupations in Delavan Lake, the most male-oriented occupations are Business & Financial (100.0%), Architecture & Engineering (86.4%), and Computers, Engineering & Science (75.9%), while the most female-oriented occupations are Legal Services & Support (100.0%), Arts, Media & Entertainment (100.0%), and Health Diagnosing & Treating (100.0%).
| Occupation | Male | Female |
| Management | 122 (67.8%) | 58 (32.2%) |
| Business & Financial | 9 (100.0%) | 0 (0.0%) |
| Computers, Engineering & Science | 22 (75.9%) | 7 (24.1%) |
| Computers & Mathematics | 0 (0.0%) | 0 (0.0%) |
| Architecture & Engineering | 19 (86.4%) | 3 (13.6%) |
| Life, Physical & Social Science | 3 (42.9%) | 4 (57.1%) |
| Community & Social Service | 32 (18.5%) | 141 (81.5%) |
| Education, Arts & Media | 0 (0.0%) | 0 (0.0%) |
| Legal Services & Support | 0 (0.0%) | 53 (100.0%) |
| Education Instruction & Library | 32 (27.6%) | 84 (72.4%) |
| Arts, Media & Entertainment | 0 (0.0%) | 4 (100.0%) |
| Health Diagnosing & Treating | 0 (0.0%) | 18 (100.0%) |
| Health Technologists | 0 (0.0%) | 8 (100.0%) |
| Total (Category) | 185 (45.2%) | 224 (54.8%) |
| Total (Overall) | 721 (51.3%) | 683 (48.6%) |
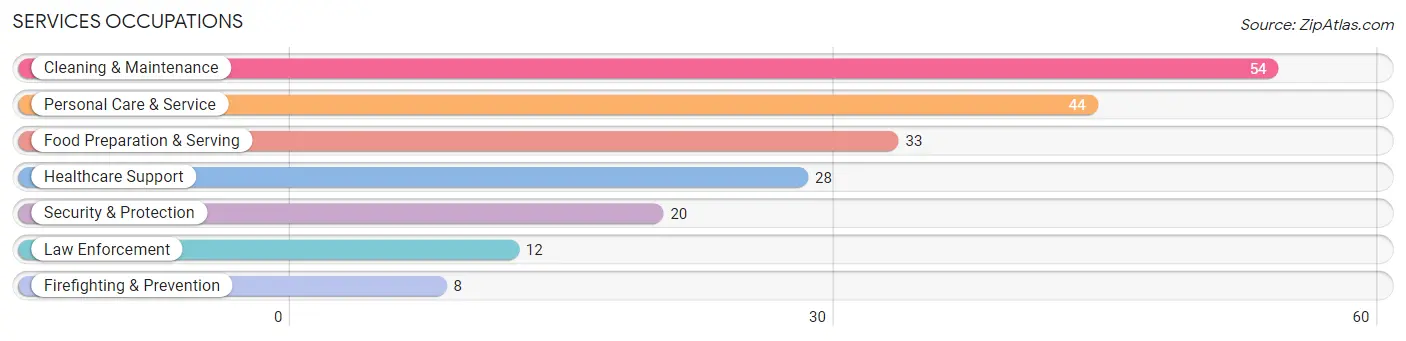
Services Occupations
The most common Services occupations in Delavan Lake are Cleaning & Maintenance (54 | 3.8%), Personal Care & Service (44 | 3.1%), Food Preparation & Serving (33 | 2.4%), Healthcare Support (28 | 2.0%), and Security & Protection (20 | 1.4%).
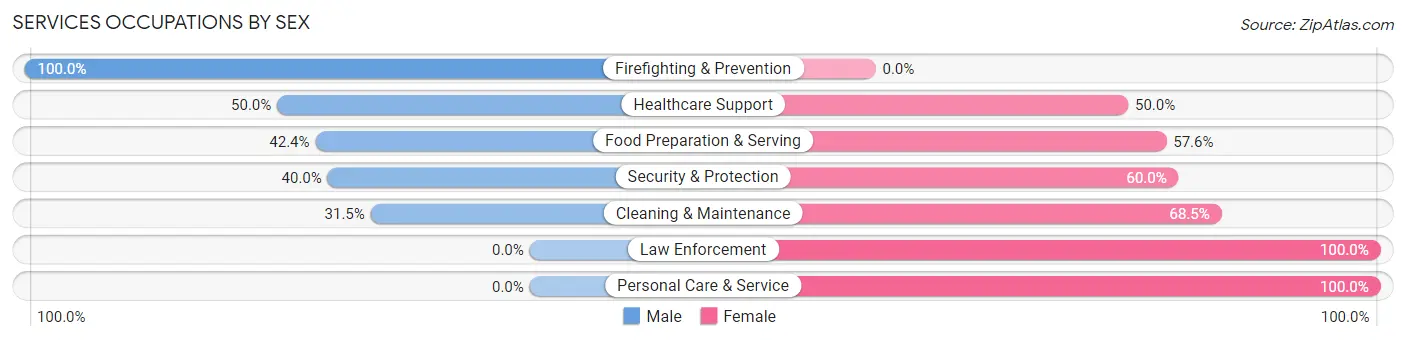
Services Occupations by Sex
Within the Services occupations in Delavan Lake, the most male-oriented occupations are Firefighting & Prevention (100.0%), Healthcare Support (50.0%), and Food Preparation & Serving (42.4%), while the most female-oriented occupations are Law Enforcement (100.0%), Personal Care & Service (100.0%), and Cleaning & Maintenance (68.5%).
| Occupation | Male | Female |
| Healthcare Support | 14 (50.0%) | 14 (50.0%) |
| Security & Protection | 8 (40.0%) | 12 (60.0%) |
| Firefighting & Prevention | 8 (100.0%) | 0 (0.0%) |
| Law Enforcement | 0 (0.0%) | 12 (100.0%) |
| Food Preparation & Serving | 14 (42.4%) | 19 (57.6%) |
| Cleaning & Maintenance | 17 (31.5%) | 37 (68.5%) |
| Personal Care & Service | 0 (0.0%) | 44 (100.0%) |
| Total (Category) | 53 (29.6%) | 126 (70.4%) |
| Total (Overall) | 721 (51.3%) | 683 (48.6%) |
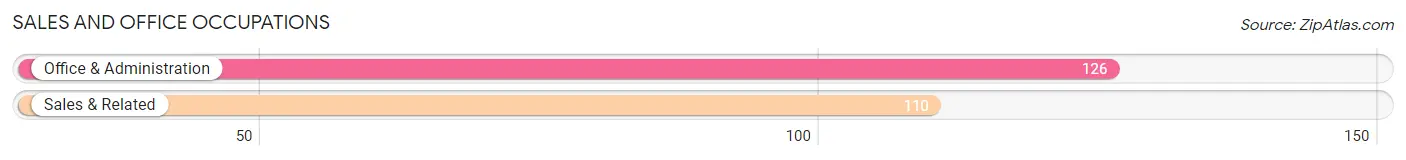
Sales and Office Occupations
The most common Sales and Office occupations in Delavan Lake are Office & Administration (126 | 9.0%), and Sales & Related (110 | 7.8%).
Sales and Office Occupations by Sex
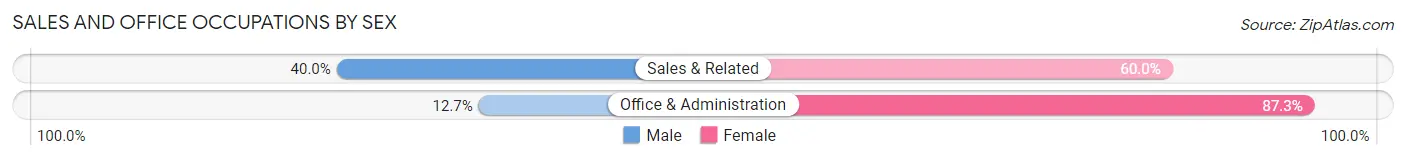
| Occupation | Male | Female |
| Sales & Related | 44 (40.0%) | 66 (60.0%) |
| Office & Administration | 16 (12.7%) | 110 (87.3%) |
| Total (Category) | 60 (25.4%) | 176 (74.6%) |
| Total (Overall) | 721 (51.3%) | 683 (48.6%) |
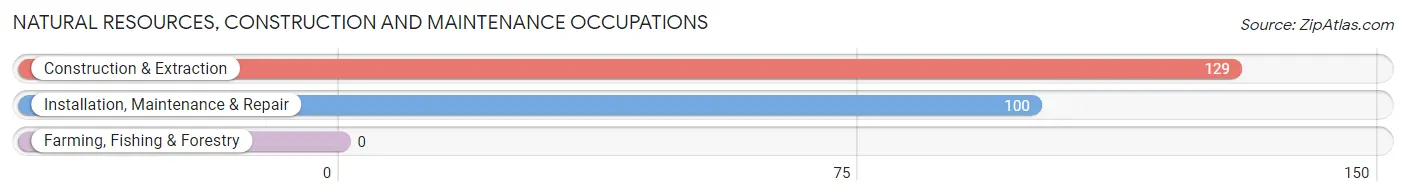
Natural Resources, Construction and Maintenance Occupations
The most common Natural Resources, Construction and Maintenance occupations in Delavan Lake are Construction & Extraction (129 | 9.2%), and Installation, Maintenance & Repair (100 | 7.1%).
Natural Resources, Construction and Maintenance Occupations by Sex
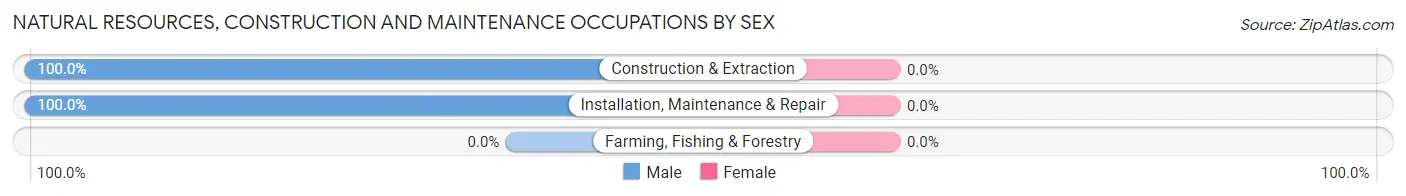
| Occupation | Male | Female |
| Farming, Fishing & Forestry | 0 (0.0%) | 0 (0.0%) |
| Construction & Extraction | 129 (100.0%) | 0 (0.0%) |
| Installation, Maintenance & Repair | 100 (100.0%) | 0 (0.0%) |
| Total (Category) | 229 (100.0%) | 0 (0.0%) |
| Total (Overall) | 721 (51.3%) | 683 (48.6%) |
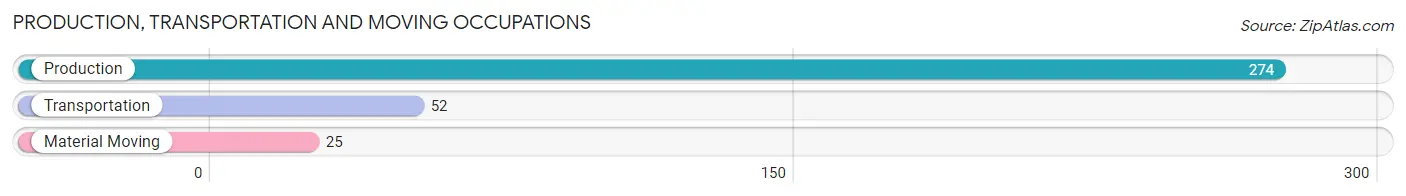
Production, Transportation and Moving Occupations
The most common Production, Transportation and Moving occupations in Delavan Lake are Production (274 | 19.5%), Transportation (52 | 3.7%), and Material Moving (25 | 1.8%).
Production, Transportation and Moving Occupations by Sex
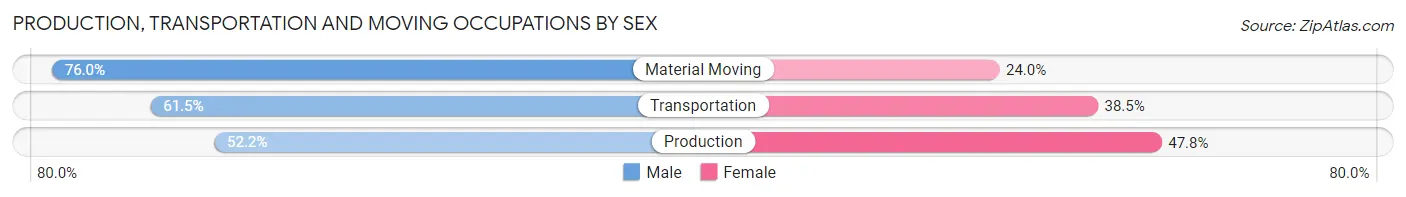
| Occupation | Male | Female |
| Production | 143 (52.2%) | 131 (47.8%) |
| Transportation | 32 (61.5%) | 20 (38.5%) |
| Material Moving | 19 (76.0%) | 6 (24.0%) |
| Total (Category) | 194 (55.3%) | 157 (44.7%) |
| Total (Overall) | 721 (51.3%) | 683 (48.6%) |
Employment Industries by Sex in Delavan Lake
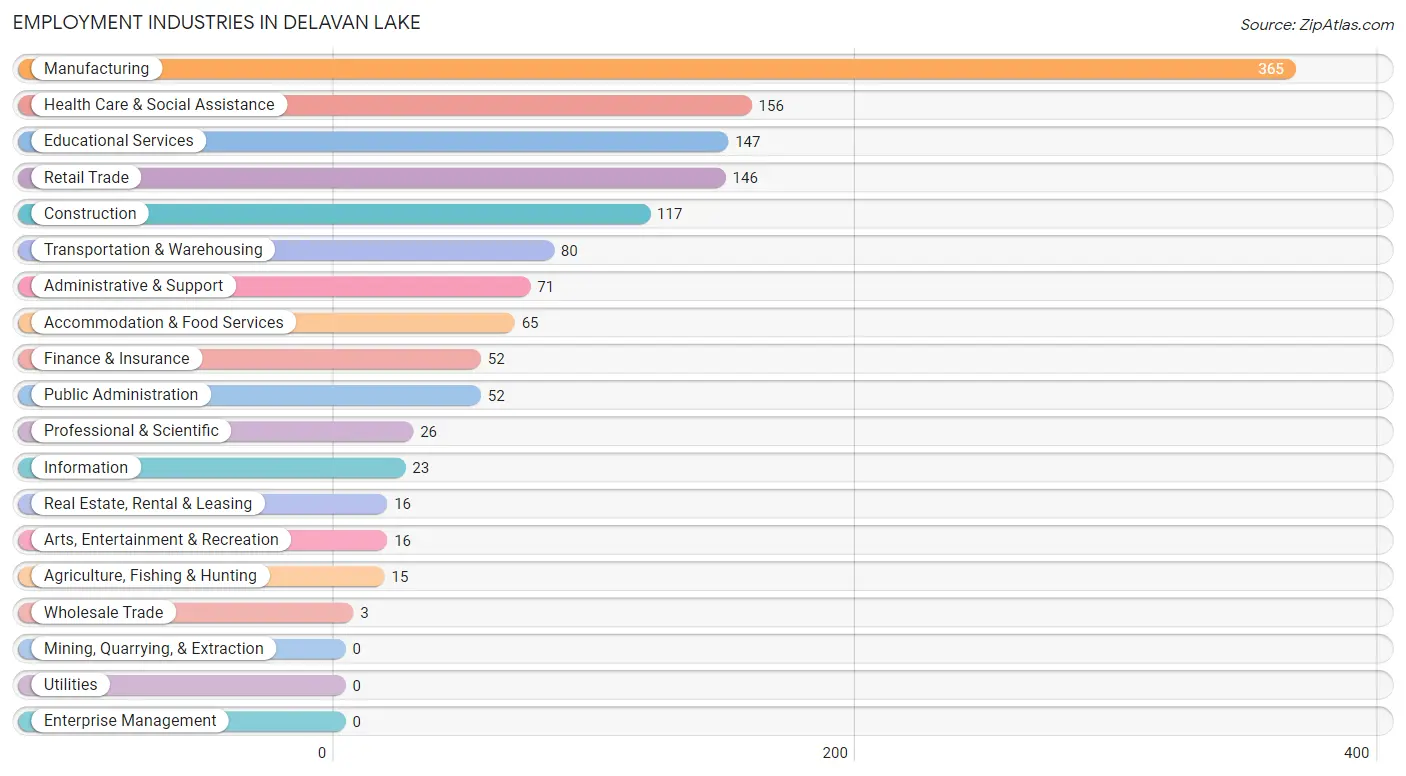
Employment Industries in Delavan Lake
The major employment industries in Delavan Lake include Manufacturing (365 | 26.0%), Health Care & Social Assistance (156 | 11.1%), Educational Services (147 | 10.5%), Retail Trade (146 | 10.4%), and Construction (117 | 8.3%).
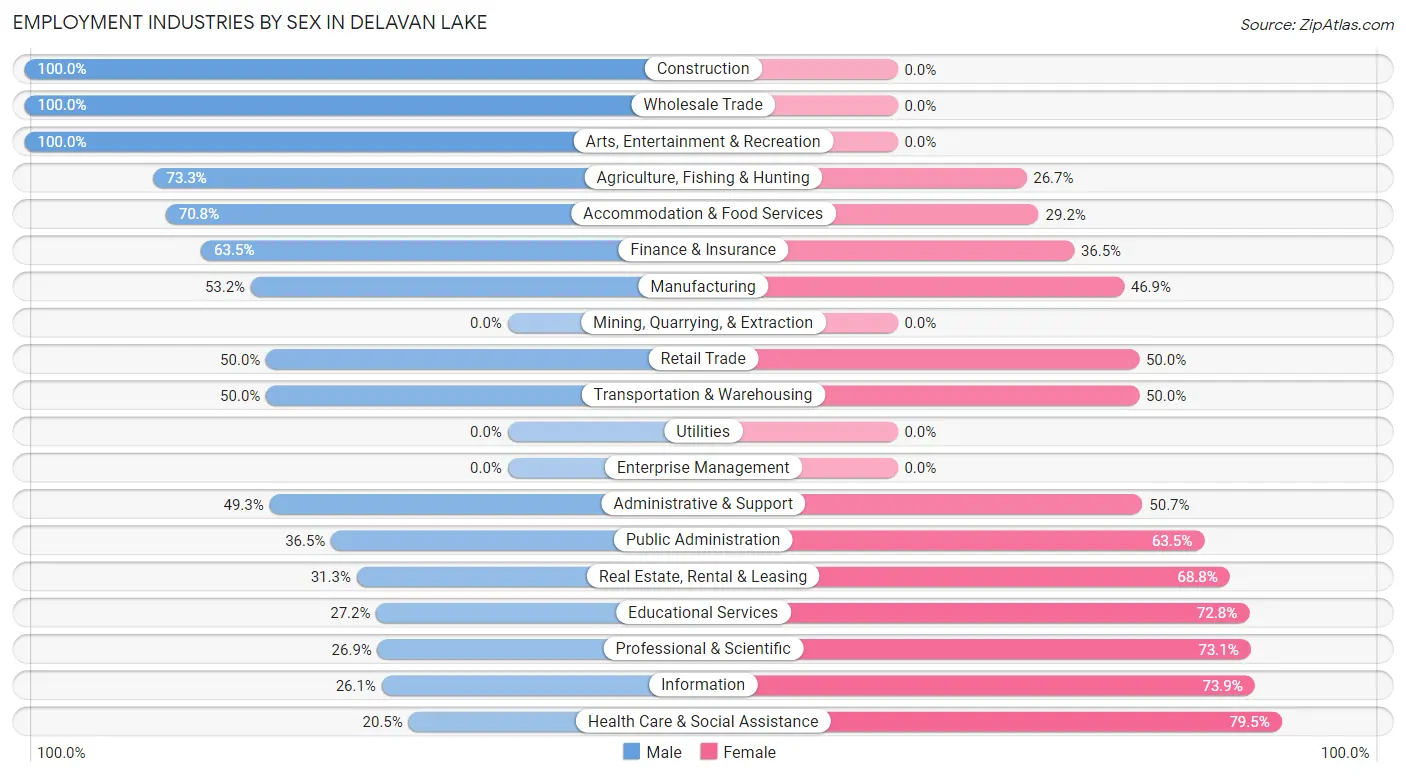
Employment Industries by Sex in Delavan Lake
The Delavan Lake industries that see more men than women are Construction (100.0%), Wholesale Trade (100.0%), and Arts, Entertainment & Recreation (100.0%), whereas the industries that tend to have a higher number of women are Health Care & Social Assistance (79.5%), Information (73.9%), and Professional & Scientific (73.1%).
| Industry | Male | Female |
| Agriculture, Fishing & Hunting | 11 (73.3%) | 4 (26.7%) |
| Mining, Quarrying, & Extraction | 0 (0.0%) | 0 (0.0%) |
| Construction | 117 (100.0%) | 0 (0.0%) |
| Manufacturing | 194 (53.1%) | 171 (46.9%) |
| Wholesale Trade | 3 (100.0%) | 0 (0.0%) |
| Retail Trade | 73 (50.0%) | 73 (50.0%) |
| Transportation & Warehousing | 40 (50.0%) | 40 (50.0%) |
| Utilities | 0 (0.0%) | 0 (0.0%) |
| Information | 6 (26.1%) | 17 (73.9%) |
| Finance & Insurance | 33 (63.5%) | 19 (36.5%) |
| Real Estate, Rental & Leasing | 5 (31.2%) | 11 (68.8%) |
| Professional & Scientific | 7 (26.9%) | 19 (73.1%) |
| Enterprise Management | 0 (0.0%) | 0 (0.0%) |
| Administrative & Support | 35 (49.3%) | 36 (50.7%) |
| Educational Services | 40 (27.2%) | 107 (72.8%) |
| Health Care & Social Assistance | 32 (20.5%) | 124 (79.5%) |
| Arts, Entertainment & Recreation | 16 (100.0%) | 0 (0.0%) |
| Accommodation & Food Services | 46 (70.8%) | 19 (29.2%) |
| Public Administration | 19 (36.5%) | 33 (63.5%) |
| Total | 721 (51.3%) | 683 (48.6%) |
Education in Delavan Lake
School Enrollment in Delavan Lake
The most common levels of schooling among the 555 students in Delavan Lake are elementary school (161 | 29.0%), high school (110 | 19.8%), and nursery / preschool (89 | 16.0%).
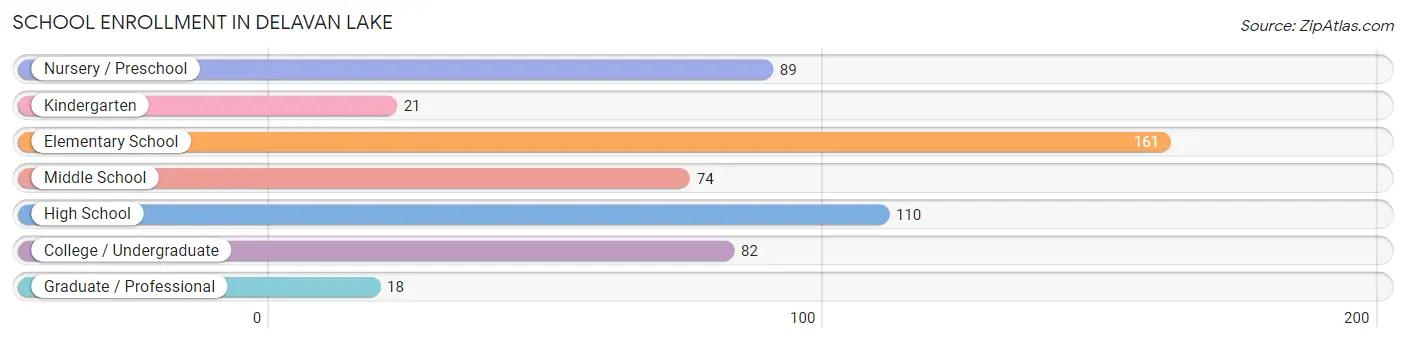
| School Level | # Students | % Students |
| Nursery / Preschool | 89 | 16.0% |
| Kindergarten | 21 | 3.8% |
| Elementary School | 161 | 29.0% |
| Middle School | 74 | 13.3% |
| High School | 110 | 19.8% |
| College / Undergraduate | 82 | 14.8% |
| Graduate / Professional | 18 | 3.2% |
| Total | 555 | 100.0% |
School Enrollment by Age by Funding Source in Delavan Lake
Out of a total of 555 students who are enrolled in schools in Delavan Lake, 151 (27.2%) attend a private institution, while the remaining 404 (72.8%) are enrolled in public schools. The age group of 35 years and over has the highest likelihood of being enrolled in private schools, with 12 (100.0% in the age bracket) enrolled. Conversely, the age group of 3 to 4 year olds has the lowest likelihood of being enrolled in a private school, with 89 (100.0% in the age bracket) attending a public institution.
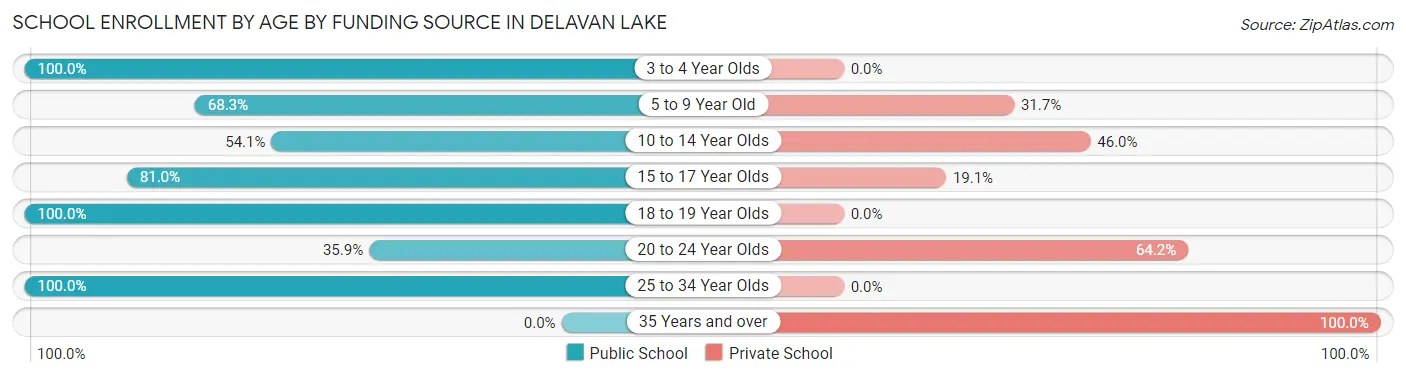
| Age Bracket | Public School | Private School |
| 3 to 4 Year Olds | 89 (100.0%) | 0 (0.0%) |
| 5 to 9 Year Old | 99 (68.3%) | 46 (31.7%) |
| 10 to 14 Year Olds | 60 (54.0%) | 51 (46.0%) |
| 15 to 17 Year Olds | 34 (80.9%) | 8 (19.1%) |
| 18 to 19 Year Olds | 91 (100.0%) | 0 (0.0%) |
| 20 to 24 Year Olds | 19 (35.8%) | 34 (64.1%) |
| 25 to 34 Year Olds | 12 (100.0%) | 0 (0.0%) |
| 35 Years and over | 0 (0.0%) | 12 (100.0%) |
| Total | 404 (72.8%) | 151 (27.2%) |
Educational Attainment by Field of Study in Delavan Lake
Business (114 | 20.2%), education (78 | 13.8%), communications (67 | 11.9%), liberal arts & history (55 | 9.7%), and social sciences (53 | 9.4%) are the most common fields of study among 565 individuals in Delavan Lake who have obtained a bachelor's degree or higher.
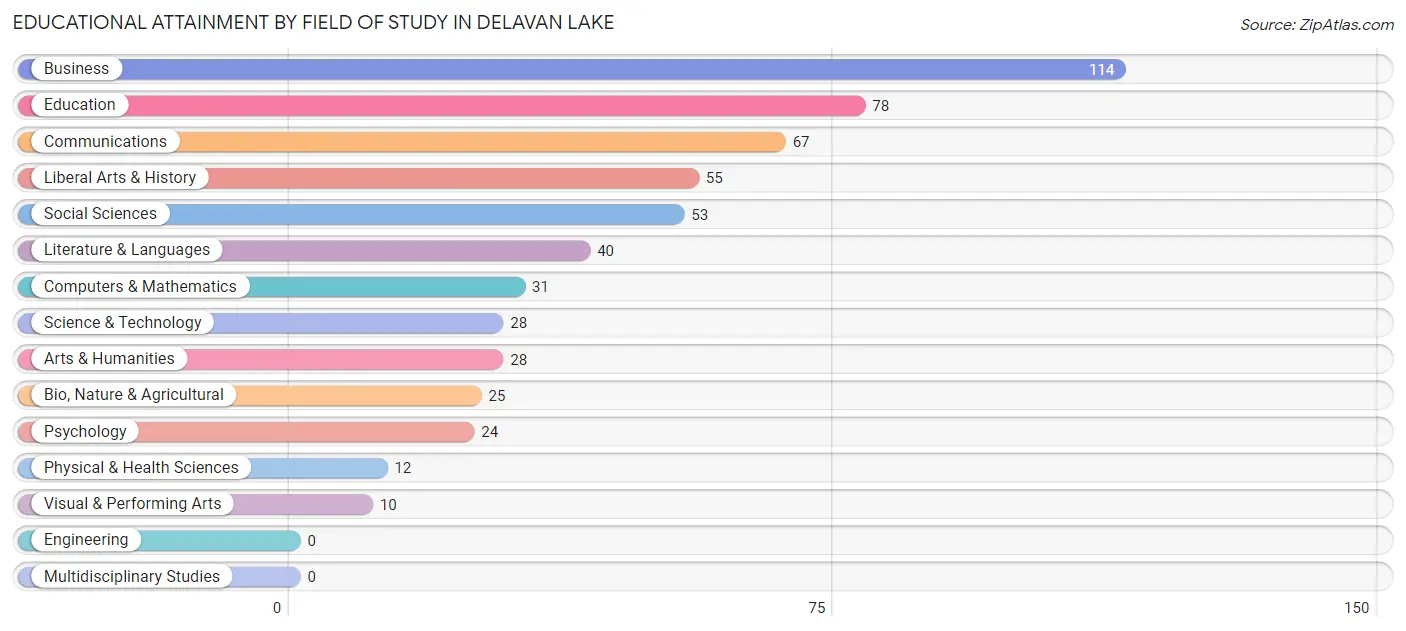
| Field of Study | # Graduates | % Graduates |
| Computers & Mathematics | 31 | 5.5% |
| Bio, Nature & Agricultural | 25 | 4.4% |
| Physical & Health Sciences | 12 | 2.1% |
| Psychology | 24 | 4.3% |
| Social Sciences | 53 | 9.4% |
| Engineering | 0 | 0.0% |
| Multidisciplinary Studies | 0 | 0.0% |
| Science & Technology | 28 | 5.0% |
| Business | 114 | 20.2% |
| Education | 78 | 13.8% |
| Literature & Languages | 40 | 7.1% |
| Liberal Arts & History | 55 | 9.7% |
| Visual & Performing Arts | 10 | 1.8% |
| Communications | 67 | 11.9% |
| Arts & Humanities | 28 | 5.0% |
| Total | 565 | 100.0% |
Transportation & Commute in Delavan Lake
Vehicle Availability by Sex in Delavan Lake
The most prevalent vehicle ownership categories in Delavan Lake are males with 5 or more vehicles (249, accounting for 34.7%) and females with 5 or more vehicles (232, making up 37.6%).
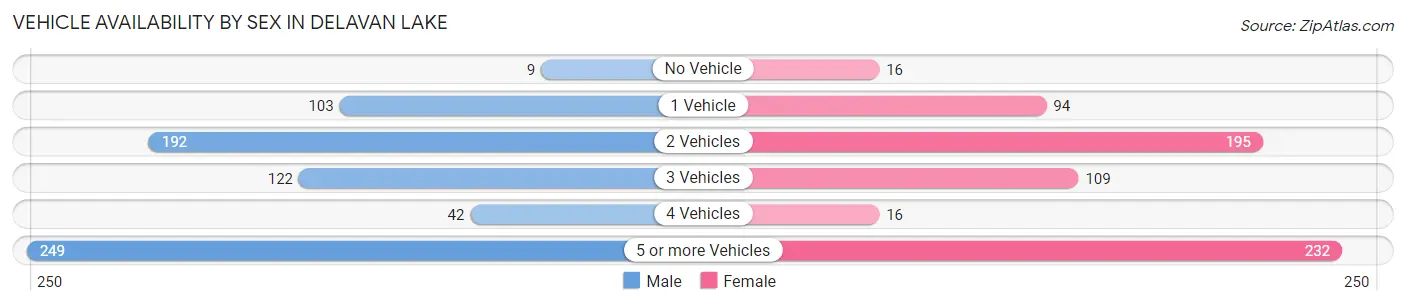
| Vehicles Available | Male | Female |
| No Vehicle | 9 (1.3%) | 16 (2.4%) |
| 1 Vehicle | 103 (14.4%) | 94 (14.2%) |
| 2 Vehicles | 192 (26.8%) | 195 (29.5%) |
| 3 Vehicles | 122 (17.0%) | 109 (16.5%) |
| 4 Vehicles | 42 (5.9%) | 16 (2.4%) |
| 5 or more Vehicles | 249 (34.7%) | 232 (35.0%) |
| Total | 717 (100.0%) | 662 (100.0%) |
Commute Time in Delavan Lake
The most frequently occuring commute durations in Delavan Lake are 10 to 14 minutes (336 commuters, 26.3%), 30 to 34 minutes (253 commuters, 19.8%), and 15 to 19 minutes (160 commuters, 12.5%).
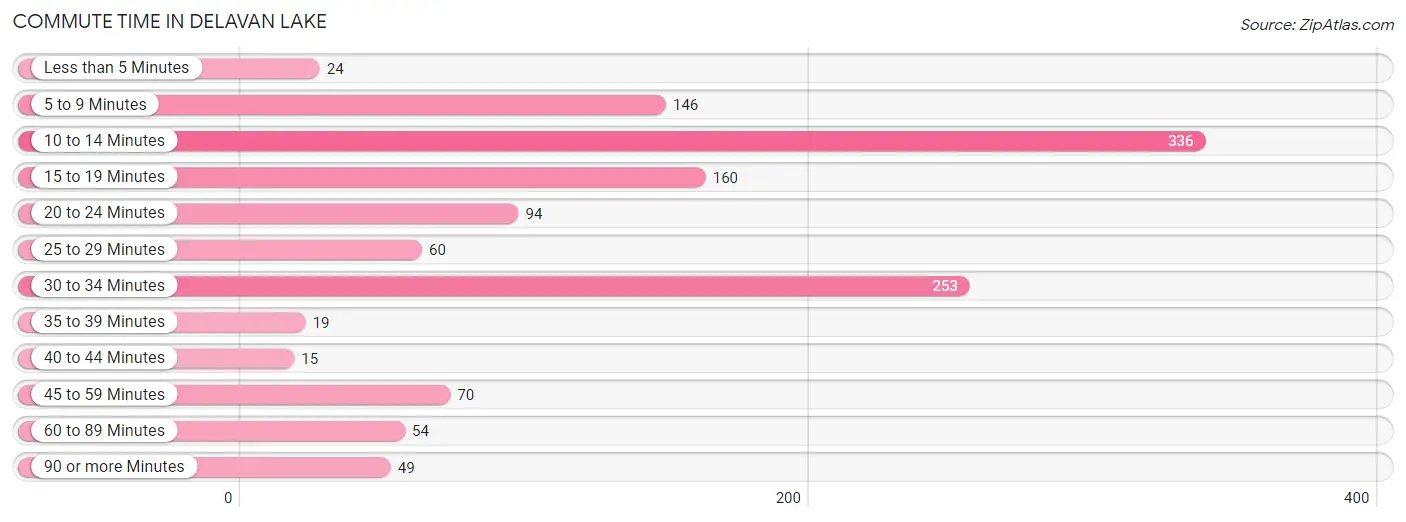
| Commute Time | # Commuters | % Commuters |
| Less than 5 Minutes | 24 | 1.9% |
| 5 to 9 Minutes | 146 | 11.4% |
| 10 to 14 Minutes | 336 | 26.3% |
| 15 to 19 Minutes | 160 | 12.5% |
| 20 to 24 Minutes | 94 | 7.3% |
| 25 to 29 Minutes | 60 | 4.7% |
| 30 to 34 Minutes | 253 | 19.8% |
| 35 to 39 Minutes | 19 | 1.5% |
| 40 to 44 Minutes | 15 | 1.2% |
| 45 to 59 Minutes | 70 | 5.5% |
| 60 to 89 Minutes | 54 | 4.2% |
| 90 or more Minutes | 49 | 3.8% |
Commute Time by Sex in Delavan Lake
The most common commute times in Delavan Lake are 10 to 14 minutes (196 commuters, 28.8%) for males and 10 to 14 minutes (140 commuters, 23.4%) for females.
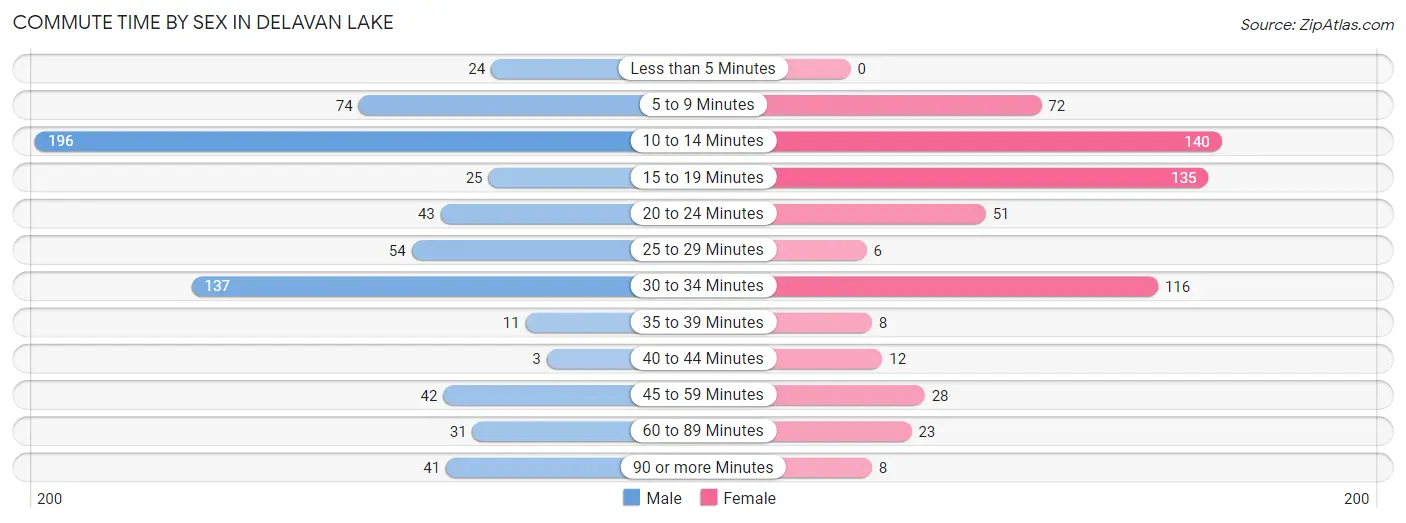
| Commute Time | Male | Female |
| Less than 5 Minutes | 24 (3.5%) | 0 (0.0%) |
| 5 to 9 Minutes | 74 (10.9%) | 72 (12.0%) |
| 10 to 14 Minutes | 196 (28.8%) | 140 (23.4%) |
| 15 to 19 Minutes | 25 (3.7%) | 135 (22.5%) |
| 20 to 24 Minutes | 43 (6.3%) | 51 (8.5%) |
| 25 to 29 Minutes | 54 (7.9%) | 6 (1.0%) |
| 30 to 34 Minutes | 137 (20.1%) | 116 (19.4%) |
| 35 to 39 Minutes | 11 (1.6%) | 8 (1.3%) |
| 40 to 44 Minutes | 3 (0.4%) | 12 (2.0%) |
| 45 to 59 Minutes | 42 (6.2%) | 28 (4.7%) |
| 60 to 89 Minutes | 31 (4.5%) | 23 (3.8%) |
| 90 or more Minutes | 41 (6.0%) | 8 (1.3%) |
Time of Departure to Work by Sex in Delavan Lake
The most frequent times of departure to work in Delavan Lake are 6:00 AM to 6:29 AM (106, 15.6%) for males and 7:30 AM to 7:59 AM (123, 20.5%) for females.
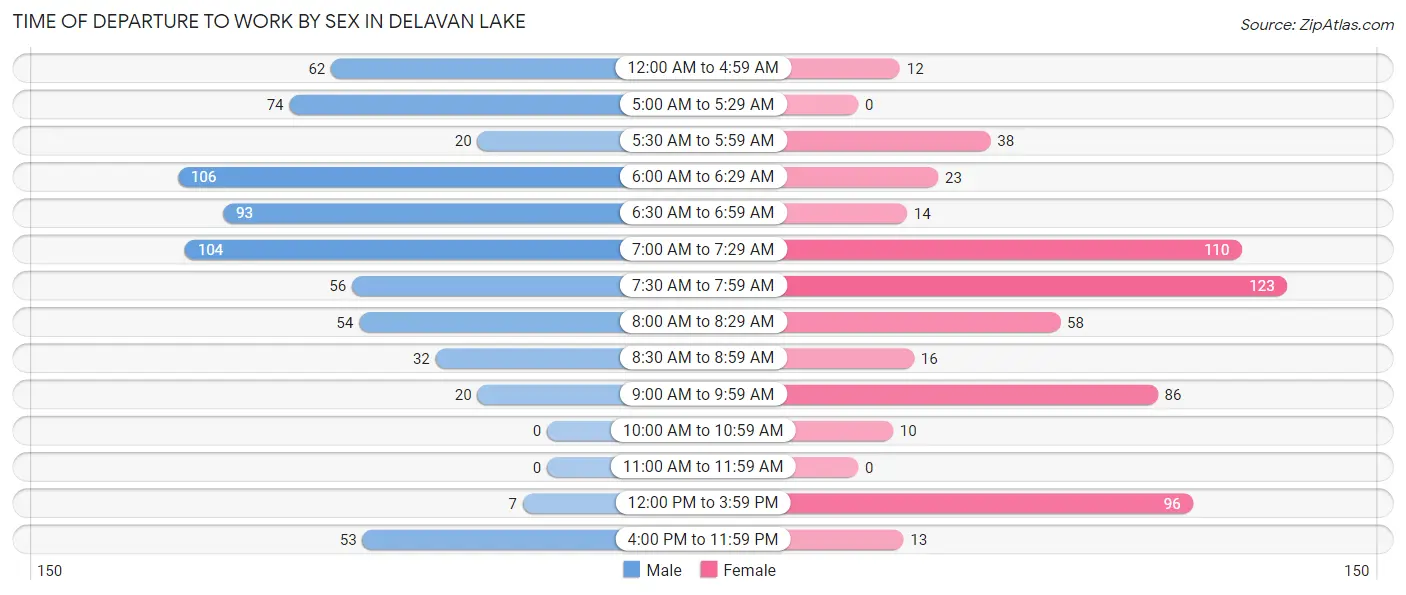
| Time of Departure | Male | Female |
| 12:00 AM to 4:59 AM | 62 (9.1%) | 12 (2.0%) |
| 5:00 AM to 5:29 AM | 74 (10.9%) | 0 (0.0%) |
| 5:30 AM to 5:59 AM | 20 (2.9%) | 38 (6.3%) |
| 6:00 AM to 6:29 AM | 106 (15.6%) | 23 (3.8%) |
| 6:30 AM to 6:59 AM | 93 (13.7%) | 14 (2.3%) |
| 7:00 AM to 7:29 AM | 104 (15.3%) | 110 (18.4%) |
| 7:30 AM to 7:59 AM | 56 (8.2%) | 123 (20.5%) |
| 8:00 AM to 8:29 AM | 54 (7.9%) | 58 (9.7%) |
| 8:30 AM to 8:59 AM | 32 (4.7%) | 16 (2.7%) |
| 9:00 AM to 9:59 AM | 20 (2.9%) | 86 (14.4%) |
| 10:00 AM to 10:59 AM | 0 (0.0%) | 10 (1.7%) |
| 11:00 AM to 11:59 AM | 0 (0.0%) | 0 (0.0%) |
| 12:00 PM to 3:59 PM | 7 (1.0%) | 96 (16.0%) |
| 4:00 PM to 11:59 PM | 53 (7.8%) | 13 (2.2%) |
| Total | 681 (100.0%) | 599 (100.0%) |
Housing Occupancy in Delavan Lake
Occupancy by Ownership in Delavan Lake
Of the total 1,232 dwellings in Delavan Lake, owner-occupied units account for 1,066 (86.5%), while renter-occupied units make up 166 (13.5%).
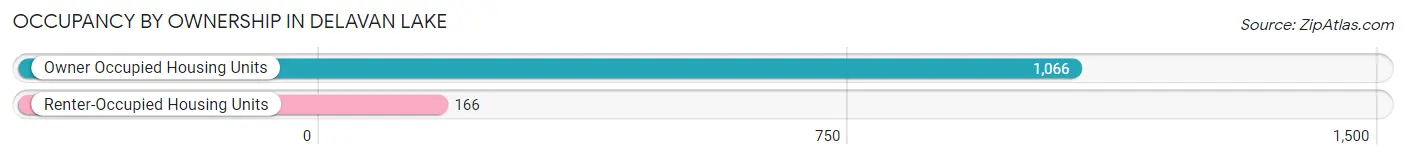
| Occupancy | # Housing Units | % Housing Units |
| Owner Occupied Housing Units | 1,066 | 86.5% |
| Renter-Occupied Housing Units | 166 | 13.5% |
| Total Occupied Housing Units | 1,232 | 100.0% |
Occupancy by Household Size in Delavan Lake
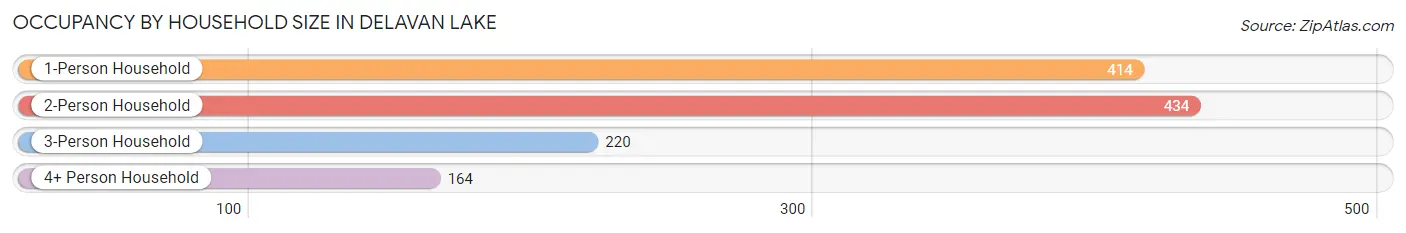
| Household Size | # Housing Units | % Housing Units |
| 1-Person Household | 414 | 33.6% |
| 2-Person Household | 434 | 35.2% |
| 3-Person Household | 220 | 17.9% |
| 4+ Person Household | 164 | 13.3% |
| Total Housing Units | 1,232 | 100.0% |
Occupancy by Ownership by Household Size in Delavan Lake
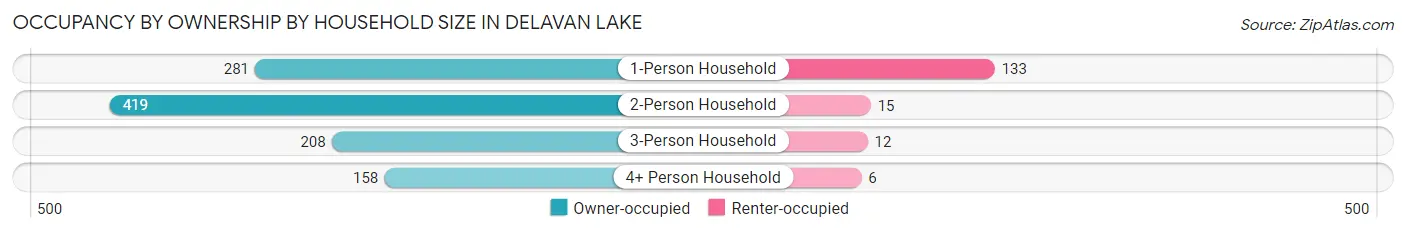
| Household Size | Owner-occupied | Renter-occupied |
| 1-Person Household | 281 (67.9%) | 133 (32.1%) |
| 2-Person Household | 419 (96.5%) | 15 (3.5%) |
| 3-Person Household | 208 (94.6%) | 12 (5.4%) |
| 4+ Person Household | 158 (96.3%) | 6 (3.7%) |
| Total Housing Units | 1,066 (86.5%) | 166 (13.5%) |
Occupancy by Educational Attainment in Delavan Lake
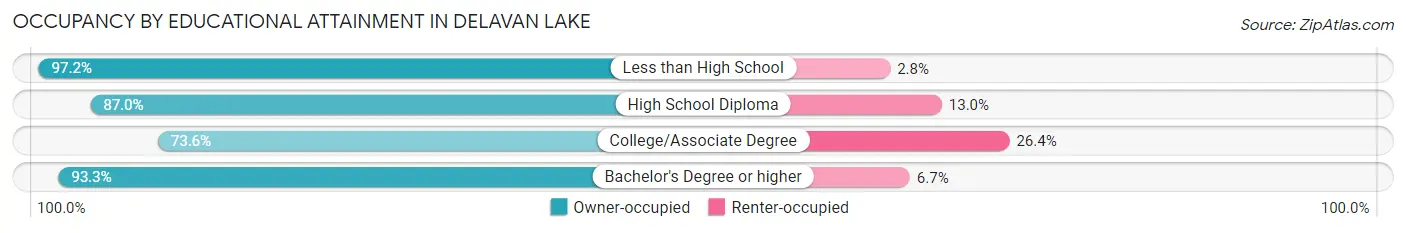
| Household Size | Owner-occupied | Renter-occupied |
| Less than High School | 244 (97.2%) | 7 (2.8%) |
| High School Diploma | 287 (87.0%) | 43 (13.0%) |
| College/Associate Degree | 270 (73.6%) | 97 (26.4%) |
| Bachelor's Degree or higher | 265 (93.3%) | 19 (6.7%) |
Occupancy by Age of Householder in Delavan Lake
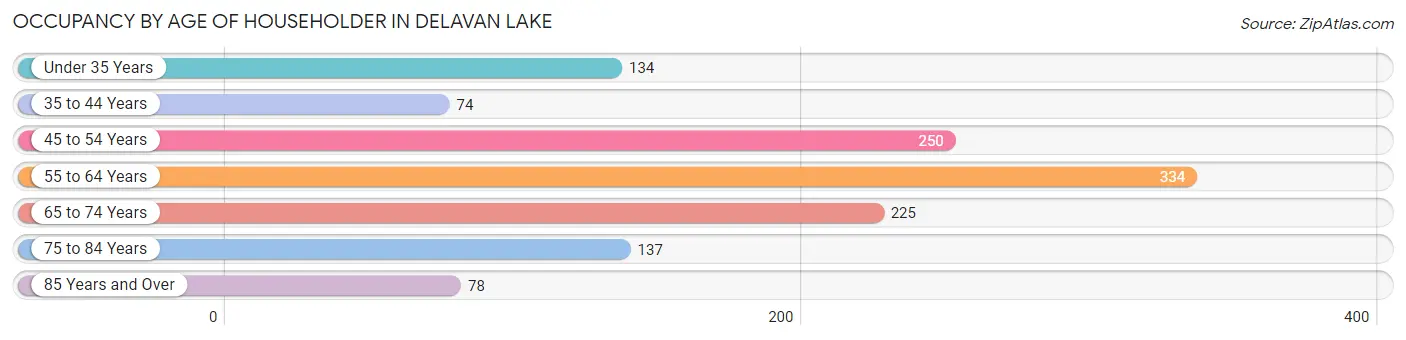
| Age Bracket | # Households | % Households |
| Under 35 Years | 134 | 10.9% |
| 35 to 44 Years | 74 | 6.0% |
| 45 to 54 Years | 250 | 20.3% |
| 55 to 64 Years | 334 | 27.1% |
| 65 to 74 Years | 225 | 18.3% |
| 75 to 84 Years | 137 | 11.1% |
| 85 Years and Over | 78 | 6.3% |
| Total | 1,232 | 100.0% |
Housing Finances in Delavan Lake
Median Income by Occupancy in Delavan Lake
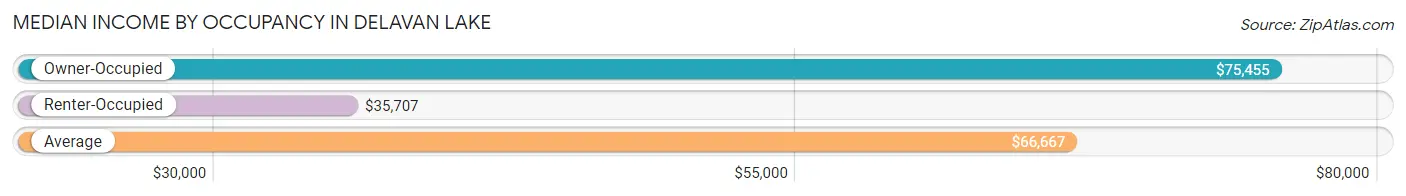
| Occupancy Type | # Households | Median Income |
| Owner-Occupied | 1,066 (86.5%) | $75,455 |
| Renter-Occupied | 166 (13.5%) | $35,707 |
| Average | 1,232 (100.0%) | $66,667 |
Occupancy by Householder Income Bracket in Delavan Lake
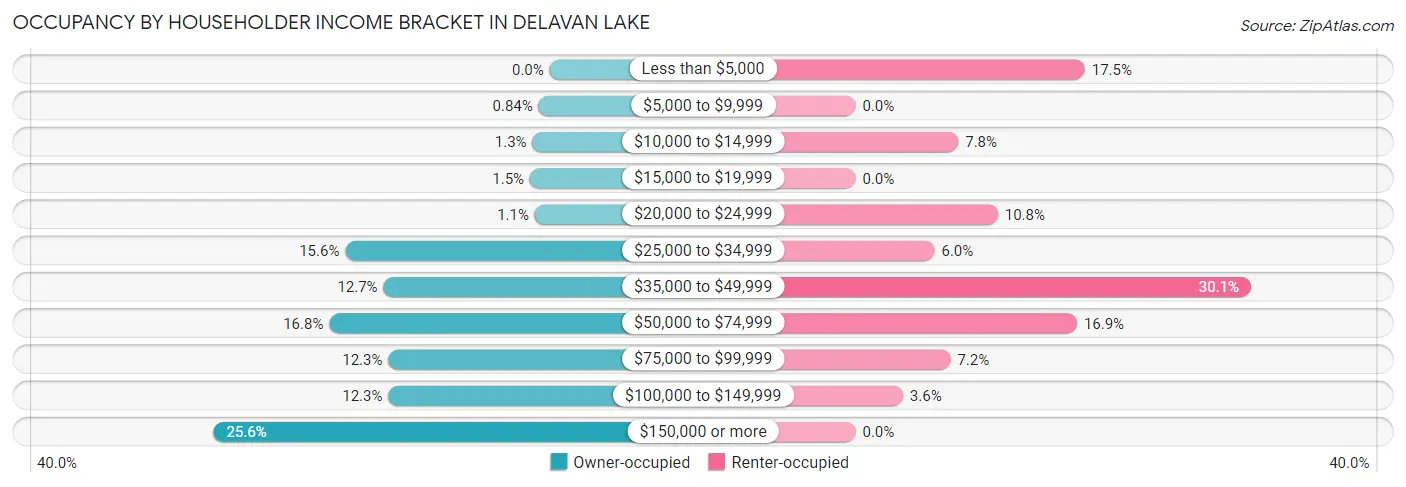
| Income Bracket | Owner-occupied | Renter-occupied |
| Less than $5,000 | 0 (0.0%) | 29 (17.5%) |
| $5,000 to $9,999 | 9 (0.8%) | 0 (0.0%) |
| $10,000 to $14,999 | 14 (1.3%) | 13 (7.8%) |
| $15,000 to $19,999 | 16 (1.5%) | 0 (0.0%) |
| $20,000 to $24,999 | 12 (1.1%) | 18 (10.8%) |
| $25,000 to $34,999 | 166 (15.6%) | 10 (6.0%) |
| $35,000 to $49,999 | 135 (12.7%) | 50 (30.1%) |
| $50,000 to $74,999 | 179 (16.8%) | 28 (16.9%) |
| $75,000 to $99,999 | 131 (12.3%) | 12 (7.2%) |
| $100,000 to $149,999 | 131 (12.3%) | 6 (3.6%) |
| $150,000 or more | 273 (25.6%) | 0 (0.0%) |
| Total | 1,066 (100.0%) | 166 (100.0%) |
Monthly Housing Cost Tiers in Delavan Lake
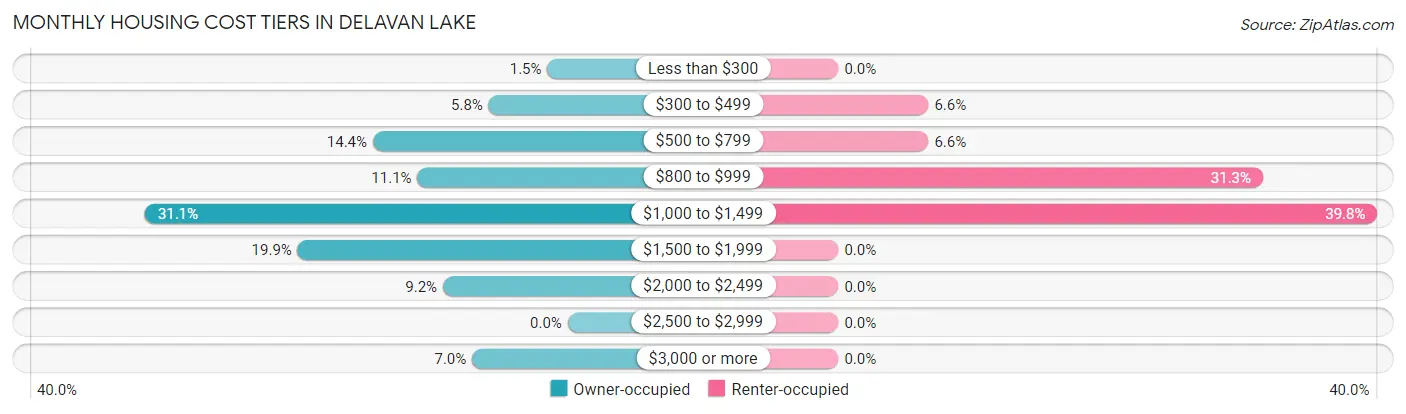
| Monthly Cost | Owner-occupied | Renter-occupied |
| Less than $300 | 16 (1.5%) | 0 (0.0%) |
| $300 to $499 | 62 (5.8%) | 11 (6.6%) |
| $500 to $799 | 153 (14.3%) | 11 (6.6%) |
| $800 to $999 | 118 (11.1%) | 52 (31.3%) |
| $1,000 to $1,499 | 332 (31.1%) | 66 (39.8%) |
| $1,500 to $1,999 | 212 (19.9%) | 0 (0.0%) |
| $2,000 to $2,499 | 98 (9.2%) | 0 (0.0%) |
| $2,500 to $2,999 | 0 (0.0%) | 0 (0.0%) |
| $3,000 or more | 75 (7.0%) | 0 (0.0%) |
| Total | 1,066 (100.0%) | 166 (100.0%) |
Physical Housing Characteristics in Delavan Lake
Housing Structures in Delavan Lake
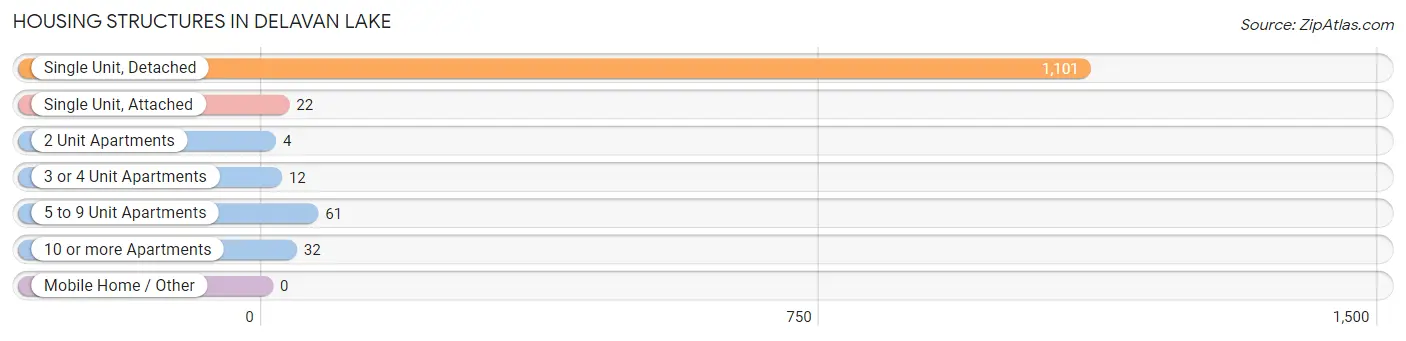
| Structure Type | # Housing Units | % Housing Units |
| Single Unit, Detached | 1,101 | 89.4% |
| Single Unit, Attached | 22 | 1.8% |
| 2 Unit Apartments | 4 | 0.3% |
| 3 or 4 Unit Apartments | 12 | 1.0% |
| 5 to 9 Unit Apartments | 61 | 5.0% |
| 10 or more Apartments | 32 | 2.6% |
| Mobile Home / Other | 0 | 0.0% |
| Total | 1,232 | 100.0% |
Housing Structures by Occupancy in Delavan Lake
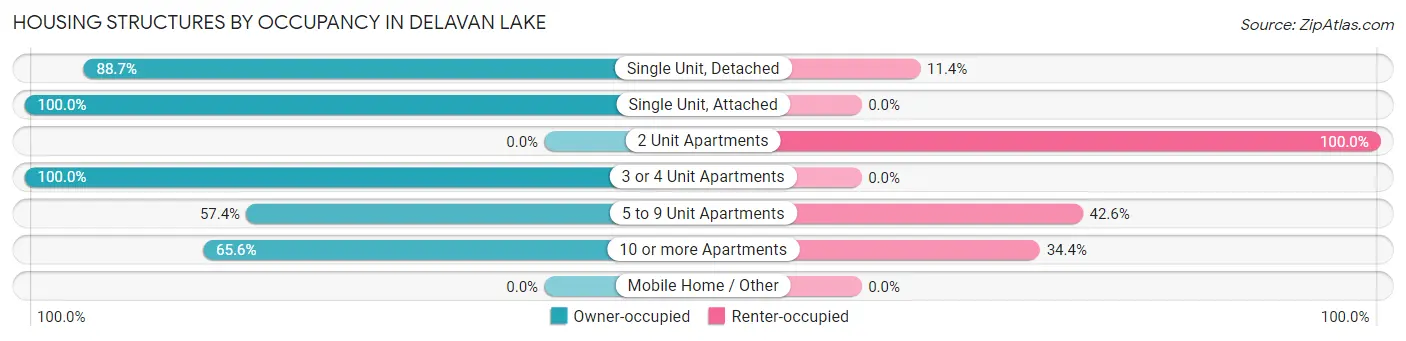
| Structure Type | Owner-occupied | Renter-occupied |
| Single Unit, Detached | 976 (88.6%) | 125 (11.4%) |
| Single Unit, Attached | 22 (100.0%) | 0 (0.0%) |
| 2 Unit Apartments | 0 (0.0%) | 4 (100.0%) |
| 3 or 4 Unit Apartments | 12 (100.0%) | 0 (0.0%) |
| 5 to 9 Unit Apartments | 35 (57.4%) | 26 (42.6%) |
| 10 or more Apartments | 21 (65.6%) | 11 (34.4%) |
| Mobile Home / Other | 0 (0.0%) | 0 (0.0%) |
| Total | 1,066 (86.5%) | 166 (13.5%) |
Housing Structures by Number of Rooms in Delavan Lake
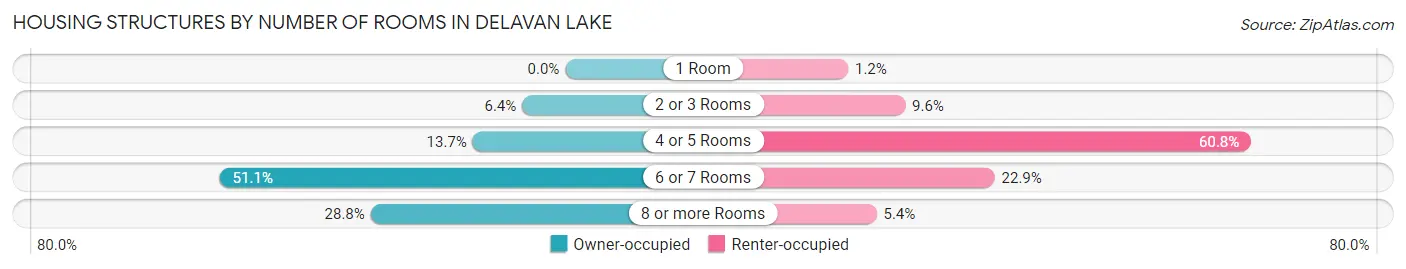
| Number of Rooms | Owner-occupied | Renter-occupied |
| 1 Room | 0 (0.0%) | 2 (1.2%) |
| 2 or 3 Rooms | 68 (6.4%) | 16 (9.6%) |
| 4 or 5 Rooms | 146 (13.7%) | 101 (60.8%) |
| 6 or 7 Rooms | 545 (51.1%) | 38 (22.9%) |
| 8 or more Rooms | 307 (28.8%) | 9 (5.4%) |
| Total | 1,066 (100.0%) | 166 (100.0%) |
Housing Structure by Heating Type in Delavan Lake
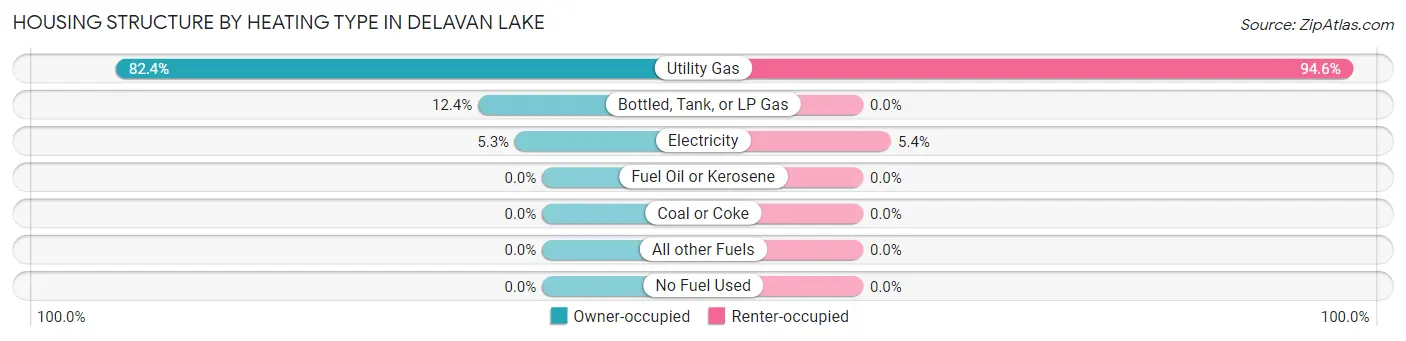
| Heating Type | Owner-occupied | Renter-occupied |
| Utility Gas | 878 (82.4%) | 157 (94.6%) |
| Bottled, Tank, or LP Gas | 132 (12.4%) | 0 (0.0%) |
| Electricity | 56 (5.2%) | 9 (5.4%) |
| Fuel Oil or Kerosene | 0 (0.0%) | 0 (0.0%) |
| Coal or Coke | 0 (0.0%) | 0 (0.0%) |
| All other Fuels | 0 (0.0%) | 0 (0.0%) |
| No Fuel Used | 0 (0.0%) | 0 (0.0%) |
| Total | 1,066 (100.0%) | 166 (100.0%) |
Household Vehicle Usage in Delavan Lake
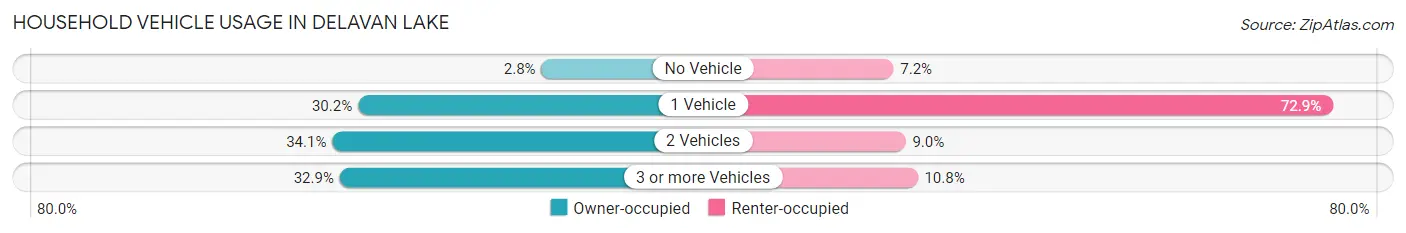
| Vehicles per Household | Owner-occupied | Renter-occupied |
| No Vehicle | 30 (2.8%) | 12 (7.2%) |
| 1 Vehicle | 322 (30.2%) | 121 (72.9%) |
| 2 Vehicles | 363 (34.1%) | 15 (9.0%) |
| 3 or more Vehicles | 351 (32.9%) | 18 (10.8%) |
| Total | 1,066 (100.0%) | 166 (100.0%) |
Real Estate & Mortgages in Delavan Lake
Real Estate and Mortgage Overview in Delavan Lake
| Characteristic | Without Mortgage | With Mortgage |
| Housing Units | 384 | 682 |
| Median Property Value | $297,500 | $229,800 |
| Median Household Income | $58,214 | $229 |
| Monthly Housing Costs | $741 | $75 |
| Real Estate Taxes | $5,148 | $0 |
Property Value by Mortgage Status in Delavan Lake
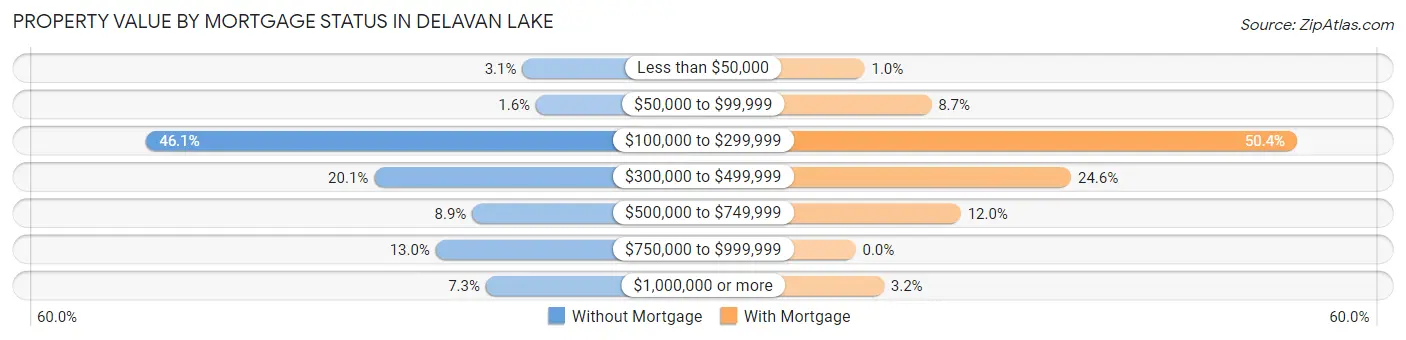
| Property Value | Without Mortgage | With Mortgage |
| Less than $50,000 | 12 (3.1%) | 7 (1.0%) |
| $50,000 to $99,999 | 6 (1.6%) | 59 (8.6%) |
| $100,000 to $299,999 | 177 (46.1%) | 344 (50.4%) |
| $300,000 to $499,999 | 77 (20.1%) | 168 (24.6%) |
| $500,000 to $749,999 | 34 (8.8%) | 82 (12.0%) |
| $750,000 to $999,999 | 50 (13.0%) | 0 (0.0%) |
| $1,000,000 or more | 28 (7.3%) | 22 (3.2%) |
| Total | 384 (100.0%) | 682 (100.0%) |
Household Income by Mortgage Status in Delavan Lake
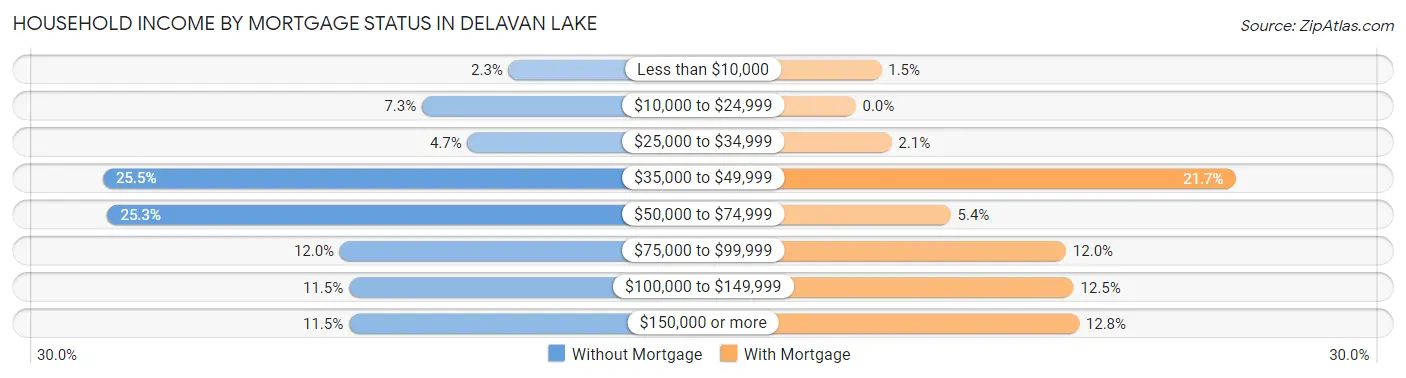
| Household Income | Without Mortgage | With Mortgage |
| Less than $10,000 | 9 (2.3%) | 10 (1.5%) |
| $10,000 to $24,999 | 28 (7.3%) | 0 (0.0%) |
| $25,000 to $34,999 | 18 (4.7%) | 14 (2.1%) |
| $35,000 to $49,999 | 98 (25.5%) | 148 (21.7%) |
| $50,000 to $74,999 | 97 (25.3%) | 37 (5.4%) |
| $75,000 to $99,999 | 46 (12.0%) | 82 (12.0%) |
| $100,000 to $149,999 | 44 (11.5%) | 85 (12.5%) |
| $150,000 or more | 44 (11.5%) | 87 (12.8%) |
| Total | 384 (100.0%) | 682 (100.0%) |
Property Value to Household Income Ratio in Delavan Lake
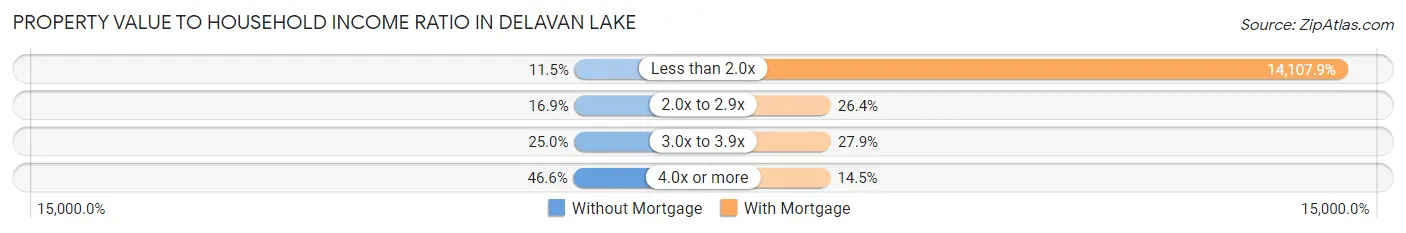
| Value-to-Income Ratio | Without Mortgage | With Mortgage |
| Less than 2.0x | 44 (11.5%) | 96,216 (14,107.9%) |
| 2.0x to 2.9x | 65 (16.9%) | 180 (26.4%) |
| 3.0x to 3.9x | 96 (25.0%) | 190 (27.9%) |
| 4.0x or more | 179 (46.6%) | 99 (14.5%) |
| Total | 384 (100.0%) | 682 (100.0%) |
Real Estate Taxes by Mortgage Status in Delavan Lake
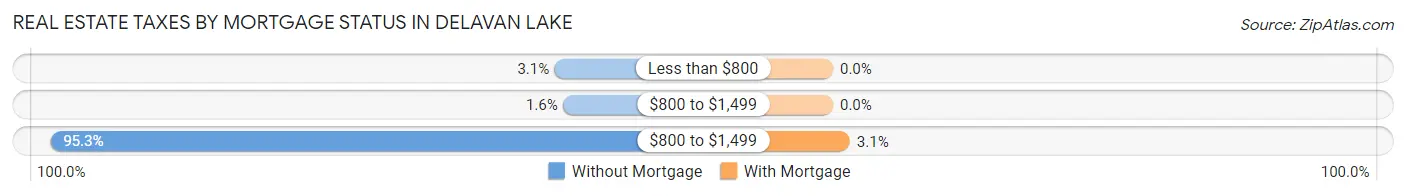
| Property Taxes | Without Mortgage | With Mortgage |
| Less than $800 | 12 (3.1%) | 0 (0.0%) |
| $800 to $1,499 | 6 (1.6%) | 0 (0.0%) |
| $800 to $1,499 | 366 (95.3%) | 21 (3.1%) |
| Total | 384 (100.0%) | 682 (100.0%) |
Health & Disability in Delavan Lake
Health Insurance Coverage by Age in Delavan Lake
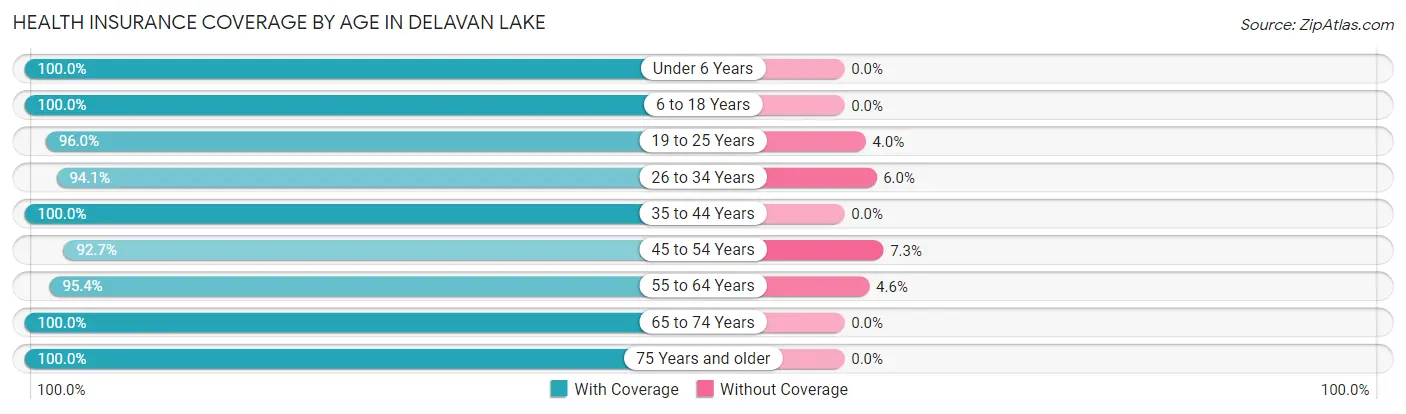
| Age Bracket | With Coverage | Without Coverage |
| Under 6 Years | 182 (100.0%) | 0 (0.0%) |
| 6 to 18 Years | 414 (100.0%) | 0 (0.0%) |
| 19 to 25 Years | 218 (96.0%) | 9 (4.0%) |
| 26 to 34 Years | 253 (94.1%) | 16 (5.9%) |
| 35 to 44 Years | 187 (100.0%) | 0 (0.0%) |
| 45 to 54 Years | 460 (92.7%) | 36 (7.3%) |
| 55 to 64 Years | 473 (95.4%) | 23 (4.6%) |
| 65 to 74 Years | 351 (100.0%) | 0 (0.0%) |
| 75 Years and older | 284 (100.0%) | 0 (0.0%) |
| Total | 2,822 (97.1%) | 84 (2.9%) |
Health Insurance Coverage by Citizenship Status in Delavan Lake
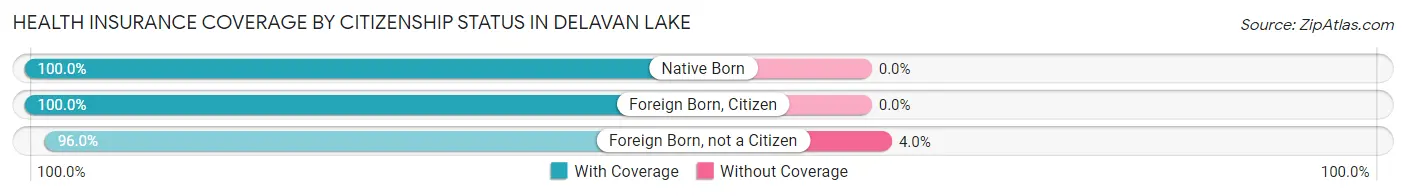
| Citizenship Status | With Coverage | Without Coverage |
| Native Born | 182 (100.0%) | 0 (0.0%) |
| Foreign Born, Citizen | 414 (100.0%) | 0 (0.0%) |
| Foreign Born, not a Citizen | 218 (96.0%) | 9 (4.0%) |
Health Insurance Coverage by Household Income in Delavan Lake
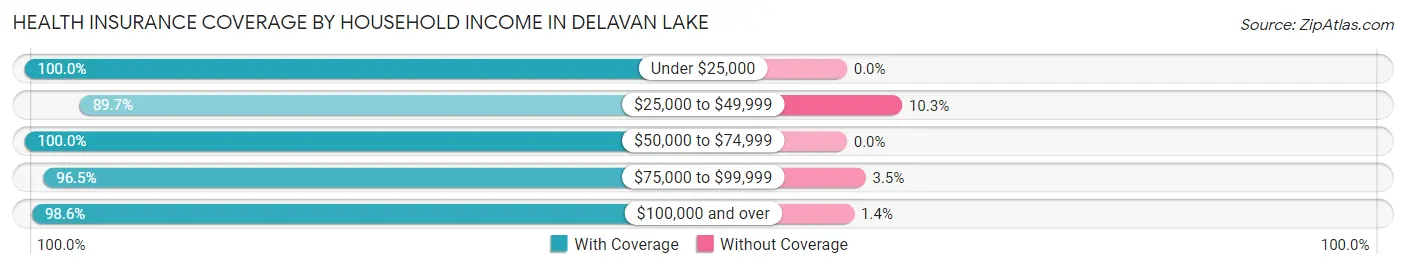
| Household Income | With Coverage | Without Coverage |
| Under $25,000 | 111 (100.0%) | 0 (0.0%) |
| $25,000 to $49,999 | 442 (89.7%) | 51 (10.3%) |
| $50,000 to $74,999 | 345 (100.0%) | 0 (0.0%) |
| $75,000 to $99,999 | 275 (96.5%) | 10 (3.5%) |
| $100,000 and over | 1,640 (98.6%) | 23 (1.4%) |
Public vs Private Health Insurance Coverage by Age in Delavan Lake
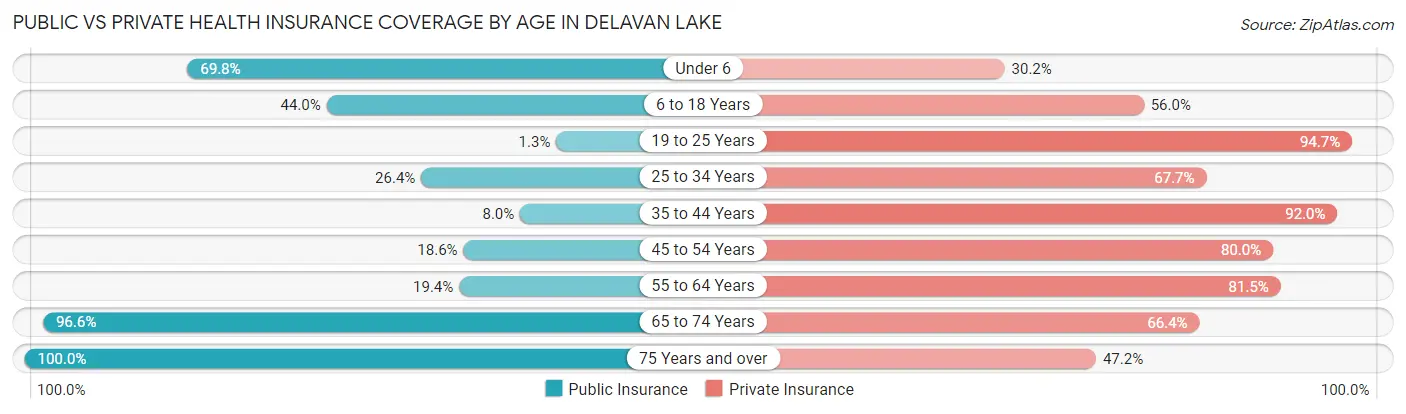
| Age Bracket | Public Insurance | Private Insurance |
| Under 6 | 127 (69.8%) | 55 (30.2%) |
| 6 to 18 Years | 182 (44.0%) | 232 (56.0%) |
| 19 to 25 Years | 3 (1.3%) | 215 (94.7%) |
| 25 to 34 Years | 71 (26.4%) | 182 (67.7%) |
| 35 to 44 Years | 15 (8.0%) | 172 (92.0%) |
| 45 to 54 Years | 92 (18.5%) | 397 (80.0%) |
| 55 to 64 Years | 96 (19.4%) | 404 (81.5%) |
| 65 to 74 Years | 339 (96.6%) | 233 (66.4%) |
| 75 Years and over | 284 (100.0%) | 134 (47.2%) |
| Total | 1,209 (41.6%) | 2,024 (69.7%) |
Disability Status by Sex by Age in Delavan Lake
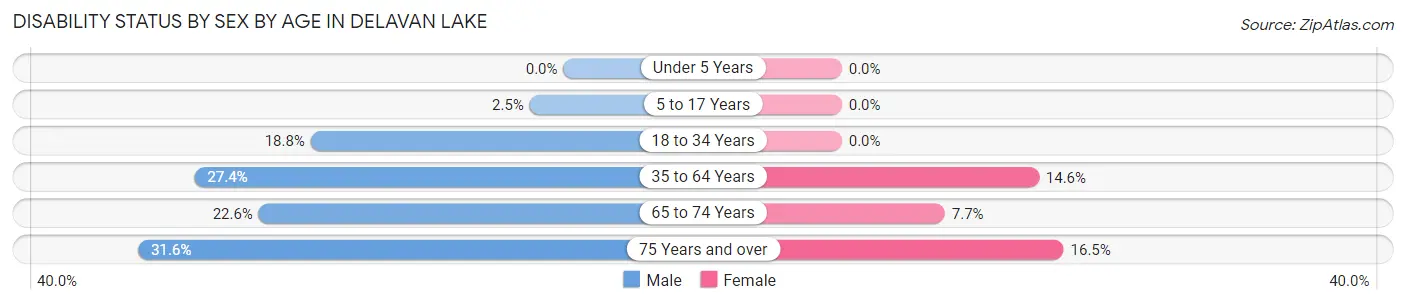
| Age Bracket | Male | Female |
| Under 5 Years | 0 (0.0%) | 0 (0.0%) |
| 5 to 17 Years | 5 (2.5%) | 0 (0.0%) |
| 18 to 34 Years | 79 (18.8%) | 0 (0.0%) |
| 35 to 64 Years | 175 (27.4%) | 79 (14.6%) |
| 65 to 74 Years | 38 (22.6%) | 14 (7.6%) |
| 75 Years and over | 36 (31.6%) | 28 (16.5%) |
Disability Class by Sex by Age in Delavan Lake
Disability Class: Hearing Difficulty
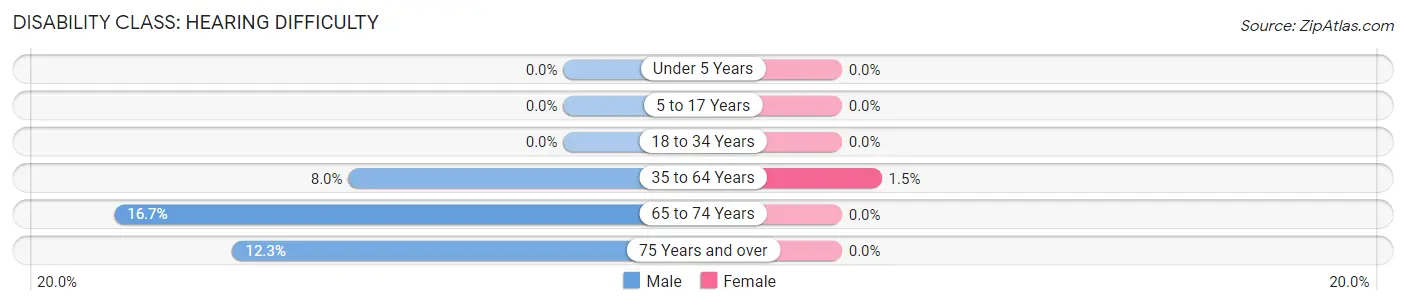
| Age Bracket | Male | Female |
| Under 5 Years | 0 (0.0%) | 0 (0.0%) |
| 5 to 17 Years | 0 (0.0%) | 0 (0.0%) |
| 18 to 34 Years | 0 (0.0%) | 0 (0.0%) |
| 35 to 64 Years | 51 (8.0%) | 8 (1.5%) |
| 65 to 74 Years | 28 (16.7%) | 0 (0.0%) |
| 75 Years and over | 14 (12.3%) | 0 (0.0%) |
Disability Class: Vision Difficulty
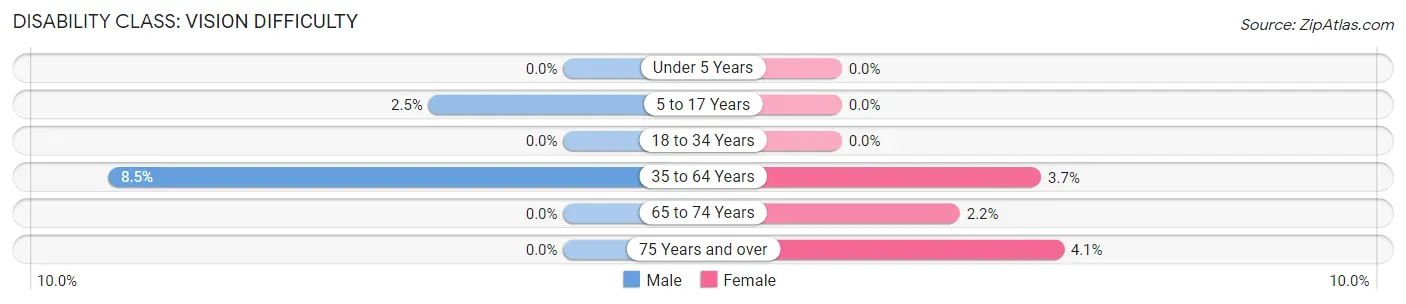
| Age Bracket | Male | Female |
| Under 5 Years | 0 (0.0%) | 0 (0.0%) |
| 5 to 17 Years | 5 (2.5%) | 0 (0.0%) |
| 18 to 34 Years | 0 (0.0%) | 0 (0.0%) |
| 35 to 64 Years | 54 (8.5%) | 20 (3.7%) |
| 65 to 74 Years | 0 (0.0%) | 4 (2.2%) |
| 75 Years and over | 0 (0.0%) | 7 (4.1%) |
Disability Class: Cognitive Difficulty
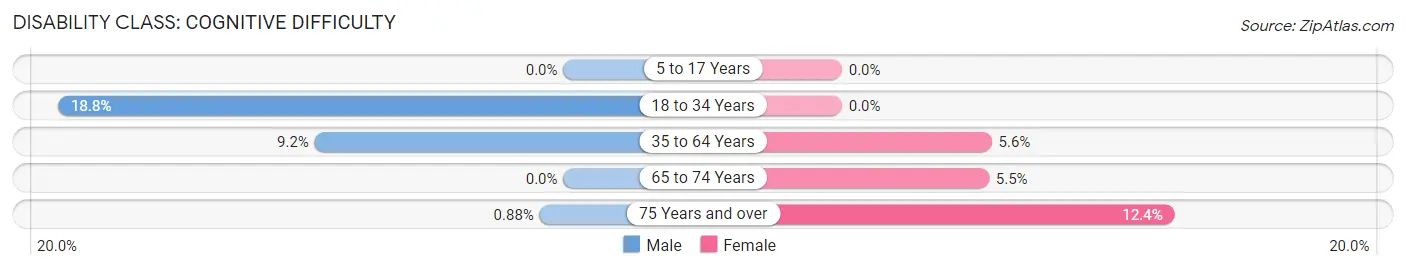
| Age Bracket | Male | Female |
| 5 to 17 Years | 0 (0.0%) | 0 (0.0%) |
| 18 to 34 Years | 79 (18.8%) | 0 (0.0%) |
| 35 to 64 Years | 59 (9.2%) | 30 (5.6%) |
| 65 to 74 Years | 0 (0.0%) | 10 (5.5%) |
| 75 Years and over | 1 (0.9%) | 21 (12.3%) |
Disability Class: Ambulatory Difficulty
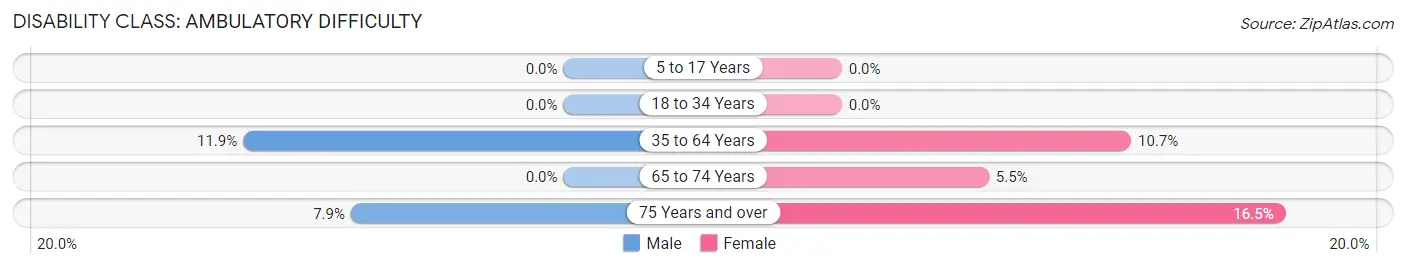
| Age Bracket | Male | Female |
| 5 to 17 Years | 0 (0.0%) | 0 (0.0%) |
| 18 to 34 Years | 0 (0.0%) | 0 (0.0%) |
| 35 to 64 Years | 76 (11.9%) | 58 (10.7%) |
| 65 to 74 Years | 0 (0.0%) | 10 (5.5%) |
| 75 Years and over | 9 (7.9%) | 28 (16.5%) |
Disability Class: Self-Care Difficulty
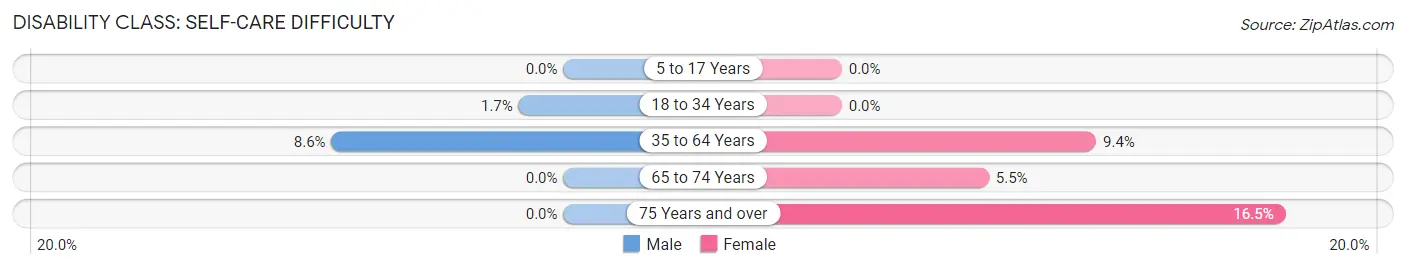
| Age Bracket | Male | Female |
| 5 to 17 Years | 0 (0.0%) | 0 (0.0%) |
| 18 to 34 Years | 7 (1.7%) | 0 (0.0%) |
| 35 to 64 Years | 55 (8.6%) | 51 (9.4%) |
| 65 to 74 Years | 0 (0.0%) | 10 (5.5%) |
| 75 Years and over | 0 (0.0%) | 28 (16.5%) |
Technology Access in Delavan Lake
Computing Device Access in Delavan Lake
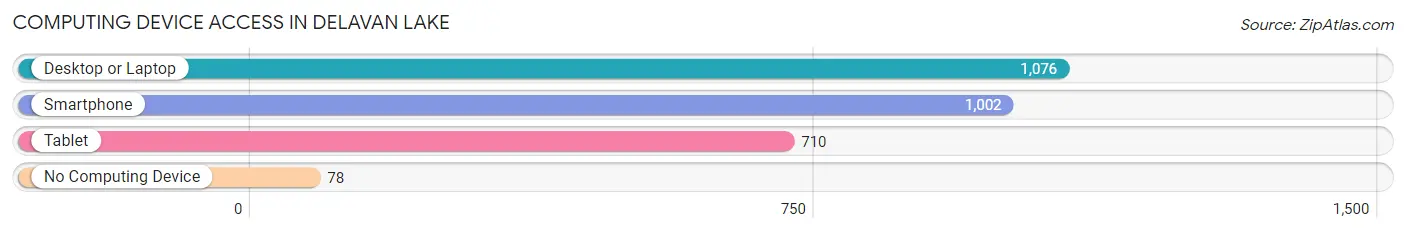
| Device Type | # Households | % Households |
| Desktop or Laptop | 1,076 | 87.3% |
| Smartphone | 1,002 | 81.3% |
| Tablet | 710 | 57.6% |
| No Computing Device | 78 | 6.3% |
| Total | 1,232 | 100.0% |
Internet Access in Delavan Lake
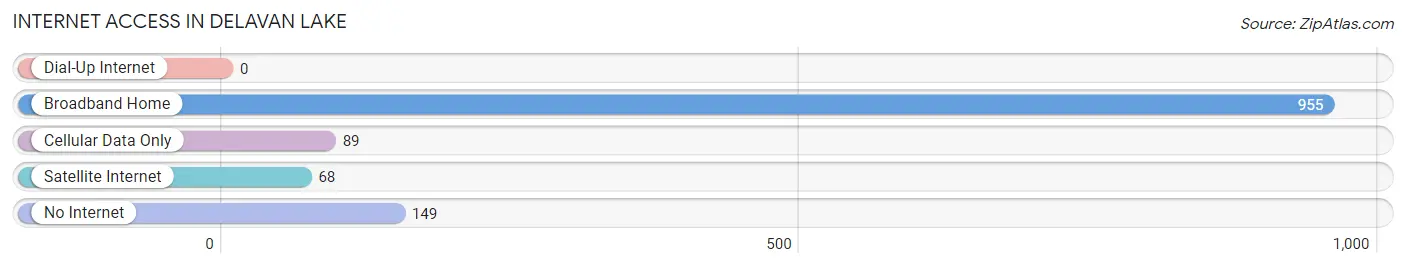
| Internet Type | # Households | % Households |
| Dial-Up Internet | 0 | 0.0% |
| Broadband Home | 955 | 77.5% |
| Cellular Data Only | 89 | 7.2% |
| Satellite Internet | 68 | 5.5% |
| No Internet | 149 | 12.1% |
| Total | 1,232 | 100.0% |
Delavan Lake Summary
Delavan Lake is a lake located in Walworth County, Wisconsin, United States. It is the largest natural lake in the state, covering an area of 1,935 acres (7.8 km2). The lake is located in the southeastern corner of the county, just north of the city of Delavan.
Geography
Delavan Lake is located in the southeastern corner of Walworth County, Wisconsin, just north of the city of Delavan. The lake is approximately 1,935 acres (7.8 km2) in size and has a maximum depth of 40 feet (12 m). The lake is fed by several small streams, including the Delavan River, and is drained by the Delavan River. The lake is surrounded by several small towns, including Delavan, Darien, and Walworth.
History
Delavan Lake has been a popular destination for recreation since the mid-1800s. The lake was originally known as “Delavan Lake” and was named after the city of Delavan, which was founded in 1837. The lake was used for fishing, swimming, and boating, and was a popular destination for tourists. In the late 1800s, the lake was also used for ice harvesting.
In the early 1900s, the lake was developed for recreational use. Several resorts were built around the lake, and the lake became a popular destination for fishing, swimming, and boating. In the 1920s, the lake was also used for water skiing.
In the 1950s, the lake was developed further for recreational use. Several marinas were built around the lake, and the lake became a popular destination for fishing, swimming, and boating. In the 1960s, the lake was also used for water skiing.
In the 1970s, the lake was developed further for recreational use. Several marinas were built around the lake, and the lake became a popular destination for fishing, swimming, and boating. In the 1980s, the lake was also used for water skiing.
In the 1990s, the lake was developed further for recreational use. Several marinas were built around the lake, and the lake became a popular destination for fishing, swimming, and boating. In the 2000s, the lake was also used for water skiing.
Economy
The economy of Delavan Lake is largely based on tourism and recreation. The lake is a popular destination for fishing, swimming, boating, and water skiing. There are several marinas located around the lake, as well as several resorts and restaurants. The lake is also home to several annual events, such as the Delavan Lake Regatta and the Delavan Lake Festival.
Demographics
The population of Delavan Lake is largely composed of seasonal residents and tourists. The population of the lake is estimated to be around 1,000 people. The majority of the population is white (90%), followed by Hispanic (4%), African American (2%), and Asian (1%). The median household income in the area is $50,000.
Conclusion
Delavan Lake is a popular destination for recreation and tourism in Walworth County, Wisconsin. The lake is the largest natural lake in the state, covering an area of 1,935 acres (7.8 km2). The lake is fed by several small streams, including the Delavan River, and is drained by the Delavan River. The economy of Delavan Lake is largely based on tourism and recreation, and the population of the lake is estimated to be around 1,000 people. The lake is a popular destination for fishing, swimming, boating, and water skiing, and is home to several annual events.
Common Questions
What is the Total Population of Delavan Lake?
Total Population of Delavan Lake is 2,926.
What is the Total Male Population of Delavan Lake?
Total Male Population of Delavan Lake is 1,618.
What is the Total Female Population of Delavan Lake?
Total Female Population of Delavan Lake is 1,308.
What is the Ratio of Males per 100 Females in Delavan Lake?
There are 123.70 Males per 100 Females in Delavan Lake.
What is the Ratio of Females per 100 Males in Delavan Lake?
There are 80.84 Females per 100 Males in Delavan Lake.
What is the Median Population Age in Delavan Lake?
Median Population Age in Delavan Lake is 48.7 Years.
What is the Average Family Size in Delavan Lake
Average Family Size in Delavan Lake is 3.1 People.
What is the Average Household Size in Delavan Lake
Average Household Size in Delavan Lake is 2.4 People.
What is Per Capita Income in Delavan Lake?
Per Capita income in Delavan Lake is $41,689.
What is the Median Family Income in Delavan Lake?
Median Family Income in Delavan Lake is $100,048.
What is the Median Household income in Delavan Lake?
Median Household Income in Delavan Lake is $66,667.
What is Income or Wage Gap in Delavan Lake?
Income or Wage Gap in Delavan Lake is 24.5%.
Women in Delavan Lake earn 75.5 cents for every dollar earned by a man.
What is Inequality or Gini Index in Delavan Lake?
Inequality or Gini Index in Delavan Lake is 0.47.
How Large is the Labor Force in Delavan Lake?
There are 1,435 People in the Labor Forcein in Delavan Lake.
What is the Percentage of People in the Labor Force in Delavan Lake?
57.4% of People are in the Labor Force in Delavan Lake.
What is the Unemployment Rate in Delavan Lake?
Unemployment Rate in Delavan Lake is 2.2%.