Cecil, WI
Cecil Map
Cecil Overview
475
TOTAL POPULATION
228
MALE POPULATION
247
FEMALE POPULATION
92.31
MALES / 100 FEMALES
108.33
FEMALES / 100 MALES
48.7
MEDIAN AGE
2.6
AVG FAMILY SIZE
1.9
AVG HOUSEHOLD SIZE
$46,346
PER CAPITA INCOME
$100,556
AVG FAMILY INCOME
$74,423
AVG HOUSEHOLD INCOME
49.2%
WAGE / INCOME GAP [ % ]
50.8¢/ $1
WAGE / INCOME GAP [ $ ]
0.37
INEQUALITY / GINI INDEX
284
LABOR FORCE [ PEOPLE ]
67.5%
PERCENT IN LABOR FORCE
1.1%
UNEMPLOYMENT RATE
Cecil Zip Codes
Cecil Area Codes
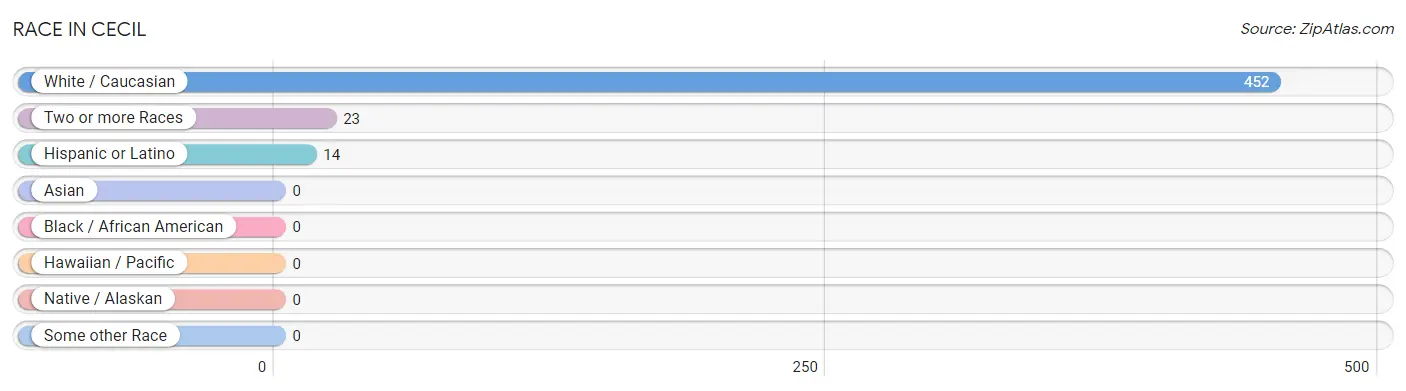
Race in Cecil
The most populous races in Cecil are White / Caucasian (452 | 95.2%), Two or more Races (23 | 4.8%), and Hispanic or Latino (14 | 2.9%).
| Race | # Population | % Population |
| Asian | 0 | 0.0% |
| Black / African American | 0 | 0.0% |
| Hawaiian / Pacific | 0 | 0.0% |
| Hispanic or Latino | 14 | 2.9% |
| Native / Alaskan | 0 | 0.0% |
| White / Caucasian | 452 | 95.2% |
| Two or more Races | 23 | 4.8% |
| Some other Race | 0 | 0.0% |
| Total | 475 | 100.0% |
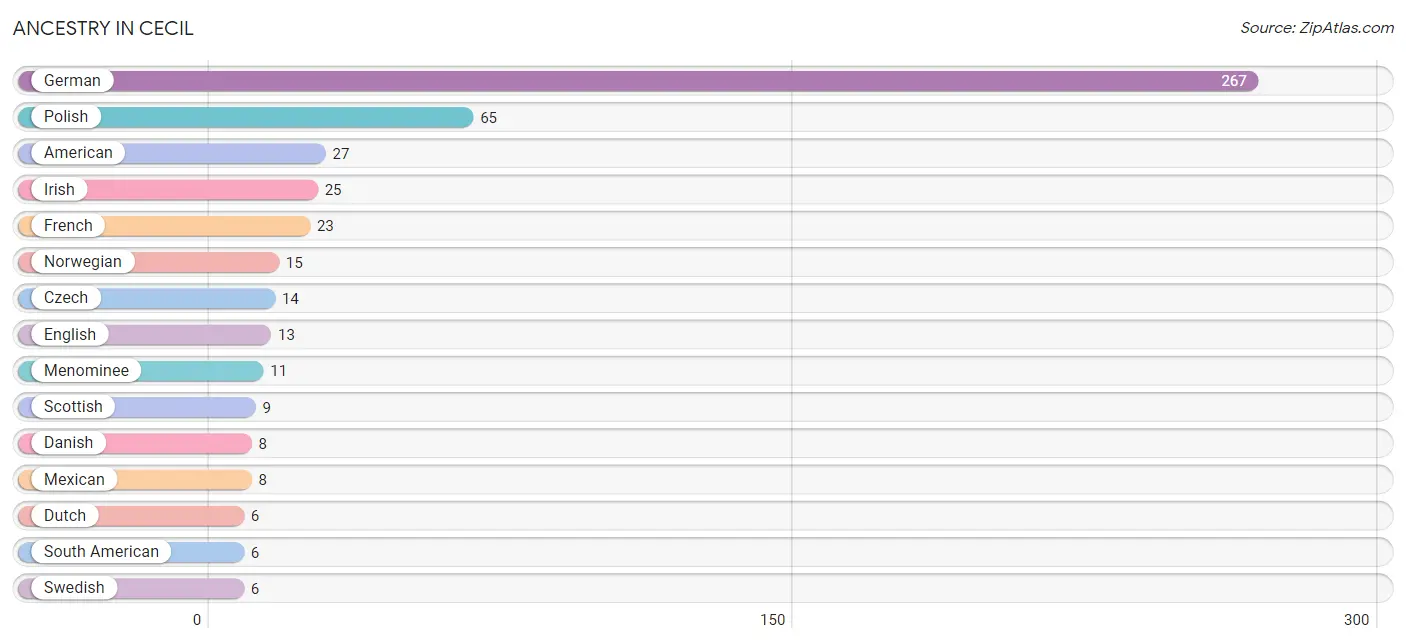
Ancestry in Cecil
The most populous ancestries reported in Cecil are German (267 | 56.2%), Polish (65 | 13.7%), American (27 | 5.7%), Irish (25 | 5.3%), and French (23 | 4.8%), together accounting for 85.7% of all Cecil residents.
| Ancestry | # Population | % Population |
| American | 27 | 5.7% |
| Belgian | 2 | 0.4% |
| Bolivian | 2 | 0.4% |
| Czech | 14 | 2.9% |
| Czechoslovakian | 1 | 0.2% |
| Danish | 8 | 1.7% |
| Dutch | 6 | 1.3% |
| English | 13 | 2.7% |
| European | 4 | 0.8% |
| French | 23 | 4.8% |
| French Canadian | 2 | 0.4% |
| German | 267 | 56.2% |
| Irish | 25 | 5.3% |
| Italian | 5 | 1.1% |
| Menominee | 11 | 2.3% |
| Mexican | 8 | 1.7% |
| Northern European | 2 | 0.4% |
| Norwegian | 15 | 3.2% |
| Peruvian | 4 | 0.8% |
| Polish | 65 | 13.7% |
| Scottish | 9 | 1.9% |
| South American | 6 | 1.3% |
| Swedish | 6 | 1.3% |
| Welsh | 2 | 0.4% | View All 24 Rows |
Immigrants in Cecil

| Immigration Origin | # Population | % Population | View All 0 Rows |
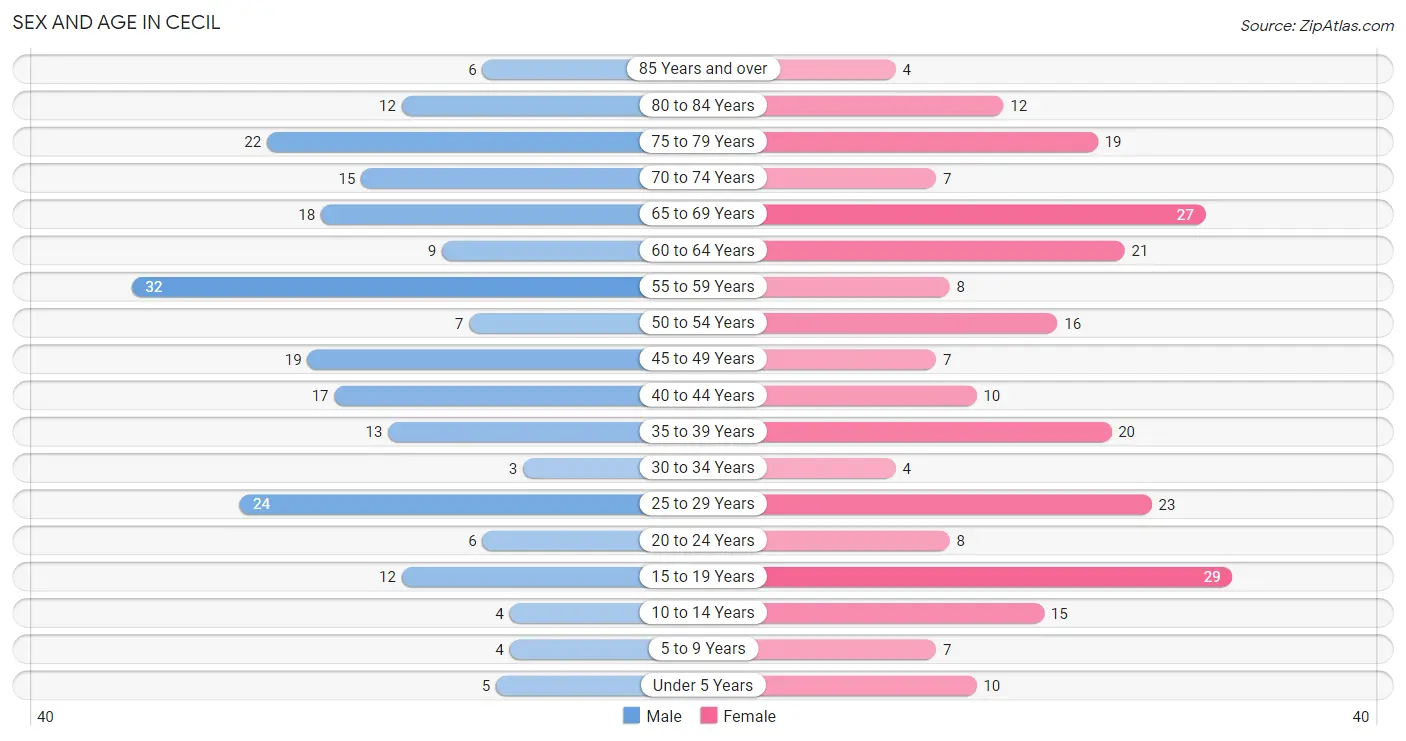
Sex and Age in Cecil
Sex and Age in Cecil
The most populous age groups in Cecil are 55 to 59 Years (32 | 14.0%) for men and 15 to 19 Years (29 | 11.7%) for women.
| Age Bracket | Male | Female |
| Under 5 Years | 5 (2.2%) | 10 (4.1%) |
| 5 to 9 Years | 4 (1.8%) | 7 (2.8%) |
| 10 to 14 Years | 4 (1.8%) | 15 (6.1%) |
| 15 to 19 Years | 12 (5.3%) | 29 (11.7%) |
| 20 to 24 Years | 6 (2.6%) | 8 (3.2%) |
| 25 to 29 Years | 24 (10.5%) | 23 (9.3%) |
| 30 to 34 Years | 3 (1.3%) | 4 (1.6%) |
| 35 to 39 Years | 13 (5.7%) | 20 (8.1%) |
| 40 to 44 Years | 17 (7.5%) | 10 (4.1%) |
| 45 to 49 Years | 19 (8.3%) | 7 (2.8%) |
| 50 to 54 Years | 7 (3.1%) | 16 (6.5%) |
| 55 to 59 Years | 32 (14.0%) | 8 (3.2%) |
| 60 to 64 Years | 9 (4.0%) | 21 (8.5%) |
| 65 to 69 Years | 18 (7.9%) | 27 (10.9%) |
| 70 to 74 Years | 15 (6.6%) | 7 (2.8%) |
| 75 to 79 Years | 22 (9.7%) | 19 (7.7%) |
| 80 to 84 Years | 12 (5.3%) | 12 (4.9%) |
| 85 Years and over | 6 (2.6%) | 4 (1.6%) |
| Total | 228 (100.0%) | 247 (100.0%) |
Families and Households in Cecil
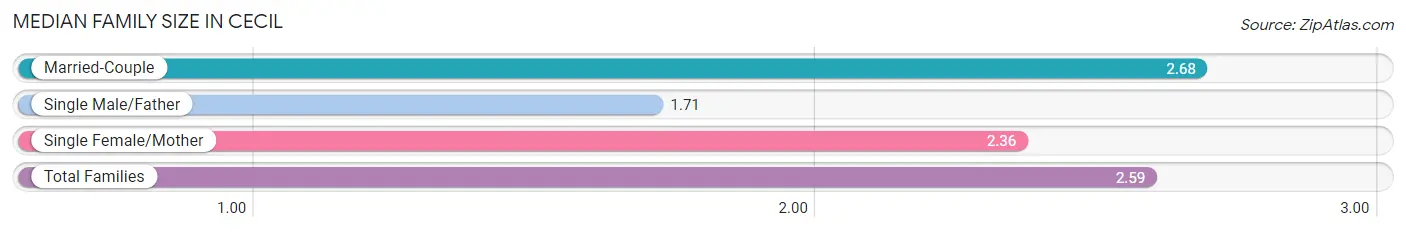
Median Family Size in Cecil
The median family size in Cecil is 2.59 persons per family, with married-couple families (107 | 83.6%) accounting for the largest median family size of 2.68 persons per family. On the other hand, single male/father families (7 | 5.5%) represent the smallest median family size with 1.71 persons per family.
| Family Type | # Families | Family Size |
| Married-Couple | 107 (83.6%) | 2.68 |
| Single Male/Father | 7 (5.5%) | 1.71 |
| Single Female/Mother | 14 (10.9%) | 2.36 |
| Total Families | 128 (100.0%) | 2.59 |
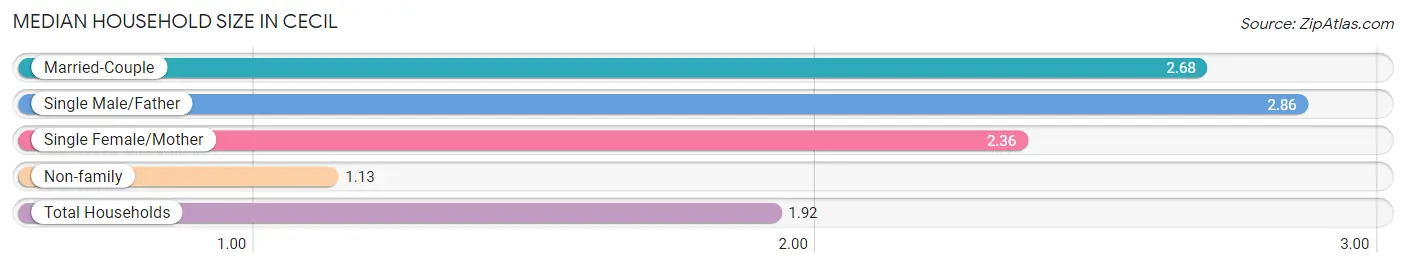
Median Household Size in Cecil
The median household size in Cecil is 1.92 persons per household, with single male/father households (7 | 2.8%) accounting for the largest median household size of 2.86 persons per household. non-family households (120 | 48.4%) represent the smallest median household size with 1.13 persons per household.
| Household Type | # Households | Household Size |
| Married-Couple | 107 (43.1%) | 2.68 |
| Single Male/Father | 7 (2.8%) | 2.86 |
| Single Female/Mother | 14 (5.7%) | 2.36 |
| Non-family | 120 (48.4%) | 1.13 |
| Total Households | 248 (100.0%) | 1.92 |
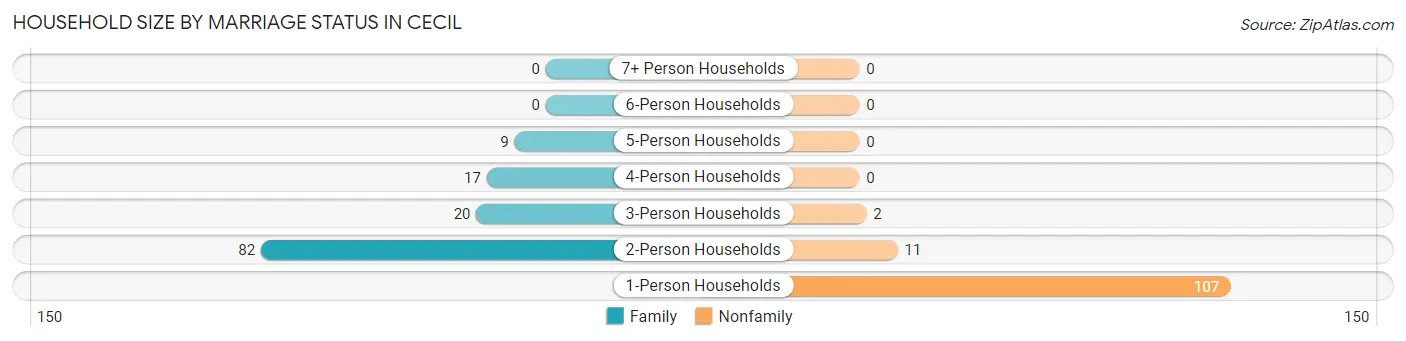
Household Size by Marriage Status in Cecil
Out of a total of 248 households in Cecil, 128 (51.6%) are family households, while 120 (48.4%) are nonfamily households. The most numerous type of family households are 2-person households, comprising 82, and the most common type of nonfamily households are 1-person households, comprising 107.
| Household Size | Family Households | Nonfamily Households |
| 1-Person Households | - | 107 (43.1%) |
| 2-Person Households | 82 (33.1%) | 11 (4.4%) |
| 3-Person Households | 20 (8.1%) | 2 (0.8%) |
| 4-Person Households | 17 (6.9%) | 0 (0.0%) |
| 5-Person Households | 9 (3.6%) | 0 (0.0%) |
| 6-Person Households | 0 (0.0%) | 0 (0.0%) |
| 7+ Person Households | 0 (0.0%) | 0 (0.0%) |
| Total | 128 (51.6%) | 120 (48.4%) |
Female Fertility in Cecil
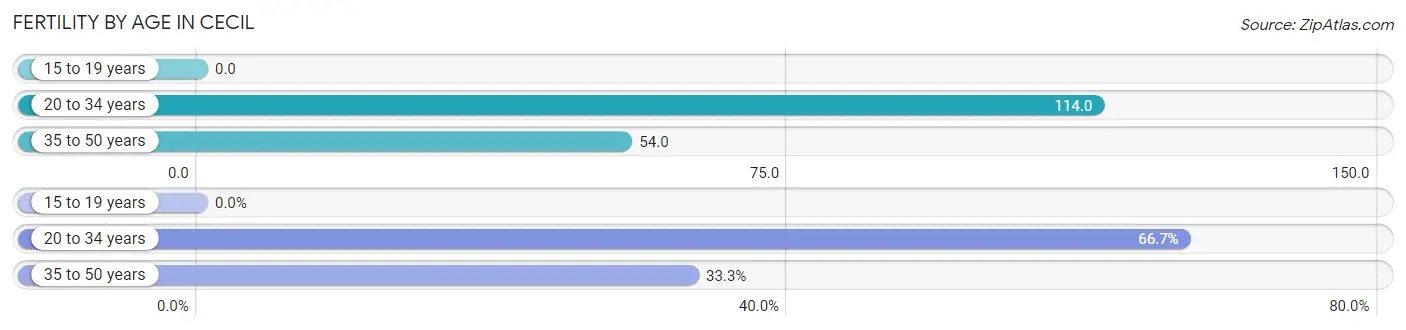
Fertility by Age in Cecil
Average fertility rate in Cecil is 59.0 births per 1,000 women. Women in the age bracket of 20 to 34 years have the highest fertility rate with 114.0 births per 1,000 women. Women in the age bracket of 20 to 34 years acount for 66.7% of all women with births.
| Age Bracket | Women with Births | Births / 1,000 Women |
| 15 to 19 years | 0 (0.0%) | 0.0 |
| 20 to 34 years | 4 (66.7%) | 114.0 |
| 35 to 50 years | 2 (33.3%) | 54.0 |
| Total | 6 (100.0%) | 59.0 |
Fertility by Age by Marriage Status in Cecil
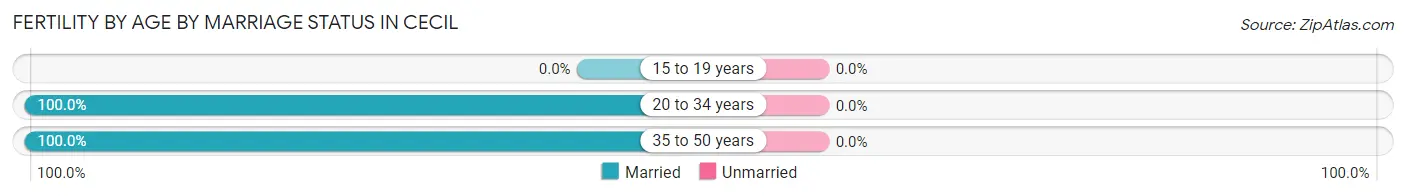
| Age Bracket | Married | Unmarried |
| 15 to 19 years | 0 (0.0%) | 0 (0.0%) |
| 20 to 34 years | 4 (100.0%) | 0 (0.0%) |
| 35 to 50 years | 2 (100.0%) | 0 (0.0%) |
| Total | 6 (100.0%) | 0 (0.0%) |
Fertility by Education in Cecil
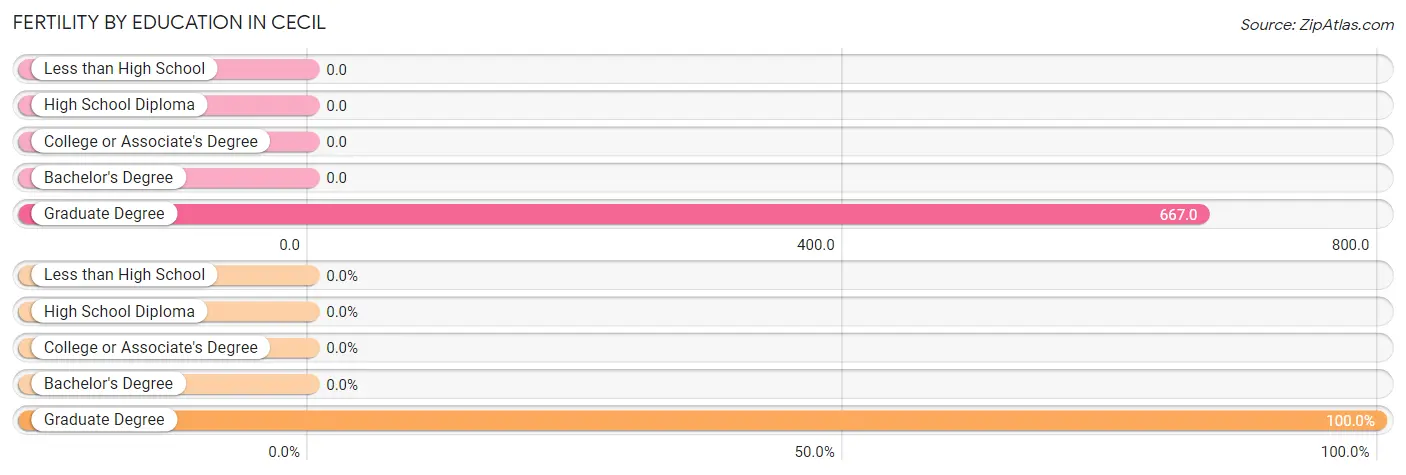
| Educational Attainment | Women with Births | Births / 1,000 Women |
| Less than High School | 0 (0.0%) | 0.0 |
| High School Diploma | 0 (0.0%) | 0.0 |
| College or Associate's Degree | 0 (0.0%) | 0.0 |
| Bachelor's Degree | 0 (0.0%) | 0.0 |
| Graduate Degree | 6 (100.0%) | 667.0 |
| Total | 6 (100.0%) | 59.0 |
Fertility by Education by Marriage Status in Cecil
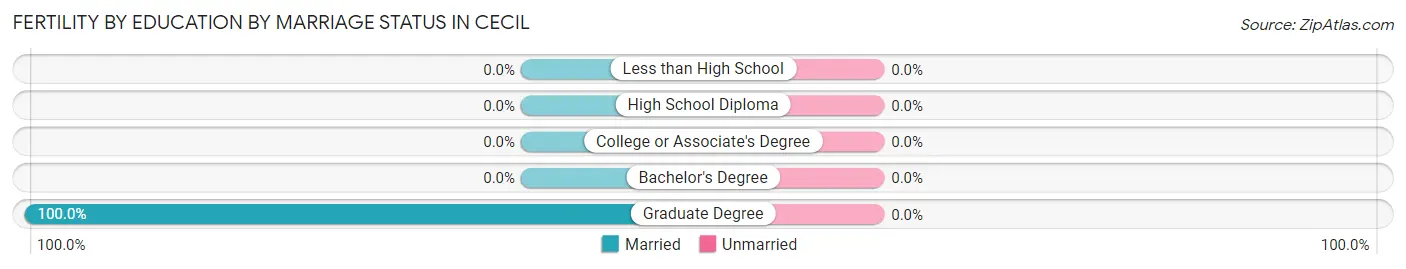
| Educational Attainment | Married | Unmarried |
| Less than High School | 0 (0.0%) | 0 (0.0%) |
| High School Diploma | 0 (0.0%) | 0 (0.0%) |
| College or Associate's Degree | 0 (0.0%) | 0 (0.0%) |
| Bachelor's Degree | 0 (0.0%) | 0 (0.0%) |
| Graduate Degree | 6 (100.0%) | 0 (0.0%) |
| Total | 6 (100.0%) | 0 (0.0%) |
Income in Cecil
Income Overview in Cecil
Per Capita Income in Cecil is $46,346, while median incomes of families and households are $100,556 and $74,423 respectively.
| Characteristic | Number | Measure |
| Per Capita Income | 475 | $46,346 |
| Median Family Income | 128 | $100,556 |
| Mean Family Income | 128 | $112,816 |
| Median Household Income | 248 | $74,423 |
| Mean Household Income | 248 | $87,346 |
| Income Deficit | 128 | $0 |
| Wage / Income Gap (%) | 475 | 49.19% |
| Wage / Income Gap ($) | 475 | 50.81¢ per $1 |
| Gini / Inequality Index | 475 | 0.37 |
Earnings by Sex in Cecil
Average Earnings in Cecil are $51,181, $68,068 for men and $34,583 for women, a difference of 49.2%.
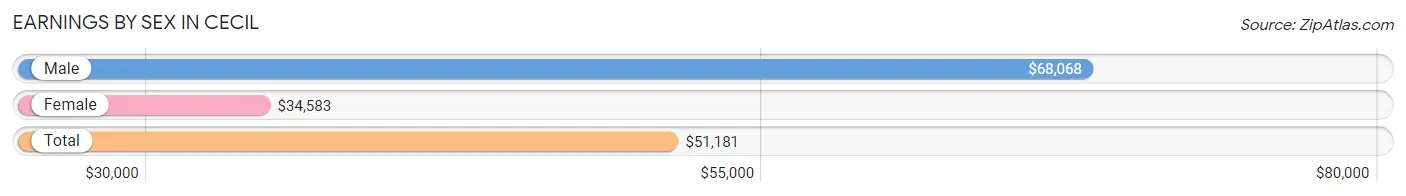
| Sex | Number | Average Earnings |
| Male | 137 (47.7%) | $68,068 |
| Female | 150 (52.3%) | $34,583 |
| Total | 287 (100.0%) | $51,181 |
Earnings by Sex by Income Bracket in Cecil
The most common earnings brackets in Cecil are $65,000 to $74,999 for men (28 | 20.4%) and $20,000 to $22,499 for women (20 | 13.3%).
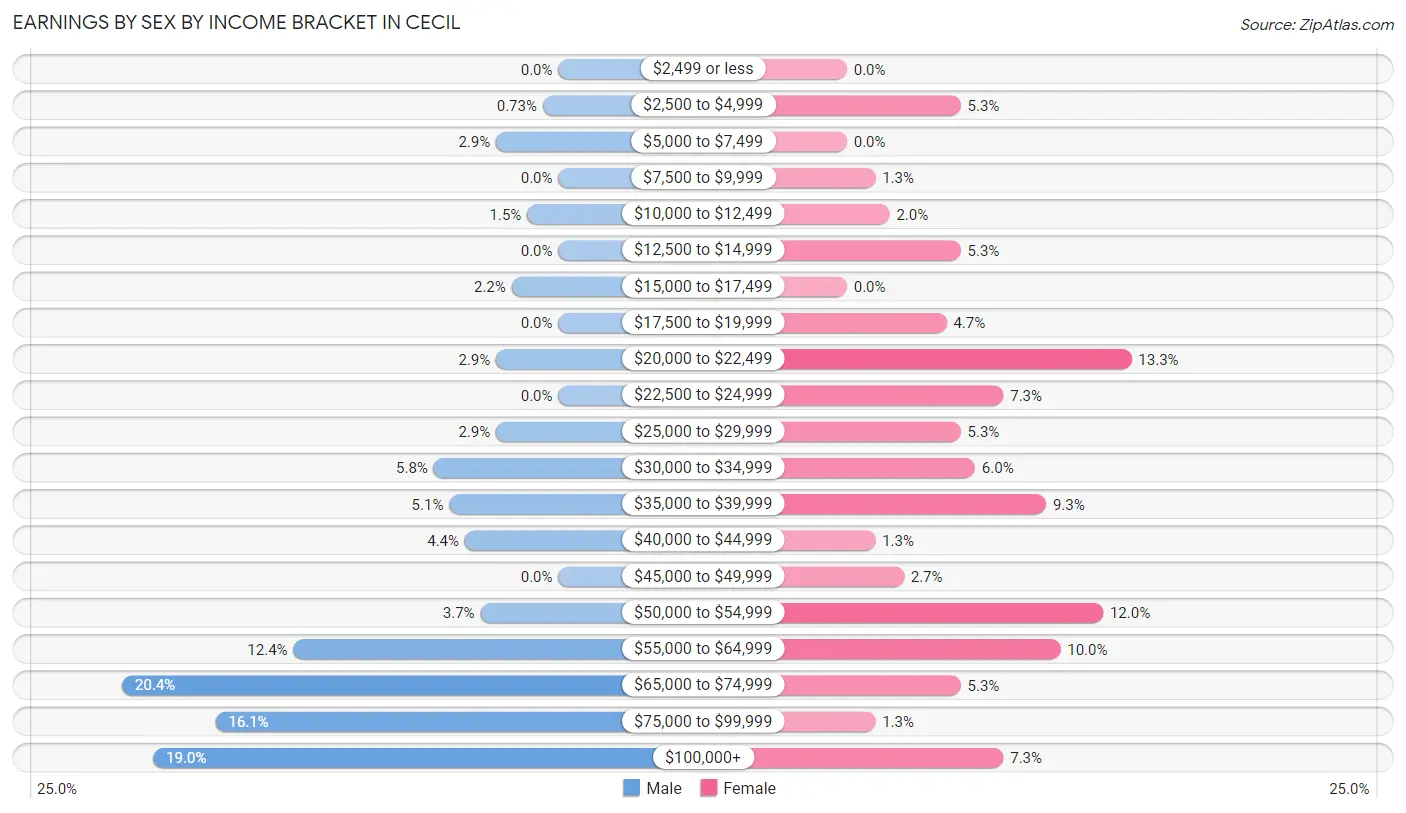
| Income | Male | Female |
| $2,499 or less | 0 (0.0%) | 0 (0.0%) |
| $2,500 to $4,999 | 1 (0.7%) | 8 (5.3%) |
| $5,000 to $7,499 | 4 (2.9%) | 0 (0.0%) |
| $7,500 to $9,999 | 0 (0.0%) | 2 (1.3%) |
| $10,000 to $12,499 | 2 (1.5%) | 3 (2.0%) |
| $12,500 to $14,999 | 0 (0.0%) | 8 (5.3%) |
| $15,000 to $17,499 | 3 (2.2%) | 0 (0.0%) |
| $17,500 to $19,999 | 0 (0.0%) | 7 (4.7%) |
| $20,000 to $22,499 | 4 (2.9%) | 20 (13.3%) |
| $22,500 to $24,999 | 0 (0.0%) | 11 (7.3%) |
| $25,000 to $29,999 | 4 (2.9%) | 8 (5.3%) |
| $30,000 to $34,999 | 8 (5.8%) | 9 (6.0%) |
| $35,000 to $39,999 | 7 (5.1%) | 14 (9.3%) |
| $40,000 to $44,999 | 6 (4.4%) | 2 (1.3%) |
| $45,000 to $49,999 | 0 (0.0%) | 4 (2.7%) |
| $50,000 to $54,999 | 5 (3.6%) | 18 (12.0%) |
| $55,000 to $64,999 | 17 (12.4%) | 15 (10.0%) |
| $65,000 to $74,999 | 28 (20.4%) | 8 (5.3%) |
| $75,000 to $99,999 | 22 (16.1%) | 2 (1.3%) |
| $100,000+ | 26 (19.0%) | 11 (7.3%) |
| Total | 137 (100.0%) | 150 (100.0%) |
Earnings by Sex by Educational Attainment in Cecil
Average earnings in Cecil are $69,091 for men and $40,000 for women, a difference of 42.1%. Men with an educational attainment of bachelor's degree enjoy the highest average annual earnings of $89,375, while those with high school diploma education earn the least with $67,708. Women with an educational attainment of graduate degree earn the most with the average annual earnings of $119,688, while those with college or associate's degree education have the smallest earnings of $32,917.
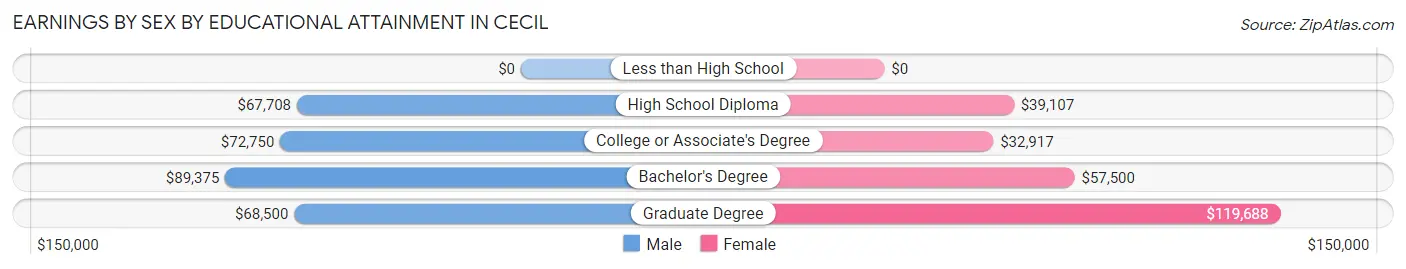
| Educational Attainment | Male Income | Female Income |
| Less than High School | - | - |
| High School Diploma | $67,708 | $39,107 |
| College or Associate's Degree | $72,750 | $32,917 |
| Bachelor's Degree | $89,375 | $57,500 |
| Graduate Degree | $68,500 | $119,688 |
| Total | $69,091 | $40,000 |
Family Income in Cecil
Family Income Brackets in Cecil
According to the Cecil family income data, there are 33 families falling into the $100,000 to $149,999 income range, which is the most common income bracket and makes up 25.8% of all families.
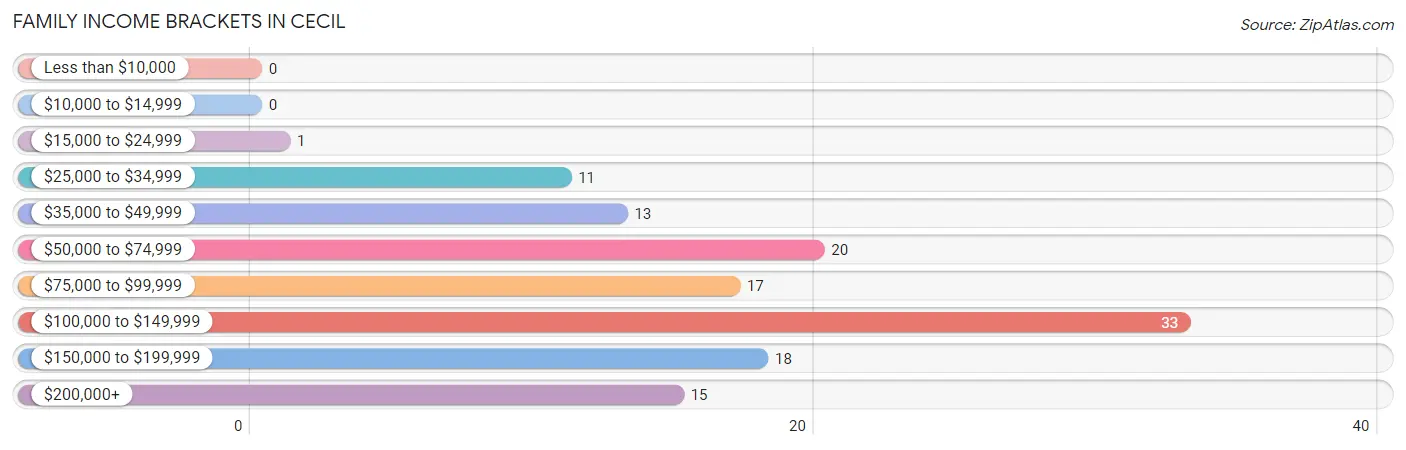
| Income Bracket | # Families | % Families |
| Less than $10,000 | 0 | 0.0% |
| $10,000 to $14,999 | 0 | 0.0% |
| $15,000 to $24,999 | 1 | 0.8% |
| $25,000 to $34,999 | 11 | 8.6% |
| $35,000 to $49,999 | 13 | 10.2% |
| $50,000 to $74,999 | 20 | 15.6% |
| $75,000 to $99,999 | 17 | 13.3% |
| $100,000 to $149,999 | 33 | 25.8% |
| $150,000 to $199,999 | 18 | 14.1% |
| $200,000+ | 15 | 11.7% |
Family Income by Famaliy Size in Cecil
5-person families (9 | 7.0%) account for the highest median family income in Cecil with $176,875 per family, while 2-person families (89 | 69.5%) have the highest median income of $43,125 per family member.
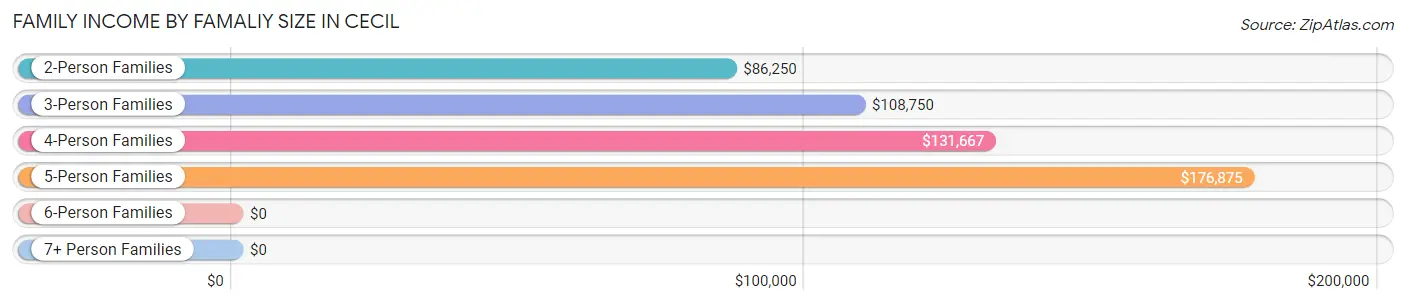
| Income Bracket | # Families | Median Income |
| 2-Person Families | 89 (69.5%) | $86,250 |
| 3-Person Families | 16 (12.5%) | $108,750 |
| 4-Person Families | 14 (10.9%) | $131,667 |
| 5-Person Families | 9 (7.0%) | $176,875 |
| 6-Person Families | 0 (0.0%) | $0 |
| 7+ Person Families | 0 (0.0%) | $0 |
| Total | 128 (100.0%) | $100,556 |
Family Income by Number of Earners in Cecil
The median family income in Cecil is $100,556, with families comprising 3+ earners (12) having the highest median family income of $200,833, while families with no earners (33) have the lowest median family income of $46,458, accounting for 9.4% and 25.8% of families, respectively.
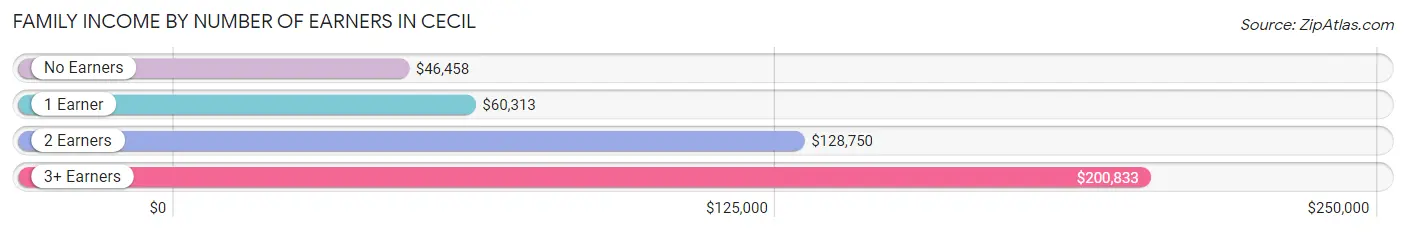
| Number of Earners | # Families | Median Income |
| No Earners | 33 (25.8%) | $46,458 |
| 1 Earner | 27 (21.1%) | $60,313 |
| 2 Earners | 56 (43.8%) | $128,750 |
| 3+ Earners | 12 (9.4%) | $200,833 |
| Total | 128 (100.0%) | $100,556 |
Household Income in Cecil
Household Income Brackets in Cecil
With 45 households falling in the category, the $35,000 to $49,999 income range is the most frequent in Cecil, accounting for 18.1% of all households. In contrast, only 4 households (1.6%) fall into the less than $10,000 income bracket, making it the least populous group.
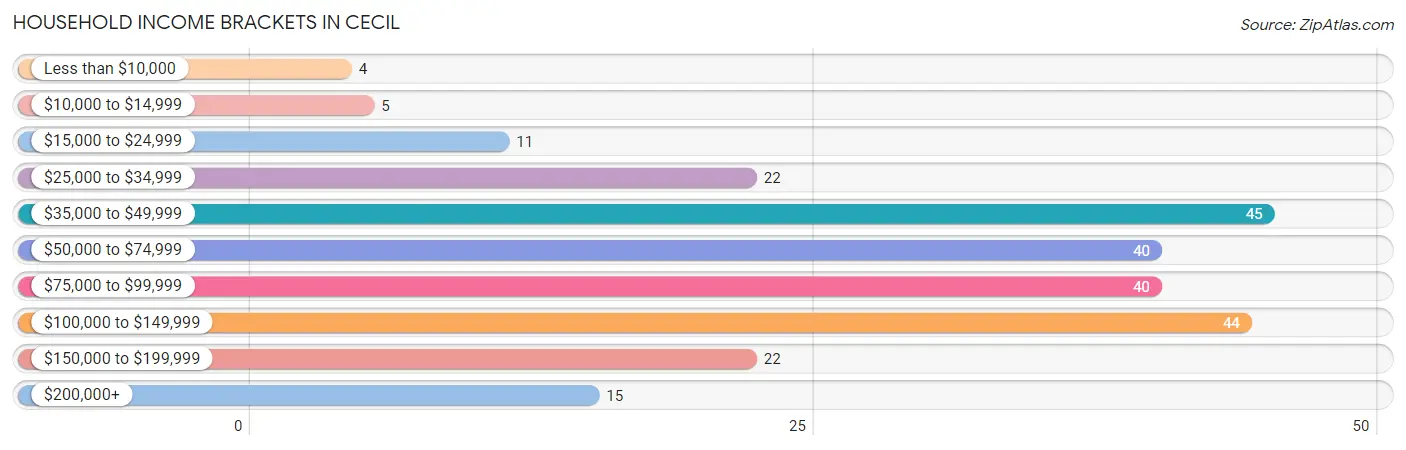
| Income Bracket | # Households | % Households |
| Less than $10,000 | 4 | 1.6% |
| $10,000 to $14,999 | 5 | 2.0% |
| $15,000 to $24,999 | 11 | 4.4% |
| $25,000 to $34,999 | 22 | 8.9% |
| $35,000 to $49,999 | 45 | 18.1% |
| $50,000 to $74,999 | 40 | 16.1% |
| $75,000 to $99,999 | 40 | 16.1% |
| $100,000 to $149,999 | 44 | 17.7% |
| $150,000 to $199,999 | 22 | 8.9% |
| $200,000+ | 15 | 6.0% |
Household Income by Householder Age in Cecil
The median household income in Cecil is $74,423, with the highest median household income of $101,932 found in the 25 to 44 years age bracket for the primary householder. A total of 53 households (21.4%) fall into this category. Meanwhile, the 15 to 24 years age bracket for the primary householder has the lowest median household income of $34,028, with 11 households (4.4%) in this group.
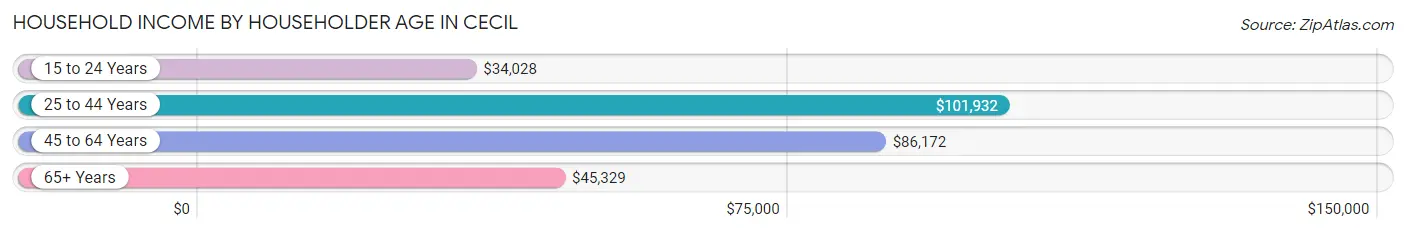
| Income Bracket | # Households | Median Income |
| 15 to 24 Years | 11 (4.4%) | $34,028 |
| 25 to 44 Years | 53 (21.4%) | $101,932 |
| 45 to 64 Years | 83 (33.5%) | $86,172 |
| 65+ Years | 101 (40.7%) | $45,329 |
| Total | 248 (100.0%) | $74,423 |
Poverty in Cecil
Income Below Poverty by Sex and Age in Cecil
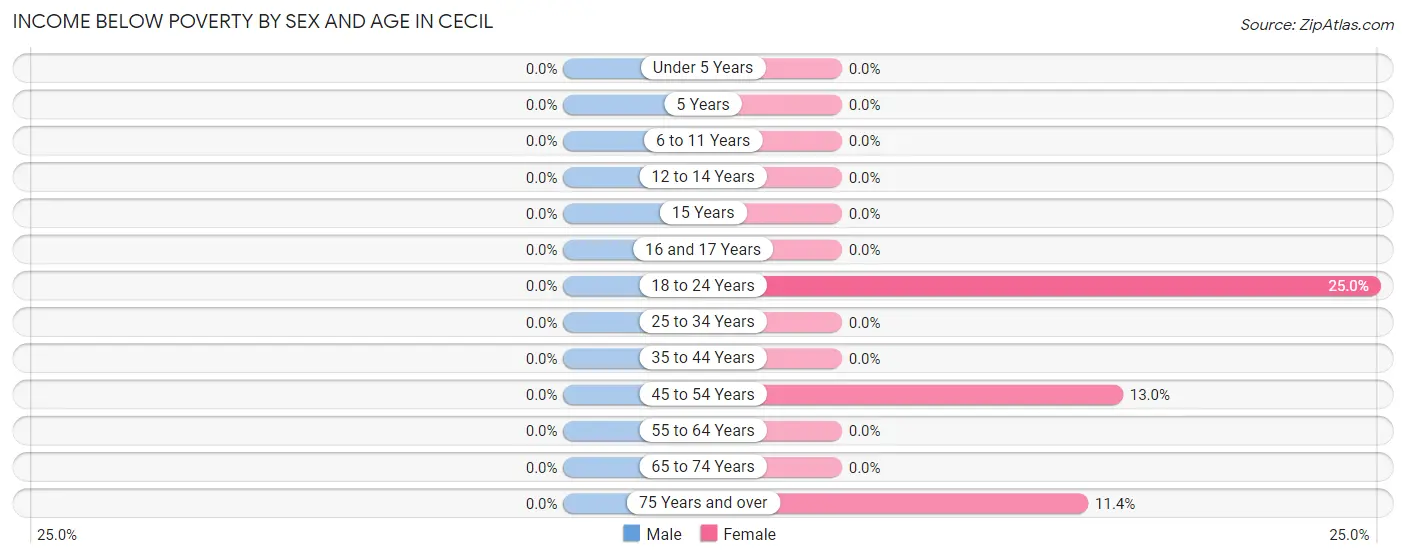
| Age Bracket | Male | Female |
| Under 5 Years | 0 (0.0%) | 0 (0.0%) |
| 5 Years | 0 (0.0%) | 0 (0.0%) |
| 6 to 11 Years | 0 (0.0%) | 0 (0.0%) |
| 12 to 14 Years | 0 (0.0%) | 0 (0.0%) |
| 15 Years | 0 (0.0%) | 0 (0.0%) |
| 16 and 17 Years | 0 (0.0%) | 0 (0.0%) |
| 18 to 24 Years | 0 (0.0%) | 8 (25.0%) |
| 25 to 34 Years | 0 (0.0%) | 0 (0.0%) |
| 35 to 44 Years | 0 (0.0%) | 0 (0.0%) |
| 45 to 54 Years | 0 (0.0%) | 3 (13.0%) |
| 55 to 64 Years | 0 (0.0%) | 0 (0.0%) |
| 65 to 74 Years | 0 (0.0%) | 0 (0.0%) |
| 75 Years and over | 0 (0.0%) | 4 (11.4%) |
| Total | 0 (0.0%) | 15 (6.1%) |
Income Above Poverty by Sex and Age in Cecil
According to the poverty statistics in Cecil, males aged under 5 years and females aged under 5 years are the age groups that are most secure financially, with 100.0% of males and 100.0% of females in these age groups living above the poverty line.
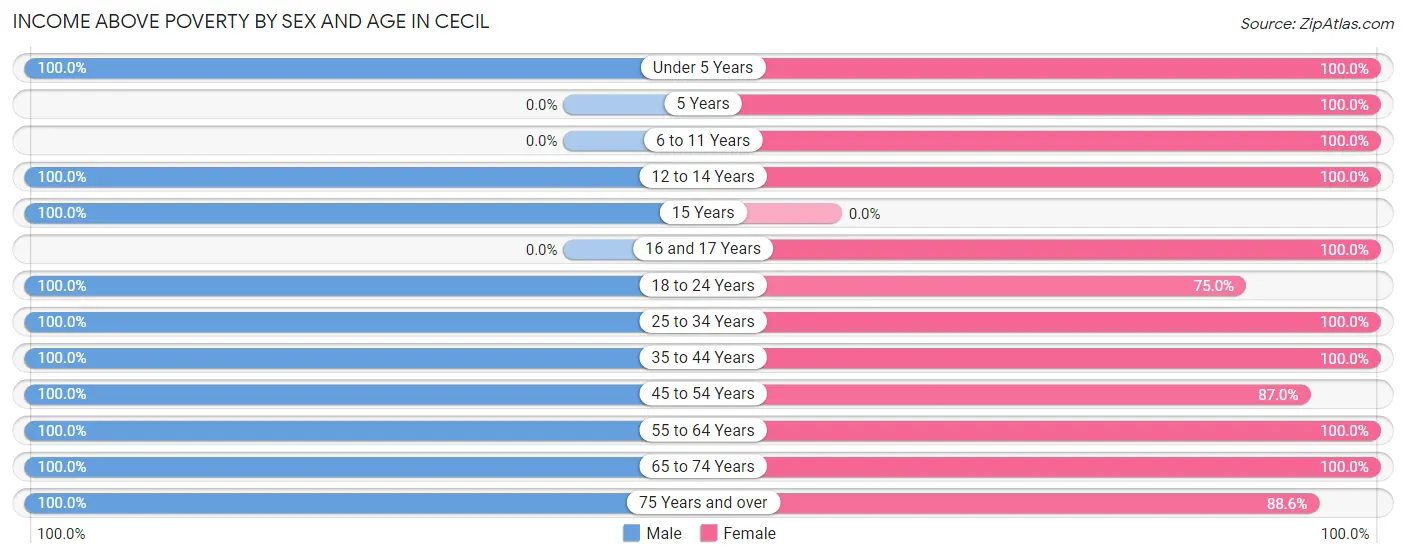
| Age Bracket | Male | Female |
| Under 5 Years | 5 (100.0%) | 10 (100.0%) |
| 5 Years | 0 (0.0%) | 2 (100.0%) |
| 6 to 11 Years | 0 (0.0%) | 17 (100.0%) |
| 12 to 14 Years | 4 (100.0%) | 3 (100.0%) |
| 15 Years | 9 (100.0%) | 0 (0.0%) |
| 16 and 17 Years | 0 (0.0%) | 5 (100.0%) |
| 18 to 24 Years | 9 (100.0%) | 24 (75.0%) |
| 25 to 34 Years | 27 (100.0%) | 27 (100.0%) |
| 35 to 44 Years | 30 (100.0%) | 30 (100.0%) |
| 45 to 54 Years | 26 (100.0%) | 20 (87.0%) |
| 55 to 64 Years | 41 (100.0%) | 29 (100.0%) |
| 65 to 74 Years | 33 (100.0%) | 34 (100.0%) |
| 75 Years and over | 40 (100.0%) | 31 (88.6%) |
| Total | 224 (100.0%) | 232 (93.9%) |
Income Below Poverty Among Married-Couple Families in Cecil
| Children | Above Poverty | Below Poverty |
| No Children | 81 (100.0%) | 0 (0.0%) |
| 1 or 2 Children | 21 (100.0%) | 0 (0.0%) |
| 3 or 4 Children | 5 (100.0%) | 0 (0.0%) |
| 5 or more Children | 0 (0.0%) | 0 (0.0%) |
| Total | 107 (100.0%) | 0 (0.0%) |
Income Below Poverty Among Single-Parent Households in Cecil
| Children | Single Father | Single Mother |
| No Children | 0 (0.0%) | 0 (0.0%) |
| 1 or 2 Children | 0 (0.0%) | 0 (0.0%) |
| 3 or 4 Children | 0 (0.0%) | 0 (0.0%) |
| 5 or more Children | 0 (0.0%) | 0 (0.0%) |
| Total | 0 (0.0%) | 0 (0.0%) |
Income Below Poverty Among Married-Couple vs Single-Parent Households in Cecil
| Children | Married-Couple Families | Single-Parent Households |
| No Children | 0 (0.0%) | 0 (0.0%) |
| 1 or 2 Children | 0 (0.0%) | 0 (0.0%) |
| 3 or 4 Children | 0 (0.0%) | 0 (0.0%) |
| 5 or more Children | 0 (0.0%) | 0 (0.0%) |
| Total | 0 (0.0%) | 0 (0.0%) |
Employment Characteristics in Cecil
Employment by Class of Employer in Cecil
Among the 272 employed individuals in Cecil, private company employees (212 | 77.9%), self-employed (not incorporated) (19 | 7.0%), and local government employees (17 | 6.2%) make up the most common classes of employment.
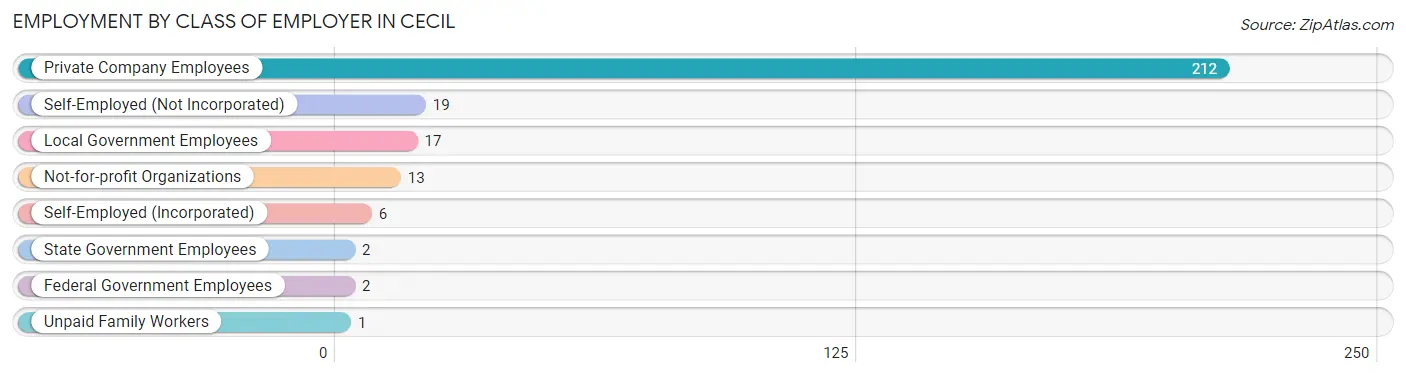
| Employer Class | # Employees | % Employees |
| Private Company Employees | 212 | 77.9% |
| Self-Employed (Incorporated) | 6 | 2.2% |
| Self-Employed (Not Incorporated) | 19 | 7.0% |
| Not-for-profit Organizations | 13 | 4.8% |
| Local Government Employees | 17 | 6.2% |
| State Government Employees | 2 | 0.7% |
| Federal Government Employees | 2 | 0.7% |
| Unpaid Family Workers | 1 | 0.4% |
| Total | 272 | 100.0% |
Employment Status by Age in Cecil
According to the labor force statistics for Cecil, out of the total population over 16 years of age (421), 67.5% or 284 individuals are in the labor force, with 1.1% or 3 of them unemployed. The age group with the highest labor force participation rate is 20 to 24 years, with 100.0% or 14 individuals in the labor force. Within the labor force, the 60 to 64 years age range has the highest percentage of unemployed individuals, with 13.6% or 3 of them being unemployed.
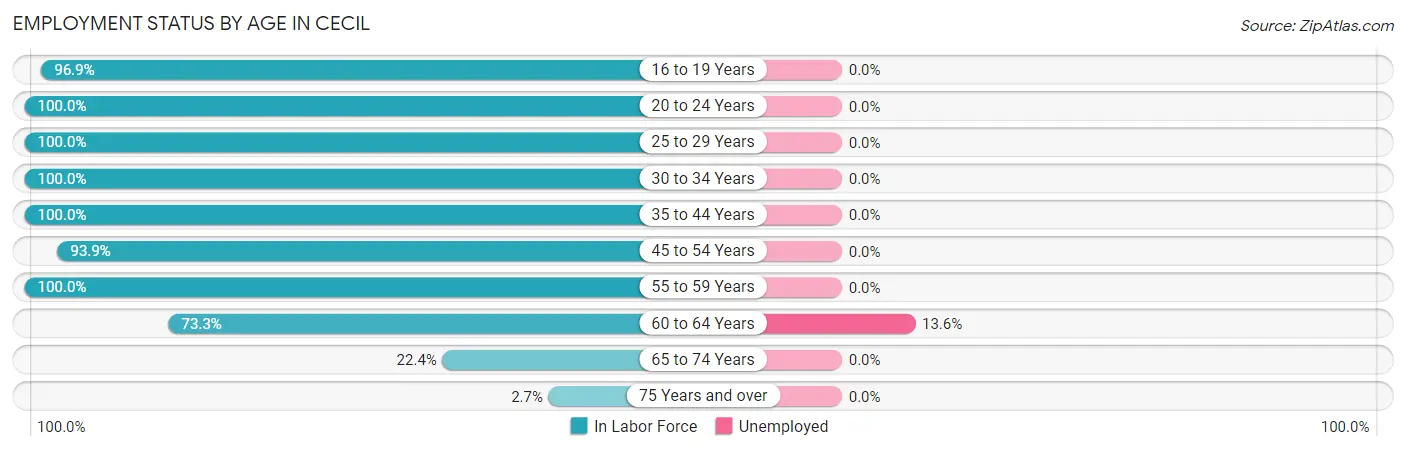
| Age Bracket | In Labor Force | Unemployed |
| 16 to 19 Years | 31 (96.9%) | 0 (0.0%) |
| 20 to 24 Years | 14 (100.0%) | 0 (0.0%) |
| 25 to 29 Years | 47 (100.0%) | 0 (0.0%) |
| 30 to 34 Years | 7 (100.0%) | 0 (0.0%) |
| 35 to 44 Years | 60 (100.0%) | 0 (0.0%) |
| 45 to 54 Years | 46 (93.9%) | 0 (0.0%) |
| 55 to 59 Years | 40 (100.0%) | 0 (0.0%) |
| 60 to 64 Years | 22 (73.3%) | 3 (13.6%) |
| 65 to 74 Years | 15 (22.4%) | 0 (0.0%) |
| 75 Years and over | 2 (2.7%) | 0 (0.0%) |
| Total | 284 (67.5%) | 3 (1.1%) |
Employment Status by Educational Attainment in Cecil
According to labor force statistics for Cecil, 95.3% of individuals (222) out of the total population between 25 and 64 years of age (233) are in the labor force, with 1.4% or 3 of them being unemployed. The group with the highest labor force participation rate are those with the educational attainment of less than high school, with 100.0% or 8 individuals in the labor force. Within the labor force, individuals with high school diploma education have the highest percentage of unemployment, with 3.3% or 3 of them being unemployed.
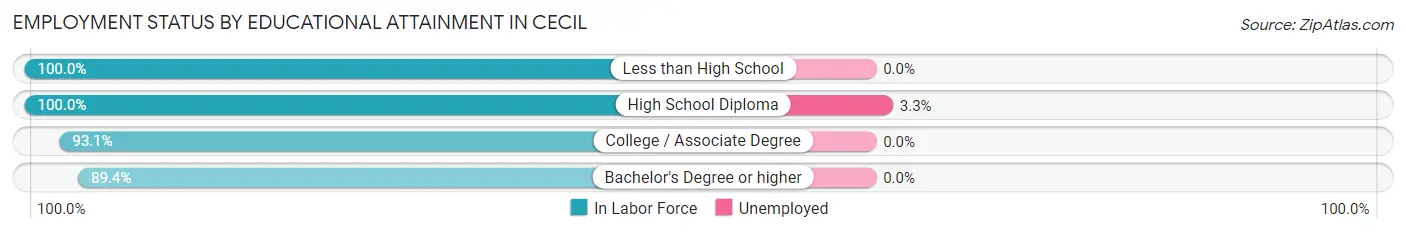
| Educational Attainment | In Labor Force | Unemployed |
| Less than High School | 8 (100.0%) | 0 (0.0%) |
| High School Diploma | 91 (100.0%) | 3 (3.3%) |
| College / Associate Degree | 81 (93.1%) | 0 (0.0%) |
| Bachelor's Degree or higher | 42 (89.4%) | 0 (0.0%) |
| Total | 222 (95.3%) | 3 (1.4%) |
Employment Occupations by Sex in Cecil
Management, Business, Science and Arts Occupations
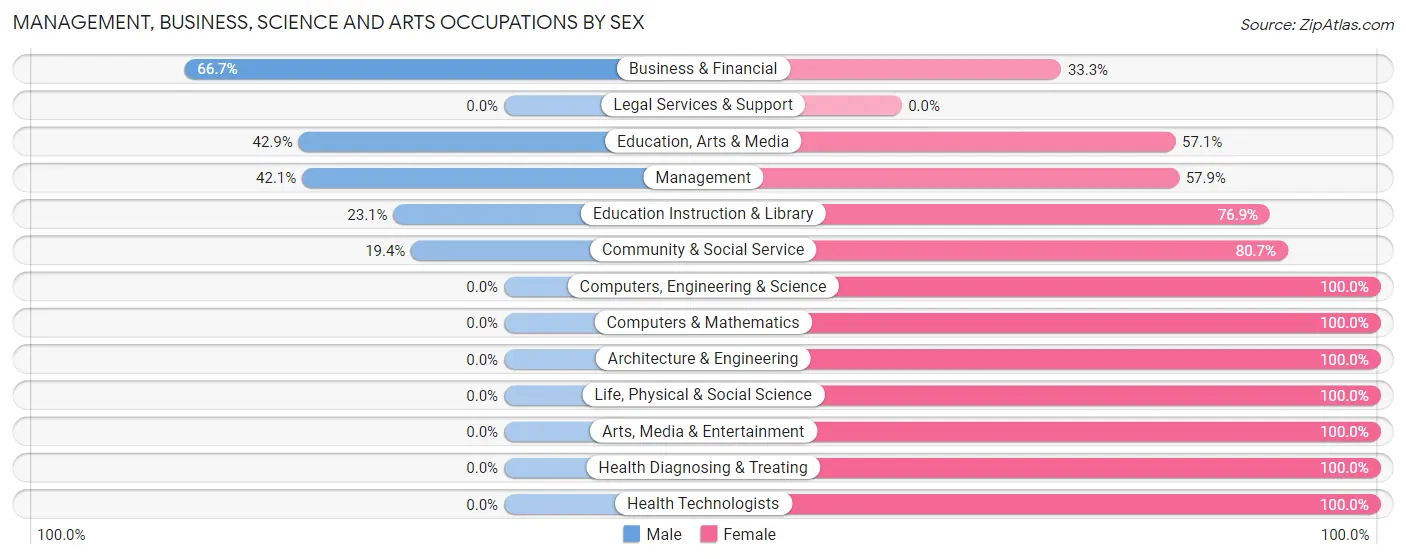
The most common Management, Business, Science and Arts occupations in Cecil are Community & Social Service (31 | 11.0%), Management (19 | 6.8%), Education Instruction & Library (13 | 4.6%), Health Diagnosing & Treating (12 | 4.3%), and Health Technologists (12 | 4.3%).
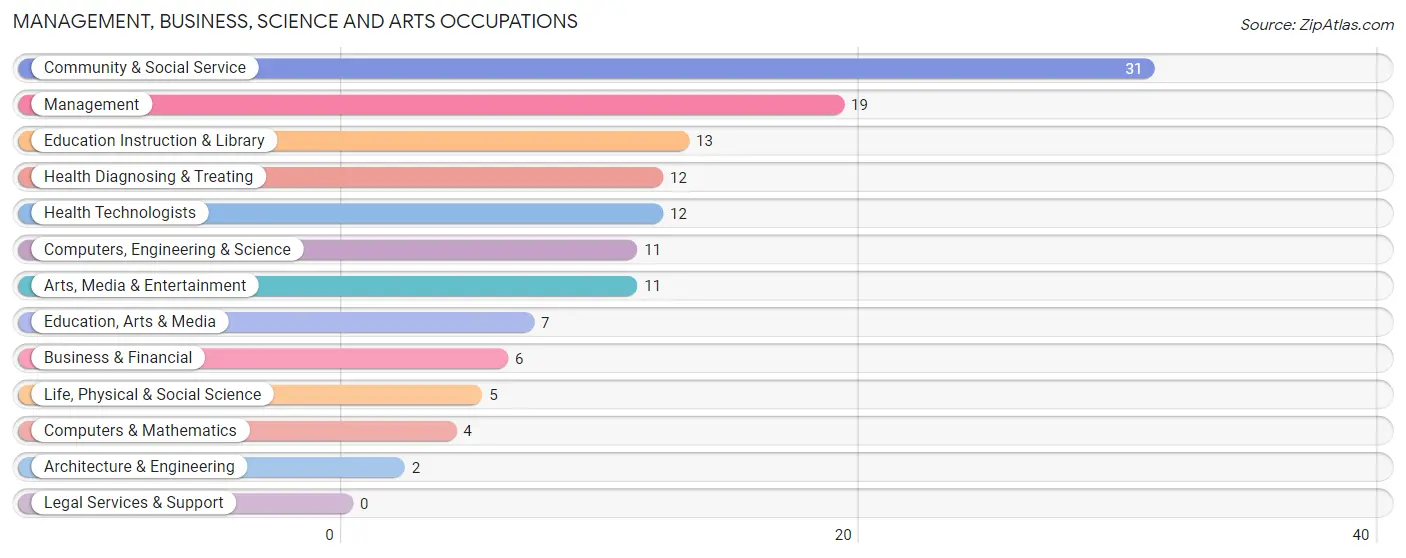
Management, Business, Science and Arts Occupations by Sex
Within the Management, Business, Science and Arts occupations in Cecil, the most male-oriented occupations are Business & Financial (66.7%), Education, Arts & Media (42.9%), and Management (42.1%), while the most female-oriented occupations are Computers, Engineering & Science (100.0%), Computers & Mathematics (100.0%), and Architecture & Engineering (100.0%).
| Occupation | Male | Female |
| Management | 8 (42.1%) | 11 (57.9%) |
| Business & Financial | 4 (66.7%) | 2 (33.3%) |
| Computers, Engineering & Science | 0 (0.0%) | 11 (100.0%) |
| Computers & Mathematics | 0 (0.0%) | 4 (100.0%) |
| Architecture & Engineering | 0 (0.0%) | 2 (100.0%) |
| Life, Physical & Social Science | 0 (0.0%) | 5 (100.0%) |
| Community & Social Service | 6 (19.4%) | 25 (80.6%) |
| Education, Arts & Media | 3 (42.9%) | 4 (57.1%) |
| Legal Services & Support | 0 (0.0%) | 0 (0.0%) |
| Education Instruction & Library | 3 (23.1%) | 10 (76.9%) |
| Arts, Media & Entertainment | 0 (0.0%) | 11 (100.0%) |
| Health Diagnosing & Treating | 0 (0.0%) | 12 (100.0%) |
| Health Technologists | 0 (0.0%) | 12 (100.0%) |
| Total (Category) | 18 (22.8%) | 61 (77.2%) |
| Total (Overall) | 135 (48.0%) | 146 (52.0%) |
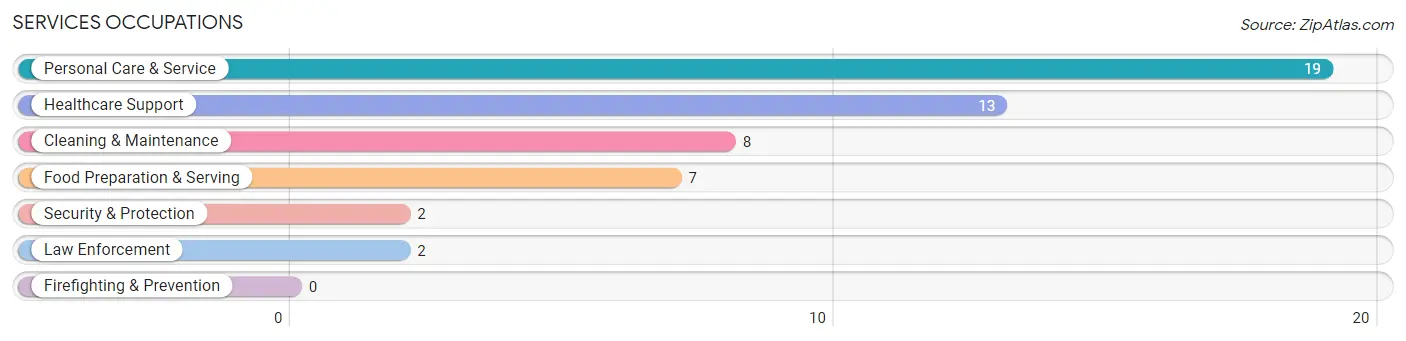
Services Occupations
The most common Services occupations in Cecil are Personal Care & Service (19 | 6.8%), Healthcare Support (13 | 4.6%), Cleaning & Maintenance (8 | 2.9%), Food Preparation & Serving (7 | 2.5%), and Security & Protection (2 | 0.7%).
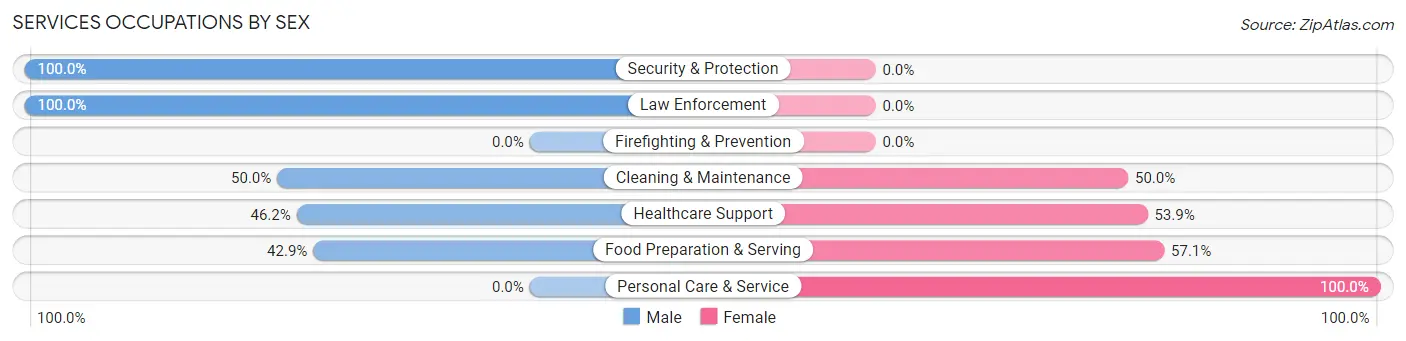
Services Occupations by Sex
Within the Services occupations in Cecil, the most male-oriented occupations are Security & Protection (100.0%), Law Enforcement (100.0%), and Cleaning & Maintenance (50.0%), while the most female-oriented occupations are Personal Care & Service (100.0%), Food Preparation & Serving (57.1%), and Healthcare Support (53.8%).
| Occupation | Male | Female |
| Healthcare Support | 6 (46.2%) | 7 (53.8%) |
| Security & Protection | 2 (100.0%) | 0 (0.0%) |
| Firefighting & Prevention | 0 (0.0%) | 0 (0.0%) |
| Law Enforcement | 2 (100.0%) | 0 (0.0%) |
| Food Preparation & Serving | 3 (42.9%) | 4 (57.1%) |
| Cleaning & Maintenance | 4 (50.0%) | 4 (50.0%) |
| Personal Care & Service | 0 (0.0%) | 19 (100.0%) |
| Total (Category) | 15 (30.6%) | 34 (69.4%) |
| Total (Overall) | 135 (48.0%) | 146 (52.0%) |
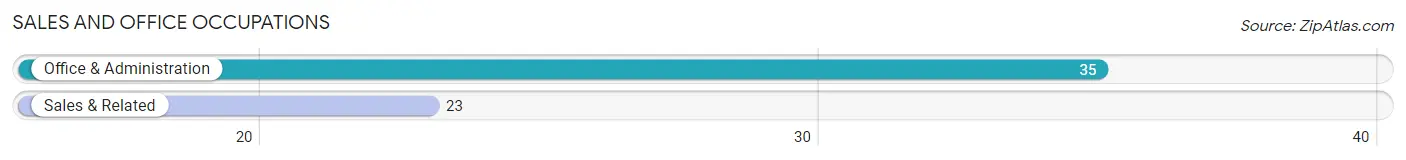
Sales and Office Occupations
The most common Sales and Office occupations in Cecil are Office & Administration (35 | 12.5%), and Sales & Related (23 | 8.2%).
Sales and Office Occupations by Sex
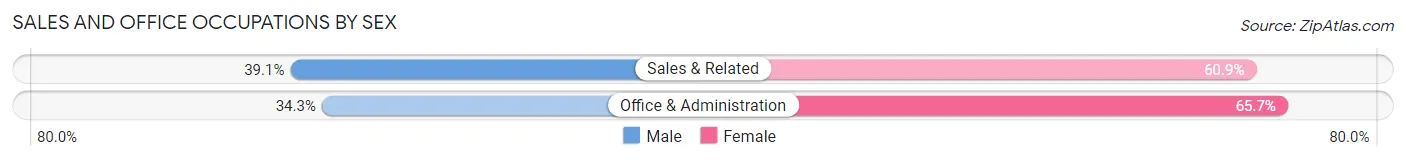
| Occupation | Male | Female |
| Sales & Related | 9 (39.1%) | 14 (60.9%) |
| Office & Administration | 12 (34.3%) | 23 (65.7%) |
| Total (Category) | 21 (36.2%) | 37 (63.8%) |
| Total (Overall) | 135 (48.0%) | 146 (52.0%) |
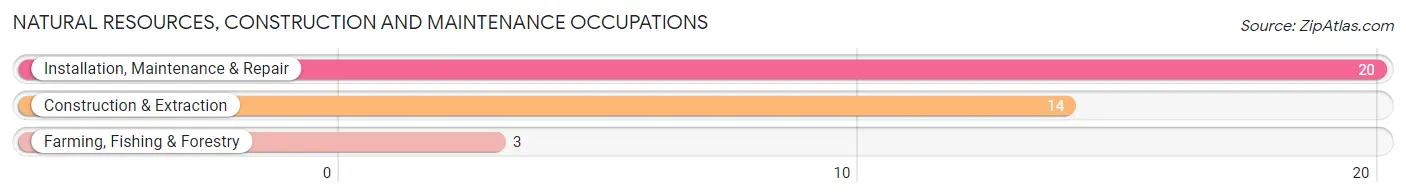
Natural Resources, Construction and Maintenance Occupations
The most common Natural Resources, Construction and Maintenance occupations in Cecil are Installation, Maintenance & Repair (20 | 7.1%), Construction & Extraction (14 | 5.0%), and Farming, Fishing & Forestry (3 | 1.1%).
Natural Resources, Construction and Maintenance Occupations by Sex
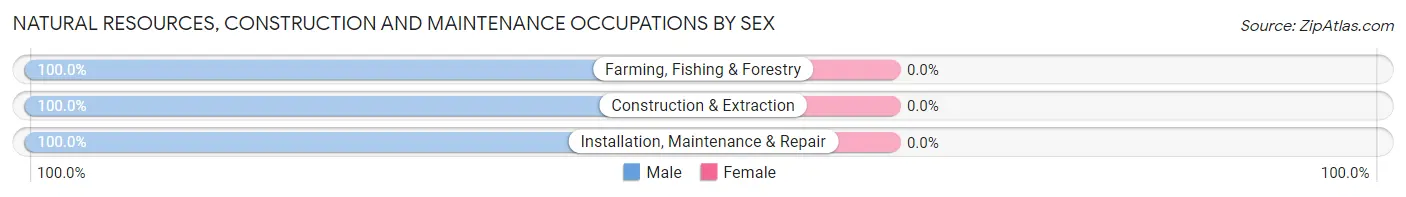
| Occupation | Male | Female |
| Farming, Fishing & Forestry | 3 (100.0%) | 0 (0.0%) |
| Construction & Extraction | 14 (100.0%) | 0 (0.0%) |
| Installation, Maintenance & Repair | 20 (100.0%) | 0 (0.0%) |
| Total (Category) | 37 (100.0%) | 0 (0.0%) |
| Total (Overall) | 135 (48.0%) | 146 (52.0%) |
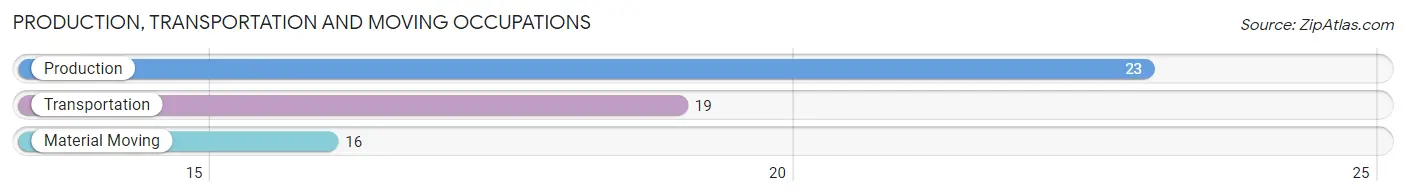
Production, Transportation and Moving Occupations
The most common Production, Transportation and Moving occupations in Cecil are Production (23 | 8.2%), Transportation (19 | 6.8%), and Material Moving (16 | 5.7%).
Production, Transportation and Moving Occupations by Sex
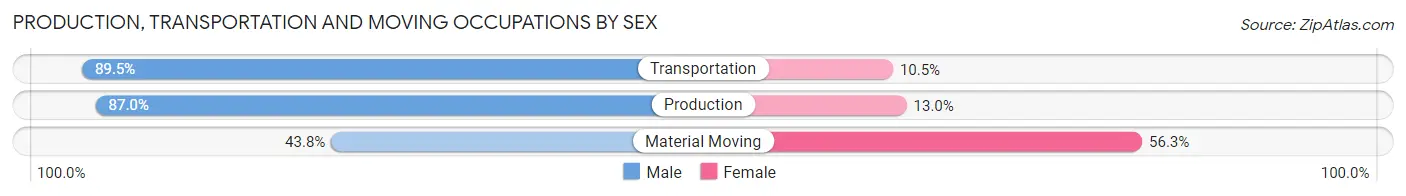
| Occupation | Male | Female |
| Production | 20 (87.0%) | 3 (13.0%) |
| Transportation | 17 (89.5%) | 2 (10.5%) |
| Material Moving | 7 (43.8%) | 9 (56.2%) |
| Total (Category) | 44 (75.9%) | 14 (24.1%) |
| Total (Overall) | 135 (48.0%) | 146 (52.0%) |
Employment Industries by Sex in Cecil
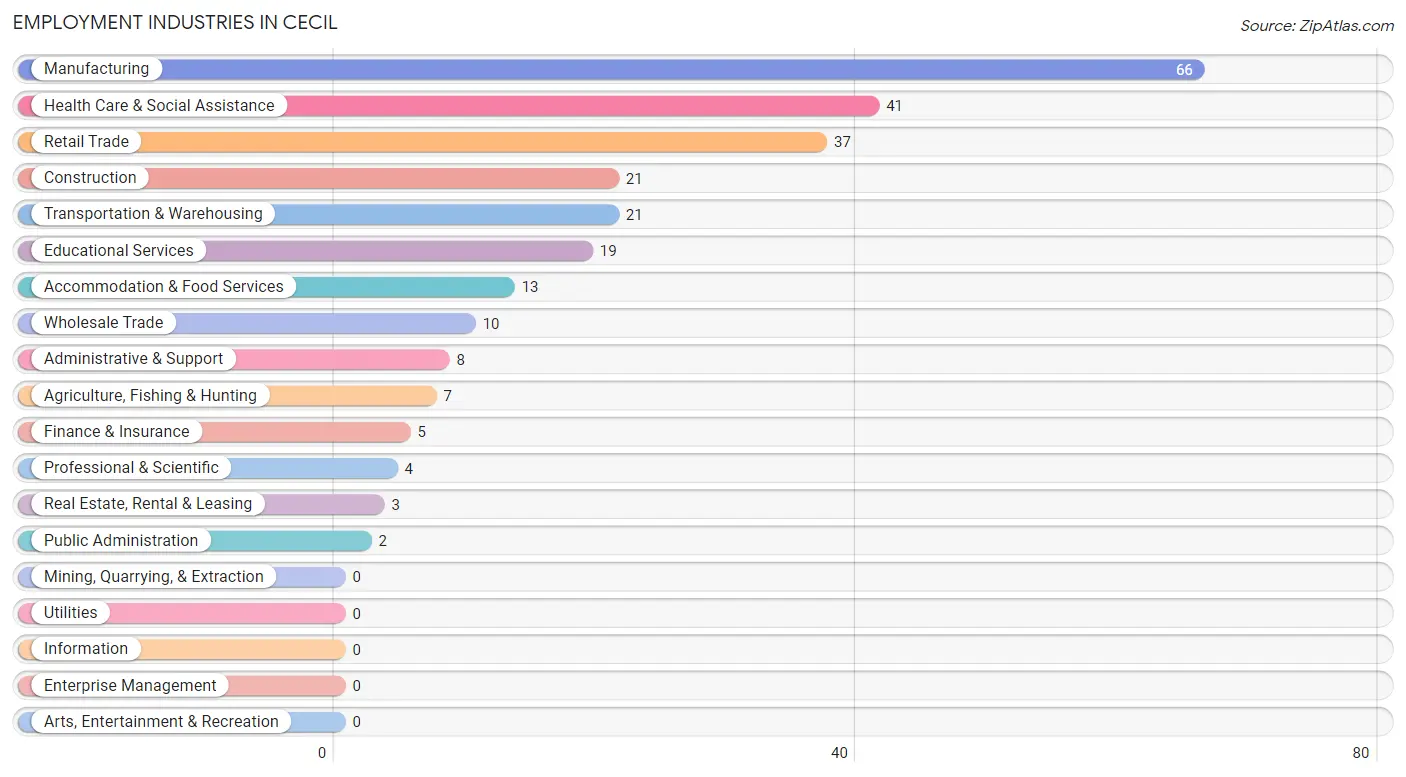
Employment Industries in Cecil
The major employment industries in Cecil include Manufacturing (66 | 23.5%), Health Care & Social Assistance (41 | 14.6%), Retail Trade (37 | 13.2%), Construction (21 | 7.5%), and Transportation & Warehousing (21 | 7.5%).
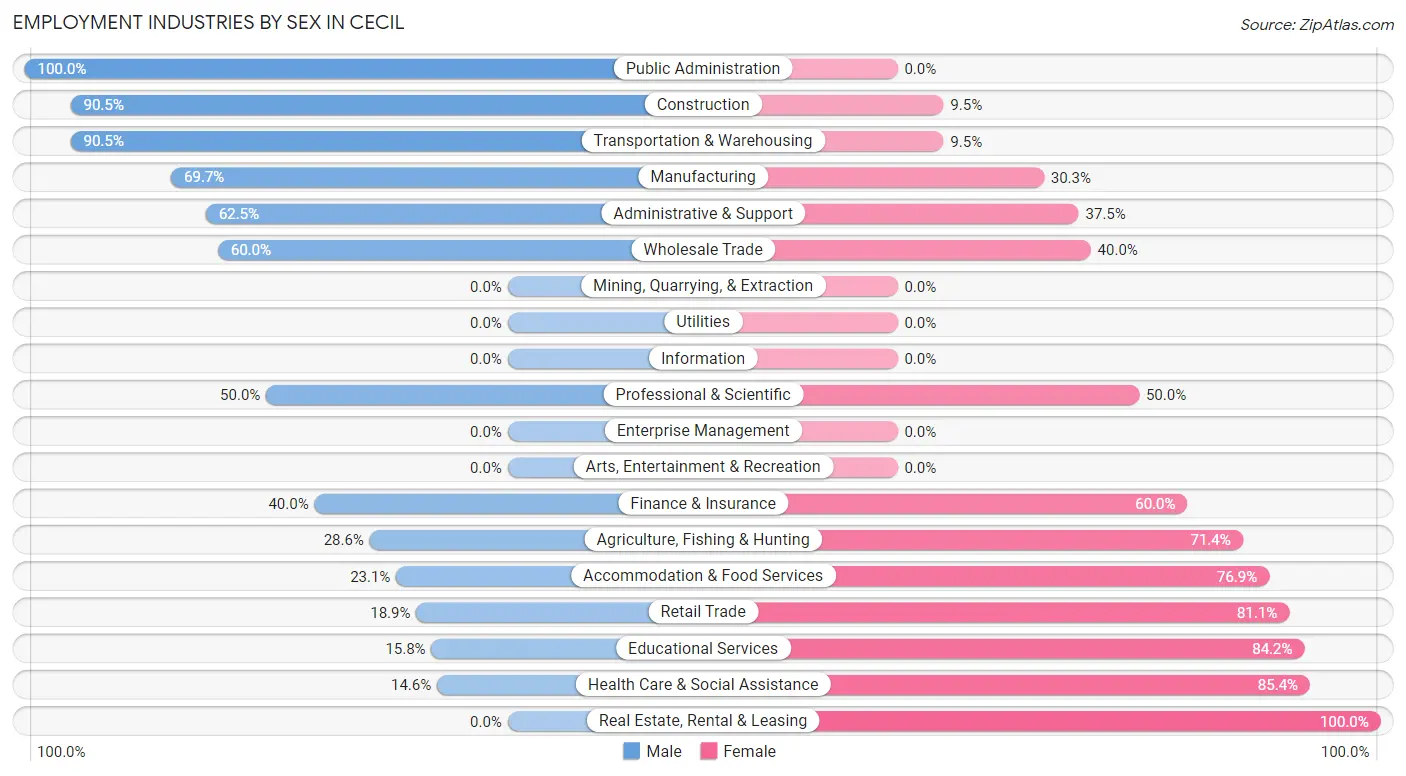
Employment Industries by Sex in Cecil
The Cecil industries that see more men than women are Public Administration (100.0%), Construction (90.5%), and Transportation & Warehousing (90.5%), whereas the industries that tend to have a higher number of women are Real Estate, Rental & Leasing (100.0%), Health Care & Social Assistance (85.4%), and Educational Services (84.2%).
| Industry | Male | Female |
| Agriculture, Fishing & Hunting | 2 (28.6%) | 5 (71.4%) |
| Mining, Quarrying, & Extraction | 0 (0.0%) | 0 (0.0%) |
| Construction | 19 (90.5%) | 2 (9.5%) |
| Manufacturing | 46 (69.7%) | 20 (30.3%) |
| Wholesale Trade | 6 (60.0%) | 4 (40.0%) |
| Retail Trade | 7 (18.9%) | 30 (81.1%) |
| Transportation & Warehousing | 19 (90.5%) | 2 (9.5%) |
| Utilities | 0 (0.0%) | 0 (0.0%) |
| Information | 0 (0.0%) | 0 (0.0%) |
| Finance & Insurance | 2 (40.0%) | 3 (60.0%) |
| Real Estate, Rental & Leasing | 0 (0.0%) | 3 (100.0%) |
| Professional & Scientific | 2 (50.0%) | 2 (50.0%) |
| Enterprise Management | 0 (0.0%) | 0 (0.0%) |
| Administrative & Support | 5 (62.5%) | 3 (37.5%) |
| Educational Services | 3 (15.8%) | 16 (84.2%) |
| Health Care & Social Assistance | 6 (14.6%) | 35 (85.4%) |
| Arts, Entertainment & Recreation | 0 (0.0%) | 0 (0.0%) |
| Accommodation & Food Services | 3 (23.1%) | 10 (76.9%) |
| Public Administration | 2 (100.0%) | 0 (0.0%) |
| Total | 135 (48.0%) | 146 (52.0%) |
Education in Cecil
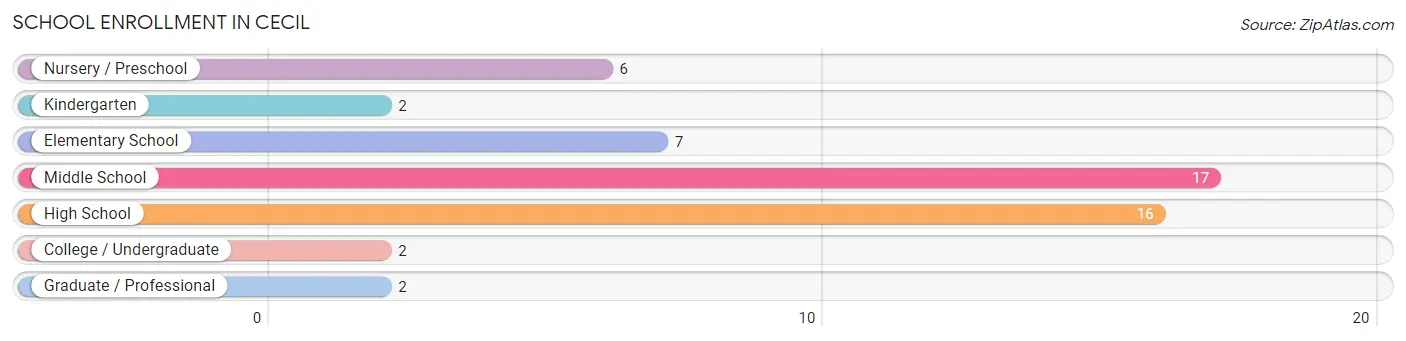
School Enrollment in Cecil
The most common levels of schooling among the 52 students in Cecil are middle school (17 | 32.7%), high school (16 | 30.8%), and elementary school (7 | 13.5%).
| School Level | # Students | % Students |
| Nursery / Preschool | 6 | 11.5% |
| Kindergarten | 2 | 3.8% |
| Elementary School | 7 | 13.5% |
| Middle School | 17 | 32.7% |
| High School | 16 | 30.8% |
| College / Undergraduate | 2 | 3.8% |
| Graduate / Professional | 2 | 3.8% |
| Total | 52 | 100.0% |
School Enrollment by Age by Funding Source in Cecil
Out of a total of 52 students who are enrolled in schools in Cecil, 7 (13.5%) attend a private institution, while the remaining 45 (86.5%) are enrolled in public schools. The age group of 10 to 14 year olds has the highest likelihood of being enrolled in private schools, with 5 (26.3% in the age bracket) enrolled. Conversely, the age group of 3 to 4 year olds has the lowest likelihood of being enrolled in a private school, with 4 (100.0% in the age bracket) attending a public institution.
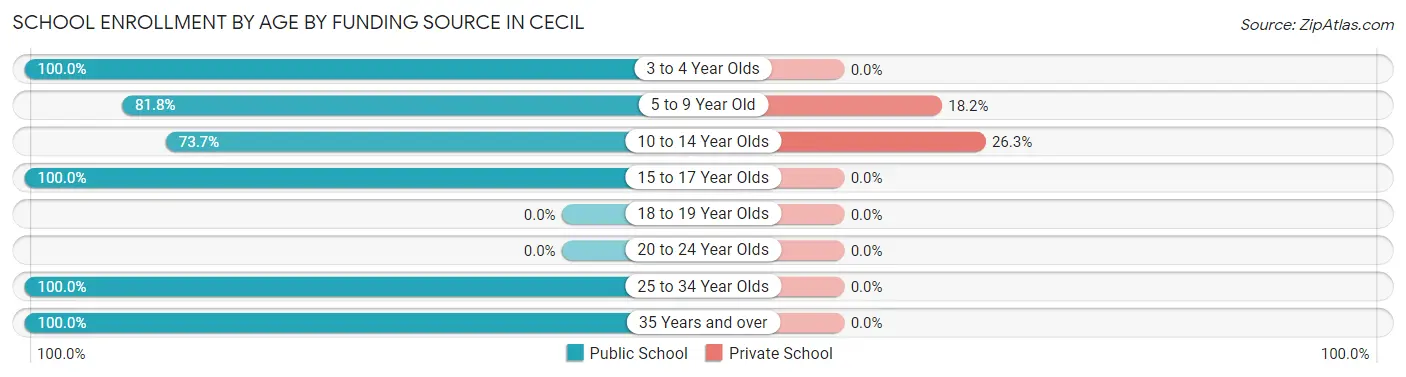
| Age Bracket | Public School | Private School |
| 3 to 4 Year Olds | 4 (100.0%) | 0 (0.0%) |
| 5 to 9 Year Old | 9 (81.8%) | 2 (18.2%) |
| 10 to 14 Year Olds | 14 (73.7%) | 5 (26.3%) |
| 15 to 17 Year Olds | 14 (100.0%) | 0 (0.0%) |
| 18 to 19 Year Olds | 0 (0.0%) | 0 (0.0%) |
| 20 to 24 Year Olds | 0 (0.0%) | 0 (0.0%) |
| 25 to 34 Year Olds | 2 (100.0%) | 0 (0.0%) |
| 35 Years and over | 2 (100.0%) | 0 (0.0%) |
| Total | 45 (86.5%) | 7 (13.5%) |
Educational Attainment by Field of Study in Cecil
Science & technology (20 | 27.4%), business (16 | 21.9%), education (15 | 20.5%), bio, nature & agricultural (6 | 8.2%), and arts & humanities (5 | 6.9%) are the most common fields of study among 73 individuals in Cecil who have obtained a bachelor's degree or higher.
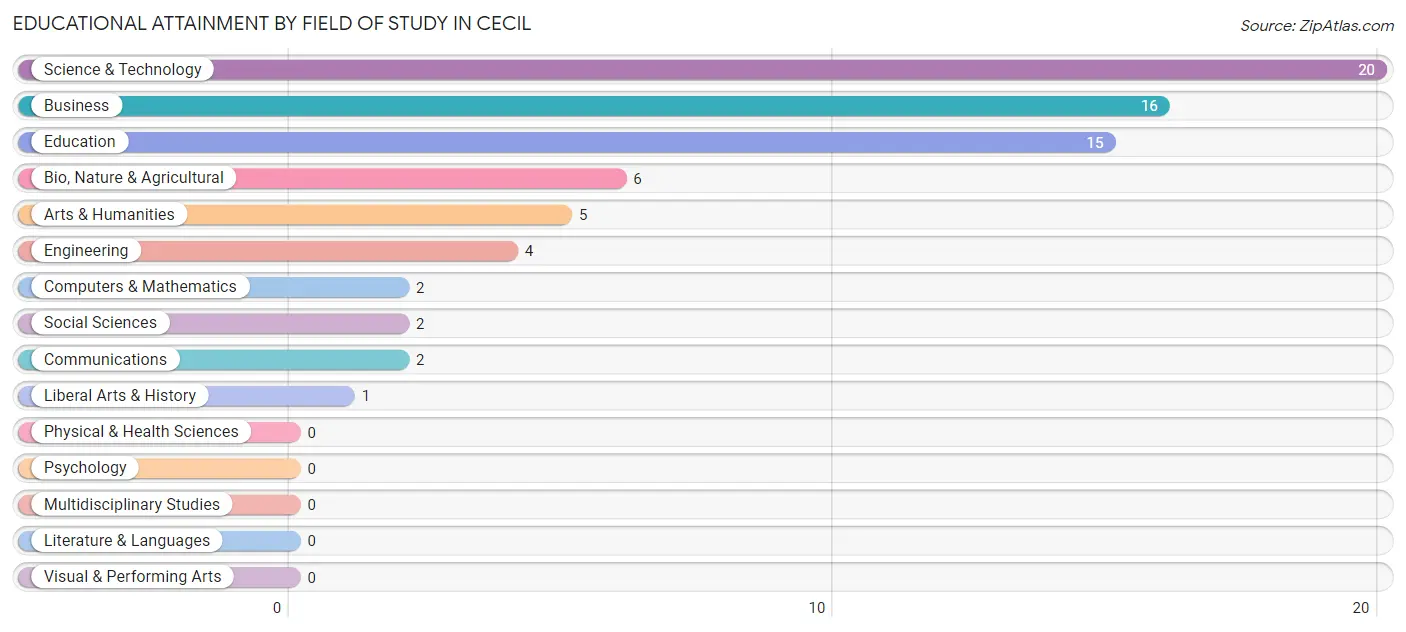
| Field of Study | # Graduates | % Graduates |
| Computers & Mathematics | 2 | 2.7% |
| Bio, Nature & Agricultural | 6 | 8.2% |
| Physical & Health Sciences | 0 | 0.0% |
| Psychology | 0 | 0.0% |
| Social Sciences | 2 | 2.7% |
| Engineering | 4 | 5.5% |
| Multidisciplinary Studies | 0 | 0.0% |
| Science & Technology | 20 | 27.4% |
| Business | 16 | 21.9% |
| Education | 15 | 20.5% |
| Literature & Languages | 0 | 0.0% |
| Liberal Arts & History | 1 | 1.4% |
| Visual & Performing Arts | 0 | 0.0% |
| Communications | 2 | 2.7% |
| Arts & Humanities | 5 | 6.9% |
| Total | 73 | 100.0% |
Transportation & Commute in Cecil
Vehicle Availability by Sex in Cecil
The most prevalent vehicle ownership categories in Cecil are males with 2 vehicles (61, accounting for 48.4%) and females with 2 vehicles (70, making up 41.8%).
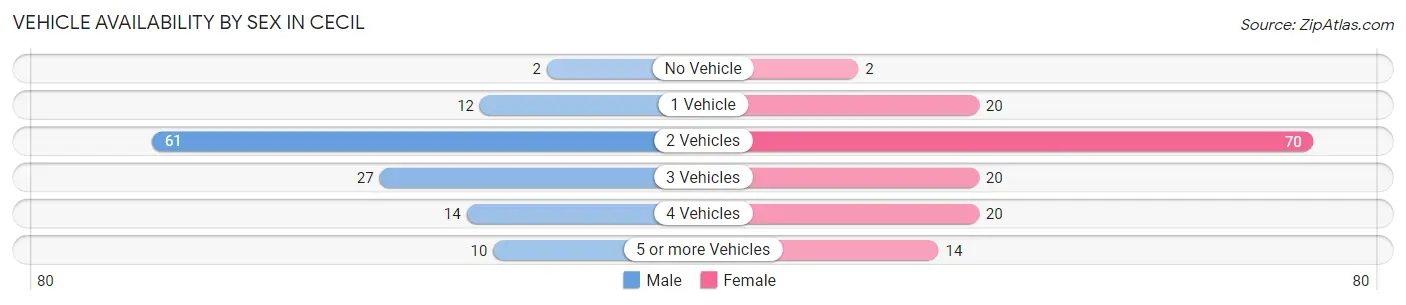
| Vehicles Available | Male | Female |
| No Vehicle | 2 (1.6%) | 2 (1.4%) |
| 1 Vehicle | 12 (9.5%) | 20 (13.7%) |
| 2 Vehicles | 61 (48.4%) | 70 (47.9%) |
| 3 Vehicles | 27 (21.4%) | 20 (13.7%) |
| 4 Vehicles | 14 (11.1%) | 20 (13.7%) |
| 5 or more Vehicles | 10 (7.9%) | 14 (9.6%) |
| Total | 126 (100.0%) | 146 (100.0%) |
Commute Time in Cecil
The most frequently occuring commute durations in Cecil are 15 to 19 minutes (103 commuters, 38.6%), 45 to 59 minutes (52 commuters, 19.5%), and 5 to 9 minutes (21 commuters, 7.9%).
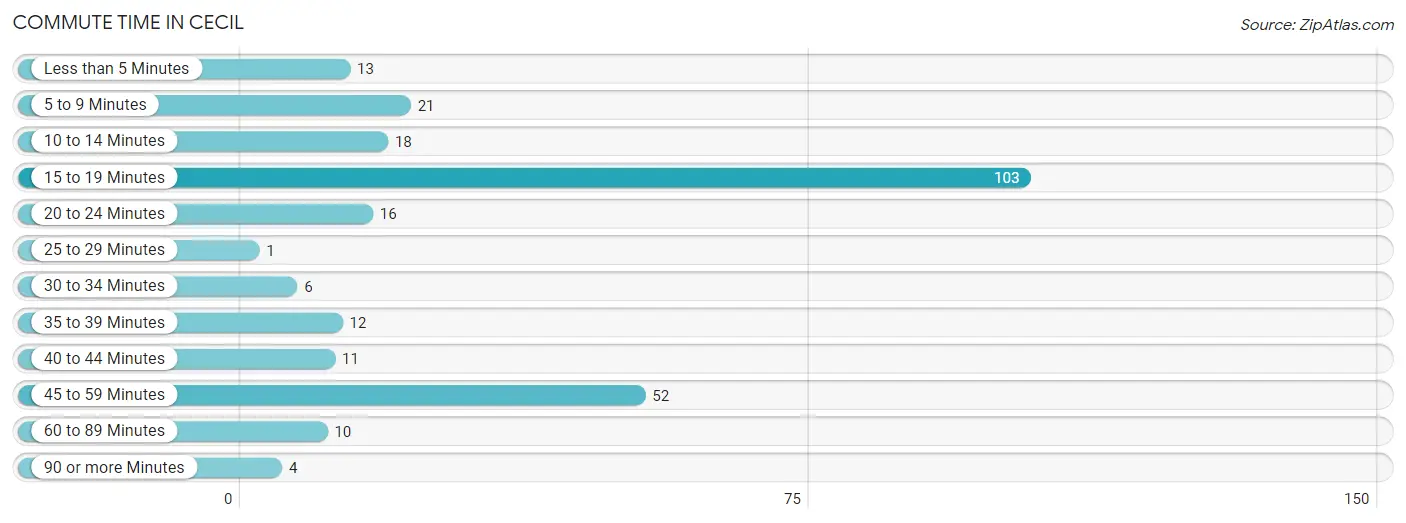
| Commute Time | # Commuters | % Commuters |
| Less than 5 Minutes | 13 | 4.9% |
| 5 to 9 Minutes | 21 | 7.9% |
| 10 to 14 Minutes | 18 | 6.7% |
| 15 to 19 Minutes | 103 | 38.6% |
| 20 to 24 Minutes | 16 | 6.0% |
| 25 to 29 Minutes | 1 | 0.4% |
| 30 to 34 Minutes | 6 | 2.2% |
| 35 to 39 Minutes | 12 | 4.5% |
| 40 to 44 Minutes | 11 | 4.1% |
| 45 to 59 Minutes | 52 | 19.5% |
| 60 to 89 Minutes | 10 | 3.7% |
| 90 or more Minutes | 4 | 1.5% |
Commute Time by Sex in Cecil
The most common commute times in Cecil are 45 to 59 minutes (44 commuters, 35.5%) for males and 15 to 19 minutes (79 commuters, 55.2%) for females.
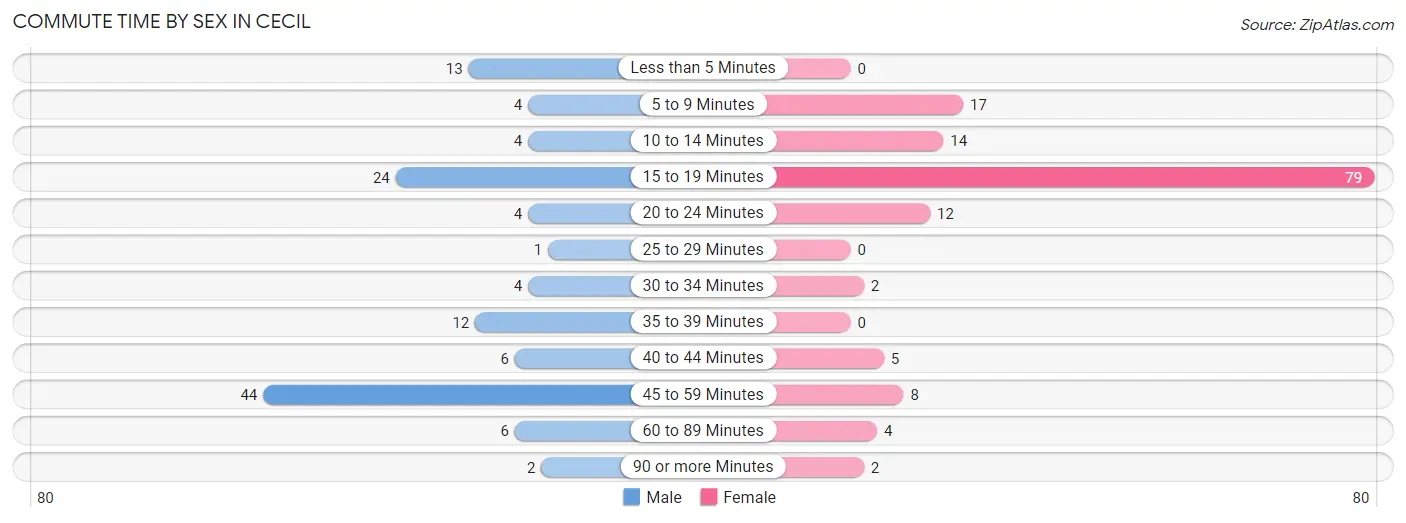
| Commute Time | Male | Female |
| Less than 5 Minutes | 13 (10.5%) | 0 (0.0%) |
| 5 to 9 Minutes | 4 (3.2%) | 17 (11.9%) |
| 10 to 14 Minutes | 4 (3.2%) | 14 (9.8%) |
| 15 to 19 Minutes | 24 (19.4%) | 79 (55.2%) |
| 20 to 24 Minutes | 4 (3.2%) | 12 (8.4%) |
| 25 to 29 Minutes | 1 (0.8%) | 0 (0.0%) |
| 30 to 34 Minutes | 4 (3.2%) | 2 (1.4%) |
| 35 to 39 Minutes | 12 (9.7%) | 0 (0.0%) |
| 40 to 44 Minutes | 6 (4.8%) | 5 (3.5%) |
| 45 to 59 Minutes | 44 (35.5%) | 8 (5.6%) |
| 60 to 89 Minutes | 6 (4.8%) | 4 (2.8%) |
| 90 or more Minutes | 2 (1.6%) | 2 (1.4%) |
Time of Departure to Work by Sex in Cecil
The most frequent times of departure to work in Cecil are 12:00 AM to 4:59 AM (29, 23.4%) for males and 6:30 AM to 6:59 AM (25, 17.5%) for females.
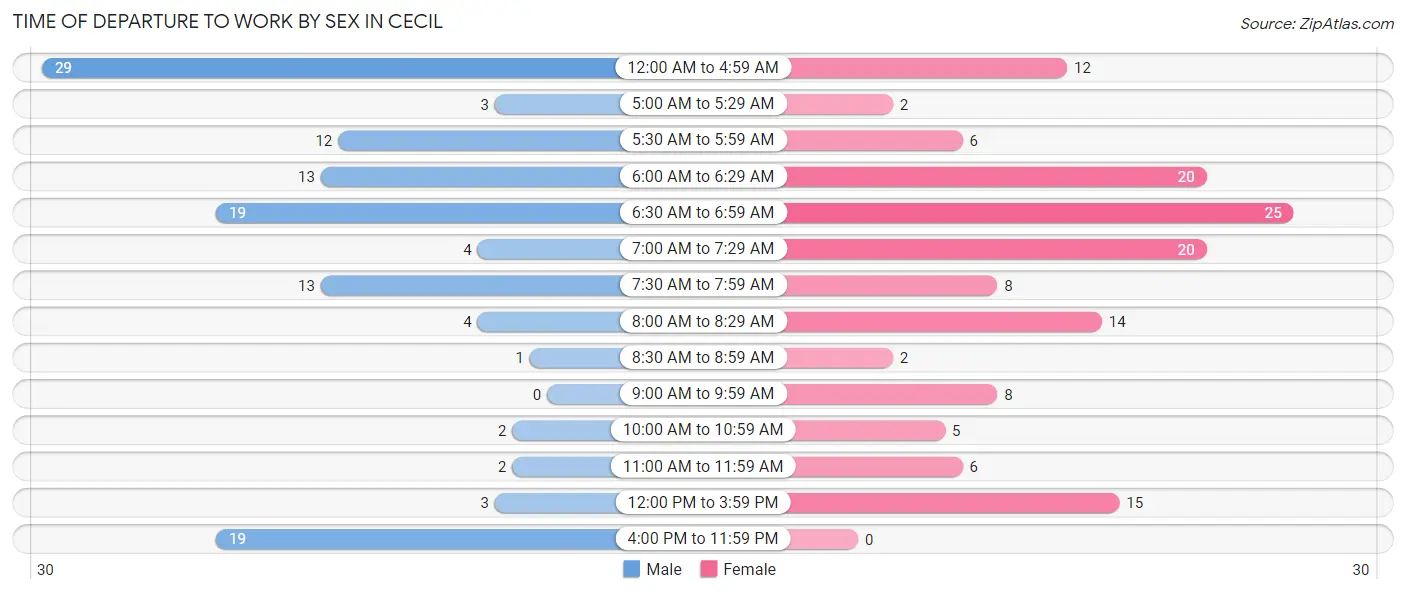
| Time of Departure | Male | Female |
| 12:00 AM to 4:59 AM | 29 (23.4%) | 12 (8.4%) |
| 5:00 AM to 5:29 AM | 3 (2.4%) | 2 (1.4%) |
| 5:30 AM to 5:59 AM | 12 (9.7%) | 6 (4.2%) |
| 6:00 AM to 6:29 AM | 13 (10.5%) | 20 (14.0%) |
| 6:30 AM to 6:59 AM | 19 (15.3%) | 25 (17.5%) |
| 7:00 AM to 7:29 AM | 4 (3.2%) | 20 (14.0%) |
| 7:30 AM to 7:59 AM | 13 (10.5%) | 8 (5.6%) |
| 8:00 AM to 8:29 AM | 4 (3.2%) | 14 (9.8%) |
| 8:30 AM to 8:59 AM | 1 (0.8%) | 2 (1.4%) |
| 9:00 AM to 9:59 AM | 0 (0.0%) | 8 (5.6%) |
| 10:00 AM to 10:59 AM | 2 (1.6%) | 5 (3.5%) |
| 11:00 AM to 11:59 AM | 2 (1.6%) | 6 (4.2%) |
| 12:00 PM to 3:59 PM | 3 (2.4%) | 15 (10.5%) |
| 4:00 PM to 11:59 PM | 19 (15.3%) | 0 (0.0%) |
| Total | 124 (100.0%) | 143 (100.0%) |
Housing Occupancy in Cecil
Occupancy by Ownership in Cecil
Of the total 248 dwellings in Cecil, owner-occupied units account for 181 (73.0%), while renter-occupied units make up 67 (27.0%).
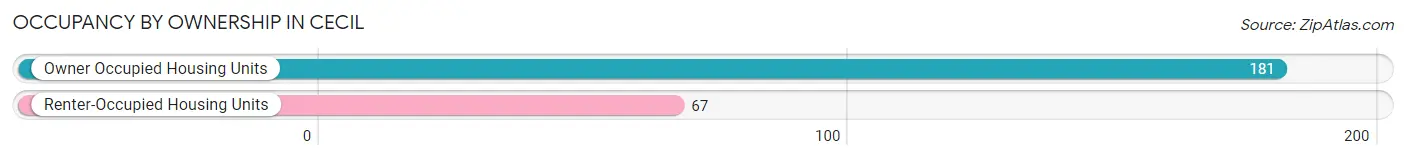
| Occupancy | # Housing Units | % Housing Units |
| Owner Occupied Housing Units | 181 | 73.0% |
| Renter-Occupied Housing Units | 67 | 27.0% |
| Total Occupied Housing Units | 248 | 100.0% |
Occupancy by Household Size in Cecil
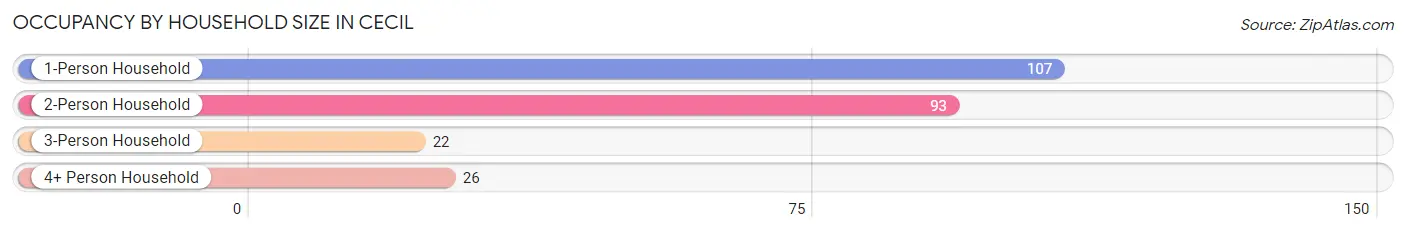
| Household Size | # Housing Units | % Housing Units |
| 1-Person Household | 107 | 43.1% |
| 2-Person Household | 93 | 37.5% |
| 3-Person Household | 22 | 8.9% |
| 4+ Person Household | 26 | 10.5% |
| Total Housing Units | 248 | 100.0% |
Occupancy by Ownership by Household Size in Cecil
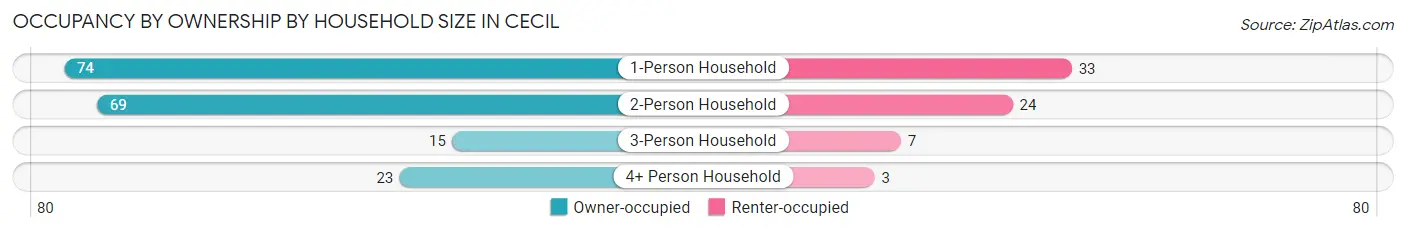
| Household Size | Owner-occupied | Renter-occupied |
| 1-Person Household | 74 (69.2%) | 33 (30.8%) |
| 2-Person Household | 69 (74.2%) | 24 (25.8%) |
| 3-Person Household | 15 (68.2%) | 7 (31.8%) |
| 4+ Person Household | 23 (88.5%) | 3 (11.5%) |
| Total Housing Units | 181 (73.0%) | 67 (27.0%) |
Occupancy by Educational Attainment in Cecil
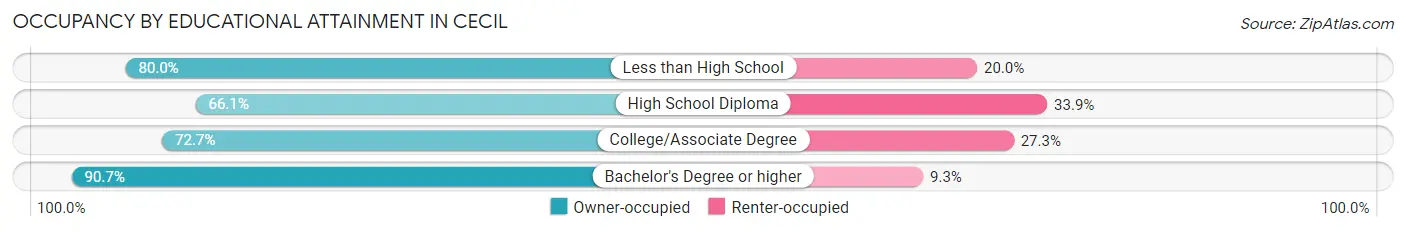
| Household Size | Owner-occupied | Renter-occupied |
| Less than High School | 8 (80.0%) | 2 (20.0%) |
| High School Diploma | 78 (66.1%) | 40 (33.9%) |
| College/Associate Degree | 56 (72.7%) | 21 (27.3%) |
| Bachelor's Degree or higher | 39 (90.7%) | 4 (9.3%) |
Occupancy by Age of Householder in Cecil
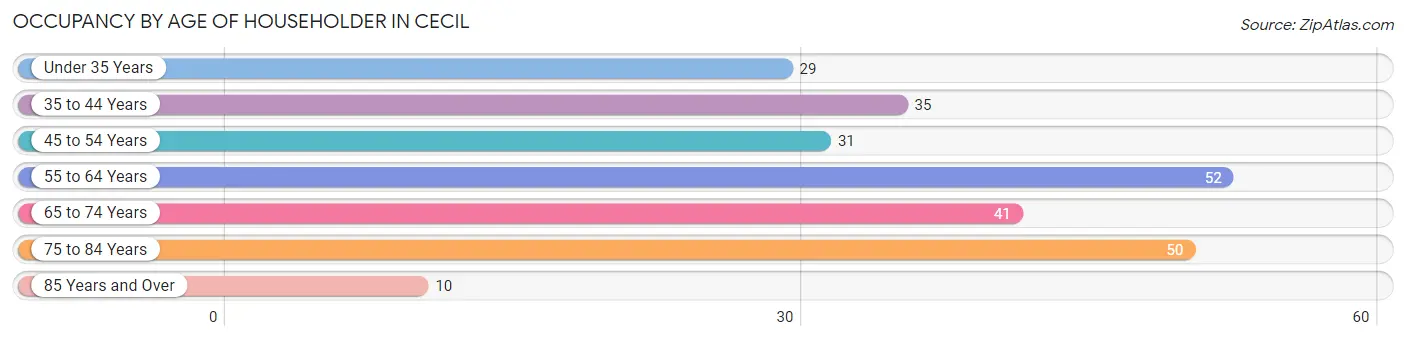
| Age Bracket | # Households | % Households |
| Under 35 Years | 29 | 11.7% |
| 35 to 44 Years | 35 | 14.1% |
| 45 to 54 Years | 31 | 12.5% |
| 55 to 64 Years | 52 | 21.0% |
| 65 to 74 Years | 41 | 16.5% |
| 75 to 84 Years | 50 | 20.2% |
| 85 Years and Over | 10 | 4.0% |
| Total | 248 | 100.0% |
Housing Finances in Cecil
Median Income by Occupancy in Cecil
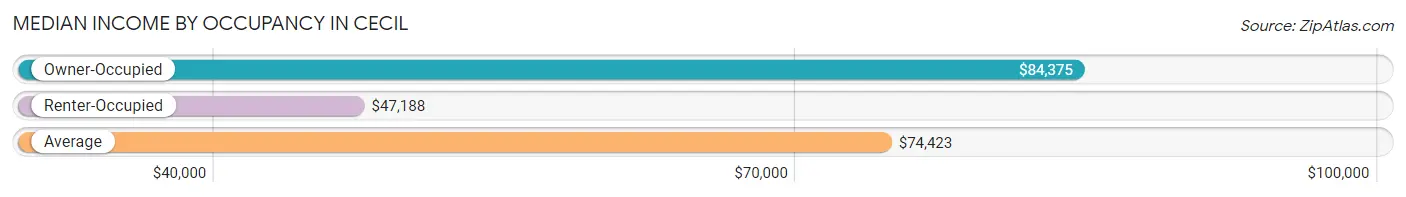
| Occupancy Type | # Households | Median Income |
| Owner-Occupied | 181 (73.0%) | $84,375 |
| Renter-Occupied | 67 (27.0%) | $47,188 |
| Average | 248 (100.0%) | $74,423 |
Occupancy by Householder Income Bracket in Cecil
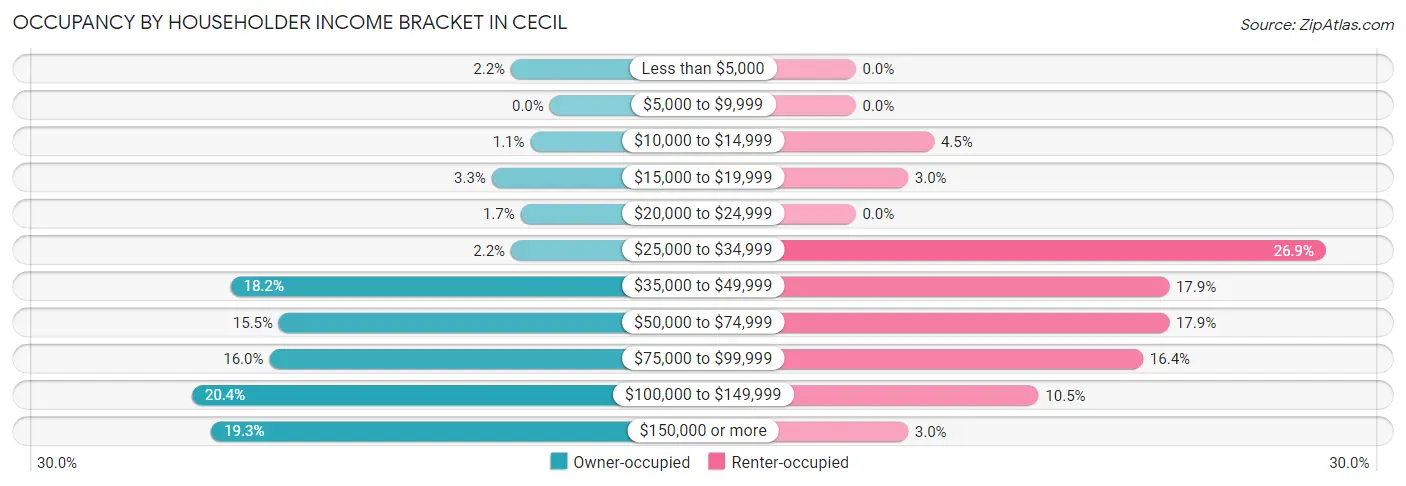
| Income Bracket | Owner-occupied | Renter-occupied |
| Less than $5,000 | 4 (2.2%) | 0 (0.0%) |
| $5,000 to $9,999 | 0 (0.0%) | 0 (0.0%) |
| $10,000 to $14,999 | 2 (1.1%) | 3 (4.5%) |
| $15,000 to $19,999 | 6 (3.3%) | 2 (3.0%) |
| $20,000 to $24,999 | 3 (1.7%) | 0 (0.0%) |
| $25,000 to $34,999 | 4 (2.2%) | 18 (26.9%) |
| $35,000 to $49,999 | 33 (18.2%) | 12 (17.9%) |
| $50,000 to $74,999 | 28 (15.5%) | 12 (17.9%) |
| $75,000 to $99,999 | 29 (16.0%) | 11 (16.4%) |
| $100,000 to $149,999 | 37 (20.4%) | 7 (10.4%) |
| $150,000 or more | 35 (19.3%) | 2 (3.0%) |
| Total | 181 (100.0%) | 67 (100.0%) |
Monthly Housing Cost Tiers in Cecil
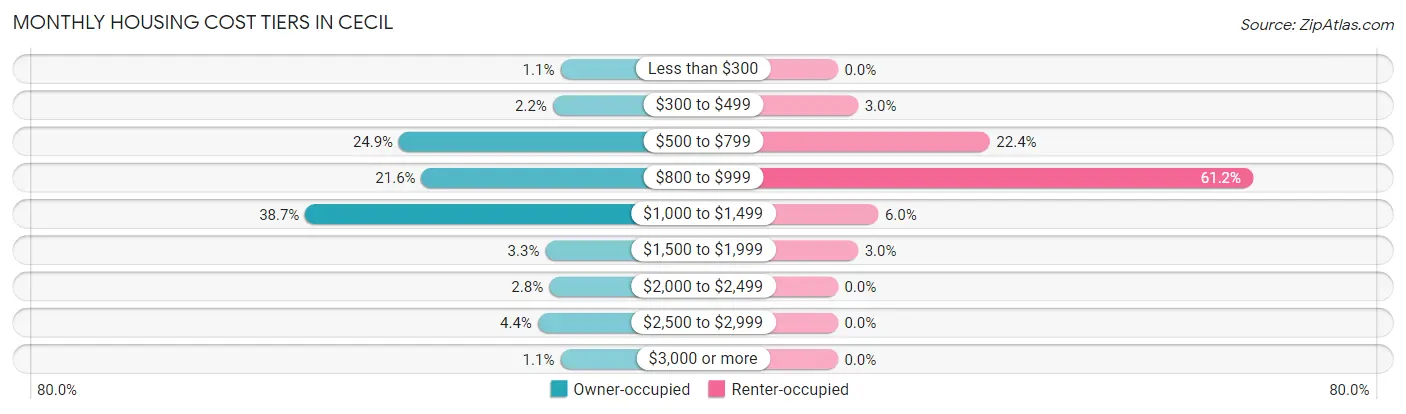
| Monthly Cost | Owner-occupied | Renter-occupied |
| Less than $300 | 2 (1.1%) | 0 (0.0%) |
| $300 to $499 | 4 (2.2%) | 2 (3.0%) |
| $500 to $799 | 45 (24.9%) | 15 (22.4%) |
| $800 to $999 | 39 (21.5%) | 41 (61.2%) |
| $1,000 to $1,499 | 70 (38.7%) | 4 (6.0%) |
| $1,500 to $1,999 | 6 (3.3%) | 2 (3.0%) |
| $2,000 to $2,499 | 5 (2.8%) | 0 (0.0%) |
| $2,500 to $2,999 | 8 (4.4%) | 0 (0.0%) |
| $3,000 or more | 2 (1.1%) | 0 (0.0%) |
| Total | 181 (100.0%) | 67 (100.0%) |
Physical Housing Characteristics in Cecil
Housing Structures in Cecil
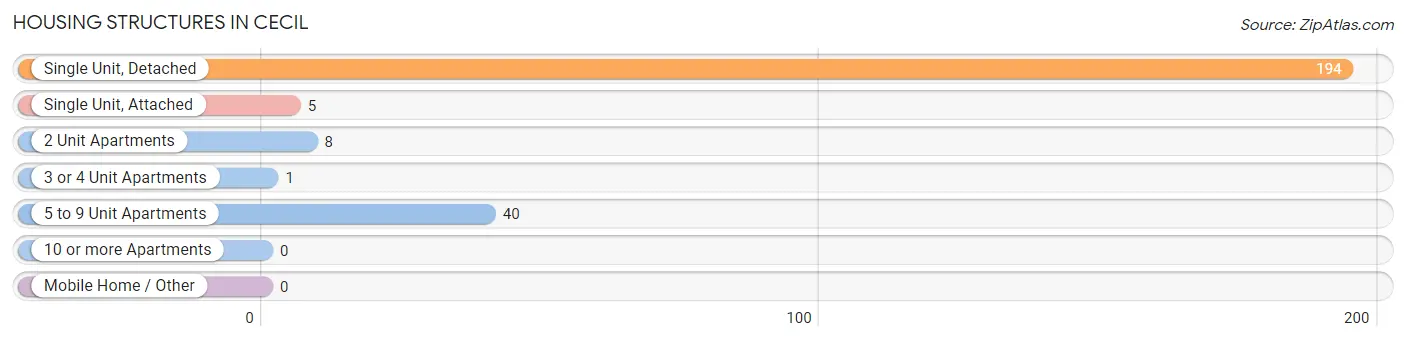
| Structure Type | # Housing Units | % Housing Units |
| Single Unit, Detached | 194 | 78.2% |
| Single Unit, Attached | 5 | 2.0% |
| 2 Unit Apartments | 8 | 3.2% |
| 3 or 4 Unit Apartments | 1 | 0.4% |
| 5 to 9 Unit Apartments | 40 | 16.1% |
| 10 or more Apartments | 0 | 0.0% |
| Mobile Home / Other | 0 | 0.0% |
| Total | 248 | 100.0% |
Housing Structures by Occupancy in Cecil
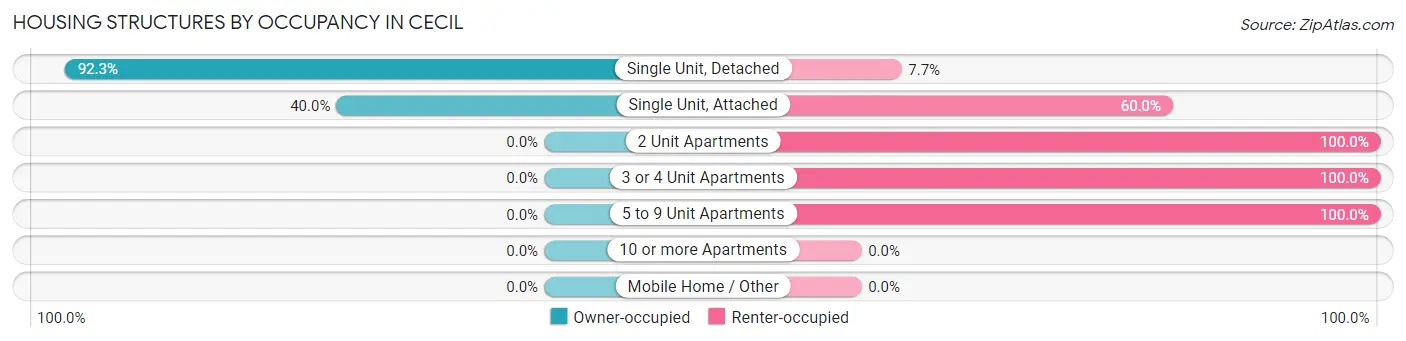
| Structure Type | Owner-occupied | Renter-occupied |
| Single Unit, Detached | 179 (92.3%) | 15 (7.7%) |
| Single Unit, Attached | 2 (40.0%) | 3 (60.0%) |
| 2 Unit Apartments | 0 (0.0%) | 8 (100.0%) |
| 3 or 4 Unit Apartments | 0 (0.0%) | 1 (100.0%) |
| 5 to 9 Unit Apartments | 0 (0.0%) | 40 (100.0%) |
| 10 or more Apartments | 0 (0.0%) | 0 (0.0%) |
| Mobile Home / Other | 0 (0.0%) | 0 (0.0%) |
| Total | 181 (73.0%) | 67 (27.0%) |
Housing Structures by Number of Rooms in Cecil
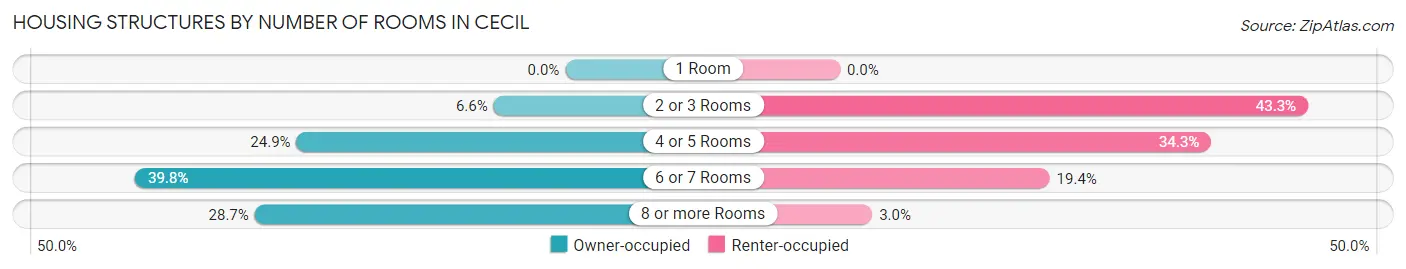
| Number of Rooms | Owner-occupied | Renter-occupied |
| 1 Room | 0 (0.0%) | 0 (0.0%) |
| 2 or 3 Rooms | 12 (6.6%) | 29 (43.3%) |
| 4 or 5 Rooms | 45 (24.9%) | 23 (34.3%) |
| 6 or 7 Rooms | 72 (39.8%) | 13 (19.4%) |
| 8 or more Rooms | 52 (28.7%) | 2 (3.0%) |
| Total | 181 (100.0%) | 67 (100.0%) |
Housing Structure by Heating Type in Cecil
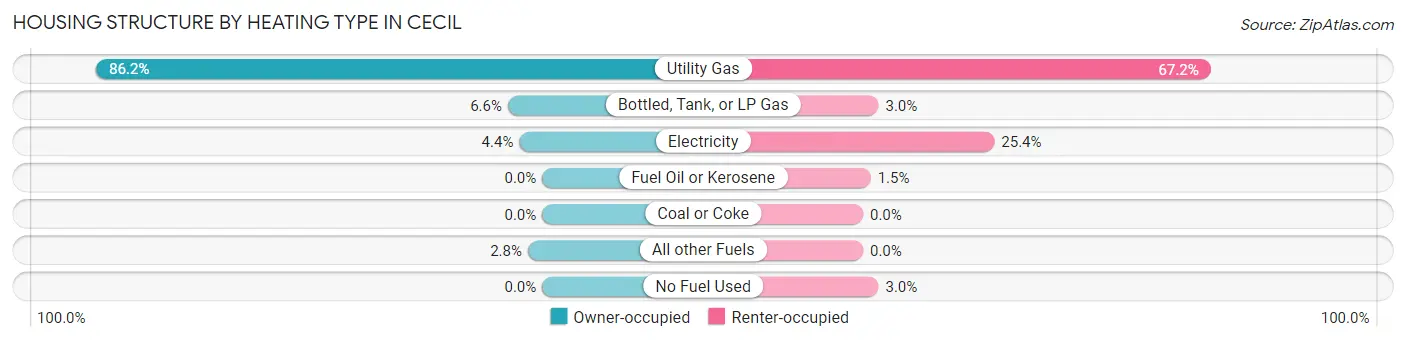
| Heating Type | Owner-occupied | Renter-occupied |
| Utility Gas | 156 (86.2%) | 45 (67.2%) |
| Bottled, Tank, or LP Gas | 12 (6.6%) | 2 (3.0%) |
| Electricity | 8 (4.4%) | 17 (25.4%) |
| Fuel Oil or Kerosene | 0 (0.0%) | 1 (1.5%) |
| Coal or Coke | 0 (0.0%) | 0 (0.0%) |
| All other Fuels | 5 (2.8%) | 0 (0.0%) |
| No Fuel Used | 0 (0.0%) | 2 (3.0%) |
| Total | 181 (100.0%) | 67 (100.0%) |
Household Vehicle Usage in Cecil
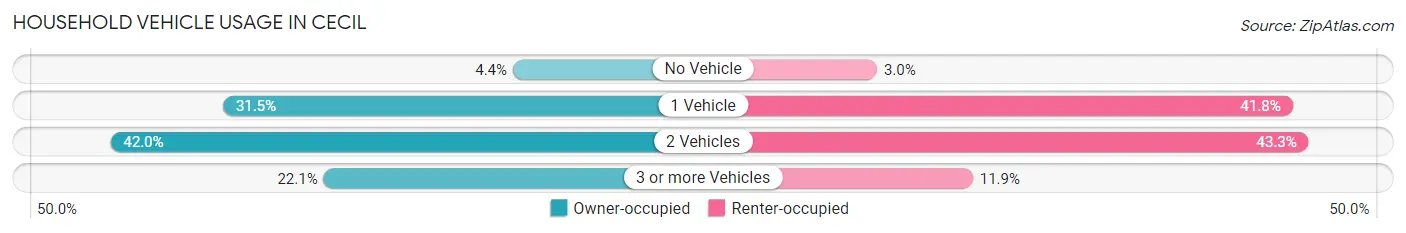
| Vehicles per Household | Owner-occupied | Renter-occupied |
| No Vehicle | 8 (4.4%) | 2 (3.0%) |
| 1 Vehicle | 57 (31.5%) | 28 (41.8%) |
| 2 Vehicles | 76 (42.0%) | 29 (43.3%) |
| 3 or more Vehicles | 40 (22.1%) | 8 (11.9%) |
| Total | 181 (100.0%) | 67 (100.0%) |
Real Estate & Mortgages in Cecil
Real Estate and Mortgage Overview in Cecil
| Characteristic | Without Mortgage | With Mortgage |
| Housing Units | 64 | 117 |
| Median Property Value | $305,600 | $158,100 |
| Median Household Income | $46,786 | $28 |
| Monthly Housing Costs | $707 | $2 |
| Real Estate Taxes | $3,636 | $2 |
Property Value by Mortgage Status in Cecil
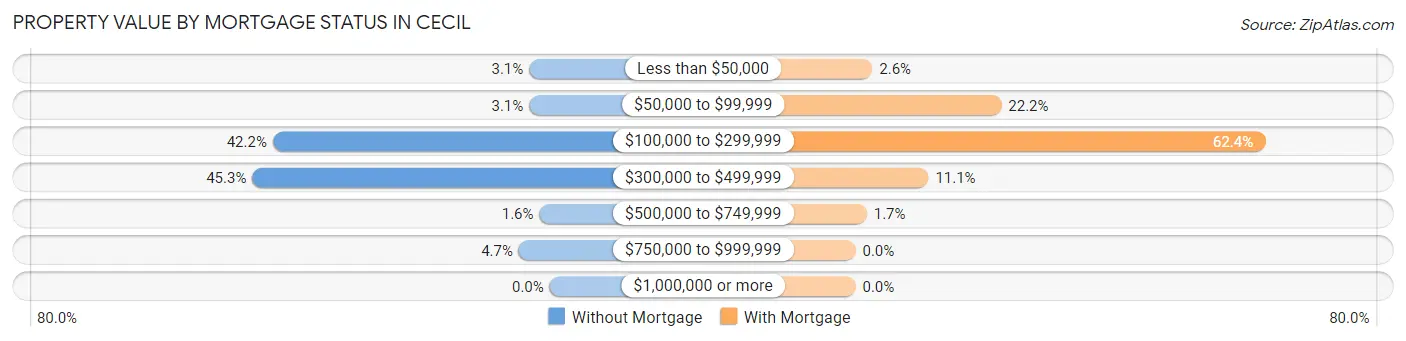
| Property Value | Without Mortgage | With Mortgage |
| Less than $50,000 | 2 (3.1%) | 3 (2.6%) |
| $50,000 to $99,999 | 2 (3.1%) | 26 (22.2%) |
| $100,000 to $299,999 | 27 (42.2%) | 73 (62.4%) |
| $300,000 to $499,999 | 29 (45.3%) | 13 (11.1%) |
| $500,000 to $749,999 | 1 (1.6%) | 2 (1.7%) |
| $750,000 to $999,999 | 3 (4.7%) | 0 (0.0%) |
| $1,000,000 or more | 0 (0.0%) | 0 (0.0%) |
| Total | 64 (100.0%) | 117 (100.0%) |
Household Income by Mortgage Status in Cecil
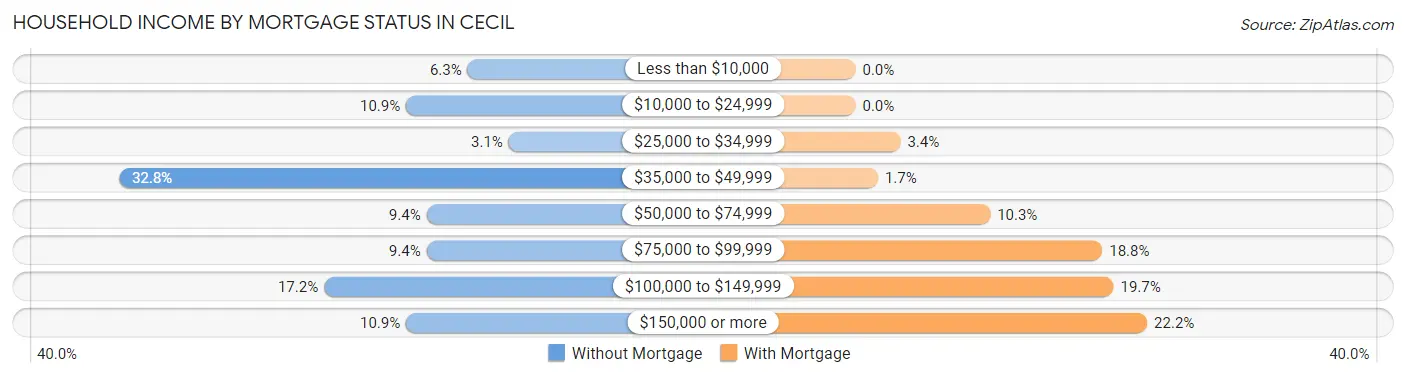
| Household Income | Without Mortgage | With Mortgage |
| Less than $10,000 | 4 (6.2%) | 0 (0.0%) |
| $10,000 to $24,999 | 7 (10.9%) | 0 (0.0%) |
| $25,000 to $34,999 | 2 (3.1%) | 4 (3.4%) |
| $35,000 to $49,999 | 21 (32.8%) | 2 (1.7%) |
| $50,000 to $74,999 | 6 (9.4%) | 12 (10.3%) |
| $75,000 to $99,999 | 6 (9.4%) | 22 (18.8%) |
| $100,000 to $149,999 | 11 (17.2%) | 23 (19.7%) |
| $150,000 or more | 7 (10.9%) | 26 (22.2%) |
| Total | 64 (100.0%) | 117 (100.0%) |
Property Value to Household Income Ratio in Cecil
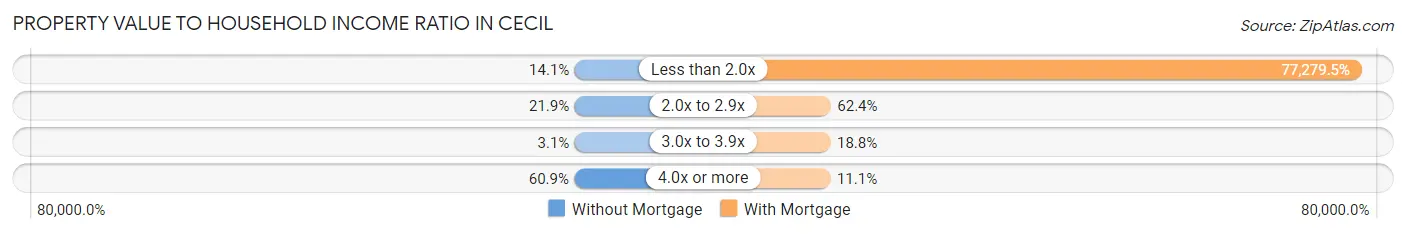
| Value-to-Income Ratio | Without Mortgage | With Mortgage |
| Less than 2.0x | 9 (14.1%) | 90,417 (77,279.5%) |
| 2.0x to 2.9x | 14 (21.9%) | 73 (62.4%) |
| 3.0x to 3.9x | 2 (3.1%) | 22 (18.8%) |
| 4.0x or more | 39 (60.9%) | 13 (11.1%) |
| Total | 64 (100.0%) | 117 (100.0%) |
Real Estate Taxes by Mortgage Status in Cecil
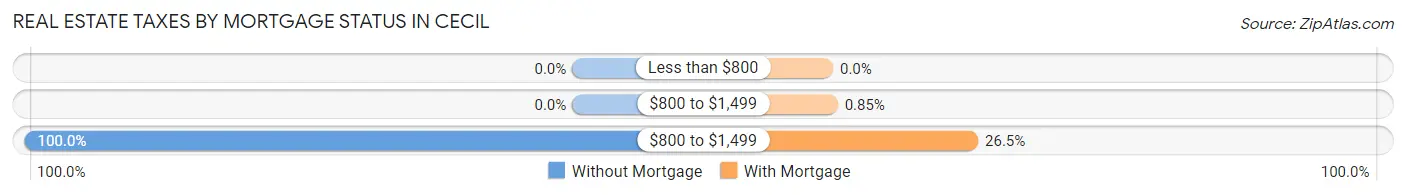
| Property Taxes | Without Mortgage | With Mortgage |
| Less than $800 | 0 (0.0%) | 0 (0.0%) |
| $800 to $1,499 | 0 (0.0%) | 1 (0.9%) |
| $800 to $1,499 | 64 (100.0%) | 31 (26.5%) |
| Total | 64 (100.0%) | 117 (100.0%) |
Health & Disability in Cecil
Health Insurance Coverage by Age in Cecil
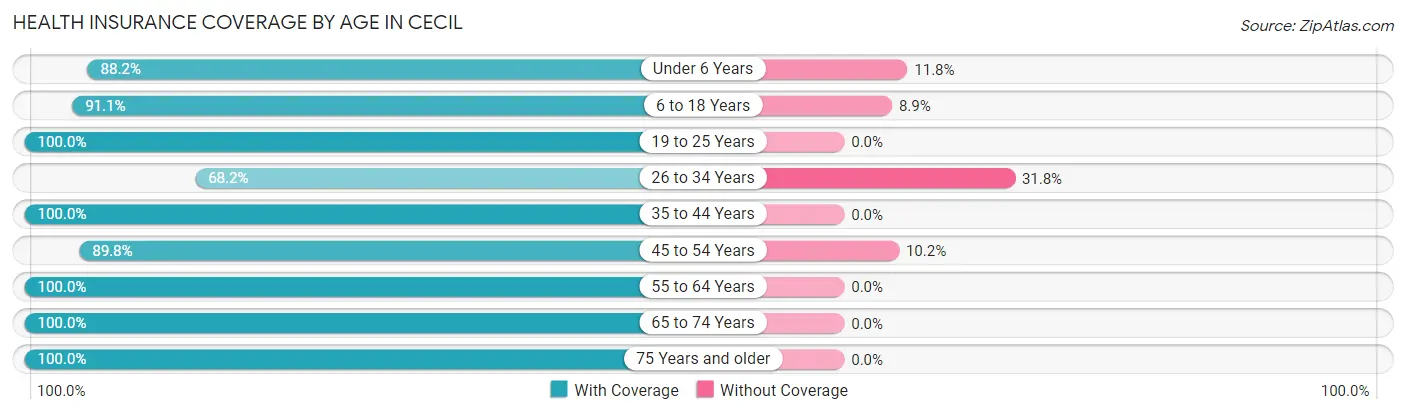
| Age Bracket | With Coverage | Without Coverage |
| Under 6 Years | 15 (88.2%) | 2 (11.8%) |
| 6 to 18 Years | 41 (91.1%) | 4 (8.9%) |
| 19 to 25 Years | 48 (100.0%) | 0 (0.0%) |
| 26 to 34 Years | 30 (68.2%) | 14 (31.8%) |
| 35 to 44 Years | 60 (100.0%) | 0 (0.0%) |
| 45 to 54 Years | 44 (89.8%) | 5 (10.2%) |
| 55 to 64 Years | 70 (100.0%) | 0 (0.0%) |
| 65 to 74 Years | 67 (100.0%) | 0 (0.0%) |
| 75 Years and older | 75 (100.0%) | 0 (0.0%) |
| Total | 450 (94.7%) | 25 (5.3%) |
Health Insurance Coverage by Citizenship Status in Cecil
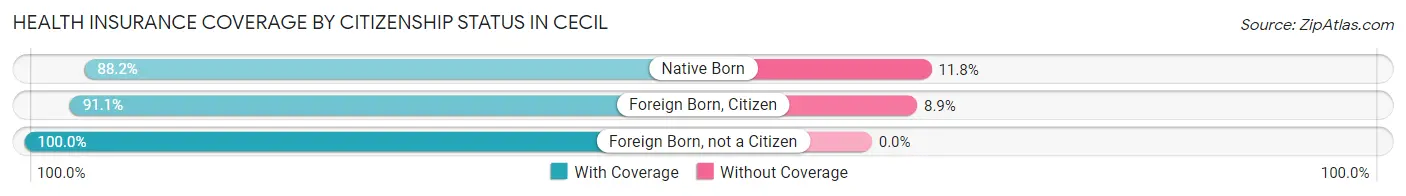
| Citizenship Status | With Coverage | Without Coverage |
| Native Born | 15 (88.2%) | 2 (11.8%) |
| Foreign Born, Citizen | 41 (91.1%) | 4 (8.9%) |
| Foreign Born, not a Citizen | 48 (100.0%) | 0 (0.0%) |
Health Insurance Coverage by Household Income in Cecil
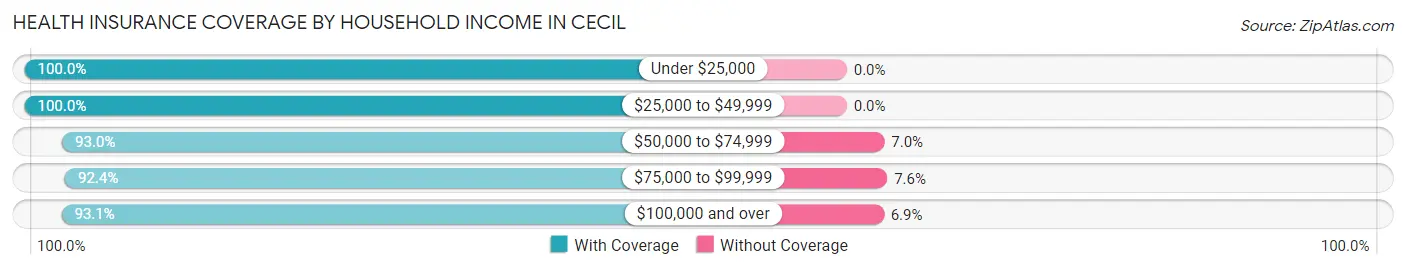
| Household Income | With Coverage | Without Coverage |
| Under $25,000 | 22 (100.0%) | 0 (0.0%) |
| $25,000 to $49,999 | 99 (100.0%) | 0 (0.0%) |
| $50,000 to $74,999 | 66 (93.0%) | 5 (7.0%) |
| $75,000 to $99,999 | 61 (92.4%) | 5 (7.6%) |
| $100,000 and over | 202 (93.1%) | 15 (6.9%) |
Public vs Private Health Insurance Coverage by Age in Cecil
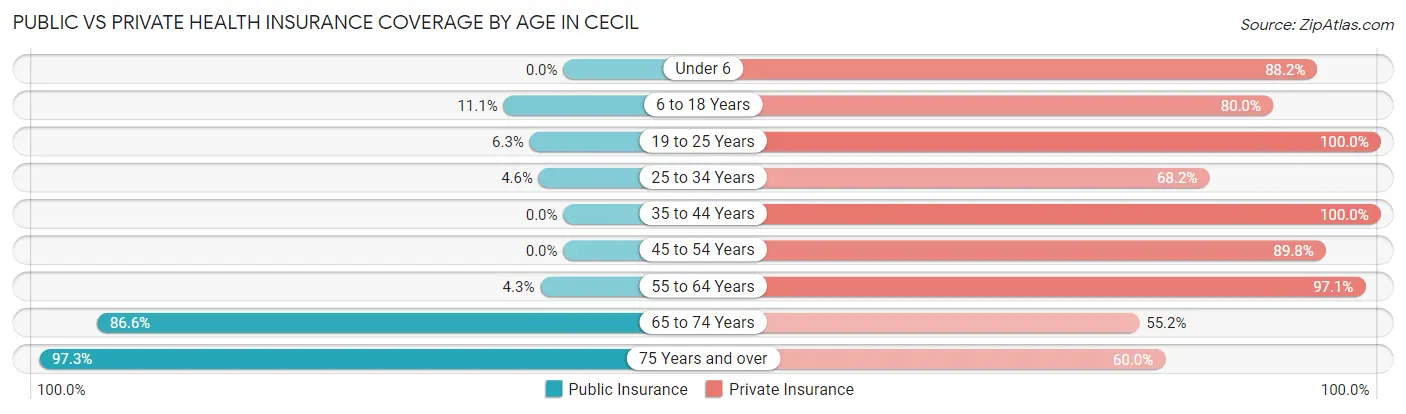
| Age Bracket | Public Insurance | Private Insurance |
| Under 6 | 0 (0.0%) | 15 (88.2%) |
| 6 to 18 Years | 5 (11.1%) | 36 (80.0%) |
| 19 to 25 Years | 3 (6.2%) | 48 (100.0%) |
| 25 to 34 Years | 2 (4.5%) | 30 (68.2%) |
| 35 to 44 Years | 0 (0.0%) | 60 (100.0%) |
| 45 to 54 Years | 0 (0.0%) | 44 (89.8%) |
| 55 to 64 Years | 3 (4.3%) | 68 (97.1%) |
| 65 to 74 Years | 58 (86.6%) | 37 (55.2%) |
| 75 Years and over | 73 (97.3%) | 45 (60.0%) |
| Total | 144 (30.3%) | 383 (80.6%) |
Disability Status by Sex by Age in Cecil
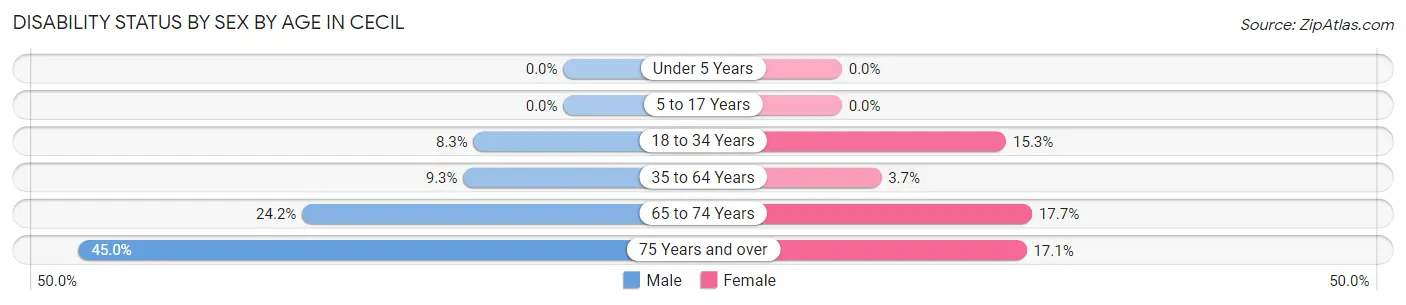
| Age Bracket | Male | Female |
| Under 5 Years | 0 (0.0%) | 0 (0.0%) |
| 5 to 17 Years | 0 (0.0%) | 0 (0.0%) |
| 18 to 34 Years | 3 (8.3%) | 9 (15.2%) |
| 35 to 64 Years | 9 (9.3%) | 3 (3.7%) |
| 65 to 74 Years | 8 (24.2%) | 6 (17.6%) |
| 75 Years and over | 18 (45.0%) | 6 (17.1%) |
Disability Class by Sex by Age in Cecil
Disability Class: Hearing Difficulty
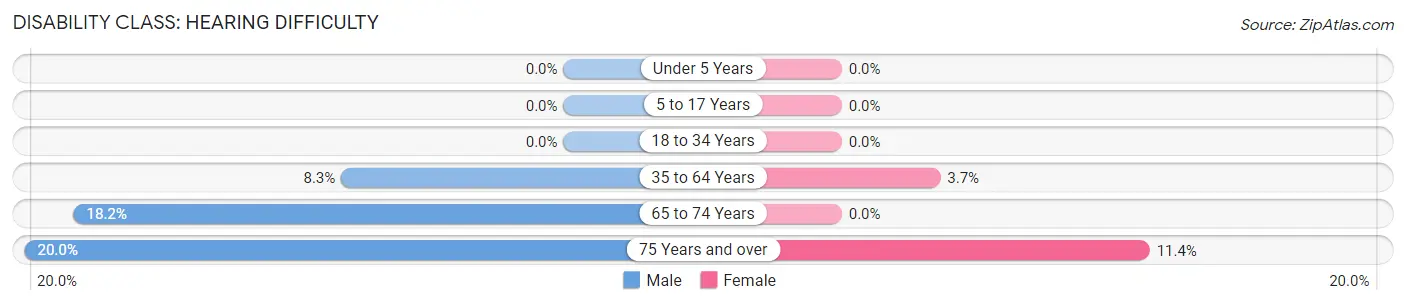
| Age Bracket | Male | Female |
| Under 5 Years | 0 (0.0%) | 0 (0.0%) |
| 5 to 17 Years | 0 (0.0%) | 0 (0.0%) |
| 18 to 34 Years | 0 (0.0%) | 0 (0.0%) |
| 35 to 64 Years | 8 (8.3%) | 3 (3.7%) |
| 65 to 74 Years | 6 (18.2%) | 0 (0.0%) |
| 75 Years and over | 8 (20.0%) | 4 (11.4%) |
Disability Class: Vision Difficulty
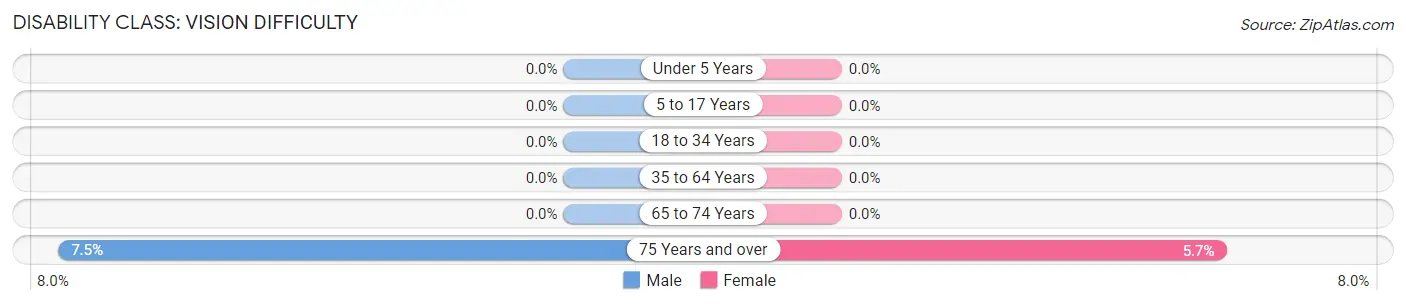
| Age Bracket | Male | Female |
| Under 5 Years | 0 (0.0%) | 0 (0.0%) |
| 5 to 17 Years | 0 (0.0%) | 0 (0.0%) |
| 18 to 34 Years | 0 (0.0%) | 0 (0.0%) |
| 35 to 64 Years | 0 (0.0%) | 0 (0.0%) |
| 65 to 74 Years | 0 (0.0%) | 0 (0.0%) |
| 75 Years and over | 3 (7.5%) | 2 (5.7%) |
Disability Class: Cognitive Difficulty
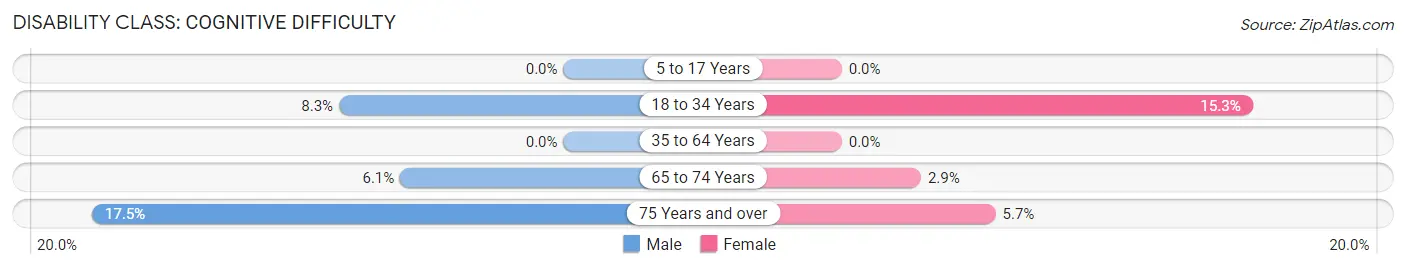
| Age Bracket | Male | Female |
| 5 to 17 Years | 0 (0.0%) | 0 (0.0%) |
| 18 to 34 Years | 3 (8.3%) | 9 (15.2%) |
| 35 to 64 Years | 0 (0.0%) | 0 (0.0%) |
| 65 to 74 Years | 2 (6.1%) | 1 (2.9%) |
| 75 Years and over | 7 (17.5%) | 2 (5.7%) |
Disability Class: Ambulatory Difficulty
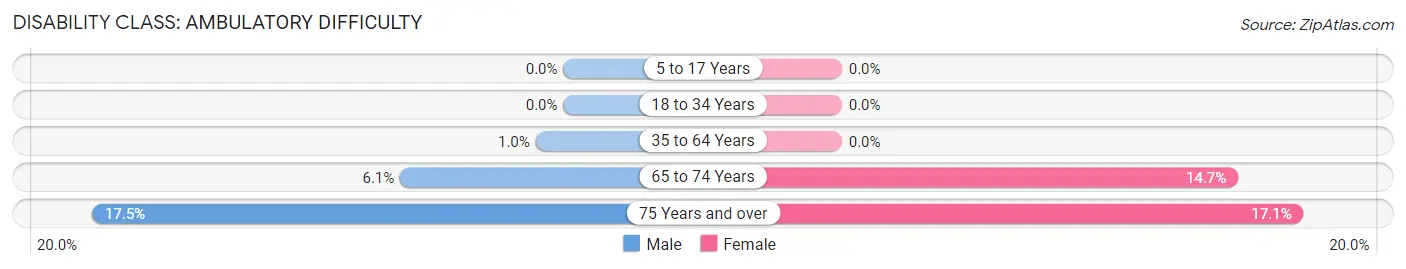
| Age Bracket | Male | Female |
| 5 to 17 Years | 0 (0.0%) | 0 (0.0%) |
| 18 to 34 Years | 0 (0.0%) | 0 (0.0%) |
| 35 to 64 Years | 1 (1.0%) | 0 (0.0%) |
| 65 to 74 Years | 2 (6.1%) | 5 (14.7%) |
| 75 Years and over | 7 (17.5%) | 6 (17.1%) |
Disability Class: Self-Care Difficulty
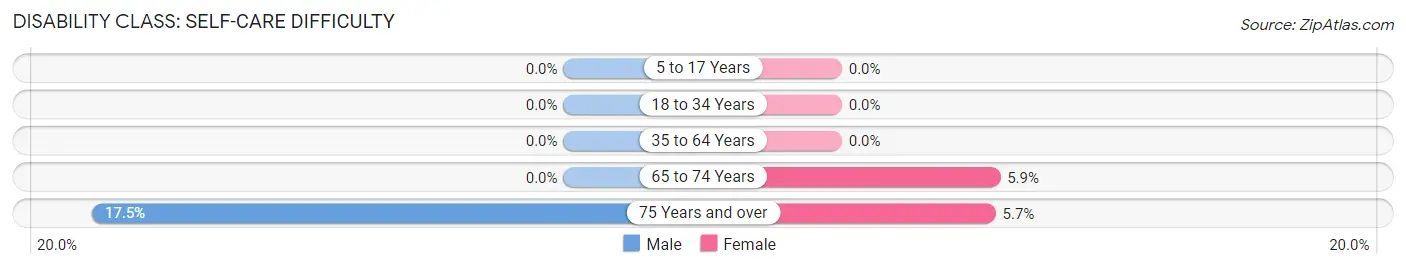
| Age Bracket | Male | Female |
| 5 to 17 Years | 0 (0.0%) | 0 (0.0%) |
| 18 to 34 Years | 0 (0.0%) | 0 (0.0%) |
| 35 to 64 Years | 0 (0.0%) | 0 (0.0%) |
| 65 to 74 Years | 0 (0.0%) | 2 (5.9%) |
| 75 Years and over | 7 (17.5%) | 2 (5.7%) |
Technology Access in Cecil
Computing Device Access in Cecil
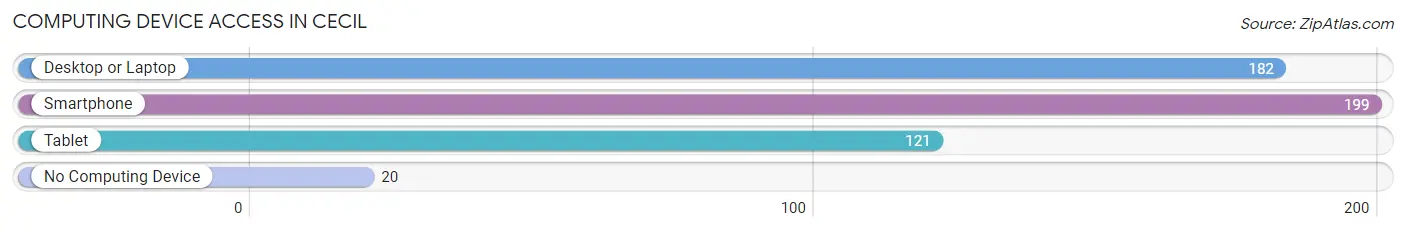
| Device Type | # Households | % Households |
| Desktop or Laptop | 182 | 73.4% |
| Smartphone | 199 | 80.2% |
| Tablet | 121 | 48.8% |
| No Computing Device | 20 | 8.1% |
| Total | 248 | 100.0% |
Internet Access in Cecil
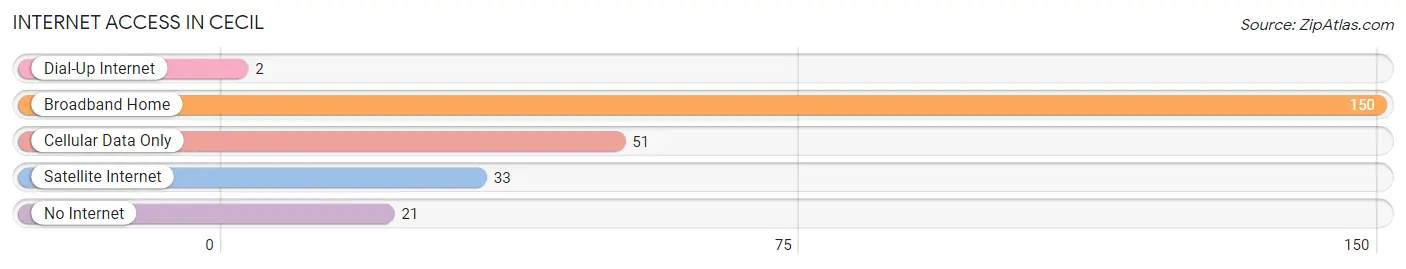
| Internet Type | # Households | % Households |
| Dial-Up Internet | 2 | 0.8% |
| Broadband Home | 150 | 60.5% |
| Cellular Data Only | 51 | 20.6% |
| Satellite Internet | 33 | 13.3% |
| No Internet | 21 | 8.5% |
| Total | 248 | 100.0% |
Cecil Summary
Cecil, Wisconsin is a small village located in Shawano County, Wisconsin. It is situated on the Wolf River, approximately 25 miles northwest of Green Bay. The village has a population of 1,093 as of the 2010 census.
History
The area that is now Cecil was first settled in the late 1840s by a group of German immigrants. The village was originally known as “Kleinschmidt”, after the family that owned the land. In 1854, the name was changed to “Cecil”, after the first postmaster, William Cecil.
The village was officially incorporated in 1876. At the time, the village was primarily an agricultural community, with a few small businesses. In the early 1900s, the village began to grow and develop. The first bank was established in 1906, and the first school was built in 1908.
In the 1920s, the village began to experience a period of growth and prosperity. The first telephone exchange was established in 1921, and the first electric power plant was built in 1923. The village also saw the construction of a new school, a new library, and a new fire station.
In the 1950s, the village experienced a period of decline. Many of the businesses closed, and the population began to decline. In the 1970s, the village began to experience a period of revitalization. The village was able to attract new businesses, and the population began to increase.
Geography
Cecil is located in Shawano County, Wisconsin. It is situated on the Wolf River, approximately 25 miles northwest of Green Bay. The village has a total area of 1.2 square miles, all of which is land.
The village is located in a rural area, with rolling hills and forests. The terrain is mostly flat, with some areas of higher elevation. The climate is humid continental, with cold winters and warm summers.
Economy
The economy of Cecil is primarily based on agriculture and tourism. The village is home to several small businesses, including a grocery store, a hardware store, and a restaurant. The village also has a small industrial park, which is home to several small manufacturing companies.
The village is also home to several tourist attractions, including the Wolf River State Trail, the Wolf River State Wildlife Area, and the Wolf River State Park. The village also hosts several annual events, including the Cecil Days Festival and the Cecil County Fair.
Demographics
As of the 2010 census, the village had a population of 1,093. The racial makeup of the village was 97.3% White, 0.7% African American, 0.3% Native American, 0.2% Asian, 0.1% Pacific Islander, 0.2% from other races, and 1.2% from two or more races. Hispanic or Latino of any race were 1.2% of the population.
The median income for a household in the village was $41,250, and the median income for a family was $50,000. The per capita income for the village was $19,945. About 8.3% of families and 10.2% of the population were below the poverty line, including 14.3% of those under age 18 and 5.3% of those age 65 or over.
Common Questions
What is the Total Population of Cecil?
Total Population of Cecil is 475.
What is the Total Male Population of Cecil?
Total Male Population of Cecil is 228.
What is the Total Female Population of Cecil?
Total Female Population of Cecil is 247.
What is the Ratio of Males per 100 Females in Cecil?
There are 92.31 Males per 100 Females in Cecil.
What is the Ratio of Females per 100 Males in Cecil?
There are 108.33 Females per 100 Males in Cecil.
What is the Median Population Age in Cecil?
Median Population Age in Cecil is 48.7 Years.
What is the Average Family Size in Cecil
Average Family Size in Cecil is 2.6 People.
What is the Average Household Size in Cecil
Average Household Size in Cecil is 1.9 People.
What is Per Capita Income in Cecil?
Per Capita income in Cecil is $46,346.
What is the Median Family Income in Cecil?
Median Family Income in Cecil is $100,556.
What is the Median Household income in Cecil?
Median Household Income in Cecil is $74,423.
What is Income or Wage Gap in Cecil?
Income or Wage Gap in Cecil is 49.2%.
Women in Cecil earn 50.8 cents for every dollar earned by a man.
What is Inequality or Gini Index in Cecil?
Inequality or Gini Index in Cecil is 0.37.
How Large is the Labor Force in Cecil?
There are 284 People in the Labor Forcein in Cecil.
What is the Percentage of People in the Labor Force in Cecil?
67.5% of People are in the Labor Force in Cecil.
What is the Unemployment Rate in Cecil?
Unemployment Rate in Cecil is 1.1%.