Camp Douglas, WI
Camp Douglas Map
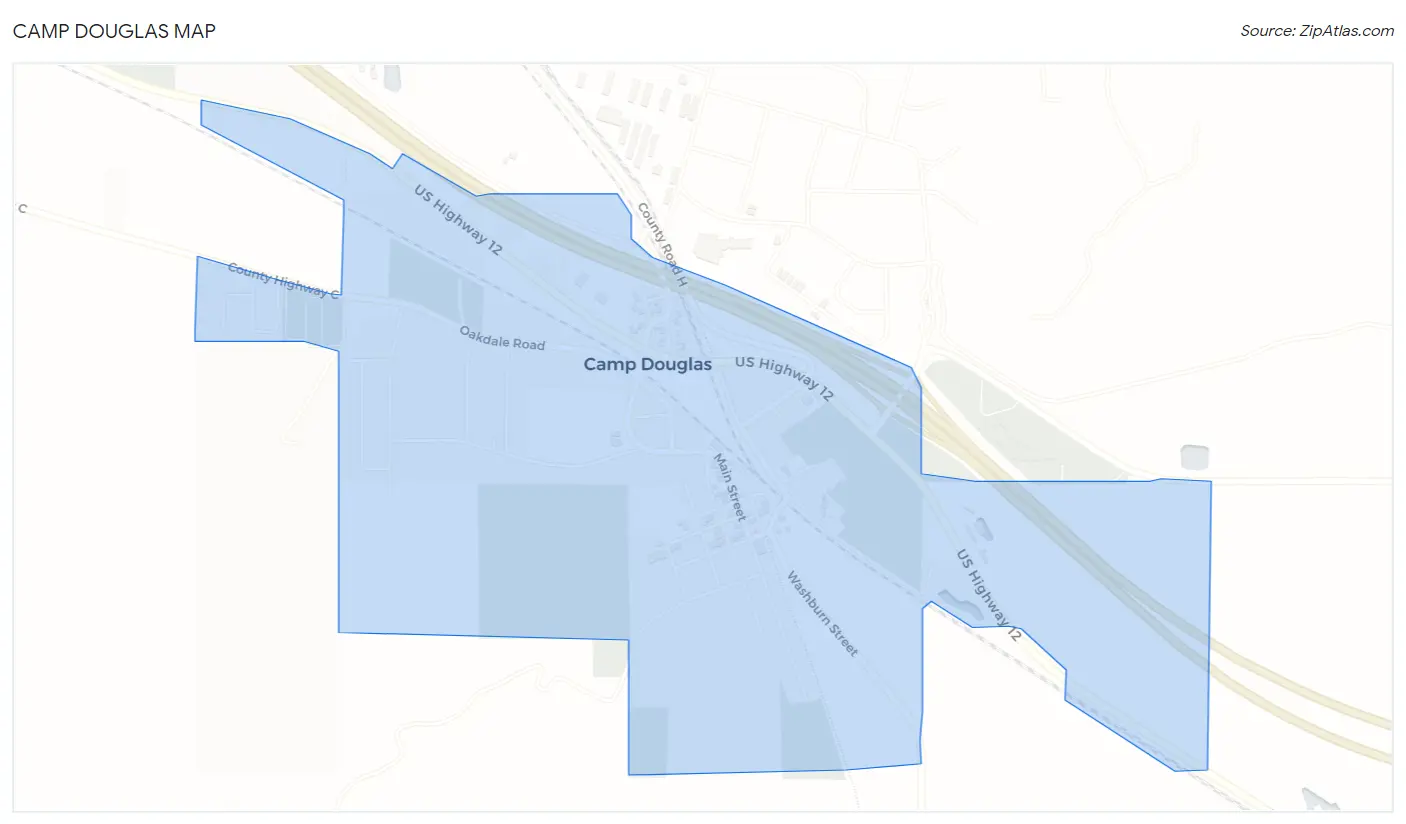
Camp Douglas Overview
739
TOTAL POPULATION
403
MALE POPULATION
336
FEMALE POPULATION
119.94
MALES / 100 FEMALES
83.37
FEMALES / 100 MALES
25.0
MEDIAN AGE
4.1
AVG FAMILY SIZE
3.0
AVG HOUSEHOLD SIZE
$22,994
PER CAPITA INCOME
$78,250
AVG FAMILY INCOME
$58,750
AVG HOUSEHOLD INCOME
42.1%
WAGE / INCOME GAP [ % ]
57.9¢/ $1
WAGE / INCOME GAP [ $ ]
$13,487
FAMILY INCOME DEFICIT
0.36
INEQUALITY / GINI INDEX
311
LABOR FORCE [ PEOPLE ]
69.9%
PERCENT IN LABOR FORCE
3.5%
UNEMPLOYMENT RATE
Camp Douglas Zip Codes
Camp Douglas Area Codes
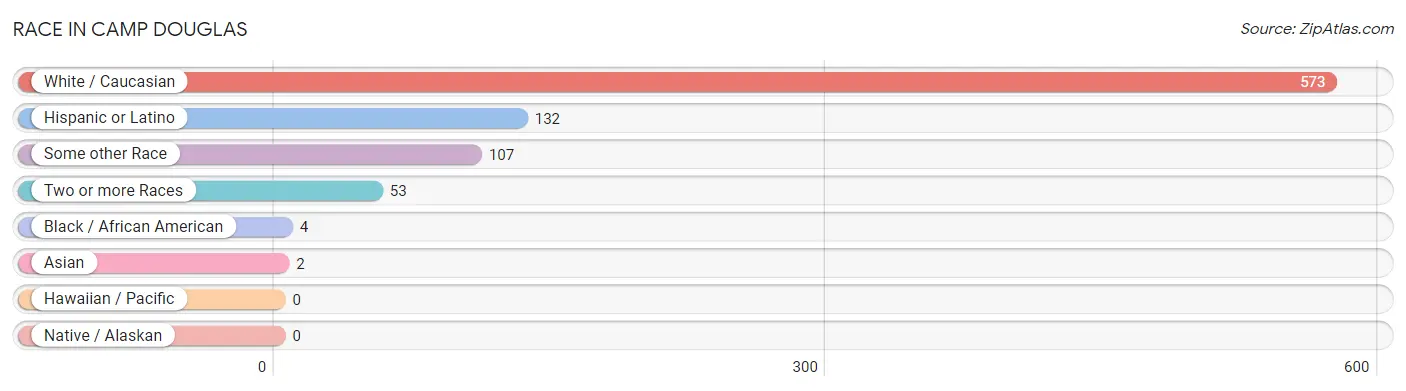
Race in Camp Douglas
The most populous races in Camp Douglas are White / Caucasian (573 | 77.5%), Hispanic or Latino (132 | 17.9%), and Some other Race (107 | 14.5%).
| Race | # Population | % Population |
| Asian | 2 | 0.3% |
| Black / African American | 4 | 0.5% |
| Hawaiian / Pacific | 0 | 0.0% |
| Hispanic or Latino | 132 | 17.9% |
| Native / Alaskan | 0 | 0.0% |
| White / Caucasian | 573 | 77.5% |
| Two or more Races | 53 | 7.2% |
| Some other Race | 107 | 14.5% |
| Total | 739 | 100.0% |
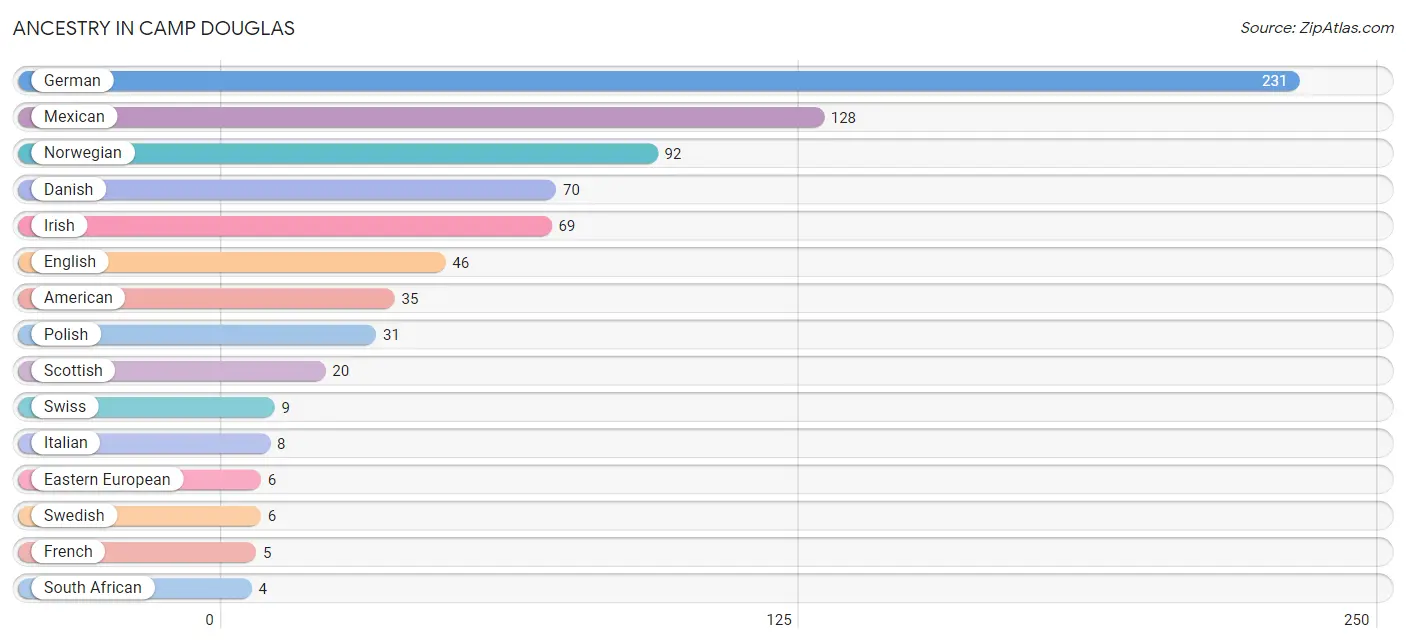
Ancestry in Camp Douglas
The most populous ancestries reported in Camp Douglas are German (231 | 31.3%), Mexican (128 | 17.3%), Norwegian (92 | 12.4%), Danish (70 | 9.5%), and Irish (69 | 9.3%), together accounting for 79.8% of all Camp Douglas residents.
| Ancestry | # Population | % Population |
| American | 35 | 4.7% |
| Bangladeshi | 1 | 0.1% |
| Colombian | 2 | 0.3% |
| Czech | 2 | 0.3% |
| Czechoslovakian | 2 | 0.3% |
| Danish | 70 | 9.5% |
| Eastern European | 6 | 0.8% |
| English | 46 | 6.2% |
| French | 5 | 0.7% |
| French Canadian | 3 | 0.4% |
| German | 231 | 31.3% |
| Irish | 69 | 9.3% |
| Italian | 8 | 1.1% |
| Mexican | 128 | 17.3% |
| Norwegian | 92 | 12.4% |
| Pakistani | 2 | 0.3% |
| Polish | 31 | 4.2% |
| Puerto Rican | 2 | 0.3% |
| Scandinavian | 1 | 0.1% |
| Scottish | 20 | 2.7% |
| South African | 4 | 0.5% |
| South American | 2 | 0.3% |
| Subsaharan African | 4 | 0.5% |
| Swedish | 6 | 0.8% |
| Swiss | 9 | 1.2% |
| Welsh | 1 | 0.1% | View All 26 Rows |
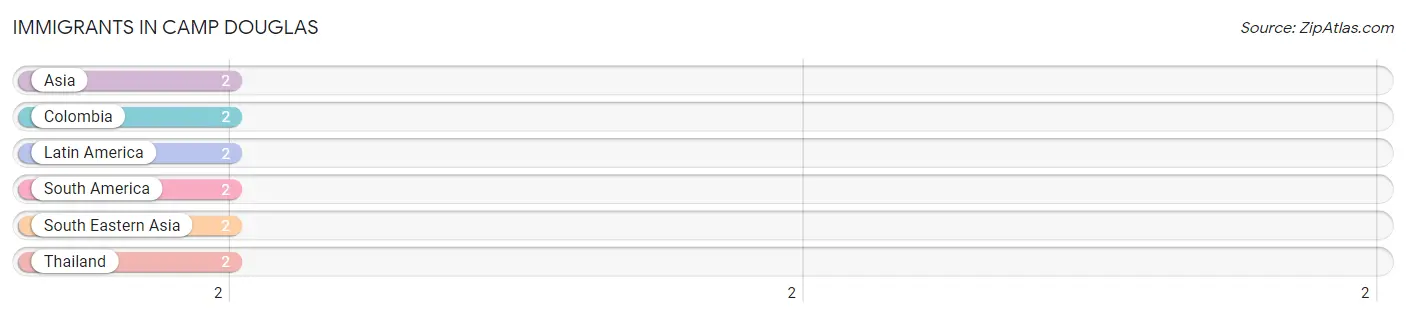
Immigrants in Camp Douglas
The most numerous immigrant groups reported in Camp Douglas came from Asia (2 | 0.3%), Colombia (2 | 0.3%), Latin America (2 | 0.3%), South America (2 | 0.3%), and South Eastern Asia (2 | 0.3%), together accounting for 1.4% of all Camp Douglas residents.
| Immigration Origin | # Population | % Population |
| Asia | 2 | 0.3% |
| Colombia | 2 | 0.3% |
| Latin America | 2 | 0.3% |
| South America | 2 | 0.3% |
| South Eastern Asia | 2 | 0.3% |
| Thailand | 2 | 0.3% | View All 6 Rows |
Sex and Age in Camp Douglas
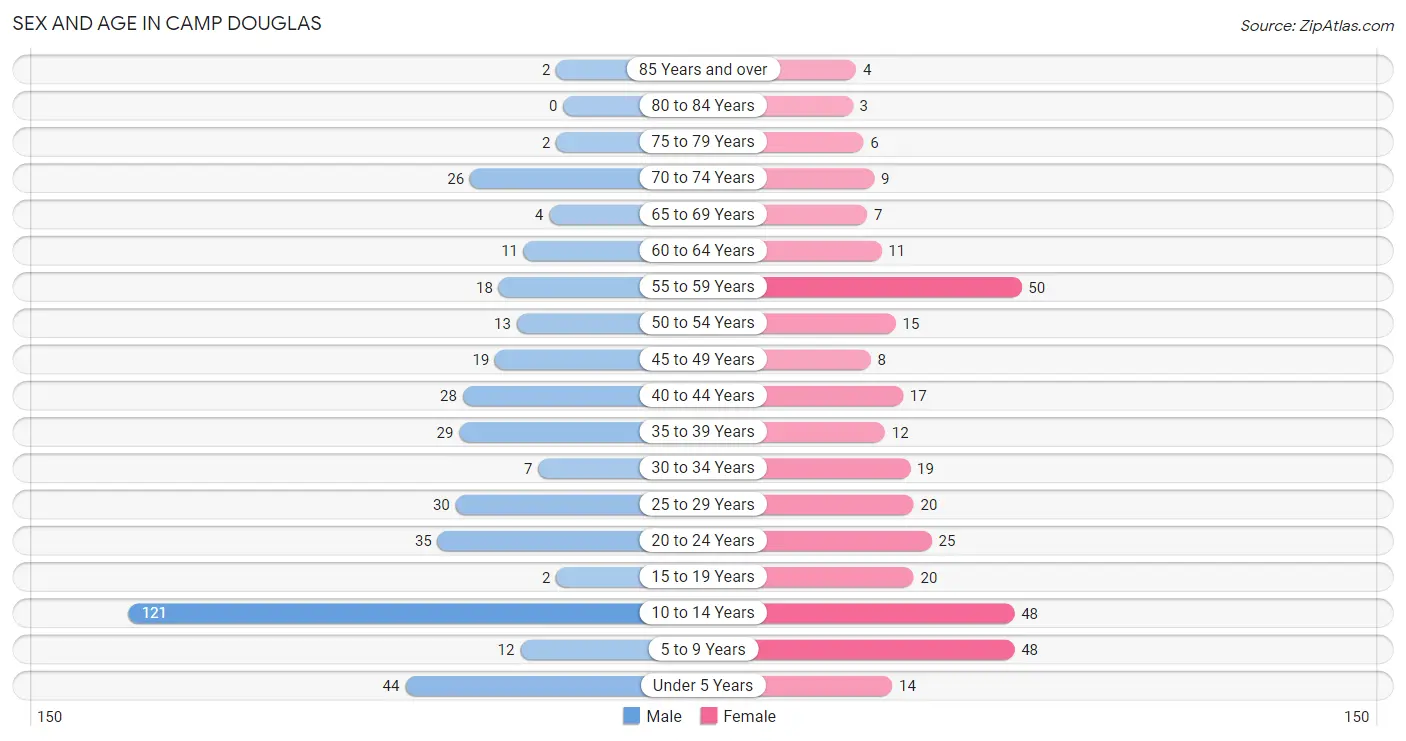
Sex and Age in Camp Douglas
The most populous age groups in Camp Douglas are 10 to 14 Years (121 | 30.0%) for men and 55 to 59 Years (50 | 14.9%) for women.
| Age Bracket | Male | Female |
| Under 5 Years | 44 (10.9%) | 14 (4.2%) |
| 5 to 9 Years | 12 (3.0%) | 48 (14.3%) |
| 10 to 14 Years | 121 (30.0%) | 48 (14.3%) |
| 15 to 19 Years | 2 (0.5%) | 20 (5.9%) |
| 20 to 24 Years | 35 (8.7%) | 25 (7.4%) |
| 25 to 29 Years | 30 (7.4%) | 20 (5.9%) |
| 30 to 34 Years | 7 (1.7%) | 19 (5.7%) |
| 35 to 39 Years | 29 (7.2%) | 12 (3.6%) |
| 40 to 44 Years | 28 (7.0%) | 17 (5.1%) |
| 45 to 49 Years | 19 (4.7%) | 8 (2.4%) |
| 50 to 54 Years | 13 (3.2%) | 15 (4.5%) |
| 55 to 59 Years | 18 (4.5%) | 50 (14.9%) |
| 60 to 64 Years | 11 (2.7%) | 11 (3.3%) |
| 65 to 69 Years | 4 (1.0%) | 7 (2.1%) |
| 70 to 74 Years | 26 (6.5%) | 9 (2.7%) |
| 75 to 79 Years | 2 (0.5%) | 6 (1.8%) |
| 80 to 84 Years | 0 (0.0%) | 3 (0.9%) |
| 85 Years and over | 2 (0.5%) | 4 (1.2%) |
| Total | 403 (100.0%) | 336 (100.0%) |
Families and Households in Camp Douglas
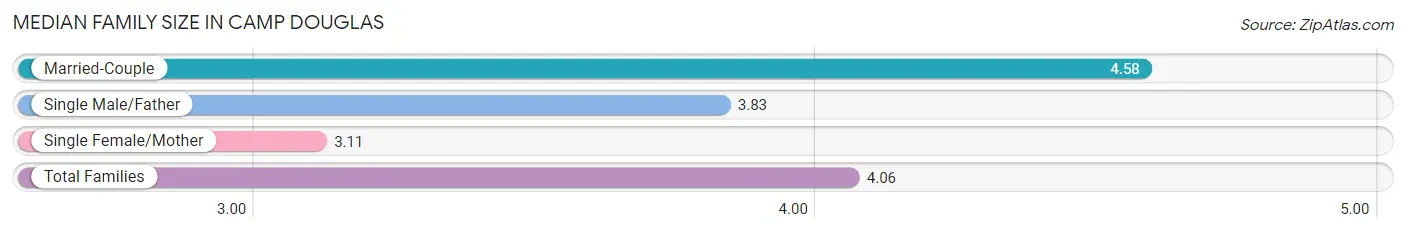
Median Family Size in Camp Douglas
The median family size in Camp Douglas is 4.06 persons per family, with married-couple families (88 | 62.9%) accounting for the largest median family size of 4.58 persons per family. On the other hand, single female/mother families (46 | 32.9%) represent the smallest median family size with 3.11 persons per family.
| Family Type | # Families | Family Size |
| Married-Couple | 88 (62.9%) | 4.58 |
| Single Male/Father | 6 (4.3%) | 3.83 |
| Single Female/Mother | 46 (32.9%) | 3.11 |
| Total Families | 140 (100.0%) | 4.06 |
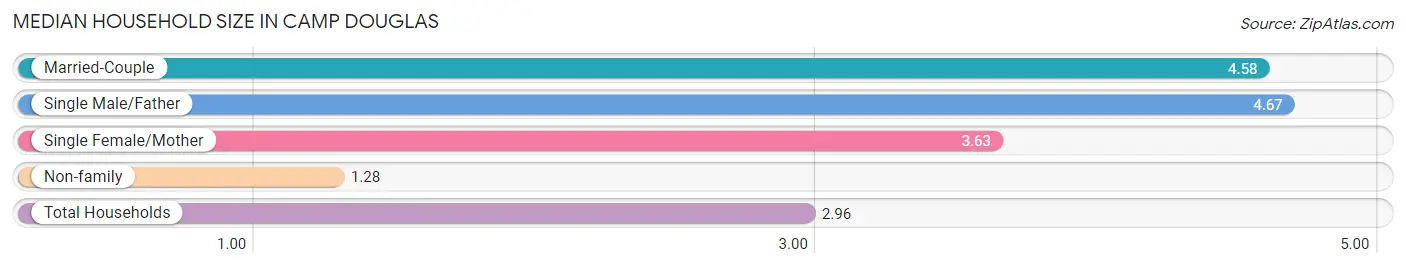
Median Household Size in Camp Douglas
The median household size in Camp Douglas is 2.96 persons per household, with single male/father households (6 | 2.4%) accounting for the largest median household size of 4.67 persons per household. non-family households (110 | 44.0%) represent the smallest median household size with 1.28 persons per household.
| Household Type | # Households | Household Size |
| Married-Couple | 88 (35.2%) | 4.58 |
| Single Male/Father | 6 (2.4%) | 4.67 |
| Single Female/Mother | 46 (18.4%) | 3.63 |
| Non-family | 110 (44.0%) | 1.28 |
| Total Households | 250 (100.0%) | 2.96 |
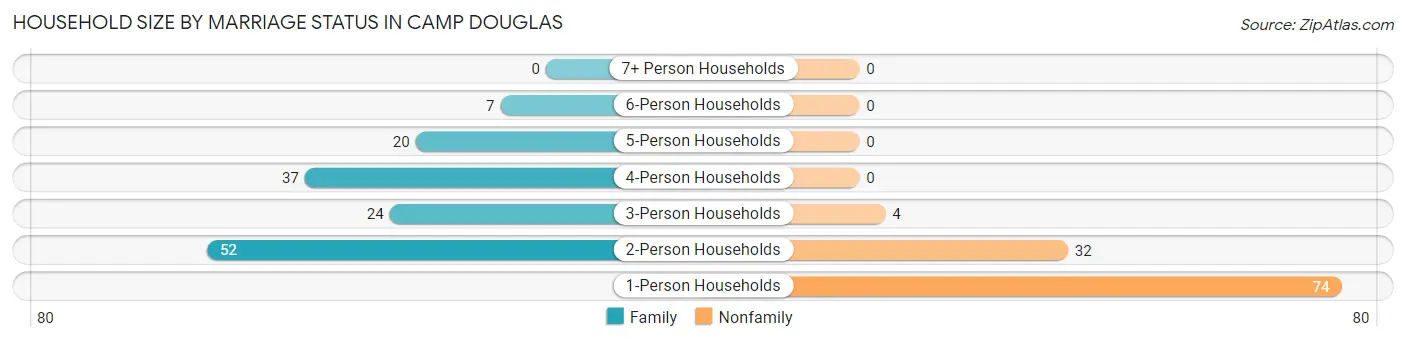
Household Size by Marriage Status in Camp Douglas
Out of a total of 250 households in Camp Douglas, 140 (56.0%) are family households, while 110 (44.0%) are nonfamily households. The most numerous type of family households are 2-person households, comprising 52, and the most common type of nonfamily households are 1-person households, comprising 74.
| Household Size | Family Households | Nonfamily Households |
| 1-Person Households | - | 74 (29.6%) |
| 2-Person Households | 52 (20.8%) | 32 (12.8%) |
| 3-Person Households | 24 (9.6%) | 4 (1.6%) |
| 4-Person Households | 37 (14.8%) | 0 (0.0%) |
| 5-Person Households | 20 (8.0%) | 0 (0.0%) |
| 6-Person Households | 7 (2.8%) | 0 (0.0%) |
| 7+ Person Households | 0 (0.0%) | 0 (0.0%) |
| Total | 140 (56.0%) | 110 (44.0%) |
Female Fertility in Camp Douglas
Fertility by Age in Camp Douglas
Average fertility rate in Camp Douglas is 33.0 births per 1,000 women. Women in the age bracket of 20 to 34 years have the highest fertility rate with 63.0 births per 1,000 women. Women in the age bracket of 20 to 34 years acount for 100.0% of all women with births.
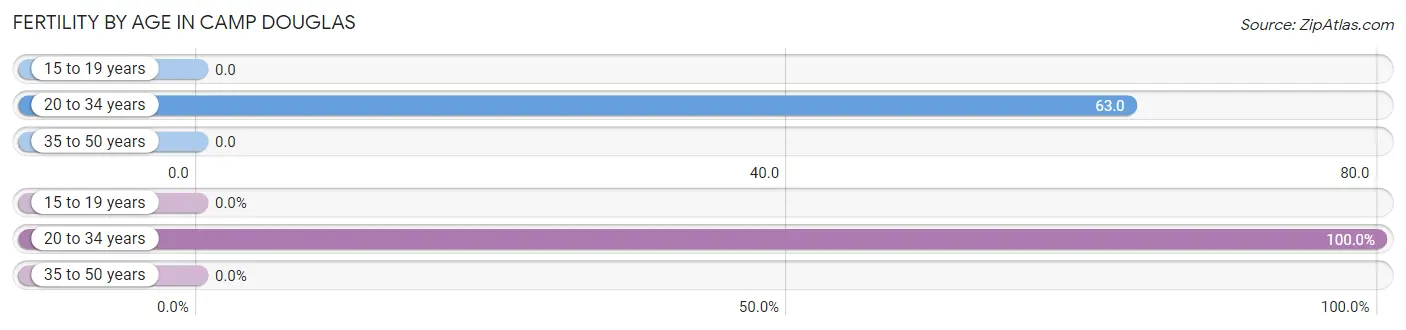
| Age Bracket | Women with Births | Births / 1,000 Women |
| 15 to 19 years | 0 (0.0%) | 0.0 |
| 20 to 34 years | 4 (100.0%) | 63.0 |
| 35 to 50 years | 0 (0.0%) | 0.0 |
| Total | 4 (100.0%) | 33.0 |
Fertility by Age by Marriage Status in Camp Douglas
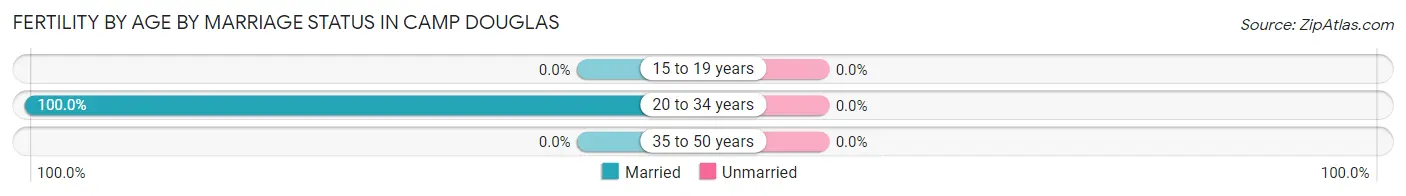
| Age Bracket | Married | Unmarried |
| 15 to 19 years | 0 (0.0%) | 0 (0.0%) |
| 20 to 34 years | 4 (100.0%) | 0 (0.0%) |
| 35 to 50 years | 0 (0.0%) | 0 (0.0%) |
| Total | 4 (100.0%) | 0 (0.0%) |
Fertility by Education in Camp Douglas
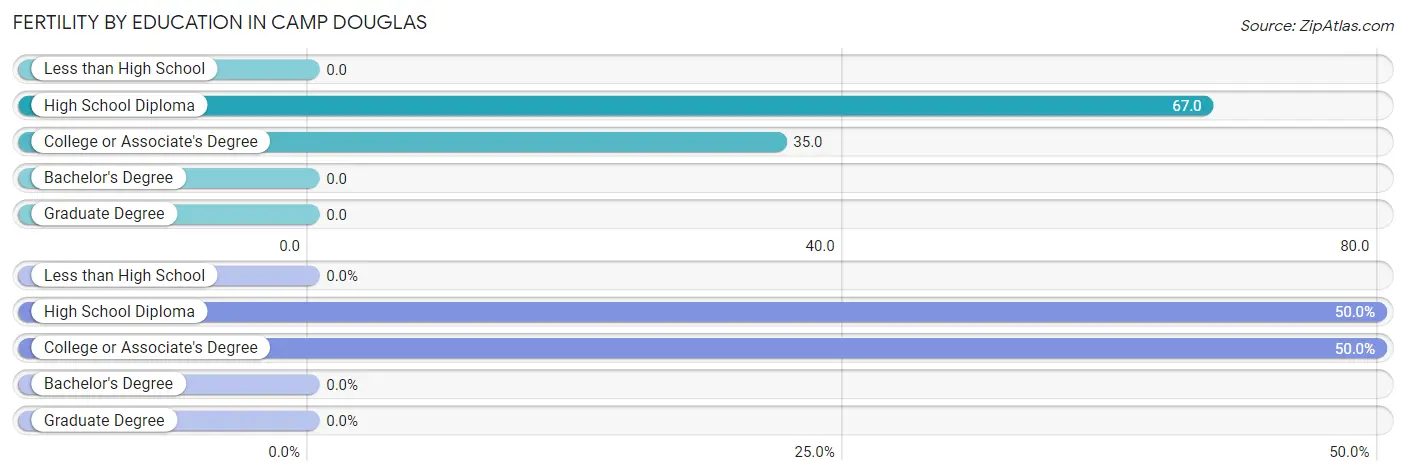
| Educational Attainment | Women with Births | Births / 1,000 Women |
| Less than High School | 0 (0.0%) | 0.0 |
| High School Diploma | 2 (50.0%) | 67.0 |
| College or Associate's Degree | 2 (50.0%) | 35.0 |
| Bachelor's Degree | 0 (0.0%) | 0.0 |
| Graduate Degree | 0 (0.0%) | 0.0 |
| Total | 4 (100.0%) | 33.0 |
Fertility by Education by Marriage Status in Camp Douglas
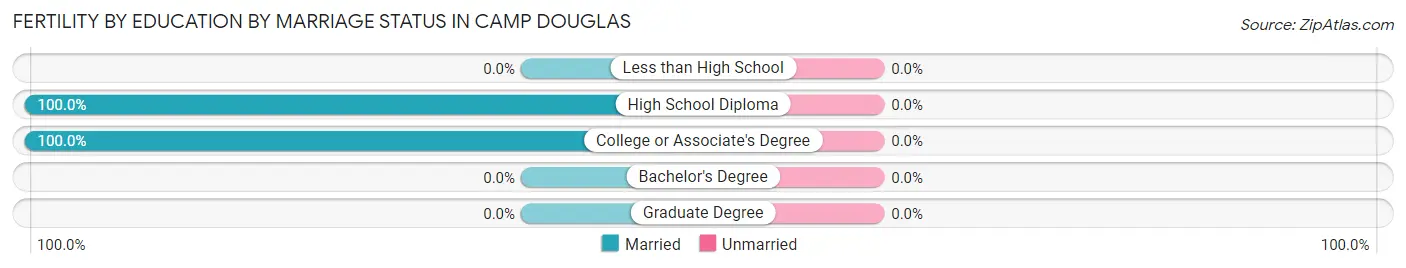
| Educational Attainment | Married | Unmarried |
| Less than High School | 0 (0.0%) | 0 (0.0%) |
| High School Diploma | 2 (100.0%) | 0 (0.0%) |
| College or Associate's Degree | 2 (100.0%) | 0 (0.0%) |
| Bachelor's Degree | 0 (0.0%) | 0 (0.0%) |
| Graduate Degree | 0 (0.0%) | 0 (0.0%) |
| Total | 4 (100.0%) | 0 (0.0%) |
Income in Camp Douglas
Income Overview in Camp Douglas
Per Capita Income in Camp Douglas is $22,994, while median incomes of families and households are $78,250 and $58,750 respectively.
| Characteristic | Number | Measure |
| Per Capita Income | 739 | $22,994 |
| Median Family Income | 140 | $78,250 |
| Mean Family Income | 140 | $73,981 |
| Median Household Income | 250 | $58,750 |
| Mean Household Income | 250 | $65,835 |
| Income Deficit | 140 | $13,487 |
| Wage / Income Gap (%) | 739 | 42.05% |
| Wage / Income Gap ($) | 739 | 57.95¢ per $1 |
| Gini / Inequality Index | 739 | 0.36 |
Earnings by Sex in Camp Douglas
Average Earnings in Camp Douglas are $38,182, $52,059 for men and $30,167 for women, a difference of 42.0%.
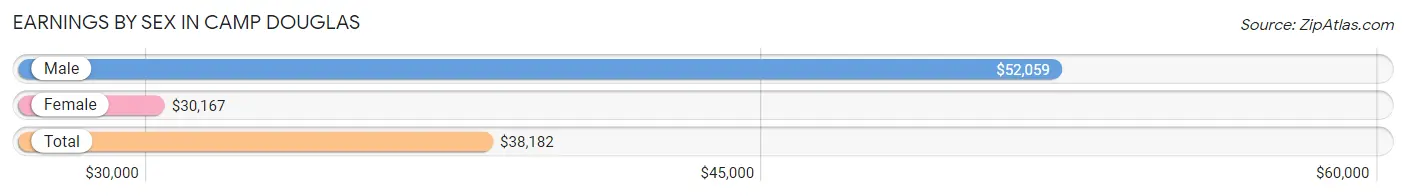
| Sex | Number | Average Earnings |
| Male | 166 (50.9%) | $52,059 |
| Female | 160 (49.1%) | $30,167 |
| Total | 326 (100.0%) | $38,182 |
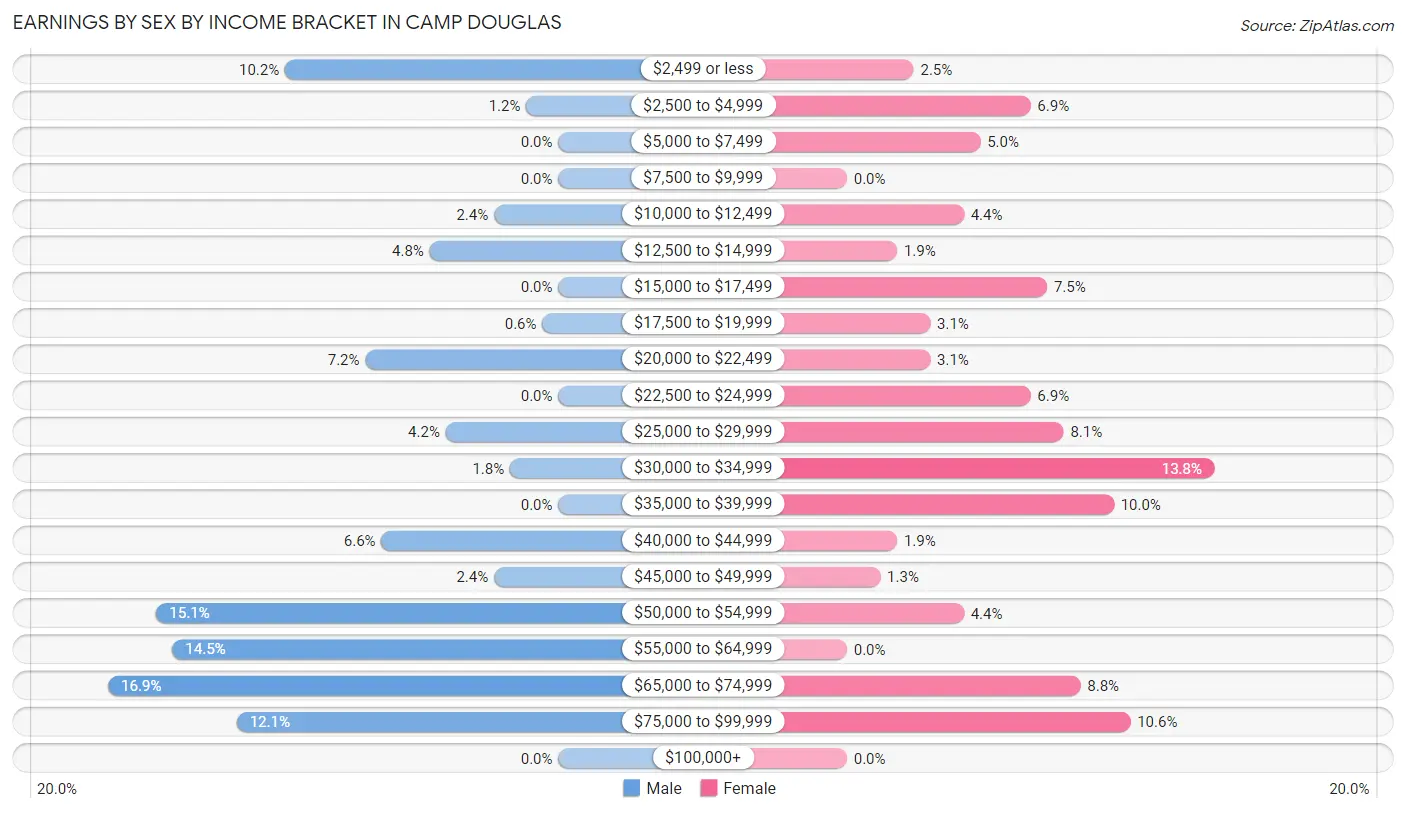
Earnings by Sex by Income Bracket in Camp Douglas
The most common earnings brackets in Camp Douglas are $65,000 to $74,999 for men (28 | 16.9%) and $30,000 to $34,999 for women (22 | 13.8%).
| Income | Male | Female |
| $2,499 or less | 17 (10.2%) | 4 (2.5%) |
| $2,500 to $4,999 | 2 (1.2%) | 11 (6.9%) |
| $5,000 to $7,499 | 0 (0.0%) | 8 (5.0%) |
| $7,500 to $9,999 | 0 (0.0%) | 0 (0.0%) |
| $10,000 to $12,499 | 4 (2.4%) | 7 (4.4%) |
| $12,500 to $14,999 | 8 (4.8%) | 3 (1.9%) |
| $15,000 to $17,499 | 0 (0.0%) | 12 (7.5%) |
| $17,500 to $19,999 | 1 (0.6%) | 5 (3.1%) |
| $20,000 to $22,499 | 12 (7.2%) | 5 (3.1%) |
| $22,500 to $24,999 | 0 (0.0%) | 11 (6.9%) |
| $25,000 to $29,999 | 7 (4.2%) | 13 (8.1%) |
| $30,000 to $34,999 | 3 (1.8%) | 22 (13.8%) |
| $35,000 to $39,999 | 0 (0.0%) | 16 (10.0%) |
| $40,000 to $44,999 | 11 (6.6%) | 3 (1.9%) |
| $45,000 to $49,999 | 4 (2.4%) | 2 (1.3%) |
| $50,000 to $54,999 | 25 (15.1%) | 7 (4.4%) |
| $55,000 to $64,999 | 24 (14.5%) | 0 (0.0%) |
| $65,000 to $74,999 | 28 (16.9%) | 14 (8.7%) |
| $75,000 to $99,999 | 20 (12.0%) | 17 (10.6%) |
| $100,000+ | 0 (0.0%) | 0 (0.0%) |
| Total | 166 (100.0%) | 160 (100.0%) |
Earnings by Sex by Educational Attainment in Camp Douglas
Average earnings in Camp Douglas are $54,844 for men and $32,000 for women, a difference of 41.6%. Men with an educational attainment of college or associate's degree enjoy the highest average annual earnings of $57,250, while those with high school diploma education earn the least with $53,750. Women with an educational attainment of bachelor's degree earn the most with the average annual earnings of $77,727, while those with college or associate's degree education have the smallest earnings of $28,000.
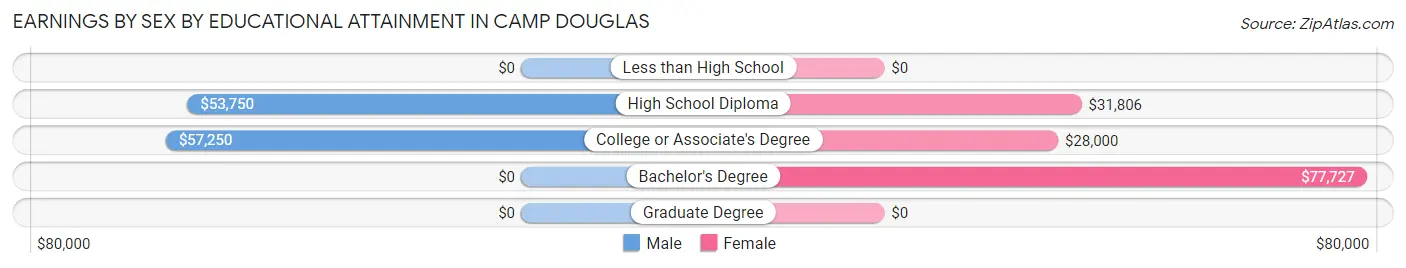
| Educational Attainment | Male Income | Female Income |
| Less than High School | - | - |
| High School Diploma | $53,750 | $31,806 |
| College or Associate's Degree | $57,250 | $28,000 |
| Bachelor's Degree | - | - |
| Graduate Degree | - | - |
| Total | $54,844 | $32,000 |
Family Income in Camp Douglas
Family Income Brackets in Camp Douglas
According to the Camp Douglas family income data, there are 43 families falling into the $100,000 to $149,999 income range, which is the most common income bracket and makes up 30.7% of all families.
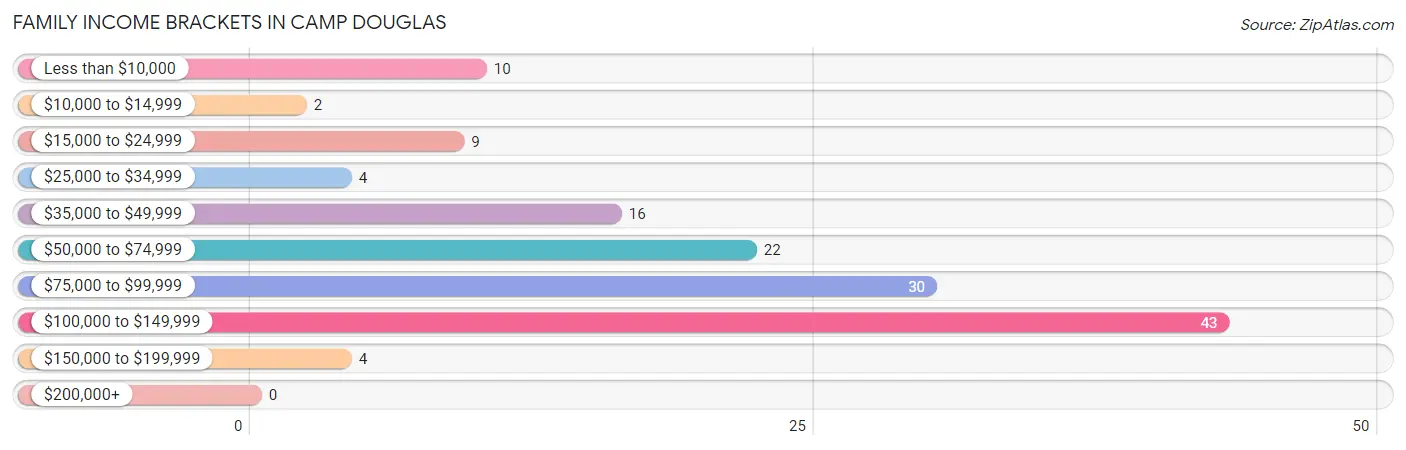
| Income Bracket | # Families | % Families |
| Less than $10,000 | 10 | 7.1% |
| $10,000 to $14,999 | 2 | 1.4% |
| $15,000 to $24,999 | 9 | 6.4% |
| $25,000 to $34,999 | 4 | 2.9% |
| $35,000 to $49,999 | 16 | 11.4% |
| $50,000 to $74,999 | 22 | 15.7% |
| $75,000 to $99,999 | 30 | 21.4% |
| $100,000 to $149,999 | 43 | 30.7% |
| $150,000 to $199,999 | 4 | 2.9% |
| $200,000+ | 0 | 0.0% |
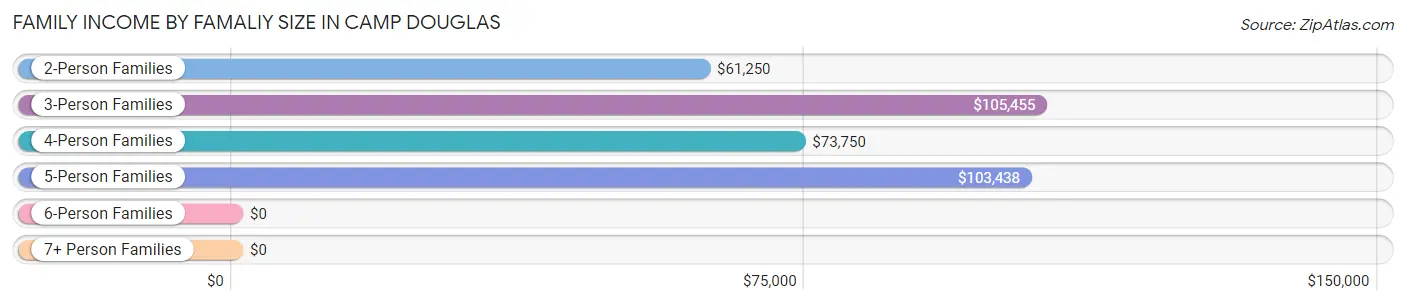
Family Income by Famaliy Size in Camp Douglas
3-person families (40 | 28.6%) account for the highest median family income in Camp Douglas with $105,455 per family, while 3-person families (40 | 28.6%) have the highest median income of $35,152 per family member.
| Income Bracket | # Families | Median Income |
| 2-Person Families | 52 (37.1%) | $61,250 |
| 3-Person Families | 40 (28.6%) | $105,455 |
| 4-Person Families | 27 (19.3%) | $73,750 |
| 5-Person Families | 14 (10.0%) | $103,438 |
| 6-Person Families | 7 (5.0%) | $0 |
| 7+ Person Families | 0 (0.0%) | $0 |
| Total | 140 (100.0%) | $78,250 |
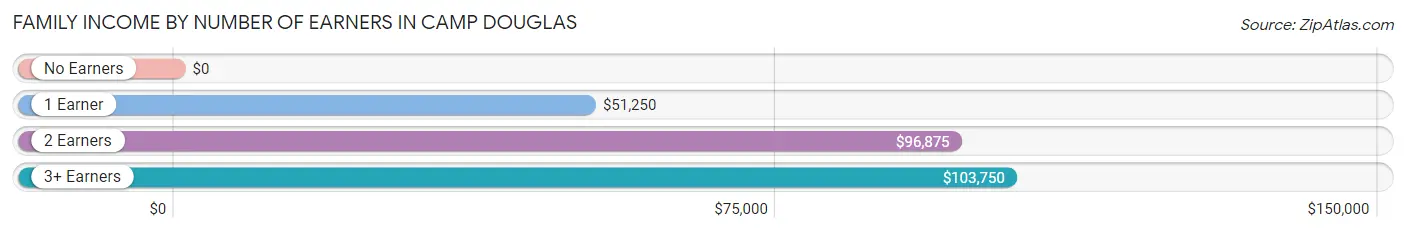
Family Income by Number of Earners in Camp Douglas
| Number of Earners | # Families | Median Income |
| No Earners | 9 (6.4%) | $0 |
| 1 Earner | 66 (47.1%) | $51,250 |
| 2 Earners | 53 (37.9%) | $96,875 |
| 3+ Earners | 12 (8.6%) | $103,750 |
| Total | 140 (100.0%) | $78,250 |
Household Income in Camp Douglas
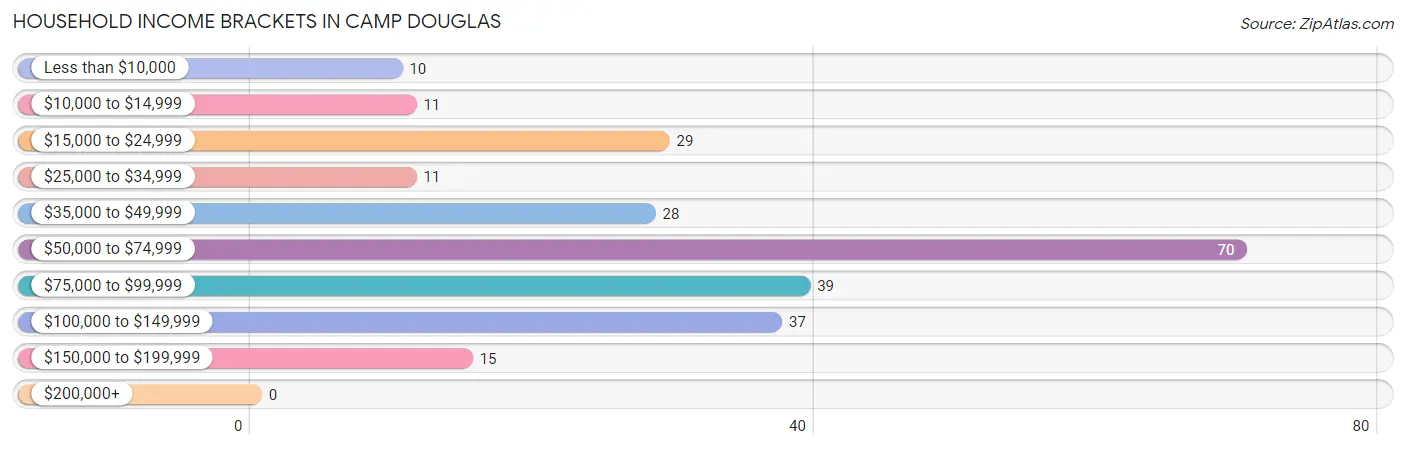
Household Income Brackets in Camp Douglas
With 70 households falling in the category, the $50,000 to $74,999 income range is the most frequent in Camp Douglas, accounting for 28.0% of all households.
| Income Bracket | # Households | % Households |
| Less than $10,000 | 10 | 4.0% |
| $10,000 to $14,999 | 11 | 4.4% |
| $15,000 to $24,999 | 29 | 11.6% |
| $25,000 to $34,999 | 11 | 4.4% |
| $35,000 to $49,999 | 28 | 11.2% |
| $50,000 to $74,999 | 70 | 28.0% |
| $75,000 to $99,999 | 39 | 15.6% |
| $100,000 to $149,999 | 37 | 14.8% |
| $150,000 to $199,999 | 15 | 6.0% |
| $200,000+ | 0 | 0.0% |
Household Income by Householder Age in Camp Douglas
The median household income in Camp Douglas is $58,750, with the highest median household income of $85,125 found in the 15 to 24 years age bracket for the primary householder. A total of 19 households (7.6%) fall into this category. Meanwhile, the 65+ years age bracket for the primary householder has the lowest median household income of $0, with 47 households (18.8%) in this group.

| Income Bracket | # Households | Median Income |
| 15 to 24 Years | 19 (7.6%) | $85,125 |
| 25 to 44 Years | 86 (34.4%) | $63,750 |
| 45 to 64 Years | 98 (39.2%) | $53,929 |
| 65+ Years | 47 (18.8%) | $0 |
| Total | 250 (100.0%) | $58,750 |
Poverty in Camp Douglas
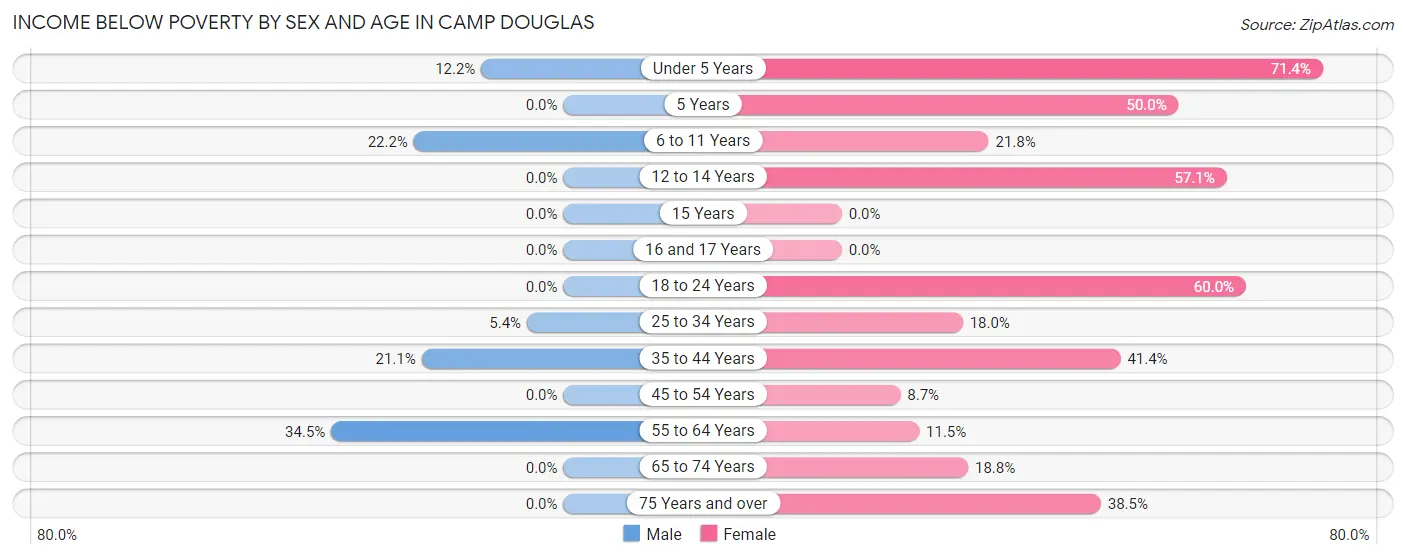
Income Below Poverty by Sex and Age in Camp Douglas
With 8.3% poverty level for males and 28.0% for females among the residents of Camp Douglas, 55 to 64 year old males and under 5 year old females are the most vulnerable to poverty, with 10 males (34.5%) and 10 females (71.4%) in their respective age groups living below the poverty level.
| Age Bracket | Male | Female |
| Under 5 Years | 5 (12.2%) | 10 (71.4%) |
| 5 Years | 0 (0.0%) | 2 (50.0%) |
| 6 to 11 Years | 4 (22.2%) | 17 (21.8%) |
| 12 to 14 Years | 0 (0.0%) | 8 (57.1%) |
| 15 Years | 0 (0.0%) | 0 (0.0%) |
| 16 and 17 Years | 0 (0.0%) | 0 (0.0%) |
| 18 to 24 Years | 0 (0.0%) | 21 (60.0%) |
| 25 to 34 Years | 2 (5.4%) | 7 (17.9%) |
| 35 to 44 Years | 12 (21.0%) | 12 (41.4%) |
| 45 to 54 Years | 0 (0.0%) | 2 (8.7%) |
| 55 to 64 Years | 10 (34.5%) | 7 (11.5%) |
| 65 to 74 Years | 0 (0.0%) | 3 (18.8%) |
| 75 Years and over | 0 (0.0%) | 5 (38.5%) |
| Total | 33 (8.3%) | 94 (28.0%) |
Income Above Poverty by Sex and Age in Camp Douglas
According to the poverty statistics in Camp Douglas, males aged 5 years and females aged 15 years are the age groups that are most secure financially, with 100.0% of males and 100.0% of females in these age groups living above the poverty line.
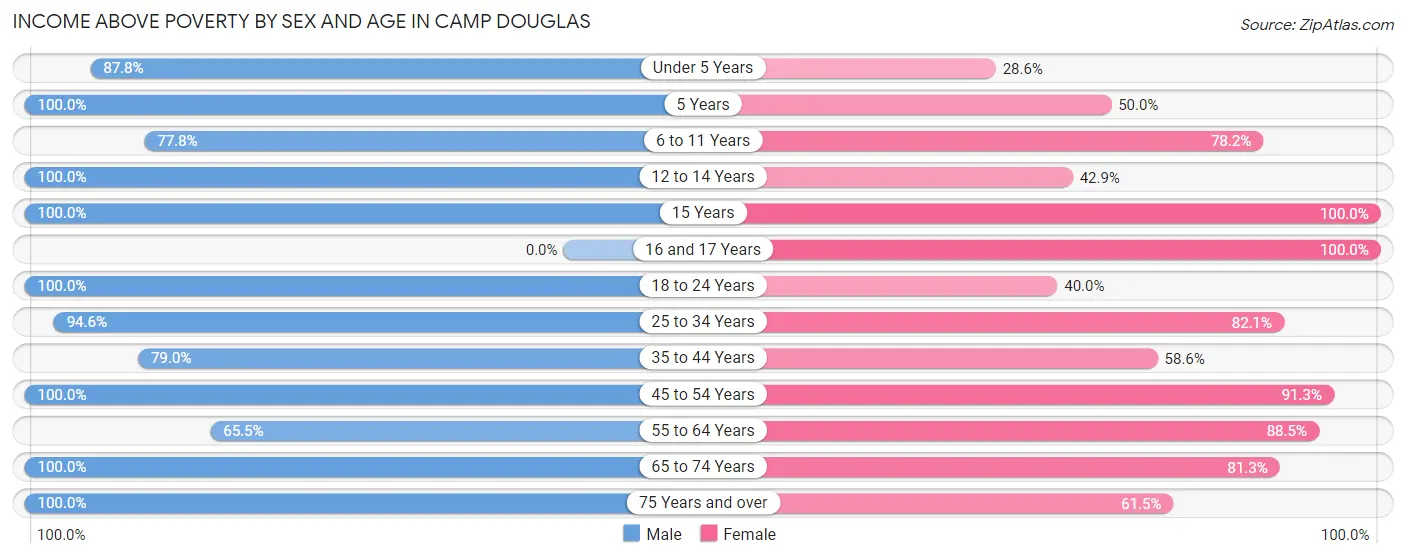
| Age Bracket | Male | Female |
| Under 5 Years | 36 (87.8%) | 4 (28.6%) |
| 5 Years | 4 (100.0%) | 2 (50.0%) |
| 6 to 11 Years | 14 (77.8%) | 61 (78.2%) |
| 12 to 14 Years | 111 (100.0%) | 6 (42.9%) |
| 15 Years | 2 (100.0%) | 5 (100.0%) |
| 16 and 17 Years | 0 (0.0%) | 5 (100.0%) |
| 18 to 24 Years | 35 (100.0%) | 14 (40.0%) |
| 25 to 34 Years | 35 (94.6%) | 32 (82.1%) |
| 35 to 44 Years | 45 (78.9%) | 17 (58.6%) |
| 45 to 54 Years | 32 (100.0%) | 21 (91.3%) |
| 55 to 64 Years | 19 (65.5%) | 54 (88.5%) |
| 65 to 74 Years | 30 (100.0%) | 13 (81.2%) |
| 75 Years and over | 4 (100.0%) | 8 (61.5%) |
| Total | 367 (91.7%) | 242 (72.0%) |
Income Below Poverty Among Married-Couple Families in Camp Douglas
The poverty statistics for married-couple families in Camp Douglas show that 17.1% or 15 of the total 88 families live below the poverty line. Families with 3 or 4 children have the highest poverty rate of 33.3%, comprising of 7 families. On the other hand, families with 1 or 2 children have the lowest poverty rate of 6.9%, which includes 2 families.
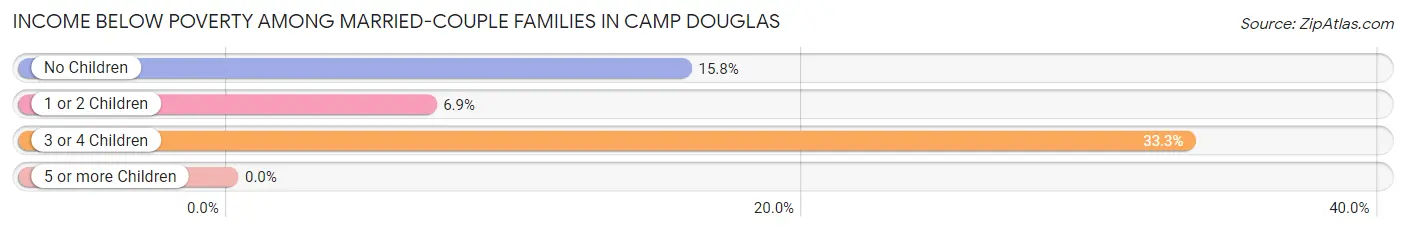
| Children | Above Poverty | Below Poverty |
| No Children | 32 (84.2%) | 6 (15.8%) |
| 1 or 2 Children | 27 (93.1%) | 2 (6.9%) |
| 3 or 4 Children | 14 (66.7%) | 7 (33.3%) |
| 5 or more Children | 0 (0.0%) | 0 (0.0%) |
| Total | 73 (83.0%) | 15 (17.1%) |
Income Below Poverty Among Single-Parent Households in Camp Douglas
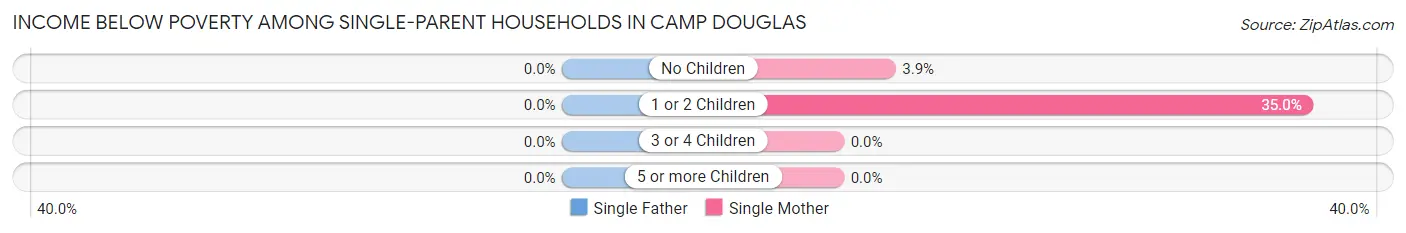
| Children | Single Father | Single Mother |
| No Children | 0 (0.0%) | 1 (3.8%) |
| 1 or 2 Children | 0 (0.0%) | 7 (35.0%) |
| 3 or 4 Children | 0 (0.0%) | 0 (0.0%) |
| 5 or more Children | 0 (0.0%) | 0 (0.0%) |
| Total | 0 (0.0%) | 8 (17.4%) |
Income Below Poverty Among Married-Couple vs Single-Parent Households in Camp Douglas
The poverty data for Camp Douglas shows that 15 of the married-couple family households (17.1%) and 8 of the single-parent households (15.4%) are living below the poverty level. Within the married-couple family households, those with 3 or 4 children have the highest poverty rate, with 7 households (33.3%) falling below the poverty line. Among the single-parent households, those with 1 or 2 children have the highest poverty rate, with 7 household (35.0%) living below poverty.
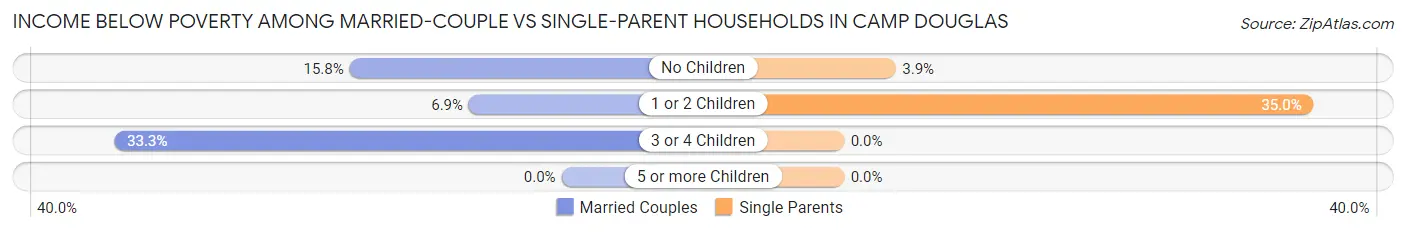
| Children | Married-Couple Families | Single-Parent Households |
| No Children | 6 (15.8%) | 1 (3.8%) |
| 1 or 2 Children | 2 (6.9%) | 7 (35.0%) |
| 3 or 4 Children | 7 (33.3%) | 0 (0.0%) |
| 5 or more Children | 0 (0.0%) | 0 (0.0%) |
| Total | 15 (17.1%) | 8 (15.4%) |
Employment Characteristics in Camp Douglas
Employment by Class of Employer in Camp Douglas
Among the 297 employed individuals in Camp Douglas, private company employees (197 | 66.3%), federal government employees (39 | 13.1%), and self-employed (not incorporated) (21 | 7.1%) make up the most common classes of employment.
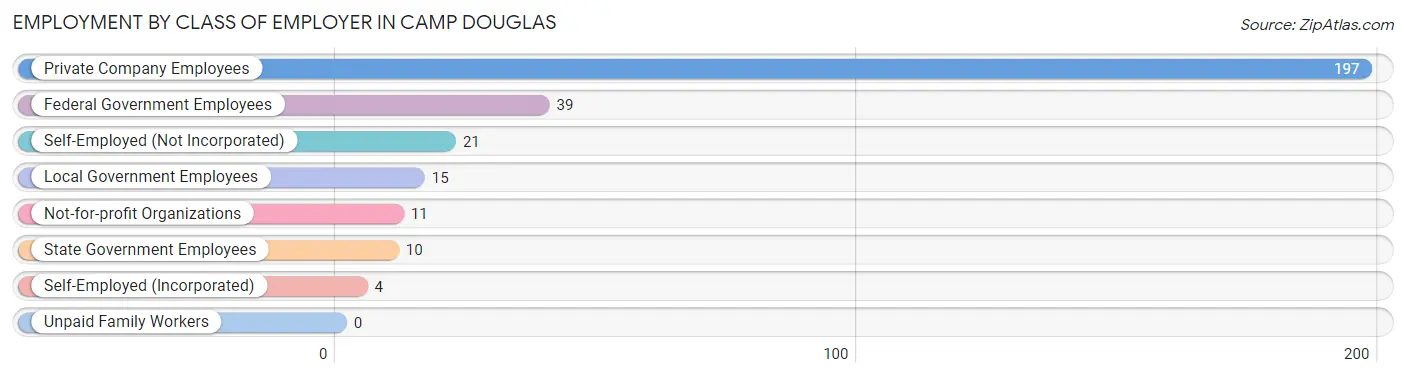
| Employer Class | # Employees | % Employees |
| Private Company Employees | 197 | 66.3% |
| Self-Employed (Incorporated) | 4 | 1.3% |
| Self-Employed (Not Incorporated) | 21 | 7.1% |
| Not-for-profit Organizations | 11 | 3.7% |
| Local Government Employees | 15 | 5.1% |
| State Government Employees | 10 | 3.4% |
| Federal Government Employees | 39 | 13.1% |
| Unpaid Family Workers | 0 | 0.0% |
| Total | 297 | 100.0% |
Employment Status by Age in Camp Douglas
According to the labor force statistics for Camp Douglas, out of the total population over 16 years of age (445), 69.9% or 311 individuals are in the labor force, with 3.5% or 11 of them unemployed. The age group with the highest labor force participation rate is 16 to 19 years, with 100.0% or 15 individuals in the labor force. Within the labor force, the 20 to 24 years age range has the highest percentage of unemployed individuals, with 16.7% or 8 of them being unemployed.
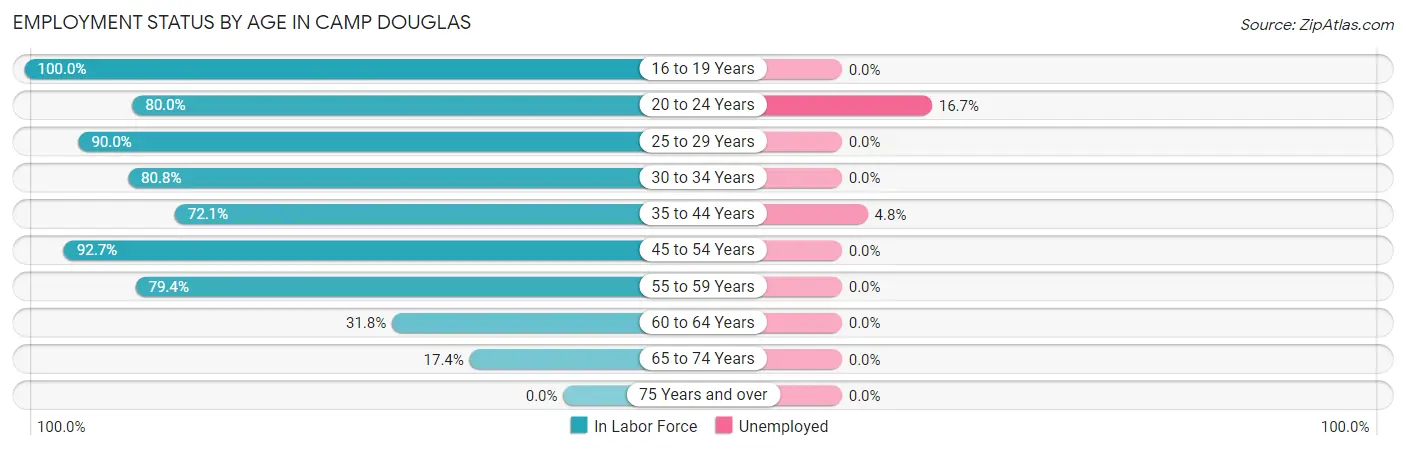
| Age Bracket | In Labor Force | Unemployed |
| 16 to 19 Years | 15 (100.0%) | 0 (0.0%) |
| 20 to 24 Years | 48 (80.0%) | 8 (16.7%) |
| 25 to 29 Years | 45 (90.0%) | 0 (0.0%) |
| 30 to 34 Years | 21 (80.8%) | 0 (0.0%) |
| 35 to 44 Years | 62 (72.1%) | 3 (4.8%) |
| 45 to 54 Years | 51 (92.7%) | 0 (0.0%) |
| 55 to 59 Years | 54 (79.4%) | 0 (0.0%) |
| 60 to 64 Years | 7 (31.8%) | 0 (0.0%) |
| 65 to 74 Years | 8 (17.4%) | 0 (0.0%) |
| 75 Years and over | 0 (0.0%) | 0 (0.0%) |
| Total | 311 (69.9%) | 11 (3.5%) |
Employment Status by Educational Attainment in Camp Douglas
According to labor force statistics for Camp Douglas, 78.2% of individuals (240) out of the total population between 25 and 64 years of age (307) are in the labor force, with 1.3% or 3 of them being unemployed. The group with the highest labor force participation rate are those with the educational attainment of bachelor's degree or higher, with 100.0% or 27 individuals in the labor force. Within the labor force, individuals with high school diploma education have the highest percentage of unemployment, with 3.2% or 3 of them being unemployed.
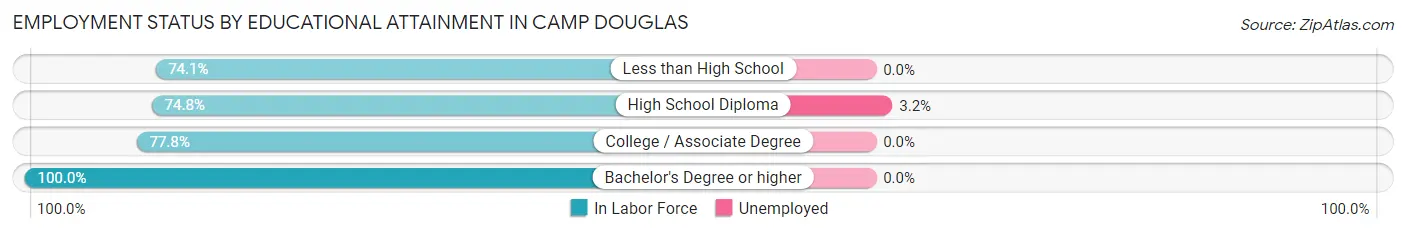
| Educational Attainment | In Labor Force | Unemployed |
| Less than High School | 20 (74.1%) | 0 (0.0%) |
| High School Diploma | 95 (74.8%) | 4 (3.2%) |
| College / Associate Degree | 98 (77.8%) | 0 (0.0%) |
| Bachelor's Degree or higher | 27 (100.0%) | 0 (0.0%) |
| Total | 240 (78.2%) | 4 (1.3%) |
Employment Occupations by Sex in Camp Douglas
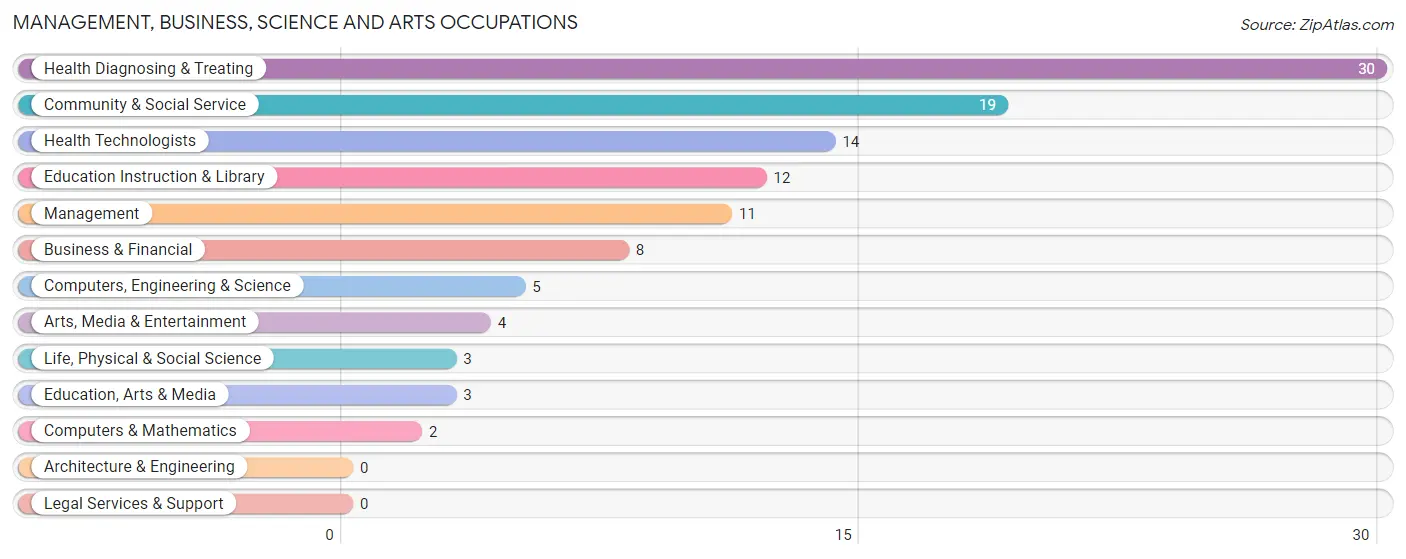
Management, Business, Science and Arts Occupations
The most common Management, Business, Science and Arts occupations in Camp Douglas are Health Diagnosing & Treating (30 | 10.0%), Community & Social Service (19 | 6.3%), Health Technologists (14 | 4.7%), Education Instruction & Library (12 | 4.0%), and Management (11 | 3.7%).
Management, Business, Science and Arts Occupations by Sex
Within the Management, Business, Science and Arts occupations in Camp Douglas, the most male-oriented occupations are Computers & Mathematics (100.0%), Management (81.8%), and Computers, Engineering & Science (60.0%), while the most female-oriented occupations are Education Instruction & Library (100.0%), Health Technologists (100.0%), and Health Diagnosing & Treating (90.0%).
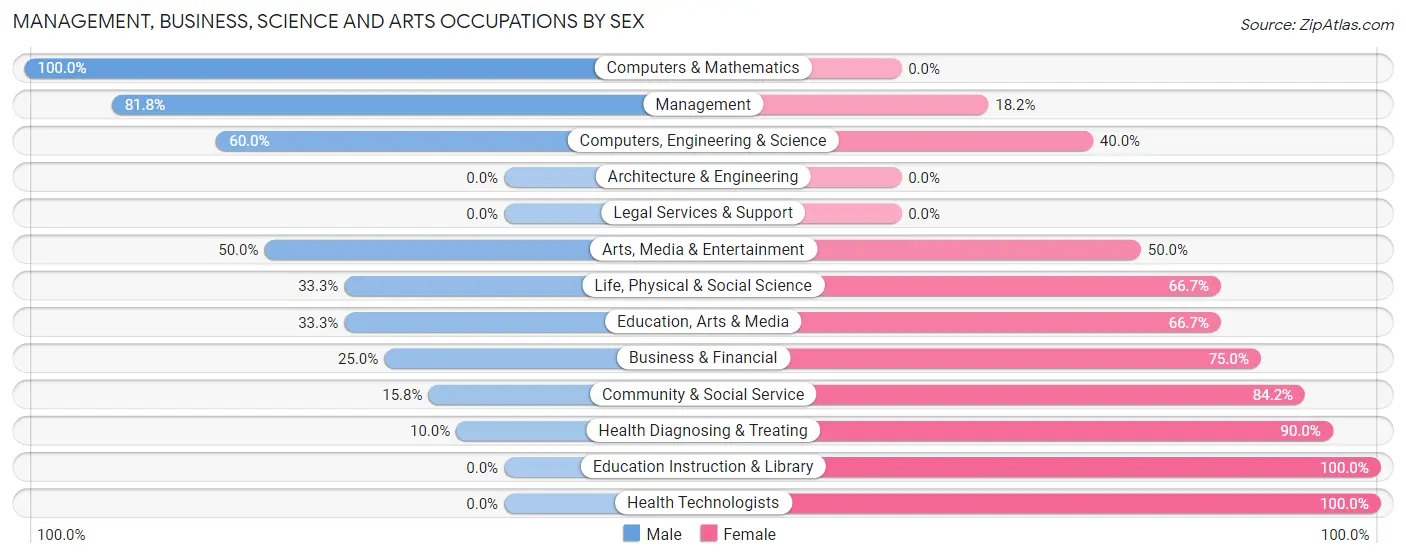
| Occupation | Male | Female |
| Management | 9 (81.8%) | 2 (18.2%) |
| Business & Financial | 2 (25.0%) | 6 (75.0%) |
| Computers, Engineering & Science | 3 (60.0%) | 2 (40.0%) |
| Computers & Mathematics | 2 (100.0%) | 0 (0.0%) |
| Architecture & Engineering | 0 (0.0%) | 0 (0.0%) |
| Life, Physical & Social Science | 1 (33.3%) | 2 (66.7%) |
| Community & Social Service | 3 (15.8%) | 16 (84.2%) |
| Education, Arts & Media | 1 (33.3%) | 2 (66.7%) |
| Legal Services & Support | 0 (0.0%) | 0 (0.0%) |
| Education Instruction & Library | 0 (0.0%) | 12 (100.0%) |
| Arts, Media & Entertainment | 2 (50.0%) | 2 (50.0%) |
| Health Diagnosing & Treating | 3 (10.0%) | 27 (90.0%) |
| Health Technologists | 0 (0.0%) | 14 (100.0%) |
| Total (Category) | 20 (27.4%) | 53 (72.6%) |
| Total (Overall) | 154 (51.3%) | 146 (48.7%) |
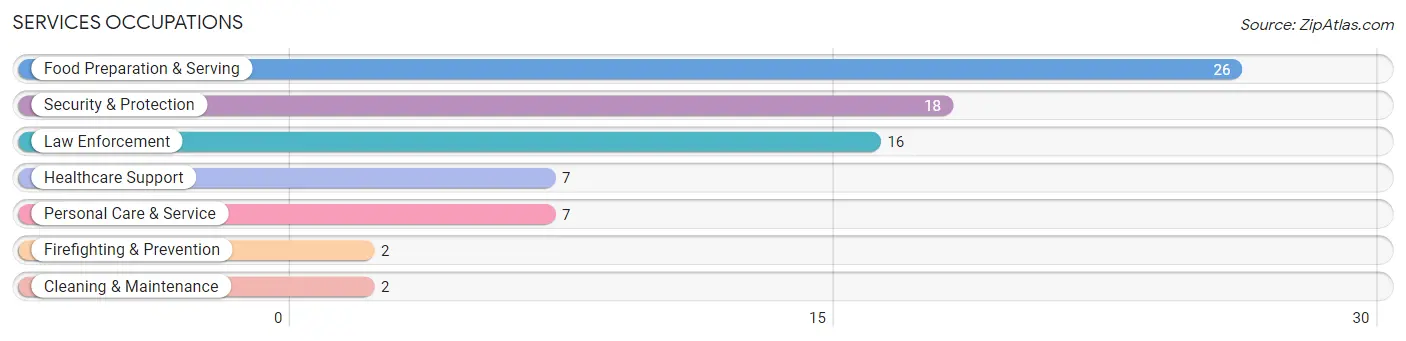
Services Occupations
The most common Services occupations in Camp Douglas are Food Preparation & Serving (26 | 8.7%), Security & Protection (18 | 6.0%), Law Enforcement (16 | 5.3%), Healthcare Support (7 | 2.3%), and Personal Care & Service (7 | 2.3%).
Services Occupations by Sex
Within the Services occupations in Camp Douglas, the most male-oriented occupations are Firefighting & Prevention (100.0%), Cleaning & Maintenance (100.0%), and Security & Protection (83.3%), while the most female-oriented occupations are Healthcare Support (100.0%), Personal Care & Service (100.0%), and Food Preparation & Serving (76.9%).
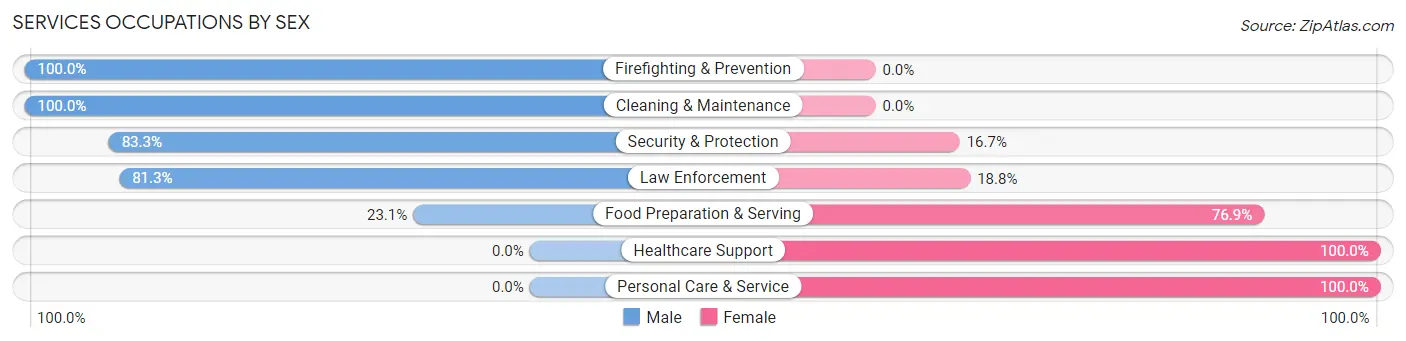
| Occupation | Male | Female |
| Healthcare Support | 0 (0.0%) | 7 (100.0%) |
| Security & Protection | 15 (83.3%) | 3 (16.7%) |
| Firefighting & Prevention | 2 (100.0%) | 0 (0.0%) |
| Law Enforcement | 13 (81.2%) | 3 (18.8%) |
| Food Preparation & Serving | 6 (23.1%) | 20 (76.9%) |
| Cleaning & Maintenance | 2 (100.0%) | 0 (0.0%) |
| Personal Care & Service | 0 (0.0%) | 7 (100.0%) |
| Total (Category) | 23 (38.3%) | 37 (61.7%) |
| Total (Overall) | 154 (51.3%) | 146 (48.7%) |
Sales and Office Occupations
The most common Sales and Office occupations in Camp Douglas are Office & Administration (17 | 5.7%), and Sales & Related (14 | 4.7%).

Sales and Office Occupations by Sex
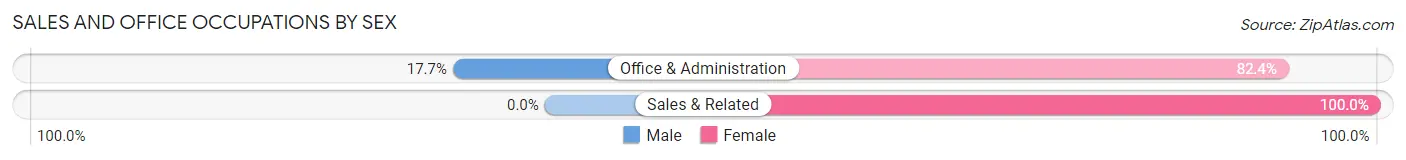
| Occupation | Male | Female |
| Sales & Related | 0 (0.0%) | 14 (100.0%) |
| Office & Administration | 3 (17.6%) | 14 (82.4%) |
| Total (Category) | 3 (9.7%) | 28 (90.3%) |
| Total (Overall) | 154 (51.3%) | 146 (48.7%) |
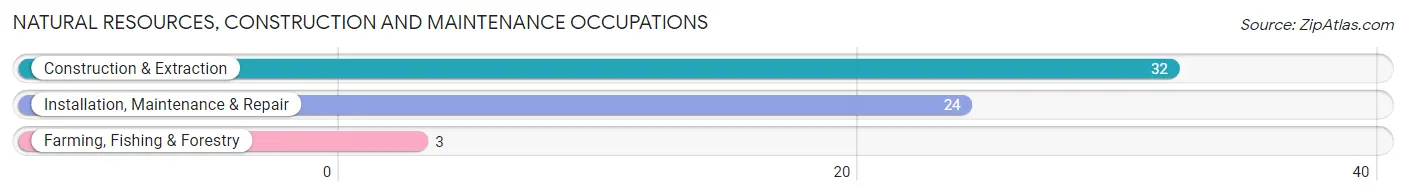
Natural Resources, Construction and Maintenance Occupations
The most common Natural Resources, Construction and Maintenance occupations in Camp Douglas are Construction & Extraction (32 | 10.7%), Installation, Maintenance & Repair (24 | 8.0%), and Farming, Fishing & Forestry (3 | 1.0%).
Natural Resources, Construction and Maintenance Occupations by Sex
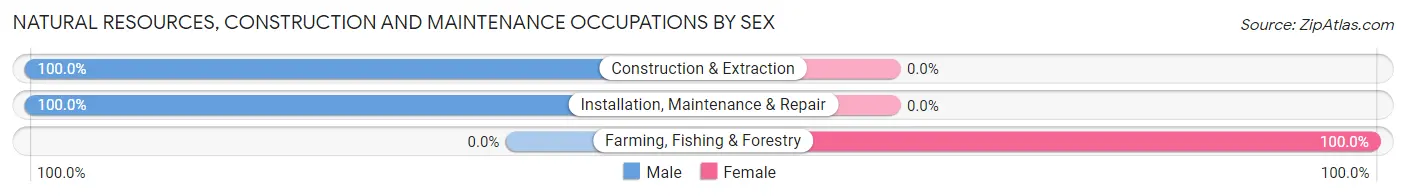
| Occupation | Male | Female |
| Farming, Fishing & Forestry | 0 (0.0%) | 3 (100.0%) |
| Construction & Extraction | 32 (100.0%) | 0 (0.0%) |
| Installation, Maintenance & Repair | 24 (100.0%) | 0 (0.0%) |
| Total (Category) | 56 (94.9%) | 3 (5.1%) |
| Total (Overall) | 154 (51.3%) | 146 (48.7%) |
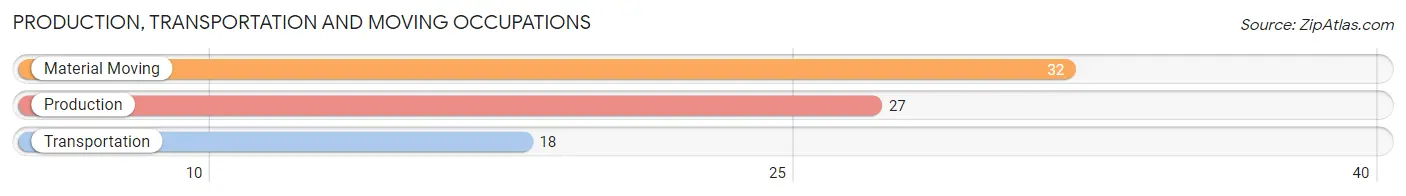
Production, Transportation and Moving Occupations
The most common Production, Transportation and Moving occupations in Camp Douglas are Material Moving (32 | 10.7%), Production (27 | 9.0%), and Transportation (18 | 6.0%).
Production, Transportation and Moving Occupations by Sex
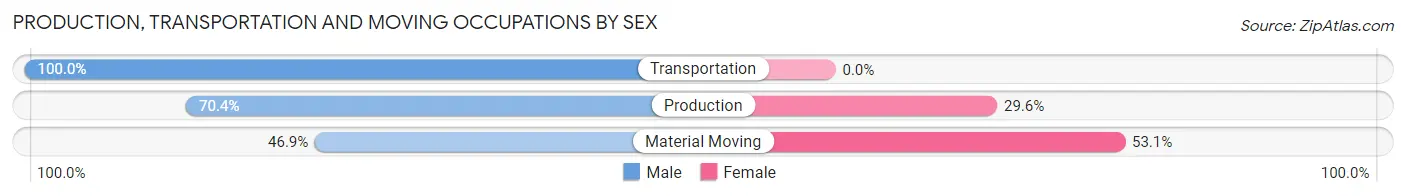
| Occupation | Male | Female |
| Production | 19 (70.4%) | 8 (29.6%) |
| Transportation | 18 (100.0%) | 0 (0.0%) |
| Material Moving | 15 (46.9%) | 17 (53.1%) |
| Total (Category) | 52 (67.5%) | 25 (32.5%) |
| Total (Overall) | 154 (51.3%) | 146 (48.7%) |
Employment Industries by Sex in Camp Douglas
Employment Industries in Camp Douglas
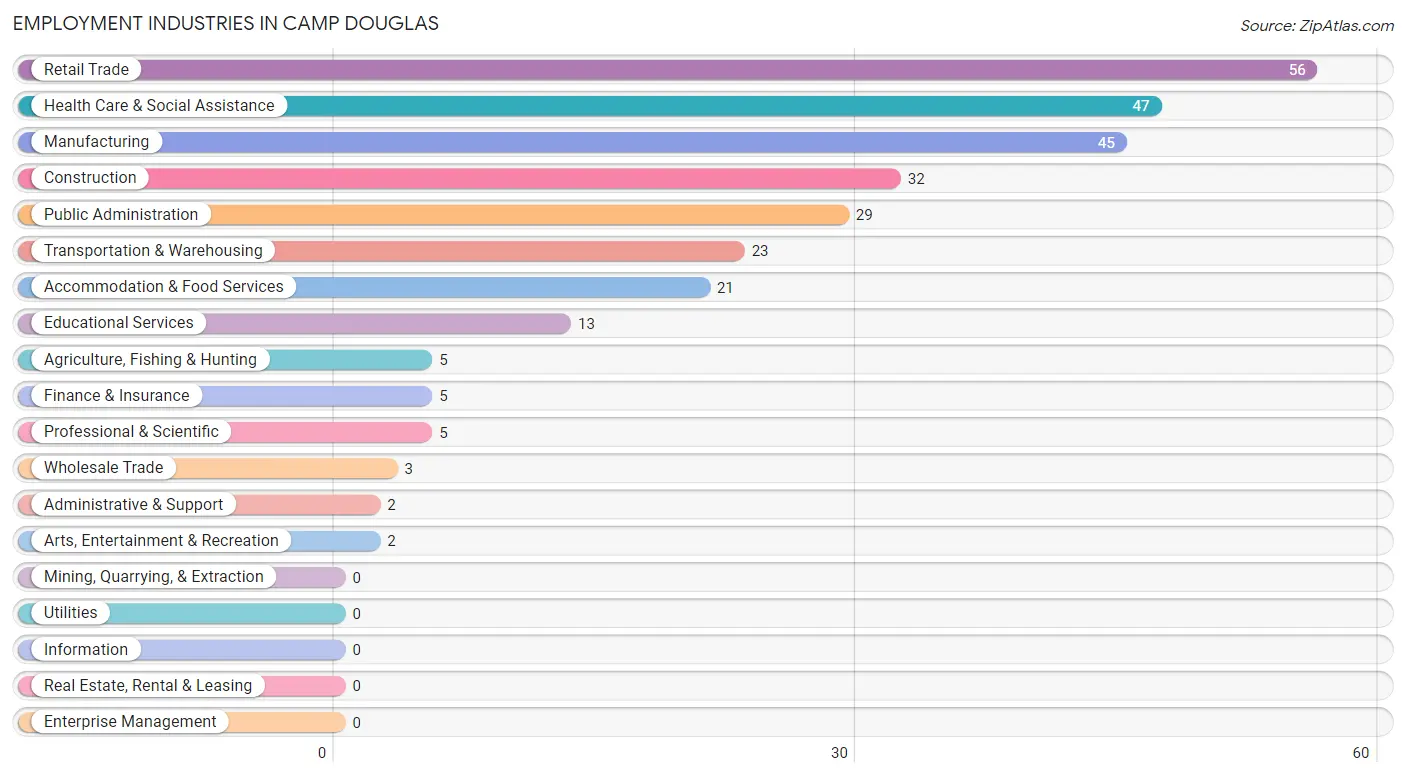
The major employment industries in Camp Douglas include Retail Trade (56 | 18.7%), Health Care & Social Assistance (47 | 15.7%), Manufacturing (45 | 15.0%), Construction (32 | 10.7%), and Public Administration (29 | 9.7%).
Employment Industries by Sex in Camp Douglas
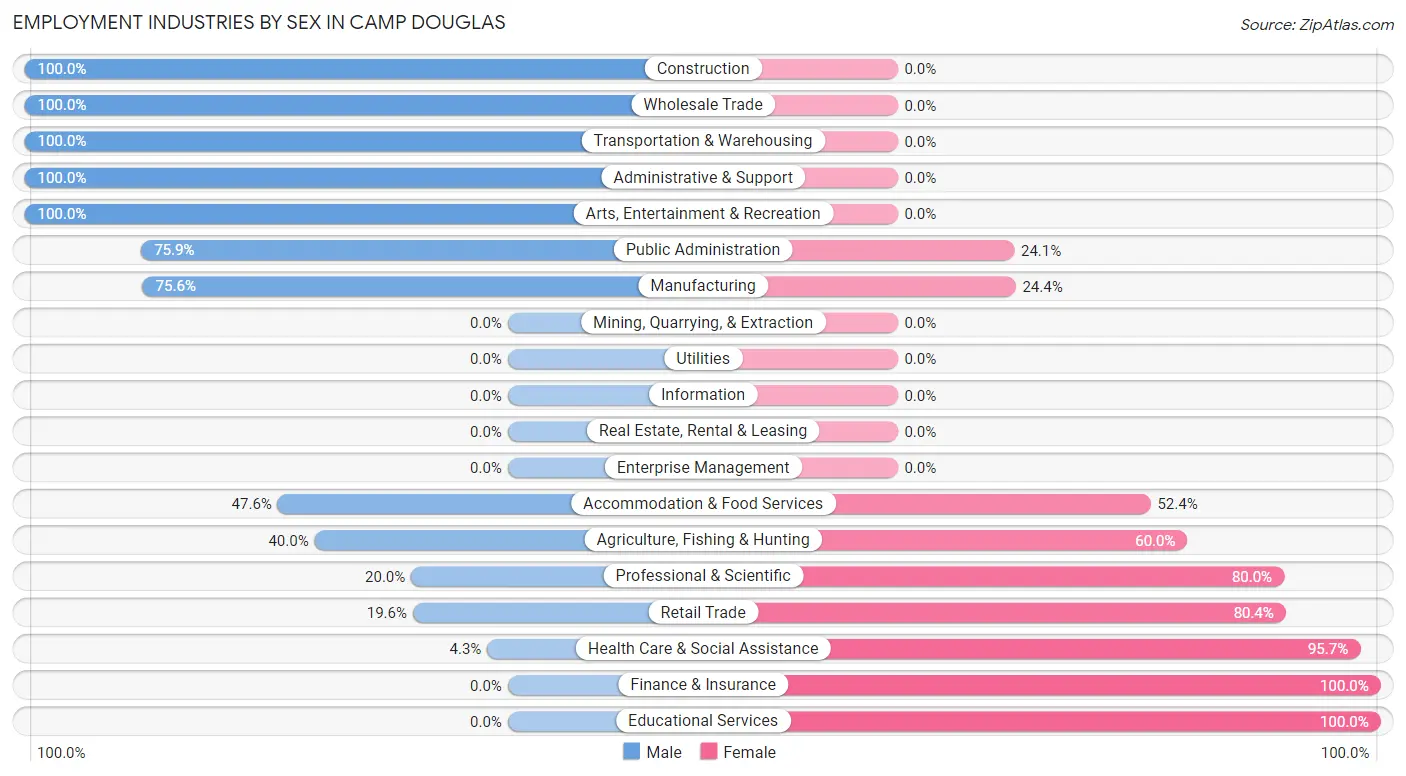
The Camp Douglas industries that see more men than women are Construction (100.0%), Wholesale Trade (100.0%), and Transportation & Warehousing (100.0%), whereas the industries that tend to have a higher number of women are Finance & Insurance (100.0%), Educational Services (100.0%), and Health Care & Social Assistance (95.7%).
| Industry | Male | Female |
| Agriculture, Fishing & Hunting | 2 (40.0%) | 3 (60.0%) |
| Mining, Quarrying, & Extraction | 0 (0.0%) | 0 (0.0%) |
| Construction | 32 (100.0%) | 0 (0.0%) |
| Manufacturing | 34 (75.6%) | 11 (24.4%) |
| Wholesale Trade | 3 (100.0%) | 0 (0.0%) |
| Retail Trade | 11 (19.6%) | 45 (80.4%) |
| Transportation & Warehousing | 23 (100.0%) | 0 (0.0%) |
| Utilities | 0 (0.0%) | 0 (0.0%) |
| Information | 0 (0.0%) | 0 (0.0%) |
| Finance & Insurance | 0 (0.0%) | 5 (100.0%) |
| Real Estate, Rental & Leasing | 0 (0.0%) | 0 (0.0%) |
| Professional & Scientific | 1 (20.0%) | 4 (80.0%) |
| Enterprise Management | 0 (0.0%) | 0 (0.0%) |
| Administrative & Support | 2 (100.0%) | 0 (0.0%) |
| Educational Services | 0 (0.0%) | 13 (100.0%) |
| Health Care & Social Assistance | 2 (4.3%) | 45 (95.7%) |
| Arts, Entertainment & Recreation | 2 (100.0%) | 0 (0.0%) |
| Accommodation & Food Services | 10 (47.6%) | 11 (52.4%) |
| Public Administration | 22 (75.9%) | 7 (24.1%) |
| Total | 154 (51.3%) | 146 (48.7%) |
Education in Camp Douglas
School Enrollment in Camp Douglas
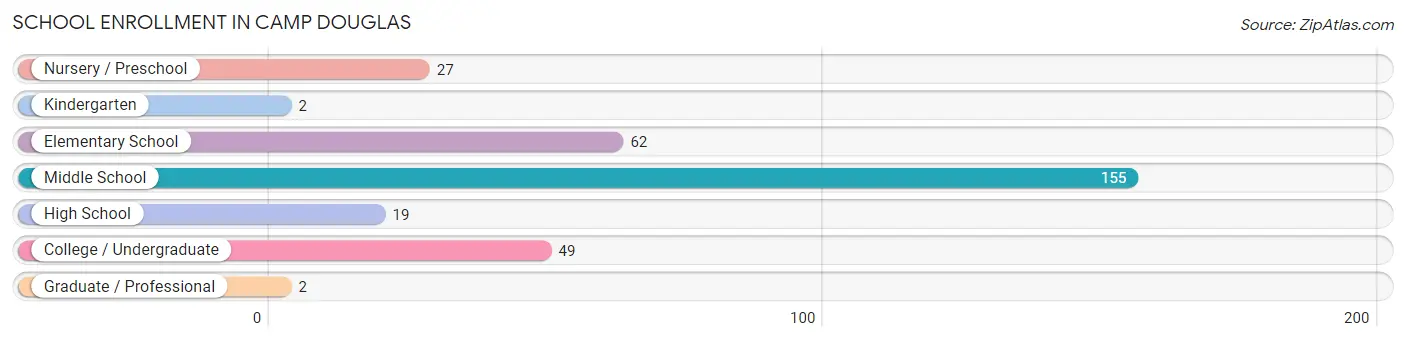
The most common levels of schooling among the 316 students in Camp Douglas are middle school (155 | 49.0%), elementary school (62 | 19.6%), and college / undergraduate (49 | 15.5%).
| School Level | # Students | % Students |
| Nursery / Preschool | 27 | 8.5% |
| Kindergarten | 2 | 0.6% |
| Elementary School | 62 | 19.6% |
| Middle School | 155 | 49.0% |
| High School | 19 | 6.0% |
| College / Undergraduate | 49 | 15.5% |
| Graduate / Professional | 2 | 0.6% |
| Total | 316 | 100.0% |
School Enrollment by Age by Funding Source in Camp Douglas
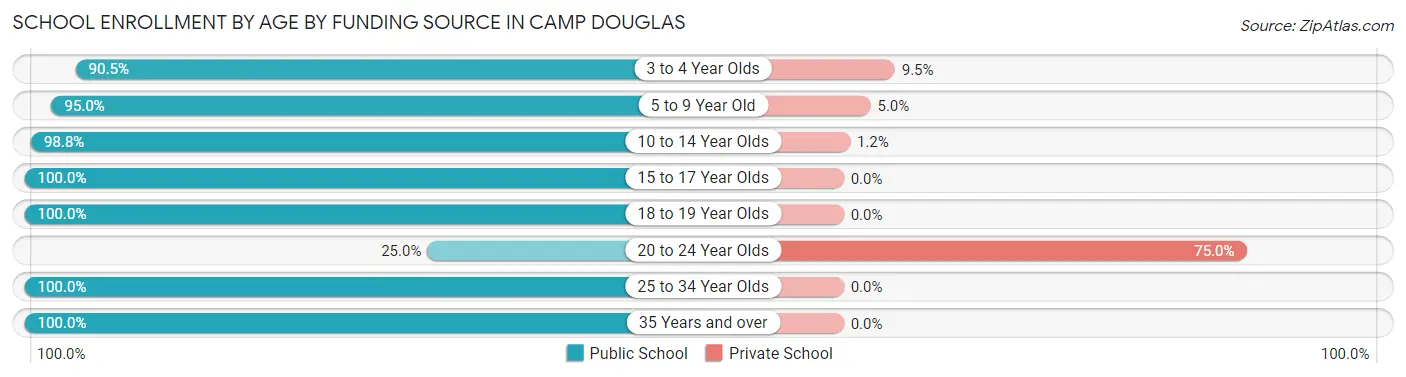
Out of a total of 316 students who are enrolled in schools in Camp Douglas, 16 (5.1%) attend a private institution, while the remaining 300 (94.9%) are enrolled in public schools. The age group of 20 to 24 year olds has the highest likelihood of being enrolled in private schools, with 9 (75.0% in the age bracket) enrolled. Conversely, the age group of 15 to 17 year olds has the lowest likelihood of being enrolled in a private school, with 12 (100.0% in the age bracket) attending a public institution.
| Age Bracket | Public School | Private School |
| 3 to 4 Year Olds | 19 (90.5%) | 2 (9.5%) |
| 5 to 9 Year Old | 57 (95.0%) | 3 (5.0%) |
| 10 to 14 Year Olds | 167 (98.8%) | 2 (1.2%) |
| 15 to 17 Year Olds | 12 (100.0%) | 0 (0.0%) |
| 18 to 19 Year Olds | 10 (100.0%) | 0 (0.0%) |
| 20 to 24 Year Olds | 3 (25.0%) | 9 (75.0%) |
| 25 to 34 Year Olds | 13 (100.0%) | 0 (0.0%) |
| 35 Years and over | 19 (100.0%) | 0 (0.0%) |
| Total | 300 (94.9%) | 16 (5.1%) |
Educational Attainment by Field of Study in Camp Douglas
Science & technology (13 | 34.2%), arts & humanities (6 | 15.8%), business (5 | 13.2%), education (5 | 13.2%), and social sciences (4 | 10.5%) are the most common fields of study among 38 individuals in Camp Douglas who have obtained a bachelor's degree or higher.
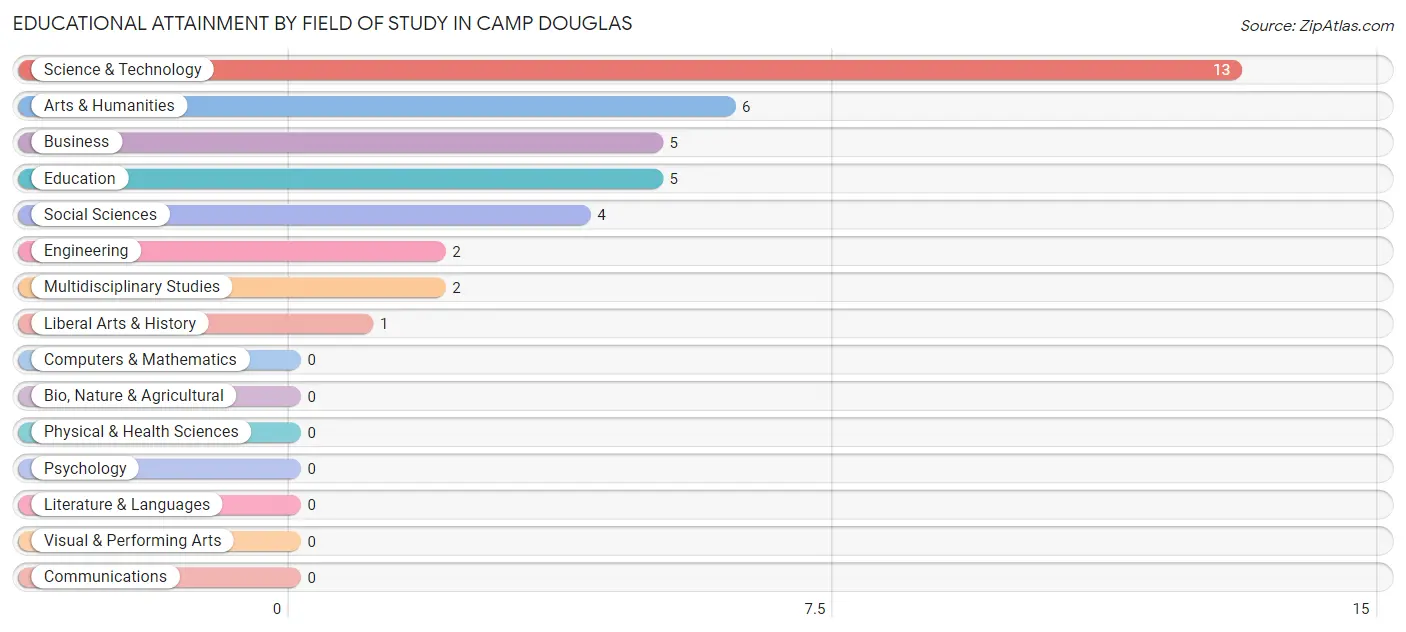
| Field of Study | # Graduates | % Graduates |
| Computers & Mathematics | 0 | 0.0% |
| Bio, Nature & Agricultural | 0 | 0.0% |
| Physical & Health Sciences | 0 | 0.0% |
| Psychology | 0 | 0.0% |
| Social Sciences | 4 | 10.5% |
| Engineering | 2 | 5.3% |
| Multidisciplinary Studies | 2 | 5.3% |
| Science & Technology | 13 | 34.2% |
| Business | 5 | 13.2% |
| Education | 5 | 13.2% |
| Literature & Languages | 0 | 0.0% |
| Liberal Arts & History | 1 | 2.6% |
| Visual & Performing Arts | 0 | 0.0% |
| Communications | 0 | 0.0% |
| Arts & Humanities | 6 | 15.8% |
| Total | 38 | 100.0% |
Transportation & Commute in Camp Douglas
Vehicle Availability by Sex in Camp Douglas
The most prevalent vehicle ownership categories in Camp Douglas are males with 2 vehicles (85, accounting for 55.2%) and females with 2 vehicles (69, making up 59.4%).
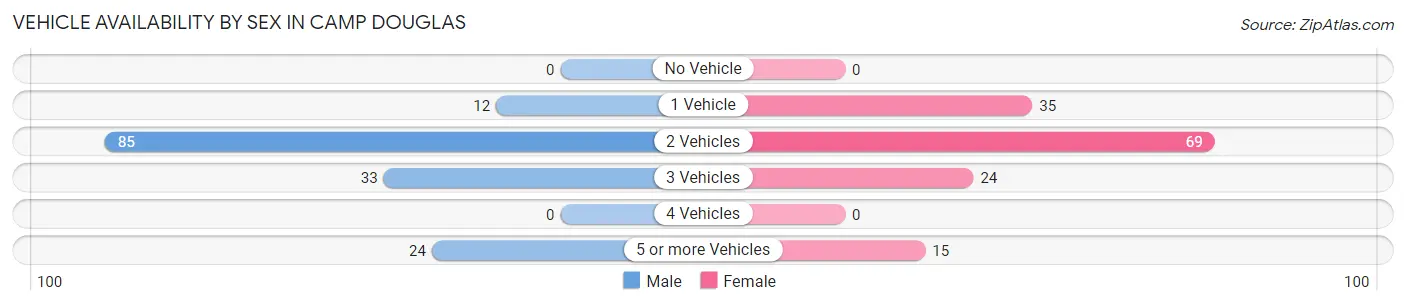
| Vehicles Available | Male | Female |
| No Vehicle | 0 (0.0%) | 0 (0.0%) |
| 1 Vehicle | 12 (7.8%) | 35 (24.5%) |
| 2 Vehicles | 85 (55.2%) | 69 (48.2%) |
| 3 Vehicles | 33 (21.4%) | 24 (16.8%) |
| 4 Vehicles | 0 (0.0%) | 0 (0.0%) |
| 5 or more Vehicles | 24 (15.6%) | 15 (10.5%) |
| Total | 154 (100.0%) | 143 (100.0%) |
Commute Time in Camp Douglas
The most frequently occuring commute durations in Camp Douglas are 20 to 24 minutes (61 commuters, 21.5%), 15 to 19 minutes (48 commuters, 17.0%), and 10 to 14 minutes (28 commuters, 9.9%).
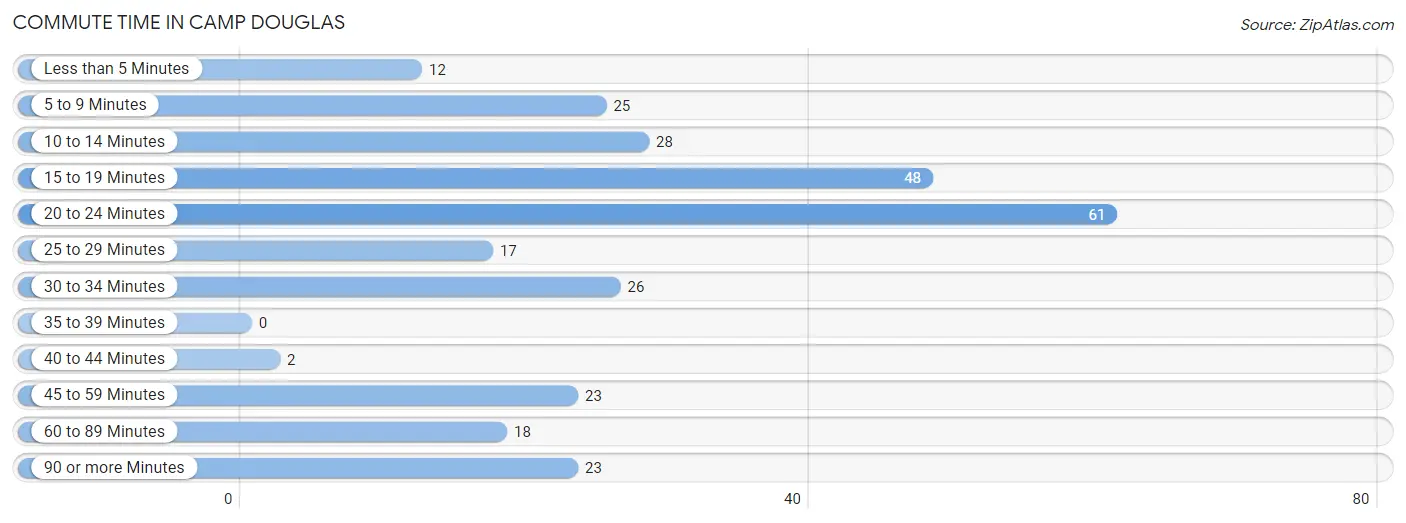
| Commute Time | # Commuters | % Commuters |
| Less than 5 Minutes | 12 | 4.2% |
| 5 to 9 Minutes | 25 | 8.8% |
| 10 to 14 Minutes | 28 | 9.9% |
| 15 to 19 Minutes | 48 | 17.0% |
| 20 to 24 Minutes | 61 | 21.5% |
| 25 to 29 Minutes | 17 | 6.0% |
| 30 to 34 Minutes | 26 | 9.2% |
| 35 to 39 Minutes | 0 | 0.0% |
| 40 to 44 Minutes | 2 | 0.7% |
| 45 to 59 Minutes | 23 | 8.1% |
| 60 to 89 Minutes | 18 | 6.4% |
| 90 or more Minutes | 23 | 8.1% |
Commute Time by Sex in Camp Douglas
The most common commute times in Camp Douglas are 20 to 24 minutes (34 commuters, 22.1%) for males and 20 to 24 minutes (27 commuters, 20.9%) for females.
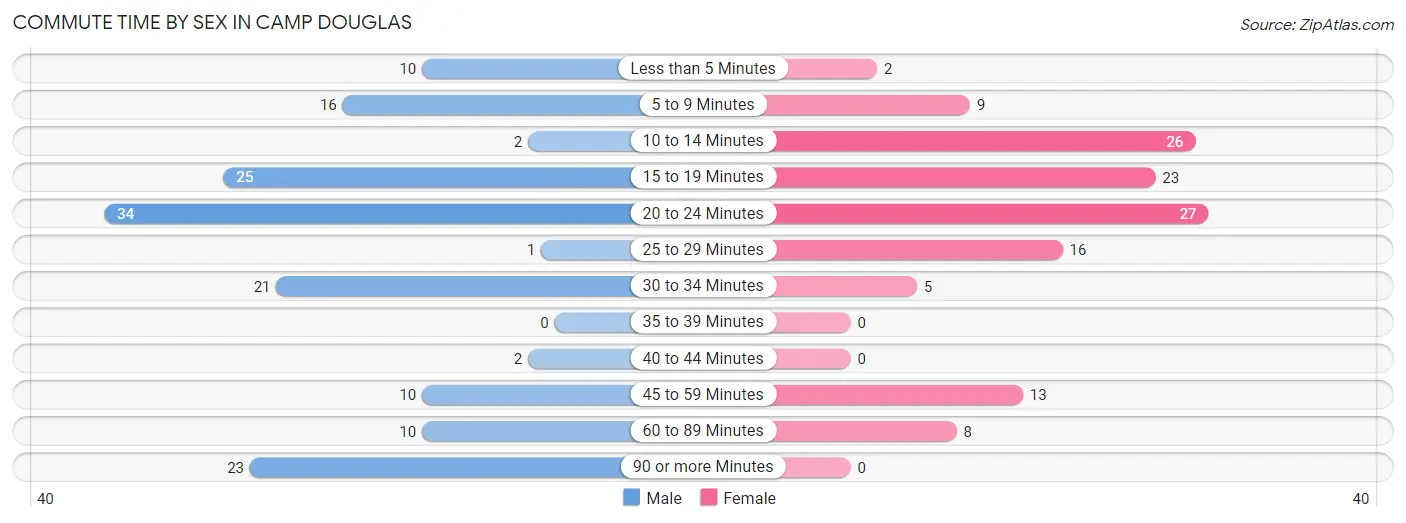
| Commute Time | Male | Female |
| Less than 5 Minutes | 10 (6.5%) | 2 (1.5%) |
| 5 to 9 Minutes | 16 (10.4%) | 9 (7.0%) |
| 10 to 14 Minutes | 2 (1.3%) | 26 (20.2%) |
| 15 to 19 Minutes | 25 (16.2%) | 23 (17.8%) |
| 20 to 24 Minutes | 34 (22.1%) | 27 (20.9%) |
| 25 to 29 Minutes | 1 (0.6%) | 16 (12.4%) |
| 30 to 34 Minutes | 21 (13.6%) | 5 (3.9%) |
| 35 to 39 Minutes | 0 (0.0%) | 0 (0.0%) |
| 40 to 44 Minutes | 2 (1.3%) | 0 (0.0%) |
| 45 to 59 Minutes | 10 (6.5%) | 13 (10.1%) |
| 60 to 89 Minutes | 10 (6.5%) | 8 (6.2%) |
| 90 or more Minutes | 23 (14.9%) | 0 (0.0%) |
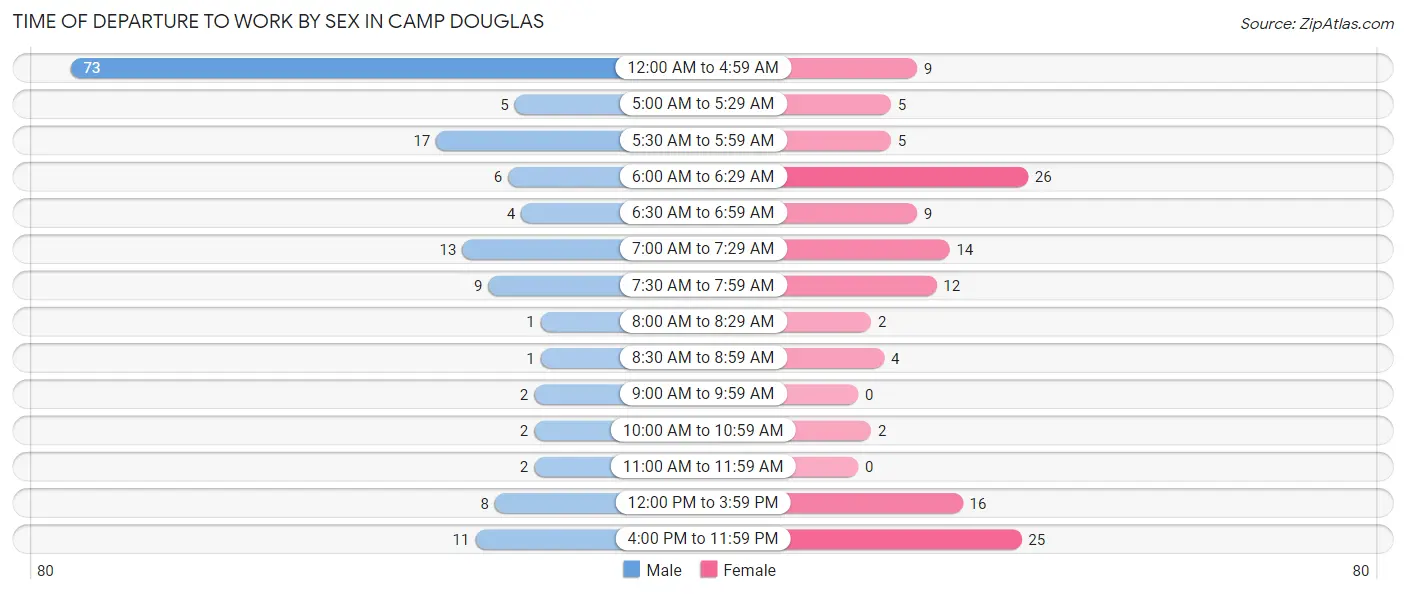
Time of Departure to Work by Sex in Camp Douglas
The most frequent times of departure to work in Camp Douglas are 12:00 AM to 4:59 AM (73, 47.4%) for males and 6:00 AM to 6:29 AM (26, 20.2%) for females.
| Time of Departure | Male | Female |
| 12:00 AM to 4:59 AM | 73 (47.4%) | 9 (7.0%) |
| 5:00 AM to 5:29 AM | 5 (3.3%) | 5 (3.9%) |
| 5:30 AM to 5:59 AM | 17 (11.0%) | 5 (3.9%) |
| 6:00 AM to 6:29 AM | 6 (3.9%) | 26 (20.2%) |
| 6:30 AM to 6:59 AM | 4 (2.6%) | 9 (7.0%) |
| 7:00 AM to 7:29 AM | 13 (8.4%) | 14 (10.8%) |
| 7:30 AM to 7:59 AM | 9 (5.8%) | 12 (9.3%) |
| 8:00 AM to 8:29 AM | 1 (0.6%) | 2 (1.5%) |
| 8:30 AM to 8:59 AM | 1 (0.6%) | 4 (3.1%) |
| 9:00 AM to 9:59 AM | 2 (1.3%) | 0 (0.0%) |
| 10:00 AM to 10:59 AM | 2 (1.3%) | 2 (1.5%) |
| 11:00 AM to 11:59 AM | 2 (1.3%) | 0 (0.0%) |
| 12:00 PM to 3:59 PM | 8 (5.2%) | 16 (12.4%) |
| 4:00 PM to 11:59 PM | 11 (7.1%) | 25 (19.4%) |
| Total | 154 (100.0%) | 129 (100.0%) |
Housing Occupancy in Camp Douglas
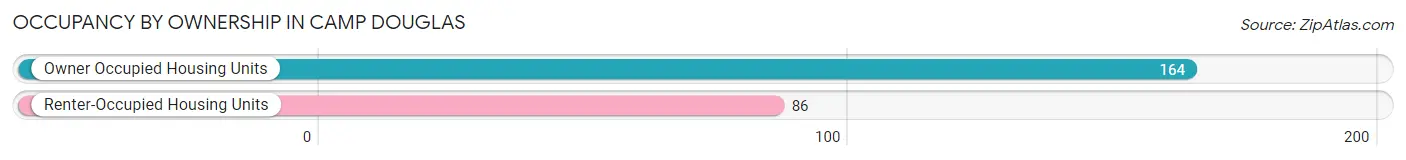
Occupancy by Ownership in Camp Douglas
Of the total 250 dwellings in Camp Douglas, owner-occupied units account for 164 (65.6%), while renter-occupied units make up 86 (34.4%).
| Occupancy | # Housing Units | % Housing Units |
| Owner Occupied Housing Units | 164 | 65.6% |
| Renter-Occupied Housing Units | 86 | 34.4% |
| Total Occupied Housing Units | 250 | 100.0% |
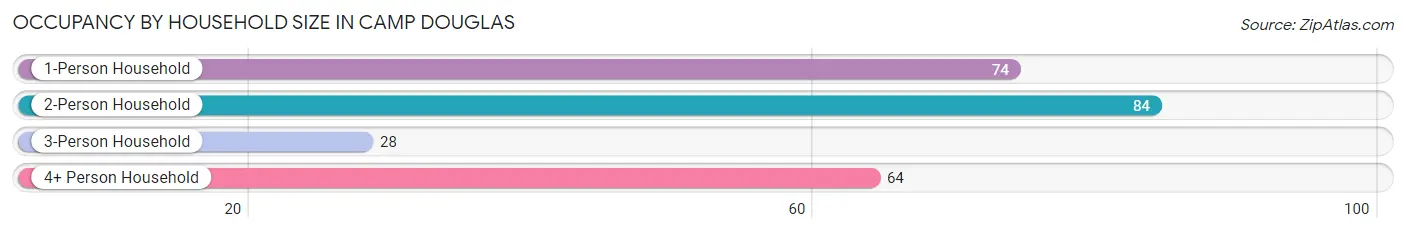
Occupancy by Household Size in Camp Douglas
| Household Size | # Housing Units | % Housing Units |
| 1-Person Household | 74 | 29.6% |
| 2-Person Household | 84 | 33.6% |
| 3-Person Household | 28 | 11.2% |
| 4+ Person Household | 64 | 25.6% |
| Total Housing Units | 250 | 100.0% |
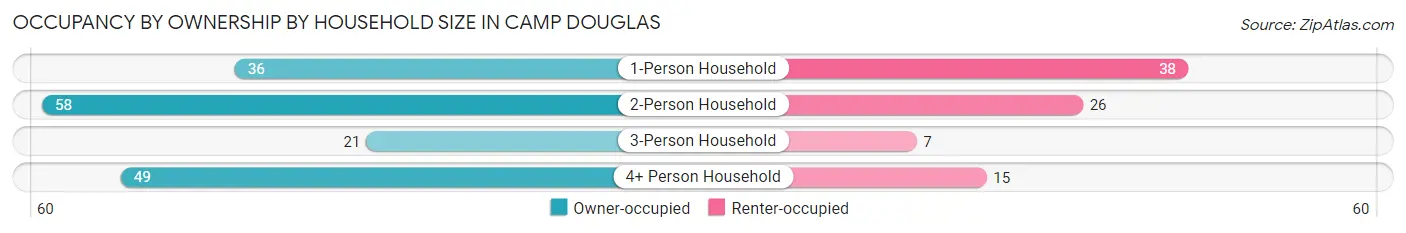
Occupancy by Ownership by Household Size in Camp Douglas
| Household Size | Owner-occupied | Renter-occupied |
| 1-Person Household | 36 (48.6%) | 38 (51.3%) |
| 2-Person Household | 58 (69.1%) | 26 (30.9%) |
| 3-Person Household | 21 (75.0%) | 7 (25.0%) |
| 4+ Person Household | 49 (76.6%) | 15 (23.4%) |
| Total Housing Units | 164 (65.6%) | 86 (34.4%) |
Occupancy by Educational Attainment in Camp Douglas

| Household Size | Owner-occupied | Renter-occupied |
| Less than High School | 7 (43.8%) | 9 (56.2%) |
| High School Diploma | 64 (61.5%) | 40 (38.5%) |
| College/Associate Degree | 68 (67.3%) | 33 (32.7%) |
| Bachelor's Degree or higher | 25 (86.2%) | 4 (13.8%) |
Occupancy by Age of Householder in Camp Douglas
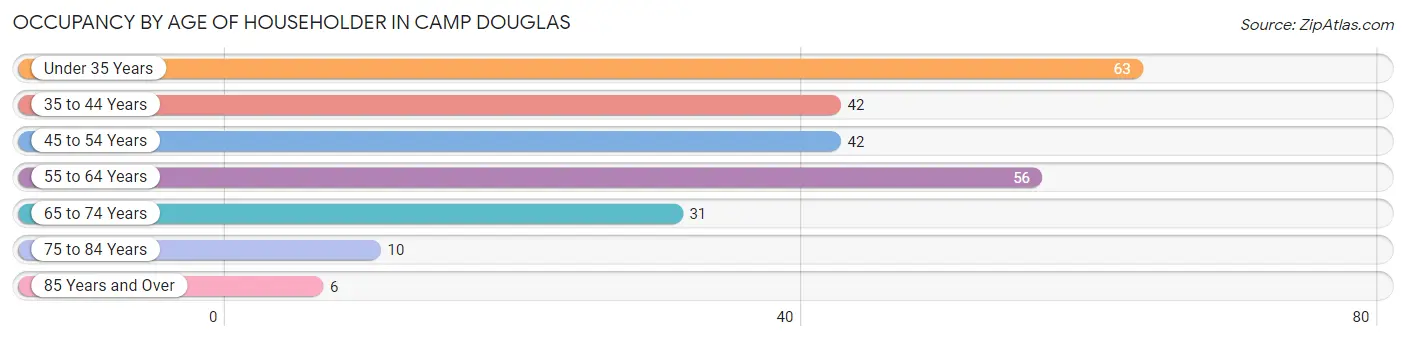
| Age Bracket | # Households | % Households |
| Under 35 Years | 63 | 25.2% |
| 35 to 44 Years | 42 | 16.8% |
| 45 to 54 Years | 42 | 16.8% |
| 55 to 64 Years | 56 | 22.4% |
| 65 to 74 Years | 31 | 12.4% |
| 75 to 84 Years | 10 | 4.0% |
| 85 Years and Over | 6 | 2.4% |
| Total | 250 | 100.0% |
Housing Finances in Camp Douglas
Median Income by Occupancy in Camp Douglas
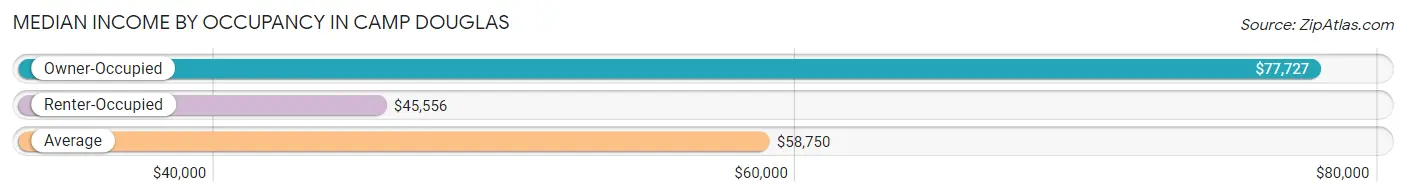
| Occupancy Type | # Households | Median Income |
| Owner-Occupied | 164 (65.6%) | $77,727 |
| Renter-Occupied | 86 (34.4%) | $45,556 |
| Average | 250 (100.0%) | $58,750 |
Occupancy by Householder Income Bracket in Camp Douglas
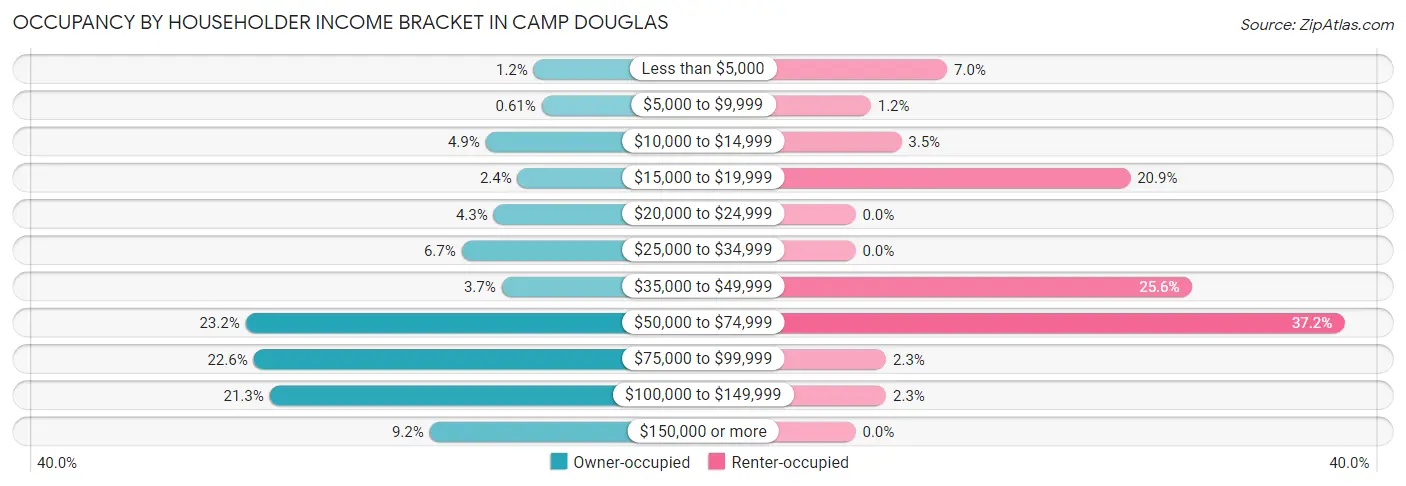
| Income Bracket | Owner-occupied | Renter-occupied |
| Less than $5,000 | 2 (1.2%) | 6 (7.0%) |
| $5,000 to $9,999 | 1 (0.6%) | 1 (1.2%) |
| $10,000 to $14,999 | 8 (4.9%) | 3 (3.5%) |
| $15,000 to $19,999 | 4 (2.4%) | 18 (20.9%) |
| $20,000 to $24,999 | 7 (4.3%) | 0 (0.0%) |
| $25,000 to $34,999 | 11 (6.7%) | 0 (0.0%) |
| $35,000 to $49,999 | 6 (3.7%) | 22 (25.6%) |
| $50,000 to $74,999 | 38 (23.2%) | 32 (37.2%) |
| $75,000 to $99,999 | 37 (22.6%) | 2 (2.3%) |
| $100,000 to $149,999 | 35 (21.3%) | 2 (2.3%) |
| $150,000 or more | 15 (9.1%) | 0 (0.0%) |
| Total | 164 (100.0%) | 86 (100.0%) |
Monthly Housing Cost Tiers in Camp Douglas
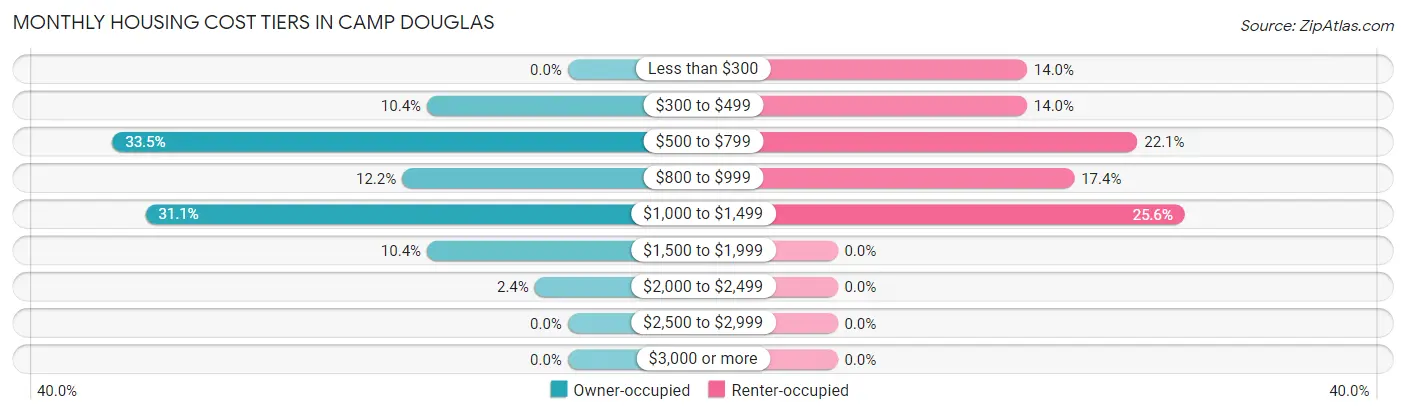
| Monthly Cost | Owner-occupied | Renter-occupied |
| Less than $300 | 0 (0.0%) | 12 (14.0%) |
| $300 to $499 | 17 (10.4%) | 12 (14.0%) |
| $500 to $799 | 55 (33.5%) | 19 (22.1%) |
| $800 to $999 | 20 (12.2%) | 15 (17.4%) |
| $1,000 to $1,499 | 51 (31.1%) | 22 (25.6%) |
| $1,500 to $1,999 | 17 (10.4%) | 0 (0.0%) |
| $2,000 to $2,499 | 4 (2.4%) | 0 (0.0%) |
| $2,500 to $2,999 | 0 (0.0%) | 0 (0.0%) |
| $3,000 or more | 0 (0.0%) | 0 (0.0%) |
| Total | 164 (100.0%) | 86 (100.0%) |
Physical Housing Characteristics in Camp Douglas
Housing Structures in Camp Douglas
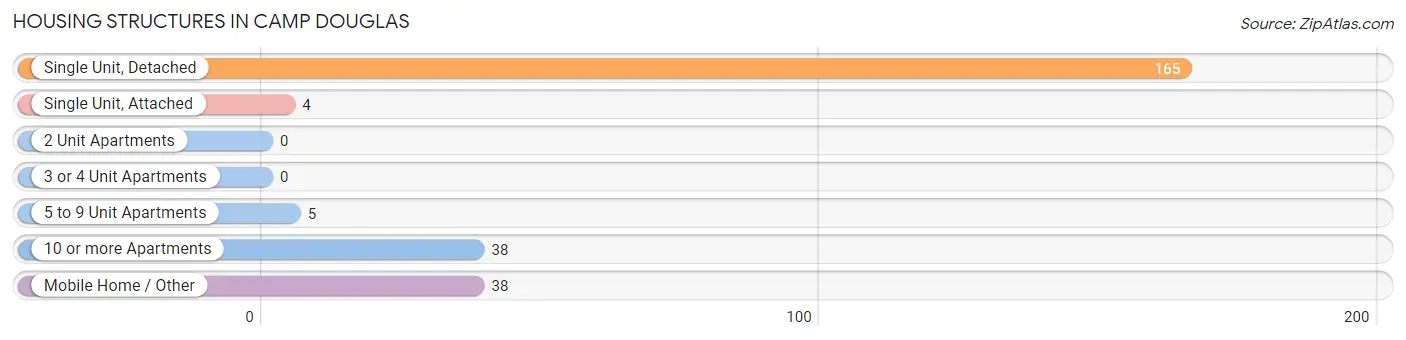
| Structure Type | # Housing Units | % Housing Units |
| Single Unit, Detached | 165 | 66.0% |
| Single Unit, Attached | 4 | 1.6% |
| 2 Unit Apartments | 0 | 0.0% |
| 3 or 4 Unit Apartments | 0 | 0.0% |
| 5 to 9 Unit Apartments | 5 | 2.0% |
| 10 or more Apartments | 38 | 15.2% |
| Mobile Home / Other | 38 | 15.2% |
| Total | 250 | 100.0% |
Housing Structures by Occupancy in Camp Douglas
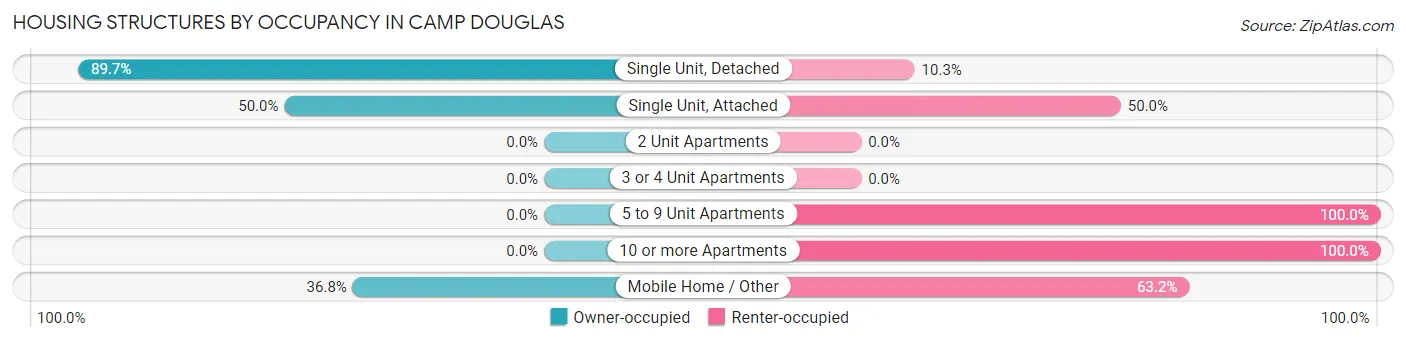
| Structure Type | Owner-occupied | Renter-occupied |
| Single Unit, Detached | 148 (89.7%) | 17 (10.3%) |
| Single Unit, Attached | 2 (50.0%) | 2 (50.0%) |
| 2 Unit Apartments | 0 (0.0%) | 0 (0.0%) |
| 3 or 4 Unit Apartments | 0 (0.0%) | 0 (0.0%) |
| 5 to 9 Unit Apartments | 0 (0.0%) | 5 (100.0%) |
| 10 or more Apartments | 0 (0.0%) | 38 (100.0%) |
| Mobile Home / Other | 14 (36.8%) | 24 (63.2%) |
| Total | 164 (65.6%) | 86 (34.4%) |
Housing Structures by Number of Rooms in Camp Douglas
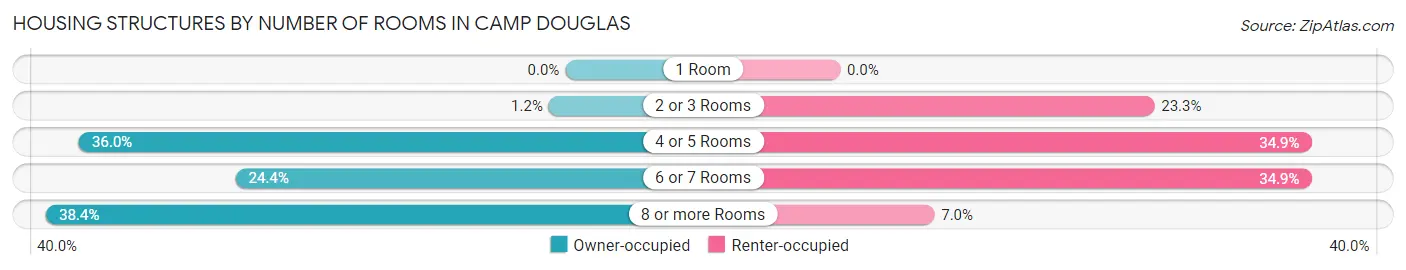
| Number of Rooms | Owner-occupied | Renter-occupied |
| 1 Room | 0 (0.0%) | 0 (0.0%) |
| 2 or 3 Rooms | 2 (1.2%) | 20 (23.3%) |
| 4 or 5 Rooms | 59 (36.0%) | 30 (34.9%) |
| 6 or 7 Rooms | 40 (24.4%) | 30 (34.9%) |
| 8 or more Rooms | 63 (38.4%) | 6 (7.0%) |
| Total | 164 (100.0%) | 86 (100.0%) |
Housing Structure by Heating Type in Camp Douglas
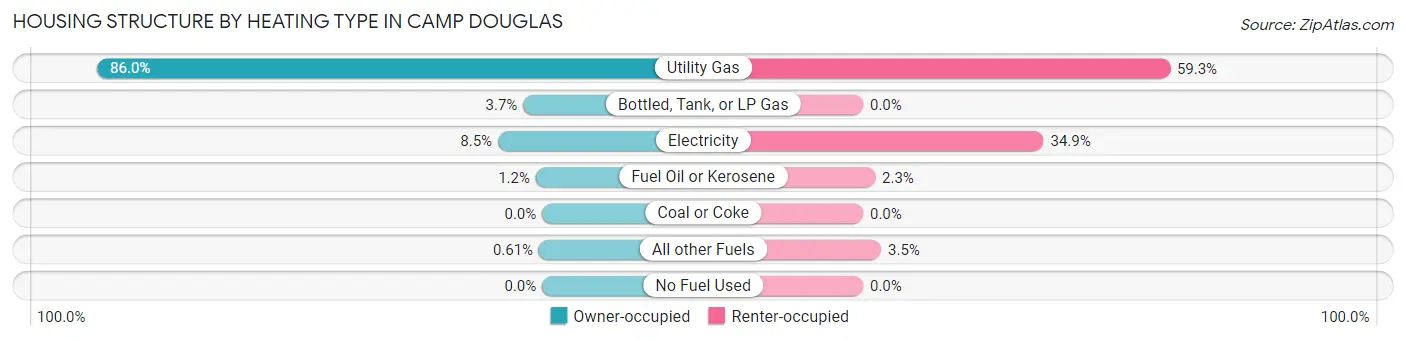
| Heating Type | Owner-occupied | Renter-occupied |
| Utility Gas | 141 (86.0%) | 51 (59.3%) |
| Bottled, Tank, or LP Gas | 6 (3.7%) | 0 (0.0%) |
| Electricity | 14 (8.5%) | 30 (34.9%) |
| Fuel Oil or Kerosene | 2 (1.2%) | 2 (2.3%) |
| Coal or Coke | 0 (0.0%) | 0 (0.0%) |
| All other Fuels | 1 (0.6%) | 3 (3.5%) |
| No Fuel Used | 0 (0.0%) | 0 (0.0%) |
| Total | 164 (100.0%) | 86 (100.0%) |
Household Vehicle Usage in Camp Douglas

| Vehicles per Household | Owner-occupied | Renter-occupied |
| No Vehicle | 2 (1.2%) | 0 (0.0%) |
| 1 Vehicle | 32 (19.5%) | 59 (68.6%) |
| 2 Vehicles | 88 (53.7%) | 23 (26.7%) |
| 3 or more Vehicles | 42 (25.6%) | 4 (4.6%) |
| Total | 164 (100.0%) | 86 (100.0%) |
Real Estate & Mortgages in Camp Douglas
Real Estate and Mortgage Overview in Camp Douglas
| Characteristic | Without Mortgage | With Mortgage |
| Housing Units | 58 | 106 |
| Median Property Value | $103,800 | $112,500 |
| Median Household Income | $56,250 | $13 |
| Monthly Housing Costs | $550 | $0 |
| Real Estate Taxes | $2,263 | $0 |
Property Value by Mortgage Status in Camp Douglas
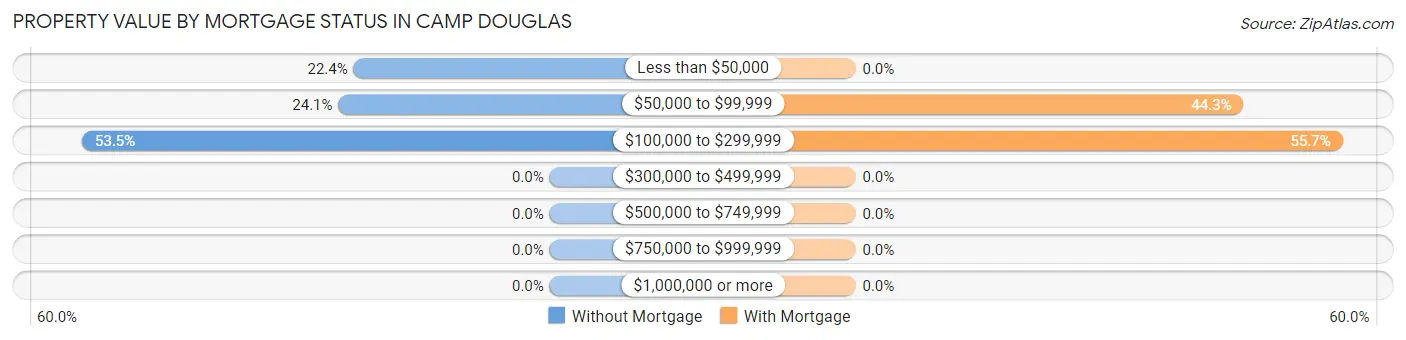
| Property Value | Without Mortgage | With Mortgage |
| Less than $50,000 | 13 (22.4%) | 0 (0.0%) |
| $50,000 to $99,999 | 14 (24.1%) | 47 (44.3%) |
| $100,000 to $299,999 | 31 (53.4%) | 59 (55.7%) |
| $300,000 to $499,999 | 0 (0.0%) | 0 (0.0%) |
| $500,000 to $749,999 | 0 (0.0%) | 0 (0.0%) |
| $750,000 to $999,999 | 0 (0.0%) | 0 (0.0%) |
| $1,000,000 or more | 0 (0.0%) | 0 (0.0%) |
| Total | 58 (100.0%) | 106 (100.0%) |
Household Income by Mortgage Status in Camp Douglas
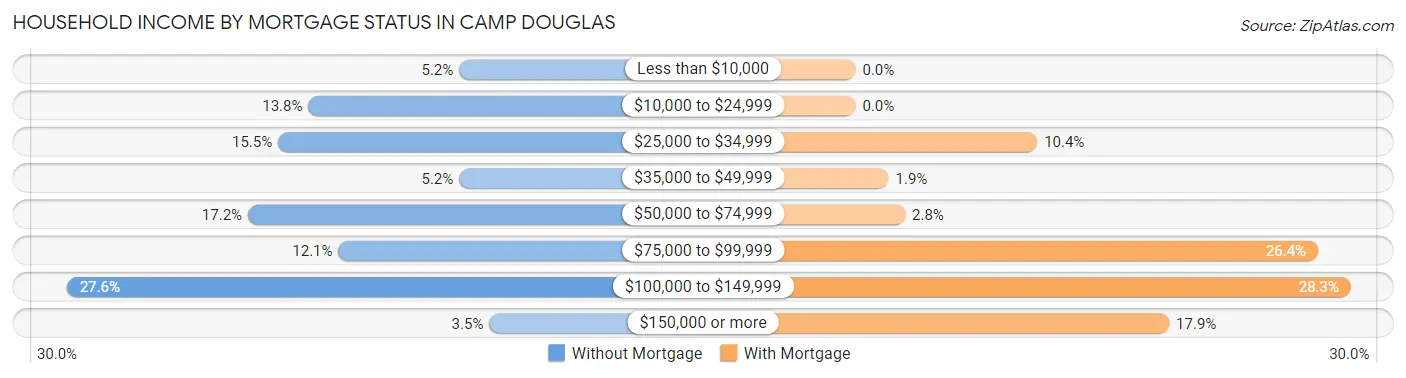
| Household Income | Without Mortgage | With Mortgage |
| Less than $10,000 | 3 (5.2%) | 0 (0.0%) |
| $10,000 to $24,999 | 8 (13.8%) | 0 (0.0%) |
| $25,000 to $34,999 | 9 (15.5%) | 11 (10.4%) |
| $35,000 to $49,999 | 3 (5.2%) | 2 (1.9%) |
| $50,000 to $74,999 | 10 (17.2%) | 3 (2.8%) |
| $75,000 to $99,999 | 7 (12.1%) | 28 (26.4%) |
| $100,000 to $149,999 | 16 (27.6%) | 30 (28.3%) |
| $150,000 or more | 2 (3.5%) | 19 (17.9%) |
| Total | 58 (100.0%) | 106 (100.0%) |
Property Value to Household Income Ratio in Camp Douglas
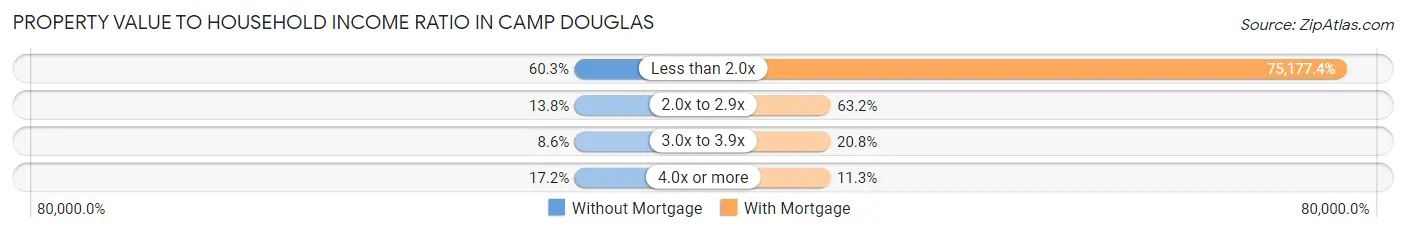
| Value-to-Income Ratio | Without Mortgage | With Mortgage |
| Less than 2.0x | 35 (60.3%) | 79,688 (75,177.4%) |
| 2.0x to 2.9x | 8 (13.8%) | 67 (63.2%) |
| 3.0x to 3.9x | 5 (8.6%) | 22 (20.7%) |
| 4.0x or more | 10 (17.2%) | 12 (11.3%) |
| Total | 58 (100.0%) | 106 (100.0%) |
Real Estate Taxes by Mortgage Status in Camp Douglas
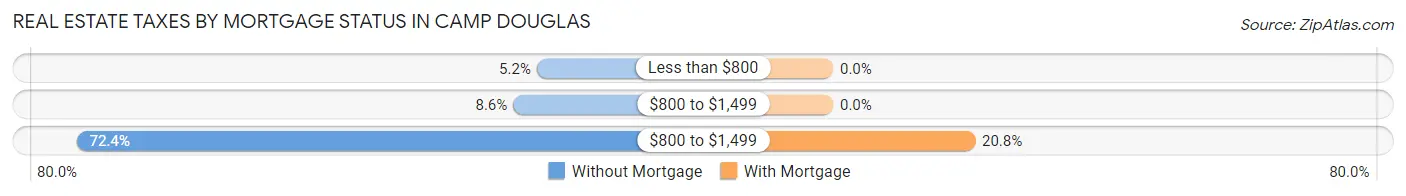
| Property Taxes | Without Mortgage | With Mortgage |
| Less than $800 | 3 (5.2%) | 0 (0.0%) |
| $800 to $1,499 | 5 (8.6%) | 0 (0.0%) |
| $800 to $1,499 | 42 (72.4%) | 22 (20.7%) |
| Total | 58 (100.0%) | 106 (100.0%) |
Health & Disability in Camp Douglas
Health Insurance Coverage by Age in Camp Douglas
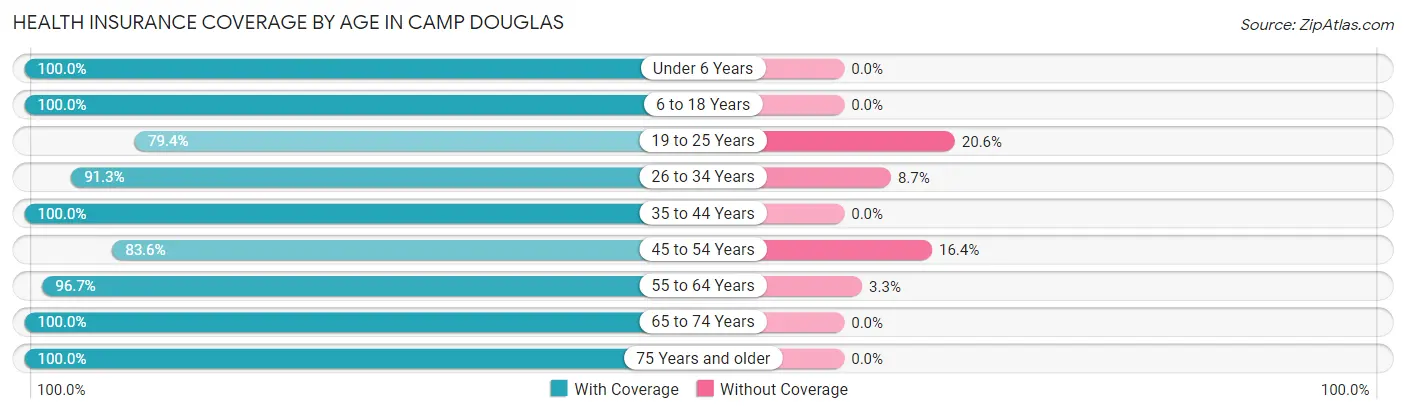
| Age Bracket | With Coverage | Without Coverage |
| Under 6 Years | 66 (100.0%) | 0 (0.0%) |
| 6 to 18 Years | 236 (100.0%) | 0 (0.0%) |
| 19 to 25 Years | 77 (79.4%) | 20 (20.6%) |
| 26 to 34 Years | 42 (91.3%) | 4 (8.7%) |
| 35 to 44 Years | 86 (100.0%) | 0 (0.0%) |
| 45 to 54 Years | 46 (83.6%) | 9 (16.4%) |
| 55 to 64 Years | 87 (96.7%) | 3 (3.3%) |
| 65 to 74 Years | 46 (100.0%) | 0 (0.0%) |
| 75 Years and older | 17 (100.0%) | 0 (0.0%) |
| Total | 703 (95.1%) | 36 (4.9%) |
Health Insurance Coverage by Citizenship Status in Camp Douglas
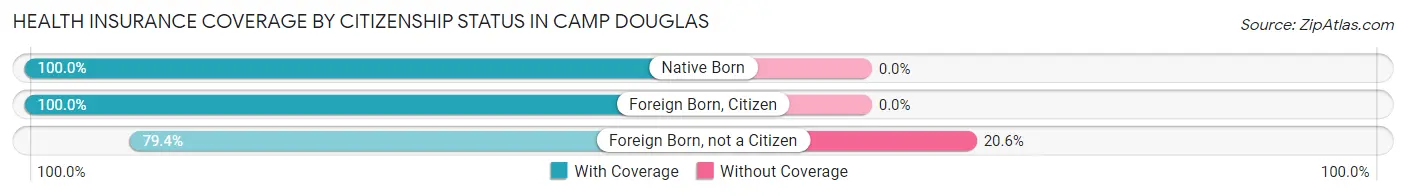
| Citizenship Status | With Coverage | Without Coverage |
| Native Born | 66 (100.0%) | 0 (0.0%) |
| Foreign Born, Citizen | 236 (100.0%) | 0 (0.0%) |
| Foreign Born, not a Citizen | 77 (79.4%) | 20 (20.6%) |
Health Insurance Coverage by Household Income in Camp Douglas
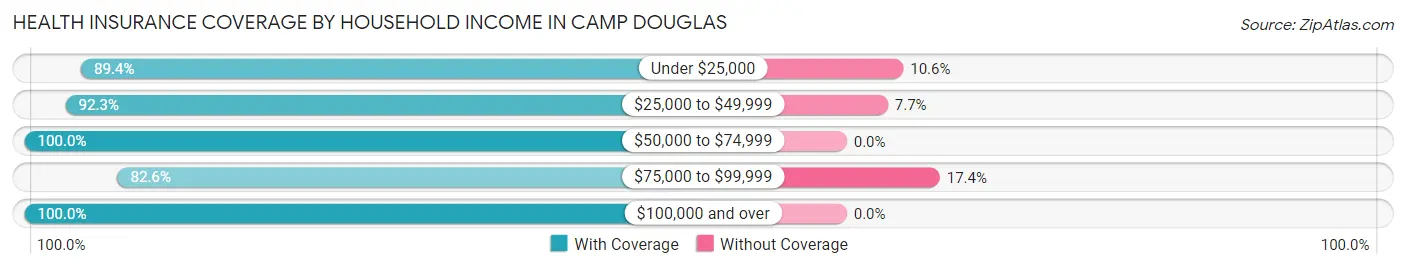
| Household Income | With Coverage | Without Coverage |
| Under $25,000 | 93 (89.4%) | 11 (10.6%) |
| $25,000 to $49,999 | 72 (92.3%) | 6 (7.7%) |
| $50,000 to $74,999 | 150 (100.0%) | 0 (0.0%) |
| $75,000 to $99,999 | 90 (82.6%) | 19 (17.4%) |
| $100,000 and over | 298 (100.0%) | 0 (0.0%) |
Public vs Private Health Insurance Coverage by Age in Camp Douglas
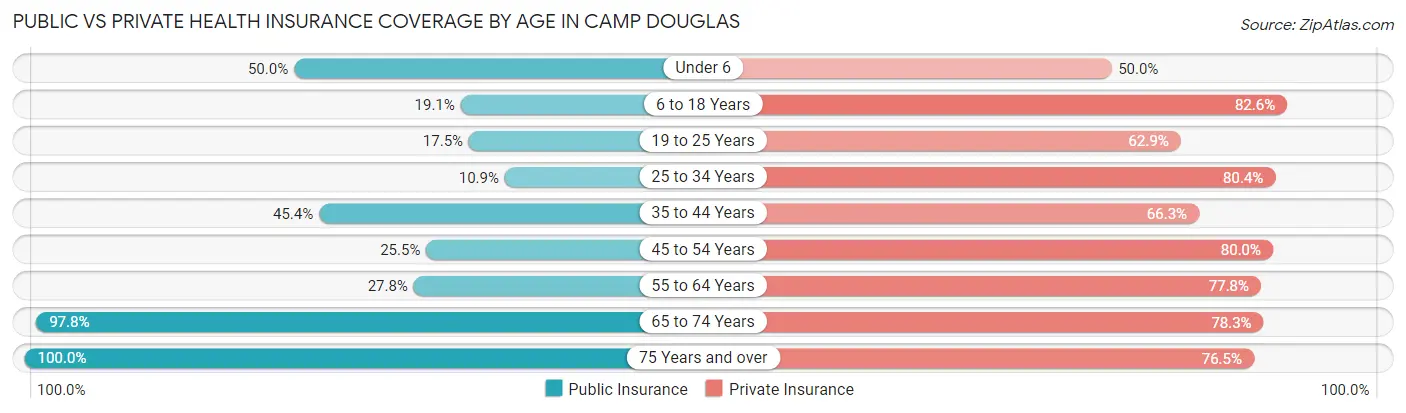
| Age Bracket | Public Insurance | Private Insurance |
| Under 6 | 33 (50.0%) | 33 (50.0%) |
| 6 to 18 Years | 45 (19.1%) | 195 (82.6%) |
| 19 to 25 Years | 17 (17.5%) | 61 (62.9%) |
| 25 to 34 Years | 5 (10.9%) | 37 (80.4%) |
| 35 to 44 Years | 39 (45.4%) | 57 (66.3%) |
| 45 to 54 Years | 14 (25.5%) | 44 (80.0%) |
| 55 to 64 Years | 25 (27.8%) | 70 (77.8%) |
| 65 to 74 Years | 45 (97.8%) | 36 (78.3%) |
| 75 Years and over | 17 (100.0%) | 13 (76.5%) |
| Total | 240 (32.5%) | 546 (73.9%) |
Disability Status by Sex by Age in Camp Douglas
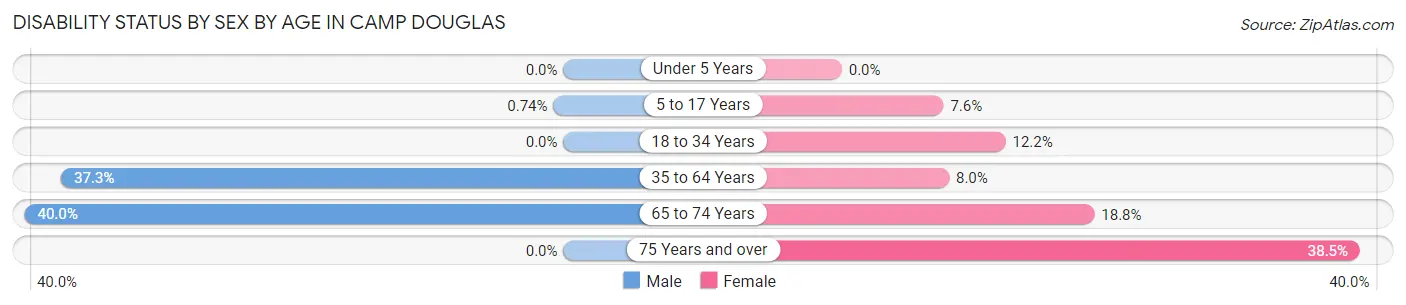
| Age Bracket | Male | Female |
| Under 5 Years | 0 (0.0%) | 0 (0.0%) |
| 5 to 17 Years | 1 (0.7%) | 8 (7.5%) |
| 18 to 34 Years | 0 (0.0%) | 9 (12.2%) |
| 35 to 64 Years | 44 (37.3%) | 9 (8.0%) |
| 65 to 74 Years | 12 (40.0%) | 3 (18.8%) |
| 75 Years and over | 0 (0.0%) | 5 (38.5%) |
Disability Class by Sex by Age in Camp Douglas
Disability Class: Hearing Difficulty
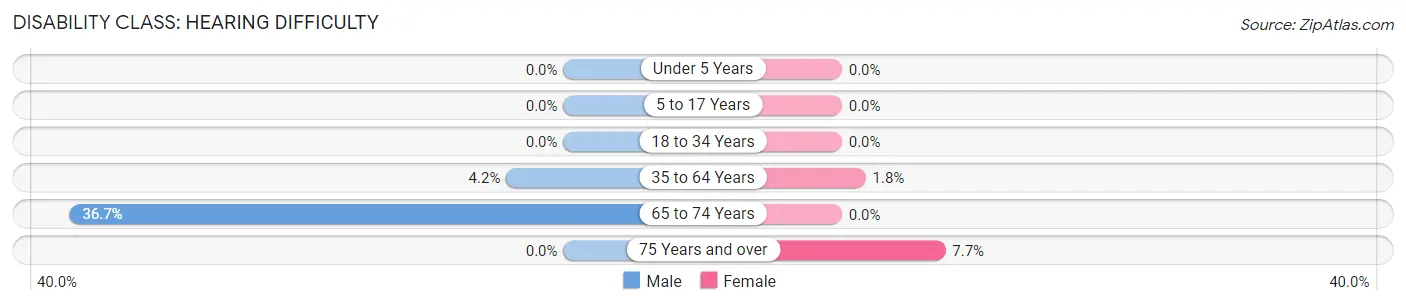
| Age Bracket | Male | Female |
| Under 5 Years | 0 (0.0%) | 0 (0.0%) |
| 5 to 17 Years | 0 (0.0%) | 0 (0.0%) |
| 18 to 34 Years | 0 (0.0%) | 0 (0.0%) |
| 35 to 64 Years | 5 (4.2%) | 2 (1.8%) |
| 65 to 74 Years | 11 (36.7%) | 0 (0.0%) |
| 75 Years and over | 0 (0.0%) | 1 (7.7%) |
Disability Class: Vision Difficulty
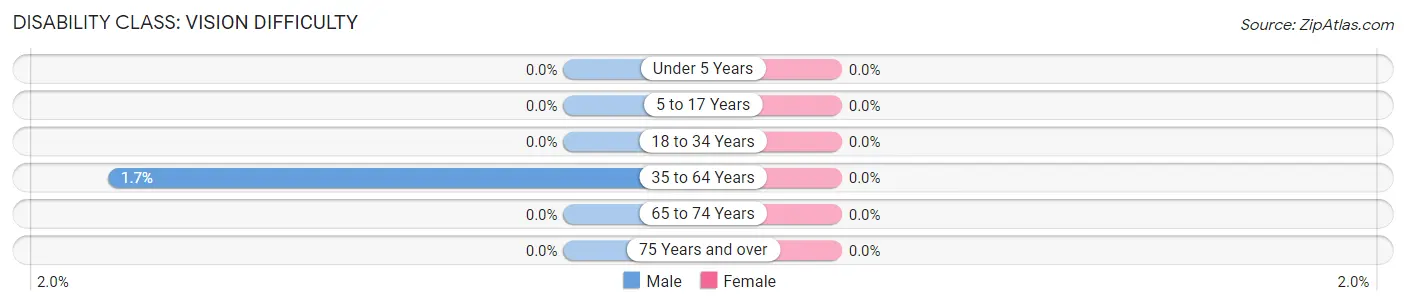
| Age Bracket | Male | Female |
| Under 5 Years | 0 (0.0%) | 0 (0.0%) |
| 5 to 17 Years | 0 (0.0%) | 0 (0.0%) |
| 18 to 34 Years | 0 (0.0%) | 0 (0.0%) |
| 35 to 64 Years | 2 (1.7%) | 0 (0.0%) |
| 65 to 74 Years | 0 (0.0%) | 0 (0.0%) |
| 75 Years and over | 0 (0.0%) | 0 (0.0%) |
Disability Class: Cognitive Difficulty
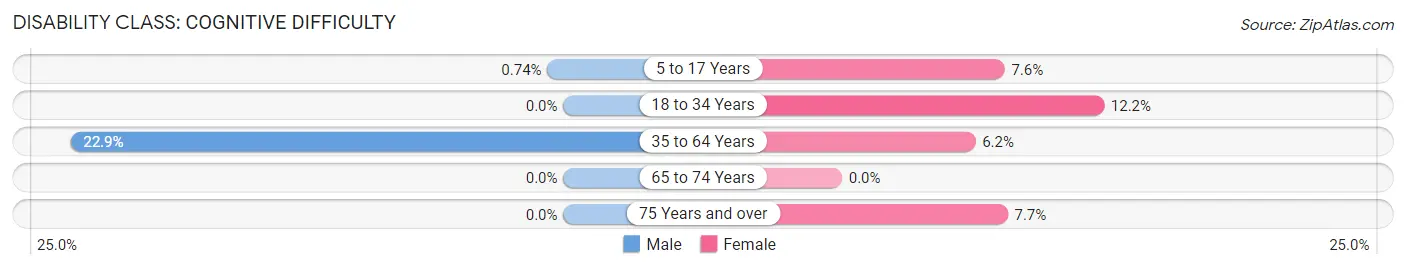
| Age Bracket | Male | Female |
| 5 to 17 Years | 1 (0.7%) | 8 (7.5%) |
| 18 to 34 Years | 0 (0.0%) | 9 (12.2%) |
| 35 to 64 Years | 27 (22.9%) | 7 (6.2%) |
| 65 to 74 Years | 0 (0.0%) | 0 (0.0%) |
| 75 Years and over | 0 (0.0%) | 1 (7.7%) |
Disability Class: Ambulatory Difficulty
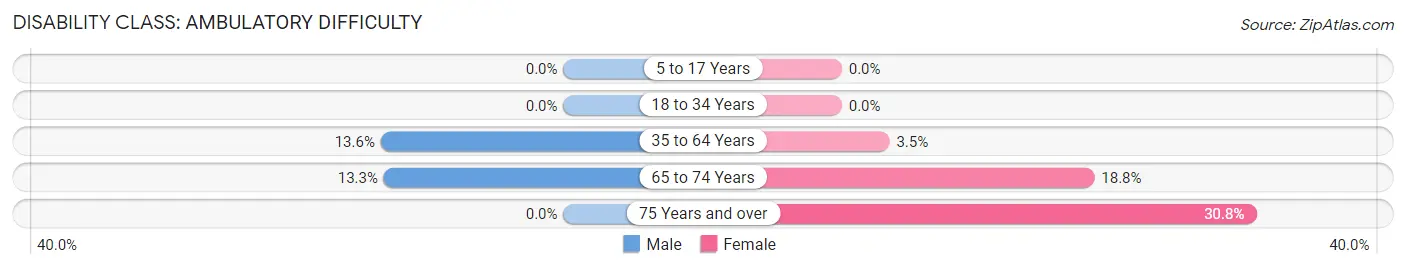
| Age Bracket | Male | Female |
| 5 to 17 Years | 0 (0.0%) | 0 (0.0%) |
| 18 to 34 Years | 0 (0.0%) | 0 (0.0%) |
| 35 to 64 Years | 16 (13.6%) | 4 (3.5%) |
| 65 to 74 Years | 4 (13.3%) | 3 (18.8%) |
| 75 Years and over | 0 (0.0%) | 4 (30.8%) |
Disability Class: Self-Care Difficulty
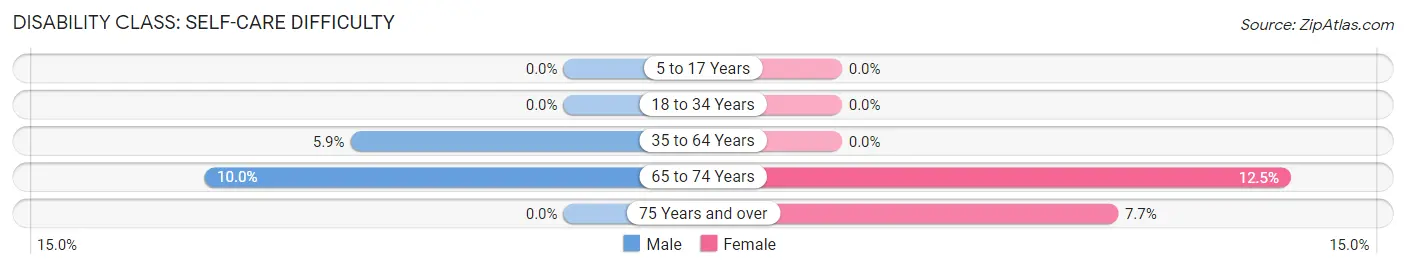
| Age Bracket | Male | Female |
| 5 to 17 Years | 0 (0.0%) | 0 (0.0%) |
| 18 to 34 Years | 0 (0.0%) | 0 (0.0%) |
| 35 to 64 Years | 7 (5.9%) | 0 (0.0%) |
| 65 to 74 Years | 3 (10.0%) | 2 (12.5%) |
| 75 Years and over | 0 (0.0%) | 1 (7.7%) |
Technology Access in Camp Douglas
Computing Device Access in Camp Douglas
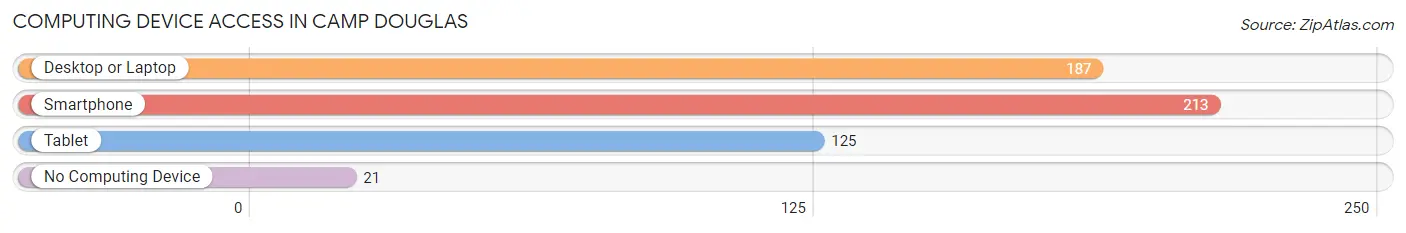
| Device Type | # Households | % Households |
| Desktop or Laptop | 187 | 74.8% |
| Smartphone | 213 | 85.2% |
| Tablet | 125 | 50.0% |
| No Computing Device | 21 | 8.4% |
| Total | 250 | 100.0% |
Internet Access in Camp Douglas
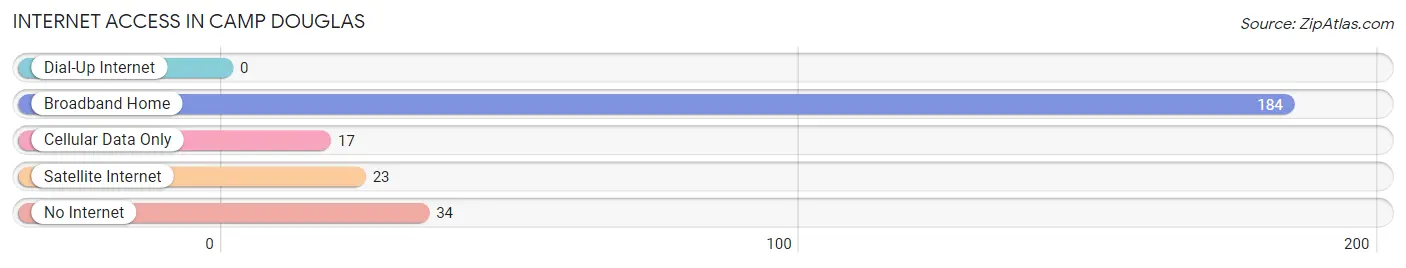
| Internet Type | # Households | % Households |
| Dial-Up Internet | 0 | 0.0% |
| Broadband Home | 184 | 73.6% |
| Cellular Data Only | 17 | 6.8% |
| Satellite Internet | 23 | 9.2% |
| No Internet | 34 | 13.6% |
| Total | 250 | 100.0% |
Camp Douglas Summary
Douglas, Wisconsin is a small village located in the southwestern corner of the state, in the county of Juneau. It is situated on the banks of the Wisconsin River, and is home to a population of just over 500 people. The village was founded in 1854 by a group of settlers from New York, and was named after Stephen A. Douglas, a prominent politician of the time.
History
The first settlers to arrive in Douglas were a group of New Yorkers led by Stephen A. Douglas. They arrived in 1854 and quickly established a small settlement. The village was officially incorporated in 1856, and the first post office was established in 1857. The village was named after Stephen A. Douglas, who had recently passed away.
The village grew slowly over the next few decades, and by the turn of the century, it had a population of just over 500 people. The economy of the village was largely based on agriculture, with many of the residents working as farmers. The village also had a few small businesses, such as a general store and a blacksmith shop.
In the early 1900s, the village began to experience a period of growth. The Wisconsin Central Railroad was built through the village in 1906, and this helped to spur economic development. The village also began to attract more tourists, as it was located near several popular lakes and rivers.
Geography
Douglas is located in the southwestern corner of Wisconsin, in the county of Juneau. It is situated on the banks of the Wisconsin River, and is surrounded by rolling hills and forests. The village is located about 25 miles south of the city of Madison, and about 50 miles west of Milwaukee.
The village has a total area of 0.7 square miles, all of which is land. The terrain is mostly flat, with some rolling hills in the surrounding area. The climate is humid continental, with cold winters and warm summers.
Economy
The economy of Douglas is largely based on agriculture and tourism. The village is home to several small farms, which produce a variety of crops, including corn, soybeans, and hay. The village also has a few small businesses, such as a general store and a blacksmith shop.
Tourism is also an important part of the local economy. The village is located near several popular lakes and rivers, and is a popular destination for fishing, boating, and other outdoor activities. The village also hosts several festivals and events throughout the year, which attract visitors from all over the region.
Demographics
As of the 2010 census, the population of Douglas was 514. The racial makeup of the village was 97.3% White, 0.6% African American, 0.2% Native American, 0.4% Asian, and 1.5% from other races. The median household income was $41,250, and the median family income was $50,000. The per capita income was $20,845.
Conclusion
Douglas, Wisconsin is a small village located in the southwestern corner of the state, in the county of Juneau. It is situated on the banks of the Wisconsin River, and is home to a population of just over 500 people. The village was founded in 1854 by a group of settlers from New York, and was named after Stephen A. Douglas, a prominent politician of the time. The economy of the village is largely based on agriculture and tourism, and the village is a popular destination for fishing, boating, and other outdoor activities. The population of Douglas is 97.3% White, 0.6% African American, 0.2% Native American, 0.4% Asian, and 1.5% from other races. The median household income was $41,250, and the median family income was $50,000.
Common Questions
What is the Total Population of Camp Douglas?
Total Population of Camp Douglas is 739.
What is the Total Male Population of Camp Douglas?
Total Male Population of Camp Douglas is 403.
What is the Total Female Population of Camp Douglas?
Total Female Population of Camp Douglas is 336.
What is the Ratio of Males per 100 Females in Camp Douglas?
There are 119.94 Males per 100 Females in Camp Douglas.
What is the Ratio of Females per 100 Males in Camp Douglas?
There are 83.37 Females per 100 Males in Camp Douglas.
What is the Median Population Age in Camp Douglas?
Median Population Age in Camp Douglas is 25.0 Years.
What is the Average Family Size in Camp Douglas
Average Family Size in Camp Douglas is 4.1 People.
What is the Average Household Size in Camp Douglas
Average Household Size in Camp Douglas is 3.0 People.
What is Per Capita Income in Camp Douglas?
Per Capita income in Camp Douglas is $22,994.
What is the Median Family Income in Camp Douglas?
Median Family Income in Camp Douglas is $78,250.
What is the Median Household income in Camp Douglas?
Median Household Income in Camp Douglas is $58,750.
What is Income or Wage Gap in Camp Douglas?
Income or Wage Gap in Camp Douglas is 42.1%.
Women in Camp Douglas earn 57.9 cents for every dollar earned by a man.
What is Family Income Deficit in Camp Douglas?
Family Income Deficit in Camp Douglas is $13,487.
Families that are below poverty line in Camp Douglas earn $13,487 less on average than the poverty threshold level.
What is Inequality or Gini Index in Camp Douglas?
Inequality or Gini Index in Camp Douglas is 0.36.
How Large is the Labor Force in Camp Douglas?
There are 311 People in the Labor Forcein in Camp Douglas.
What is the Percentage of People in the Labor Force in Camp Douglas?
69.9% of People are in the Labor Force in Camp Douglas.
What is the Unemployment Rate in Camp Douglas?
Unemployment Rate in Camp Douglas is 3.5%.