Winnebago County, WI
Winnebago County Map
Winnebago County Overview
171,197
TOTAL POPULATION
87,117
MALE POPULATION
84,080
FEMALE POPULATION
103.61
MALES / 100 FEMALES
96.51
FEMALES / 100 MALES
38.4
MEDIAN AGE
2.9
AVG FAMILY SIZE
2.3
AVG HOUSEHOLD SIZE
$37,983
PER CAPITA INCOME
$90,900
AVG FAMILY INCOME
$70,041
AVG HOUSEHOLD INCOME
27.5%
WAGE / INCOME GAP [ % ]
72.5¢/ $1
WAGE / INCOME GAP [ $ ]
$12,132
FAMILY INCOME DEFICIT
0.42
INEQUALITY / GINI INDEX
93,027
LABOR FORCE [ PEOPLE ]
66.2%
PERCENT IN LABOR FORCE
2.4%
UNEMPLOYMENT RATE
Winnebago County Area Codes
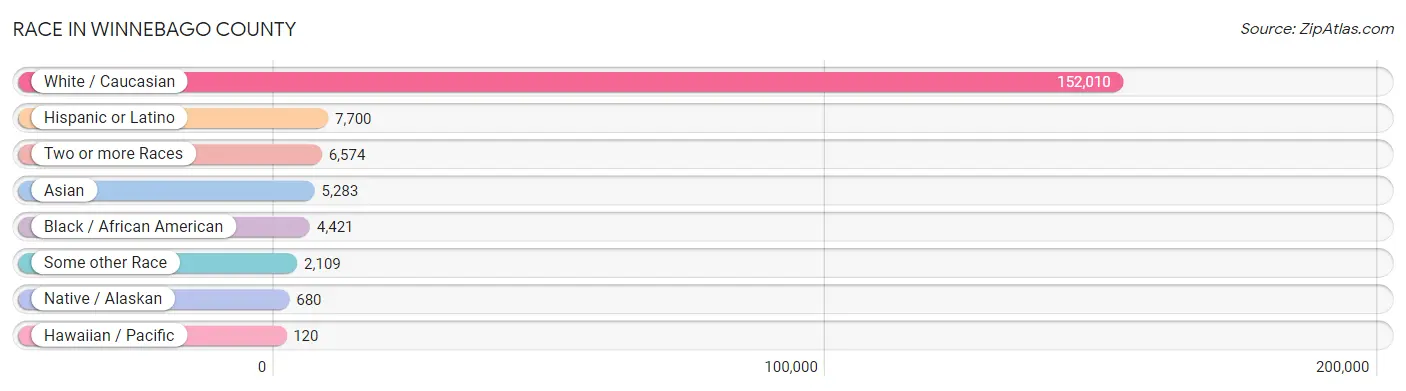
Race in Winnebago County
The most populous races in Winnebago County are White / Caucasian (152,010 | 88.8%), Hispanic or Latino (7,700 | 4.5%), and Two or more Races (6,574 | 3.8%).
| Race | # Population | % Population |
| Asian | 5,283 | 3.1% |
| Black / African American | 4,421 | 2.6% |
| Hawaiian / Pacific | 120 | 0.1% |
| Hispanic or Latino | 7,700 | 4.5% |
| Native / Alaskan | 680 | 0.4% |
| White / Caucasian | 152,010 | 88.8% |
| Two or more Races | 6,574 | 3.8% |
| Some other Race | 2,109 | 1.2% |
| Total | 171,197 | 100.0% |
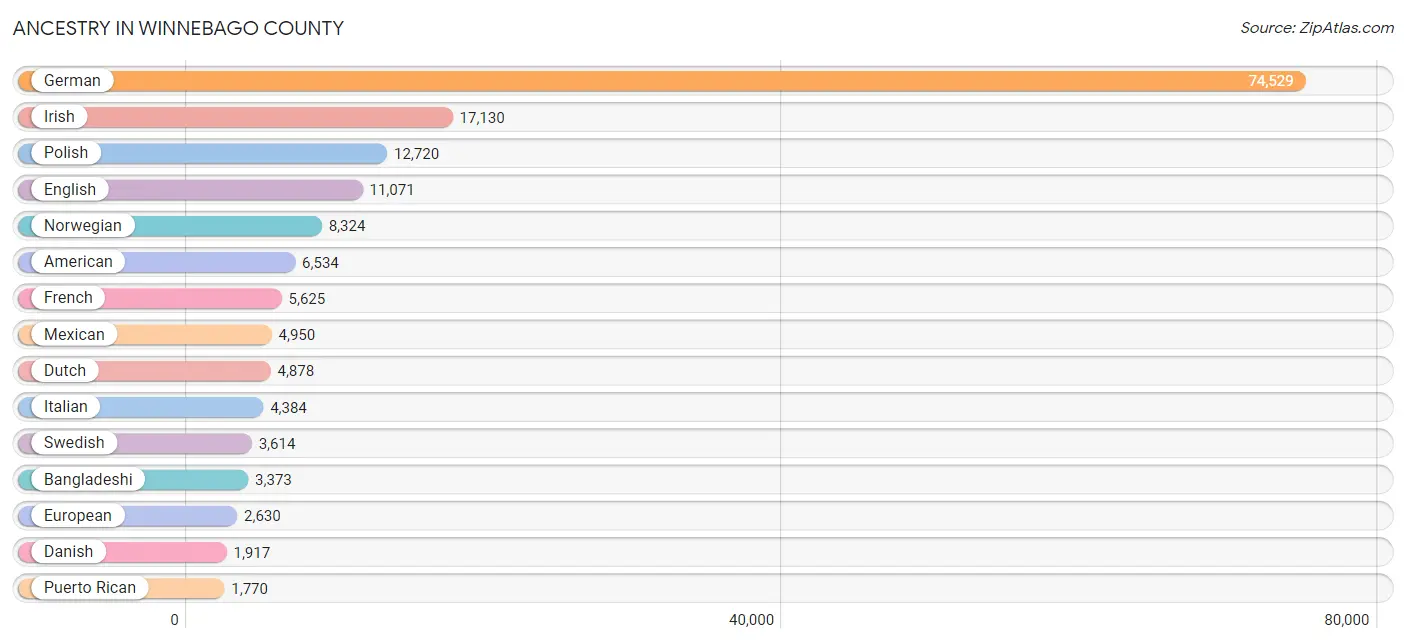
Ancestry in Winnebago County
The most populous ancestries reported in Winnebago County are German (74,529 | 43.5%), Irish (17,130 | 10.0%), Polish (12,720 | 7.4%), English (11,071 | 6.5%), and Norwegian (8,324 | 4.9%), together accounting for 72.3% of all Winnebago County residents.
| Ancestry | # Population | % Population |
| African | 446 | 0.3% |
| Alaska Native | 4 | 0.0% |
| Albanian | 5 | 0.0% |
| American | 6,534 | 3.8% |
| Apache | 88 | 0.1% |
| Arab | 601 | 0.4% |
| Argentinean | 36 | 0.0% |
| Armenian | 75 | 0.0% |
| Austrian | 649 | 0.4% |
| Bangladeshi | 3,373 | 2.0% |
| Belgian | 983 | 0.6% |
| Bhutanese | 175 | 0.1% |
| Blackfeet | 78 | 0.1% |
| Brazilian | 38 | 0.0% |
| British | 502 | 0.3% |
| British West Indian | 7 | 0.0% |
| Bulgarian | 36 | 0.0% |
| Burmese | 192 | 0.1% |
| Cajun | 18 | 0.0% |
| Canadian | 182 | 0.1% |
| Cape Verdean | 28 | 0.0% |
| Celtic | 26 | 0.0% |
| Central American | 137 | 0.1% |
| Central American Indian | 105 | 0.1% |
| Cherokee | 193 | 0.1% |
| Chilean | 6 | 0.0% |
| Chippewa | 312 | 0.2% |
| Choctaw | 46 | 0.0% |
| Colombian | 104 | 0.1% |
| Cree | 25 | 0.0% |
| Creek | 33 | 0.0% |
| Croatian | 159 | 0.1% |
| Cuban | 83 | 0.1% |
| Czech | 1,513 | 0.9% |
| Czechoslovakian | 262 | 0.2% |
| Danish | 1,917 | 1.1% |
| Delaware | 7 | 0.0% |
| Dominican | 25 | 0.0% |
| Dutch | 4,878 | 2.9% |
| Eastern European | 166 | 0.1% |
| Ecuadorian | 66 | 0.0% |
| English | 11,071 | 6.5% |
| Ethiopian | 11 | 0.0% |
| European | 2,630 | 1.5% |
| Finnish | 1,263 | 0.7% |
| French | 5,625 | 3.3% |
| French American Indian | 27 | 0.0% |
| French Canadian | 1,298 | 0.8% |
| German | 74,529 | 43.5% |
| German Russian | 5 | 0.0% |
| Greek | 440 | 0.3% |
| Guatemalan | 31 | 0.0% |
| Haitian | 306 | 0.2% |
| Honduran | 64 | 0.0% |
| Hungarian | 409 | 0.2% |
| Icelander | 27 | 0.0% |
| Indian (Asian) | 862 | 0.5% |
| Iranian | 56 | 0.0% |
| Iraqi | 156 | 0.1% |
| Irish | 17,130 | 10.0% |
| Iroquois | 163 | 0.1% |
| Israeli | 21 | 0.0% |
| Italian | 4,384 | 2.6% |
| Jamaican | 53 | 0.0% |
| Japanese | 114 | 0.1% |
| Korean | 350 | 0.2% |
| Latvian | 84 | 0.1% |
| Lebanese | 194 | 0.1% |
| Lithuanian | 212 | 0.1% |
| Luxembourger | 41 | 0.0% |
| Macedonian | 4 | 0.0% |
| Malaysian | 121 | 0.1% |
| Maltese | 5 | 0.0% |
| Menominee | 94 | 0.1% |
| Mexican | 4,950 | 2.9% |
| Mexican American Indian | 107 | 0.1% |
| Native Hawaiian | 28 | 0.0% |
| Navajo | 12 | 0.0% |
| Nicaraguan | 16 | 0.0% |
| Nigerian | 134 | 0.1% |
| Northern European | 197 | 0.1% |
| Norwegian | 8,324 | 4.9% |
| Pakistani | 53 | 0.0% |
| Palestinian | 7 | 0.0% |
| Paraguayan | 4 | 0.0% |
| Pennsylvania German | 37 | 0.0% |
| Peruvian | 9 | 0.0% |
| Polish | 12,720 | 7.4% |
| Portuguese | 26 | 0.0% |
| Potawatomi | 126 | 0.1% |
| Puerto Rican | 1,770 | 1.0% |
| Puget Sound Salish | 15 | 0.0% |
| Romanian | 185 | 0.1% |
| Russian | 925 | 0.5% |
| Salvadoran | 26 | 0.0% |
| Scandinavian | 822 | 0.5% |
| Scotch-Irish | 567 | 0.3% |
| Scottish | 1,270 | 0.7% |
| Serbian | 97 | 0.1% |
| Sierra Leonean | 20 | 0.0% |
| Sioux | 22 | 0.0% |
| Slavic | 100 | 0.1% |
| Slovak | 54 | 0.0% |
| Slovene | 60 | 0.0% |
| South American | 321 | 0.2% |
| South American Indian | 84 | 0.1% |
| Spaniard | 186 | 0.1% |
| Spanish | 30 | 0.0% |
| Sri Lankan | 432 | 0.3% |
| Subsaharan African | 908 | 0.5% |
| Sudanese | 175 | 0.1% |
| Swedish | 3,614 | 2.1% |
| Swiss | 1,061 | 0.6% |
| Syrian | 151 | 0.1% |
| Thai | 417 | 0.2% |
| Tlingit-Haida | 19 | 0.0% |
| Turkish | 68 | 0.0% |
| Ugandan | 4 | 0.0% |
| Ukrainian | 279 | 0.2% |
| Venezuelan | 96 | 0.1% |
| Welsh | 954 | 0.6% |
| West Indian | 6 | 0.0% |
| Yaqui | 17 | 0.0% |
| Yugoslavian | 68 | 0.0% | View All 124 Rows |
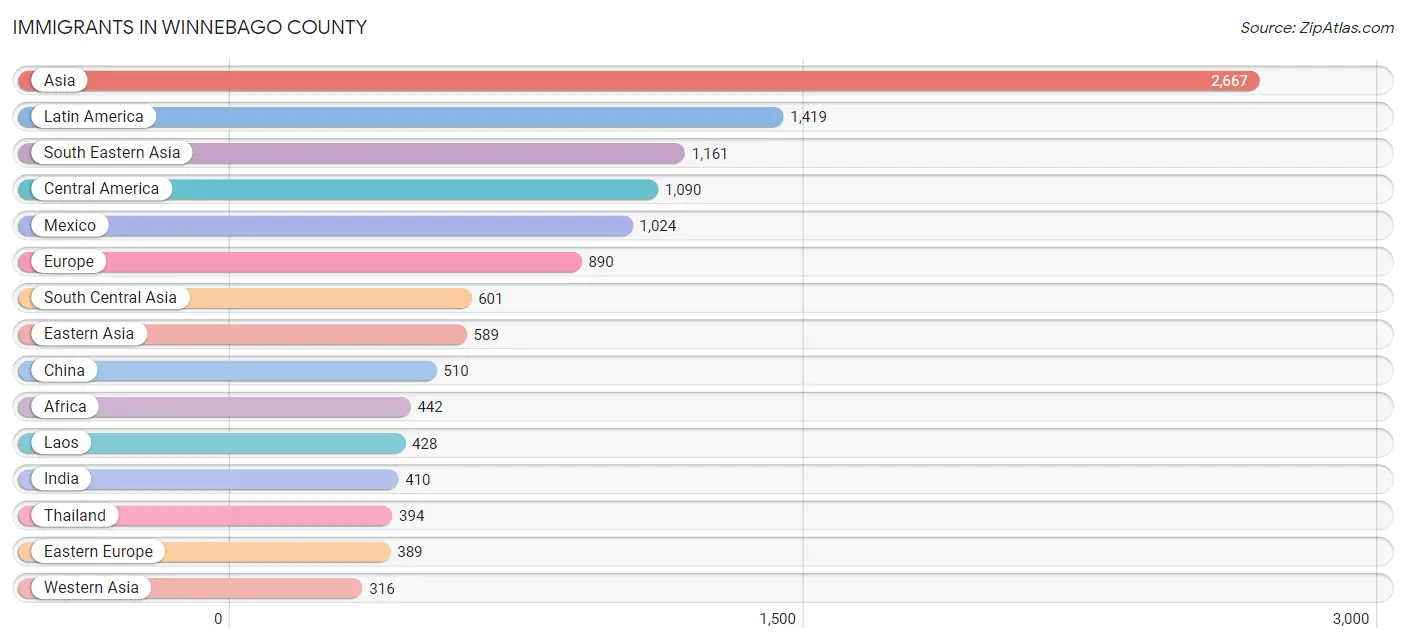
Immigrants in Winnebago County
The most numerous immigrant groups reported in Winnebago County came from Asia (2,667 | 1.6%), Latin America (1,419 | 0.8%), South Eastern Asia (1,161 | 0.7%), Central America (1,090 | 0.6%), and Mexico (1,024 | 0.6%), together accounting for 4.3% of all Winnebago County residents.
| Immigration Origin | # Population | % Population |
| Africa | 442 | 0.3% |
| Albania | 5 | 0.0% |
| Argentina | 20 | 0.0% |
| Asia | 2,667 | 1.6% |
| Austria | 12 | 0.0% |
| Bahamas | 10 | 0.0% |
| Belarus | 32 | 0.0% |
| Belgium | 8 | 0.0% |
| Bosnia and Herzegovina | 49 | 0.0% |
| Brazil | 31 | 0.0% |
| Bulgaria | 28 | 0.0% |
| Canada | 283 | 0.2% |
| Caribbean | 189 | 0.1% |
| Central America | 1,090 | 0.6% |
| Chile | 3 | 0.0% |
| China | 510 | 0.3% |
| Colombia | 26 | 0.0% |
| Croatia | 8 | 0.0% |
| Cuba | 9 | 0.0% |
| Czechoslovakia | 36 | 0.0% |
| Denmark | 7 | 0.0% |
| Dominican Republic | 14 | 0.0% |
| Eastern Africa | 205 | 0.1% |
| Eastern Asia | 589 | 0.3% |
| Eastern Europe | 389 | 0.2% |
| Ecuador | 56 | 0.0% |
| Egypt | 22 | 0.0% |
| El Salvador | 7 | 0.0% |
| England | 91 | 0.1% |
| Ethiopia | 11 | 0.0% |
| Europe | 890 | 0.5% |
| Germany | 113 | 0.1% |
| Guatemala | 16 | 0.0% |
| Haiti | 122 | 0.1% |
| Honduras | 18 | 0.0% |
| India | 410 | 0.2% |
| Iran | 26 | 0.0% |
| Iraq | 163 | 0.1% |
| Ireland | 36 | 0.0% |
| Jamaica | 28 | 0.0% |
| Kenya | 47 | 0.0% |
| Korea | 79 | 0.1% |
| Laos | 428 | 0.3% |
| Latin America | 1,419 | 0.8% |
| Latvia | 55 | 0.0% |
| Mexico | 1,024 | 0.6% |
| Micronesia | 67 | 0.0% |
| Middle Africa | 112 | 0.1% |
| Netherlands | 38 | 0.0% |
| Nicaragua | 25 | 0.0% |
| Nigeria | 53 | 0.0% |
| Northern Africa | 45 | 0.0% |
| Northern Europe | 222 | 0.1% |
| Norway | 5 | 0.0% |
| Oceania | 67 | 0.0% |
| Pakistan | 148 | 0.1% |
| Philippines | 125 | 0.1% |
| Poland | 27 | 0.0% |
| Romania | 9 | 0.0% |
| Russia | 78 | 0.1% |
| Saudi Arabia | 4 | 0.0% |
| Scotland | 19 | 0.0% |
| Serbia | 18 | 0.0% |
| Sierra Leone | 19 | 0.0% |
| South America | 140 | 0.1% |
| South Central Asia | 601 | 0.4% |
| South Eastern Asia | 1,161 | 0.7% |
| Southern Europe | 108 | 0.1% |
| Spain | 108 | 0.1% |
| Sudan | 23 | 0.0% |
| Sweden | 3 | 0.0% |
| Syria | 140 | 0.1% |
| Taiwan | 28 | 0.0% |
| Thailand | 394 | 0.2% |
| Trinidad and Tobago | 6 | 0.0% |
| Uganda | 19 | 0.0% |
| Ukraine | 26 | 0.0% |
| Vietnam | 214 | 0.1% |
| Western Africa | 80 | 0.1% |
| Western Asia | 316 | 0.2% |
| Western Europe | 171 | 0.1% |
| Zaire | 112 | 0.1% | View All 82 Rows |
Sex and Age in Winnebago County
Sex and Age in Winnebago County
The most populous age groups in Winnebago County are 20 to 24 Years (7,646 | 8.8%) for men and 20 to 24 Years (7,402 | 8.8%) for women.
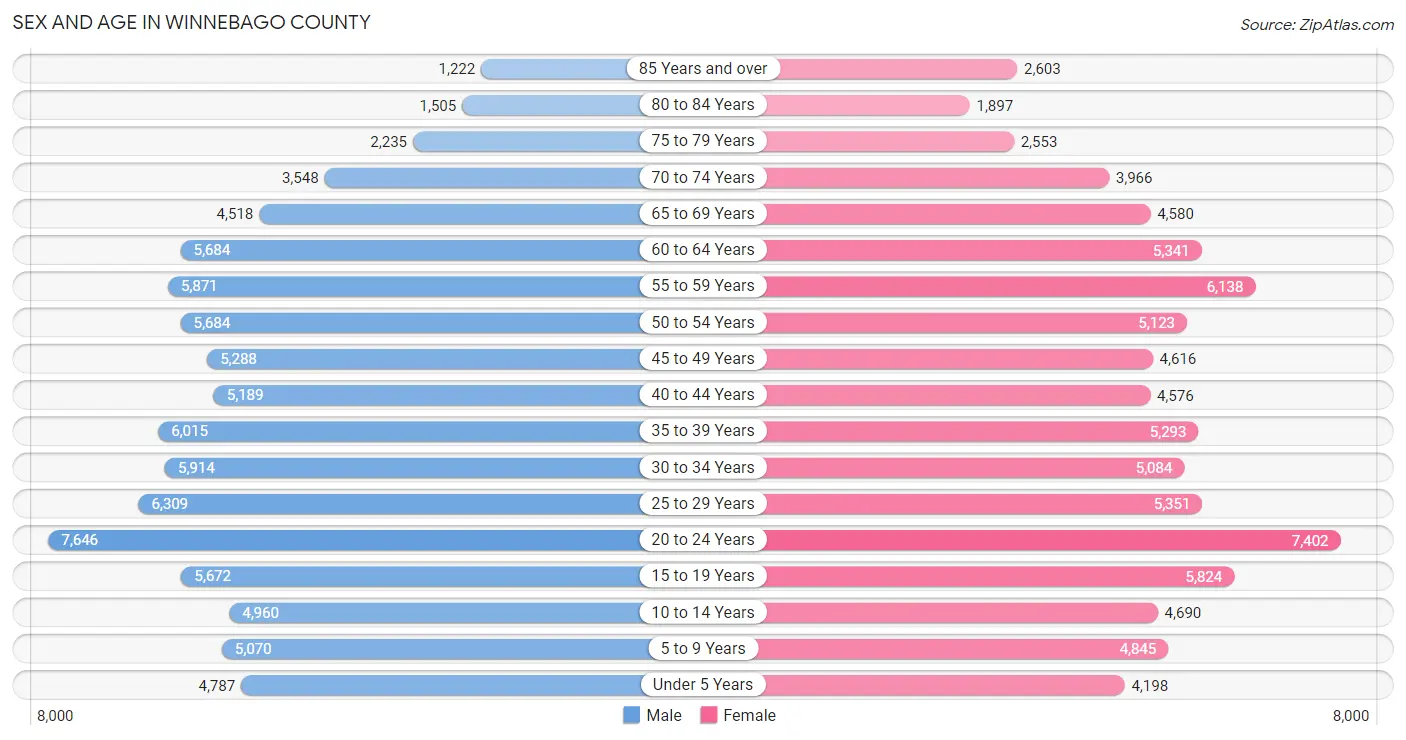
| Age Bracket | Male | Female |
| Under 5 Years | 4,787 (5.5%) | 4,198 (5.0%) |
| 5 to 9 Years | 5,070 (5.8%) | 4,845 (5.8%) |
| 10 to 14 Years | 4,960 (5.7%) | 4,690 (5.6%) |
| 15 to 19 Years | 5,672 (6.5%) | 5,824 (6.9%) |
| 20 to 24 Years | 7,646 (8.8%) | 7,402 (8.8%) |
| 25 to 29 Years | 6,309 (7.2%) | 5,351 (6.4%) |
| 30 to 34 Years | 5,914 (6.8%) | 5,084 (6.0%) |
| 35 to 39 Years | 6,015 (6.9%) | 5,293 (6.3%) |
| 40 to 44 Years | 5,189 (6.0%) | 4,576 (5.4%) |
| 45 to 49 Years | 5,288 (6.1%) | 4,616 (5.5%) |
| 50 to 54 Years | 5,684 (6.5%) | 5,123 (6.1%) |
| 55 to 59 Years | 5,871 (6.7%) | 6,138 (7.3%) |
| 60 to 64 Years | 5,684 (6.5%) | 5,341 (6.4%) |
| 65 to 69 Years | 4,518 (5.2%) | 4,580 (5.4%) |
| 70 to 74 Years | 3,548 (4.1%) | 3,966 (4.7%) |
| 75 to 79 Years | 2,235 (2.6%) | 2,553 (3.0%) |
| 80 to 84 Years | 1,505 (1.7%) | 1,897 (2.3%) |
| 85 Years and over | 1,222 (1.4%) | 2,603 (3.1%) |
| Total | 87,117 (100.0%) | 84,080 (100.0%) |
Families and Households in Winnebago County
Median Family Size in Winnebago County
The median family size in Winnebago County is 2.87 persons per family, with married-couple families (32,562 | 77.5%) accounting for the largest median family size of 2.9 persons per family. On the other hand, single male/father families (3,302 | 7.9%) represent the smallest median family size with 2.47 persons per family.
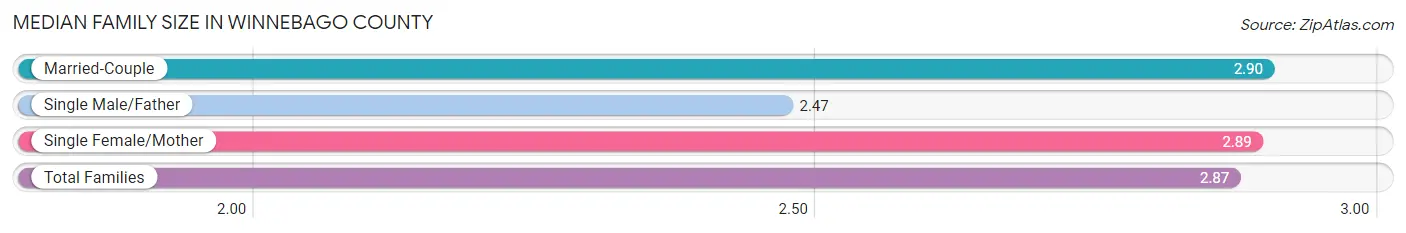
| Family Type | # Families | Family Size |
| Married-Couple | 32,562 (77.5%) | 2.90 |
| Single Male/Father | 3,302 (7.9%) | 2.47 |
| Single Female/Mother | 6,156 (14.6%) | 2.89 |
| Total Families | 42,020 (100.0%) | 2.87 |
Median Household Size in Winnebago County
The median household size in Winnebago County is 2.28 persons per household, with single female/mother households (6,156 | 8.6%) accounting for the largest median household size of 3.16 persons per household. non-family households (29,923 | 41.6%) represent the smallest median household size with 1.33 persons per household.
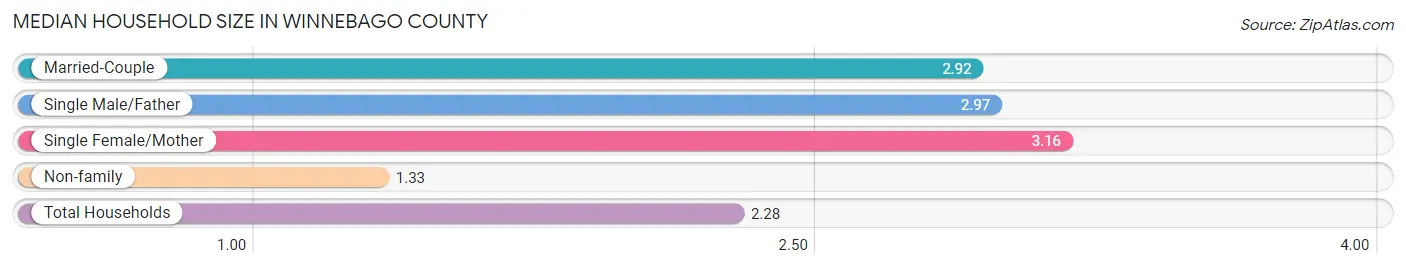
| Household Type | # Households | Household Size |
| Married-Couple | 32,562 (45.3%) | 2.92 |
| Single Male/Father | 3,302 (4.6%) | 2.97 |
| Single Female/Mother | 6,156 (8.6%) | 3.16 |
| Non-family | 29,923 (41.6%) | 1.33 |
| Total Households | 71,943 (100.0%) | 2.28 |
Household Size by Marriage Status in Winnebago County
Out of a total of 71,943 households in Winnebago County, 42,020 (58.4%) are family households, while 29,923 (41.6%) are nonfamily households. The most numerous type of family households are 2-person households, comprising 21,787, and the most common type of nonfamily households are 1-person households, comprising 22,721.
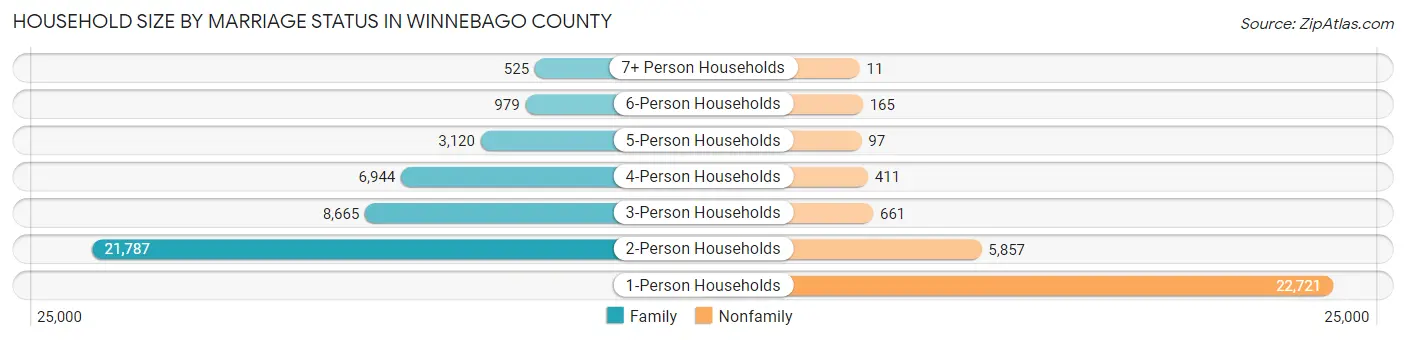
| Household Size | Family Households | Nonfamily Households |
| 1-Person Households | - | 22,721 (31.6%) |
| 2-Person Households | 21,787 (30.3%) | 5,857 (8.1%) |
| 3-Person Households | 8,665 (12.0%) | 661 (0.9%) |
| 4-Person Households | 6,944 (9.7%) | 411 (0.6%) |
| 5-Person Households | 3,120 (4.3%) | 97 (0.1%) |
| 6-Person Households | 979 (1.4%) | 165 (0.2%) |
| 7+ Person Households | 525 (0.7%) | 11 (0.0%) |
| Total | 42,020 (58.4%) | 29,923 (41.6%) |
Female Fertility in Winnebago County
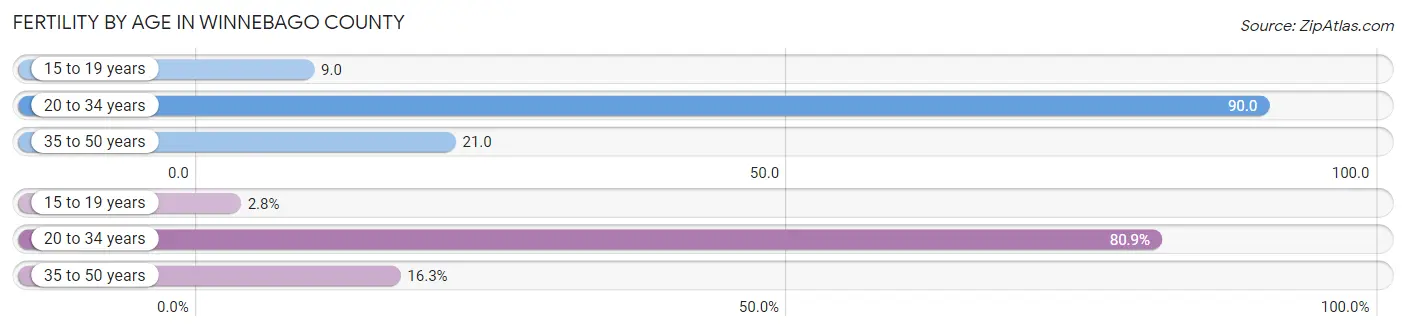
Fertility by Age in Winnebago County
Average fertility rate in Winnebago County is 51.0 births per 1,000 women. Women in the age bracket of 20 to 34 years have the highest fertility rate with 90.0 births per 1,000 women. Women in the age bracket of 20 to 34 years acount for 80.9% of all women with births.
| Age Bracket | Women with Births | Births / 1,000 Women |
| 15 to 19 years | 55 (2.8%) | 9.0 |
| 20 to 34 years | 1,606 (80.9%) | 90.0 |
| 35 to 50 years | 324 (16.3%) | 21.0 |
| Total | 1,985 (100.0%) | 51.0 |
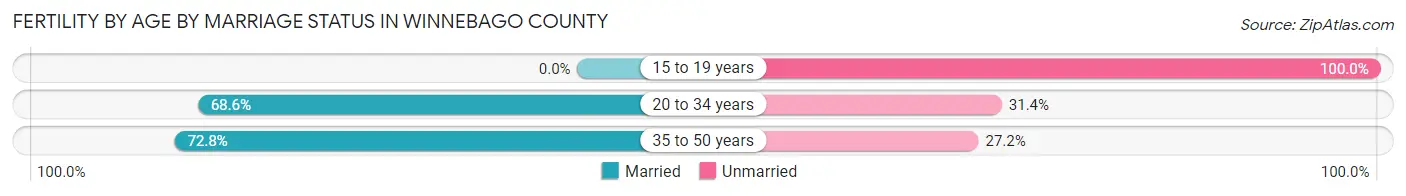
Fertility by Age by Marriage Status in Winnebago County
67.4% of women with births (1,985) in Winnebago County are married. The highest percentage of unmarried women with births falls into 15 to 19 years age bracket with 100.0% of them unmarried at the time of birth, while the lowest percentage of unmarried women with births belong to 35 to 50 years age bracket with 27.2% of them unmarried.
| Age Bracket | Married | Unmarried |
| 15 to 19 years | 0 (0.0%) | 55 (100.0%) |
| 20 to 34 years | 1,102 (68.6%) | 504 (31.4%) |
| 35 to 50 years | 236 (72.8%) | 88 (27.2%) |
| Total | 1,338 (67.4%) | 647 (32.6%) |
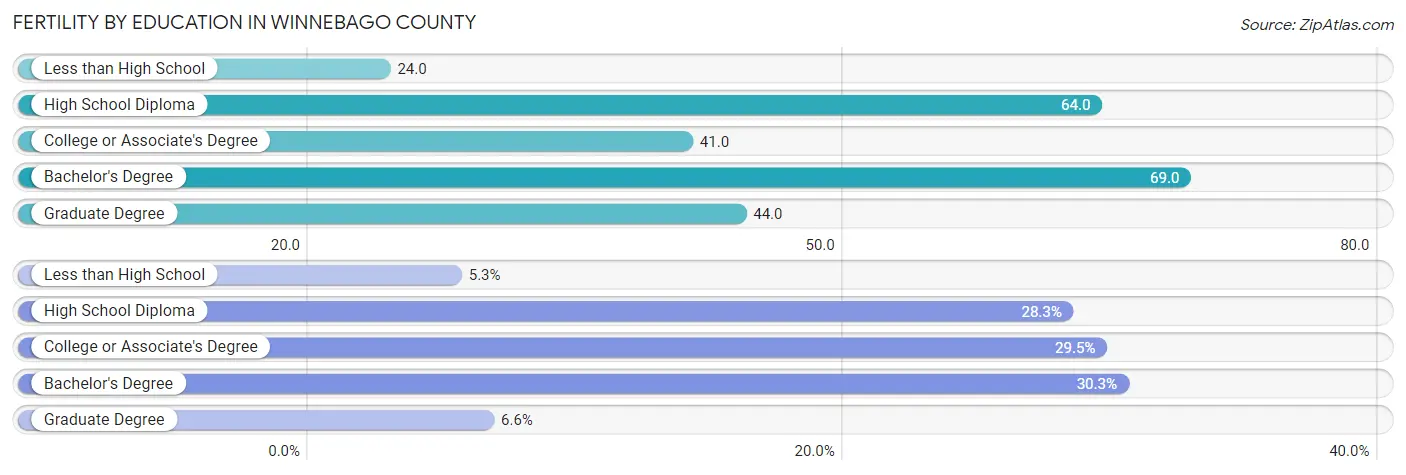
Fertility by Education in Winnebago County
Average fertility rate in Winnebago County is 51.0 births per 1,000 women. Women with the education attainment of bachelor's degree have the highest fertility rate of 69.0 births per 1,000 women, while women with the education attainment of less than high school have the lowest fertility at 24.0 births per 1,000 women. Women with the education attainment of bachelor's degree represent 30.3% of all women with births.
| Educational Attainment | Women with Births | Births / 1,000 Women |
| Less than High School | 106 (5.3%) | 24.0 |
| High School Diploma | 561 (28.3%) | 64.0 |
| College or Associate's Degree | 586 (29.5%) | 41.0 |
| Bachelor's Degree | 602 (30.3%) | 69.0 |
| Graduate Degree | 130 (6.6%) | 44.0 |
| Total | 1,985 (100.0%) | 51.0 |
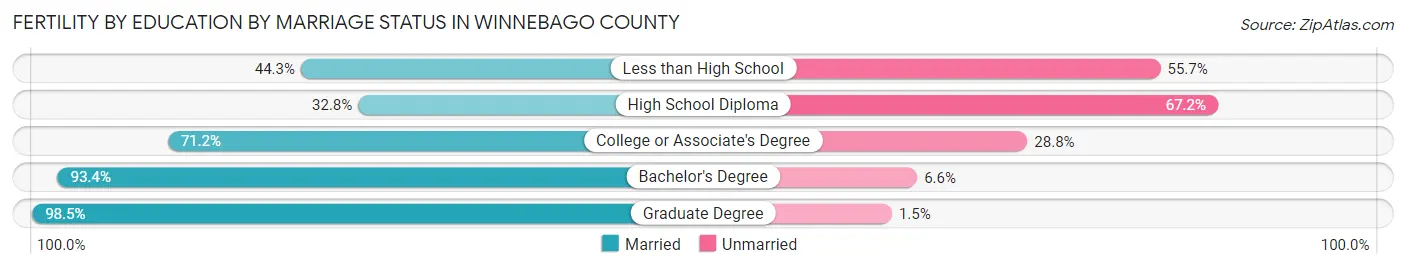
Fertility by Education by Marriage Status in Winnebago County
32.6% of women with births in Winnebago County are unmarried. Women with the educational attainment of graduate degree are most likely to be married with 98.5% of them married at childbirth, while women with the educational attainment of high school diploma are least likely to be married with 67.2% of them unmarried at childbirth.
| Educational Attainment | Married | Unmarried |
| Less than High School | 47 (44.3%) | 59 (55.7%) |
| High School Diploma | 184 (32.8%) | 377 (67.2%) |
| College or Associate's Degree | 417 (71.2%) | 169 (28.8%) |
| Bachelor's Degree | 562 (93.4%) | 40 (6.6%) |
| Graduate Degree | 128 (98.5%) | 2 (1.5%) |
| Total | 1,338 (67.4%) | 647 (32.6%) |
Income in Winnebago County
Income Overview in Winnebago County
Per Capita Income in Winnebago County is $37,983, while median incomes of families and households are $90,900 and $70,041 respectively.
| Characteristic | Number | Measure |
| Per Capita Income | 171,197 | $37,983 |
| Median Family Income | 42,020 | $90,900 |
| Mean Family Income | 42,020 | $109,619 |
| Median Household Income | 71,943 | $70,041 |
| Mean Household Income | 71,943 | $88,231 |
| Income Deficit | 42,020 | $12,132 |
| Wage / Income Gap (%) | 171,197 | 27.47% |
| Wage / Income Gap ($) | 171,197 | 72.53¢ per $1 |
| Gini / Inequality Index | 171,197 | 0.42 |
Earnings by Sex in Winnebago County
Average Earnings in Winnebago County are $40,739, $47,511 for men and $34,459 for women, a difference of 27.5%.
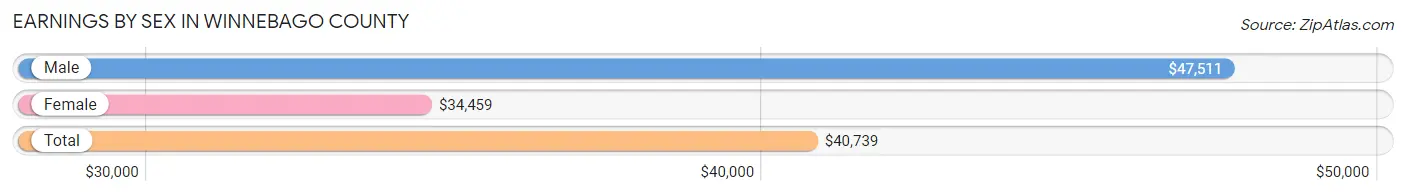
| Sex | Number | Average Earnings |
| Male | 52,720 (53.3%) | $47,511 |
| Female | 46,263 (46.7%) | $34,459 |
| Total | 98,983 (100.0%) | $40,739 |
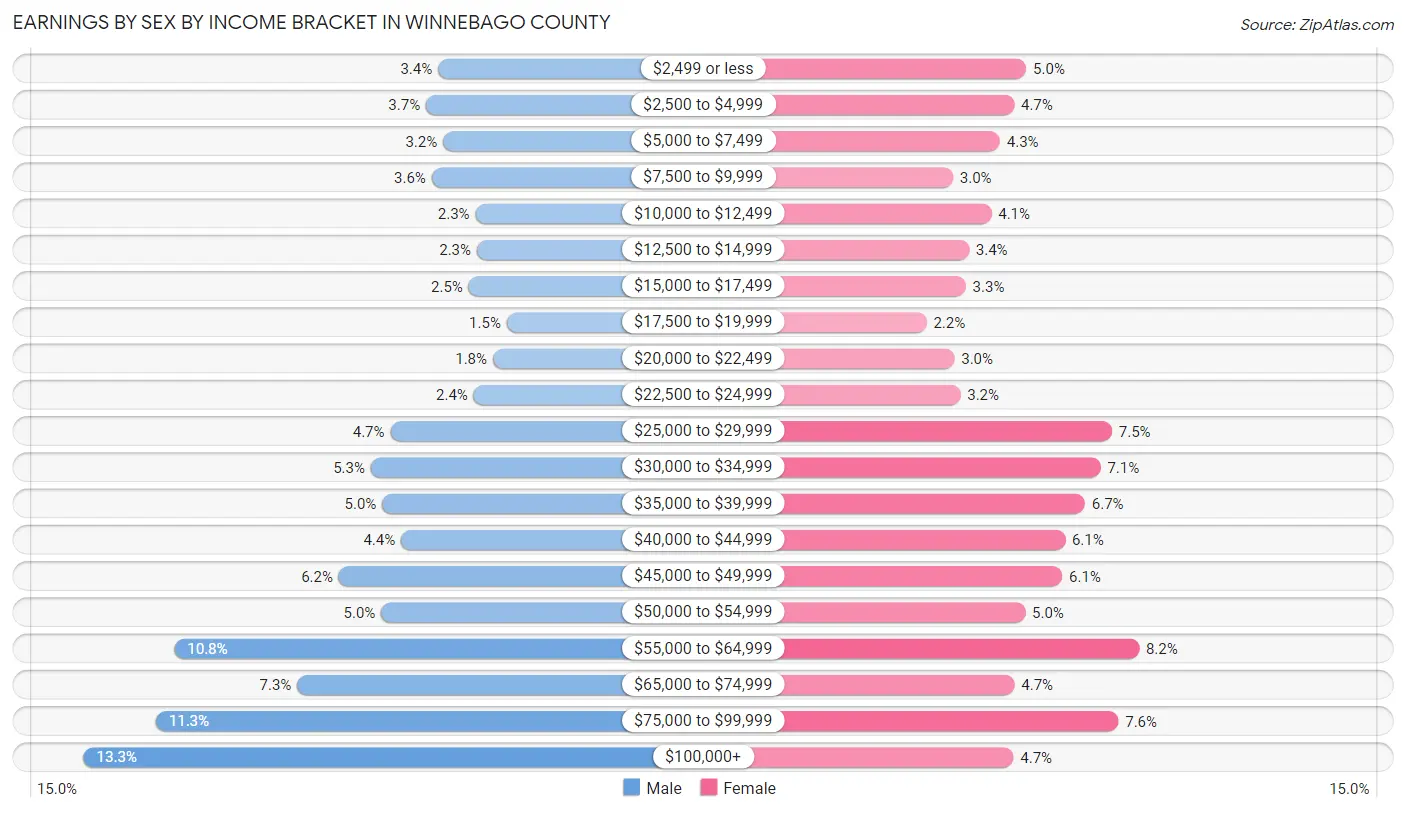
Earnings by Sex by Income Bracket in Winnebago County
The most common earnings brackets in Winnebago County are $100,000+ for men (7,035 | 13.3%) and $55,000 to $64,999 for women (3,800 | 8.2%).
| Income | Male | Female |
| $2,499 or less | 1,782 (3.4%) | 2,330 (5.0%) |
| $2,500 to $4,999 | 1,959 (3.7%) | 2,173 (4.7%) |
| $5,000 to $7,499 | 1,709 (3.2%) | 1,988 (4.3%) |
| $7,500 to $9,999 | 1,877 (3.6%) | 1,380 (3.0%) |
| $10,000 to $12,499 | 1,229 (2.3%) | 1,878 (4.1%) |
| $12,500 to $14,999 | 1,207 (2.3%) | 1,587 (3.4%) |
| $15,000 to $17,499 | 1,330 (2.5%) | 1,547 (3.3%) |
| $17,500 to $19,999 | 764 (1.5%) | 1,035 (2.2%) |
| $20,000 to $22,499 | 968 (1.8%) | 1,399 (3.0%) |
| $22,500 to $24,999 | 1,255 (2.4%) | 1,478 (3.2%) |
| $25,000 to $29,999 | 2,487 (4.7%) | 3,448 (7.4%) |
| $30,000 to $34,999 | 2,778 (5.3%) | 3,299 (7.1%) |
| $35,000 to $39,999 | 2,611 (5.0%) | 3,093 (6.7%) |
| $40,000 to $44,999 | 2,330 (4.4%) | 2,838 (6.1%) |
| $45,000 to $49,999 | 3,253 (6.2%) | 2,798 (6.0%) |
| $50,000 to $54,999 | 2,627 (5.0%) | 2,316 (5.0%) |
| $55,000 to $64,999 | 5,687 (10.8%) | 3,800 (8.2%) |
| $65,000 to $74,999 | 3,868 (7.3%) | 2,181 (4.7%) |
| $75,000 to $99,999 | 5,964 (11.3%) | 3,532 (7.6%) |
| $100,000+ | 7,035 (13.3%) | 2,163 (4.7%) |
| Total | 52,720 (100.0%) | 46,263 (100.0%) |
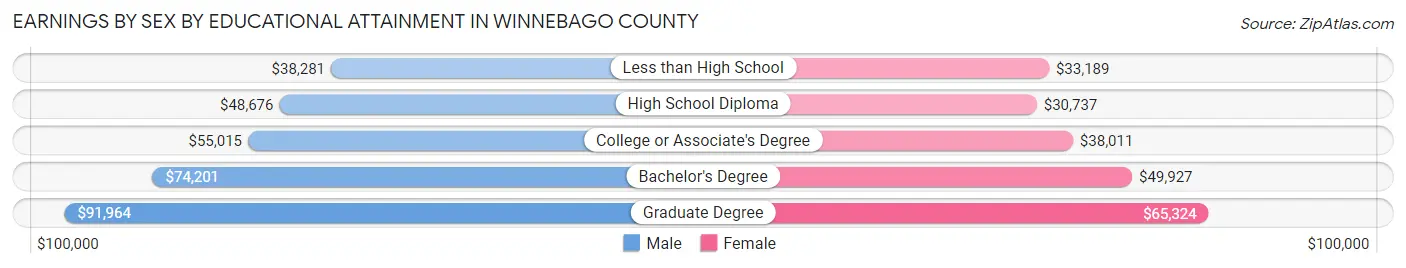
Earnings by Sex by Educational Attainment in Winnebago County
Average earnings in Winnebago County are $56,648 for men and $40,841 for women, a difference of 27.9%. Men with an educational attainment of graduate degree enjoy the highest average annual earnings of $91,964, while those with less than high school education earn the least with $38,281. Women with an educational attainment of graduate degree earn the most with the average annual earnings of $65,324, while those with high school diploma education have the smallest earnings of $30,737.
| Educational Attainment | Male Income | Female Income |
| Less than High School | $38,281 | $33,189 |
| High School Diploma | $48,676 | $30,737 |
| College or Associate's Degree | $55,015 | $38,011 |
| Bachelor's Degree | $74,201 | $49,927 |
| Graduate Degree | $91,964 | $65,324 |
| Total | $56,648 | $40,841 |
Family Income in Winnebago County
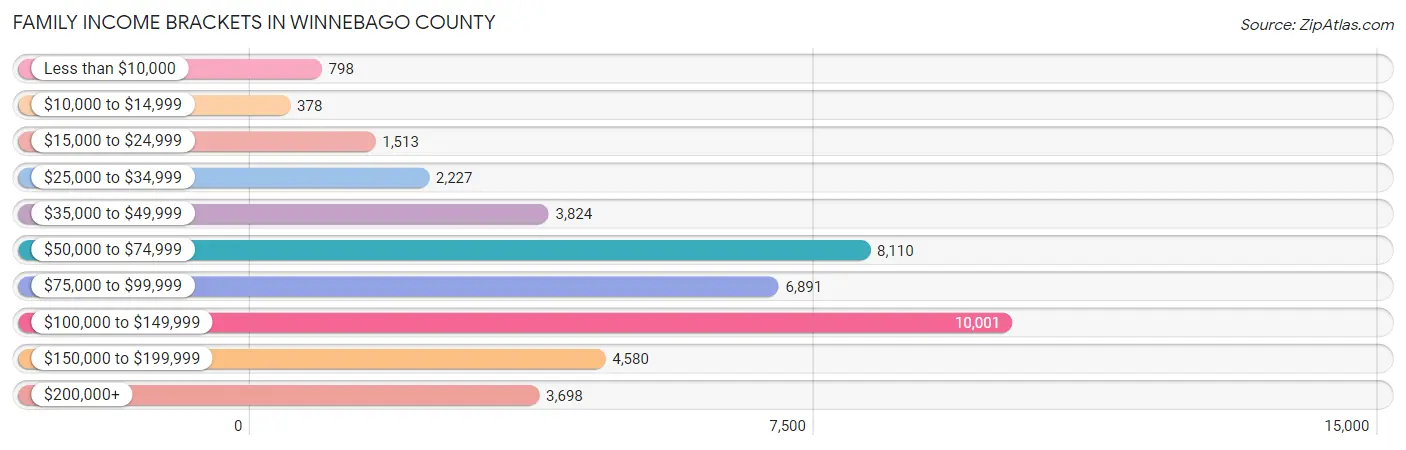
Family Income Brackets in Winnebago County
According to the Winnebago County family income data, there are 10,001 families falling into the $100,000 to $149,999 income range, which is the most common income bracket and makes up 23.8% of all families. Conversely, the $10,000 to $14,999 income bracket is the least frequent group with only 378 families (0.9%) belonging to this category.
| Income Bracket | # Families | % Families |
| Less than $10,000 | 798 | 1.9% |
| $10,000 to $14,999 | 378 | 0.9% |
| $15,000 to $24,999 | 1,513 | 3.6% |
| $25,000 to $34,999 | 2,227 | 5.3% |
| $35,000 to $49,999 | 3,824 | 9.1% |
| $50,000 to $74,999 | 8,110 | 19.3% |
| $75,000 to $99,999 | 6,891 | 16.4% |
| $100,000 to $149,999 | 10,001 | 23.8% |
| $150,000 to $199,999 | 4,580 | 10.9% |
| $200,000+ | 3,698 | 8.8% |
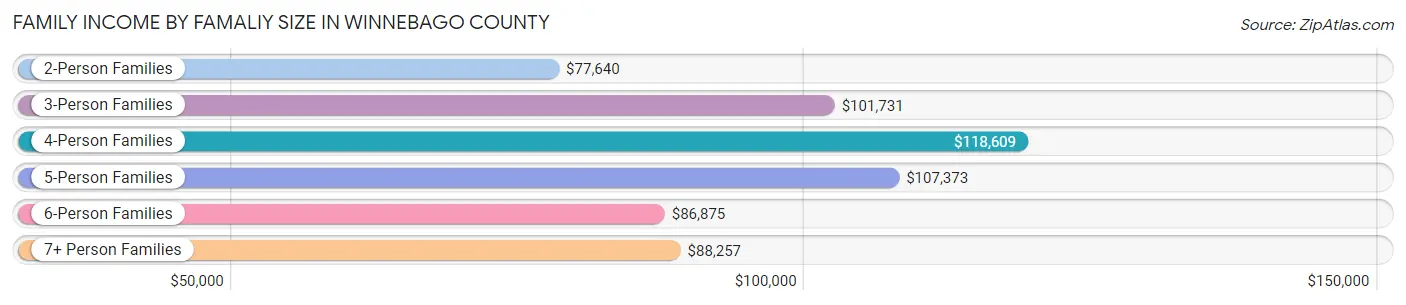
Family Income by Famaliy Size in Winnebago County
4-person families (6,615 | 15.7%) account for the highest median family income in Winnebago County with $118,609 per family, while 2-person families (23,325 | 55.5%) have the highest median income of $38,820 per family member.
| Income Bracket | # Families | Median Income |
| 2-Person Families | 23,325 (55.5%) | $77,640 |
| 3-Person Families | 8,081 (19.2%) | $101,731 |
| 4-Person Families | 6,615 (15.7%) | $118,609 |
| 5-Person Families | 2,770 (6.6%) | $107,373 |
| 6-Person Families | 814 (1.9%) | $86,875 |
| 7+ Person Families | 415 (1.0%) | $88,257 |
| Total | 42,020 (100.0%) | $90,900 |
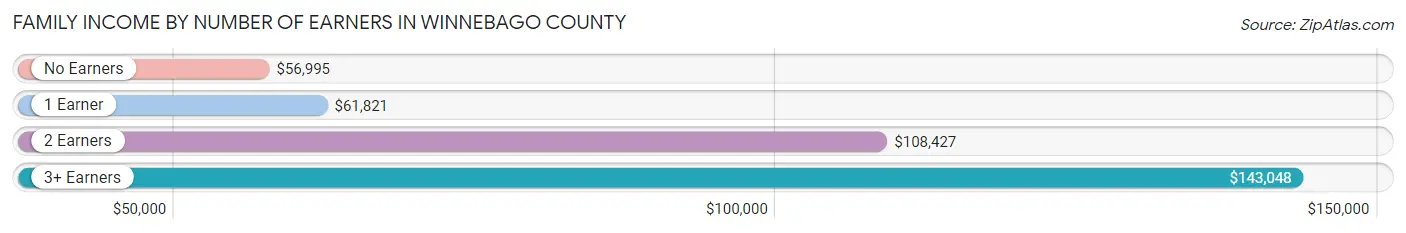
Family Income by Number of Earners in Winnebago County
The median family income in Winnebago County is $90,900, with families comprising 3+ earners (4,547) having the highest median family income of $143,048, while families with no earners (6,811) have the lowest median family income of $56,995, accounting for 10.8% and 16.2% of families, respectively.
| Number of Earners | # Families | Median Income |
| No Earners | 6,811 (16.2%) | $56,995 |
| 1 Earner | 11,669 (27.8%) | $61,821 |
| 2 Earners | 18,993 (45.2%) | $108,427 |
| 3+ Earners | 4,547 (10.8%) | $143,048 |
| Total | 42,020 (100.0%) | $90,900 |
Household Income in Winnebago County
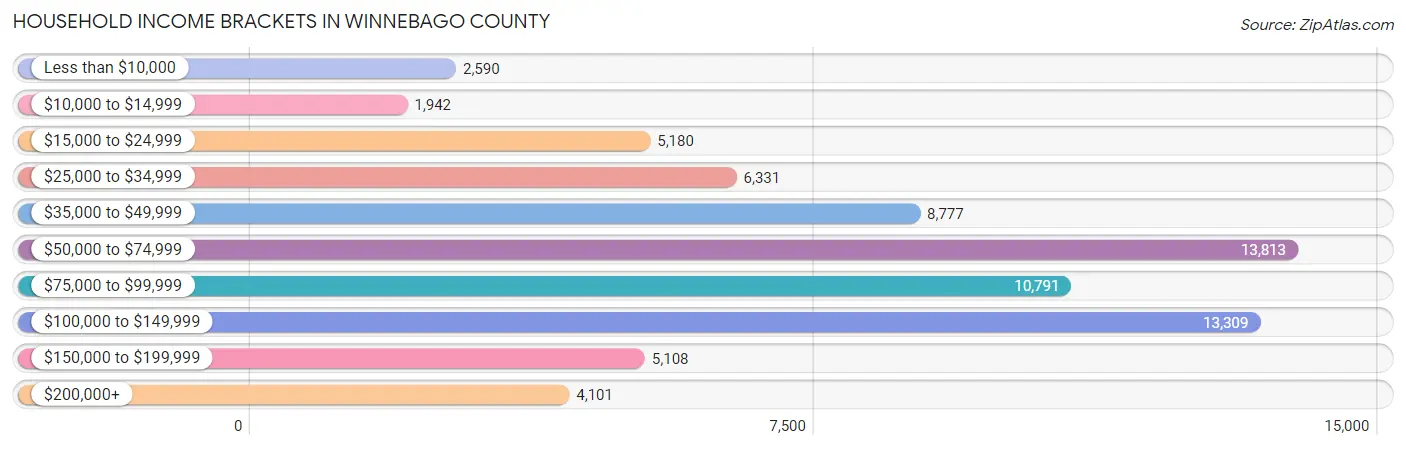
Household Income Brackets in Winnebago County
With 13,813 households falling in the category, the $50,000 to $74,999 income range is the most frequent in Winnebago County, accounting for 19.2% of all households. In contrast, only 1,942 households (2.7%) fall into the $10,000 to $14,999 income bracket, making it the least populous group.
| Income Bracket | # Households | % Households |
| Less than $10,000 | 2,590 | 3.6% |
| $10,000 to $14,999 | 1,942 | 2.7% |
| $15,000 to $24,999 | 5,180 | 7.2% |
| $25,000 to $34,999 | 6,331 | 8.8% |
| $35,000 to $49,999 | 8,777 | 12.2% |
| $50,000 to $74,999 | 13,813 | 19.2% |
| $75,000 to $99,999 | 10,791 | 15.0% |
| $100,000 to $149,999 | 13,309 | 18.5% |
| $150,000 to $199,999 | 5,108 | 7.1% |
| $200,000+ | 4,101 | 5.7% |
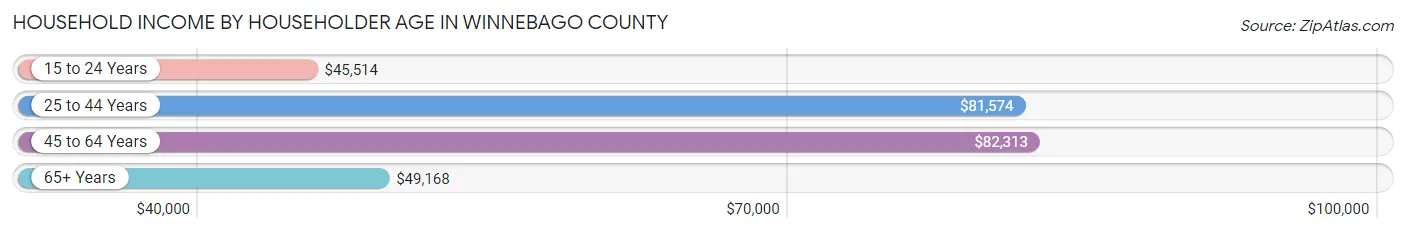
Household Income by Householder Age in Winnebago County
The median household income in Winnebago County is $70,041, with the highest median household income of $82,313 found in the 45 to 64 years age bracket for the primary householder. A total of 25,551 households (35.5%) fall into this category. Meanwhile, the 15 to 24 years age bracket for the primary householder has the lowest median household income of $45,514, with 5,042 households (7.0%) in this group.
| Income Bracket | # Households | Median Income |
| 15 to 24 Years | 5,042 (7.0%) | $45,514 |
| 25 to 44 Years | 22,471 (31.2%) | $81,574 |
| 45 to 64 Years | 25,551 (35.5%) | $82,313 |
| 65+ Years | 18,879 (26.2%) | $49,168 |
| Total | 71,943 (100.0%) | $70,041 |
Poverty in Winnebago County
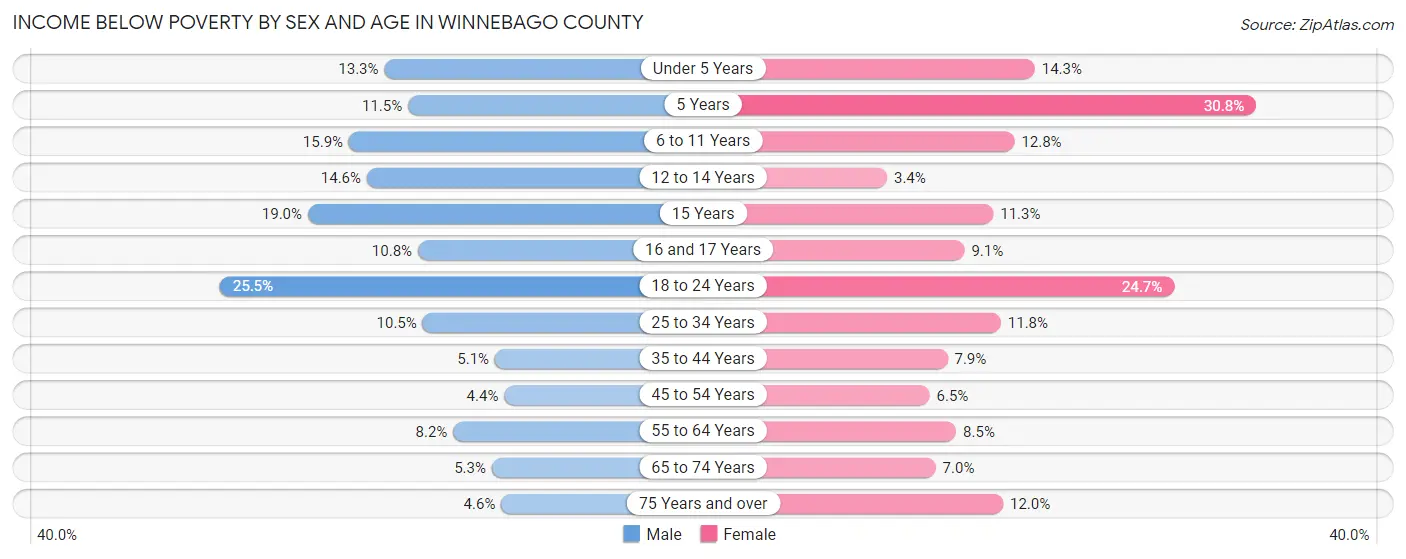
Income Below Poverty by Sex and Age in Winnebago County
With 10.4% poverty level for males and 11.3% for females among the residents of Winnebago County, 18 to 24 year old males and 5 year old females are the most vulnerable to poverty, with 2,325 males (25.5%) and 377 females (30.7%) in their respective age groups living below the poverty level.
| Age Bracket | Male | Female |
| Under 5 Years | 629 (13.3%) | 588 (14.3%) |
| 5 Years | 113 (11.5%) | 377 (30.7%) |
| 6 to 11 Years | 893 (15.9%) | 731 (12.8%) |
| 12 to 14 Years | 457 (14.6%) | 75 (3.4%) |
| 15 Years | 202 (19.0%) | 119 (11.3%) |
| 16 and 17 Years | 223 (10.8%) | 178 (9.1%) |
| 18 to 24 Years | 2,325 (25.5%) | 2,127 (24.7%) |
| 25 to 34 Years | 1,191 (10.4%) | 1,208 (11.8%) |
| 35 to 44 Years | 529 (5.1%) | 764 (7.9%) |
| 45 to 54 Years | 460 (4.4%) | 634 (6.5%) |
| 55 to 64 Years | 906 (8.2%) | 970 (8.5%) |
| 65 to 74 Years | 417 (5.3%) | 590 (7.0%) |
| 75 Years and over | 221 (4.6%) | 798 (12.0%) |
| Total | 8,566 (10.4%) | 9,159 (11.3%) |
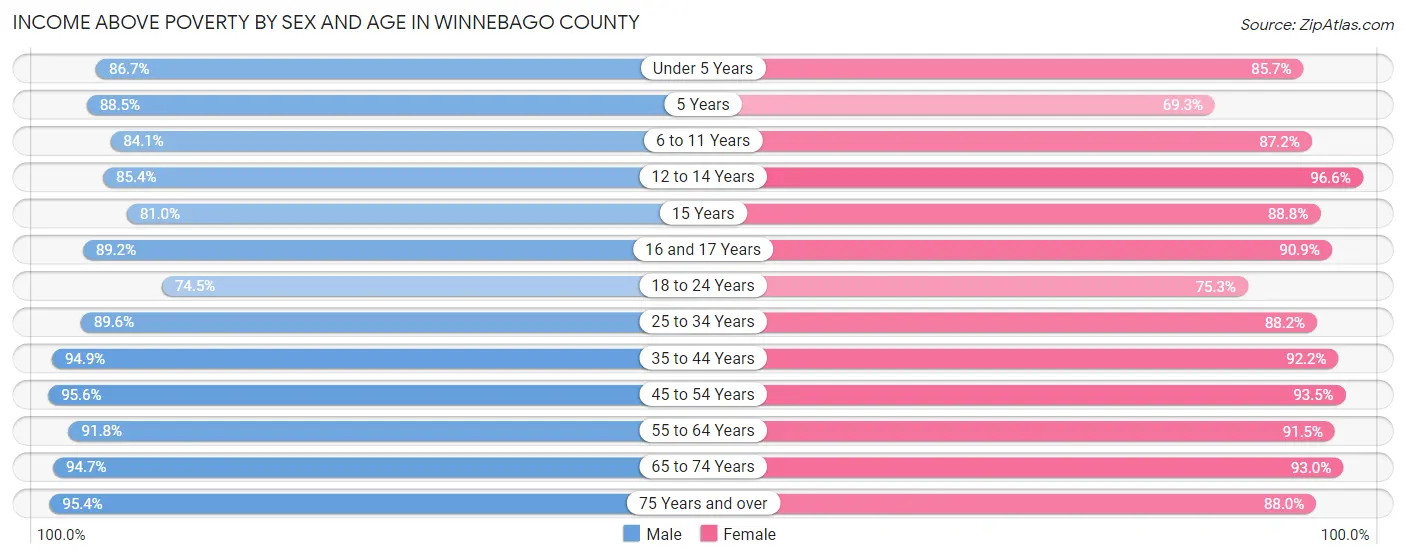
Income Above Poverty by Sex and Age in Winnebago County
According to the poverty statistics in Winnebago County, males aged 45 to 54 years and females aged 12 to 14 years are the age groups that are most secure financially, with 95.6% of males and 96.6% of females in these age groups living above the poverty line.
| Age Bracket | Male | Female |
| Under 5 Years | 4,103 (86.7%) | 3,516 (85.7%) |
| 5 Years | 867 (88.5%) | 849 (69.3%) |
| 6 to 11 Years | 4,718 (84.1%) | 4,972 (87.2%) |
| 12 to 14 Years | 2,676 (85.4%) | 2,156 (96.6%) |
| 15 Years | 863 (81.0%) | 939 (88.7%) |
| 16 and 17 Years | 1,841 (89.2%) | 1,775 (90.9%) |
| 18 to 24 Years | 6,792 (74.5%) | 6,495 (75.3%) |
| 25 to 34 Years | 10,209 (89.5%) | 9,022 (88.2%) |
| 35 to 44 Years | 9,892 (94.9%) | 8,966 (92.1%) |
| 45 to 54 Years | 10,007 (95.6%) | 9,087 (93.5%) |
| 55 to 64 Years | 10,167 (91.8%) | 10,454 (91.5%) |
| 65 to 74 Years | 7,429 (94.7%) | 7,880 (93.0%) |
| 75 Years and over | 4,576 (95.4%) | 5,866 (88.0%) |
| Total | 74,140 (89.6%) | 71,977 (88.7%) |
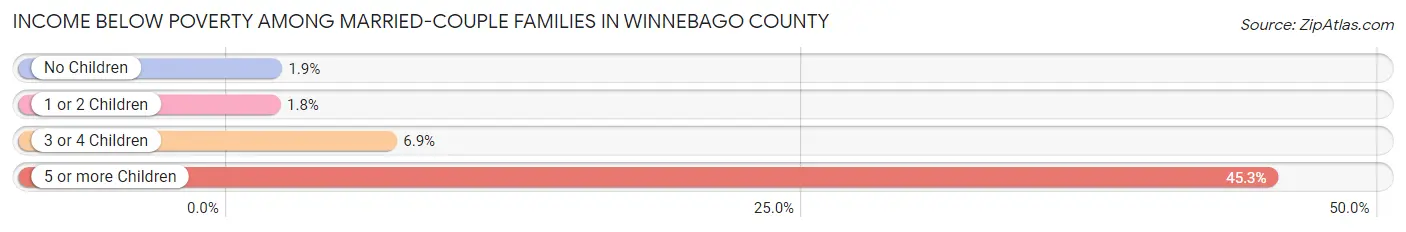
Income Below Poverty Among Married-Couple Families in Winnebago County
The poverty statistics for married-couple families in Winnebago County show that 2.5% or 804 of the total 32,562 families live below the poverty line. Families with 5 or more children have the highest poverty rate of 45.3%, comprising of 72 families. On the other hand, families with 1 or 2 children have the lowest poverty rate of 1.8%, which includes 171 families.
| Children | Above Poverty | Below Poverty |
| No Children | 20,163 (98.1%) | 389 (1.9%) |
| 1 or 2 Children | 9,184 (98.2%) | 171 (1.8%) |
| 3 or 4 Children | 2,324 (93.1%) | 172 (6.9%) |
| 5 or more Children | 87 (54.7%) | 72 (45.3%) |
| Total | 31,758 (97.5%) | 804 (2.5%) |
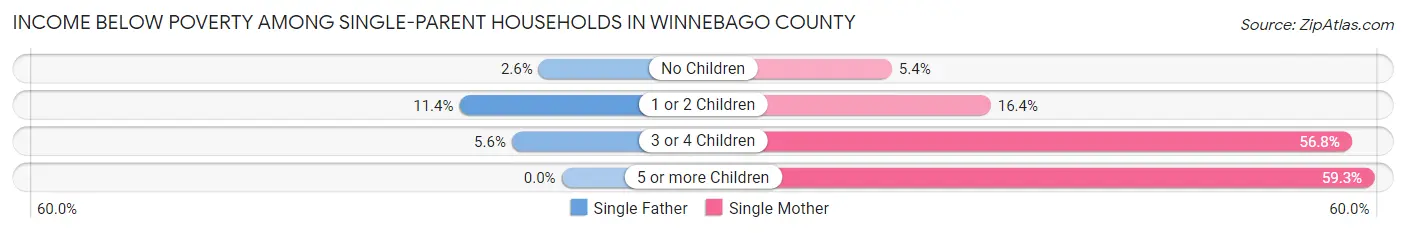
Income Below Poverty Among Single-Parent Households in Winnebago County
According to the poverty data in Winnebago County, 7.8% or 258 single-father households and 17.8% or 1,094 single-mother households are living below the poverty line. Among single-father households, those with 1 or 2 children have the highest poverty rate, with 217 households (11.4%) experiencing poverty. Likewise, among single-mother households, those with 5 or more children have the highest poverty rate, with 112 households (59.3%) falling below the poverty line.
| Children | Single Father | Single Mother |
| No Children | 31 (2.6%) | 110 (5.4%) |
| 1 or 2 Children | 217 (11.4%) | 553 (16.4%) |
| 3 or 4 Children | 10 (5.6%) | 319 (56.8%) |
| 5 or more Children | 0 (0.0%) | 112 (59.3%) |
| Total | 258 (7.8%) | 1,094 (17.8%) |
Income Below Poverty Among Married-Couple vs Single-Parent Households in Winnebago County
The poverty data for Winnebago County shows that 804 of the married-couple family households (2.5%) and 1,352 of the single-parent households (14.3%) are living below the poverty level. Within the married-couple family households, those with 5 or more children have the highest poverty rate, with 72 households (45.3%) falling below the poverty line. Among the single-parent households, those with 5 or more children have the highest poverty rate, with 112 household (55.4%) living below poverty.
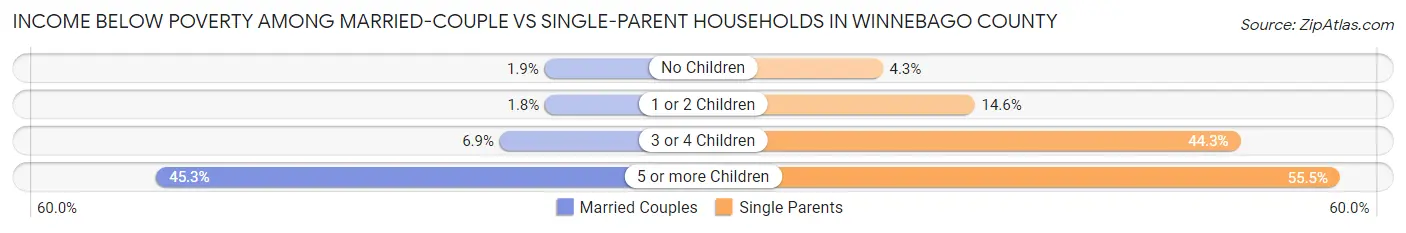
| Children | Married-Couple Families | Single-Parent Households |
| No Children | 389 (1.9%) | 141 (4.3%) |
| 1 or 2 Children | 171 (1.8%) | 770 (14.6%) |
| 3 or 4 Children | 172 (6.9%) | 329 (44.3%) |
| 5 or more Children | 72 (45.3%) | 112 (55.4%) |
| Total | 804 (2.5%) | 1,352 (14.3%) |
Employment Characteristics in Winnebago County
Employment by Class of Employer in Winnebago County
Among the 88,979 employed individuals in Winnebago County, private company employees (65,424 | 73.5%), not-for-profit organizations (7,443 | 8.4%), and local government employees (5,244 | 5.9%) make up the most common classes of employment.
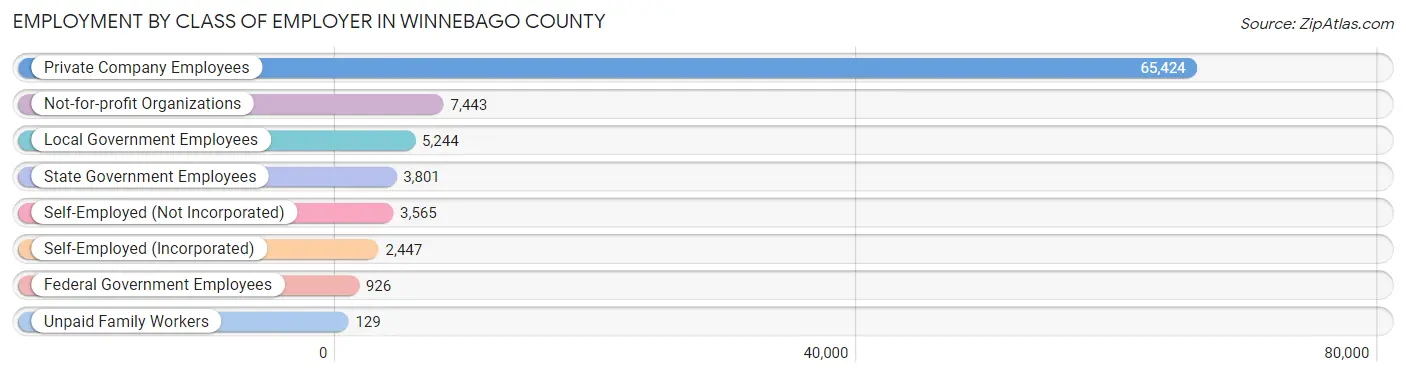
| Employer Class | # Employees | % Employees |
| Private Company Employees | 65,424 | 73.5% |
| Self-Employed (Incorporated) | 2,447 | 2.8% |
| Self-Employed (Not Incorporated) | 3,565 | 4.0% |
| Not-for-profit Organizations | 7,443 | 8.4% |
| Local Government Employees | 5,244 | 5.9% |
| State Government Employees | 3,801 | 4.3% |
| Federal Government Employees | 926 | 1.0% |
| Unpaid Family Workers | 129 | 0.1% |
| Total | 88,979 | 100.0% |
Employment Status by Age in Winnebago County
According to the labor force statistics for Winnebago County, out of the total population over 16 years of age (140,524), 66.2% or 93,027 individuals are in the labor force, with 2.4% or 2,233 of them unemployed. The age group with the highest labor force participation rate is 25 to 29 years, with 86.1% or 10,039 individuals in the labor force. Within the labor force, the 16 to 19 years age range has the highest percentage of unemployed individuals, with 7.1% or 360 of them being unemployed.
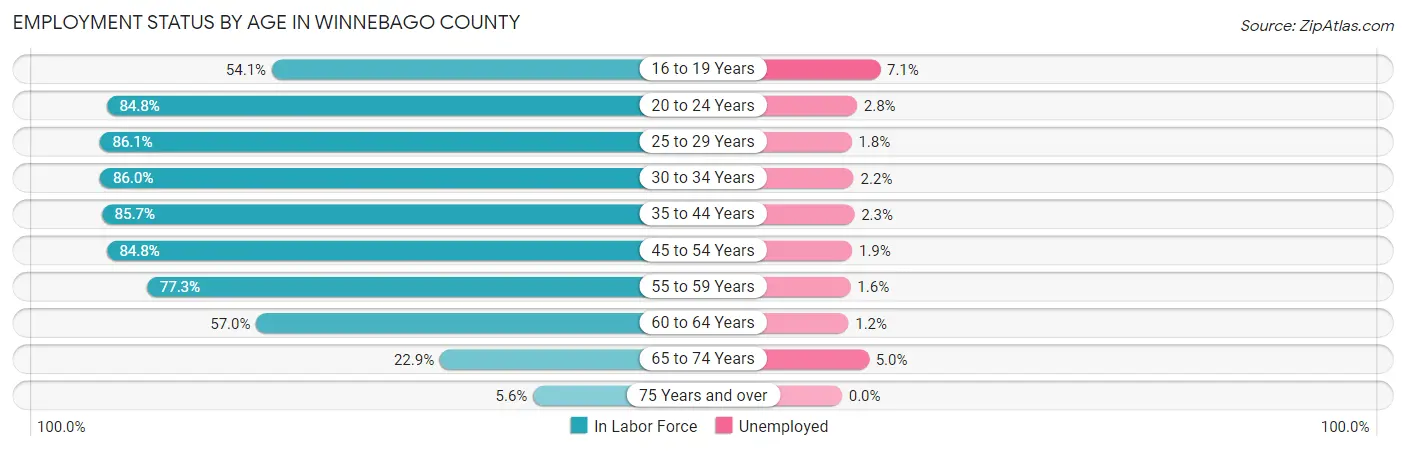
| Age Bracket | In Labor Force | Unemployed |
| 16 to 19 Years | 5,071 (54.1%) | 360 (7.1%) |
| 20 to 24 Years | 12,761 (84.8%) | 357 (2.8%) |
| 25 to 29 Years | 10,039 (86.1%) | 181 (1.8%) |
| 30 to 34 Years | 9,458 (86.0%) | 208 (2.2%) |
| 35 to 44 Years | 18,060 (85.7%) | 415 (2.3%) |
| 45 to 54 Years | 17,563 (84.8%) | 334 (1.9%) |
| 55 to 59 Years | 9,283 (77.3%) | 149 (1.6%) |
| 60 to 64 Years | 6,284 (57.0%) | 75 (1.2%) |
| 65 to 74 Years | 3,804 (22.9%) | 190 (5.0%) |
| 75 Years and over | 673 (5.6%) | 0 (0.0%) |
| Total | 93,027 (66.2%) | 2,233 (2.4%) |
Employment Status by Educational Attainment in Winnebago County
According to labor force statistics for Winnebago County, 80.8% of individuals (70,681) out of the total population between 25 and 64 years of age (87,476) are in the labor force, with 1.9% or 1,343 of them being unemployed. The group with the highest labor force participation rate are those with the educational attainment of bachelor's degree or higher, with 88.5% or 24,277 individuals in the labor force. Within the labor force, individuals with less than high school education have the highest percentage of unemployment, with 7.0% or 178 of them being unemployed.
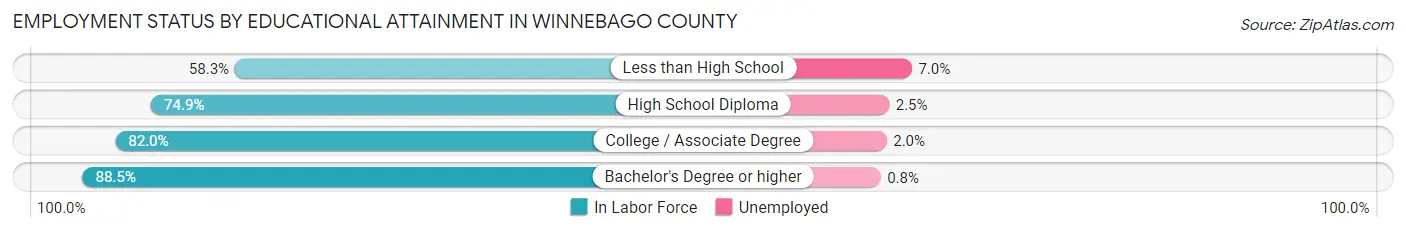
| Educational Attainment | In Labor Force | Unemployed |
| Less than High School | 2,545 (58.3%) | 306 (7.0%) |
| High School Diploma | 18,828 (74.9%) | 628 (2.5%) |
| College / Associate Degree | 25,044 (82.0%) | 611 (2.0%) |
| Bachelor's Degree or higher | 24,277 (88.5%) | 219 (0.8%) |
| Total | 70,681 (80.8%) | 1,662 (1.9%) |
Employment Occupations by Sex in Winnebago County
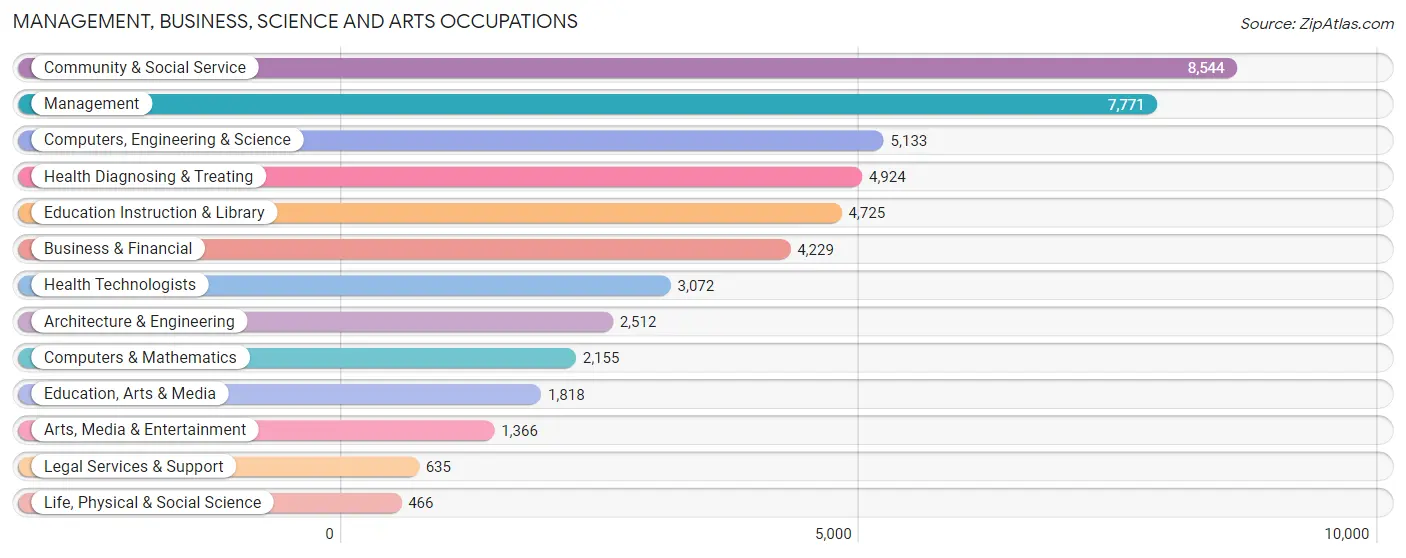
Management, Business, Science and Arts Occupations
The most common Management, Business, Science and Arts occupations in Winnebago County are Community & Social Service (8,544 | 9.4%), Management (7,771 | 8.6%), Computers, Engineering & Science (5,133 | 5.7%), Health Diagnosing & Treating (4,924 | 5.4%), and Education Instruction & Library (4,725 | 5.2%).
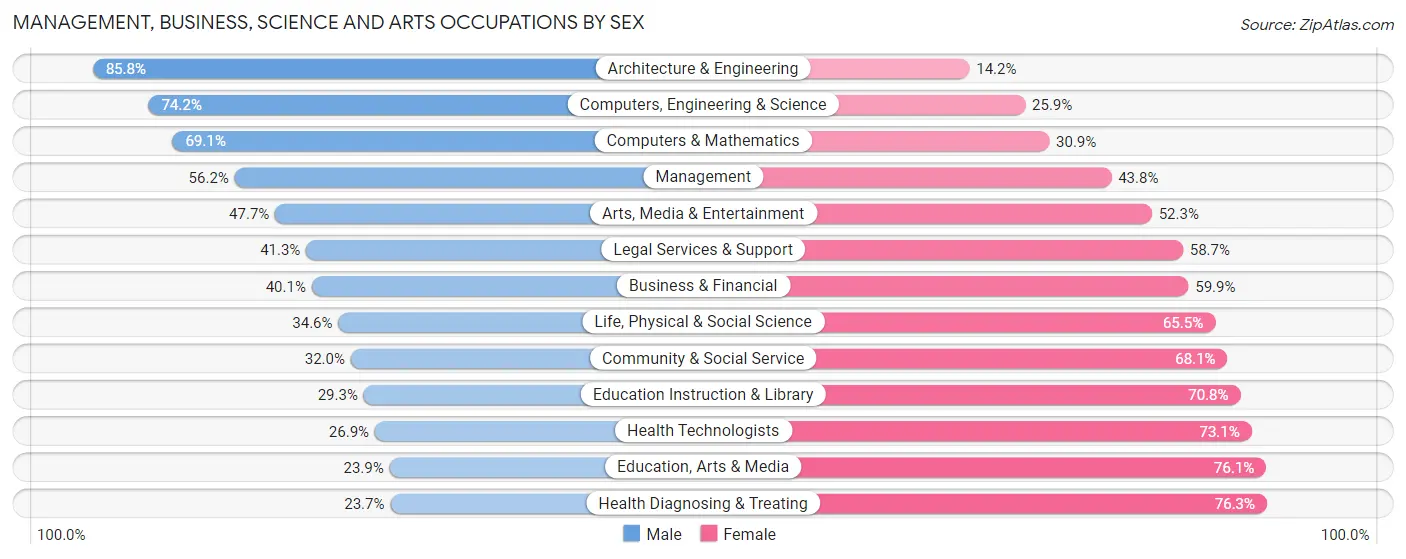
Management, Business, Science and Arts Occupations by Sex
Within the Management, Business, Science and Arts occupations in Winnebago County, the most male-oriented occupations are Architecture & Engineering (85.8%), Computers, Engineering & Science (74.2%), and Computers & Mathematics (69.1%), while the most female-oriented occupations are Health Diagnosing & Treating (76.3%), Education, Arts & Media (76.1%), and Health Technologists (73.1%).
| Occupation | Male | Female |
| Management | 4,366 (56.2%) | 3,405 (43.8%) |
| Business & Financial | 1,696 (40.1%) | 2,533 (59.9%) |
| Computers, Engineering & Science | 3,806 (74.2%) | 1,327 (25.9%) |
| Computers & Mathematics | 1,490 (69.1%) | 665 (30.9%) |
| Architecture & Engineering | 2,155 (85.8%) | 357 (14.2%) |
| Life, Physical & Social Science | 161 (34.5%) | 305 (65.4%) |
| Community & Social Service | 2,730 (32.0%) | 5,814 (68.0%) |
| Education, Arts & Media | 434 (23.9%) | 1,384 (76.1%) |
| Legal Services & Support | 262 (41.3%) | 373 (58.7%) |
| Education Instruction & Library | 1,382 (29.2%) | 3,343 (70.8%) |
| Arts, Media & Entertainment | 652 (47.7%) | 714 (52.3%) |
| Health Diagnosing & Treating | 1,168 (23.7%) | 3,756 (76.3%) |
| Health Technologists | 827 (26.9%) | 2,245 (73.1%) |
| Total (Category) | 13,766 (45.0%) | 16,835 (55.0%) |
| Total (Overall) | 48,381 (53.4%) | 42,247 (46.6%) |
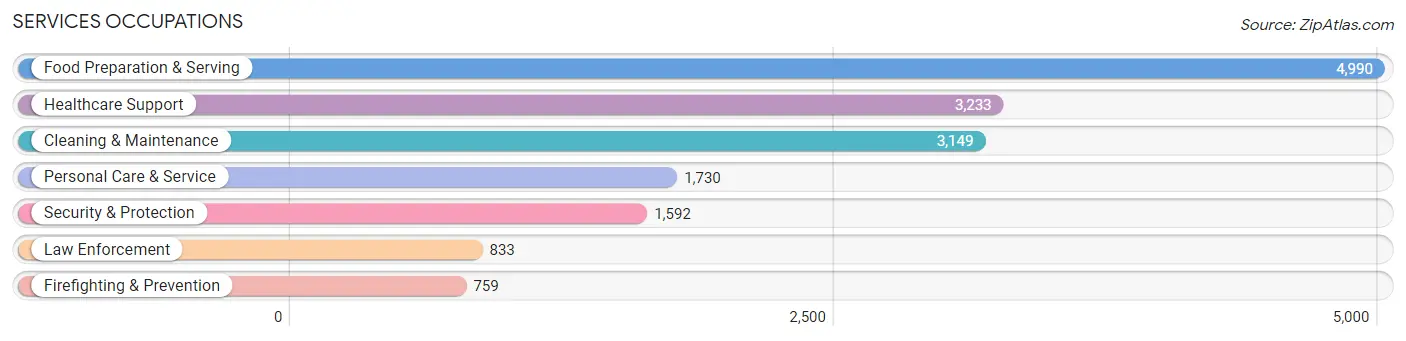
Services Occupations
The most common Services occupations in Winnebago County are Food Preparation & Serving (4,990 | 5.5%), Healthcare Support (3,233 | 3.6%), Cleaning & Maintenance (3,149 | 3.5%), Personal Care & Service (1,730 | 1.9%), and Security & Protection (1,592 | 1.8%).
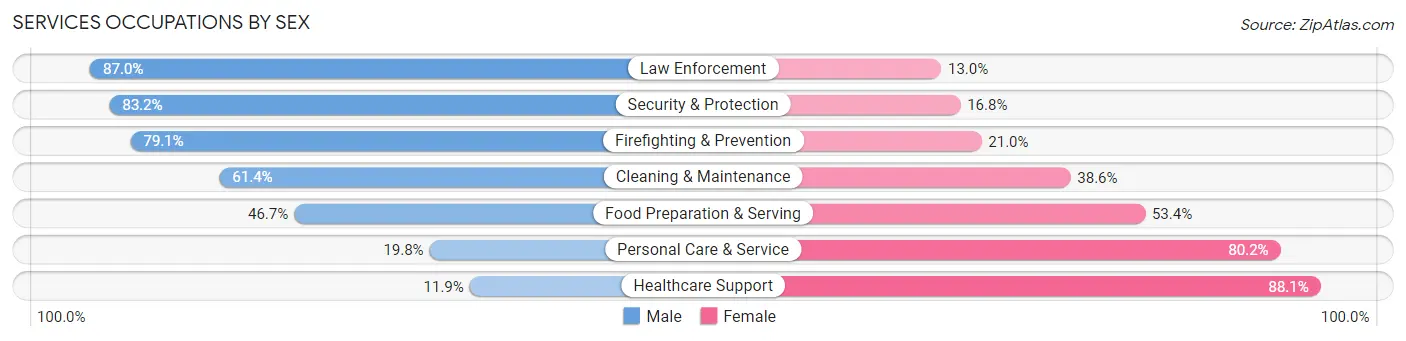
Services Occupations by Sex
Within the Services occupations in Winnebago County, the most male-oriented occupations are Law Enforcement (87.0%), Security & Protection (83.2%), and Firefighting & Prevention (79.0%), while the most female-oriented occupations are Healthcare Support (88.1%), Personal Care & Service (80.2%), and Food Preparation & Serving (53.3%).
| Occupation | Male | Female |
| Healthcare Support | 384 (11.9%) | 2,849 (88.1%) |
| Security & Protection | 1,325 (83.2%) | 267 (16.8%) |
| Firefighting & Prevention | 600 (79.0%) | 159 (20.9%) |
| Law Enforcement | 725 (87.0%) | 108 (13.0%) |
| Food Preparation & Serving | 2,328 (46.7%) | 2,662 (53.3%) |
| Cleaning & Maintenance | 1,934 (61.4%) | 1,215 (38.6%) |
| Personal Care & Service | 343 (19.8%) | 1,387 (80.2%) |
| Total (Category) | 6,314 (43.0%) | 8,380 (57.0%) |
| Total (Overall) | 48,381 (53.4%) | 42,247 (46.6%) |
Sales and Office Occupations
The most common Sales and Office occupations in Winnebago County are Office & Administration (10,539 | 11.6%), and Sales & Related (9,130 | 10.1%).

Sales and Office Occupations by Sex
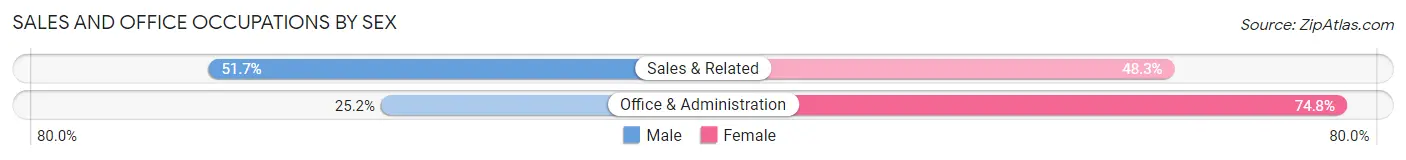
| Occupation | Male | Female |
| Sales & Related | 4,721 (51.7%) | 4,409 (48.3%) |
| Office & Administration | 2,655 (25.2%) | 7,884 (74.8%) |
| Total (Category) | 7,376 (37.5%) | 12,293 (62.5%) |
| Total (Overall) | 48,381 (53.4%) | 42,247 (46.6%) |
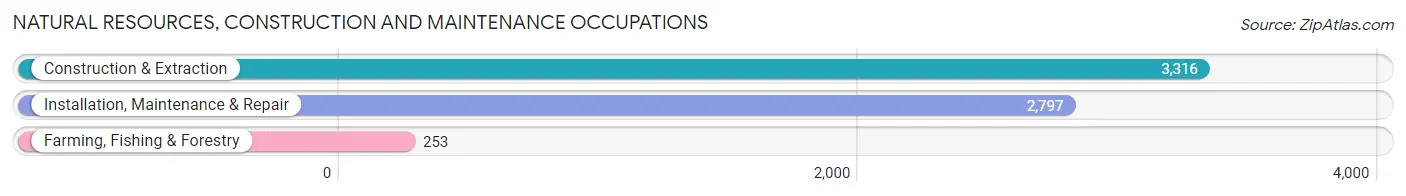
Natural Resources, Construction and Maintenance Occupations
The most common Natural Resources, Construction and Maintenance occupations in Winnebago County are Construction & Extraction (3,316 | 3.7%), Installation, Maintenance & Repair (2,797 | 3.1%), and Farming, Fishing & Forestry (253 | 0.3%).
Natural Resources, Construction and Maintenance Occupations by Sex
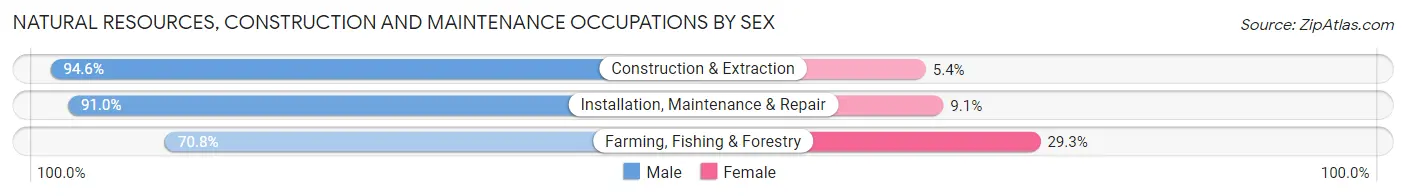
| Occupation | Male | Female |
| Farming, Fishing & Forestry | 179 (70.8%) | 74 (29.2%) |
| Construction & Extraction | 3,137 (94.6%) | 179 (5.4%) |
| Installation, Maintenance & Repair | 2,544 (90.9%) | 253 (9.0%) |
| Total (Category) | 5,860 (92.0%) | 506 (8.0%) |
| Total (Overall) | 48,381 (53.4%) | 42,247 (46.6%) |
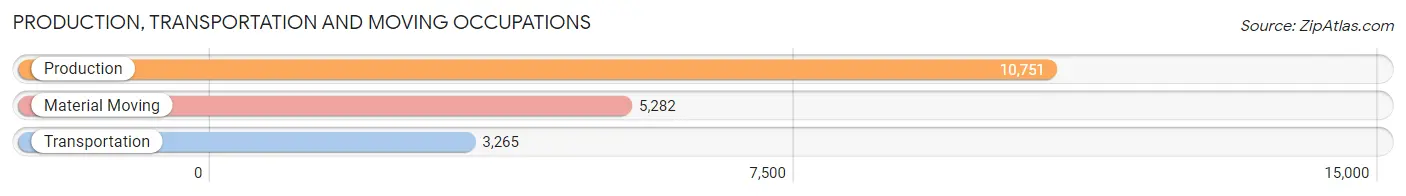
Production, Transportation and Moving Occupations
The most common Production, Transportation and Moving occupations in Winnebago County are Production (10,751 | 11.9%), Material Moving (5,282 | 5.8%), and Transportation (3,265 | 3.6%).
Production, Transportation and Moving Occupations by Sex
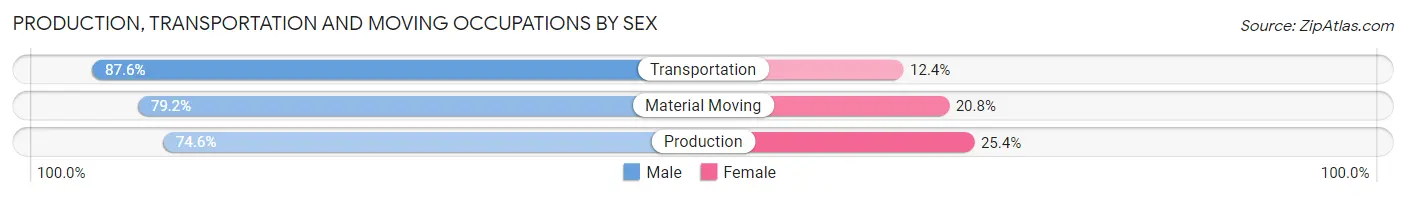
| Occupation | Male | Female |
| Production | 8,020 (74.6%) | 2,731 (25.4%) |
| Transportation | 2,860 (87.6%) | 405 (12.4%) |
| Material Moving | 4,185 (79.2%) | 1,097 (20.8%) |
| Total (Category) | 15,065 (78.1%) | 4,233 (21.9%) |
| Total (Overall) | 48,381 (53.4%) | 42,247 (46.6%) |
Employment Industries by Sex in Winnebago County
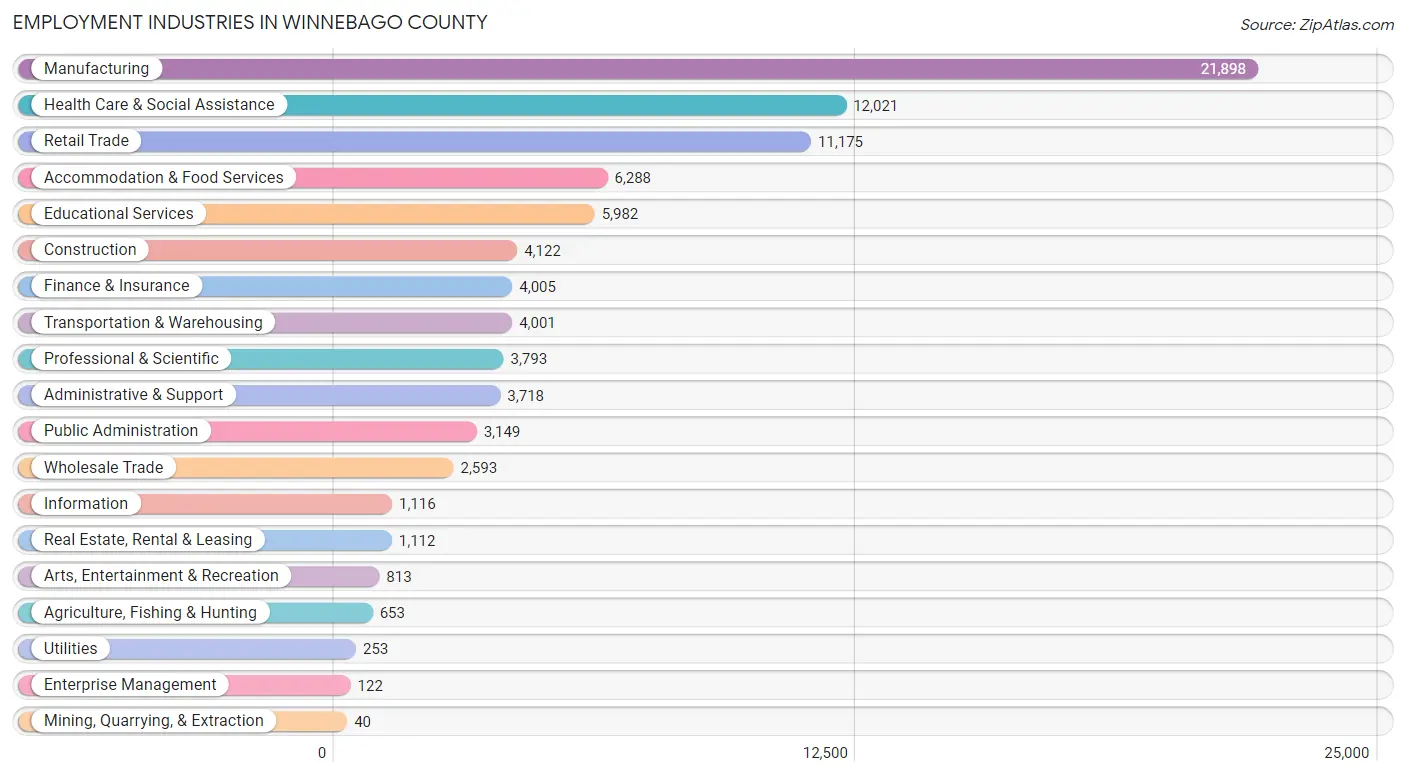
Employment Industries in Winnebago County
The major employment industries in Winnebago County include Manufacturing (21,898 | 24.2%), Health Care & Social Assistance (12,021 | 13.3%), Retail Trade (11,175 | 12.3%), Accommodation & Food Services (6,288 | 6.9%), and Educational Services (5,982 | 6.6%).
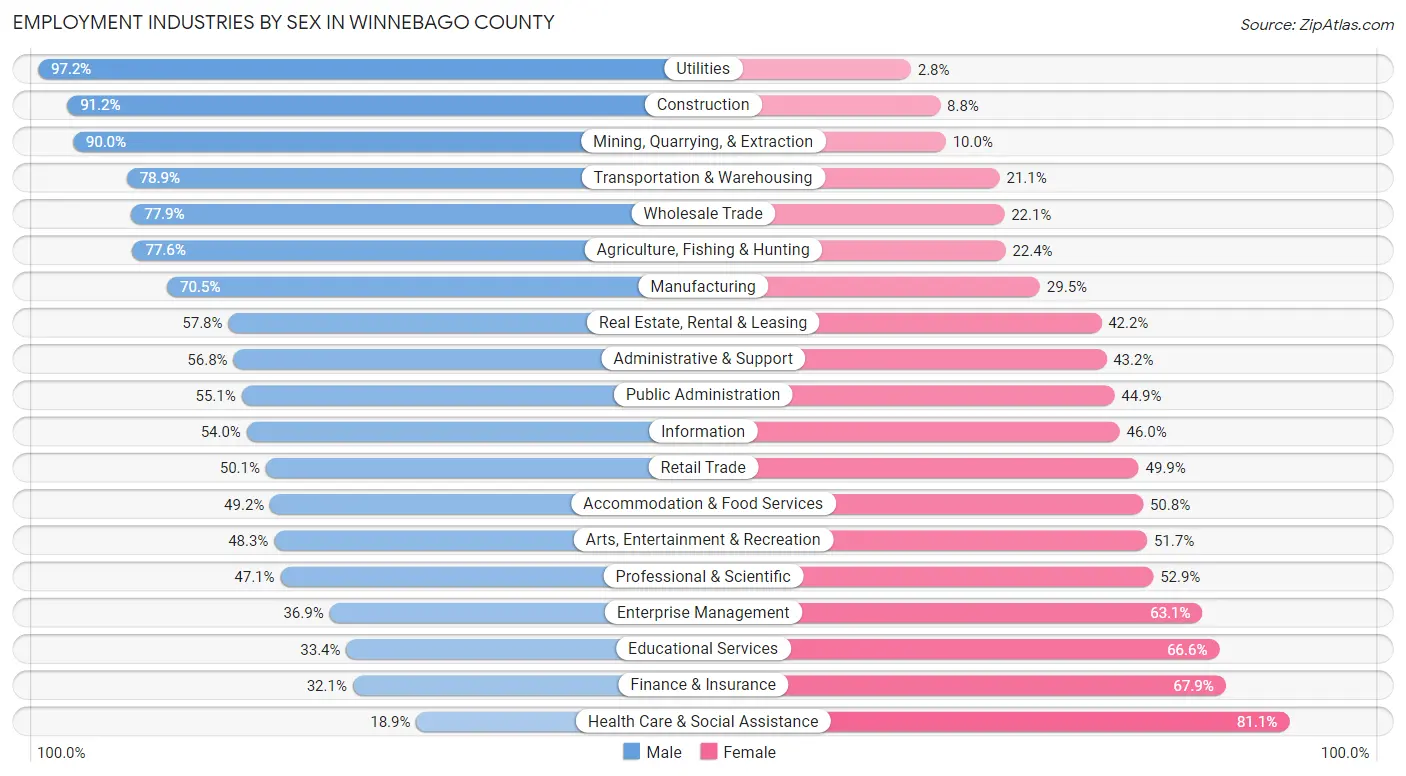
Employment Industries by Sex in Winnebago County
The Winnebago County industries that see more men than women are Utilities (97.2%), Construction (91.2%), and Mining, Quarrying, & Extraction (90.0%), whereas the industries that tend to have a higher number of women are Health Care & Social Assistance (81.1%), Finance & Insurance (67.9%), and Educational Services (66.6%).
| Industry | Male | Female |
| Agriculture, Fishing & Hunting | 507 (77.6%) | 146 (22.4%) |
| Mining, Quarrying, & Extraction | 36 (90.0%) | 4 (10.0%) |
| Construction | 3,758 (91.2%) | 364 (8.8%) |
| Manufacturing | 15,440 (70.5%) | 6,458 (29.5%) |
| Wholesale Trade | 2,020 (77.9%) | 573 (22.1%) |
| Retail Trade | 5,596 (50.1%) | 5,579 (49.9%) |
| Transportation & Warehousing | 3,155 (78.9%) | 846 (21.1%) |
| Utilities | 246 (97.2%) | 7 (2.8%) |
| Information | 603 (54.0%) | 513 (46.0%) |
| Finance & Insurance | 1,285 (32.1%) | 2,720 (67.9%) |
| Real Estate, Rental & Leasing | 643 (57.8%) | 469 (42.2%) |
| Professional & Scientific | 1,785 (47.1%) | 2,008 (52.9%) |
| Enterprise Management | 45 (36.9%) | 77 (63.1%) |
| Administrative & Support | 2,111 (56.8%) | 1,607 (43.2%) |
| Educational Services | 1,998 (33.4%) | 3,984 (66.6%) |
| Health Care & Social Assistance | 2,274 (18.9%) | 9,747 (81.1%) |
| Arts, Entertainment & Recreation | 393 (48.3%) | 420 (51.7%) |
| Accommodation & Food Services | 3,092 (49.2%) | 3,196 (50.8%) |
| Public Administration | 1,735 (55.1%) | 1,414 (44.9%) |
| Total | 48,381 (53.4%) | 42,247 (46.6%) |
Education in Winnebago County
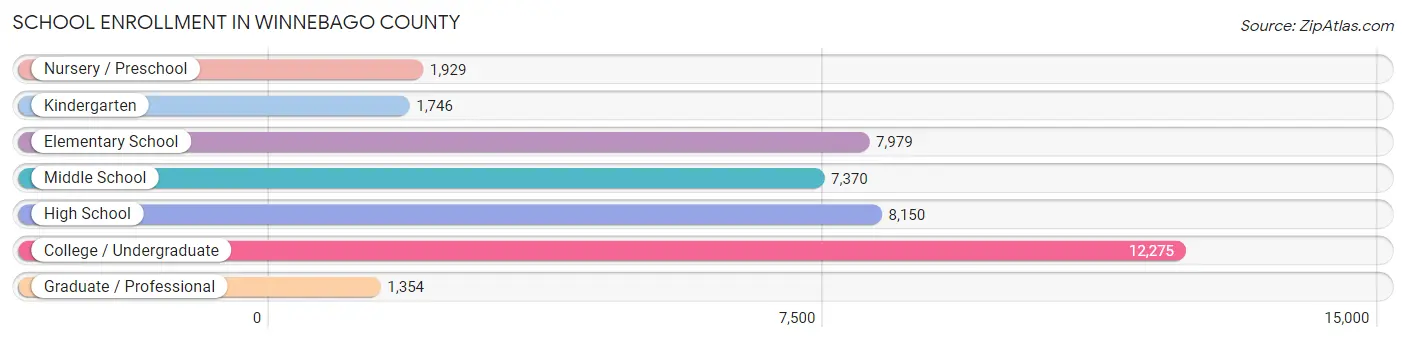
School Enrollment in Winnebago County
The most common levels of schooling among the 40,803 students in Winnebago County are college / undergraduate (12,275 | 30.1%), high school (8,150 | 20.0%), and elementary school (7,979 | 19.6%).
| School Level | # Students | % Students |
| Nursery / Preschool | 1,929 | 4.7% |
| Kindergarten | 1,746 | 4.3% |
| Elementary School | 7,979 | 19.6% |
| Middle School | 7,370 | 18.1% |
| High School | 8,150 | 20.0% |
| College / Undergraduate | 12,275 | 30.1% |
| Graduate / Professional | 1,354 | 3.3% |
| Total | 40,803 | 100.0% |
School Enrollment by Age by Funding Source in Winnebago County
Out of a total of 40,803 students who are enrolled in schools in Winnebago County, 4,815 (11.8%) attend a private institution, while the remaining 35,988 (88.2%) are enrolled in public schools. The age group of 3 to 4 year olds has the highest likelihood of being enrolled in private schools, with 207 (20.7% in the age bracket) enrolled. Conversely, the age group of 20 to 24 year olds has the lowest likelihood of being enrolled in a private school, with 6,422 (94.1% in the age bracket) attending a public institution.
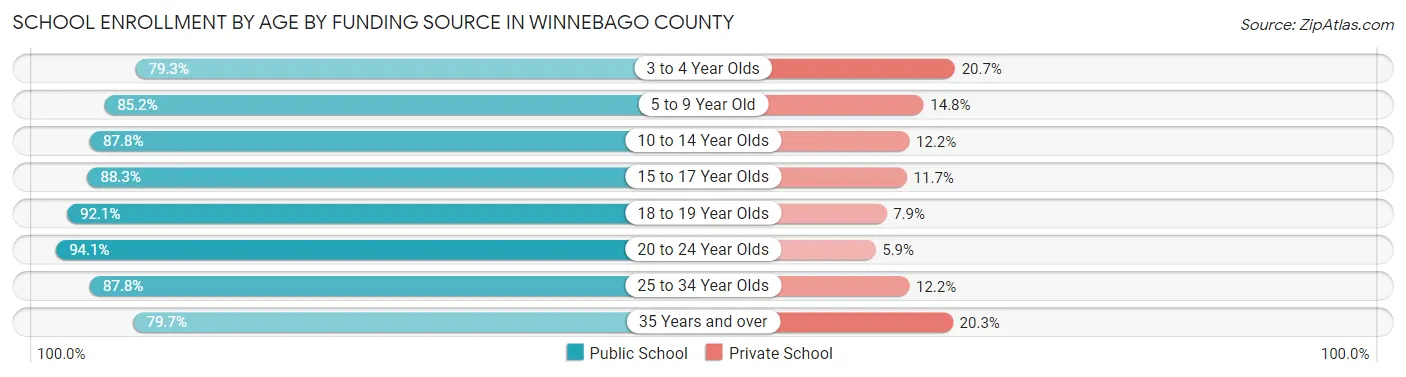
| Age Bracket | Public School | Private School |
| 3 to 4 Year Olds | 794 (79.3%) | 207 (20.7%) |
| 5 to 9 Year Old | 7,965 (85.2%) | 1,388 (14.8%) |
| 10 to 14 Year Olds | 8,233 (87.8%) | 1,143 (12.2%) |
| 15 to 17 Year Olds | 5,228 (88.3%) | 695 (11.7%) |
| 18 to 19 Year Olds | 3,993 (92.1%) | 344 (7.9%) |
| 20 to 24 Year Olds | 6,422 (94.1%) | 402 (5.9%) |
| 25 to 34 Year Olds | 2,050 (87.8%) | 284 (12.2%) |
| 35 Years and over | 1,319 (79.7%) | 336 (20.3%) |
| Total | 35,988 (88.2%) | 4,815 (11.8%) |
Educational Attainment by Field of Study in Winnebago County
Business (7,481 | 20.2%), education (5,563 | 15.0%), science & technology (3,883 | 10.5%), arts & humanities (2,924 | 7.9%), and engineering (2,834 | 7.6%) are the most common fields of study among 37,055 individuals in Winnebago County who have obtained a bachelor's degree or higher.
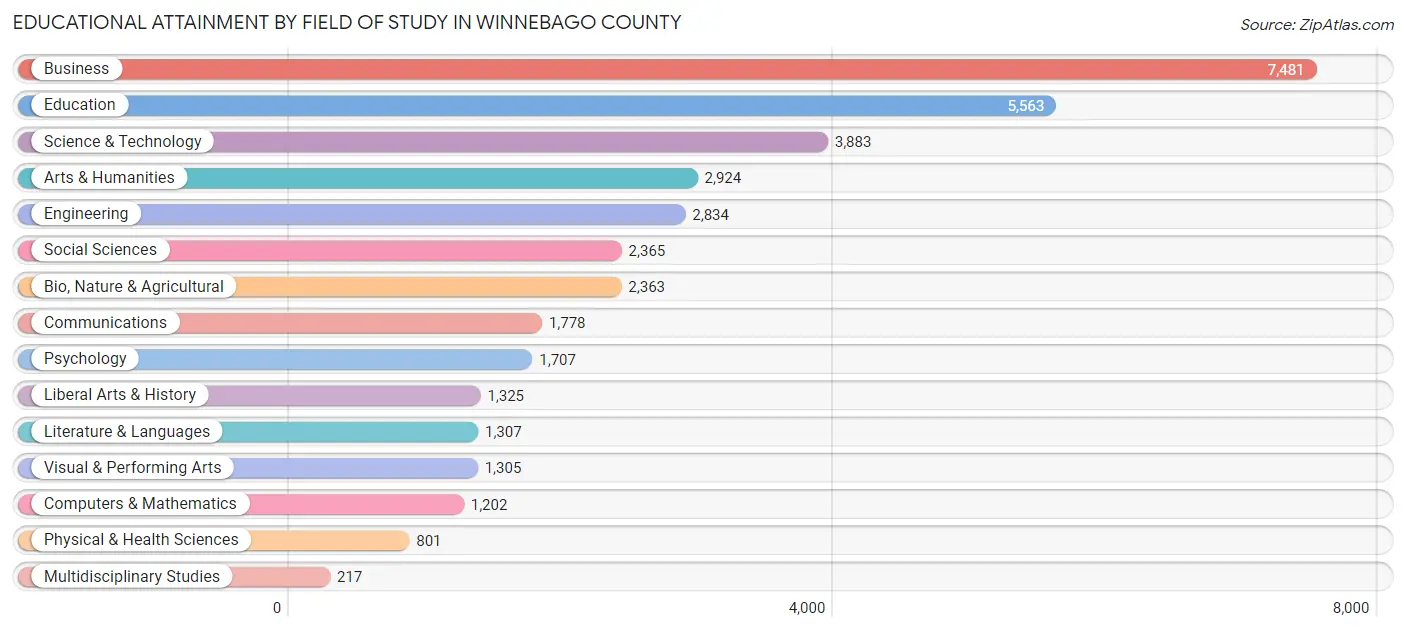
| Field of Study | # Graduates | % Graduates |
| Computers & Mathematics | 1,202 | 3.2% |
| Bio, Nature & Agricultural | 2,363 | 6.4% |
| Physical & Health Sciences | 801 | 2.2% |
| Psychology | 1,707 | 4.6% |
| Social Sciences | 2,365 | 6.4% |
| Engineering | 2,834 | 7.6% |
| Multidisciplinary Studies | 217 | 0.6% |
| Science & Technology | 3,883 | 10.5% |
| Business | 7,481 | 20.2% |
| Education | 5,563 | 15.0% |
| Literature & Languages | 1,307 | 3.5% |
| Liberal Arts & History | 1,325 | 3.6% |
| Visual & Performing Arts | 1,305 | 3.5% |
| Communications | 1,778 | 4.8% |
| Arts & Humanities | 2,924 | 7.9% |
| Total | 37,055 | 100.0% |
Transportation & Commute in Winnebago County
Vehicle Availability by Sex in Winnebago County
The most prevalent vehicle ownership categories in Winnebago County are males with 2 vehicles (21,661, accounting for 46.0%) and females with 2 vehicles (18,999, making up 53.2%).
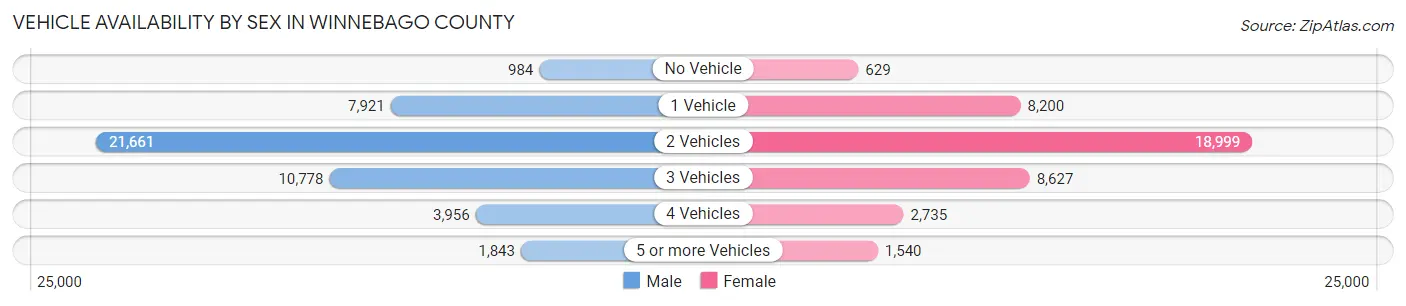
| Vehicles Available | Male | Female |
| No Vehicle | 984 (2.1%) | 629 (1.5%) |
| 1 Vehicle | 7,921 (16.8%) | 8,200 (20.1%) |
| 2 Vehicles | 21,661 (46.0%) | 18,999 (46.7%) |
| 3 Vehicles | 10,778 (22.9%) | 8,627 (21.2%) |
| 4 Vehicles | 3,956 (8.4%) | 2,735 (6.7%) |
| 5 or more Vehicles | 1,843 (3.9%) | 1,540 (3.8%) |
| Total | 47,143 (100.0%) | 40,730 (100.0%) |
Commute Time in Winnebago County
The most frequently occuring commute durations in Winnebago County are 10 to 14 minutes (16,806 commuters, 20.8%), 15 to 19 minutes (16,520 commuters, 20.4%), and 5 to 9 minutes (13,936 commuters, 17.2%).
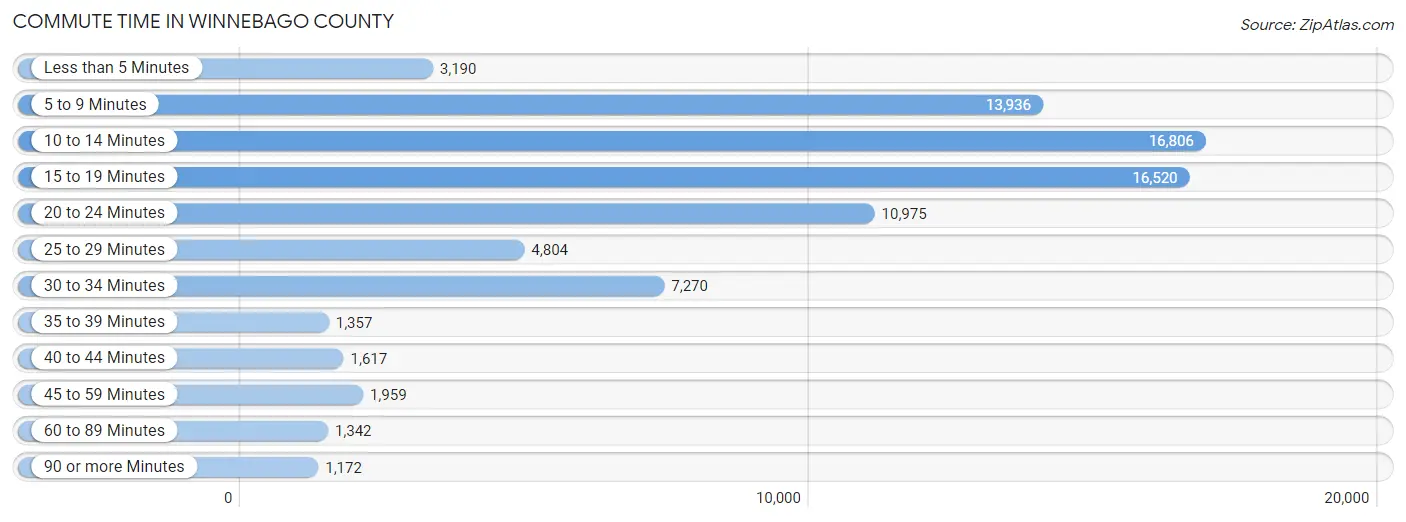
| Commute Time | # Commuters | % Commuters |
| Less than 5 Minutes | 3,190 | 3.9% |
| 5 to 9 Minutes | 13,936 | 17.2% |
| 10 to 14 Minutes | 16,806 | 20.8% |
| 15 to 19 Minutes | 16,520 | 20.4% |
| 20 to 24 Minutes | 10,975 | 13.6% |
| 25 to 29 Minutes | 4,804 | 5.9% |
| 30 to 34 Minutes | 7,270 | 9.0% |
| 35 to 39 Minutes | 1,357 | 1.7% |
| 40 to 44 Minutes | 1,617 | 2.0% |
| 45 to 59 Minutes | 1,959 | 2.4% |
| 60 to 89 Minutes | 1,342 | 1.7% |
| 90 or more Minutes | 1,172 | 1.5% |
Commute Time by Sex in Winnebago County
The most common commute times in Winnebago County are 10 to 14 minutes (9,275 commuters, 21.1%) for males and 15 to 19 minutes (7,945 commuters, 21.4%) for females.
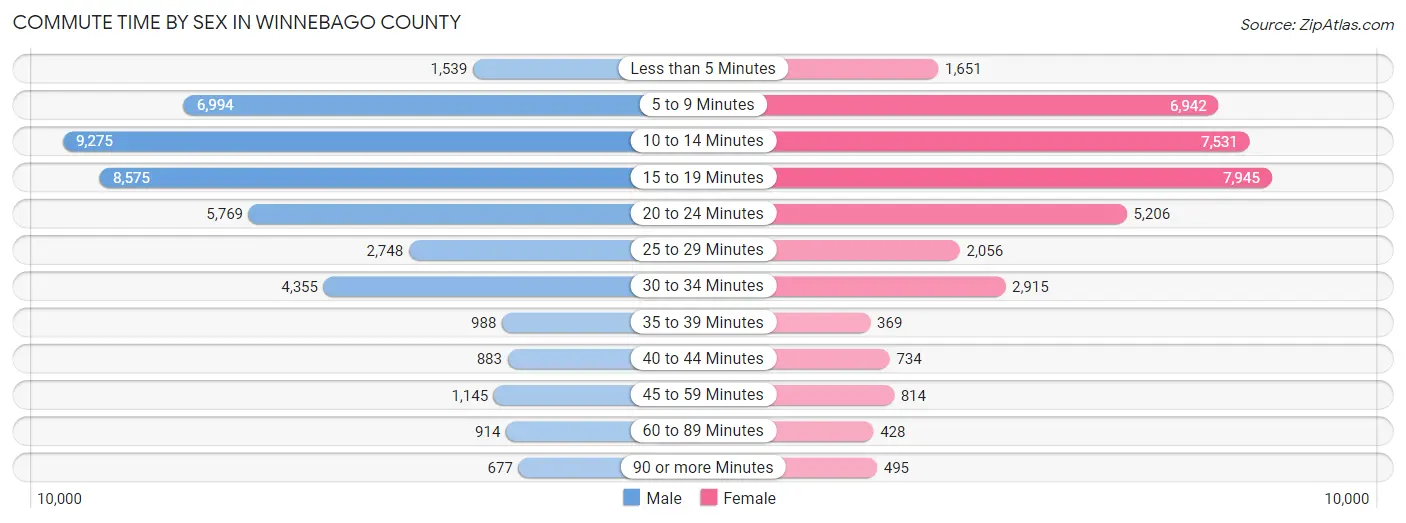
| Commute Time | Male | Female |
| Less than 5 Minutes | 1,539 (3.5%) | 1,651 (4.4%) |
| 5 to 9 Minutes | 6,994 (16.0%) | 6,942 (18.7%) |
| 10 to 14 Minutes | 9,275 (21.1%) | 7,531 (20.3%) |
| 15 to 19 Minutes | 8,575 (19.6%) | 7,945 (21.4%) |
| 20 to 24 Minutes | 5,769 (13.2%) | 5,206 (14.0%) |
| 25 to 29 Minutes | 2,748 (6.3%) | 2,056 (5.5%) |
| 30 to 34 Minutes | 4,355 (9.9%) | 2,915 (7.9%) |
| 35 to 39 Minutes | 988 (2.2%) | 369 (1.0%) |
| 40 to 44 Minutes | 883 (2.0%) | 734 (2.0%) |
| 45 to 59 Minutes | 1,145 (2.6%) | 814 (2.2%) |
| 60 to 89 Minutes | 914 (2.1%) | 428 (1.1%) |
| 90 or more Minutes | 677 (1.5%) | 495 (1.3%) |
Time of Departure to Work by Sex in Winnebago County
The most frequent times of departure to work in Winnebago County are 7:00 AM to 7:29 AM (4,648, 10.6%) for males and 7:30 AM to 7:59 AM (5,707, 15.4%) for females.
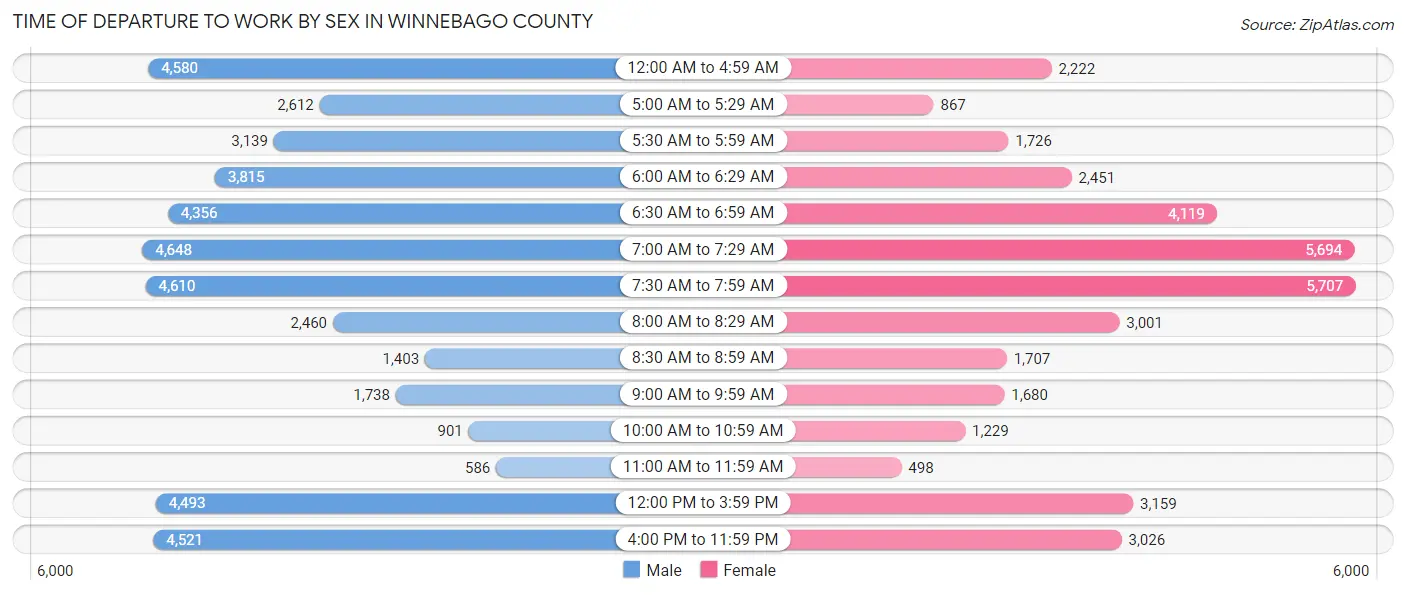
| Time of Departure | Male | Female |
| 12:00 AM to 4:59 AM | 4,580 (10.4%) | 2,222 (6.0%) |
| 5:00 AM to 5:29 AM | 2,612 (6.0%) | 867 (2.3%) |
| 5:30 AM to 5:59 AM | 3,139 (7.2%) | 1,726 (4.6%) |
| 6:00 AM to 6:29 AM | 3,815 (8.7%) | 2,451 (6.6%) |
| 6:30 AM to 6:59 AM | 4,356 (9.9%) | 4,119 (11.1%) |
| 7:00 AM to 7:29 AM | 4,648 (10.6%) | 5,694 (15.3%) |
| 7:30 AM to 7:59 AM | 4,610 (10.5%) | 5,707 (15.4%) |
| 8:00 AM to 8:29 AM | 2,460 (5.6%) | 3,001 (8.1%) |
| 8:30 AM to 8:59 AM | 1,403 (3.2%) | 1,707 (4.6%) |
| 9:00 AM to 9:59 AM | 1,738 (4.0%) | 1,680 (4.5%) |
| 10:00 AM to 10:59 AM | 901 (2.1%) | 1,229 (3.3%) |
| 11:00 AM to 11:59 AM | 586 (1.3%) | 498 (1.3%) |
| 12:00 PM to 3:59 PM | 4,493 (10.2%) | 3,159 (8.5%) |
| 4:00 PM to 11:59 PM | 4,521 (10.3%) | 3,026 (8.2%) |
| Total | 43,862 (100.0%) | 37,086 (100.0%) |
Housing Occupancy in Winnebago County
Occupancy by Ownership in Winnebago County
Of the total 71,943 dwellings in Winnebago County, owner-occupied units account for 47,490 (66.0%), while renter-occupied units make up 24,453 (34.0%).
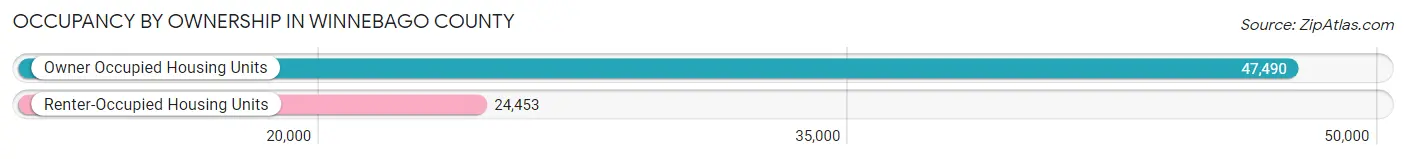
| Occupancy | # Housing Units | % Housing Units |
| Owner Occupied Housing Units | 47,490 | 66.0% |
| Renter-Occupied Housing Units | 24,453 | 34.0% |
| Total Occupied Housing Units | 71,943 | 100.0% |
Occupancy by Household Size in Winnebago County
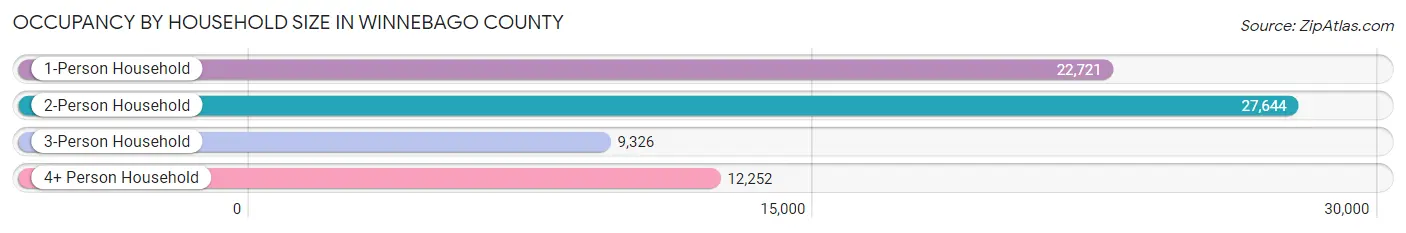
| Household Size | # Housing Units | % Housing Units |
| 1-Person Household | 22,721 | 31.6% |
| 2-Person Household | 27,644 | 38.4% |
| 3-Person Household | 9,326 | 13.0% |
| 4+ Person Household | 12,252 | 17.0% |
| Total Housing Units | 71,943 | 100.0% |
Occupancy by Ownership by Household Size in Winnebago County
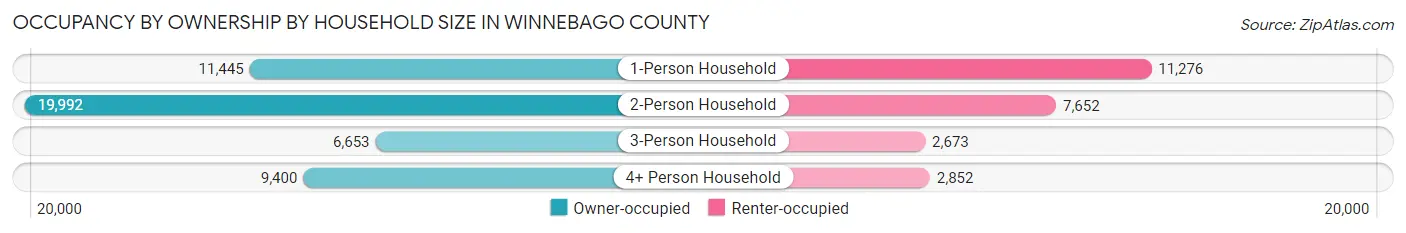
| Household Size | Owner-occupied | Renter-occupied |
| 1-Person Household | 11,445 (50.4%) | 11,276 (49.6%) |
| 2-Person Household | 19,992 (72.3%) | 7,652 (27.7%) |
| 3-Person Household | 6,653 (71.3%) | 2,673 (28.7%) |
| 4+ Person Household | 9,400 (76.7%) | 2,852 (23.3%) |
| Total Housing Units | 47,490 (66.0%) | 24,453 (34.0%) |
Occupancy by Educational Attainment in Winnebago County
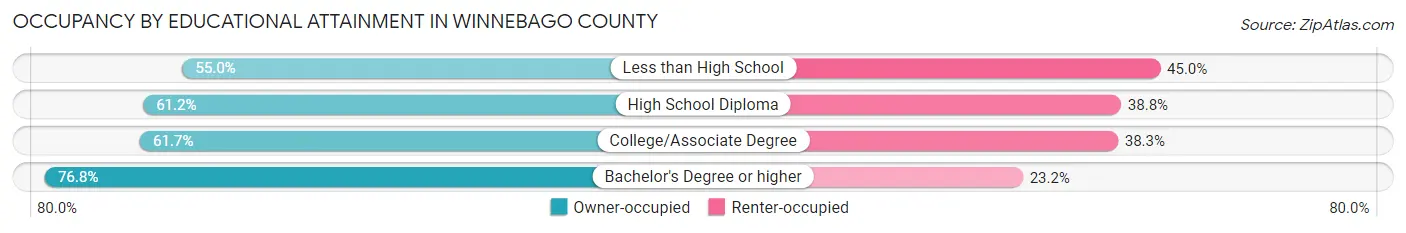
| Household Size | Owner-occupied | Renter-occupied |
| Less than High School | 1,741 (55.0%) | 1,427 (45.0%) |
| High School Diploma | 12,574 (61.2%) | 7,980 (38.8%) |
| College/Associate Degree | 15,702 (61.7%) | 9,757 (38.3%) |
| Bachelor's Degree or higher | 17,473 (76.8%) | 5,289 (23.2%) |
Occupancy by Age of Householder in Winnebago County
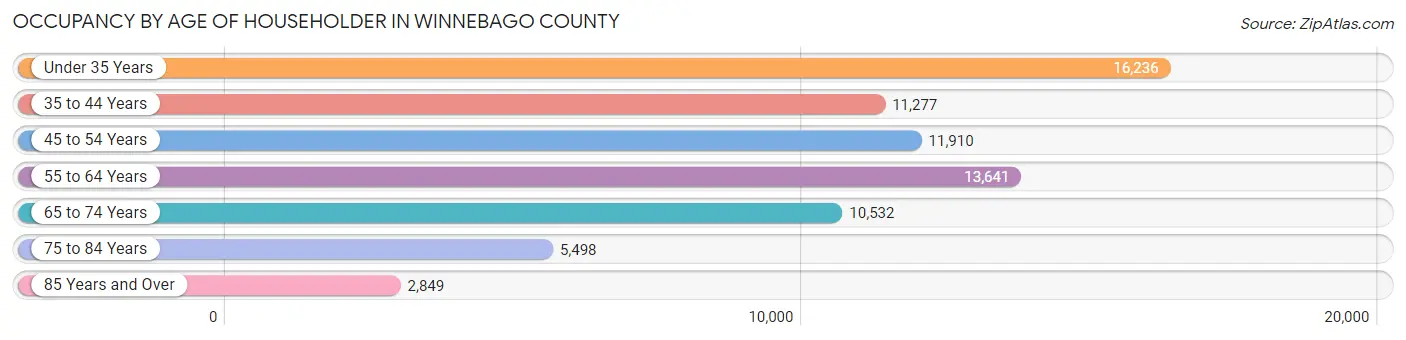
| Age Bracket | # Households | % Households |
| Under 35 Years | 16,236 | 22.6% |
| 35 to 44 Years | 11,277 | 15.7% |
| 45 to 54 Years | 11,910 | 16.6% |
| 55 to 64 Years | 13,641 | 19.0% |
| 65 to 74 Years | 10,532 | 14.6% |
| 75 to 84 Years | 5,498 | 7.6% |
| 85 Years and Over | 2,849 | 4.0% |
| Total | 71,943 | 100.0% |
Housing Finances in Winnebago County
Median Income by Occupancy in Winnebago County
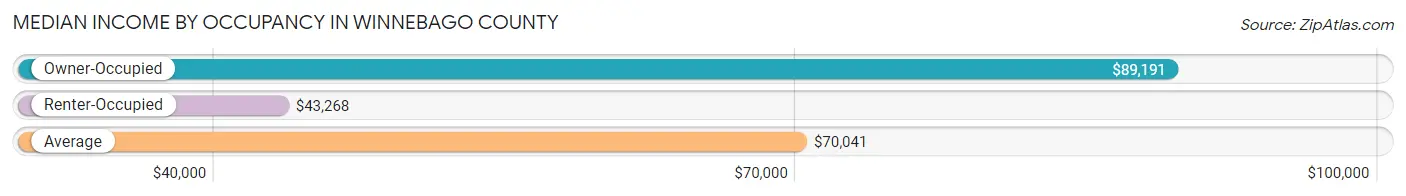
| Occupancy Type | # Households | Median Income |
| Owner-Occupied | 47,490 (66.0%) | $89,191 |
| Renter-Occupied | 24,453 (34.0%) | $43,268 |
| Average | 71,943 (100.0%) | $70,041 |
Occupancy by Householder Income Bracket in Winnebago County
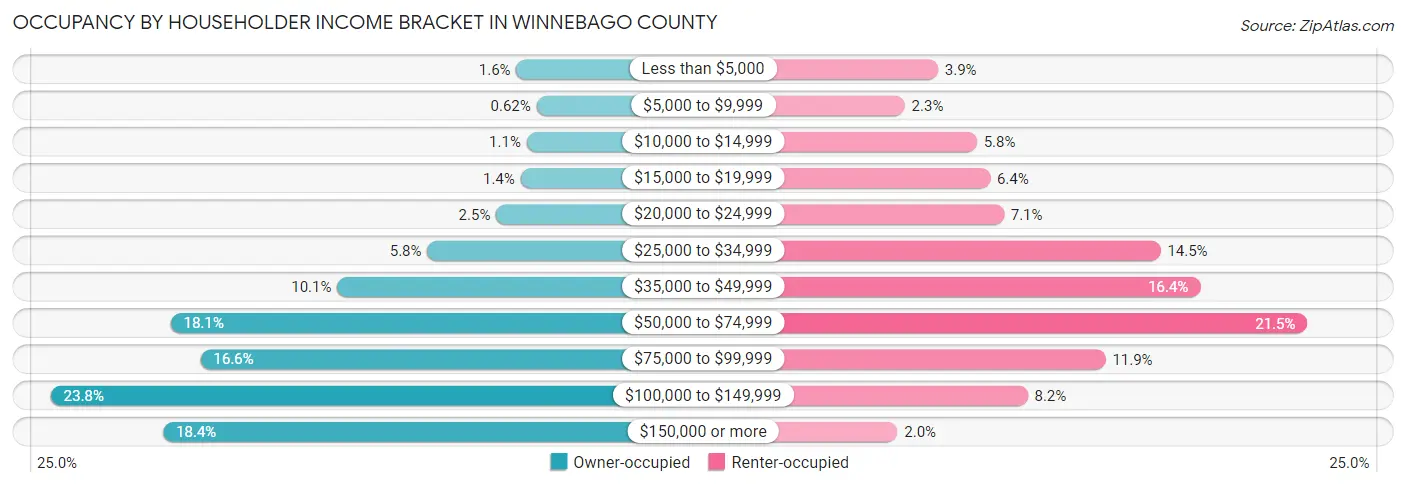
| Income Bracket | Owner-occupied | Renter-occupied |
| Less than $5,000 | 752 (1.6%) | 958 (3.9%) |
| $5,000 to $9,999 | 294 (0.6%) | 571 (2.3%) |
| $10,000 to $14,999 | 519 (1.1%) | 1,410 (5.8%) |
| $15,000 to $19,999 | 656 (1.4%) | 1,564 (6.4%) |
| $20,000 to $24,999 | 1,205 (2.5%) | 1,726 (7.1%) |
| $25,000 to $34,999 | 2,762 (5.8%) | 3,551 (14.5%) |
| $35,000 to $49,999 | 4,799 (10.1%) | 4,012 (16.4%) |
| $50,000 to $74,999 | 8,574 (18.0%) | 5,261 (21.5%) |
| $75,000 to $99,999 | 7,899 (16.6%) | 2,910 (11.9%) |
| $100,000 to $149,999 | 11,285 (23.8%) | 2,003 (8.2%) |
| $150,000 or more | 8,745 (18.4%) | 487 (2.0%) |
| Total | 47,490 (100.0%) | 24,453 (100.0%) |
Monthly Housing Cost Tiers in Winnebago County
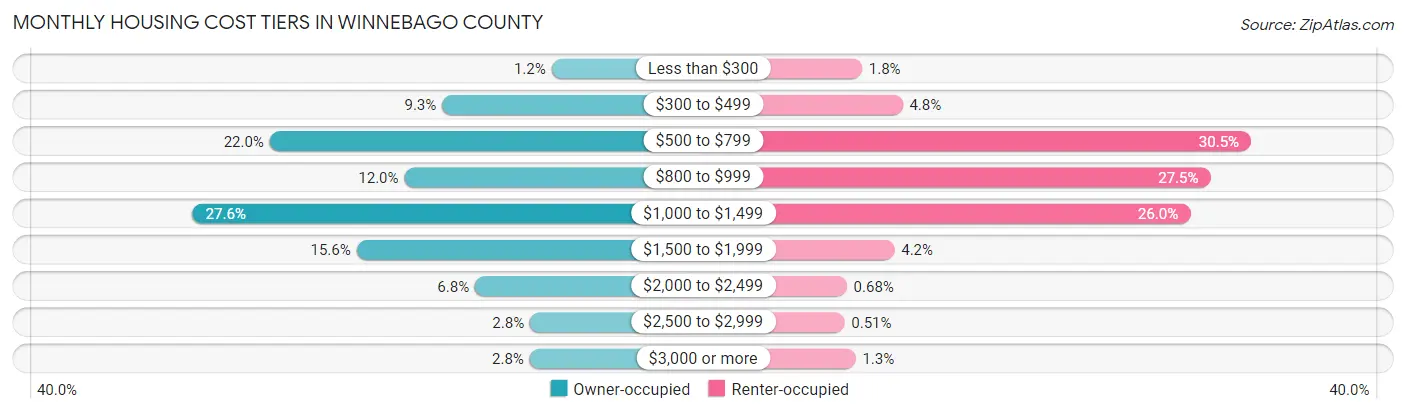
| Monthly Cost | Owner-occupied | Renter-occupied |
| Less than $300 | 567 (1.2%) | 440 (1.8%) |
| $300 to $499 | 4,394 (9.2%) | 1,172 (4.8%) |
| $500 to $799 | 10,423 (22.0%) | 7,445 (30.4%) |
| $800 to $999 | 5,714 (12.0%) | 6,716 (27.5%) |
| $1,000 to $1,499 | 13,115 (27.6%) | 6,350 (26.0%) |
| $1,500 to $1,999 | 7,384 (15.5%) | 1,025 (4.2%) |
| $2,000 to $2,499 | 3,244 (6.8%) | 166 (0.7%) |
| $2,500 to $2,999 | 1,318 (2.8%) | 124 (0.5%) |
| $3,000 or more | 1,331 (2.8%) | 326 (1.3%) |
| Total | 47,490 (100.0%) | 24,453 (100.0%) |
Physical Housing Characteristics in Winnebago County
Housing Structures in Winnebago County
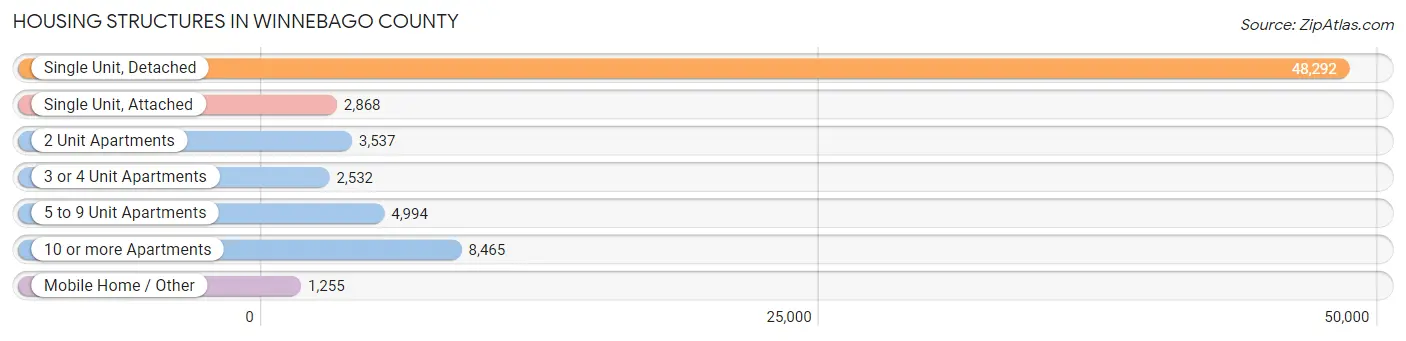
| Structure Type | # Housing Units | % Housing Units |
| Single Unit, Detached | 48,292 | 67.1% |
| Single Unit, Attached | 2,868 | 4.0% |
| 2 Unit Apartments | 3,537 | 4.9% |
| 3 or 4 Unit Apartments | 2,532 | 3.5% |
| 5 to 9 Unit Apartments | 4,994 | 6.9% |
| 10 or more Apartments | 8,465 | 11.8% |
| Mobile Home / Other | 1,255 | 1.7% |
| Total | 71,943 | 100.0% |
Housing Structures by Occupancy in Winnebago County
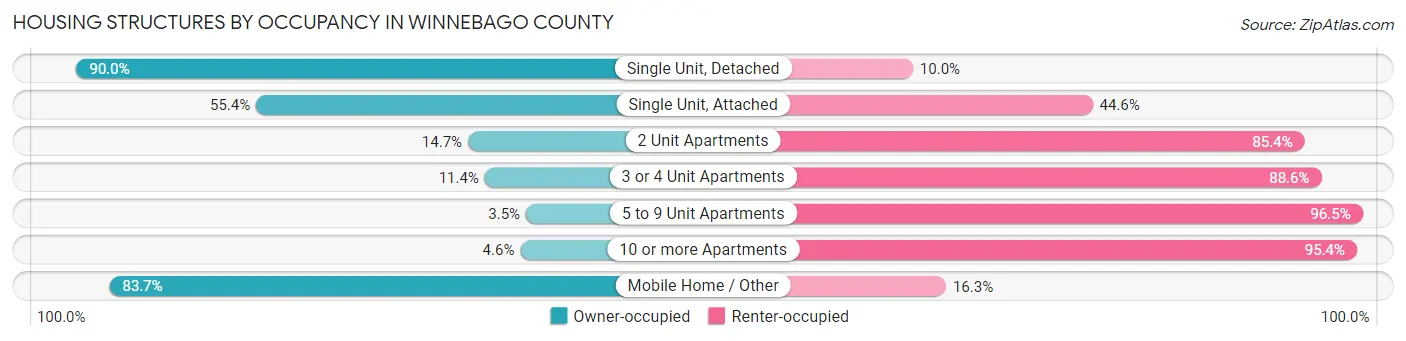
| Structure Type | Owner-occupied | Renter-occupied |
| Single Unit, Detached | 43,482 (90.0%) | 4,810 (10.0%) |
| Single Unit, Attached | 1,590 (55.4%) | 1,278 (44.6%) |
| 2 Unit Apartments | 518 (14.6%) | 3,019 (85.4%) |
| 3 or 4 Unit Apartments | 289 (11.4%) | 2,243 (88.6%) |
| 5 to 9 Unit Apartments | 174 (3.5%) | 4,820 (96.5%) |
| 10 or more Apartments | 387 (4.6%) | 8,078 (95.4%) |
| Mobile Home / Other | 1,050 (83.7%) | 205 (16.3%) |
| Total | 47,490 (66.0%) | 24,453 (34.0%) |
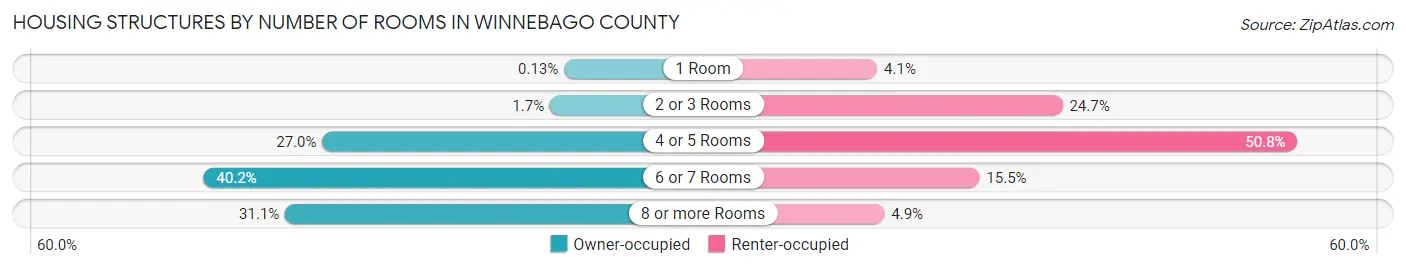
Housing Structures by Number of Rooms in Winnebago County
| Number of Rooms | Owner-occupied | Renter-occupied |
| 1 Room | 60 (0.1%) | 1,009 (4.1%) |
| 2 or 3 Rooms | 802 (1.7%) | 6,040 (24.7%) |
| 4 or 5 Rooms | 12,804 (27.0%) | 12,414 (50.8%) |
| 6 or 7 Rooms | 19,065 (40.2%) | 3,785 (15.5%) |
| 8 or more Rooms | 14,759 (31.1%) | 1,205 (4.9%) |
| Total | 47,490 (100.0%) | 24,453 (100.0%) |
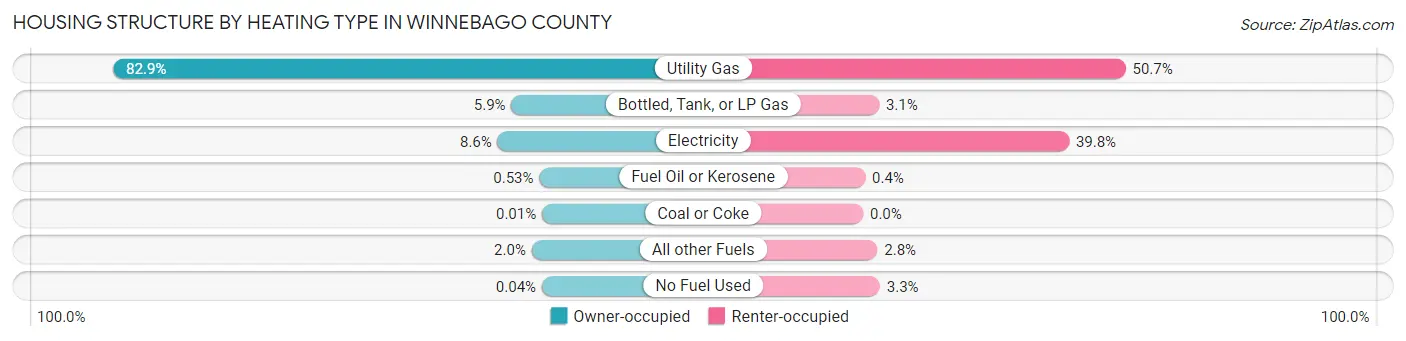
Housing Structure by Heating Type in Winnebago County
| Heating Type | Owner-occupied | Renter-occupied |
| Utility Gas | 39,368 (82.9%) | 12,405 (50.7%) |
| Bottled, Tank, or LP Gas | 2,817 (5.9%) | 750 (3.1%) |
| Electricity | 4,081 (8.6%) | 9,730 (39.8%) |
| Fuel Oil or Kerosene | 253 (0.5%) | 97 (0.4%) |
| Coal or Coke | 4 (0.0%) | 0 (0.0%) |
| All other Fuels | 949 (2.0%) | 677 (2.8%) |
| No Fuel Used | 18 (0.0%) | 794 (3.3%) |
| Total | 47,490 (100.0%) | 24,453 (100.0%) |
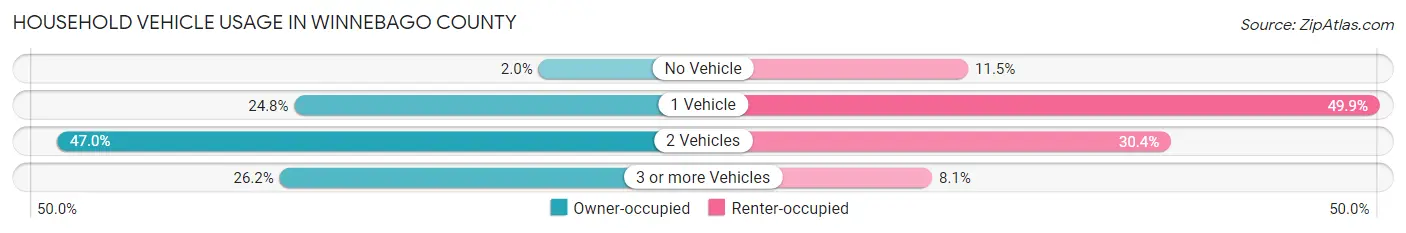
Household Vehicle Usage in Winnebago County
| Vehicles per Household | Owner-occupied | Renter-occupied |
| No Vehicle | 962 (2.0%) | 2,811 (11.5%) |
| 1 Vehicle | 11,786 (24.8%) | 12,207 (49.9%) |
| 2 Vehicles | 22,301 (47.0%) | 7,444 (30.4%) |
| 3 or more Vehicles | 12,441 (26.2%) | 1,991 (8.1%) |
| Total | 47,490 (100.0%) | 24,453 (100.0%) |
Real Estate & Mortgages in Winnebago County
Real Estate and Mortgage Overview in Winnebago County
| Characteristic | Without Mortgage | With Mortgage |
| Housing Units | 18,148 | 29,342 |
| Median Property Value | $192,700 | $189,600 |
| Median Household Income | $67,451 | $6,301 |
| Monthly Housing Costs | $613 | $1,281 |
| Real Estate Taxes | $3,553 | $248 |
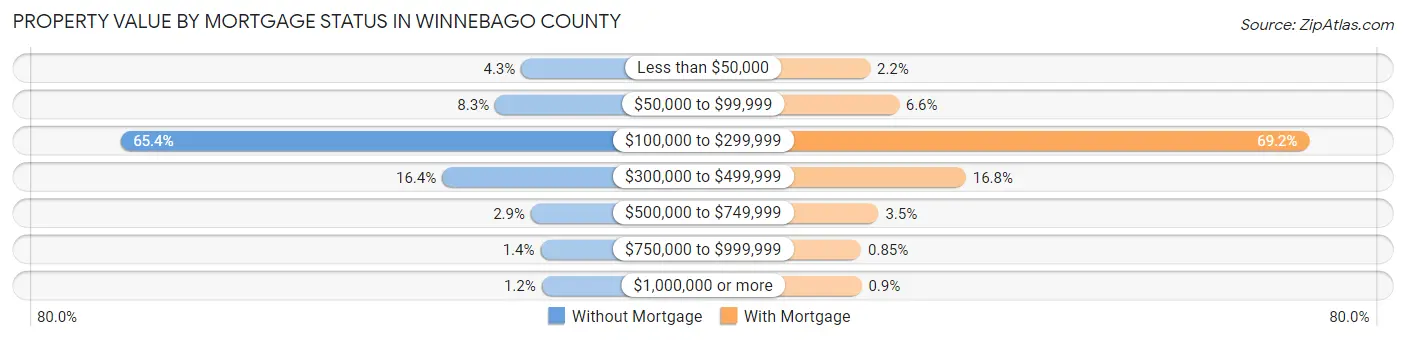
Property Value by Mortgage Status in Winnebago County
| Property Value | Without Mortgage | With Mortgage |
| Less than $50,000 | 787 (4.3%) | 649 (2.2%) |
| $50,000 to $99,999 | 1,510 (8.3%) | 1,934 (6.6%) |
| $100,000 to $299,999 | 11,873 (65.4%) | 20,291 (69.2%) |
| $300,000 to $499,999 | 2,975 (16.4%) | 4,929 (16.8%) |
| $500,000 to $749,999 | 521 (2.9%) | 1,025 (3.5%) |
| $750,000 to $999,999 | 258 (1.4%) | 249 (0.9%) |
| $1,000,000 or more | 224 (1.2%) | 265 (0.9%) |
| Total | 18,148 (100.0%) | 29,342 (100.0%) |
Household Income by Mortgage Status in Winnebago County
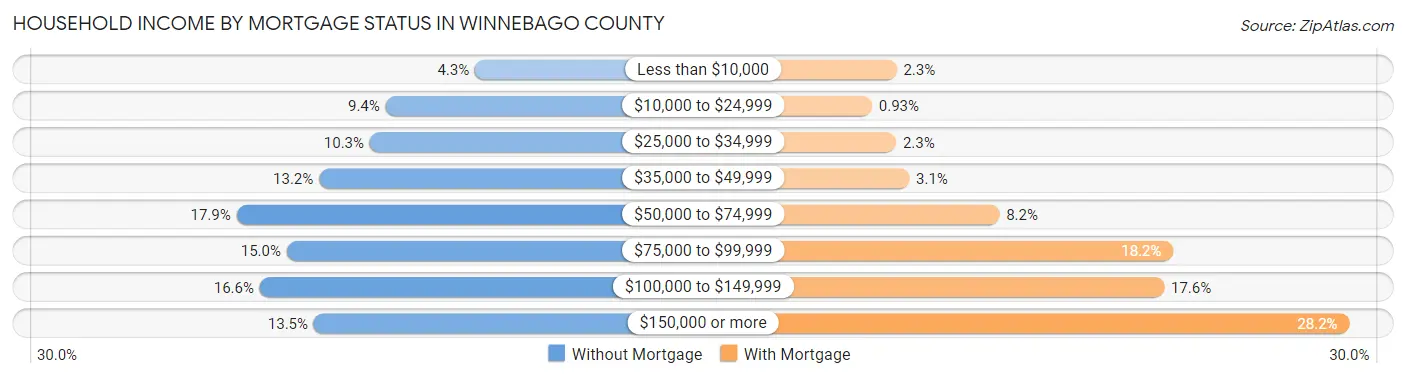
| Household Income | Without Mortgage | With Mortgage |
| Less than $10,000 | 773 (4.3%) | 687 (2.3%) |
| $10,000 to $24,999 | 1,701 (9.4%) | 273 (0.9%) |
| $25,000 to $34,999 | 1,863 (10.3%) | 679 (2.3%) |
| $35,000 to $49,999 | 2,390 (13.2%) | 899 (3.1%) |
| $50,000 to $74,999 | 3,246 (17.9%) | 2,409 (8.2%) |
| $75,000 to $99,999 | 2,726 (15.0%) | 5,328 (18.2%) |
| $100,000 to $149,999 | 3,005 (16.6%) | 5,173 (17.6%) |
| $150,000 or more | 2,444 (13.5%) | 8,280 (28.2%) |
| Total | 18,148 (100.0%) | 29,342 (100.0%) |
Property Value to Household Income Ratio in Winnebago County
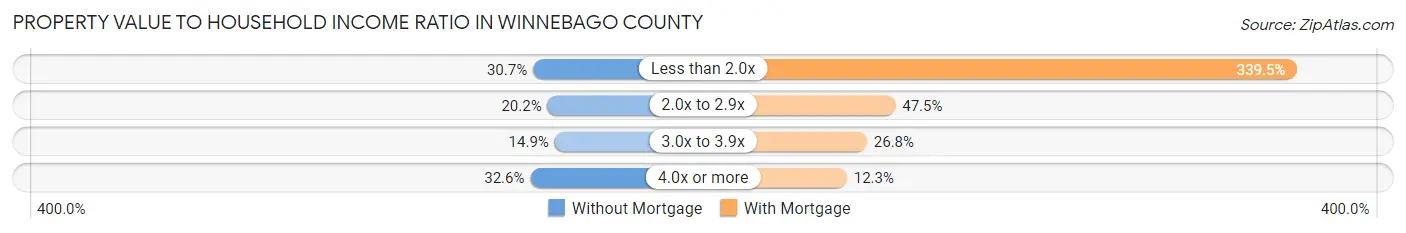
| Value-to-Income Ratio | Without Mortgage | With Mortgage |
| Less than 2.0x | 5,569 (30.7%) | 99,614 (339.5%) |
| 2.0x to 2.9x | 3,659 (20.2%) | 13,935 (47.5%) |
| 3.0x to 3.9x | 2,709 (14.9%) | 7,873 (26.8%) |
| 4.0x or more | 5,921 (32.6%) | 3,602 (12.3%) |
| Total | 18,148 (100.0%) | 29,342 (100.0%) |
Real Estate Taxes by Mortgage Status in Winnebago County

| Property Taxes | Without Mortgage | With Mortgage |
| Less than $800 | 415 (2.3%) | 89 (0.3%) |
| $800 to $1,499 | 646 (3.6%) | 416 (1.4%) |
| $800 to $1,499 | 16,698 (92.0%) | 724 (2.5%) |
| Total | 18,148 (100.0%) | 29,342 (100.0%) |
Health & Disability in Winnebago County
Health Insurance Coverage by Age in Winnebago County
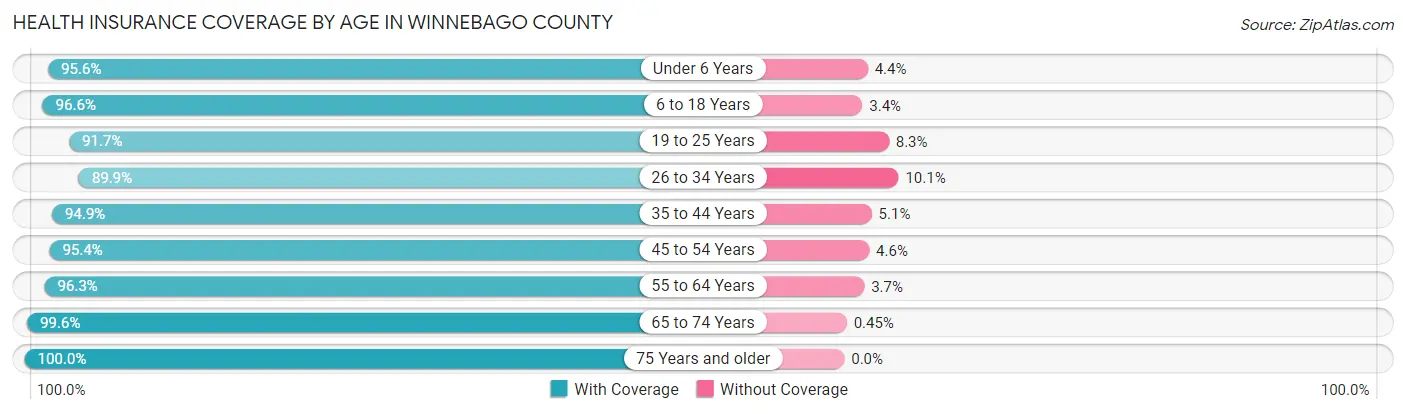
| Age Bracket | With Coverage | Without Coverage |
| Under 6 Years | 10,714 (95.6%) | 490 (4.4%) |
| 6 to 18 Years | 25,471 (96.6%) | 888 (3.4%) |
| 19 to 25 Years | 18,024 (91.7%) | 1,631 (8.3%) |
| 26 to 34 Years | 17,391 (89.9%) | 1,955 (10.1%) |
| 35 to 44 Years | 19,065 (94.9%) | 1,024 (5.1%) |
| 45 to 54 Years | 19,189 (95.4%) | 934 (4.6%) |
| 55 to 64 Years | 21,662 (96.3%) | 835 (3.7%) |
| 65 to 74 Years | 16,242 (99.6%) | 74 (0.4%) |
| 75 Years and older | 11,461 (100.0%) | 0 (0.0%) |
| Total | 159,219 (95.3%) | 7,831 (4.7%) |
Health Insurance Coverage by Citizenship Status in Winnebago County
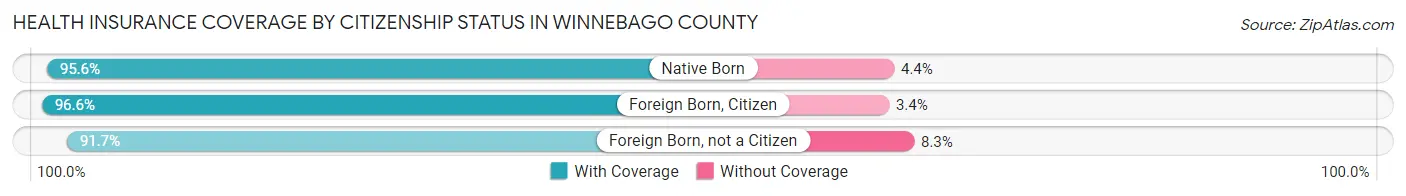
| Citizenship Status | With Coverage | Without Coverage |
| Native Born | 10,714 (95.6%) | 490 (4.4%) |
| Foreign Born, Citizen | 25,471 (96.6%) | 888 (3.4%) |
| Foreign Born, not a Citizen | 18,024 (91.7%) | 1,631 (8.3%) |
Health Insurance Coverage by Household Income in Winnebago County
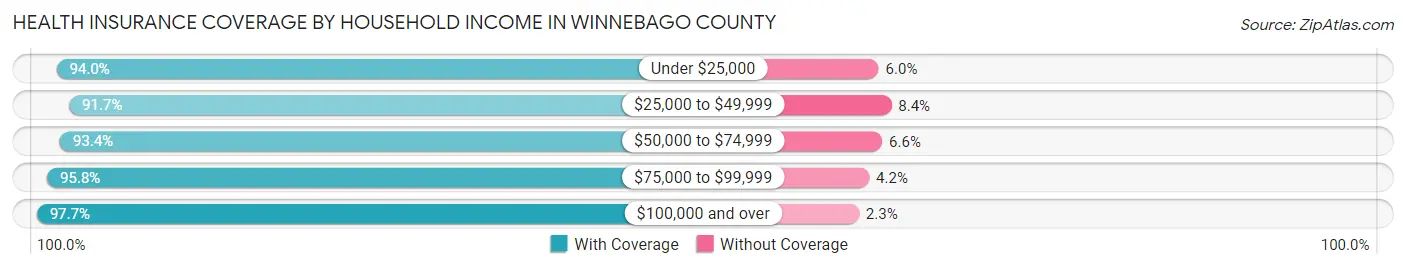
| Household Income | With Coverage | Without Coverage |
| Under $25,000 | 13,889 (94.0%) | 882 (6.0%) |
| $25,000 to $49,999 | 24,566 (91.6%) | 2,237 (8.4%) |
| $50,000 to $74,999 | 27,894 (93.4%) | 1,979 (6.6%) |
| $75,000 to $99,999 | 25,390 (95.8%) | 1,109 (4.2%) |
| $100,000 and over | 64,351 (97.7%) | 1,496 (2.3%) |
Public vs Private Health Insurance Coverage by Age in Winnebago County
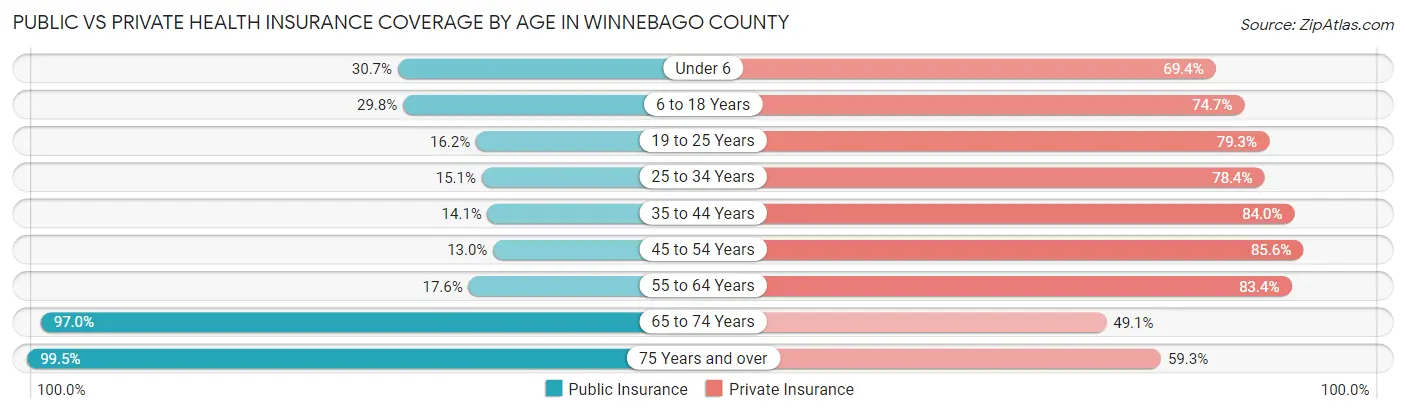
| Age Bracket | Public Insurance | Private Insurance |
| Under 6 | 3,442 (30.7%) | 7,772 (69.4%) |
| 6 to 18 Years | 7,845 (29.8%) | 19,689 (74.7%) |
| 19 to 25 Years | 3,185 (16.2%) | 15,577 (79.2%) |
| 25 to 34 Years | 2,929 (15.1%) | 15,173 (78.4%) |
| 35 to 44 Years | 2,823 (14.1%) | 16,872 (84.0%) |
| 45 to 54 Years | 2,620 (13.0%) | 17,225 (85.6%) |
| 55 to 64 Years | 3,957 (17.6%) | 18,766 (83.4%) |
| 65 to 74 Years | 15,825 (97.0%) | 8,010 (49.1%) |
| 75 Years and over | 11,405 (99.5%) | 6,791 (59.3%) |
| Total | 54,031 (32.3%) | 125,875 (75.3%) |
Disability Status by Sex by Age in Winnebago County
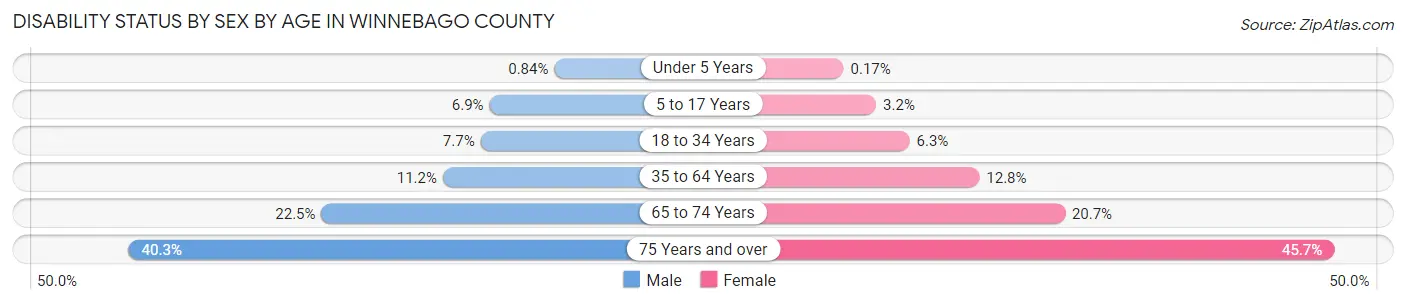
| Age Bracket | Male | Female |
| Under 5 Years | 40 (0.8%) | 7 (0.2%) |
| 5 to 17 Years | 902 (6.9%) | 400 (3.2%) |
| 18 to 34 Years | 1,649 (7.7%) | 1,286 (6.3%) |
| 35 to 64 Years | 3,568 (11.2%) | 3,936 (12.8%) |
| 65 to 74 Years | 1,762 (22.5%) | 1,754 (20.7%) |
| 75 Years and over | 1,935 (40.3%) | 3,044 (45.7%) |
Disability Class by Sex by Age in Winnebago County
Disability Class: Hearing Difficulty
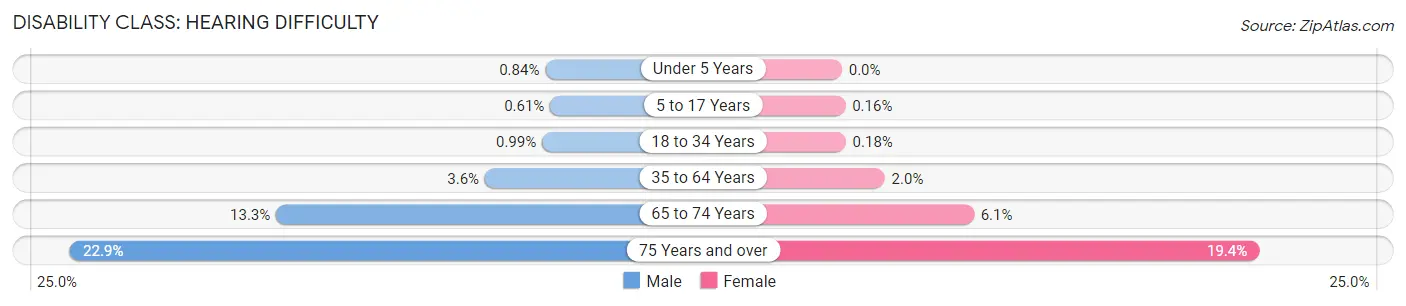
| Age Bracket | Male | Female |
| Under 5 Years | 40 (0.8%) | 0 (0.0%) |
| 5 to 17 Years | 80 (0.6%) | 20 (0.2%) |
| 18 to 34 Years | 212 (1.0%) | 36 (0.2%) |
| 35 to 64 Years | 1,161 (3.6%) | 612 (2.0%) |
| 65 to 74 Years | 1,046 (13.3%) | 518 (6.1%) |
| 75 Years and over | 1,098 (22.9%) | 1,290 (19.4%) |
Disability Class: Vision Difficulty
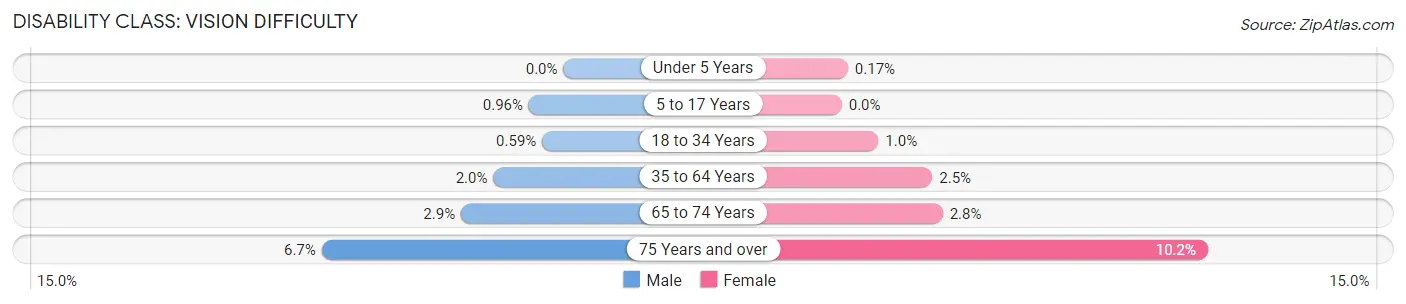
| Age Bracket | Male | Female |
| Under 5 Years | 0 (0.0%) | 7 (0.2%) |
| 5 to 17 Years | 126 (1.0%) | 0 (0.0%) |
| 18 to 34 Years | 127 (0.6%) | 209 (1.0%) |
| 35 to 64 Years | 623 (1.9%) | 778 (2.5%) |
| 65 to 74 Years | 224 (2.9%) | 238 (2.8%) |
| 75 Years and over | 323 (6.7%) | 679 (10.2%) |
Disability Class: Cognitive Difficulty
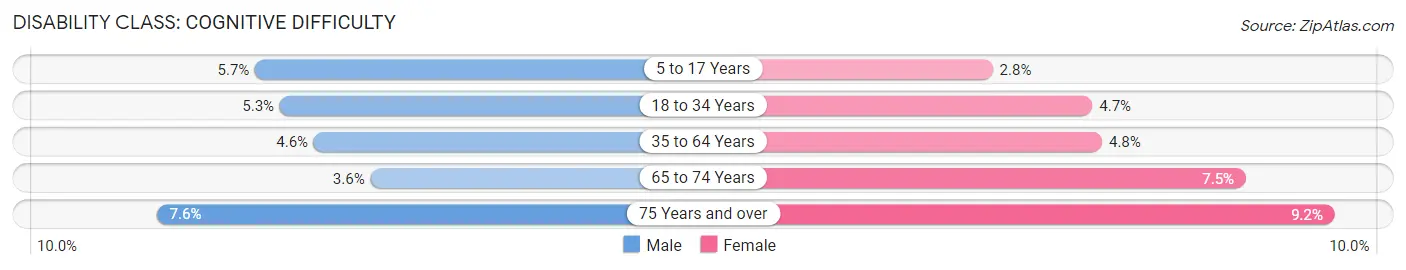
| Age Bracket | Male | Female |
| 5 to 17 Years | 752 (5.7%) | 352 (2.8%) |
| 18 to 34 Years | 1,127 (5.3%) | 951 (4.6%) |
| 35 to 64 Years | 1,476 (4.6%) | 1,489 (4.8%) |
| 65 to 74 Years | 281 (3.6%) | 635 (7.5%) |
| 75 Years and over | 362 (7.5%) | 610 (9.1%) |
Disability Class: Ambulatory Difficulty
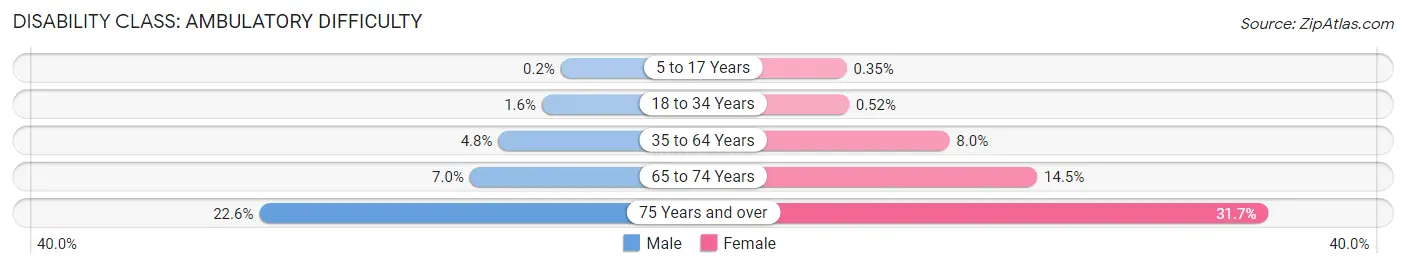
| Age Bracket | Male | Female |
| 5 to 17 Years | 26 (0.2%) | 44 (0.4%) |
| 18 to 34 Years | 342 (1.6%) | 107 (0.5%) |
| 35 to 64 Years | 1,540 (4.8%) | 2,463 (8.0%) |
| 65 to 74 Years | 545 (7.0%) | 1,228 (14.5%) |
| 75 Years and over | 1,083 (22.6%) | 2,110 (31.7%) |
Disability Class: Self-Care Difficulty
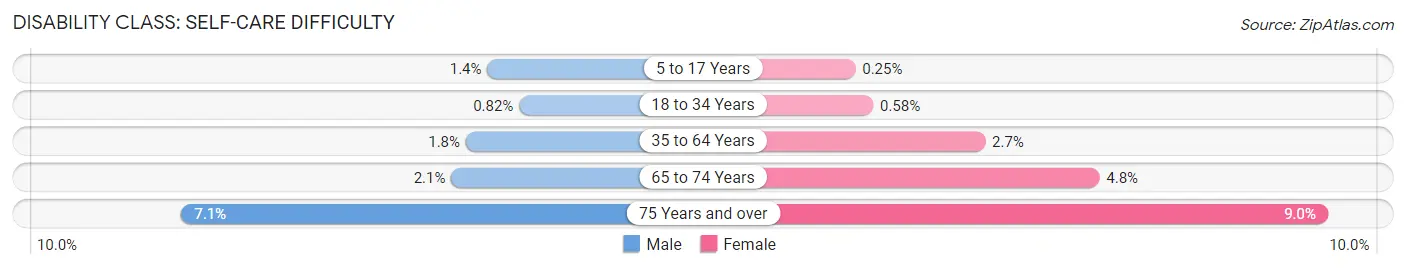
| Age Bracket | Male | Female |
| 5 to 17 Years | 186 (1.4%) | 31 (0.3%) |
| 18 to 34 Years | 176 (0.8%) | 118 (0.6%) |
| 35 to 64 Years | 578 (1.8%) | 820 (2.7%) |
| 65 to 74 Years | 163 (2.1%) | 405 (4.8%) |
| 75 Years and over | 340 (7.1%) | 601 (9.0%) |
Technology Access in Winnebago County
Computing Device Access in Winnebago County
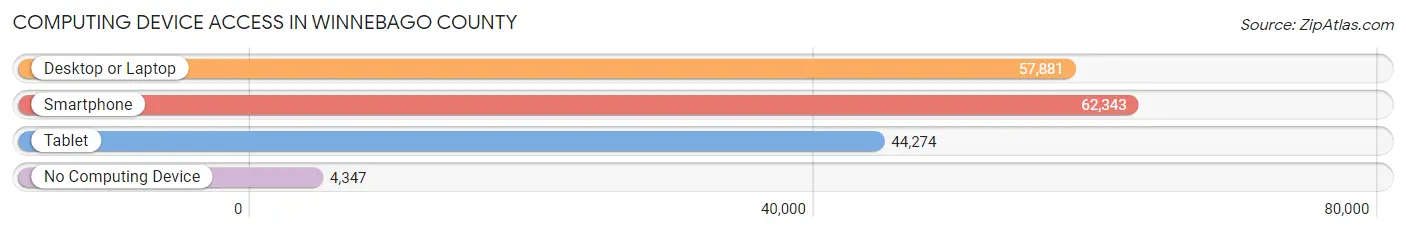
| Device Type | # Households | % Households |
| Desktop or Laptop | 57,881 | 80.4% |
| Smartphone | 62,343 | 86.7% |
| Tablet | 44,274 | 61.5% |
| No Computing Device | 4,347 | 6.0% |
| Total | 71,943 | 100.0% |
Internet Access in Winnebago County
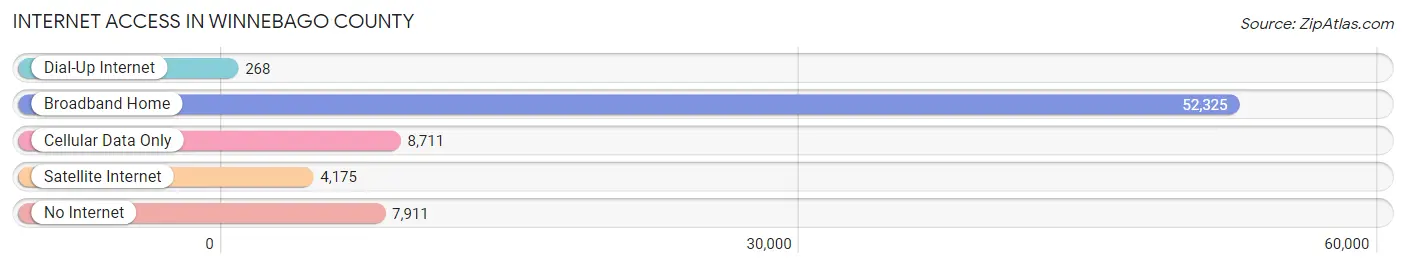
| Internet Type | # Households | % Households |
| Dial-Up Internet | 268 | 0.4% |
| Broadband Home | 52,325 | 72.7% |
| Cellular Data Only | 8,711 | 12.1% |
| Satellite Internet | 4,175 | 5.8% |
| No Internet | 7,911 | 11.0% |
| Total | 71,943 | 100.0% |
Winnebago County Summary
Winnebago County, Wisconsin is located in the east-central part of the state, and is bordered by Calumet, Fond du Lac, Green Lake, and Waushara counties. The county seat is Oshkosh, and the county is part of the Fox Cities metropolitan area. As of the 2010 census, the population of Winnebago County was 166,994, making it the fourth most populous county in Wisconsin.
History
The area that is now Winnebago County was originally inhabited by the Menominee and Ho-Chunk Native American tribes. The first European settlers arrived in the area in the 1830s, and the county was officially organized in 1840. The county was named after the Winnebago tribe, which had been living in the area for centuries.
In the late 19th century, the county experienced a period of rapid growth and development. The city of Oshkosh was established in 1853, and the county seat was moved there in 1856. The city quickly became a major industrial center, and the county's population grew rapidly. By the turn of the century, the county had become a major center for the lumber industry, and the Fox River was lined with sawmills and paper mills.
Geography
Winnebago County covers an area of 845 square miles, making it the second largest county in Wisconsin. The county is located in the east-central part of the state, and is bordered by Calumet, Fond du Lac, Green Lake, and Waushara counties. The Fox River runs through the county, and the Wolf River flows through the northern part of the county. The county is mostly flat, with some rolling hills in the northern and western parts.
The county is home to several state parks, including High Cliff State Park, which is located on the shores of Lake Winnebago. The county also contains several wildlife areas, including the Horicon Marsh, which is one of the largest freshwater marshes in the United States.
Economy
The economy of Winnebago County is largely based on manufacturing and tourism. The county is home to several major manufacturing companies, including Oshkosh Corporation, which is one of the largest manufacturers of military vehicles in the world. The county is also home to several paper mills, which produce paper products for the local and national markets.
The county is also a major tourist destination, and is home to several popular attractions, including the EAA AirVenture Museum, the Oshkosh Public Museum, and the Paine Art Center and Gardens. The county is also home to several popular festivals, including the Oshkosh Air Show and the Country USA Music Festival.
Demographics
As of the 2010 census, the population of Winnebago County was 166,994, making it the fourth most populous county in Wisconsin. The population is spread out across the county, with the largest cities being Oshkosh (66,083), Neenah (25,501), and Menasha (17,353).
The racial makeup of the county is 87.3% White, 5.7% Hispanic or Latino, 3.2% African American, 1.7% Asian, and 1.1% Native American. The median household income is $50,945, and the median home value is $142,400. The county has a poverty rate of 11.2%.
Conclusion
Winnebago County, Wisconsin is a vibrant and diverse county located in the east-central part of the state. The county is home to several major manufacturing companies, and is a major tourist destination. The population of the county is 166,994, and is largely made up of White, Hispanic or Latino, African American, Asian, and Native American residents. The county has a strong economy, and is a great place to live and work.
Common Questions
What is the Total Population of Winnebago County?
Total Population of Winnebago County is 171,197.
What is the Total Male Population of Winnebago County?
Total Male Population of Winnebago County is 87,117.
What is the Total Female Population of Winnebago County?
Total Female Population of Winnebago County is 84,080.
What is the Ratio of Males per 100 Females in Winnebago County?
There are 103.61 Males per 100 Females in Winnebago County.
What is the Ratio of Females per 100 Males in Winnebago County?
There are 96.51 Females per 100 Males in Winnebago County.
What is the Median Population Age in Winnebago County?
Median Population Age in Winnebago County is 38.4 Years.
What is the Average Family Size in Winnebago County
Average Family Size in Winnebago County is 2.9 People.
What is the Average Household Size in Winnebago County
Average Household Size in Winnebago County is 2.3 People.
What is Per Capita Income in Winnebago County?
Per Capita income in Winnebago County is $37,983.
What is the Median Family Income in Winnebago County?
Median Family Income in Winnebago County is $90,900.
What is the Median Household income in Winnebago County?
Median Household Income in Winnebago County is $70,041.
What is Income or Wage Gap in Winnebago County?
Income or Wage Gap in Winnebago County is 27.5%.
Women in Winnebago County earn 72.5 cents for every dollar earned by a man.
What is Family Income Deficit in Winnebago County?
Family Income Deficit in Winnebago County is $12,132.
Families that are below poverty line in Winnebago County earn $12,132 less on average than the poverty threshold level.
What is Inequality or Gini Index in Winnebago County?
Inequality or Gini Index in Winnebago County is 0.42.
How Large is the Labor Force in Winnebago County?
There are 93,027 People in the Labor Forcein in Winnebago County.
What is the Percentage of People in the Labor Force in Winnebago County?
66.2% of People are in the Labor Force in Winnebago County.
What is the Unemployment Rate in Winnebago County?
Unemployment Rate in Winnebago County is 2.4%.