Waushara County, WI
Waushara County Map
Waushara County Overview
24,672
TOTAL POPULATION
13,129
MALE POPULATION
11,543
FEMALE POPULATION
113.74
MALES / 100 FEMALES
87.92
FEMALES / 100 MALES
49.9
MEDIAN AGE
2.9
AVG FAMILY SIZE
2.3
AVG HOUSEHOLD SIZE
$37,927
PER CAPITA INCOME
$75,586
AVG FAMILY INCOME
$61,033
AVG HOUSEHOLD INCOME
36.3%
WAGE / INCOME GAP [ % ]
63.7¢/ $1
WAGE / INCOME GAP [ $ ]
$9,401
FAMILY INCOME DEFICIT
0.44
INEQUALITY / GINI INDEX
11,301
LABOR FORCE [ PEOPLE ]
54.4%
PERCENT IN LABOR FORCE
4.1%
UNEMPLOYMENT RATE
Race in Waushara County
The most populous races in Waushara County are White / Caucasian (22,351 | 90.6%), Hispanic or Latino (1,598 | 6.5%), and Two or more Races (811 | 3.3%).
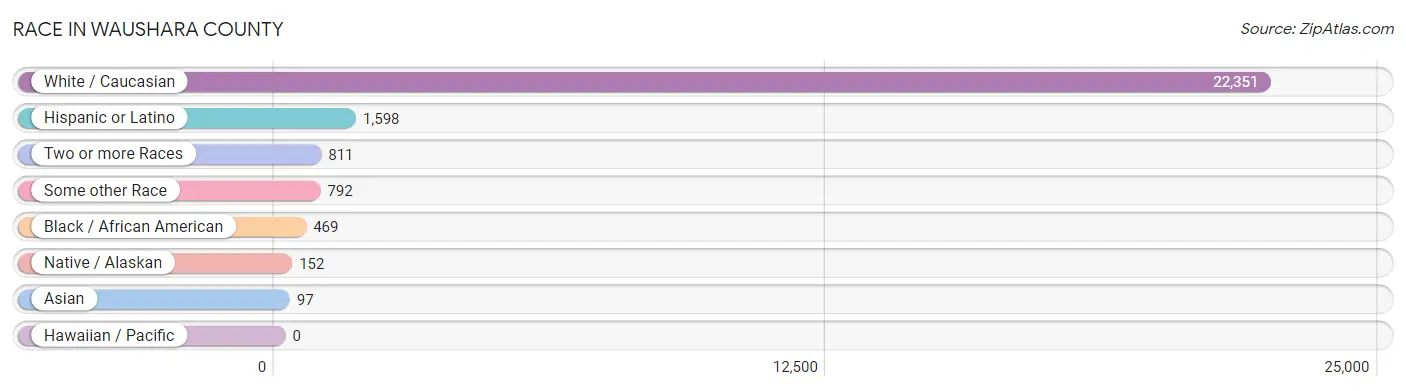
| Race | # Population | % Population |
| Asian | 97 | 0.4% |
| Black / African American | 469 | 1.9% |
| Hawaiian / Pacific | 0 | 0.0% |
| Hispanic or Latino | 1,598 | 6.5% |
| Native / Alaskan | 152 | 0.6% |
| White / Caucasian | 22,351 | 90.6% |
| Two or more Races | 811 | 3.3% |
| Some other Race | 792 | 3.2% |
| Total | 24,672 | 100.0% |
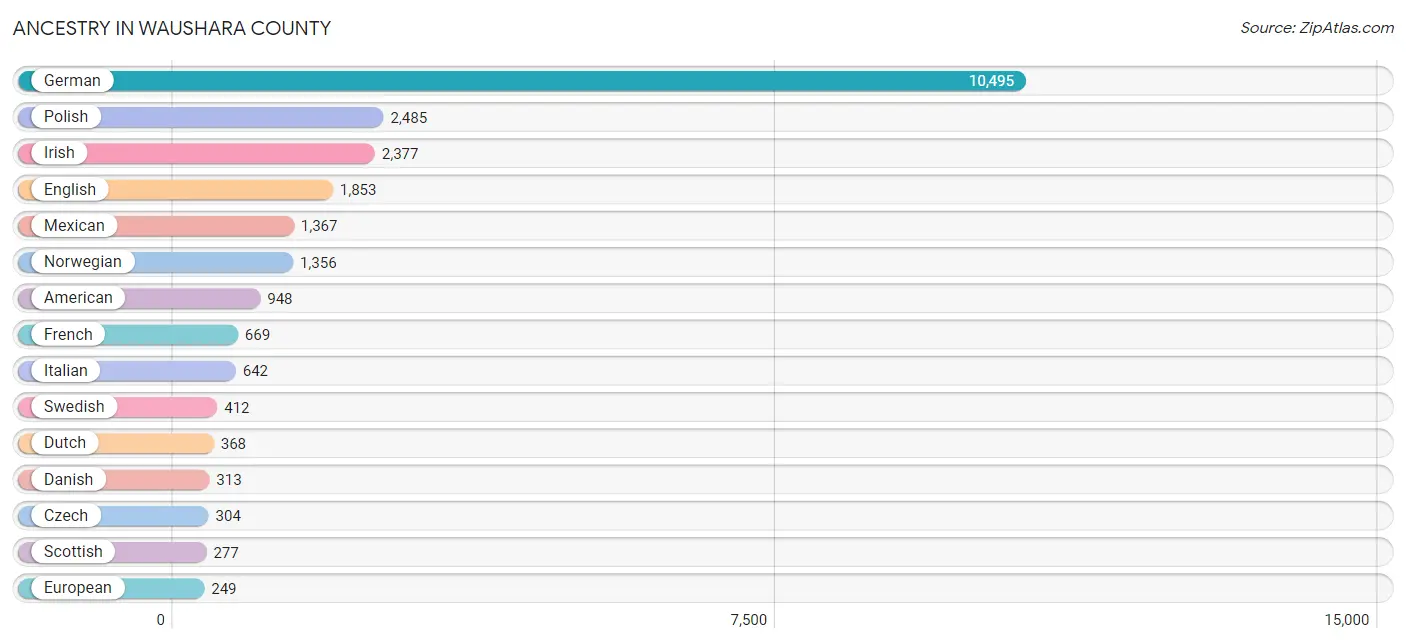
Ancestry in Waushara County
The most populous ancestries reported in Waushara County are German (10,495 | 42.5%), Polish (2,485 | 10.1%), Irish (2,377 | 9.6%), English (1,853 | 7.5%), and Mexican (1,367 | 5.5%), together accounting for 75.3% of all Waushara County residents.
| Ancestry | # Population | % Population |
| African | 133 | 0.5% |
| Alaska Native | 5 | 0.0% |
| Alsatian | 3 | 0.0% |
| American | 948 | 3.8% |
| Arab | 3 | 0.0% |
| Armenian | 12 | 0.1% |
| Assyrian / Chaldean / Syriac | 4 | 0.0% |
| Australian | 8 | 0.0% |
| Austrian | 87 | 0.4% |
| Bangladeshi | 24 | 0.1% |
| Belgian | 52 | 0.2% |
| Bhutanese | 9 | 0.0% |
| Blackfeet | 3 | 0.0% |
| British | 41 | 0.2% |
| Burmese | 6 | 0.0% |
| Canadian | 31 | 0.1% |
| Celtic | 4 | 0.0% |
| Central American | 58 | 0.2% |
| Central American Indian | 14 | 0.1% |
| Cherokee | 22 | 0.1% |
| Chilean | 4 | 0.0% |
| Chippewa | 94 | 0.4% |
| Choctaw | 6 | 0.0% |
| Colombian | 4 | 0.0% |
| Croatian | 55 | 0.2% |
| Cuban | 8 | 0.0% |
| Czech | 304 | 1.2% |
| Czechoslovakian | 37 | 0.2% |
| Danish | 313 | 1.3% |
| Dutch | 368 | 1.5% |
| Eastern European | 11 | 0.0% |
| English | 1,853 | 7.5% |
| European | 249 | 1.0% |
| Finnish | 90 | 0.4% |
| French | 669 | 2.7% |
| French American Indian | 2 | 0.0% |
| French Canadian | 169 | 0.7% |
| German | 10,495 | 42.5% |
| Greek | 63 | 0.3% |
| Guatemalan | 42 | 0.2% |
| Haitian | 8 | 0.0% |
| Hungarian | 155 | 0.6% |
| Icelander | 2 | 0.0% |
| Indian (Asian) | 55 | 0.2% |
| Irish | 2,377 | 9.6% |
| Iroquois | 26 | 0.1% |
| Italian | 642 | 2.6% |
| Jamaican | 28 | 0.1% |
| Korean | 44 | 0.2% |
| Laotian | 3 | 0.0% |
| Latvian | 4 | 0.0% |
| Lebanese | 3 | 0.0% |
| Lithuanian | 73 | 0.3% |
| Macedonian | 19 | 0.1% |
| Malaysian | 20 | 0.1% |
| Menominee | 6 | 0.0% |
| Mexican | 1,367 | 5.5% |
| Nicaraguan | 16 | 0.1% |
| Northern European | 20 | 0.1% |
| Norwegian | 1,356 | 5.5% |
| Pakistani | 3 | 0.0% |
| Pennsylvania German | 29 | 0.1% |
| Polish | 2,485 | 10.1% |
| Portuguese | 31 | 0.1% |
| Potawatomi | 5 | 0.0% |
| Puerto Rican | 79 | 0.3% |
| Romanian | 16 | 0.1% |
| Russian | 145 | 0.6% |
| Scandinavian | 66 | 0.3% |
| Scotch-Irish | 58 | 0.2% |
| Scottish | 277 | 1.1% |
| Serbian | 20 | 0.1% |
| Sioux | 13 | 0.1% |
| Slavic | 2 | 0.0% |
| Slovak | 25 | 0.1% |
| Slovene | 17 | 0.1% |
| South African | 10 | 0.0% |
| South American | 10 | 0.0% |
| Spaniard | 5 | 0.0% |
| Spanish | 6 | 0.0% |
| Subsaharan African | 143 | 0.6% |
| Swedish | 412 | 1.7% |
| Swiss | 172 | 0.7% |
| Thai | 16 | 0.1% |
| Turkish | 6 | 0.0% |
| Ukrainian | 23 | 0.1% |
| Venezuelan | 2 | 0.0% |
| Welsh | 174 | 0.7% |
| Yugoslavian | 13 | 0.1% | View All 89 Rows |
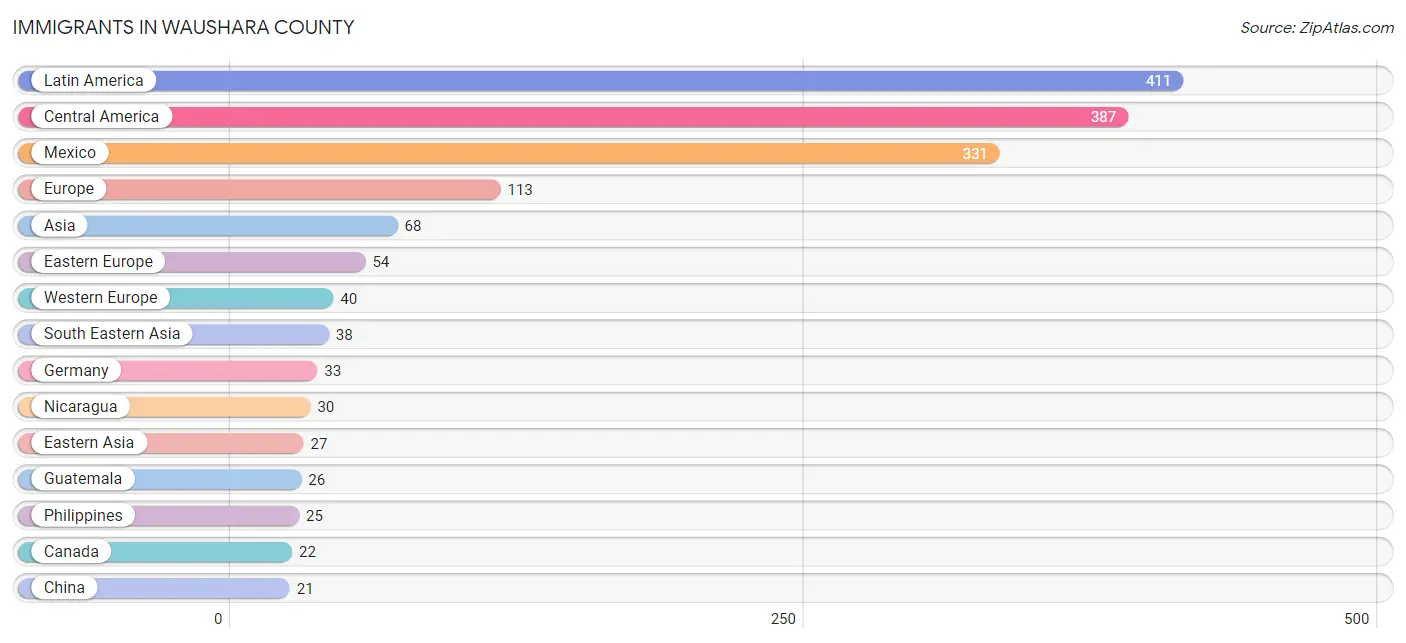
Immigrants in Waushara County
The most numerous immigrant groups reported in Waushara County came from Latin America (411 | 1.7%), Central America (387 | 1.6%), Mexico (331 | 1.3%), Europe (113 | 0.5%), and Asia (68 | 0.3%), together accounting for 5.3% of all Waushara County residents.
| Immigration Origin | # Population | % Population |
| Afghanistan | 3 | 0.0% |
| Africa | 10 | 0.0% |
| Argentina | 6 | 0.0% |
| Asia | 68 | 0.3% |
| Australia | 8 | 0.0% |
| Austria | 1 | 0.0% |
| Canada | 22 | 0.1% |
| Caribbean | 12 | 0.1% |
| Central America | 387 | 1.6% |
| China | 21 | 0.1% |
| Colombia | 4 | 0.0% |
| Croatia | 6 | 0.0% |
| Cuba | 6 | 0.0% |
| Eastern Asia | 27 | 0.1% |
| Eastern Europe | 54 | 0.2% |
| Ecuador | 2 | 0.0% |
| England | 2 | 0.0% |
| Europe | 113 | 0.5% |
| Germany | 33 | 0.1% |
| Guatemala | 26 | 0.1% |
| Hungary | 2 | 0.0% |
| Jamaica | 6 | 0.0% |
| Korea | 6 | 0.0% |
| Latin America | 411 | 1.7% |
| Mexico | 331 | 1.3% |
| Netherlands | 6 | 0.0% |
| Nicaragua | 30 | 0.1% |
| North Macedonia | 14 | 0.1% |
| Northern Europe | 15 | 0.1% |
| Oceania | 8 | 0.0% |
| Philippines | 25 | 0.1% |
| Poland | 14 | 0.1% |
| Romania | 14 | 0.1% |
| Scotland | 8 | 0.0% |
| South Africa | 10 | 0.0% |
| South America | 12 | 0.1% |
| South Central Asia | 3 | 0.0% |
| South Eastern Asia | 38 | 0.2% |
| Southern Europe | 4 | 0.0% |
| Spain | 4 | 0.0% |
| Taiwan | 8 | 0.0% |
| Thailand | 9 | 0.0% |
| Western Europe | 40 | 0.2% | View All 43 Rows |
Sex and Age in Waushara County
Sex and Age in Waushara County
The most populous age groups in Waushara County are 55 to 59 Years (1,209 | 9.2%) for men and 55 to 59 Years (1,059 | 9.2%) for women.
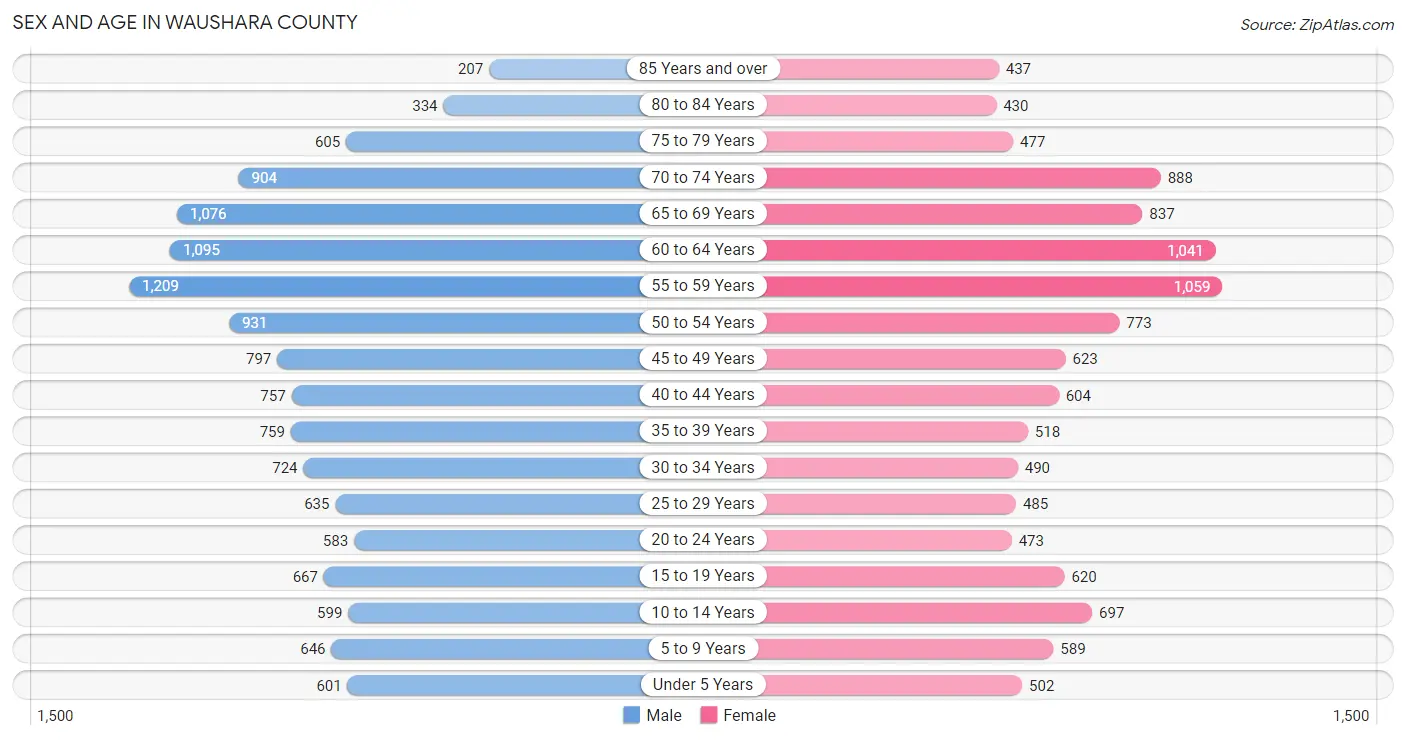
| Age Bracket | Male | Female |
| Under 5 Years | 601 (4.6%) | 502 (4.3%) |
| 5 to 9 Years | 646 (4.9%) | 589 (5.1%) |
| 10 to 14 Years | 599 (4.6%) | 697 (6.0%) |
| 15 to 19 Years | 667 (5.1%) | 620 (5.4%) |
| 20 to 24 Years | 583 (4.4%) | 473 (4.1%) |
| 25 to 29 Years | 635 (4.8%) | 485 (4.2%) |
| 30 to 34 Years | 724 (5.5%) | 490 (4.2%) |
| 35 to 39 Years | 759 (5.8%) | 518 (4.5%) |
| 40 to 44 Years | 757 (5.8%) | 604 (5.2%) |
| 45 to 49 Years | 797 (6.1%) | 623 (5.4%) |
| 50 to 54 Years | 931 (7.1%) | 773 (6.7%) |
| 55 to 59 Years | 1,209 (9.2%) | 1,059 (9.2%) |
| 60 to 64 Years | 1,095 (8.3%) | 1,041 (9.0%) |
| 65 to 69 Years | 1,076 (8.2%) | 837 (7.2%) |
| 70 to 74 Years | 904 (6.9%) | 888 (7.7%) |
| 75 to 79 Years | 605 (4.6%) | 477 (4.1%) |
| 80 to 84 Years | 334 (2.5%) | 430 (3.7%) |
| 85 Years and over | 207 (1.6%) | 437 (3.8%) |
| Total | 13,129 (100.0%) | 11,543 (100.0%) |
Families and Households in Waushara County
Median Family Size in Waushara County
The median family size in Waushara County is 2.87 persons per family, with married-couple families (5,391 | 81.9%) accounting for the largest median family size of 2.87 persons per family. On the other hand, single male/father families (454 | 6.9%) represent the smallest median family size with 2.78 persons per family.
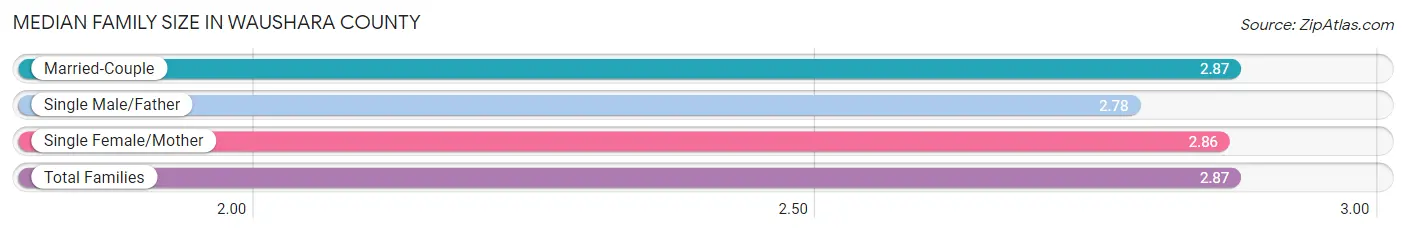
| Family Type | # Families | Family Size |
| Married-Couple | 5,391 (81.9%) | 2.87 |
| Single Male/Father | 454 (6.9%) | 2.78 |
| Single Female/Mother | 739 (11.2%) | 2.86 |
| Total Families | 6,584 (100.0%) | 2.87 |
Median Household Size in Waushara County
The median household size in Waushara County is 2.32 persons per household, with single female/mother households (739 | 7.3%) accounting for the largest median household size of 3.25 persons per household. non-family households (3,574 | 35.2%) represent the smallest median household size with 1.17 persons per household.
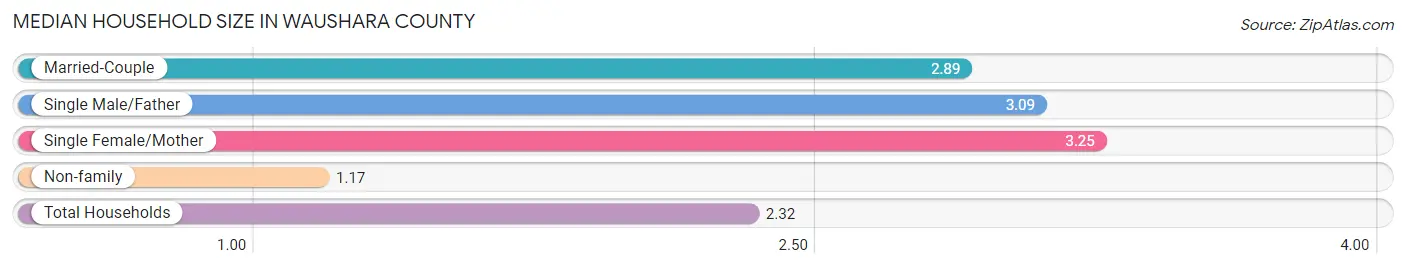
| Household Type | # Households | Household Size |
| Married-Couple | 5,391 (53.1%) | 2.89 |
| Single Male/Father | 454 (4.5%) | 3.09 |
| Single Female/Mother | 739 (7.3%) | 3.25 |
| Non-family | 3,574 (35.2%) | 1.17 |
| Total Households | 10,158 (100.0%) | 2.32 |
Household Size by Marriage Status in Waushara County
Out of a total of 10,158 households in Waushara County, 6,584 (64.8%) are family households, while 3,574 (35.2%) are nonfamily households. The most numerous type of family households are 2-person households, comprising 3,750, and the most common type of nonfamily households are 1-person households, comprising 3,086.
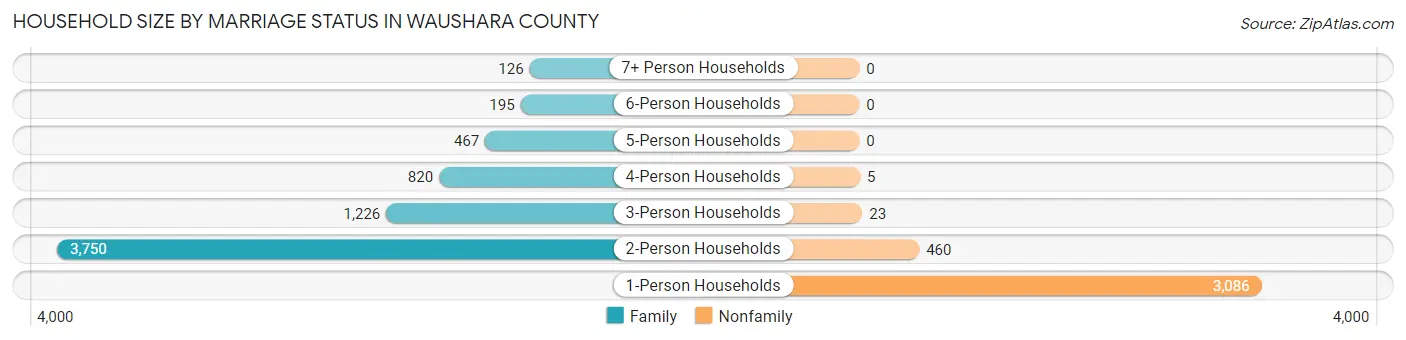
| Household Size | Family Households | Nonfamily Households |
| 1-Person Households | - | 3,086 (30.4%) |
| 2-Person Households | 3,750 (36.9%) | 460 (4.5%) |
| 3-Person Households | 1,226 (12.1%) | 23 (0.2%) |
| 4-Person Households | 820 (8.1%) | 5 (0.1%) |
| 5-Person Households | 467 (4.6%) | 0 (0.0%) |
| 6-Person Households | 195 (1.9%) | 0 (0.0%) |
| 7+ Person Households | 126 (1.2%) | 0 (0.0%) |
| Total | 6,584 (64.8%) | 3,574 (35.2%) |
Female Fertility in Waushara County
Fertility by Age in Waushara County
Average fertility rate in Waushara County is 62.0 births per 1,000 women. Women in the age bracket of 20 to 34 years have the highest fertility rate with 140.0 births per 1,000 women. Women in the age bracket of 20 to 34 years acount for 80.5% of all women with births.
| Age Bracket | Women with Births | Births / 1,000 Women |
| 15 to 19 years | 6 (2.4%) | 10.0 |
| 20 to 34 years | 202 (80.5%) | 140.0 |
| 35 to 50 years | 43 (17.1%) | 22.0 |
| Total | 251 (100.0%) | 62.0 |
Fertility by Age by Marriage Status in Waushara County
72.9% of women with births (251) in Waushara County are married. The highest percentage of unmarried women with births falls into 15 to 19 years age bracket with 100.0% of them unmarried at the time of birth, while the lowest percentage of unmarried women with births belong to 35 to 50 years age bracket with 13.9% of them unmarried.
| Age Bracket | Married | Unmarried |
| 15 to 19 years | 0 (0.0%) | 6 (100.0%) |
| 20 to 34 years | 146 (72.3%) | 56 (27.7%) |
| 35 to 50 years | 37 (86.1%) | 6 (14.0%) |
| Total | 183 (72.9%) | 68 (27.1%) |
Fertility by Education in Waushara County
Average fertility rate in Waushara County is 62.0 births per 1,000 women. Women with the education attainment of bachelor's degree have the highest fertility rate of 110.0 births per 1,000 women, while women with the education attainment of high school diploma have the lowest fertility at 34.0 births per 1,000 women. Women with the education attainment of college or associate's degree represent 43.4% of all women with births.
| Educational Attainment | Women with Births | Births / 1,000 Women |
| Less than High School | 29 (11.6%) | 35.0 |
| High School Diploma | 44 (17.5%) | 34.0 |
| College or Associate's Degree | 109 (43.4%) | 90.0 |
| Bachelor's Degree | 61 (24.3%) | 110.0 |
| Graduate Degree | 8 (3.2%) | 46.0 |
| Total | 251 (100.0%) | 62.0 |
Fertility by Education by Marriage Status in Waushara County
27.1% of women with births in Waushara County are unmarried. Women with the educational attainment of graduate degree are most likely to be married with 100.0% of them married at childbirth, while women with the educational attainment of bachelor's degree are least likely to be married with 42.6% of them unmarried at childbirth.
| Educational Attainment | Married | Unmarried |
| Less than High School | 23 (79.3%) | 6 (20.7%) |
| High School Diploma | 31 (70.5%) | 13 (29.5%) |
| College or Associate's Degree | 86 (78.9%) | 23 (21.1%) |
| Bachelor's Degree | 35 (57.4%) | 26 (42.6%) |
| Graduate Degree | 8 (100.0%) | 0 (0.0%) |
| Total | 183 (72.9%) | 68 (27.1%) |
Income in Waushara County
Income Overview in Waushara County
Per Capita Income in Waushara County is $37,927, while median incomes of families and households are $75,586 and $61,033 respectively.
| Characteristic | Number | Measure |
| Per Capita Income | 24,672 | $37,927 |
| Median Family Income | 6,584 | $75,586 |
| Mean Family Income | 6,584 | $92,342 |
| Median Household Income | 10,158 | $61,033 |
| Mean Household Income | 10,158 | $79,620 |
| Income Deficit | 6,584 | $9,401 |
| Wage / Income Gap (%) | 24,672 | 36.32% |
| Wage / Income Gap ($) | 24,672 | 63.68¢ per $1 |
| Gini / Inequality Index | 24,672 | 0.44 |
Earnings by Sex in Waushara County
Average Earnings in Waushara County are $37,245, $45,634 for men and $29,060 for women, a difference of 36.3%.
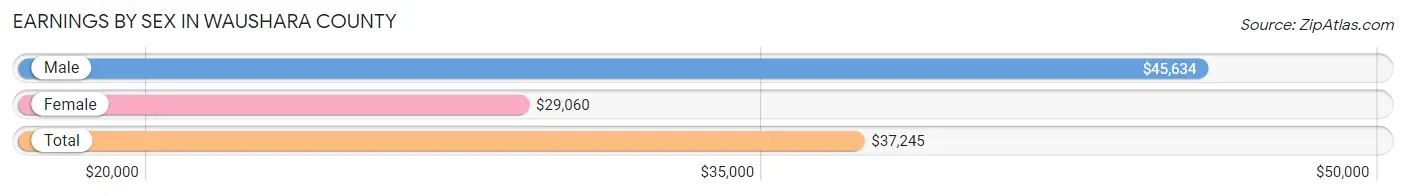
| Sex | Number | Average Earnings |
| Male | 6,892 (56.3%) | $45,634 |
| Female | 5,340 (43.7%) | $29,060 |
| Total | 12,232 (100.0%) | $37,245 |
Earnings by Sex by Income Bracket in Waushara County
The most common earnings brackets in Waushara County are $75,000 to $99,999 for men (794 | 11.5%) and $35,000 to $39,999 for women (432 | 8.1%).
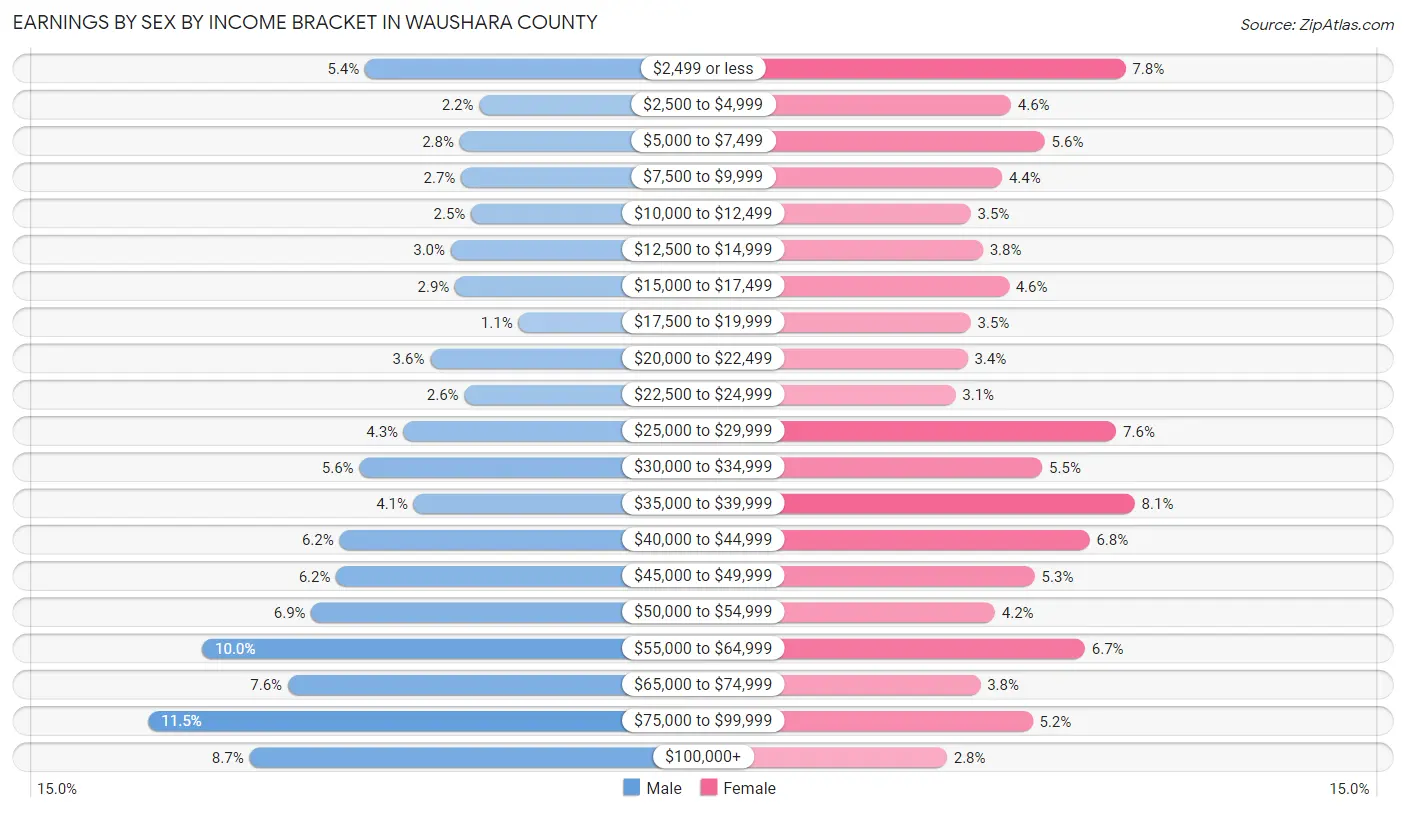
| Income | Male | Female |
| $2,499 or less | 374 (5.4%) | 418 (7.8%) |
| $2,500 to $4,999 | 153 (2.2%) | 246 (4.6%) |
| $5,000 to $7,499 | 191 (2.8%) | 297 (5.6%) |
| $7,500 to $9,999 | 188 (2.7%) | 233 (4.4%) |
| $10,000 to $12,499 | 169 (2.5%) | 186 (3.5%) |
| $12,500 to $14,999 | 208 (3.0%) | 204 (3.8%) |
| $15,000 to $17,499 | 200 (2.9%) | 243 (4.5%) |
| $17,500 to $19,999 | 77 (1.1%) | 186 (3.5%) |
| $20,000 to $22,499 | 248 (3.6%) | 181 (3.4%) |
| $22,500 to $24,999 | 182 (2.6%) | 163 (3.0%) |
| $25,000 to $29,999 | 299 (4.3%) | 404 (7.6%) |
| $30,000 to $34,999 | 385 (5.6%) | 293 (5.5%) |
| $35,000 to $39,999 | 280 (4.1%) | 432 (8.1%) |
| $40,000 to $44,999 | 424 (6.1%) | 364 (6.8%) |
| $45,000 to $49,999 | 430 (6.2%) | 282 (5.3%) |
| $50,000 to $54,999 | 478 (6.9%) | 222 (4.2%) |
| $55,000 to $64,999 | 690 (10.0%) | 357 (6.7%) |
| $65,000 to $74,999 | 524 (7.6%) | 200 (3.7%) |
| $75,000 to $99,999 | 794 (11.5%) | 279 (5.2%) |
| $100,000+ | 598 (8.7%) | 150 (2.8%) |
| Total | 6,892 (100.0%) | 5,340 (100.0%) |
Earnings by Sex by Educational Attainment in Waushara County
Average earnings in Waushara County are $50,004 for men and $33,814 for women, a difference of 32.4%. Men with an educational attainment of graduate degree enjoy the highest average annual earnings of $75,000, while those with less than high school education earn the least with $34,934. Women with an educational attainment of graduate degree earn the most with the average annual earnings of $69,107, while those with less than high school education have the smallest earnings of $20,871.
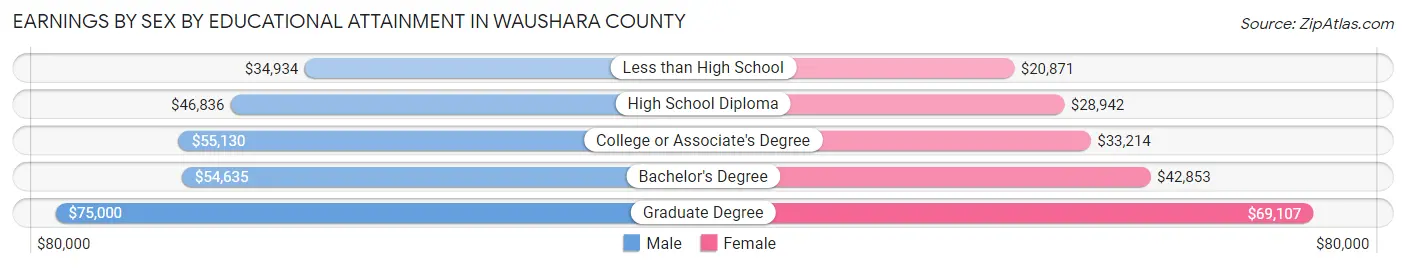
| Educational Attainment | Male Income | Female Income |
| Less than High School | $34,934 | $20,871 |
| High School Diploma | $46,836 | $28,942 |
| College or Associate's Degree | $55,130 | $33,214 |
| Bachelor's Degree | $54,635 | $42,853 |
| Graduate Degree | $75,000 | $69,107 |
| Total | $50,004 | $33,814 |
Family Income in Waushara County
Family Income Brackets in Waushara County
According to the Waushara County family income data, there are 1,363 families falling into the $50,000 to $74,999 income range, which is the most common income bracket and makes up 20.7% of all families. Conversely, the $10,000 to $14,999 income bracket is the least frequent group with only 112 families (1.7%) belonging to this category.
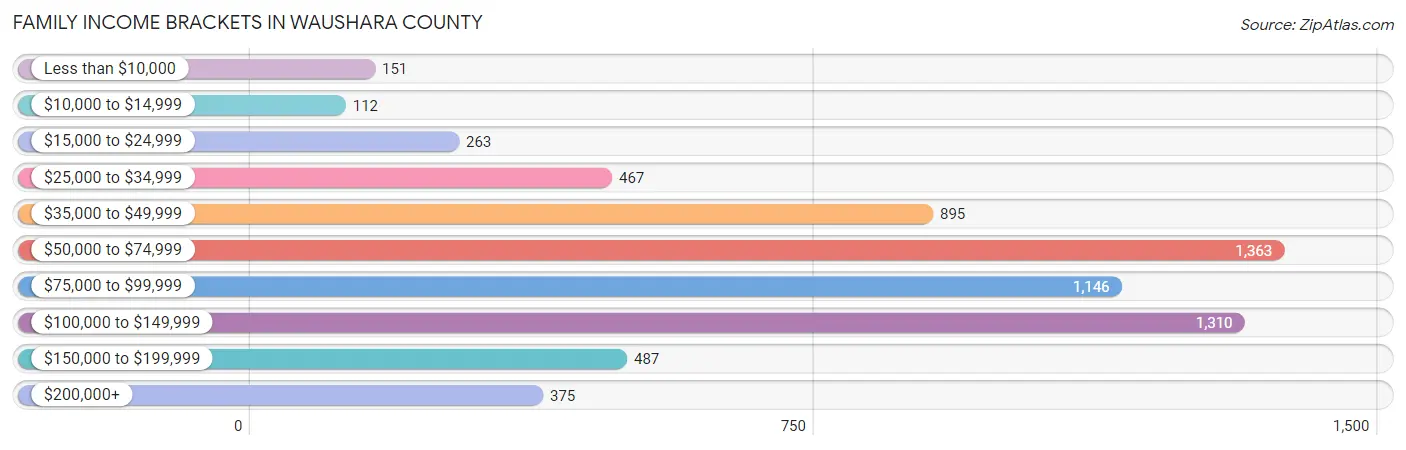
| Income Bracket | # Families | % Families |
| Less than $10,000 | 151 | 2.3% |
| $10,000 to $14,999 | 112 | 1.7% |
| $15,000 to $24,999 | 263 | 4.0% |
| $25,000 to $34,999 | 467 | 7.1% |
| $35,000 to $49,999 | 895 | 13.6% |
| $50,000 to $74,999 | 1,363 | 20.7% |
| $75,000 to $99,999 | 1,146 | 17.4% |
| $100,000 to $149,999 | 1,310 | 19.9% |
| $150,000 to $199,999 | 487 | 7.4% |
| $200,000+ | 375 | 5.7% |
Family Income by Famaliy Size in Waushara County
6-person families (163 | 2.5%) account for the highest median family income in Waushara County with $127,679 per family, while 2-person families (3,953 | 60.0%) have the highest median income of $33,375 per family member.
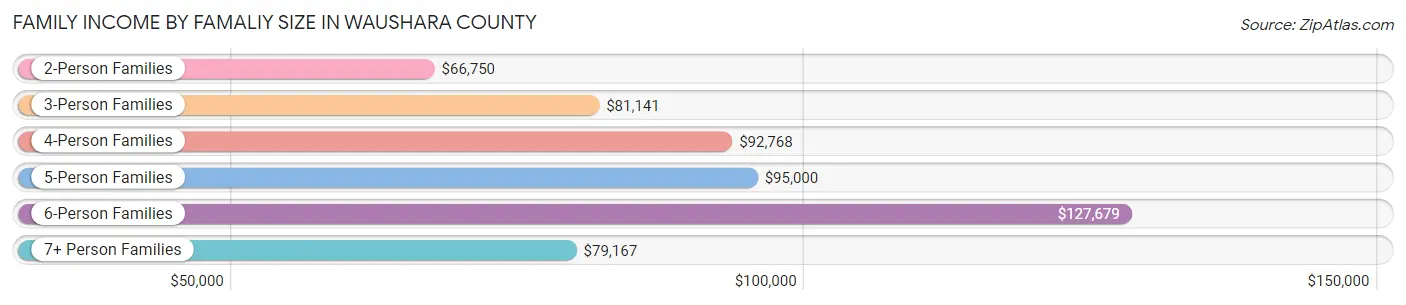
| Income Bracket | # Families | Median Income |
| 2-Person Families | 3,953 (60.0%) | $66,750 |
| 3-Person Families | 1,089 (16.5%) | $81,141 |
| 4-Person Families | 845 (12.8%) | $92,768 |
| 5-Person Families | 428 (6.5%) | $95,000 |
| 6-Person Families | 163 (2.5%) | $127,679 |
| 7+ Person Families | 106 (1.6%) | $79,167 |
| Total | 6,584 (100.0%) | $75,586 |
Family Income by Number of Earners in Waushara County
The median family income in Waushara County is $75,586, with families comprising 3+ earners (764) having the highest median family income of $120,500, while families with no earners (1,495) have the lowest median family income of $49,913, accounting for 11.6% and 22.7% of families, respectively.
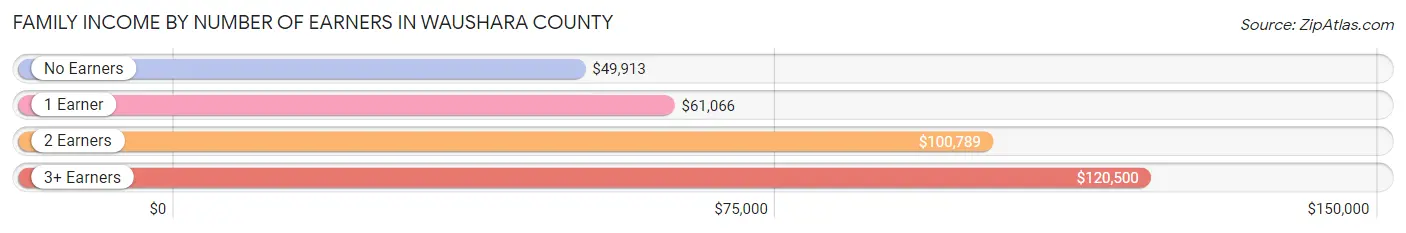
| Number of Earners | # Families | Median Income |
| No Earners | 1,495 (22.7%) | $49,913 |
| 1 Earner | 2,011 (30.5%) | $61,066 |
| 2 Earners | 2,314 (35.1%) | $100,789 |
| 3+ Earners | 764 (11.6%) | $120,500 |
| Total | 6,584 (100.0%) | $75,586 |
Household Income in Waushara County
Household Income Brackets in Waushara County
With 1,889 households falling in the category, the $50,000 to $74,999 income range is the most frequent in Waushara County, accounting for 18.6% of all households. In contrast, only 416 households (4.1%) fall into the $10,000 to $14,999 income bracket, making it the least populous group.
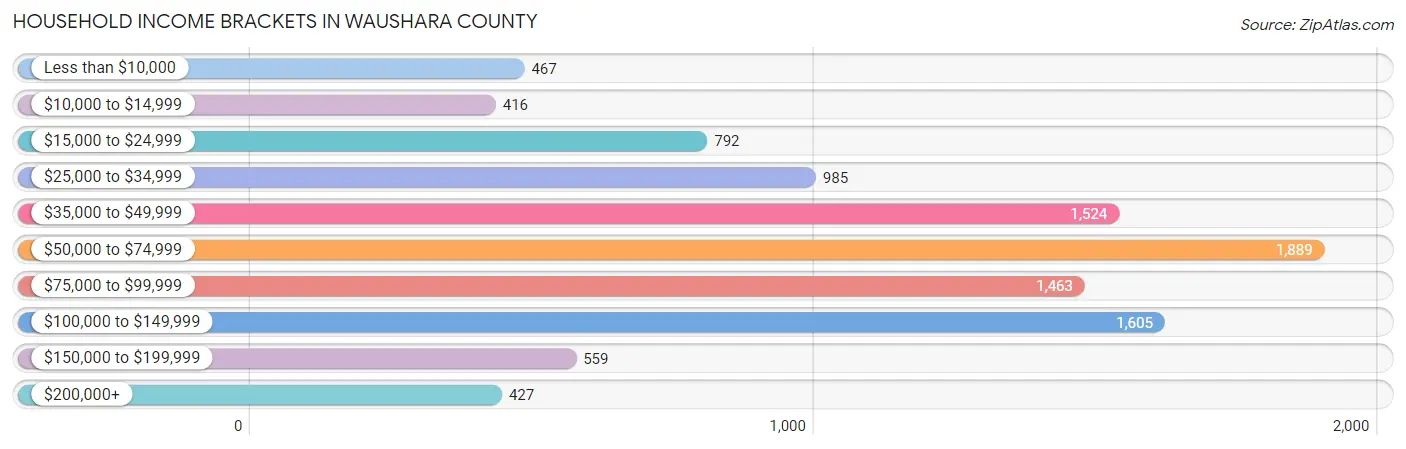
| Income Bracket | # Households | % Households |
| Less than $10,000 | 467 | 4.6% |
| $10,000 to $14,999 | 416 | 4.1% |
| $15,000 to $24,999 | 792 | 7.8% |
| $25,000 to $34,999 | 985 | 9.7% |
| $35,000 to $49,999 | 1,524 | 15.0% |
| $50,000 to $74,999 | 1,889 | 18.6% |
| $75,000 to $99,999 | 1,463 | 14.4% |
| $100,000 to $149,999 | 1,605 | 15.8% |
| $150,000 to $199,999 | 559 | 5.5% |
| $200,000+ | 427 | 4.2% |
Household Income by Householder Age in Waushara County
The median household income in Waushara County is $61,033, with the highest median household income of $79,322 found in the 25 to 44 years age bracket for the primary householder. A total of 2,158 households (21.2%) fall into this category. Meanwhile, the 65+ years age bracket for the primary householder has the lowest median household income of $45,557, with 3,849 households (37.9%) in this group.
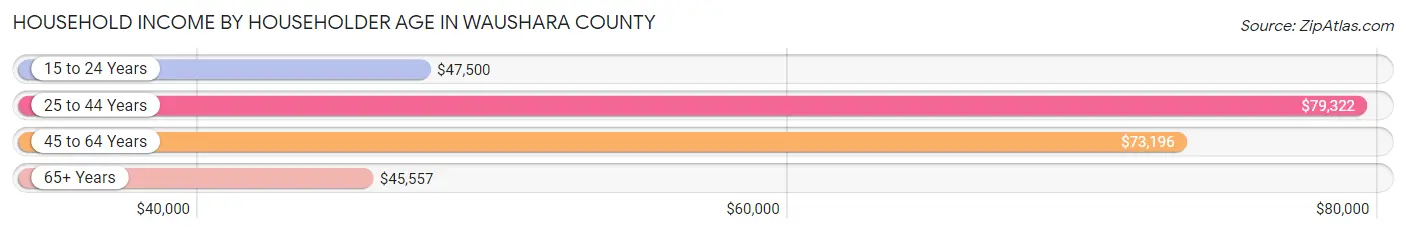
| Income Bracket | # Households | Median Income |
| 15 to 24 Years | 200 (2.0%) | $47,500 |
| 25 to 44 Years | 2,158 (21.2%) | $79,322 |
| 45 to 64 Years | 3,951 (38.9%) | $73,196 |
| 65+ Years | 3,849 (37.9%) | $45,557 |
| Total | 10,158 (100.0%) | $61,033 |
Poverty in Waushara County
Income Below Poverty by Sex and Age in Waushara County
With 10.1% poverty level for males and 12.9% for females among the residents of Waushara County, 6 to 11 year old males and 18 to 24 year old females are the most vulnerable to poverty, with 166 males (22.6%) and 137 females (20.0%) in their respective age groups living below the poverty level.
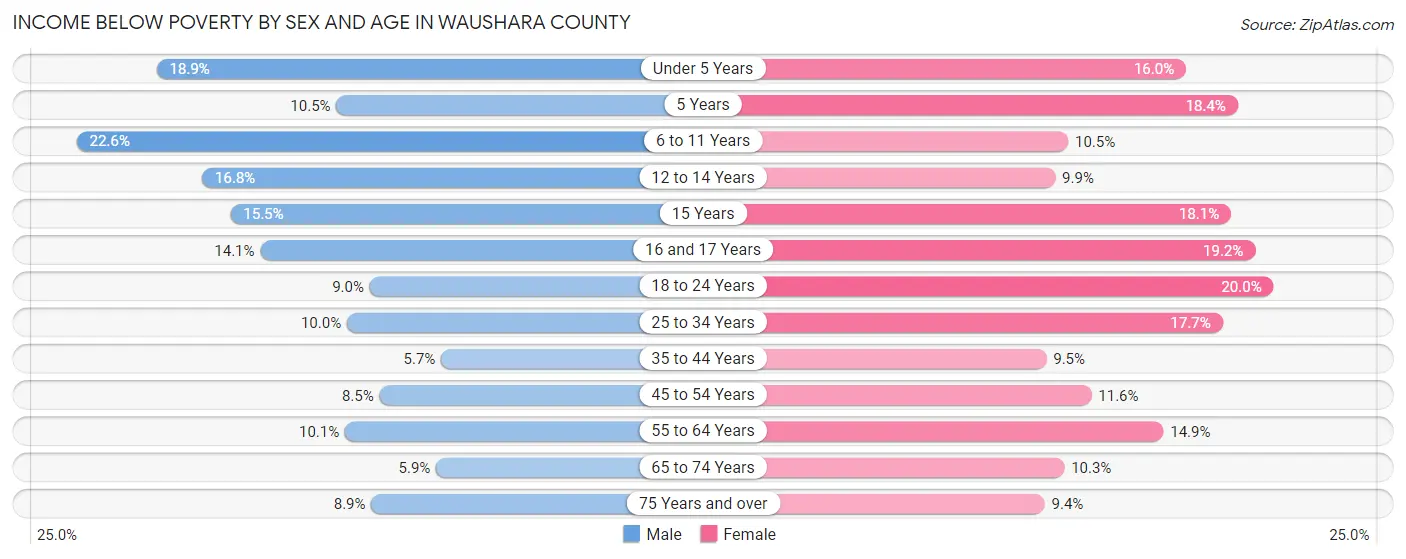
| Age Bracket | Male | Female |
| Under 5 Years | 111 (18.9%) | 80 (16.0%) |
| 5 Years | 14 (10.5%) | 18 (18.4%) |
| 6 to 11 Years | 166 (22.6%) | 78 (10.5%) |
| 12 to 14 Years | 56 (16.8%) | 41 (9.9%) |
| 15 Years | 17 (15.4%) | 28 (18.1%) |
| 16 and 17 Years | 44 (14.1%) | 47 (19.2%) |
| 18 to 24 Years | 69 (9.0%) | 137 (20.0%) |
| 25 to 34 Years | 113 (10.0%) | 170 (17.7%) |
| 35 to 44 Years | 75 (5.7%) | 104 (9.5%) |
| 45 to 54 Years | 129 (8.5%) | 160 (11.6%) |
| 55 to 64 Years | 222 (10.1%) | 308 (14.9%) |
| 65 to 74 Years | 113 (5.9%) | 178 (10.3%) |
| 75 Years and over | 101 (8.9%) | 122 (9.4%) |
| Total | 1,230 (10.1%) | 1,471 (12.9%) |
Income Above Poverty by Sex and Age in Waushara County
According to the poverty statistics in Waushara County, males aged 35 to 44 years and females aged 75 years and over are the age groups that are most secure financially, with 94.3% of males and 90.6% of females in these age groups living above the poverty line.
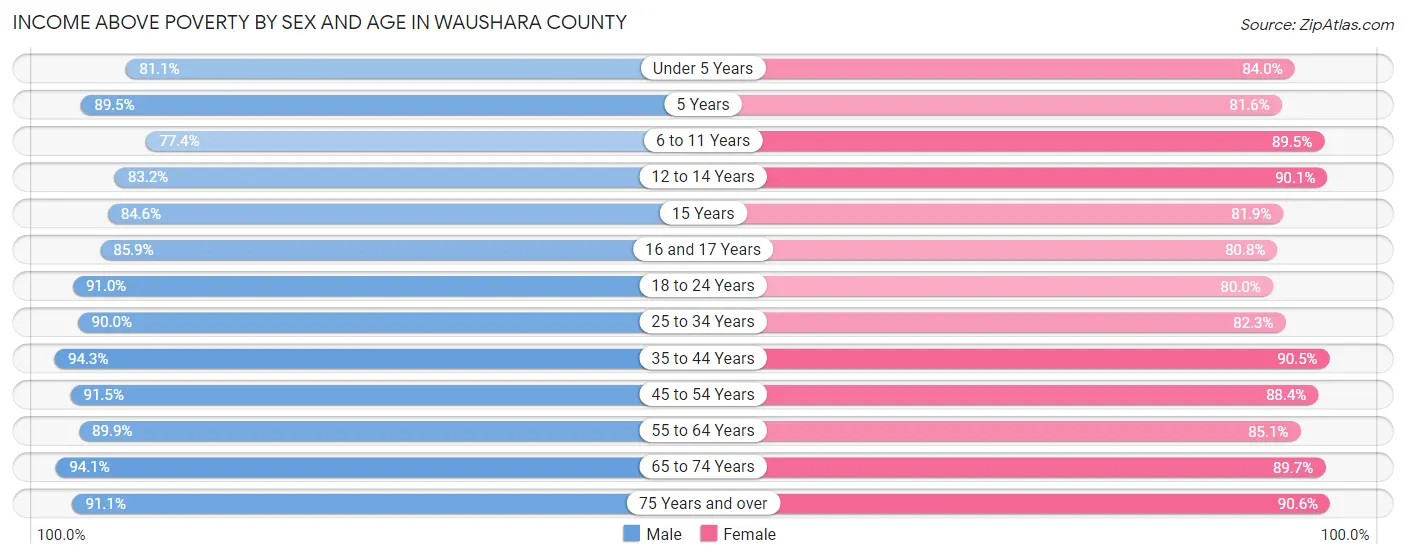
| Age Bracket | Male | Female |
| Under 5 Years | 477 (81.1%) | 421 (84.0%) |
| 5 Years | 119 (89.5%) | 80 (81.6%) |
| 6 to 11 Years | 569 (77.4%) | 665 (89.5%) |
| 12 to 14 Years | 278 (83.2%) | 373 (90.1%) |
| 15 Years | 93 (84.6%) | 127 (81.9%) |
| 16 and 17 Years | 269 (85.9%) | 198 (80.8%) |
| 18 to 24 Years | 699 (91.0%) | 547 (80.0%) |
| 25 to 34 Years | 1,013 (90.0%) | 792 (82.3%) |
| 35 to 44 Years | 1,248 (94.3%) | 992 (90.5%) |
| 45 to 54 Years | 1,383 (91.5%) | 1,222 (88.4%) |
| 55 to 64 Years | 1,970 (89.9%) | 1,757 (85.1%) |
| 65 to 74 Years | 1,802 (94.1%) | 1,547 (89.7%) |
| 75 Years and over | 1,032 (91.1%) | 1,174 (90.6%) |
| Total | 10,952 (89.9%) | 9,895 (87.1%) |
Income Below Poverty Among Married-Couple Families in Waushara County
The poverty statistics for married-couple families in Waushara County show that 4.3% or 234 of the total 5,391 families live below the poverty line. Families with 5 or more children have the highest poverty rate of 26.7%, comprising of 20 families. On the other hand, families with no children have the lowest poverty rate of 2.8%, which includes 107 families.
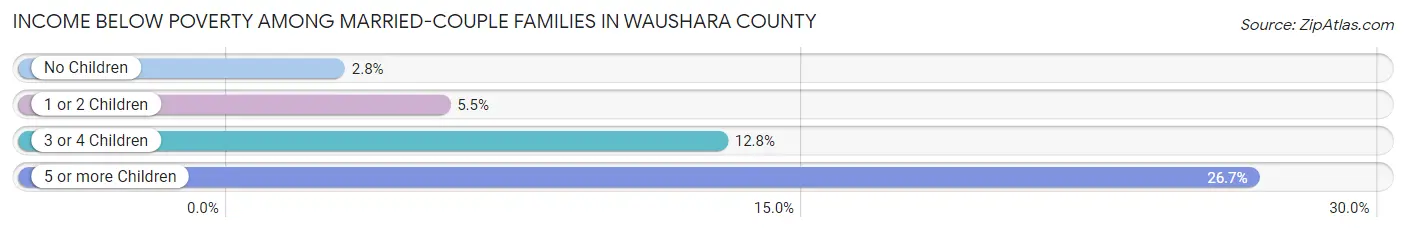
| Children | Above Poverty | Below Poverty |
| No Children | 3,727 (97.2%) | 107 (2.8%) |
| 1 or 2 Children | 1,075 (94.5%) | 63 (5.5%) |
| 3 or 4 Children | 300 (87.2%) | 44 (12.8%) |
| 5 or more Children | 55 (73.3%) | 20 (26.7%) |
| Total | 5,157 (95.7%) | 234 (4.3%) |
Income Below Poverty Among Single-Parent Households in Waushara County
According to the poverty data in Waushara County, 11.7% or 53 single-father households and 32.1% or 237 single-mother households are living below the poverty line. Among single-father households, those with 3 or 4 children have the highest poverty rate, with 19 households (33.3%) experiencing poverty. Likewise, among single-mother households, those with 1 or 2 children have the highest poverty rate, with 182 households (43.5%) falling below the poverty line.
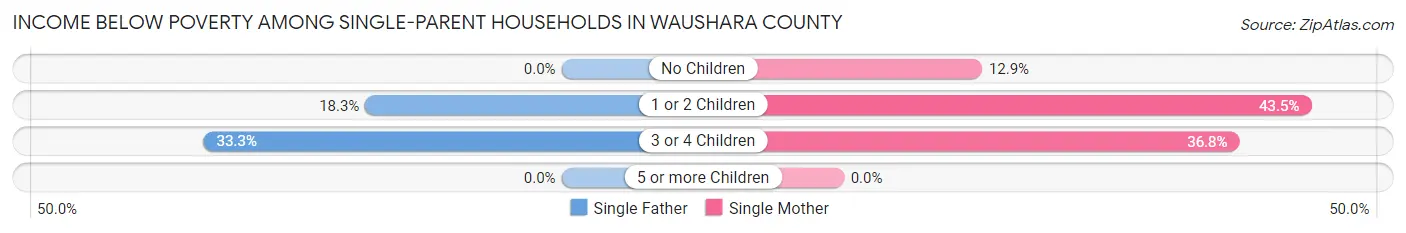
| Children | Single Father | Single Mother |
| No Children | 0 (0.0%) | 34 (12.9%) |
| 1 or 2 Children | 34 (18.3%) | 182 (43.5%) |
| 3 or 4 Children | 19 (33.3%) | 21 (36.8%) |
| 5 or more Children | 0 (0.0%) | 0 (0.0%) |
| Total | 53 (11.7%) | 237 (32.1%) |
Income Below Poverty Among Married-Couple vs Single-Parent Households in Waushara County
The poverty data for Waushara County shows that 234 of the married-couple family households (4.3%) and 290 of the single-parent households (24.3%) are living below the poverty level. Within the married-couple family households, those with 5 or more children have the highest poverty rate, with 20 households (26.7%) falling below the poverty line. Among the single-parent households, those with 1 or 2 children have the highest poverty rate, with 216 household (35.8%) living below poverty.
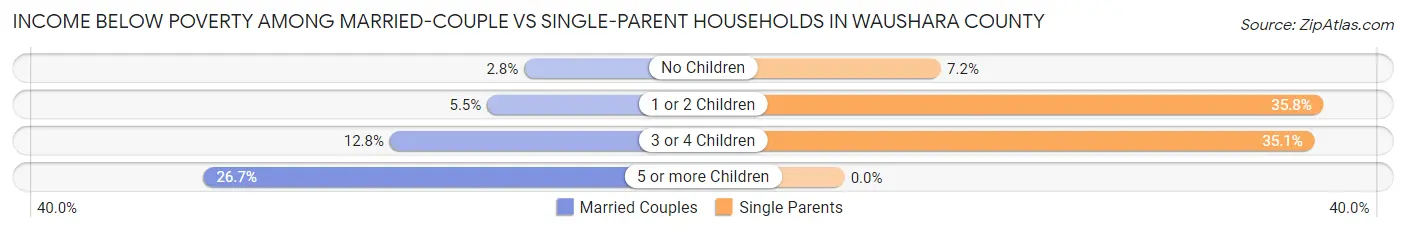
| Children | Married-Couple Families | Single-Parent Households |
| No Children | 107 (2.8%) | 34 (7.2%) |
| 1 or 2 Children | 63 (5.5%) | 216 (35.8%) |
| 3 or 4 Children | 44 (12.8%) | 40 (35.1%) |
| 5 or more Children | 20 (26.7%) | 0 (0.0%) |
| Total | 234 (4.3%) | 290 (24.3%) |
Employment Characteristics in Waushara County
Employment by Class of Employer in Waushara County
Among the 10,588 employed individuals in Waushara County, private company employees (7,354 | 69.5%), self-employed (not incorporated) (729 | 6.9%), and local government employees (700 | 6.6%) make up the most common classes of employment.
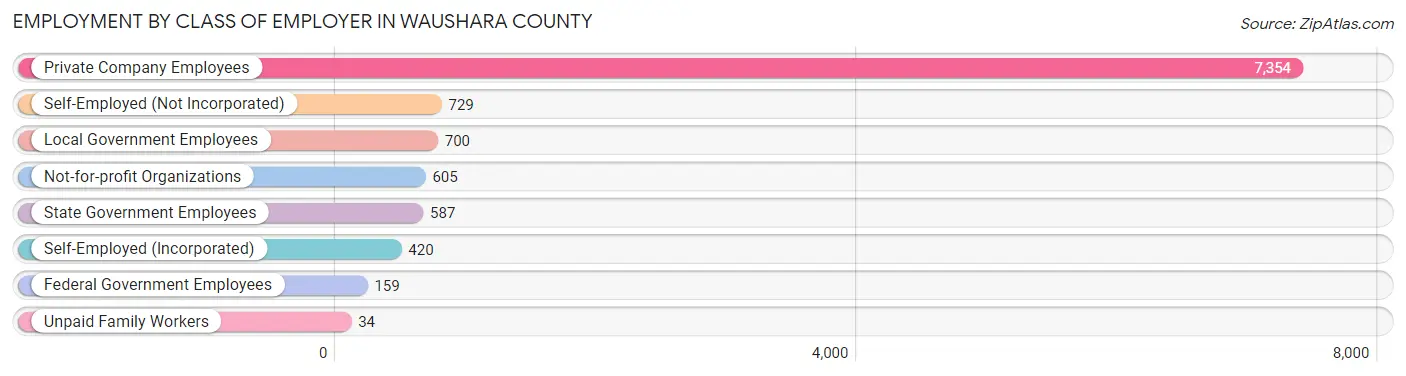
| Employer Class | # Employees | % Employees |
| Private Company Employees | 7,354 | 69.5% |
| Self-Employed (Incorporated) | 420 | 4.0% |
| Self-Employed (Not Incorporated) | 729 | 6.9% |
| Not-for-profit Organizations | 605 | 5.7% |
| Local Government Employees | 700 | 6.6% |
| State Government Employees | 587 | 5.5% |
| Federal Government Employees | 159 | 1.5% |
| Unpaid Family Workers | 34 | 0.3% |
| Total | 10,588 | 100.0% |
Employment Status by Age in Waushara County
According to the labor force statistics for Waushara County, out of the total population over 16 years of age (20,773), 54.4% or 11,301 individuals are in the labor force, with 4.1% or 463 of them unemployed. The age group with the highest labor force participation rate is 25 to 29 years, with 82.8% or 927 individuals in the labor force. Within the labor force, the 20 to 24 years age range has the highest percentage of unemployed individuals, with 9.0% or 76 of them being unemployed.
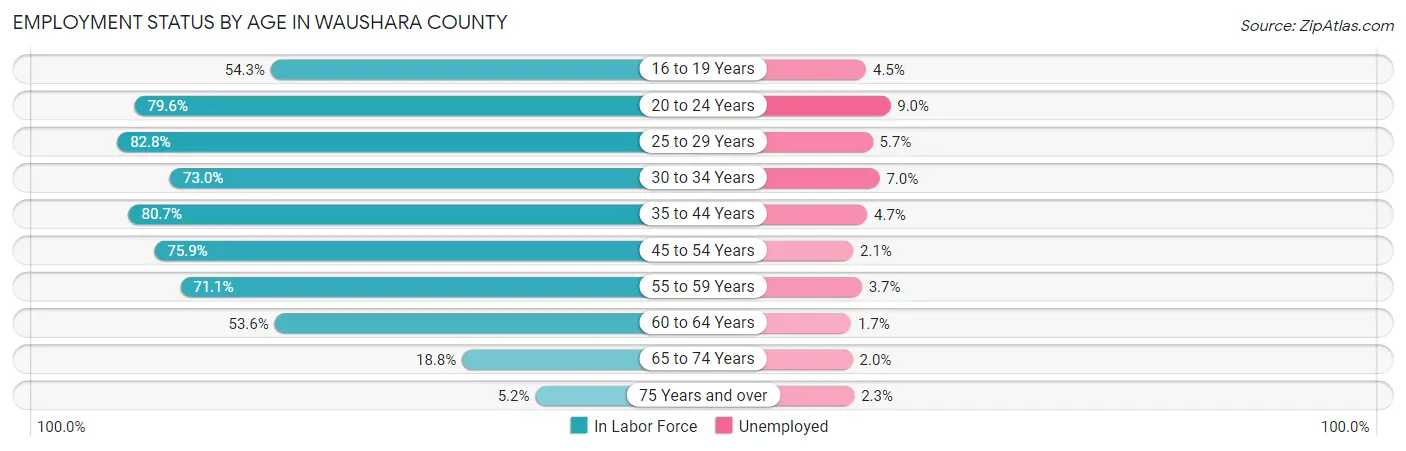
| Age Bracket | In Labor Force | Unemployed |
| 16 to 19 Years | 555 (54.3%) | 25 (4.5%) |
| 20 to 24 Years | 841 (79.6%) | 76 (9.0%) |
| 25 to 29 Years | 927 (82.8%) | 53 (5.7%) |
| 30 to 34 Years | 886 (73.0%) | 62 (7.0%) |
| 35 to 44 Years | 2,129 (80.7%) | 100 (4.7%) |
| 45 to 54 Years | 2,371 (75.9%) | 50 (2.1%) |
| 55 to 59 Years | 1,613 (71.1%) | 60 (3.7%) |
| 60 to 64 Years | 1,145 (53.6%) | 19 (1.7%) |
| 65 to 74 Years | 697 (18.8%) | 14 (2.0%) |
| 75 Years and over | 129 (5.2%) | 3 (2.3%) |
| Total | 11,301 (54.4%) | 463 (4.1%) |
Employment Status by Educational Attainment in Waushara County
According to labor force statistics for Waushara County, 72.6% of individuals (9,075) out of the total population between 25 and 64 years of age (12,500) are in the labor force, with 3.8% or 345 of them being unemployed. The group with the highest labor force participation rate are those with the educational attainment of bachelor's degree or higher, with 80.9% or 1,687 individuals in the labor force. Within the labor force, individuals with less than high school education have the highest percentage of unemployment, with 8.2% or 58 of them being unemployed.
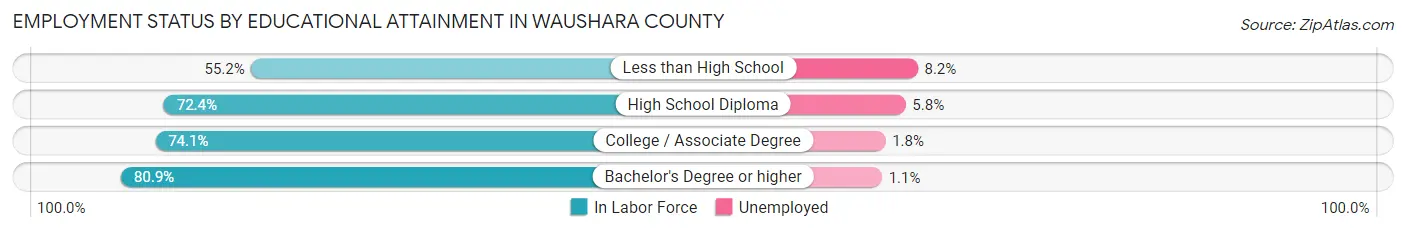
| Educational Attainment | In Labor Force | Unemployed |
| Less than High School | 712 (55.2%) | 106 (8.2%) |
| High School Diploma | 3,743 (72.4%) | 300 (5.8%) |
| College / Associate Degree | 2,931 (74.1%) | 71 (1.8%) |
| Bachelor's Degree or higher | 1,687 (80.9%) | 23 (1.1%) |
| Total | 9,075 (72.6%) | 475 (3.8%) |
Employment Occupations by Sex in Waushara County
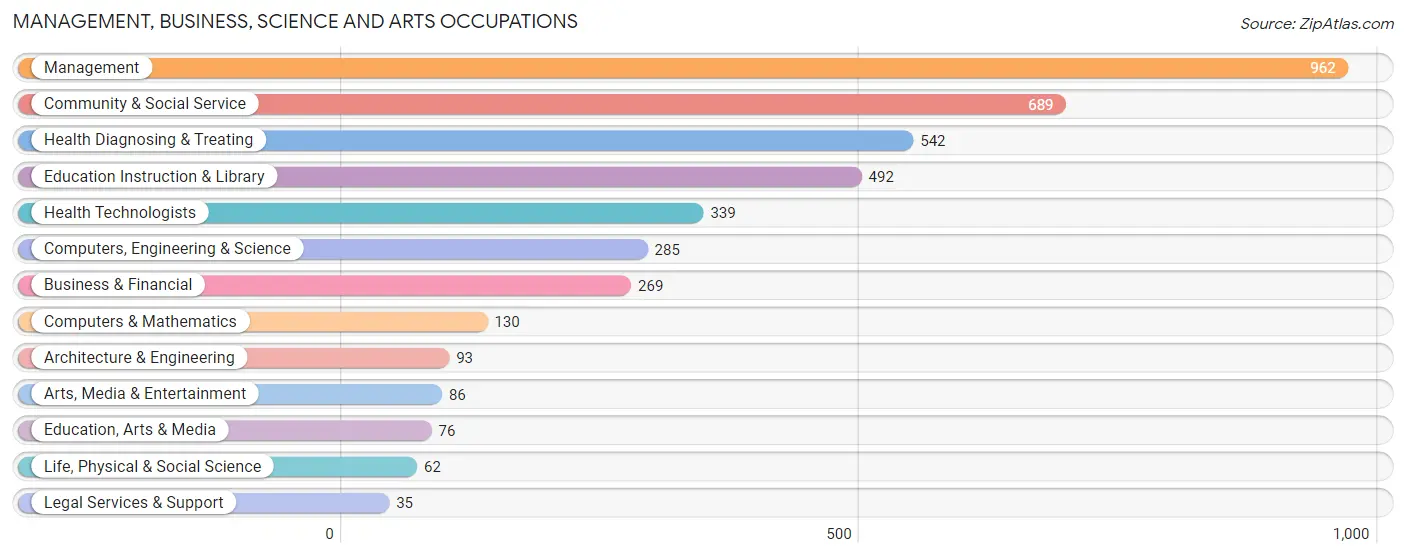
Management, Business, Science and Arts Occupations
The most common Management, Business, Science and Arts occupations in Waushara County are Management (962 | 8.9%), Community & Social Service (689 | 6.4%), Health Diagnosing & Treating (542 | 5.0%), Education Instruction & Library (492 | 4.5%), and Health Technologists (339 | 3.1%).
Management, Business, Science and Arts Occupations by Sex
Within the Management, Business, Science and Arts occupations in Waushara County, the most male-oriented occupations are Architecture & Engineering (78.5%), Computers, Engineering & Science (69.5%), and Computers & Mathematics (68.5%), while the most female-oriented occupations are Health Diagnosing & Treating (88.2%), Health Technologists (84.1%), and Education, Arts & Media (77.6%).
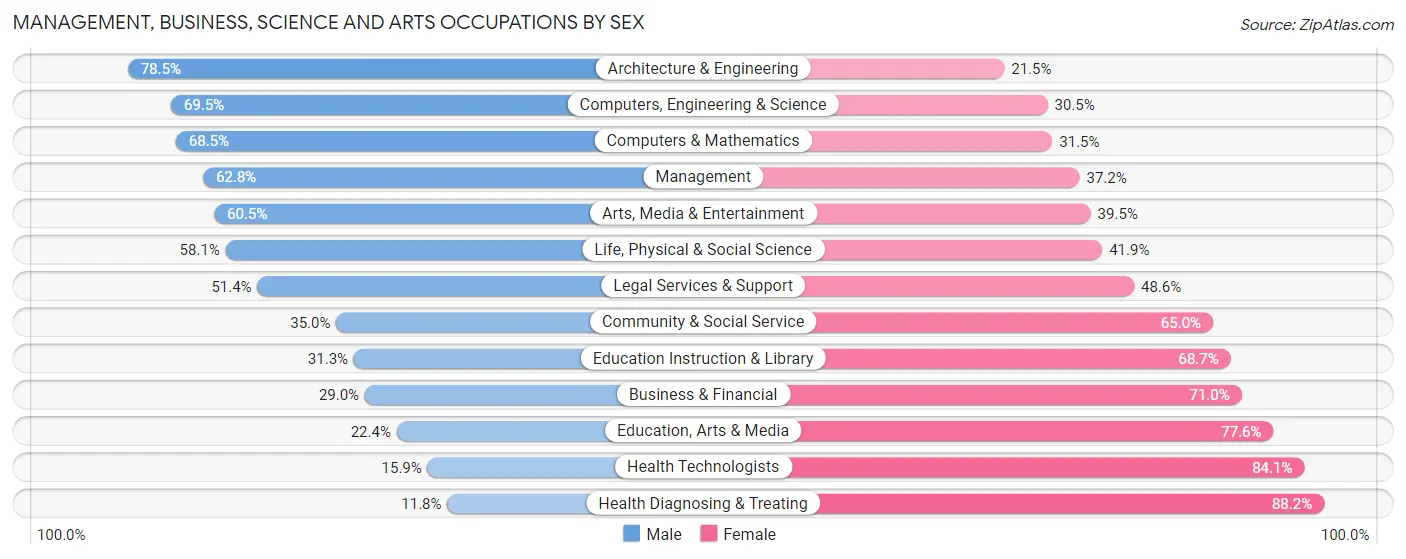
| Occupation | Male | Female |
| Management | 604 (62.8%) | 358 (37.2%) |
| Business & Financial | 78 (29.0%) | 191 (71.0%) |
| Computers, Engineering & Science | 198 (69.5%) | 87 (30.5%) |
| Computers & Mathematics | 89 (68.5%) | 41 (31.5%) |
| Architecture & Engineering | 73 (78.5%) | 20 (21.5%) |
| Life, Physical & Social Science | 36 (58.1%) | 26 (41.9%) |
| Community & Social Service | 241 (35.0%) | 448 (65.0%) |
| Education, Arts & Media | 17 (22.4%) | 59 (77.6%) |
| Legal Services & Support | 18 (51.4%) | 17 (48.6%) |
| Education Instruction & Library | 154 (31.3%) | 338 (68.7%) |
| Arts, Media & Entertainment | 52 (60.5%) | 34 (39.5%) |
| Health Diagnosing & Treating | 64 (11.8%) | 478 (88.2%) |
| Health Technologists | 54 (15.9%) | 285 (84.1%) |
| Total (Category) | 1,185 (43.1%) | 1,562 (56.9%) |
| Total (Overall) | 6,070 (56.1%) | 4,756 (43.9%) |
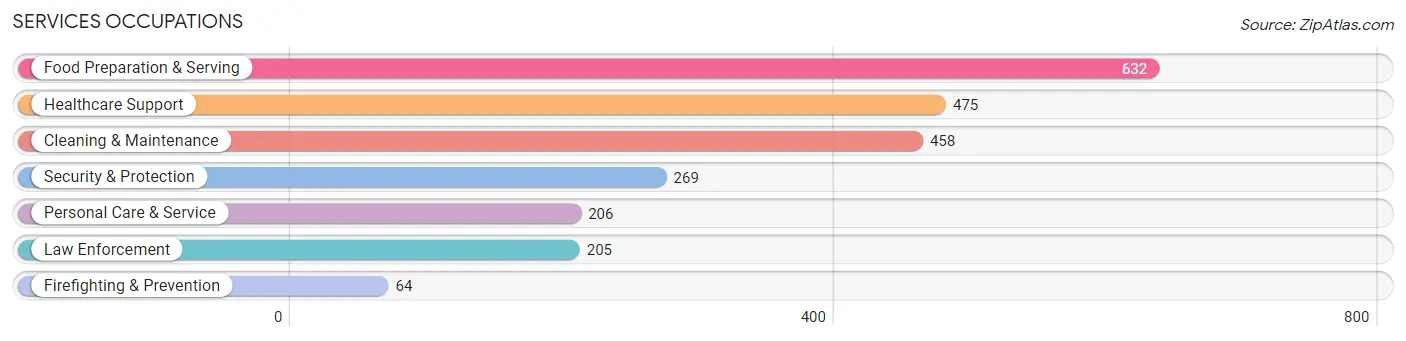
Services Occupations
The most common Services occupations in Waushara County are Food Preparation & Serving (632 | 5.8%), Healthcare Support (475 | 4.4%), Cleaning & Maintenance (458 | 4.2%), Security & Protection (269 | 2.5%), and Personal Care & Service (206 | 1.9%).
Services Occupations by Sex
Within the Services occupations in Waushara County, the most male-oriented occupations are Law Enforcement (90.7%), Security & Protection (90.7%), and Firefighting & Prevention (90.6%), while the most female-oriented occupations are Healthcare Support (90.5%), Personal Care & Service (80.1%), and Food Preparation & Serving (65.3%).
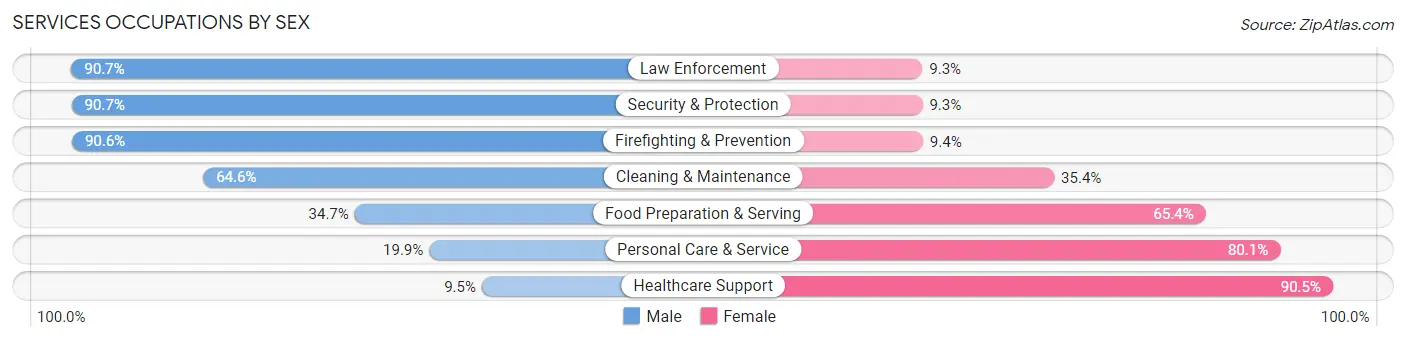
| Occupation | Male | Female |
| Healthcare Support | 45 (9.5%) | 430 (90.5%) |
| Security & Protection | 244 (90.7%) | 25 (9.3%) |
| Firefighting & Prevention | 58 (90.6%) | 6 (9.4%) |
| Law Enforcement | 186 (90.7%) | 19 (9.3%) |
| Food Preparation & Serving | 219 (34.6%) | 413 (65.3%) |
| Cleaning & Maintenance | 296 (64.6%) | 162 (35.4%) |
| Personal Care & Service | 41 (19.9%) | 165 (80.1%) |
| Total (Category) | 845 (41.4%) | 1,195 (58.6%) |
| Total (Overall) | 6,070 (56.1%) | 4,756 (43.9%) |
Sales and Office Occupations
The most common Sales and Office occupations in Waushara County are Office & Administration (1,188 | 11.0%), and Sales & Related (751 | 6.9%).

Sales and Office Occupations by Sex

| Occupation | Male | Female |
| Sales & Related | 413 (55.0%) | 338 (45.0%) |
| Office & Administration | 235 (19.8%) | 953 (80.2%) |
| Total (Category) | 648 (33.4%) | 1,291 (66.6%) |
| Total (Overall) | 6,070 (56.1%) | 4,756 (43.9%) |
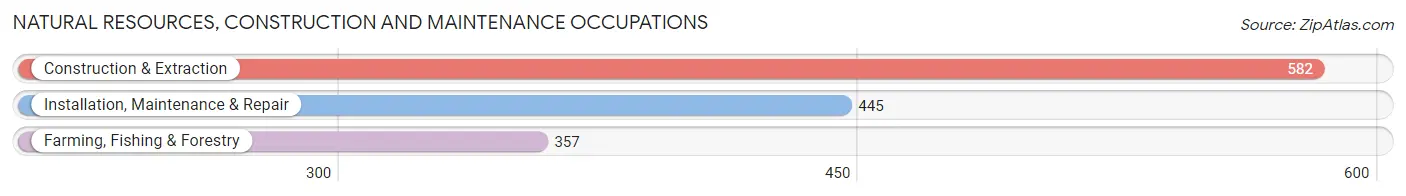
Natural Resources, Construction and Maintenance Occupations
The most common Natural Resources, Construction and Maintenance occupations in Waushara County are Construction & Extraction (582 | 5.4%), Installation, Maintenance & Repair (445 | 4.1%), and Farming, Fishing & Forestry (357 | 3.3%).
Natural Resources, Construction and Maintenance Occupations by Sex
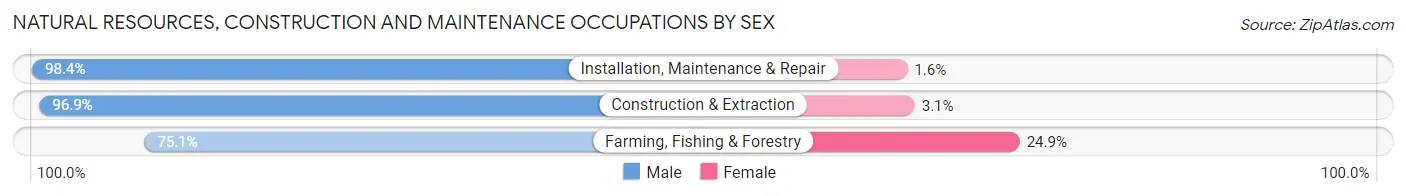
| Occupation | Male | Female |
| Farming, Fishing & Forestry | 268 (75.1%) | 89 (24.9%) |
| Construction & Extraction | 564 (96.9%) | 18 (3.1%) |
| Installation, Maintenance & Repair | 438 (98.4%) | 7 (1.6%) |
| Total (Category) | 1,270 (91.8%) | 114 (8.2%) |
| Total (Overall) | 6,070 (56.1%) | 4,756 (43.9%) |
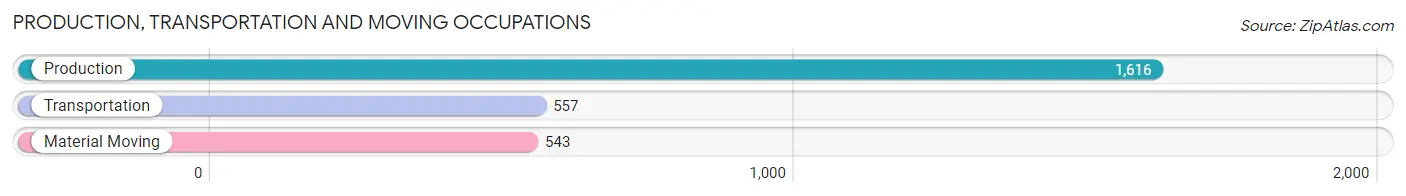
Production, Transportation and Moving Occupations
The most common Production, Transportation and Moving occupations in Waushara County are Production (1,616 | 14.9%), Transportation (557 | 5.1%), and Material Moving (543 | 5.0%).
Production, Transportation and Moving Occupations by Sex
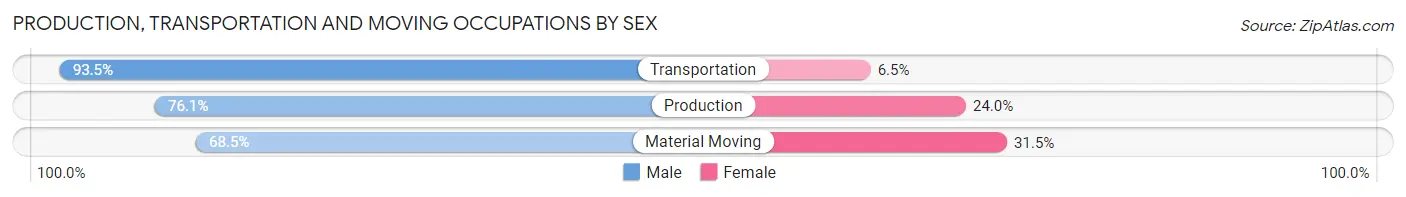
| Occupation | Male | Female |
| Production | 1,229 (76.0%) | 387 (23.9%) |
| Transportation | 521 (93.5%) | 36 (6.5%) |
| Material Moving | 372 (68.5%) | 171 (31.5%) |
| Total (Category) | 2,122 (78.1%) | 594 (21.9%) |
| Total (Overall) | 6,070 (56.1%) | 4,756 (43.9%) |
Employment Industries by Sex in Waushara County
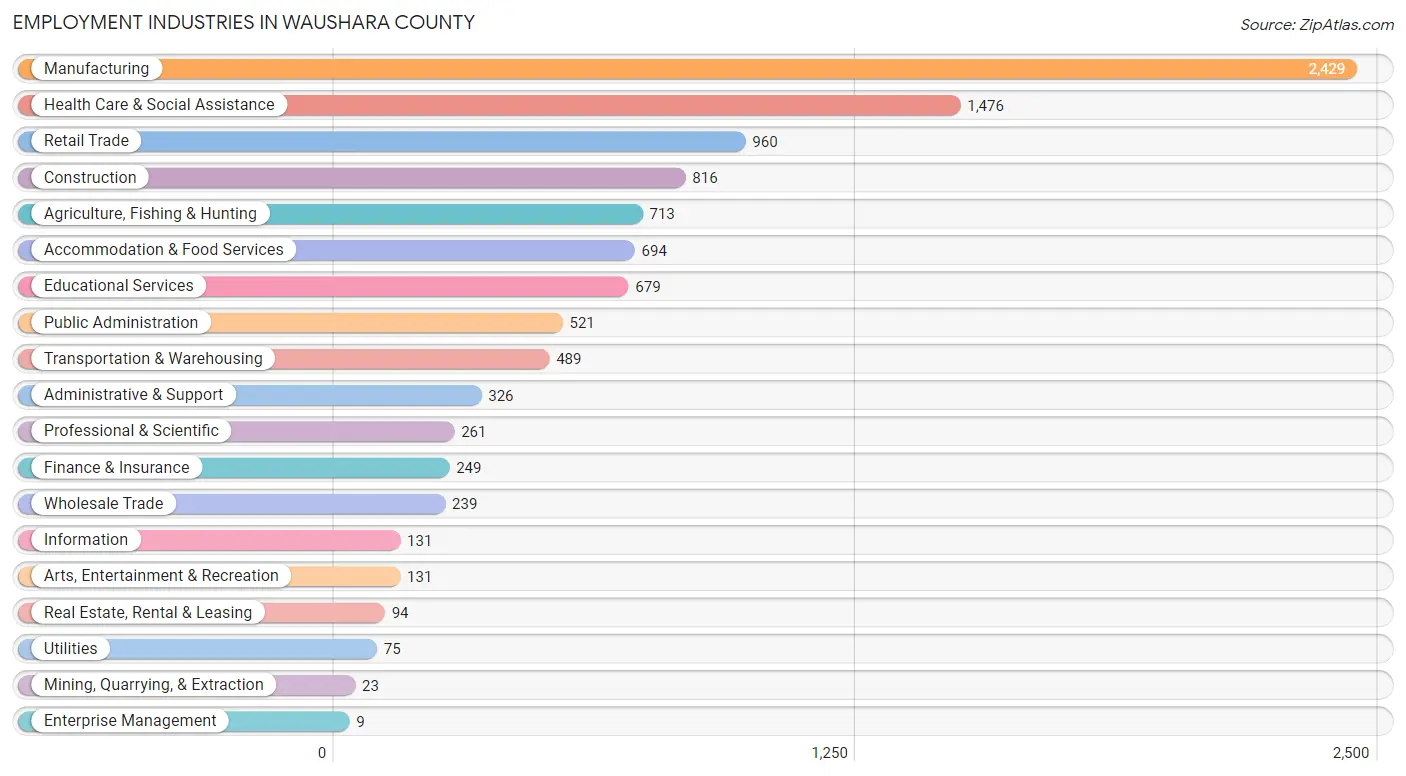
Employment Industries in Waushara County
The major employment industries in Waushara County include Manufacturing (2,429 | 22.4%), Health Care & Social Assistance (1,476 | 13.6%), Retail Trade (960 | 8.9%), Construction (816 | 7.5%), and Agriculture, Fishing & Hunting (713 | 6.6%).
Employment Industries by Sex in Waushara County
The Waushara County industries that see more men than women are Construction (93.4%), Utilities (85.3%), and Transportation & Warehousing (78.1%), whereas the industries that tend to have a higher number of women are Health Care & Social Assistance (85.9%), Finance & Insurance (70.3%), and Educational Services (62.3%).
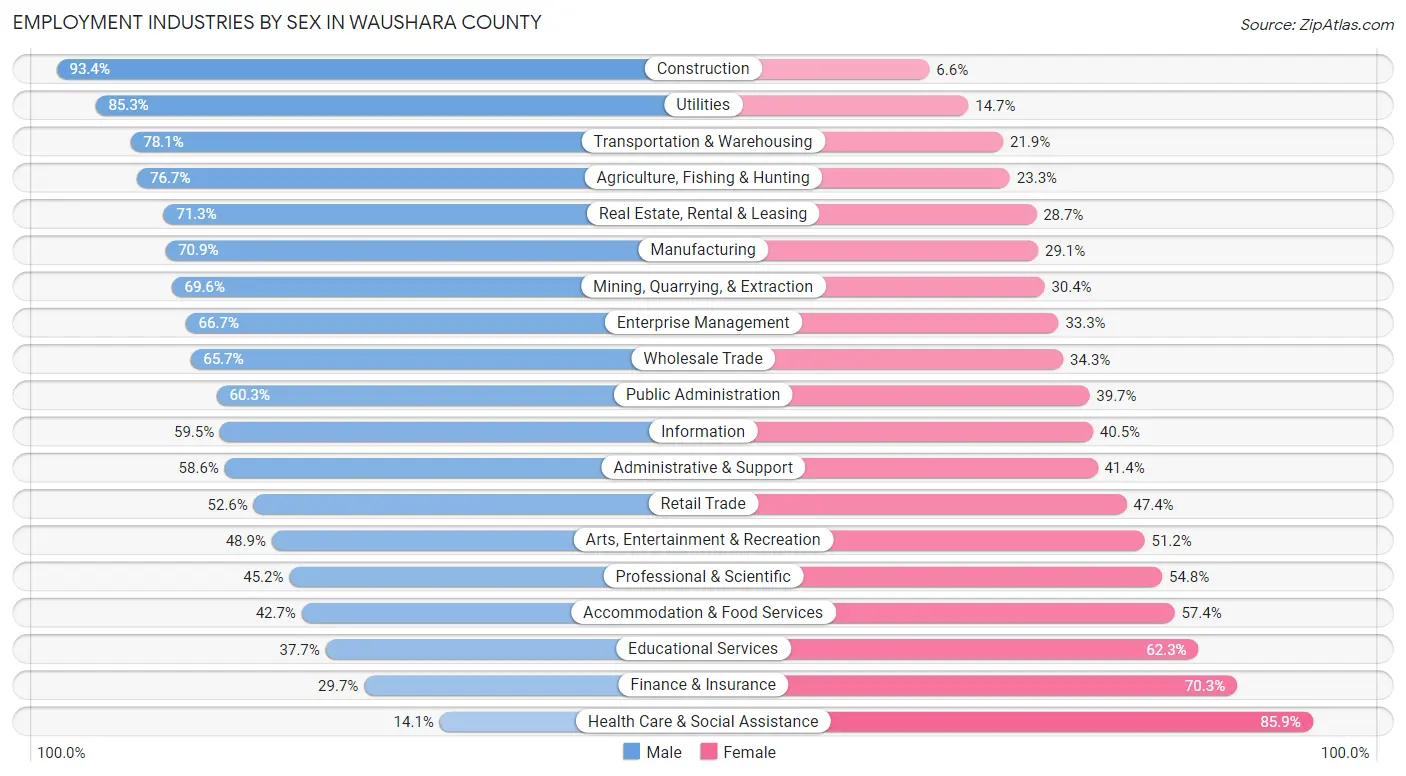
| Industry | Male | Female |
| Agriculture, Fishing & Hunting | 547 (76.7%) | 166 (23.3%) |
| Mining, Quarrying, & Extraction | 16 (69.6%) | 7 (30.4%) |
| Construction | 762 (93.4%) | 54 (6.6%) |
| Manufacturing | 1,722 (70.9%) | 707 (29.1%) |
| Wholesale Trade | 157 (65.7%) | 82 (34.3%) |
| Retail Trade | 505 (52.6%) | 455 (47.4%) |
| Transportation & Warehousing | 382 (78.1%) | 107 (21.9%) |
| Utilities | 64 (85.3%) | 11 (14.7%) |
| Information | 78 (59.5%) | 53 (40.5%) |
| Finance & Insurance | 74 (29.7%) | 175 (70.3%) |
| Real Estate, Rental & Leasing | 67 (71.3%) | 27 (28.7%) |
| Professional & Scientific | 118 (45.2%) | 143 (54.8%) |
| Enterprise Management | 6 (66.7%) | 3 (33.3%) |
| Administrative & Support | 191 (58.6%) | 135 (41.4%) |
| Educational Services | 256 (37.7%) | 423 (62.3%) |
| Health Care & Social Assistance | 208 (14.1%) | 1,268 (85.9%) |
| Arts, Entertainment & Recreation | 64 (48.8%) | 67 (51.1%) |
| Accommodation & Food Services | 296 (42.6%) | 398 (57.4%) |
| Public Administration | 314 (60.3%) | 207 (39.7%) |
| Total | 6,070 (56.1%) | 4,756 (43.9%) |
Education in Waushara County
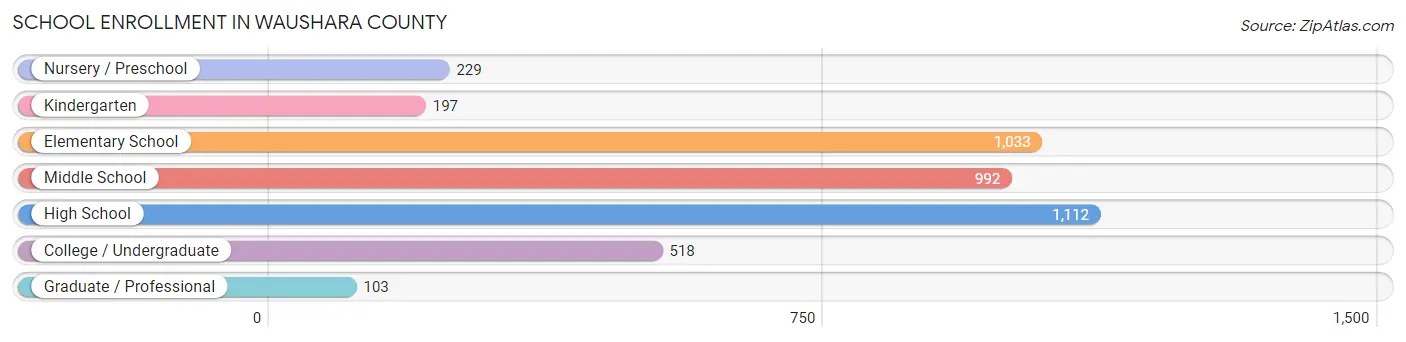
School Enrollment in Waushara County
The most common levels of schooling among the 4,184 students in Waushara County are high school (1,112 | 26.6%), elementary school (1,033 | 24.7%), and middle school (992 | 23.7%).
| School Level | # Students | % Students |
| Nursery / Preschool | 229 | 5.5% |
| Kindergarten | 197 | 4.7% |
| Elementary School | 1,033 | 24.7% |
| Middle School | 992 | 23.7% |
| High School | 1,112 | 26.6% |
| College / Undergraduate | 518 | 12.4% |
| Graduate / Professional | 103 | 2.5% |
| Total | 4,184 | 100.0% |
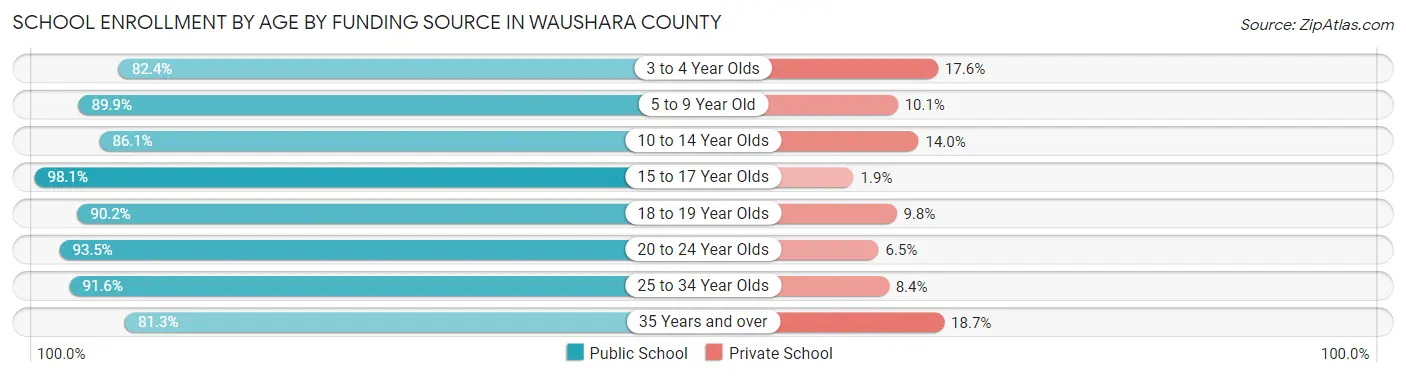
School Enrollment by Age by Funding Source in Waushara County
Out of a total of 4,184 students who are enrolled in schools in Waushara County, 427 (10.2%) attend a private institution, while the remaining 3,757 (89.8%) are enrolled in public schools. The age group of 35 years and over has the highest likelihood of being enrolled in private schools, with 41 (18.7% in the age bracket) enrolled. Conversely, the age group of 15 to 17 year olds has the lowest likelihood of being enrolled in a private school, with 739 (98.1% in the age bracket) attending a public institution.
| Age Bracket | Public School | Private School |
| 3 to 4 Year Olds | 122 (82.4%) | 26 (17.6%) |
| 5 to 9 Year Old | 1,073 (89.9%) | 120 (10.1%) |
| 10 to 14 Year Olds | 1,086 (86.1%) | 176 (14.0%) |
| 15 to 17 Year Olds | 739 (98.1%) | 14 (1.9%) |
| 18 to 19 Year Olds | 229 (90.2%) | 25 (9.8%) |
| 20 to 24 Year Olds | 187 (93.5%) | 13 (6.5%) |
| 25 to 34 Year Olds | 142 (91.6%) | 13 (8.4%) |
| 35 Years and over | 178 (81.3%) | 41 (18.7%) |
| Total | 3,757 (89.8%) | 427 (10.2%) |
Educational Attainment by Field of Study in Waushara County
Education (792 | 23.1%), science & technology (457 | 13.4%), business (428 | 12.5%), bio, nature & agricultural (382 | 11.2%), and arts & humanities (304 | 8.9%) are the most common fields of study among 3,422 individuals in Waushara County who have obtained a bachelor's degree or higher.
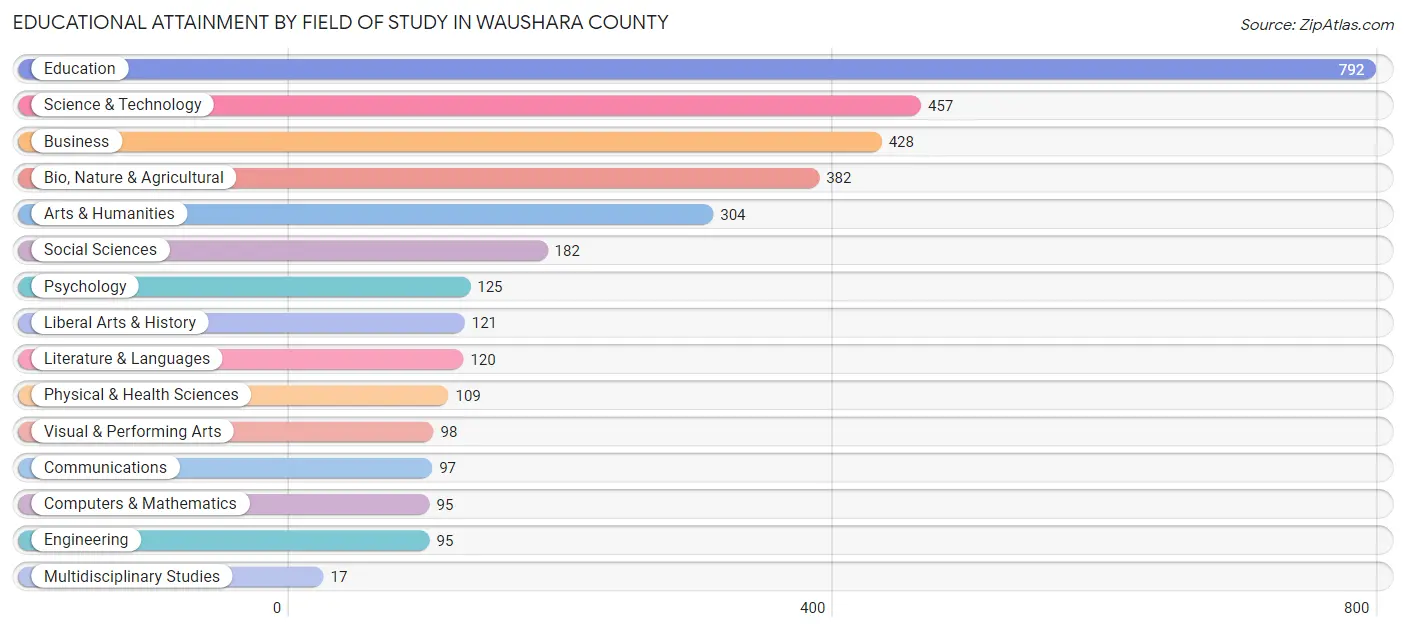
| Field of Study | # Graduates | % Graduates |
| Computers & Mathematics | 95 | 2.8% |
| Bio, Nature & Agricultural | 382 | 11.2% |
| Physical & Health Sciences | 109 | 3.2% |
| Psychology | 125 | 3.6% |
| Social Sciences | 182 | 5.3% |
| Engineering | 95 | 2.8% |
| Multidisciplinary Studies | 17 | 0.5% |
| Science & Technology | 457 | 13.4% |
| Business | 428 | 12.5% |
| Education | 792 | 23.1% |
| Literature & Languages | 120 | 3.5% |
| Liberal Arts & History | 121 | 3.5% |
| Visual & Performing Arts | 98 | 2.9% |
| Communications | 97 | 2.8% |
| Arts & Humanities | 304 | 8.9% |
| Total | 3,422 | 100.0% |
Transportation & Commute in Waushara County
Vehicle Availability by Sex in Waushara County
The most prevalent vehicle ownership categories in Waushara County are males with 2 vehicles (2,162, accounting for 36.5%) and females with 2 vehicles (1,557, making up 46.4%).
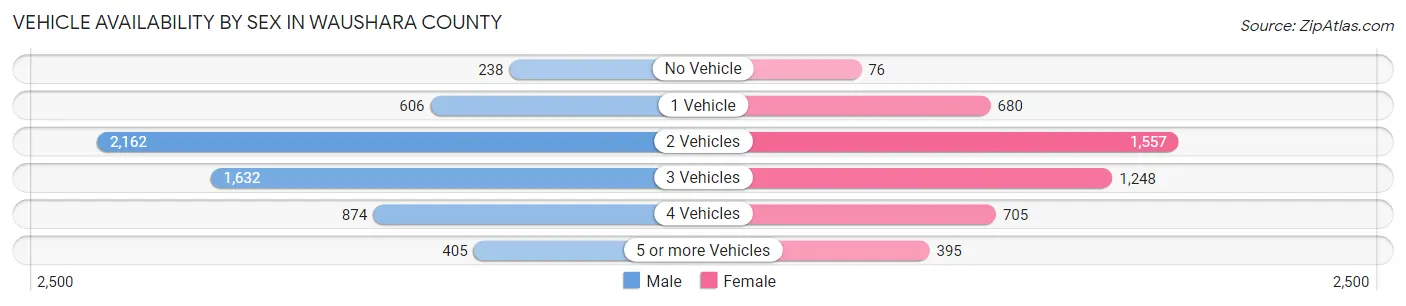
| Vehicles Available | Male | Female |
| No Vehicle | 238 (4.0%) | 76 (1.6%) |
| 1 Vehicle | 606 (10.2%) | 680 (14.6%) |
| 2 Vehicles | 2,162 (36.5%) | 1,557 (33.4%) |
| 3 Vehicles | 1,632 (27.6%) | 1,248 (26.8%) |
| 4 Vehicles | 874 (14.8%) | 705 (15.1%) |
| 5 or more Vehicles | 405 (6.8%) | 395 (8.5%) |
| Total | 5,917 (100.0%) | 4,661 (100.0%) |
Commute Time in Waushara County
The most frequently occuring commute durations in Waushara County are 15 to 19 minutes (1,232 commuters, 12.4%), 5 to 9 minutes (1,179 commuters, 11.8%), and 30 to 34 minutes (1,034 commuters, 10.4%).
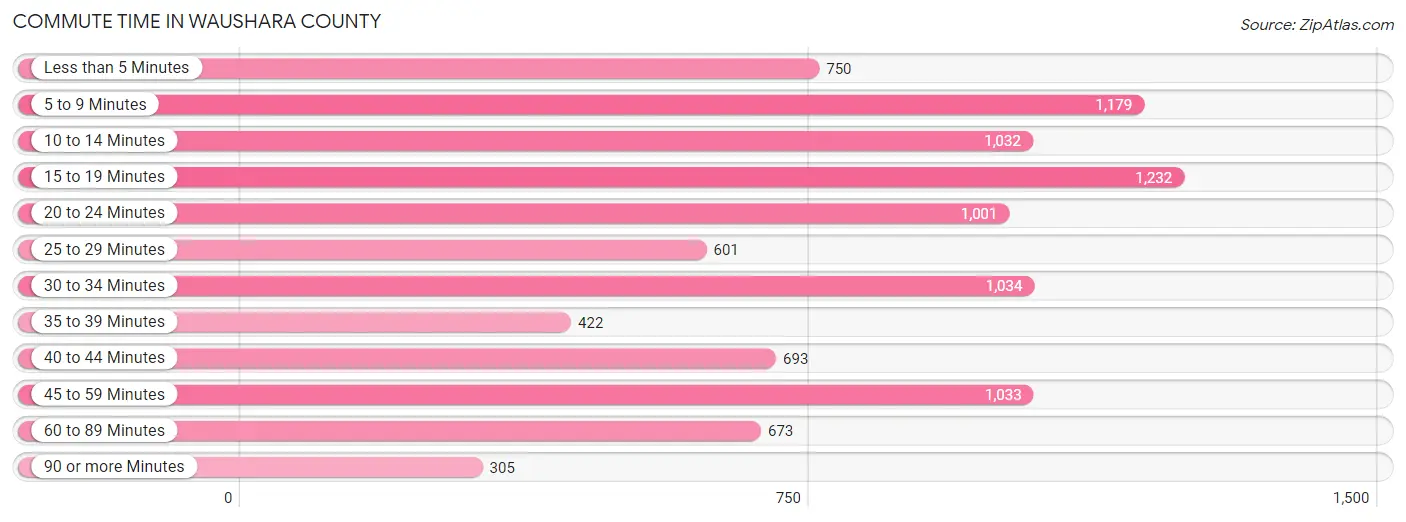
| Commute Time | # Commuters | % Commuters |
| Less than 5 Minutes | 750 | 7.5% |
| 5 to 9 Minutes | 1,179 | 11.8% |
| 10 to 14 Minutes | 1,032 | 10.4% |
| 15 to 19 Minutes | 1,232 | 12.4% |
| 20 to 24 Minutes | 1,001 | 10.1% |
| 25 to 29 Minutes | 601 | 6.0% |
| 30 to 34 Minutes | 1,034 | 10.4% |
| 35 to 39 Minutes | 422 | 4.2% |
| 40 to 44 Minutes | 693 | 7.0% |
| 45 to 59 Minutes | 1,033 | 10.4% |
| 60 to 89 Minutes | 673 | 6.8% |
| 90 or more Minutes | 305 | 3.1% |
Commute Time by Sex in Waushara County
The most common commute times in Waushara County are 15 to 19 minutes (674 commuters, 12.0%) for males and 5 to 9 minutes (589 commuters, 13.6%) for females.
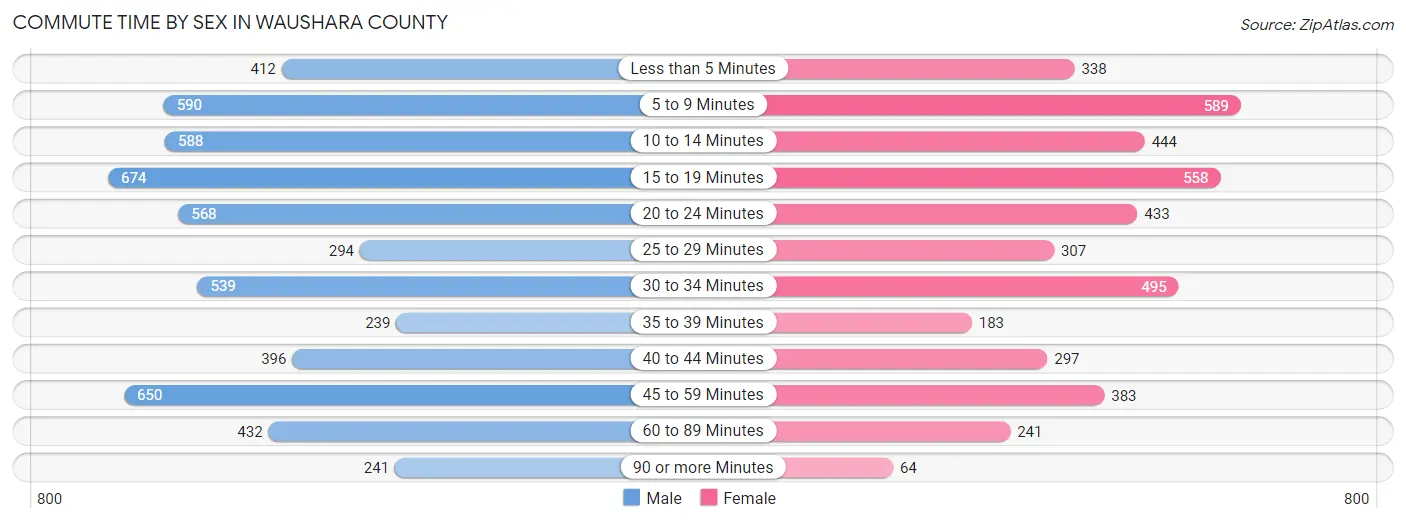
| Commute Time | Male | Female |
| Less than 5 Minutes | 412 (7.3%) | 338 (7.8%) |
| 5 to 9 Minutes | 590 (10.5%) | 589 (13.6%) |
| 10 to 14 Minutes | 588 (10.5%) | 444 (10.2%) |
| 15 to 19 Minutes | 674 (12.0%) | 558 (12.9%) |
| 20 to 24 Minutes | 568 (10.1%) | 433 (10.0%) |
| 25 to 29 Minutes | 294 (5.2%) | 307 (7.1%) |
| 30 to 34 Minutes | 539 (9.6%) | 495 (11.4%) |
| 35 to 39 Minutes | 239 (4.3%) | 183 (4.2%) |
| 40 to 44 Minutes | 396 (7.0%) | 297 (6.9%) |
| 45 to 59 Minutes | 650 (11.6%) | 383 (8.8%) |
| 60 to 89 Minutes | 432 (7.7%) | 241 (5.6%) |
| 90 or more Minutes | 241 (4.3%) | 64 (1.5%) |
Time of Departure to Work by Sex in Waushara County
The most frequent times of departure to work in Waushara County are 12:00 AM to 4:59 AM (765, 13.6%) for males and 7:00 AM to 7:29 AM (679, 15.7%) for females.
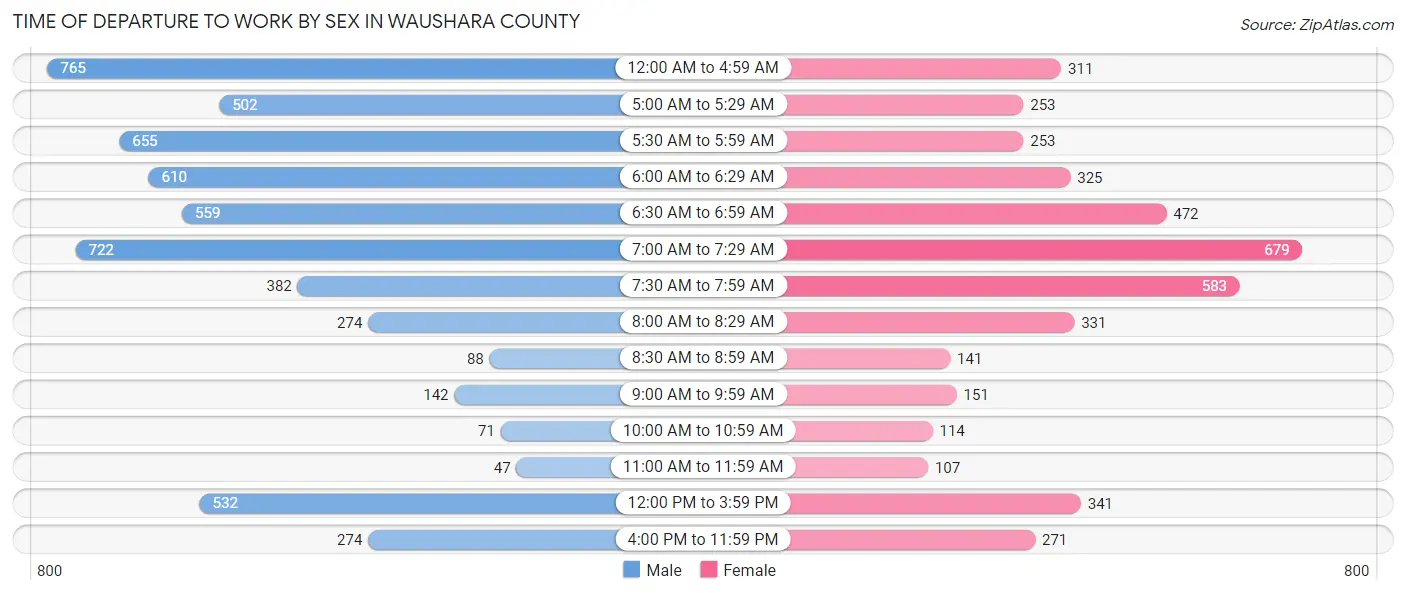
| Time of Departure | Male | Female |
| 12:00 AM to 4:59 AM | 765 (13.6%) | 311 (7.2%) |
| 5:00 AM to 5:29 AM | 502 (8.9%) | 253 (5.8%) |
| 5:30 AM to 5:59 AM | 655 (11.7%) | 253 (5.8%) |
| 6:00 AM to 6:29 AM | 610 (10.8%) | 325 (7.5%) |
| 6:30 AM to 6:59 AM | 559 (9.9%) | 472 (10.9%) |
| 7:00 AM to 7:29 AM | 722 (12.8%) | 679 (15.7%) |
| 7:30 AM to 7:59 AM | 382 (6.8%) | 583 (13.5%) |
| 8:00 AM to 8:29 AM | 274 (4.9%) | 331 (7.6%) |
| 8:30 AM to 8:59 AM | 88 (1.6%) | 141 (3.3%) |
| 9:00 AM to 9:59 AM | 142 (2.5%) | 151 (3.5%) |
| 10:00 AM to 10:59 AM | 71 (1.3%) | 114 (2.6%) |
| 11:00 AM to 11:59 AM | 47 (0.8%) | 107 (2.5%) |
| 12:00 PM to 3:59 PM | 532 (9.5%) | 341 (7.9%) |
| 4:00 PM to 11:59 PM | 274 (4.9%) | 271 (6.3%) |
| Total | 5,623 (100.0%) | 4,332 (100.0%) |
Housing Occupancy in Waushara County
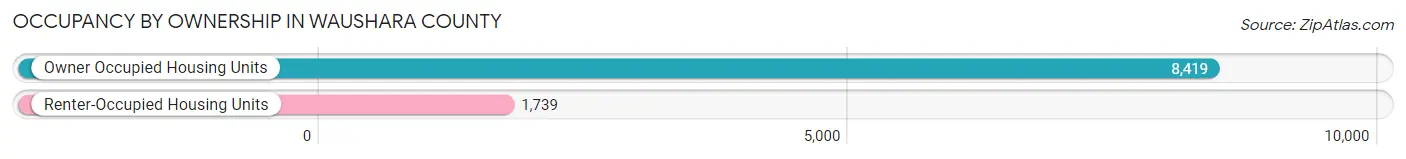
Occupancy by Ownership in Waushara County
Of the total 10,158 dwellings in Waushara County, owner-occupied units account for 8,419 (82.9%), while renter-occupied units make up 1,739 (17.1%).
| Occupancy | # Housing Units | % Housing Units |
| Owner Occupied Housing Units | 8,419 | 82.9% |
| Renter-Occupied Housing Units | 1,739 | 17.1% |
| Total Occupied Housing Units | 10,158 | 100.0% |
Occupancy by Household Size in Waushara County
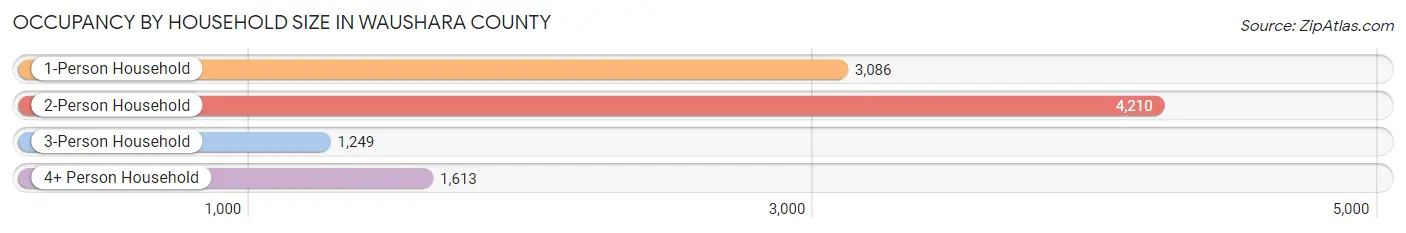
| Household Size | # Housing Units | % Housing Units |
| 1-Person Household | 3,086 | 30.4% |
| 2-Person Household | 4,210 | 41.4% |
| 3-Person Household | 1,249 | 12.3% |
| 4+ Person Household | 1,613 | 15.9% |
| Total Housing Units | 10,158 | 100.0% |
Occupancy by Ownership by Household Size in Waushara County
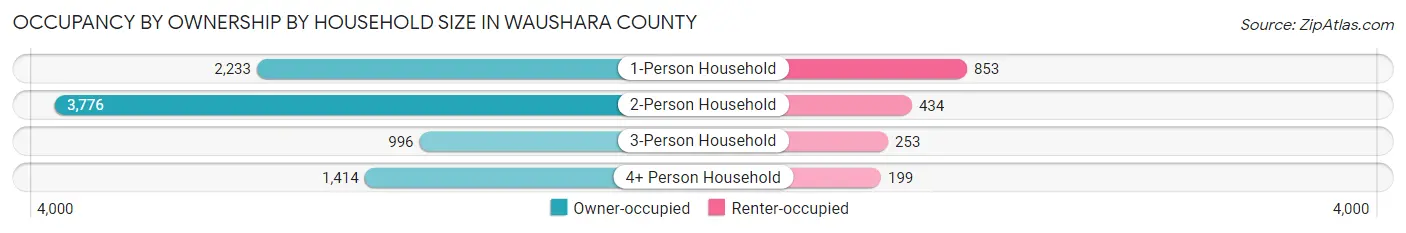
| Household Size | Owner-occupied | Renter-occupied |
| 1-Person Household | 2,233 (72.4%) | 853 (27.6%) |
| 2-Person Household | 3,776 (89.7%) | 434 (10.3%) |
| 3-Person Household | 996 (79.7%) | 253 (20.3%) |
| 4+ Person Household | 1,414 (87.7%) | 199 (12.3%) |
| Total Housing Units | 8,419 (82.9%) | 1,739 (17.1%) |
Occupancy by Educational Attainment in Waushara County
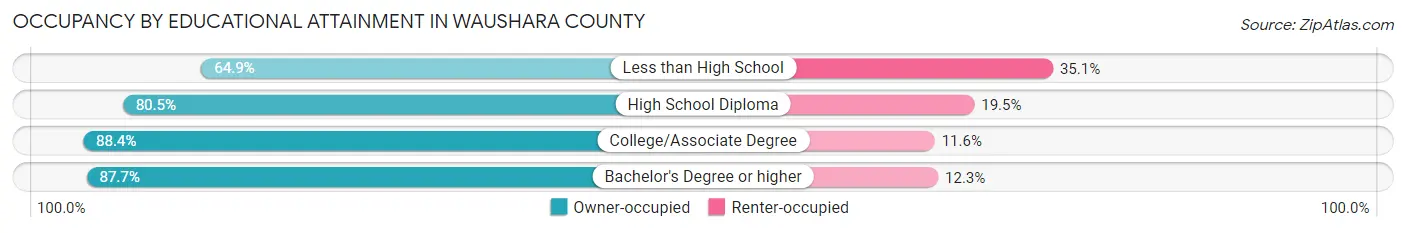
| Household Size | Owner-occupied | Renter-occupied |
| Less than High School | 663 (64.9%) | 358 (35.1%) |
| High School Diploma | 3,161 (80.5%) | 764 (19.5%) |
| College/Associate Degree | 3,016 (88.4%) | 396 (11.6%) |
| Bachelor's Degree or higher | 1,579 (87.7%) | 221 (12.3%) |
Occupancy by Age of Householder in Waushara County
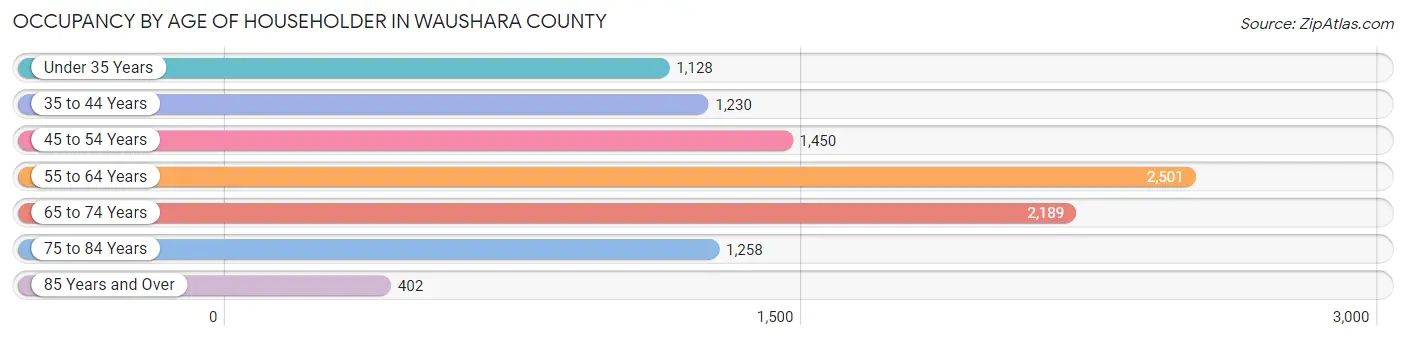
| Age Bracket | # Households | % Households |
| Under 35 Years | 1,128 | 11.1% |
| 35 to 44 Years | 1,230 | 12.1% |
| 45 to 54 Years | 1,450 | 14.3% |
| 55 to 64 Years | 2,501 | 24.6% |
| 65 to 74 Years | 2,189 | 21.5% |
| 75 to 84 Years | 1,258 | 12.4% |
| 85 Years and Over | 402 | 4.0% |
| Total | 10,158 | 100.0% |
Housing Finances in Waushara County
Median Income by Occupancy in Waushara County

| Occupancy Type | # Households | Median Income |
| Owner-Occupied | 8,419 (82.9%) | $68,327 |
| Renter-Occupied | 1,739 (17.1%) | $35,887 |
| Average | 10,158 (100.0%) | $61,033 |
Occupancy by Householder Income Bracket in Waushara County
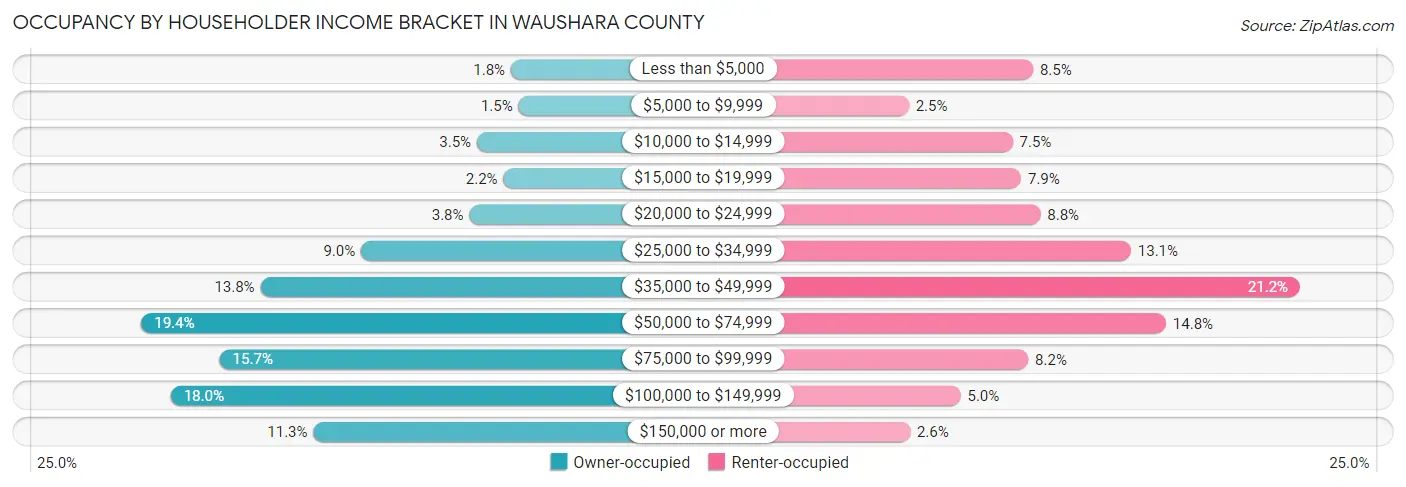
| Income Bracket | Owner-occupied | Renter-occupied |
| Less than $5,000 | 155 (1.8%) | 147 (8.5%) |
| $5,000 to $9,999 | 125 (1.5%) | 44 (2.5%) |
| $10,000 to $14,999 | 291 (3.5%) | 130 (7.5%) |
| $15,000 to $19,999 | 185 (2.2%) | 137 (7.9%) |
| $20,000 to $24,999 | 322 (3.8%) | 153 (8.8%) |
| $25,000 to $34,999 | 756 (9.0%) | 228 (13.1%) |
| $35,000 to $49,999 | 1,159 (13.8%) | 368 (21.2%) |
| $50,000 to $74,999 | 1,637 (19.4%) | 257 (14.8%) |
| $75,000 to $99,999 | 1,323 (15.7%) | 143 (8.2%) |
| $100,000 to $149,999 | 1,519 (18.0%) | 87 (5.0%) |
| $150,000 or more | 947 (11.3%) | 45 (2.6%) |
| Total | 8,419 (100.0%) | 1,739 (100.0%) |
Monthly Housing Cost Tiers in Waushara County
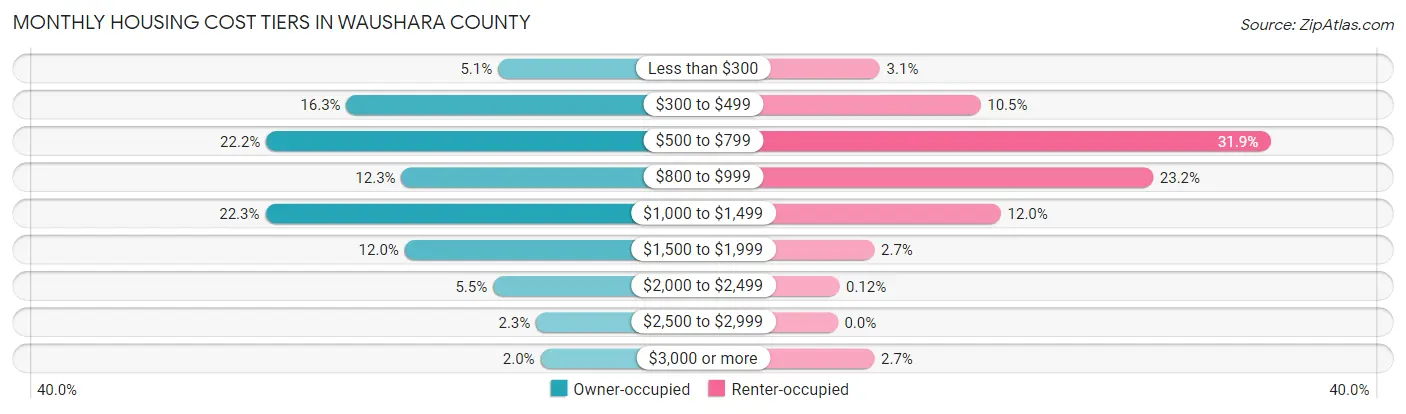
| Monthly Cost | Owner-occupied | Renter-occupied |
| Less than $300 | 432 (5.1%) | 54 (3.1%) |
| $300 to $499 | 1,372 (16.3%) | 183 (10.5%) |
| $500 to $799 | 1,870 (22.2%) | 554 (31.9%) |
| $800 to $999 | 1,031 (12.2%) | 404 (23.2%) |
| $1,000 to $1,499 | 1,875 (22.3%) | 209 (12.0%) |
| $1,500 to $1,999 | 1,011 (12.0%) | 47 (2.7%) |
| $2,000 to $2,499 | 463 (5.5%) | 2 (0.1%) |
| $2,500 to $2,999 | 196 (2.3%) | 0 (0.0%) |
| $3,000 or more | 169 (2.0%) | 47 (2.7%) |
| Total | 8,419 (100.0%) | 1,739 (100.0%) |
Physical Housing Characteristics in Waushara County
Housing Structures in Waushara County
| Structure Type | # Housing Units | % Housing Units |
| Single Unit, Detached | 8,601 | 84.7% |
| Single Unit, Attached | 120 | 1.2% |
| 2 Unit Apartments | 162 | 1.6% |
| 3 or 4 Unit Apartments | 124 | 1.2% |
| 5 to 9 Unit Apartments | 86 | 0.9% |
| 10 or more Apartments | 323 | 3.2% |
| Mobile Home / Other | 742 | 7.3% |
| Total | 10,158 | 100.0% |
Housing Structures by Occupancy in Waushara County
| Structure Type | Owner-occupied | Renter-occupied |
| Single Unit, Detached | 7,826 (91.0%) | 775 (9.0%) |
| Single Unit, Attached | 89 (74.2%) | 31 (25.8%) |
| 2 Unit Apartments | 22 (13.6%) | 140 (86.4%) |
| 3 or 4 Unit Apartments | 24 (19.4%) | 100 (80.6%) |
| 5 to 9 Unit Apartments | 0 (0.0%) | 86 (100.0%) |
| 10 or more Apartments | 0 (0.0%) | 323 (100.0%) |
| Mobile Home / Other | 458 (61.7%) | 284 (38.3%) |
| Total | 8,419 (82.9%) | 1,739 (17.1%) |
Housing Structures by Number of Rooms in Waushara County
| Number of Rooms | Owner-occupied | Renter-occupied |
| 1 Room | 18 (0.2%) | 41 (2.4%) |
| 2 or 3 Rooms | 257 (3.0%) | 384 (22.1%) |
| 4 or 5 Rooms | 2,700 (32.1%) | 836 (48.1%) |
| 6 or 7 Rooms | 3,311 (39.3%) | 337 (19.4%) |
| 8 or more Rooms | 2,133 (25.3%) | 141 (8.1%) |
| Total | 8,419 (100.0%) | 1,739 (100.0%) |
Housing Structure by Heating Type in Waushara County
| Heating Type | Owner-occupied | Renter-occupied |
| Utility Gas | 3,160 (37.5%) | 769 (44.2%) |
| Bottled, Tank, or LP Gas | 3,549 (42.1%) | 370 (21.3%) |
| Electricity | 467 (5.6%) | 506 (29.1%) |
| Fuel Oil or Kerosene | 154 (1.8%) | 15 (0.9%) |
| Coal or Coke | 14 (0.2%) | 0 (0.0%) |
| All other Fuels | 1,040 (12.3%) | 58 (3.3%) |
| No Fuel Used | 35 (0.4%) | 21 (1.2%) |
| Total | 8,419 (100.0%) | 1,739 (100.0%) |
Household Vehicle Usage in Waushara County
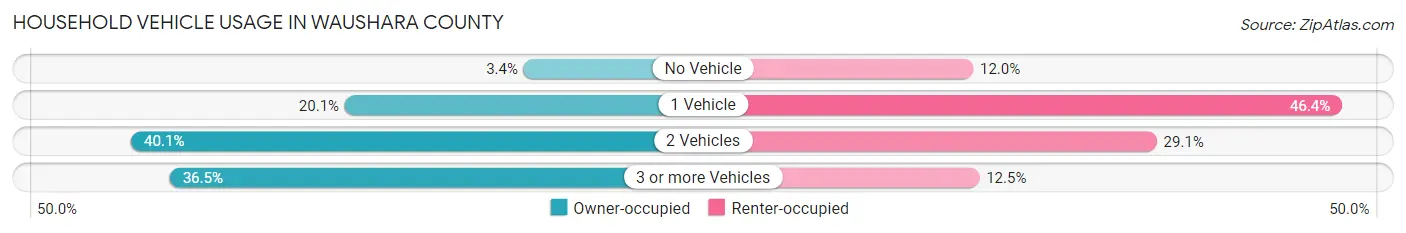
| Vehicles per Household | Owner-occupied | Renter-occupied |
| No Vehicle | 286 (3.4%) | 208 (12.0%) |
| 1 Vehicle | 1,692 (20.1%) | 807 (46.4%) |
| 2 Vehicles | 3,372 (40.1%) | 506 (29.1%) |
| 3 or more Vehicles | 3,069 (36.4%) | 218 (12.5%) |
| Total | 8,419 (100.0%) | 1,739 (100.0%) |
Real Estate & Mortgages in Waushara County
Real Estate and Mortgage Overview in Waushara County
| Characteristic | Without Mortgage | With Mortgage |
| Housing Units | 3,723 | 4,696 |
| Median Property Value | $167,100 | $180,300 |
| Median Household Income | $54,867 | $677 |
| Monthly Housing Costs | $517 | $155 |
| Real Estate Taxes | $2,378 | $32 |
Property Value by Mortgage Status in Waushara County
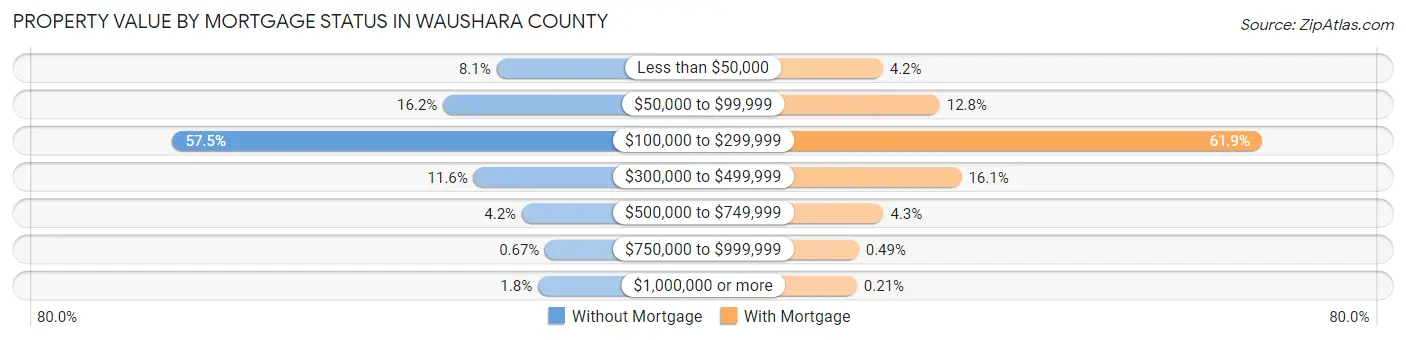
| Property Value | Without Mortgage | With Mortgage |
| Less than $50,000 | 301 (8.1%) | 195 (4.2%) |
| $50,000 to $99,999 | 604 (16.2%) | 603 (12.8%) |
| $100,000 to $299,999 | 2,139 (57.5%) | 2,907 (61.9%) |
| $300,000 to $499,999 | 431 (11.6%) | 758 (16.1%) |
| $500,000 to $749,999 | 157 (4.2%) | 200 (4.3%) |
| $750,000 to $999,999 | 25 (0.7%) | 23 (0.5%) |
| $1,000,000 or more | 66 (1.8%) | 10 (0.2%) |
| Total | 3,723 (100.0%) | 4,696 (100.0%) |
Household Income by Mortgage Status in Waushara County
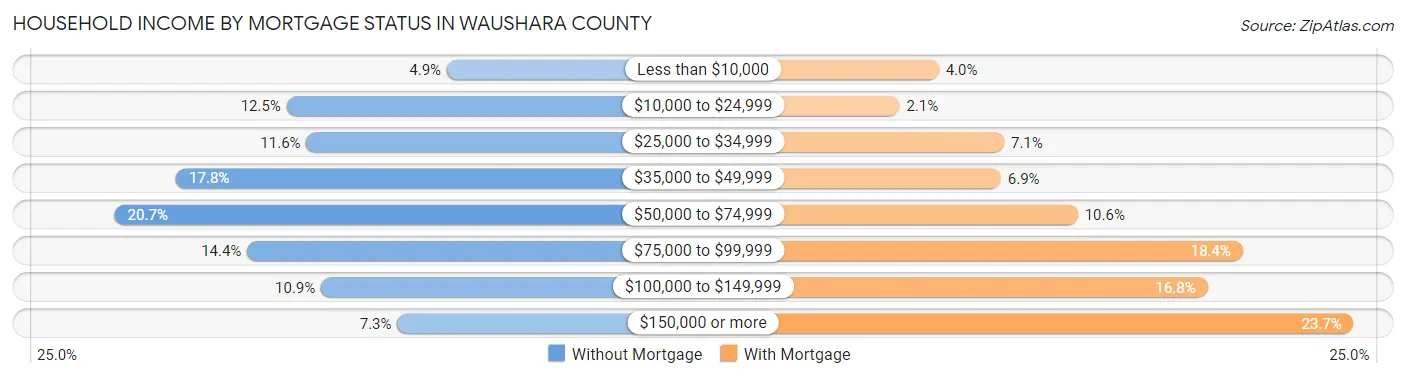
| Household Income | Without Mortgage | With Mortgage |
| Less than $10,000 | 182 (4.9%) | 186 (4.0%) |
| $10,000 to $24,999 | 466 (12.5%) | 98 (2.1%) |
| $25,000 to $34,999 | 431 (11.6%) | 332 (7.1%) |
| $35,000 to $49,999 | 662 (17.8%) | 325 (6.9%) |
| $50,000 to $74,999 | 771 (20.7%) | 497 (10.6%) |
| $75,000 to $99,999 | 536 (14.4%) | 866 (18.4%) |
| $100,000 to $149,999 | 405 (10.9%) | 787 (16.8%) |
| $150,000 or more | 270 (7.2%) | 1,114 (23.7%) |
| Total | 3,723 (100.0%) | 4,696 (100.0%) |
Property Value to Household Income Ratio in Waushara County
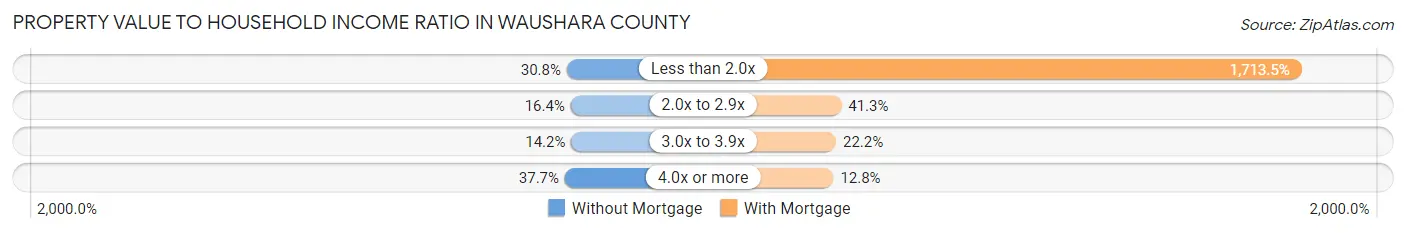
| Value-to-Income Ratio | Without Mortgage | With Mortgage |
| Less than 2.0x | 1,145 (30.7%) | 80,466 (1,713.5%) |
| 2.0x to 2.9x | 611 (16.4%) | 1,937 (41.2%) |
| 3.0x to 3.9x | 527 (14.2%) | 1,044 (22.2%) |
| 4.0x or more | 1,405 (37.7%) | 603 (12.8%) |
| Total | 3,723 (100.0%) | 4,696 (100.0%) |
Real Estate Taxes by Mortgage Status in Waushara County
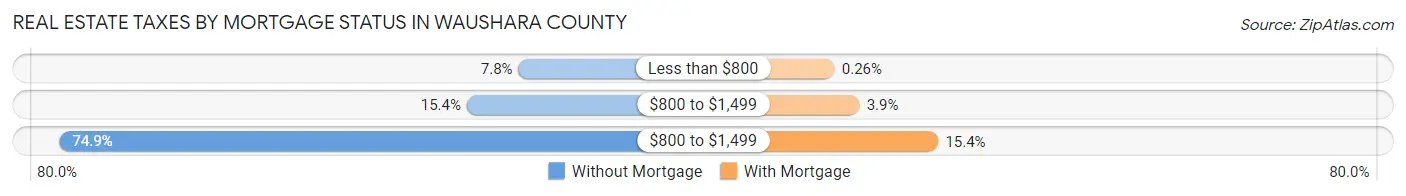
| Property Taxes | Without Mortgage | With Mortgage |
| Less than $800 | 292 (7.8%) | 12 (0.3%) |
| $800 to $1,499 | 573 (15.4%) | 183 (3.9%) |
| $800 to $1,499 | 2,789 (74.9%) | 723 (15.4%) |
| Total | 3,723 (100.0%) | 4,696 (100.0%) |
Health & Disability in Waushara County
Health Insurance Coverage by Age in Waushara County
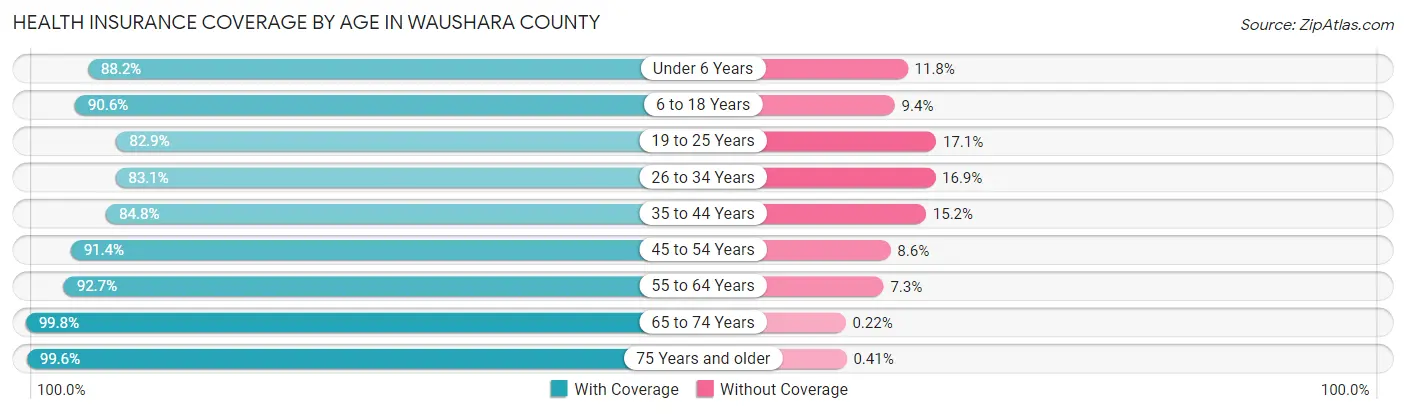
| Age Bracket | With Coverage | Without Coverage |
| Under 6 Years | 1,180 (88.2%) | 158 (11.8%) |
| 6 to 18 Years | 3,020 (90.6%) | 313 (9.4%) |
| 19 to 25 Years | 1,124 (82.9%) | 232 (17.1%) |
| 26 to 34 Years | 1,634 (83.1%) | 333 (16.9%) |
| 35 to 44 Years | 2,051 (84.8%) | 368 (15.2%) |
| 45 to 54 Years | 2,645 (91.4%) | 249 (8.6%) |
| 55 to 64 Years | 3,946 (92.7%) | 311 (7.3%) |
| 65 to 74 Years | 3,632 (99.8%) | 8 (0.2%) |
| 75 Years and older | 2,419 (99.6%) | 10 (0.4%) |
| Total | 21,651 (91.6%) | 1,982 (8.4%) |
Health Insurance Coverage by Citizenship Status in Waushara County

| Citizenship Status | With Coverage | Without Coverage |
| Native Born | 1,180 (88.2%) | 158 (11.8%) |
| Foreign Born, Citizen | 3,020 (90.6%) | 313 (9.4%) |
| Foreign Born, not a Citizen | 1,124 (82.9%) | 232 (17.1%) |
Health Insurance Coverage by Household Income in Waushara County

| Household Income | With Coverage | Without Coverage |
| Under $25,000 | 2,386 (93.4%) | 169 (6.6%) |
| $25,000 to $49,999 | 3,999 (87.9%) | 551 (12.1%) |
| $50,000 to $74,999 | 4,009 (88.8%) | 505 (11.2%) |
| $75,000 to $99,999 | 3,525 (91.8%) | 313 (8.2%) |
| $100,000 and over | 7,661 (94.5%) | 444 (5.5%) |
Public vs Private Health Insurance Coverage by Age in Waushara County
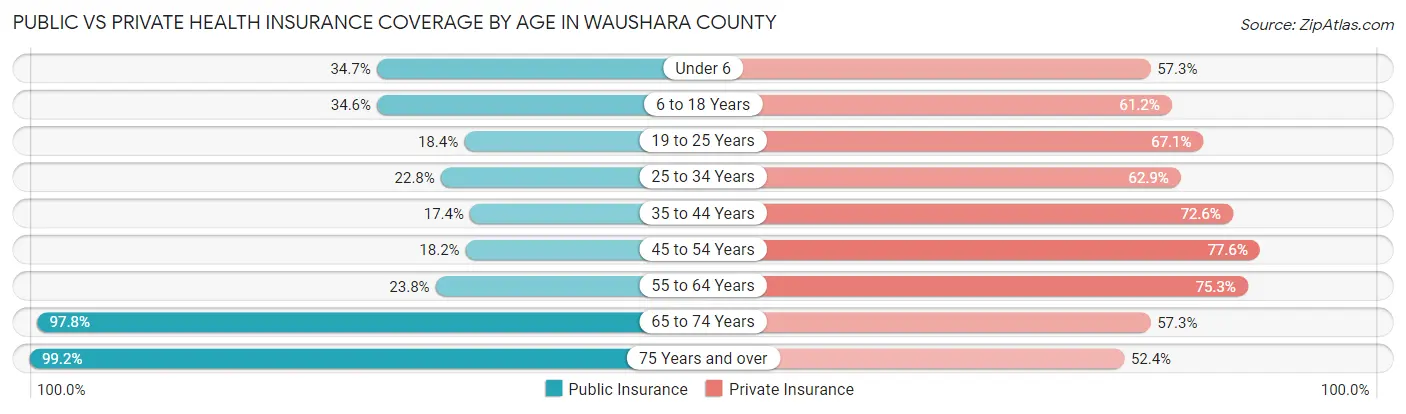
| Age Bracket | Public Insurance | Private Insurance |
| Under 6 | 464 (34.7%) | 766 (57.3%) |
| 6 to 18 Years | 1,154 (34.6%) | 2,040 (61.2%) |
| 19 to 25 Years | 250 (18.4%) | 910 (67.1%) |
| 25 to 34 Years | 448 (22.8%) | 1,237 (62.9%) |
| 35 to 44 Years | 420 (17.4%) | 1,755 (72.6%) |
| 45 to 54 Years | 526 (18.2%) | 2,245 (77.6%) |
| 55 to 64 Years | 1,011 (23.7%) | 3,207 (75.3%) |
| 65 to 74 Years | 3,559 (97.8%) | 2,084 (57.3%) |
| 75 Years and over | 2,409 (99.2%) | 1,272 (52.4%) |
| Total | 10,241 (43.3%) | 15,516 (65.6%) |
Disability Status by Sex by Age in Waushara County
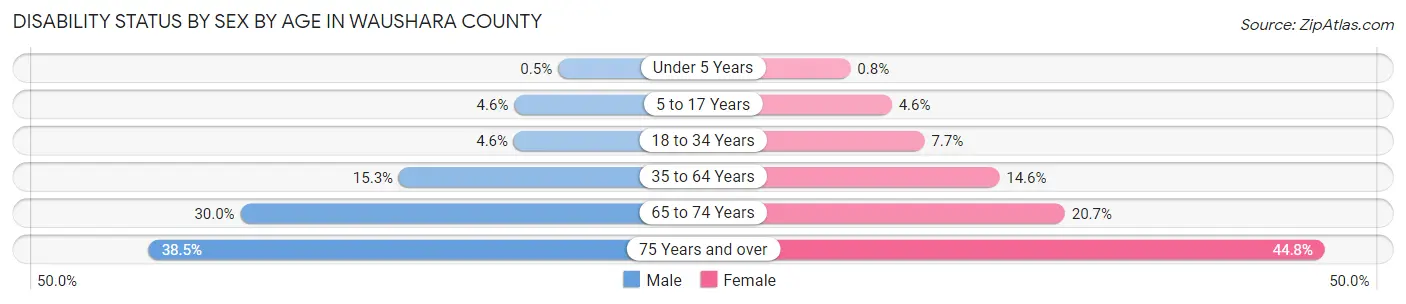
| Age Bracket | Male | Female |
| Under 5 Years | 3 (0.5%) | 4 (0.8%) |
| 5 to 17 Years | 76 (4.6%) | 78 (4.6%) |
| 18 to 34 Years | 87 (4.6%) | 126 (7.7%) |
| 35 to 64 Years | 767 (15.3%) | 664 (14.6%) |
| 65 to 74 Years | 574 (30.0%) | 357 (20.7%) |
| 75 Years and over | 436 (38.5%) | 581 (44.8%) |
Disability Class by Sex by Age in Waushara County
Disability Class: Hearing Difficulty
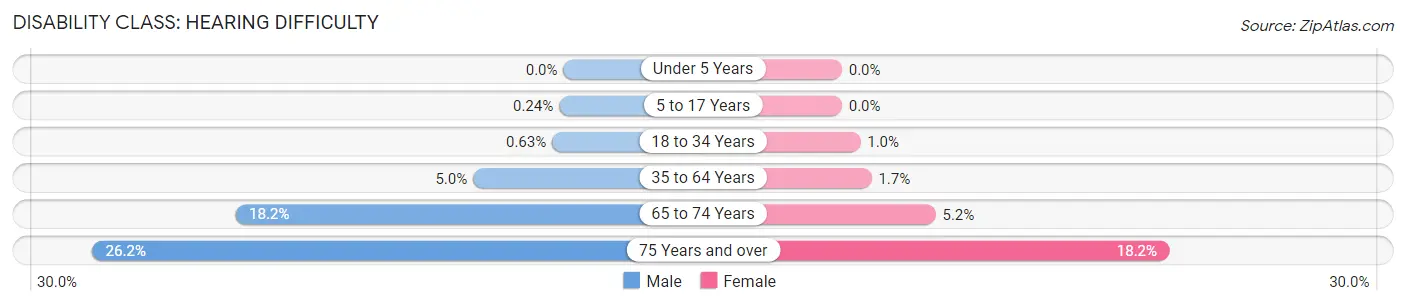
| Age Bracket | Male | Female |
| Under 5 Years | 0 (0.0%) | 0 (0.0%) |
| 5 to 17 Years | 4 (0.2%) | 0 (0.0%) |
| 18 to 34 Years | 12 (0.6%) | 17 (1.0%) |
| 35 to 64 Years | 253 (5.0%) | 75 (1.7%) |
| 65 to 74 Years | 349 (18.2%) | 90 (5.2%) |
| 75 Years and over | 297 (26.2%) | 236 (18.2%) |
Disability Class: Vision Difficulty
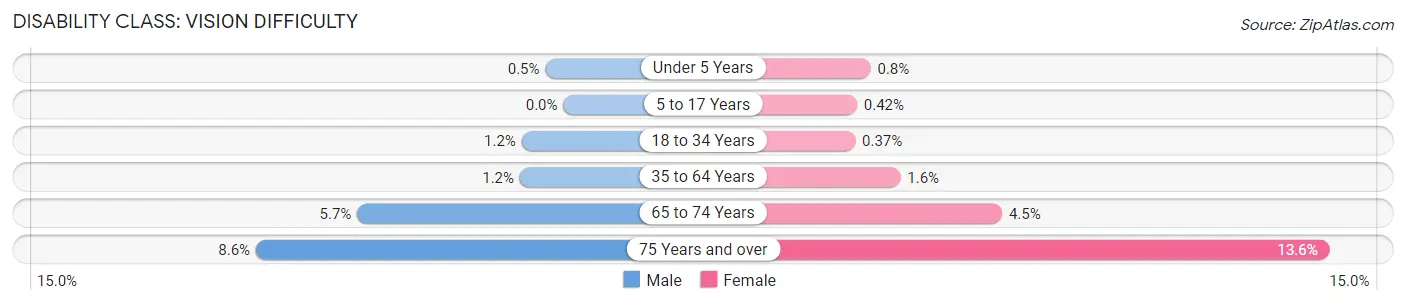
| Age Bracket | Male | Female |
| Under 5 Years | 3 (0.5%) | 4 (0.8%) |
| 5 to 17 Years | 0 (0.0%) | 7 (0.4%) |
| 18 to 34 Years | 22 (1.2%) | 6 (0.4%) |
| 35 to 64 Years | 61 (1.2%) | 74 (1.6%) |
| 65 to 74 Years | 110 (5.7%) | 77 (4.5%) |
| 75 Years and over | 97 (8.6%) | 176 (13.6%) |
Disability Class: Cognitive Difficulty
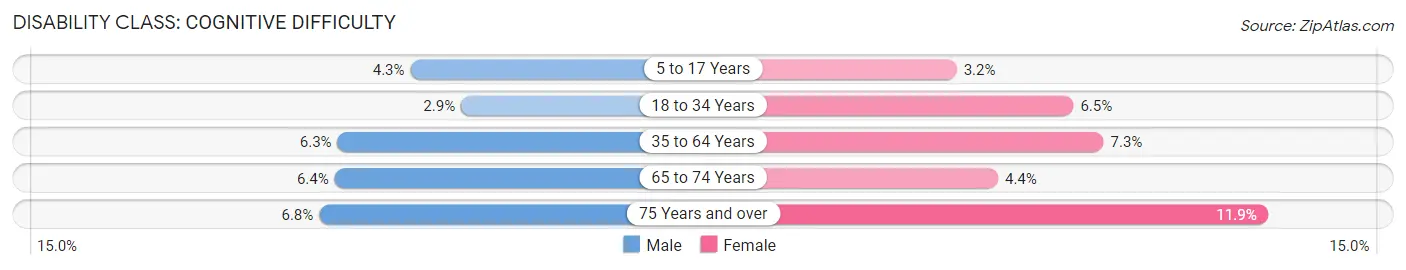
| Age Bracket | Male | Female |
| 5 to 17 Years | 71 (4.3%) | 54 (3.2%) |
| 18 to 34 Years | 54 (2.9%) | 106 (6.5%) |
| 35 to 64 Years | 316 (6.3%) | 331 (7.3%) |
| 65 to 74 Years | 122 (6.4%) | 75 (4.3%) |
| 75 Years and over | 77 (6.8%) | 154 (11.9%) |
Disability Class: Ambulatory Difficulty
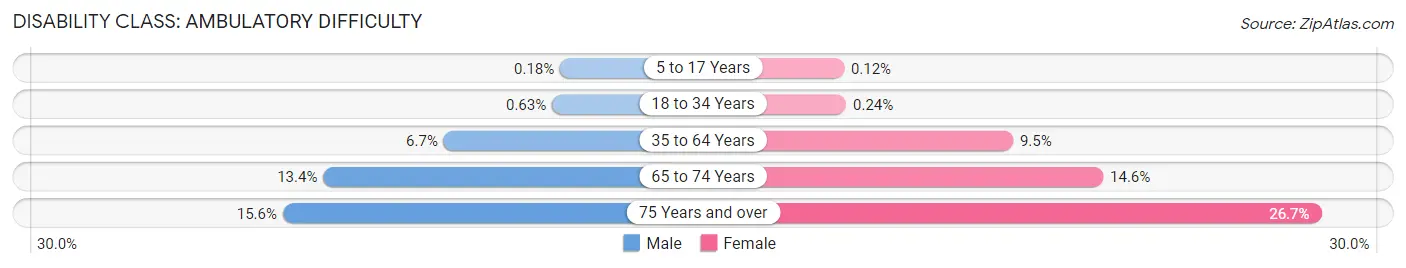
| Age Bracket | Male | Female |
| 5 to 17 Years | 3 (0.2%) | 2 (0.1%) |
| 18 to 34 Years | 12 (0.6%) | 4 (0.2%) |
| 35 to 64 Years | 335 (6.7%) | 433 (9.5%) |
| 65 to 74 Years | 256 (13.4%) | 251 (14.5%) |
| 75 Years and over | 177 (15.6%) | 346 (26.7%) |
Disability Class: Self-Care Difficulty

| Age Bracket | Male | Female |
| 5 to 17 Years | 6 (0.4%) | 13 (0.8%) |
| 18 to 34 Years | 18 (0.9%) | 8 (0.5%) |
| 35 to 64 Years | 161 (3.2%) | 196 (4.3%) |
| 65 to 74 Years | 59 (3.1%) | 71 (4.1%) |
| 75 Years and over | 61 (5.4%) | 116 (8.9%) |
Technology Access in Waushara County
Computing Device Access in Waushara County
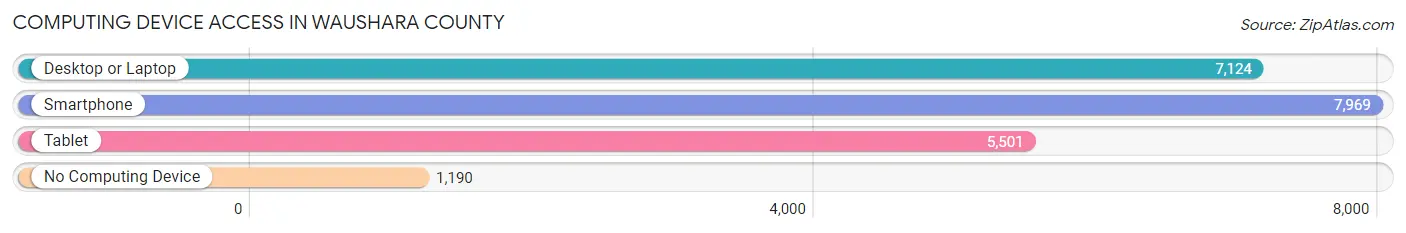
| Device Type | # Households | % Households |
| Desktop or Laptop | 7,124 | 70.1% |
| Smartphone | 7,969 | 78.4% |
| Tablet | 5,501 | 54.1% |
| No Computing Device | 1,190 | 11.7% |
| Total | 10,158 | 100.0% |
Internet Access in Waushara County
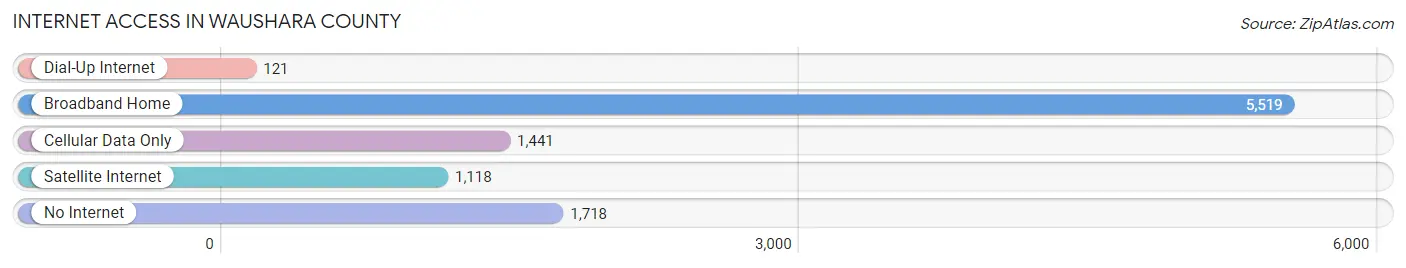
| Internet Type | # Households | % Households |
| Dial-Up Internet | 121 | 1.2% |
| Broadband Home | 5,519 | 54.3% |
| Cellular Data Only | 1,441 | 14.2% |
| Satellite Internet | 1,118 | 11.0% |
| No Internet | 1,718 | 16.9% |
| Total | 10,158 | 100.0% |
Waushara County Summary
Waushara County is located in the central part of Wisconsin, in the Fox River Valley. It is bordered by Green Lake County to the north, Marquette County to the east, Adams County to the south, and Winnebago County to the west. The county seat is Wautoma, and the largest city is Wild Rose. The county was created in 1851 and named after the Waushara River, which flows through the county.
Geography
Waushara County covers an area of 845 square miles, making it the 33rd largest county in Wisconsin. It is mostly rural, with rolling hills and valleys, and is home to several lakes, including Lake Poygan, Lake Winneconne, and Lake Redstone. The county is also home to the Mecan River, which flows through the county from east to west. The highest point in the county is located in the town of Hancock, at an elevation of 1,092 feet.
The climate of Waushara County is typical of the Midwest, with cold winters and hot, humid summers. The average annual temperature is around 45 degrees Fahrenheit, and the average annual precipitation is around 30 inches.
Demographics
As of the 2010 census, Waushara County had a population of 24,496. The population was spread out, with 19.3% under the age of 18, 8.2% from 18 to 24, 24.2% from 25 to 44, 28.2% from 45 to 64, and 20.1% who were 65 years of age or older. The median age was 42.4 years. The gender makeup of the county was 50.3% male and 49.7% female.
The racial makeup of the county was 97.2% White, 0.3% African American, 0.4% Native American, 0.4% Asian, 0.2% from other races, and 1.5% from two or more races. Hispanic or Latino of any race were 1.2% of the population.
Economy
Waushara County has a diverse economy, with a mix of agriculture, manufacturing, and tourism. Agriculture is the largest sector of the economy, with dairy farming and crop production being the main activities. Manufacturing is also important, with several companies located in the county, including a paper mill, a furniture manufacturer, and a plastics manufacturer. Tourism is also an important part of the economy, with several lakes and rivers providing recreational opportunities.
The median household income in Waushara County was $45,945 in 2018, and the median family income was $54,945. The per capita income was $24,945. About 11.2% of the population was below the poverty line.
Waushara County is a great place to live and work, with a diverse economy and a beautiful natural landscape. It is a great place to raise a family, with a strong sense of community and plenty of recreational opportunities.
Common Questions
What is the Total Population of Waushara County?
Total Population of Waushara County is 24,672.
What is the Total Male Population of Waushara County?
Total Male Population of Waushara County is 13,129.
What is the Total Female Population of Waushara County?
Total Female Population of Waushara County is 11,543.
What is the Ratio of Males per 100 Females in Waushara County?
There are 113.74 Males per 100 Females in Waushara County.
What is the Ratio of Females per 100 Males in Waushara County?
There are 87.92 Females per 100 Males in Waushara County.
What is the Median Population Age in Waushara County?
Median Population Age in Waushara County is 49.9 Years.
What is the Average Family Size in Waushara County
Average Family Size in Waushara County is 2.9 People.
What is the Average Household Size in Waushara County
Average Household Size in Waushara County is 2.3 People.
What is Per Capita Income in Waushara County?
Per Capita income in Waushara County is $37,927.
What is the Median Family Income in Waushara County?
Median Family Income in Waushara County is $75,586.
What is the Median Household income in Waushara County?
Median Household Income in Waushara County is $61,033.
What is Income or Wage Gap in Waushara County?
Income or Wage Gap in Waushara County is 36.3%.
Women in Waushara County earn 63.7 cents for every dollar earned by a man.
What is Family Income Deficit in Waushara County?
Family Income Deficit in Waushara County is $9,401.
Families that are below poverty line in Waushara County earn $9,401 less on average than the poverty threshold level.
What is Inequality or Gini Index in Waushara County?
Inequality or Gini Index in Waushara County is 0.44.
How Large is the Labor Force in Waushara County?
There are 11,301 People in the Labor Forcein in Waushara County.
What is the Percentage of People in the Labor Force in Waushara County?
54.4% of People are in the Labor Force in Waushara County.
What is the Unemployment Rate in Waushara County?
Unemployment Rate in Waushara County is 4.1%.