Waupaca County, WI
Waupaca County Map
Waupaca County Overview
51,822
TOTAL POPULATION
26,448
MALE POPULATION
25,374
FEMALE POPULATION
104.23
MALES / 100 FEMALES
95.94
FEMALES / 100 MALES
45.3
MEDIAN AGE
2.7
AVG FAMILY SIZE
2.2
AVG HOUSEHOLD SIZE
$39,147
PER CAPITA INCOME
$84,282
AVG FAMILY INCOME
$69,198
AVG HOUSEHOLD INCOME
34.7%
WAGE / INCOME GAP [ % ]
65.3¢/ $1
WAGE / INCOME GAP [ $ ]
$10,275
FAMILY INCOME DEFICIT
0.44
INEQUALITY / GINI INDEX
26,893
LABOR FORCE [ PEOPLE ]
63.0%
PERCENT IN LABOR FORCE
2.7%
UNEMPLOYMENT RATE
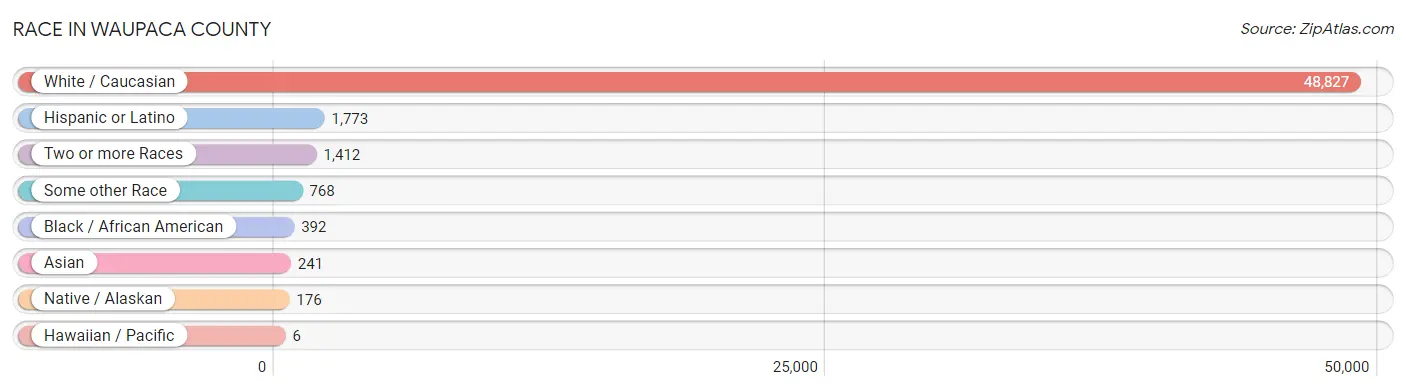
Race in Waupaca County
The most populous races in Waupaca County are White / Caucasian (48,827 | 94.2%), Hispanic or Latino (1,773 | 3.4%), and Two or more Races (1,412 | 2.7%).
| Race | # Population | % Population |
| Asian | 241 | 0.5% |
| Black / African American | 392 | 0.8% |
| Hawaiian / Pacific | 6 | 0.0% |
| Hispanic or Latino | 1,773 | 3.4% |
| Native / Alaskan | 176 | 0.3% |
| White / Caucasian | 48,827 | 94.2% |
| Two or more Races | 1,412 | 2.7% |
| Some other Race | 768 | 1.5% |
| Total | 51,822 | 100.0% |
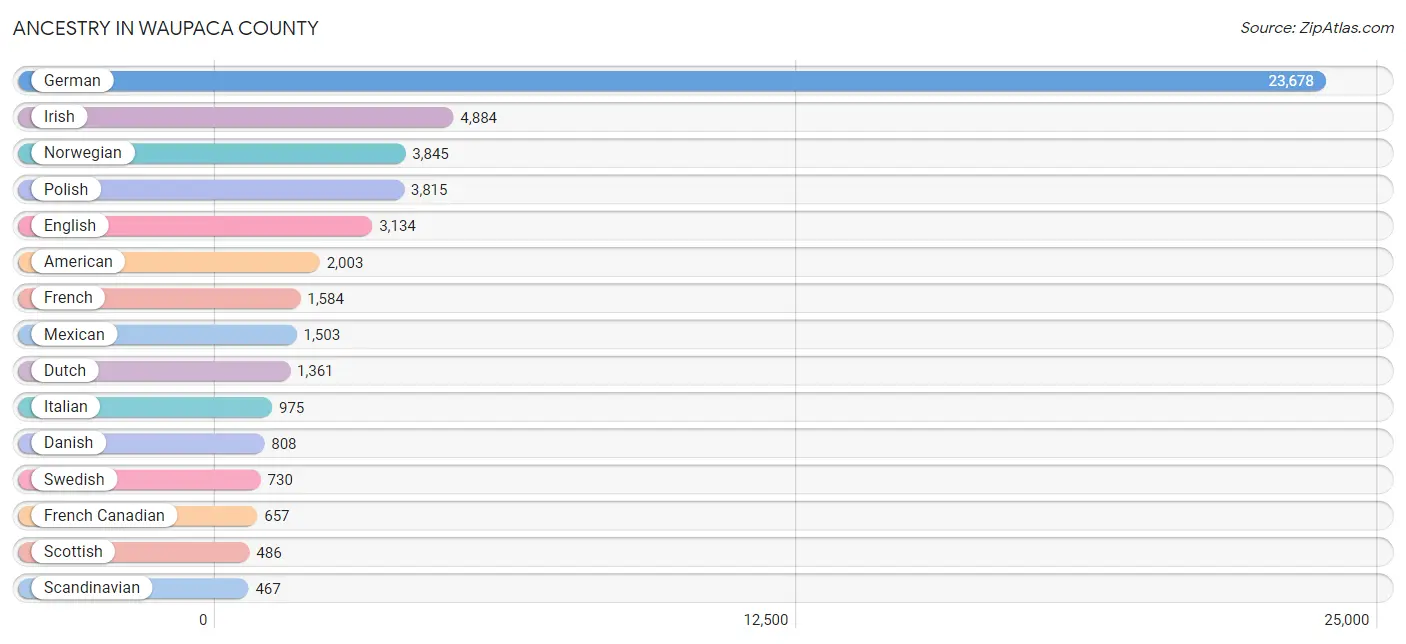
Ancestry in Waupaca County
The most populous ancestries reported in Waupaca County are German (23,678 | 45.7%), Irish (4,884 | 9.4%), Norwegian (3,845 | 7.4%), Polish (3,815 | 7.4%), and English (3,134 | 6.0%), together accounting for 75.9% of all Waupaca County residents.
| Ancestry | # Population | % Population |
| African | 22 | 0.0% |
| Alsatian | 3 | 0.0% |
| American | 2,003 | 3.9% |
| Arab | 37 | 0.1% |
| Armenian | 33 | 0.1% |
| Austrian | 218 | 0.4% |
| Bangladeshi | 17 | 0.0% |
| Belgian | 291 | 0.6% |
| Bhutanese | 66 | 0.1% |
| Blackfeet | 4 | 0.0% |
| British | 74 | 0.1% |
| Burmese | 137 | 0.3% |
| Cajun | 2 | 0.0% |
| Canadian | 47 | 0.1% |
| Central American | 48 | 0.1% |
| Central American Indian | 17 | 0.0% |
| Cherokee | 8 | 0.0% |
| Chilean | 3 | 0.0% |
| Chippewa | 60 | 0.1% |
| Choctaw | 7 | 0.0% |
| Colombian | 12 | 0.0% |
| Cree | 1 | 0.0% |
| Croatian | 43 | 0.1% |
| Cuban | 54 | 0.1% |
| Czech | 453 | 0.9% |
| Czechoslovakian | 52 | 0.1% |
| Danish | 808 | 1.6% |
| Dominican | 3 | 0.0% |
| Dutch | 1,361 | 2.6% |
| Eastern European | 64 | 0.1% |
| Ecuadorian | 3 | 0.0% |
| Egyptian | 17 | 0.0% |
| English | 3,134 | 6.0% |
| Ethiopian | 44 | 0.1% |
| European | 408 | 0.8% |
| Filipino | 1 | 0.0% |
| Finnish | 268 | 0.5% |
| French | 1,584 | 3.1% |
| French American Indian | 22 | 0.0% |
| French Canadian | 657 | 1.3% |
| German | 23,678 | 45.7% |
| German Russian | 4 | 0.0% |
| Greek | 125 | 0.2% |
| Guamanian / Chamorro | 10 | 0.0% |
| Guatemalan | 32 | 0.1% |
| Honduran | 4 | 0.0% |
| Hungarian | 288 | 0.6% |
| Icelander | 9 | 0.0% |
| Indian (Asian) | 14 | 0.0% |
| Irish | 4,884 | 9.4% |
| Iroquois | 133 | 0.3% |
| Italian | 975 | 1.9% |
| Kiowa | 4 | 0.0% |
| Korean | 110 | 0.2% |
| Latvian | 16 | 0.0% |
| Lebanese | 18 | 0.0% |
| Lithuanian | 95 | 0.2% |
| Luxembourger | 29 | 0.1% |
| Macedonian | 2 | 0.0% |
| Malaysian | 24 | 0.1% |
| Menominee | 53 | 0.1% |
| Mexican | 1,503 | 2.9% |
| Mexican American Indian | 1 | 0.0% |
| Native Hawaiian | 15 | 0.0% |
| Navajo | 4 | 0.0% |
| New Zealander | 3 | 0.0% |
| Nicaraguan | 12 | 0.0% |
| Nigerian | 10 | 0.0% |
| Northern European | 57 | 0.1% |
| Norwegian | 3,845 | 7.4% |
| Ottawa | 4 | 0.0% |
| Pennsylvania German | 40 | 0.1% |
| Polish | 3,815 | 7.4% |
| Portuguese | 3 | 0.0% |
| Potawatomi | 3 | 0.0% |
| Puerto Rican | 102 | 0.2% |
| Romanian | 9 | 0.0% |
| Russian | 179 | 0.4% |
| Samoan | 6 | 0.0% |
| Scandinavian | 467 | 0.9% |
| Scotch-Irish | 123 | 0.2% |
| Scottish | 486 | 0.9% |
| Serbian | 12 | 0.0% |
| Shoshone | 2 | 0.0% |
| Sioux | 3 | 0.0% |
| Slavic | 4 | 0.0% |
| Slovak | 31 | 0.1% |
| Slovene | 34 | 0.1% |
| South American | 31 | 0.1% |
| Spaniard | 17 | 0.0% |
| Spanish | 9 | 0.0% |
| Sri Lankan | 8 | 0.0% |
| Subsaharan African | 76 | 0.2% |
| Swedish | 730 | 1.4% |
| Swiss | 278 | 0.5% |
| Syrian | 2 | 0.0% |
| Thai | 13 | 0.0% |
| Tohono O'Odham | 62 | 0.1% |
| Turkish | 3 | 0.0% |
| Ukrainian | 59 | 0.1% |
| Venezuelan | 13 | 0.0% |
| Welsh | 128 | 0.3% |
| Yugoslavian | 3 | 0.0% | View All 103 Rows |
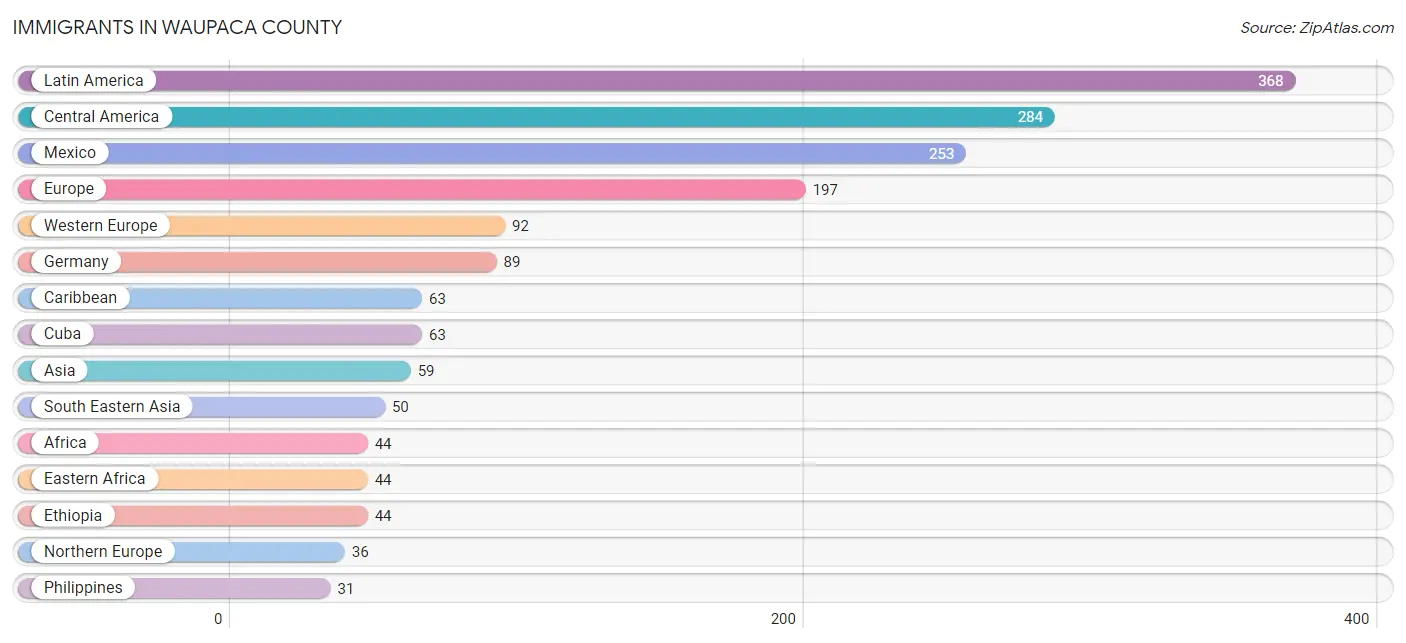
Immigrants in Waupaca County
The most numerous immigrant groups reported in Waupaca County came from Latin America (368 | 0.7%), Central America (284 | 0.5%), Mexico (253 | 0.5%), Europe (197 | 0.4%), and Western Europe (92 | 0.2%), together accounting for 2.3% of all Waupaca County residents.
| Immigration Origin | # Population | % Population |
| Africa | 44 | 0.1% |
| Asia | 59 | 0.1% |
| Austria | 1 | 0.0% |
| Brazil | 2 | 0.0% |
| Canada | 13 | 0.0% |
| Caribbean | 63 | 0.1% |
| Central America | 284 | 0.5% |
| Chile | 3 | 0.0% |
| Cuba | 63 | 0.1% |
| Czechoslovakia | 11 | 0.0% |
| Eastern Africa | 44 | 0.1% |
| Eastern Asia | 1 | 0.0% |
| Eastern Europe | 30 | 0.1% |
| England | 14 | 0.0% |
| Ethiopia | 44 | 0.1% |
| Europe | 197 | 0.4% |
| Germany | 89 | 0.2% |
| Greece | 3 | 0.0% |
| Guatemala | 28 | 0.1% |
| Honduras | 3 | 0.0% |
| India | 8 | 0.0% |
| Italy | 19 | 0.0% |
| Japan | 1 | 0.0% |
| Laos | 3 | 0.0% |
| Latin America | 368 | 0.7% |
| Lithuania | 6 | 0.0% |
| Mexico | 253 | 0.5% |
| Netherlands | 2 | 0.0% |
| Northern Europe | 36 | 0.1% |
| Norway | 8 | 0.0% |
| Philippines | 31 | 0.1% |
| Poland | 7 | 0.0% |
| Russia | 2 | 0.0% |
| South America | 21 | 0.0% |
| South Central Asia | 8 | 0.0% |
| South Eastern Asia | 50 | 0.1% |
| Southern Europe | 26 | 0.1% |
| Spain | 4 | 0.0% |
| Sweden | 2 | 0.0% |
| Thailand | 14 | 0.0% |
| Ukraine | 4 | 0.0% |
| Venezuela | 13 | 0.0% |
| Vietnam | 2 | 0.0% |
| Western Europe | 92 | 0.2% | View All 44 Rows |
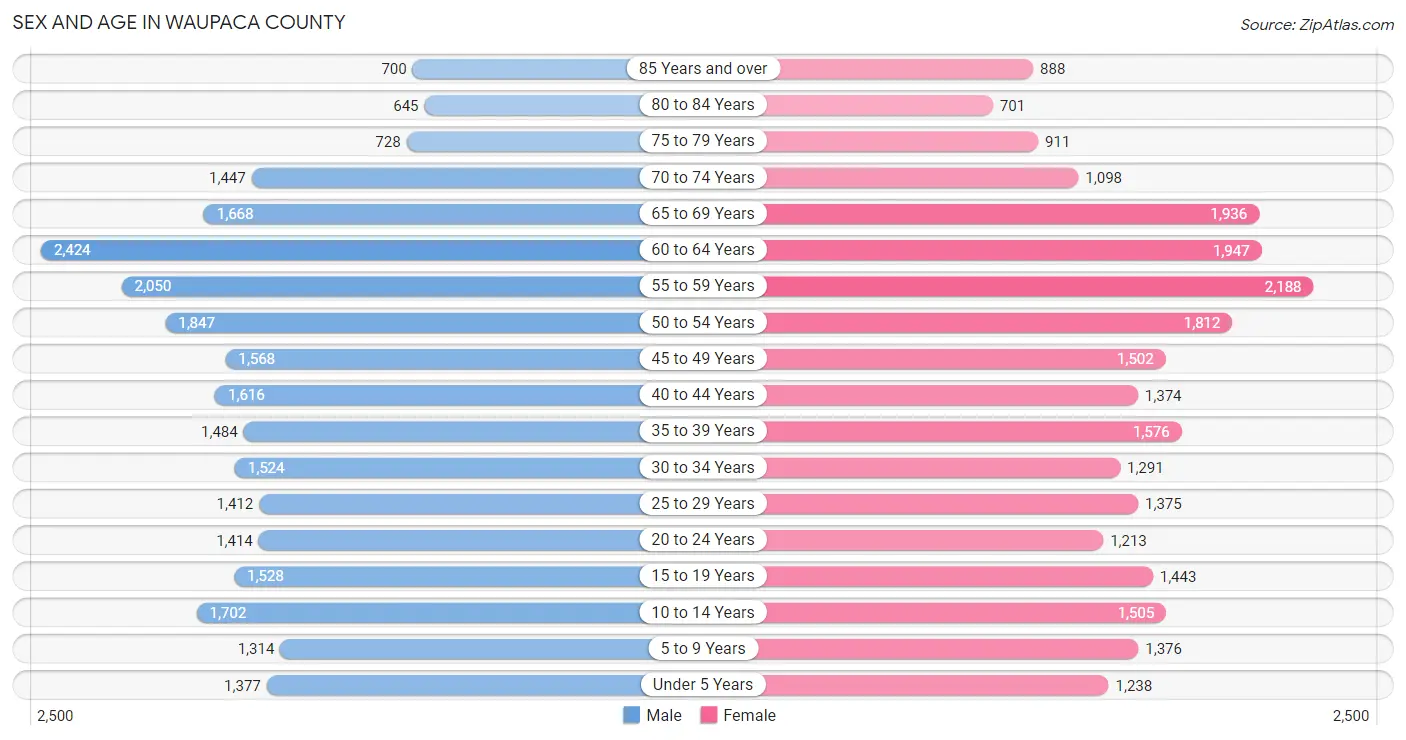
Sex and Age in Waupaca County
Sex and Age in Waupaca County
The most populous age groups in Waupaca County are 60 to 64 Years (2,424 | 9.2%) for men and 55 to 59 Years (2,188 | 8.6%) for women.
| Age Bracket | Male | Female |
| Under 5 Years | 1,377 (5.2%) | 1,238 (4.9%) |
| 5 to 9 Years | 1,314 (5.0%) | 1,376 (5.4%) |
| 10 to 14 Years | 1,702 (6.4%) | 1,505 (5.9%) |
| 15 to 19 Years | 1,528 (5.8%) | 1,443 (5.7%) |
| 20 to 24 Years | 1,414 (5.3%) | 1,213 (4.8%) |
| 25 to 29 Years | 1,412 (5.3%) | 1,375 (5.4%) |
| 30 to 34 Years | 1,524 (5.8%) | 1,291 (5.1%) |
| 35 to 39 Years | 1,484 (5.6%) | 1,576 (6.2%) |
| 40 to 44 Years | 1,616 (6.1%) | 1,374 (5.4%) |
| 45 to 49 Years | 1,568 (5.9%) | 1,502 (5.9%) |
| 50 to 54 Years | 1,847 (7.0%) | 1,812 (7.1%) |
| 55 to 59 Years | 2,050 (7.7%) | 2,188 (8.6%) |
| 60 to 64 Years | 2,424 (9.2%) | 1,947 (7.7%) |
| 65 to 69 Years | 1,668 (6.3%) | 1,936 (7.6%) |
| 70 to 74 Years | 1,447 (5.5%) | 1,098 (4.3%) |
| 75 to 79 Years | 728 (2.8%) | 911 (3.6%) |
| 80 to 84 Years | 645 (2.4%) | 701 (2.8%) |
| 85 Years and over | 700 (2.6%) | 888 (3.5%) |
| Total | 26,448 (100.0%) | 25,374 (100.0%) |
Families and Households in Waupaca County
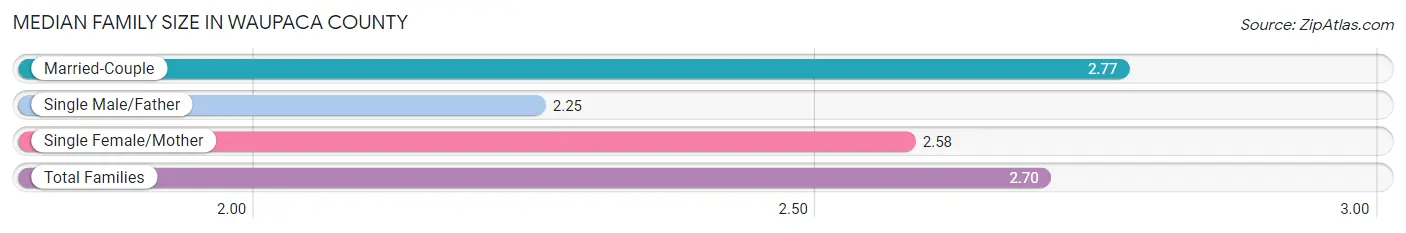
Median Family Size in Waupaca County
The median family size in Waupaca County is 2.70 persons per family, with married-couple families (11,439 | 77.5%) accounting for the largest median family size of 2.77 persons per family. On the other hand, single male/father families (1,285 | 8.7%) represent the smallest median family size with 2.25 persons per family.
| Family Type | # Families | Family Size |
| Married-Couple | 11,439 (77.5%) | 2.77 |
| Single Male/Father | 1,285 (8.7%) | 2.25 |
| Single Female/Mother | 2,030 (13.8%) | 2.58 |
| Total Families | 14,754 (100.0%) | 2.70 |
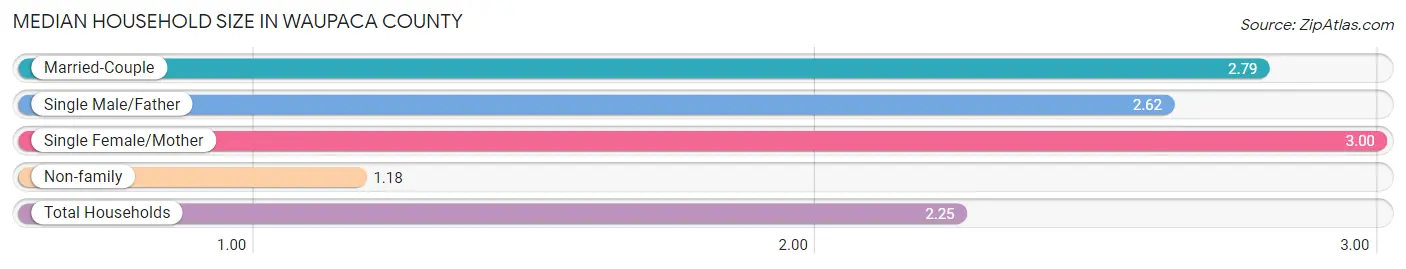
Median Household Size in Waupaca County
The median household size in Waupaca County is 2.25 persons per household, with single female/mother households (2,030 | 9.1%) accounting for the largest median household size of 3 persons per household. non-family households (7,601 | 34.0%) represent the smallest median household size with 1.18 persons per household.
| Household Type | # Households | Household Size |
| Married-Couple | 11,439 (51.2%) | 2.79 |
| Single Male/Father | 1,285 (5.8%) | 2.62 |
| Single Female/Mother | 2,030 (9.1%) | 3.00 |
| Non-family | 7,601 (34.0%) | 1.18 |
| Total Households | 22,355 (100.0%) | 2.25 |
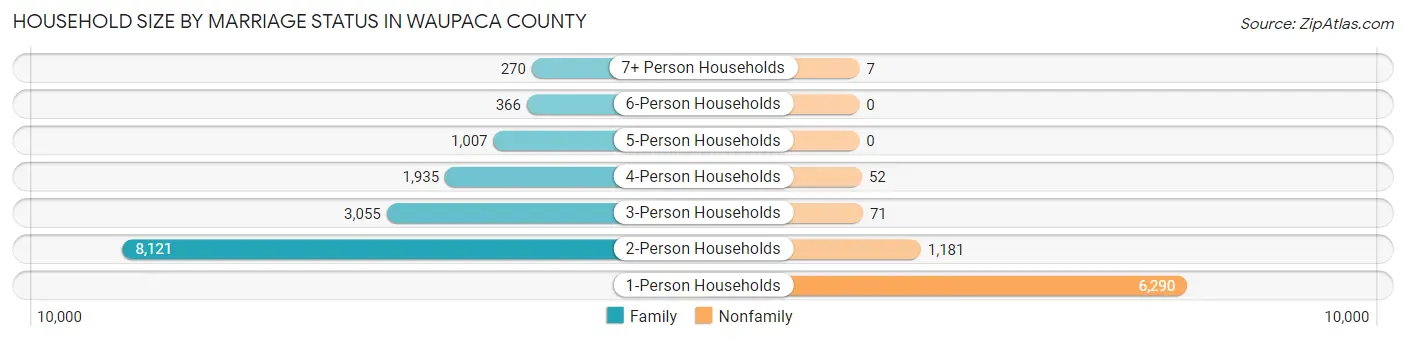
Household Size by Marriage Status in Waupaca County
Out of a total of 22,355 households in Waupaca County, 14,754 (66.0%) are family households, while 7,601 (34.0%) are nonfamily households. The most numerous type of family households are 2-person households, comprising 8,121, and the most common type of nonfamily households are 1-person households, comprising 6,290.
| Household Size | Family Households | Nonfamily Households |
| 1-Person Households | - | 6,290 (28.1%) |
| 2-Person Households | 8,121 (36.3%) | 1,181 (5.3%) |
| 3-Person Households | 3,055 (13.7%) | 71 (0.3%) |
| 4-Person Households | 1,935 (8.7%) | 52 (0.2%) |
| 5-Person Households | 1,007 (4.5%) | 0 (0.0%) |
| 6-Person Households | 366 (1.6%) | 0 (0.0%) |
| 7+ Person Households | 270 (1.2%) | 7 (0.0%) |
| Total | 14,754 (66.0%) | 7,601 (34.0%) |
Female Fertility in Waupaca County
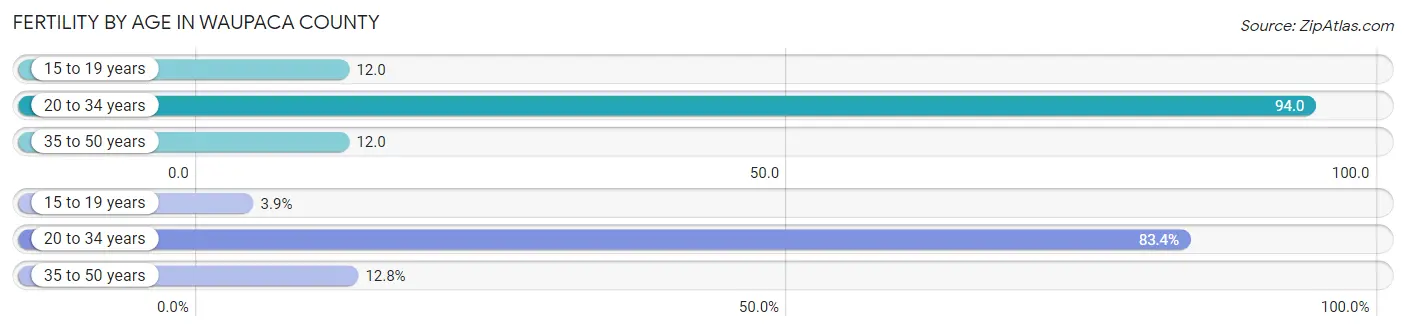
Fertility by Age in Waupaca County
Average fertility rate in Waupaca County is 43.0 births per 1,000 women. Women in the age bracket of 20 to 34 years have the highest fertility rate with 94.0 births per 1,000 women. Women in the age bracket of 20 to 34 years acount for 83.4% of all women with births.
| Age Bracket | Women with Births | Births / 1,000 Women |
| 15 to 19 years | 17 (3.9%) | 12.0 |
| 20 to 34 years | 366 (83.4%) | 94.0 |
| 35 to 50 years | 56 (12.8%) | 12.0 |
| Total | 439 (100.0%) | 43.0 |
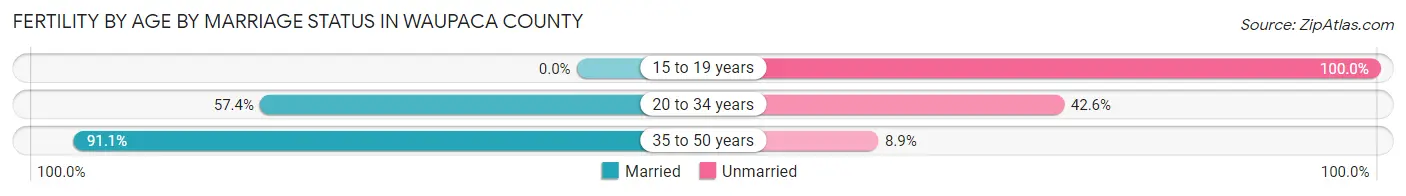
Fertility by Age by Marriage Status in Waupaca County
59.5% of women with births (439) in Waupaca County are married. The highest percentage of unmarried women with births falls into 15 to 19 years age bracket with 100.0% of them unmarried at the time of birth, while the lowest percentage of unmarried women with births belong to 35 to 50 years age bracket with 8.9% of them unmarried.
| Age Bracket | Married | Unmarried |
| 15 to 19 years | 0 (0.0%) | 17 (100.0%) |
| 20 to 34 years | 210 (57.4%) | 156 (42.6%) |
| 35 to 50 years | 51 (91.1%) | 5 (8.9%) |
| Total | 261 (59.5%) | 178 (40.6%) |
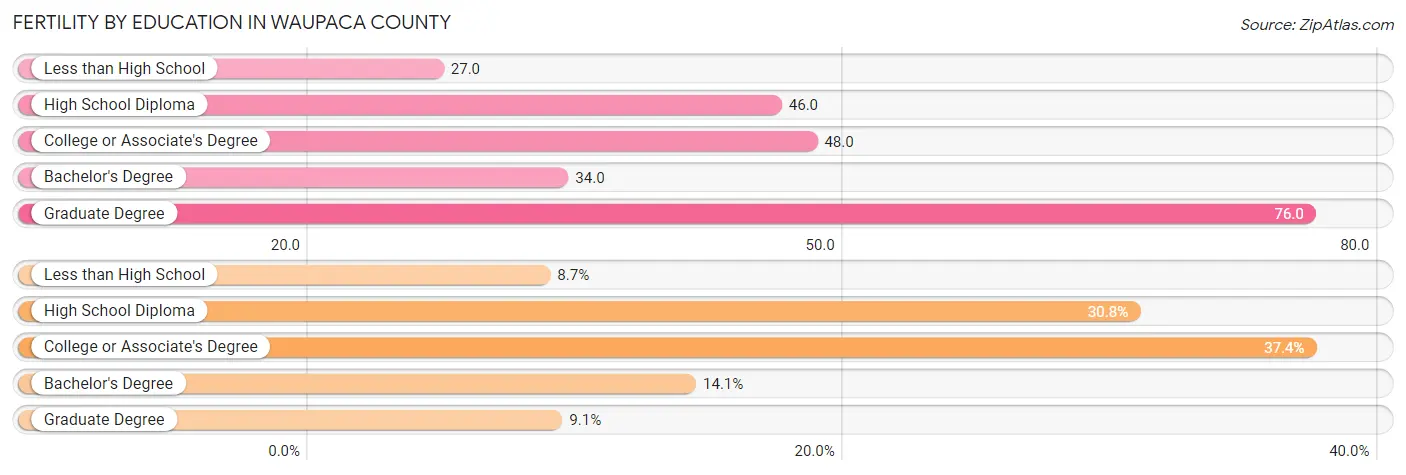
Fertility by Education in Waupaca County
Average fertility rate in Waupaca County is 43.0 births per 1,000 women. Women with the education attainment of graduate degree have the highest fertility rate of 76.0 births per 1,000 women, while women with the education attainment of less than high school have the lowest fertility at 27.0 births per 1,000 women. Women with the education attainment of college or associate's degree represent 37.4% of all women with births.
| Educational Attainment | Women with Births | Births / 1,000 Women |
| Less than High School | 38 (8.7%) | 27.0 |
| High School Diploma | 135 (30.7%) | 46.0 |
| College or Associate's Degree | 164 (37.4%) | 48.0 |
| Bachelor's Degree | 62 (14.1%) | 34.0 |
| Graduate Degree | 40 (9.1%) | 76.0 |
| Total | 439 (100.0%) | 43.0 |
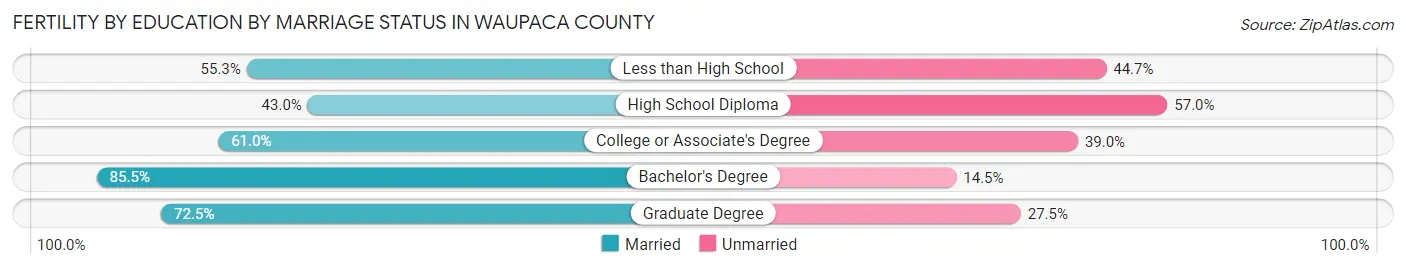
Fertility by Education by Marriage Status in Waupaca County
40.6% of women with births in Waupaca County are unmarried. Women with the educational attainment of bachelor's degree are most likely to be married with 85.5% of them married at childbirth, while women with the educational attainment of high school diploma are least likely to be married with 57.0% of them unmarried at childbirth.
| Educational Attainment | Married | Unmarried |
| Less than High School | 21 (55.3%) | 17 (44.7%) |
| High School Diploma | 58 (43.0%) | 77 (57.0%) |
| College or Associate's Degree | 100 (61.0%) | 64 (39.0%) |
| Bachelor's Degree | 53 (85.5%) | 9 (14.5%) |
| Graduate Degree | 29 (72.5%) | 11 (27.5%) |
| Total | 261 (59.5%) | 178 (40.6%) |
Income in Waupaca County
Income Overview in Waupaca County
Per Capita Income in Waupaca County is $39,147, while median incomes of families and households are $84,282 and $69,198 respectively.
| Characteristic | Number | Measure |
| Per Capita Income | 51,822 | $39,147 |
| Median Family Income | 14,754 | $84,282 |
| Mean Family Income | 14,754 | $105,255 |
| Median Household Income | 22,355 | $69,198 |
| Mean Household Income | 22,355 | $89,128 |
| Income Deficit | 14,754 | $10,275 |
| Wage / Income Gap (%) | 51,822 | 34.74% |
| Wage / Income Gap ($) | 51,822 | 65.26¢ per $1 |
| Gini / Inequality Index | 51,822 | 0.44 |
Earnings by Sex in Waupaca County
Average Earnings in Waupaca County are $42,630, $51,859 for men and $33,843 for women, a difference of 34.7%.
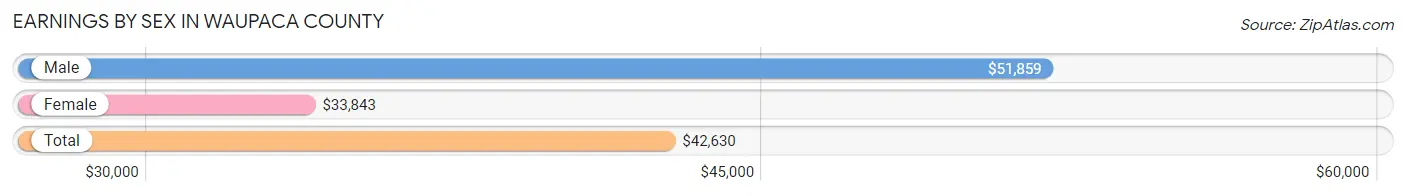
| Sex | Number | Average Earnings |
| Male | 15,317 (53.4%) | $51,859 |
| Female | 13,367 (46.6%) | $33,843 |
| Total | 28,684 (100.0%) | $42,630 |
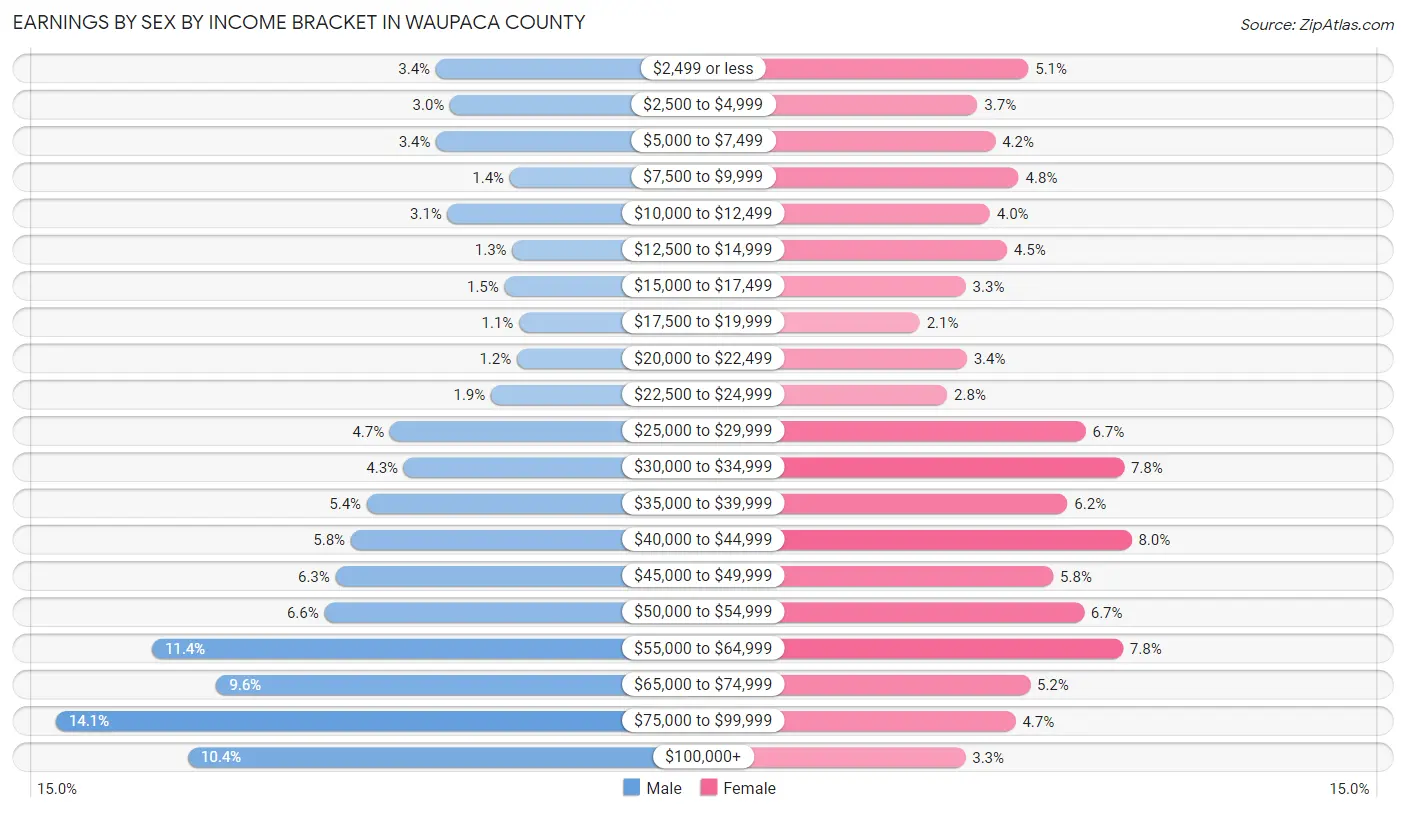
Earnings by Sex by Income Bracket in Waupaca County
The most common earnings brackets in Waupaca County are $75,000 to $99,999 for men (2,163 | 14.1%) and $40,000 to $44,999 for women (1,069 | 8.0%).
| Income | Male | Female |
| $2,499 or less | 527 (3.4%) | 682 (5.1%) |
| $2,500 to $4,999 | 465 (3.0%) | 491 (3.7%) |
| $5,000 to $7,499 | 526 (3.4%) | 557 (4.2%) |
| $7,500 to $9,999 | 209 (1.4%) | 646 (4.8%) |
| $10,000 to $12,499 | 477 (3.1%) | 537 (4.0%) |
| $12,500 to $14,999 | 198 (1.3%) | 601 (4.5%) |
| $15,000 to $17,499 | 231 (1.5%) | 447 (3.3%) |
| $17,500 to $19,999 | 169 (1.1%) | 274 (2.1%) |
| $20,000 to $22,499 | 177 (1.2%) | 450 (3.4%) |
| $22,500 to $24,999 | 289 (1.9%) | 377 (2.8%) |
| $25,000 to $29,999 | 724 (4.7%) | 897 (6.7%) |
| $30,000 to $34,999 | 664 (4.3%) | 1,041 (7.8%) |
| $35,000 to $39,999 | 824 (5.4%) | 829 (6.2%) |
| $40,000 to $44,999 | 893 (5.8%) | 1,069 (8.0%) |
| $45,000 to $49,999 | 959 (6.3%) | 775 (5.8%) |
| $50,000 to $54,999 | 1,006 (6.6%) | 890 (6.7%) |
| $55,000 to $64,999 | 1,749 (11.4%) | 1,037 (7.8%) |
| $65,000 to $74,999 | 1,472 (9.6%) | 689 (5.1%) |
| $75,000 to $99,999 | 2,163 (14.1%) | 633 (4.7%) |
| $100,000+ | 1,595 (10.4%) | 445 (3.3%) |
| Total | 15,317 (100.0%) | 13,367 (100.0%) |
Earnings by Sex by Educational Attainment in Waupaca County
Average earnings in Waupaca County are $56,481 for men and $37,454 for women, a difference of 33.7%. Men with an educational attainment of graduate degree enjoy the highest average annual earnings of $72,766, while those with less than high school education earn the least with $35,069. Women with an educational attainment of graduate degree earn the most with the average annual earnings of $61,250, while those with less than high school education have the smallest earnings of $16,250.
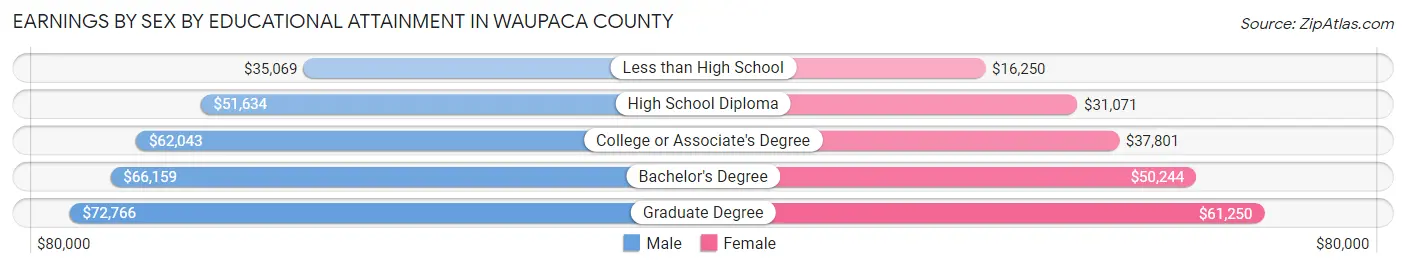
| Educational Attainment | Male Income | Female Income |
| Less than High School | $35,069 | $16,250 |
| High School Diploma | $51,634 | $31,071 |
| College or Associate's Degree | $62,043 | $37,801 |
| Bachelor's Degree | $66,159 | $50,244 |
| Graduate Degree | $72,766 | $61,250 |
| Total | $56,481 | $37,454 |
Family Income in Waupaca County
Family Income Brackets in Waupaca County
According to the Waupaca County family income data, there are 3,334 families falling into the $100,000 to $149,999 income range, which is the most common income bracket and makes up 22.6% of all families. Conversely, the $10,000 to $14,999 income bracket is the least frequent group with only 148 families (1.0%) belonging to this category.
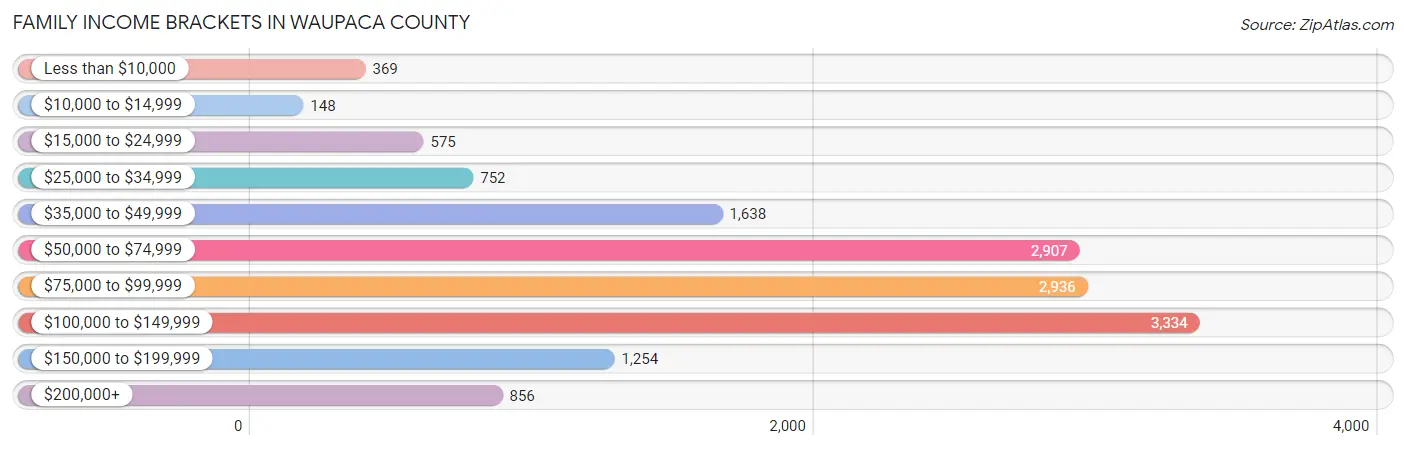
| Income Bracket | # Families | % Families |
| Less than $10,000 | 369 | 2.5% |
| $10,000 to $14,999 | 148 | 1.0% |
| $15,000 to $24,999 | 575 | 3.9% |
| $25,000 to $34,999 | 752 | 5.1% |
| $35,000 to $49,999 | 1,638 | 11.1% |
| $50,000 to $74,999 | 2,907 | 19.7% |
| $75,000 to $99,999 | 2,936 | 19.9% |
| $100,000 to $149,999 | 3,334 | 22.6% |
| $150,000 to $199,999 | 1,254 | 8.5% |
| $200,000+ | 856 | 5.8% |
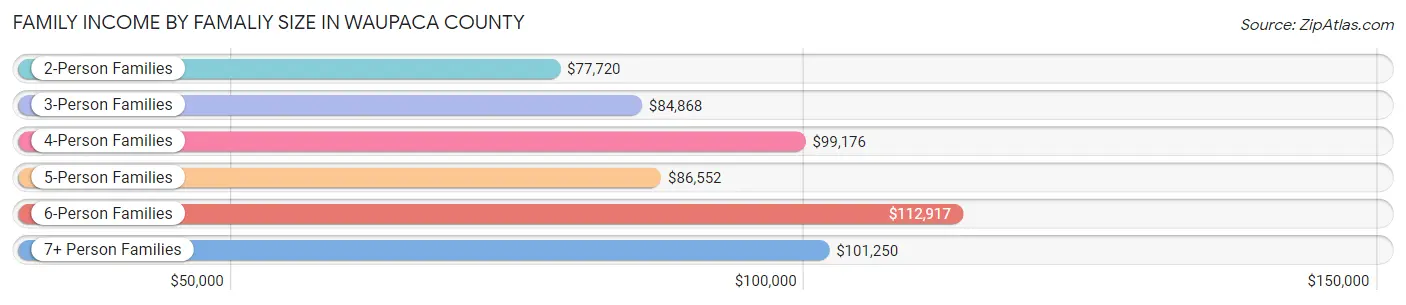
Family Income by Famaliy Size in Waupaca County
6-person families (242 | 1.6%) account for the highest median family income in Waupaca County with $112,917 per family, while 2-person families (8,637 | 58.5%) have the highest median income of $38,860 per family member.
| Income Bracket | # Families | Median Income |
| 2-Person Families | 8,637 (58.5%) | $77,720 |
| 3-Person Families | 2,932 (19.9%) | $84,868 |
| 4-Person Families | 1,860 (12.6%) | $99,176 |
| 5-Person Families | 878 (5.9%) | $86,552 |
| 6-Person Families | 242 (1.6%) | $112,917 |
| 7+ Person Families | 205 (1.4%) | $101,250 |
| Total | 14,754 (100.0%) | $84,282 |
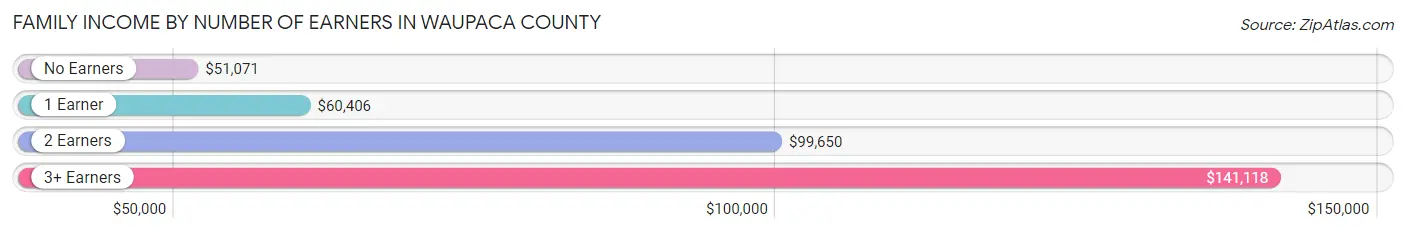
Family Income by Number of Earners in Waupaca County
The median family income in Waupaca County is $84,282, with families comprising 3+ earners (1,636) having the highest median family income of $141,118, while families with no earners (2,444) have the lowest median family income of $51,071, accounting for 11.1% and 16.6% of families, respectively.
| Number of Earners | # Families | Median Income |
| No Earners | 2,444 (16.6%) | $51,071 |
| 1 Earner | 4,603 (31.2%) | $60,406 |
| 2 Earners | 6,071 (41.1%) | $99,650 |
| 3+ Earners | 1,636 (11.1%) | $141,118 |
| Total | 14,754 (100.0%) | $84,282 |
Household Income in Waupaca County
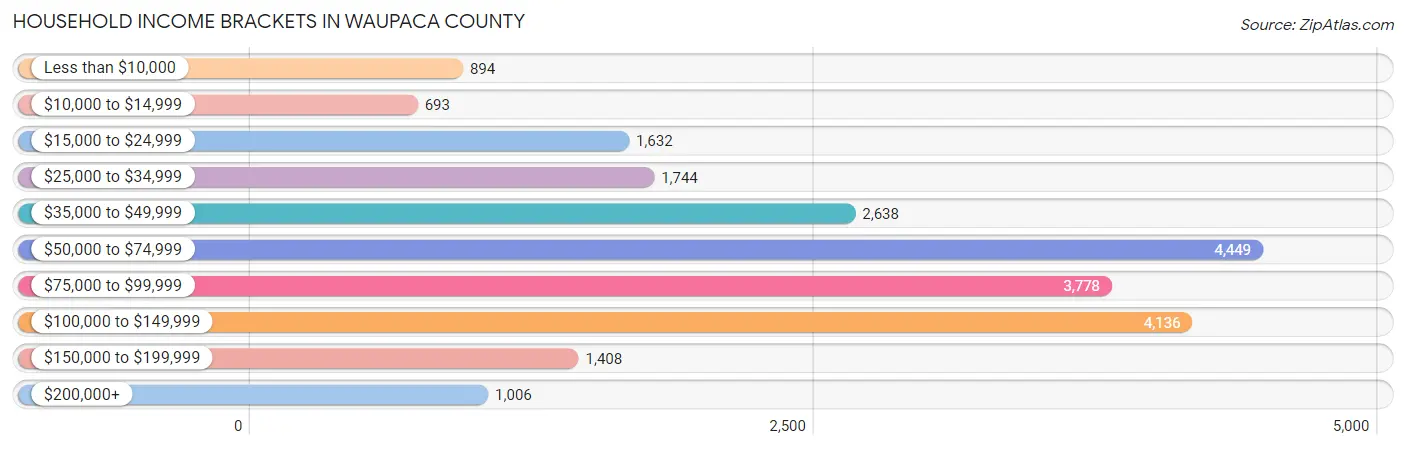
Household Income Brackets in Waupaca County
With 4,449 households falling in the category, the $50,000 to $74,999 income range is the most frequent in Waupaca County, accounting for 19.9% of all households. In contrast, only 693 households (3.1%) fall into the $10,000 to $14,999 income bracket, making it the least populous group.
| Income Bracket | # Households | % Households |
| Less than $10,000 | 894 | 4.0% |
| $10,000 to $14,999 | 693 | 3.1% |
| $15,000 to $24,999 | 1,632 | 7.3% |
| $25,000 to $34,999 | 1,744 | 7.8% |
| $35,000 to $49,999 | 2,638 | 11.8% |
| $50,000 to $74,999 | 4,449 | 19.9% |
| $75,000 to $99,999 | 3,778 | 16.9% |
| $100,000 to $149,999 | 4,136 | 18.5% |
| $150,000 to $199,999 | 1,408 | 6.3% |
| $200,000+ | 1,006 | 4.5% |
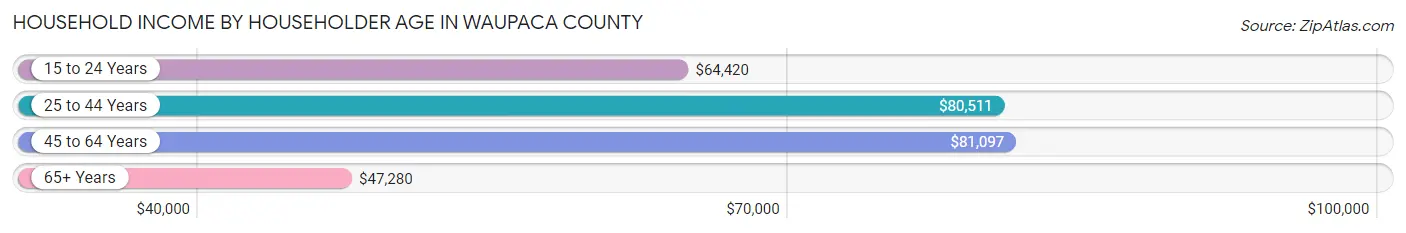
Household Income by Householder Age in Waupaca County
The median household income in Waupaca County is $69,198, with the highest median household income of $81,097 found in the 45 to 64 years age bracket for the primary householder. A total of 8,603 households (38.5%) fall into this category. Meanwhile, the 65+ years age bracket for the primary householder has the lowest median household income of $47,280, with 6,630 households (29.7%) in this group.
| Income Bracket | # Households | Median Income |
| 15 to 24 Years | 929 (4.2%) | $64,420 |
| 25 to 44 Years | 6,193 (27.7%) | $80,511 |
| 45 to 64 Years | 8,603 (38.5%) | $81,097 |
| 65+ Years | 6,630 (29.7%) | $47,280 |
| Total | 22,355 (100.0%) | $69,198 |
Poverty in Waupaca County
Income Below Poverty by Sex and Age in Waupaca County
With 7.8% poverty level for males and 9.9% for females among the residents of Waupaca County, under 5 year old males and 16 and 17 year old females are the most vulnerable to poverty, with 170 males (12.6%) and 89 females (14.8%) in their respective age groups living below the poverty level.
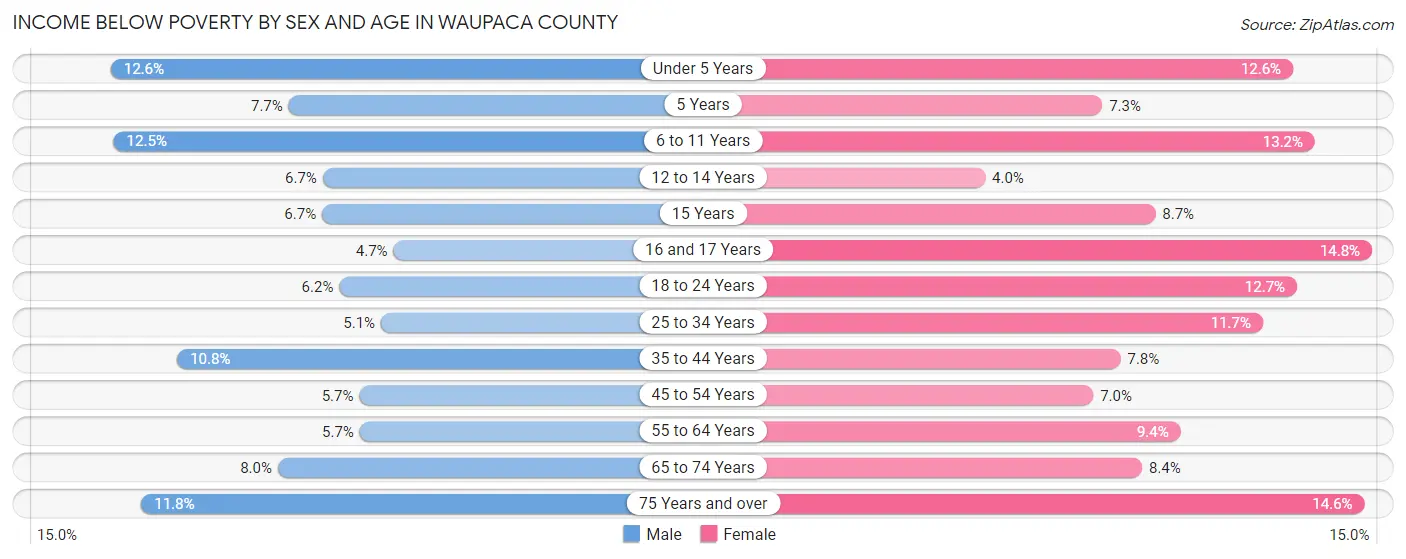
| Age Bracket | Male | Female |
| Under 5 Years | 170 (12.6%) | 149 (12.6%) |
| 5 Years | 13 (7.6%) | 14 (7.2%) |
| 6 to 11 Years | 216 (12.5%) | 182 (13.2%) |
| 12 to 14 Years | 70 (6.7%) | 43 (4.0%) |
| 15 Years | 18 (6.7%) | 31 (8.7%) |
| 16 and 17 Years | 34 (4.7%) | 89 (14.8%) |
| 18 to 24 Years | 119 (6.2%) | 214 (12.7%) |
| 25 to 34 Years | 147 (5.1%) | 312 (11.7%) |
| 35 to 44 Years | 325 (10.7%) | 229 (7.8%) |
| 45 to 54 Years | 191 (5.7%) | 232 (7.0%) |
| 55 to 64 Years | 251 (5.7%) | 390 (9.4%) |
| 65 to 74 Years | 235 (8.0%) | 252 (8.4%) |
| 75 Years and over | 179 (11.7%) | 334 (14.5%) |
| Total | 1,968 (7.8%) | 2,471 (9.9%) |
Income Above Poverty by Sex and Age in Waupaca County
According to the poverty statistics in Waupaca County, males aged 16 and 17 years and females aged 12 to 14 years are the age groups that are most secure financially, with 95.3% of males and 96.0% of females in these age groups living above the poverty line.
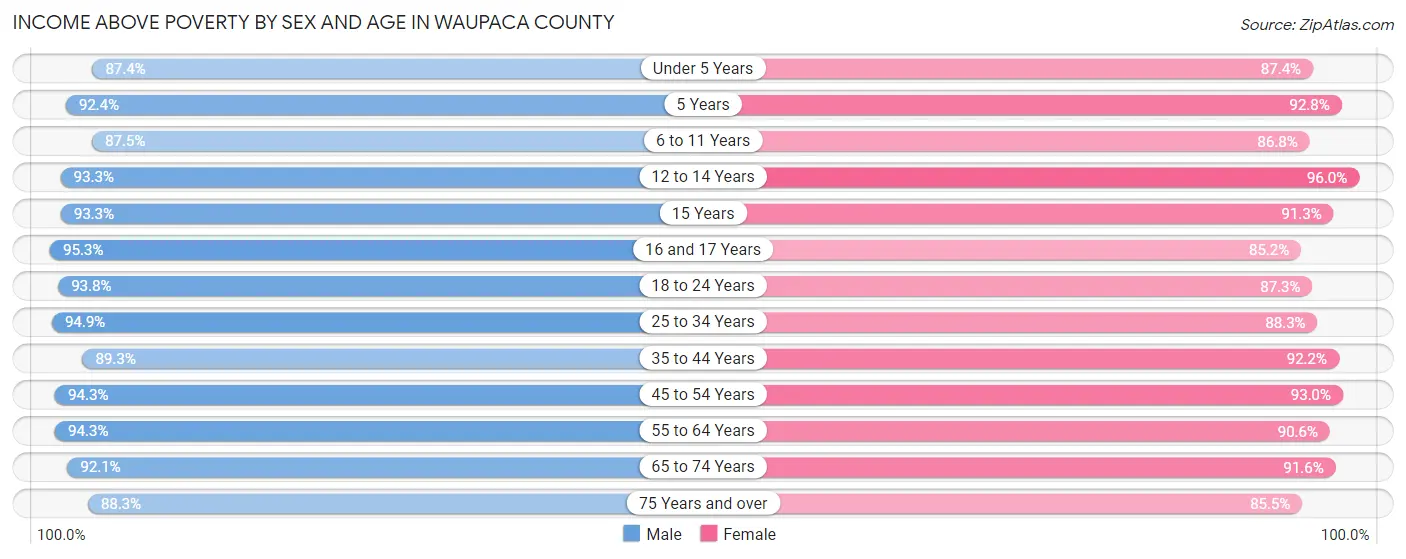
| Age Bracket | Male | Female |
| Under 5 Years | 1,179 (87.4%) | 1,037 (87.4%) |
| 5 Years | 157 (92.3%) | 179 (92.7%) |
| 6 to 11 Years | 1,509 (87.5%) | 1,200 (86.8%) |
| 12 to 14 Years | 975 (93.3%) | 1,035 (96.0%) |
| 15 Years | 250 (93.3%) | 324 (91.3%) |
| 16 and 17 Years | 685 (95.3%) | 514 (85.2%) |
| 18 to 24 Years | 1,788 (93.8%) | 1,475 (87.3%) |
| 25 to 34 Years | 2,745 (94.9%) | 2,350 (88.3%) |
| 35 to 44 Years | 2,699 (89.2%) | 2,721 (92.2%) |
| 45 to 54 Years | 3,170 (94.3%) | 3,082 (93.0%) |
| 55 to 64 Years | 4,173 (94.3%) | 3,745 (90.6%) |
| 65 to 74 Years | 2,722 (92.0%) | 2,764 (91.6%) |
| 75 Years and over | 1,344 (88.2%) | 1,961 (85.5%) |
| Total | 23,396 (92.2%) | 22,387 (90.1%) |
Income Below Poverty Among Married-Couple Families in Waupaca County
The poverty statistics for married-couple families in Waupaca County show that 3.6% or 413 of the total 11,439 families live below the poverty line. Families with 5 or more children have the highest poverty rate of 9.1%, comprising of 11 families. On the other hand, families with no children have the lowest poverty rate of 3.1%, which includes 252 families.
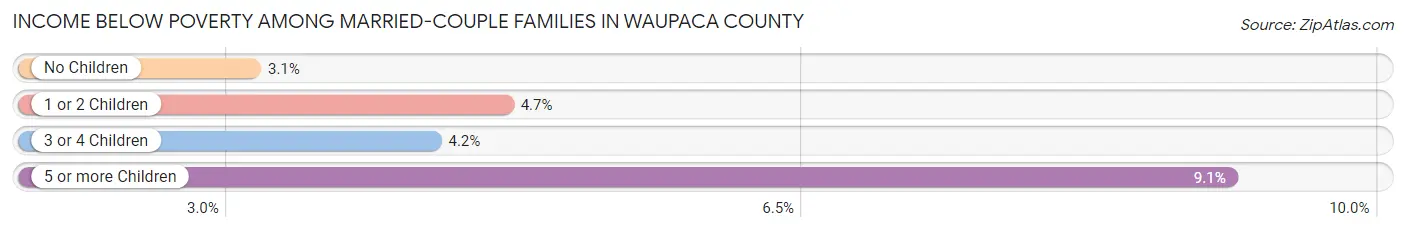
| Children | Above Poverty | Below Poverty |
| No Children | 7,786 (96.9%) | 252 (3.1%) |
| 1 or 2 Children | 2,385 (95.3%) | 117 (4.7%) |
| 3 or 4 Children | 745 (95.8%) | 33 (4.2%) |
| 5 or more Children | 110 (90.9%) | 11 (9.1%) |
| Total | 11,026 (96.4%) | 413 (3.6%) |
Income Below Poverty Among Single-Parent Households in Waupaca County
According to the poverty data in Waupaca County, 12.1% or 156 single-father households and 16.6% or 337 single-mother households are living below the poverty line. Among single-father households, those with 1 or 2 children have the highest poverty rate, with 95 households (15.6%) experiencing poverty. Likewise, among single-mother households, those with 3 or 4 children have the highest poverty rate, with 55 households (25.0%) falling below the poverty line.
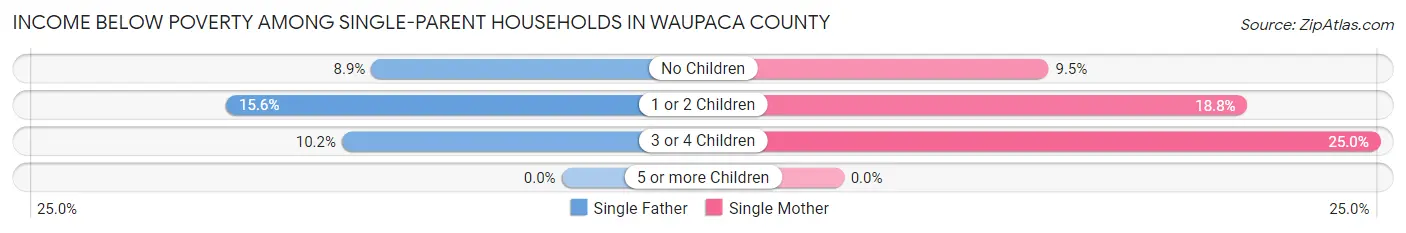
| Children | Single Father | Single Mother |
| No Children | 52 (8.9%) | 60 (9.5%) |
| 1 or 2 Children | 95 (15.6%) | 222 (18.8%) |
| 3 or 4 Children | 9 (10.2%) | 55 (25.0%) |
| 5 or more Children | 0 (0.0%) | 0 (0.0%) |
| Total | 156 (12.1%) | 337 (16.6%) |
Income Below Poverty Among Married-Couple vs Single-Parent Households in Waupaca County
The poverty data for Waupaca County shows that 413 of the married-couple family households (3.6%) and 493 of the single-parent households (14.9%) are living below the poverty level. Within the married-couple family households, those with 5 or more children have the highest poverty rate, with 11 households (9.1%) falling below the poverty line. Among the single-parent households, those with 3 or 4 children have the highest poverty rate, with 64 household (20.8%) living below poverty.
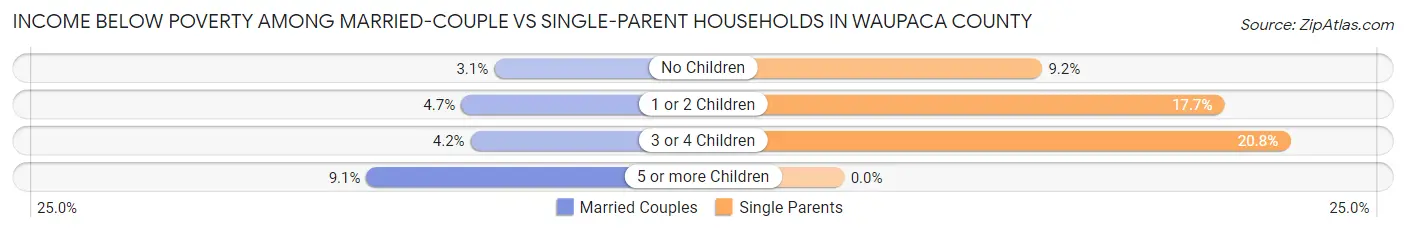
| Children | Married-Couple Families | Single-Parent Households |
| No Children | 252 (3.1%) | 112 (9.2%) |
| 1 or 2 Children | 117 (4.7%) | 317 (17.7%) |
| 3 or 4 Children | 33 (4.2%) | 64 (20.8%) |
| 5 or more Children | 11 (9.1%) | 0 (0.0%) |
| Total | 413 (3.6%) | 493 (14.9%) |
Employment Characteristics in Waupaca County
Employment by Class of Employer in Waupaca County
Among the 25,573 employed individuals in Waupaca County, private company employees (18,366 | 71.8%), local government employees (1,860 | 7.3%), and self-employed (not incorporated) (1,670 | 6.5%) make up the most common classes of employment.
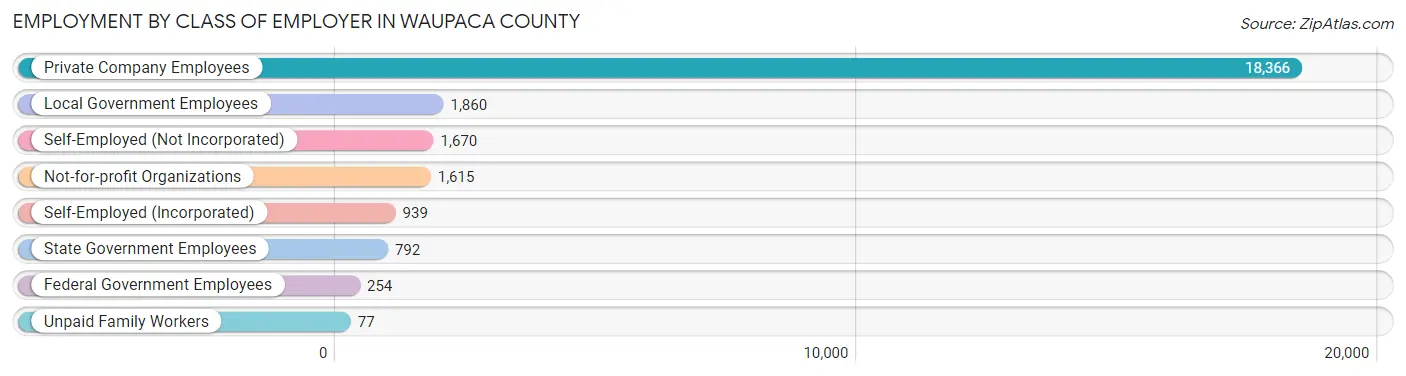
| Employer Class | # Employees | % Employees |
| Private Company Employees | 18,366 | 71.8% |
| Self-Employed (Incorporated) | 939 | 3.7% |
| Self-Employed (Not Incorporated) | 1,670 | 6.5% |
| Not-for-profit Organizations | 1,615 | 6.3% |
| Local Government Employees | 1,860 | 7.3% |
| State Government Employees | 792 | 3.1% |
| Federal Government Employees | 254 | 1.0% |
| Unpaid Family Workers | 77 | 0.3% |
| Total | 25,573 | 100.0% |
Employment Status by Age in Waupaca County
According to the labor force statistics for Waupaca County, out of the total population over 16 years of age (42,687), 63.0% or 26,893 individuals are in the labor force, with 2.7% or 726 of them unemployed. The age group with the highest labor force participation rate is 25 to 29 years, with 91.0% or 2,536 individuals in the labor force. Within the labor force, the 16 to 19 years age range has the highest percentage of unemployed individuals, with 8.6% or 101 of them being unemployed.
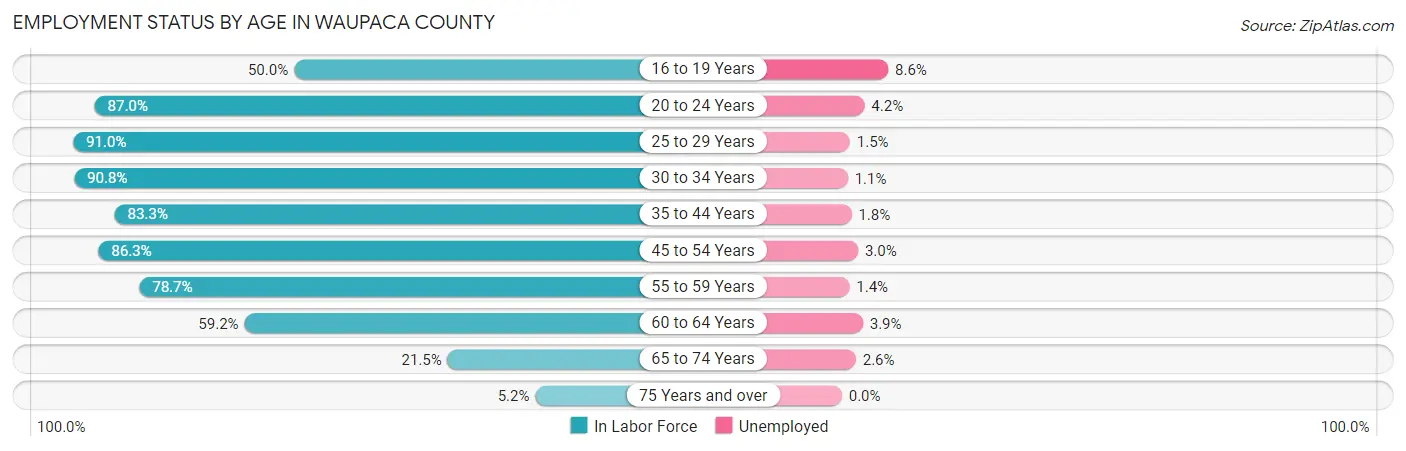
| Age Bracket | In Labor Force | Unemployed |
| 16 to 19 Years | 1,174 (50.0%) | 101 (8.6%) |
| 20 to 24 Years | 2,285 (87.0%) | 96 (4.2%) |
| 25 to 29 Years | 2,536 (91.0%) | 38 (1.5%) |
| 30 to 34 Years | 2,556 (90.8%) | 28 (1.1%) |
| 35 to 44 Years | 5,040 (83.3%) | 91 (1.8%) |
| 45 to 54 Years | 5,807 (86.3%) | 174 (3.0%) |
| 55 to 59 Years | 3,335 (78.7%) | 47 (1.4%) |
| 60 to 64 Years | 2,588 (59.2%) | 101 (3.9%) |
| 65 to 74 Years | 1,322 (21.5%) | 34 (2.6%) |
| 75 Years and over | 238 (5.2%) | 0 (0.0%) |
| Total | 26,893 (63.0%) | 726 (2.7%) |
Employment Status by Educational Attainment in Waupaca County
According to labor force statistics for Waupaca County, 81.0% of individuals (21,862) out of the total population between 25 and 64 years of age (26,990) are in the labor force, with 2.2% or 481 of them being unemployed. The group with the highest labor force participation rate are those with the educational attainment of bachelor's degree or higher, with 90.4% or 5,051 individuals in the labor force. Within the labor force, individuals with less than high school education have the highest percentage of unemployment, with 5.2% or 59 of them being unemployed.
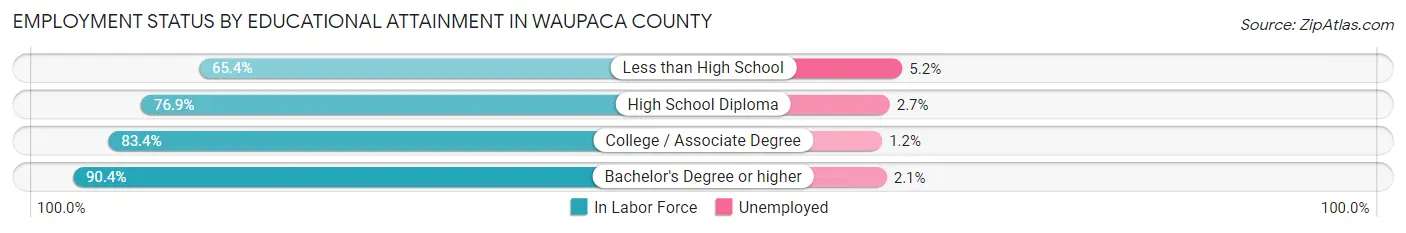
| Educational Attainment | In Labor Force | Unemployed |
| Less than High School | 1,143 (65.4%) | 91 (5.2%) |
| High School Diploma | 8,542 (76.9%) | 300 (2.7%) |
| College / Associate Degree | 7,129 (83.4%) | 103 (1.2%) |
| Bachelor's Degree or higher | 5,051 (90.4%) | 117 (2.1%) |
| Total | 21,862 (81.0%) | 594 (2.2%) |
Employment Occupations by Sex in Waupaca County
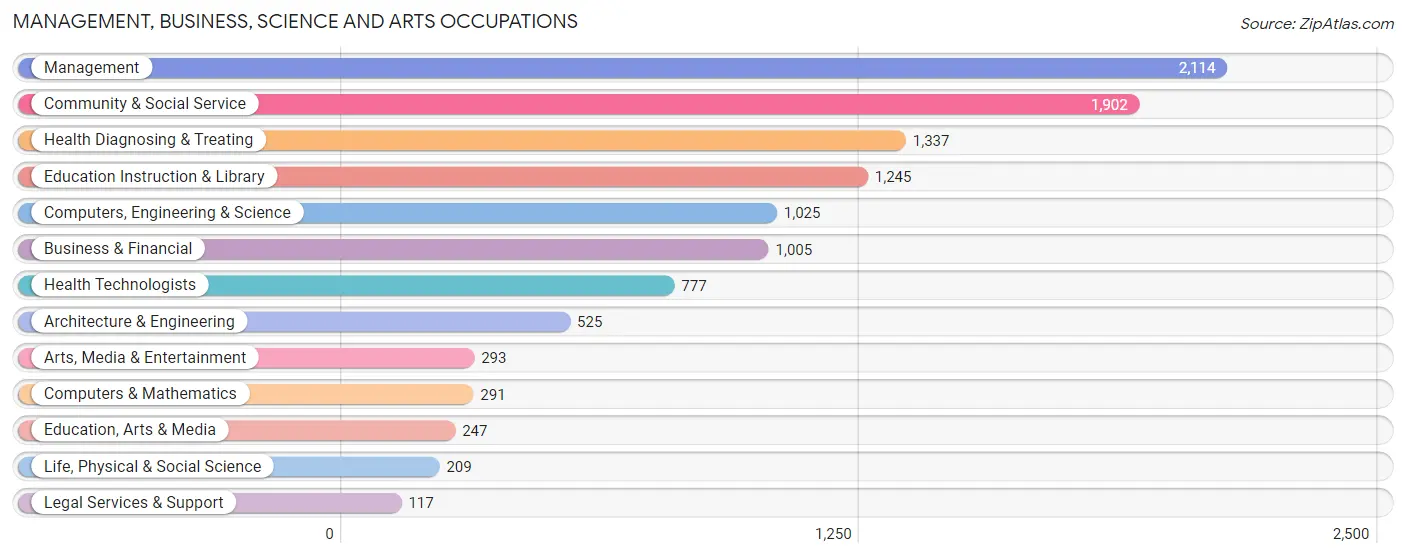
Management, Business, Science and Arts Occupations
The most common Management, Business, Science and Arts occupations in Waupaca County are Management (2,114 | 8.1%), Community & Social Service (1,902 | 7.3%), Health Diagnosing & Treating (1,337 | 5.1%), Education Instruction & Library (1,245 | 4.8%), and Computers, Engineering & Science (1,025 | 3.9%).
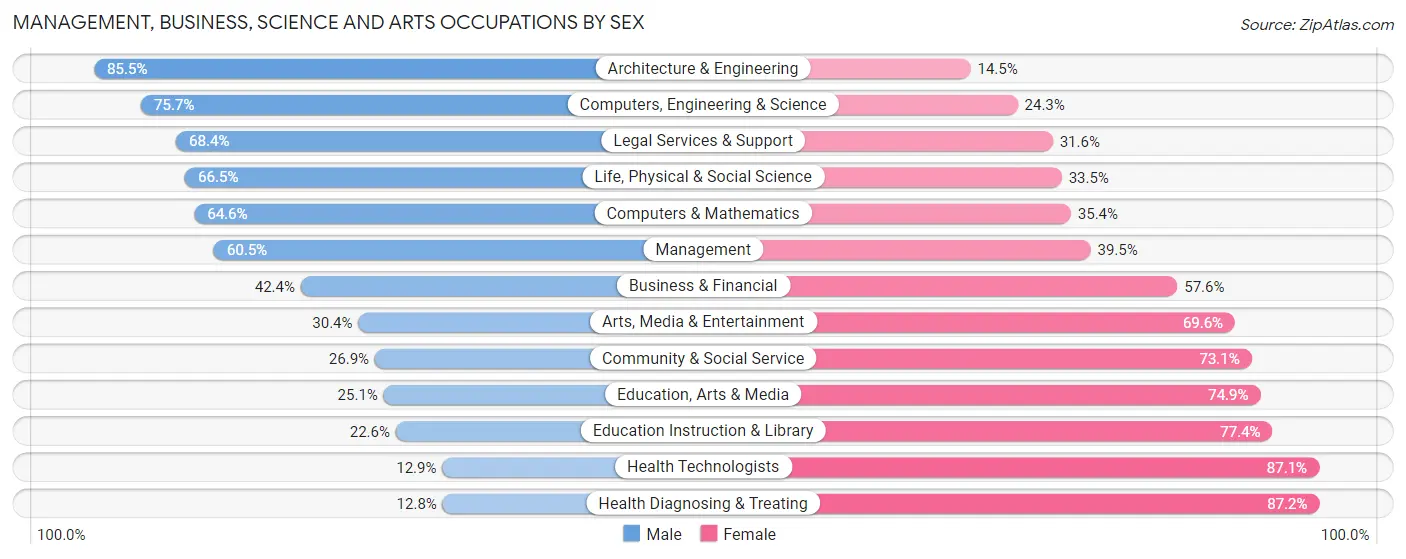
Management, Business, Science and Arts Occupations by Sex
Within the Management, Business, Science and Arts occupations in Waupaca County, the most male-oriented occupations are Architecture & Engineering (85.5%), Computers, Engineering & Science (75.7%), and Legal Services & Support (68.4%), while the most female-oriented occupations are Health Diagnosing & Treating (87.2%), Health Technologists (87.1%), and Education Instruction & Library (77.4%).
| Occupation | Male | Female |
| Management | 1,279 (60.5%) | 835 (39.5%) |
| Business & Financial | 426 (42.4%) | 579 (57.6%) |
| Computers, Engineering & Science | 776 (75.7%) | 249 (24.3%) |
| Computers & Mathematics | 188 (64.6%) | 103 (35.4%) |
| Architecture & Engineering | 449 (85.5%) | 76 (14.5%) |
| Life, Physical & Social Science | 139 (66.5%) | 70 (33.5%) |
| Community & Social Service | 512 (26.9%) | 1,390 (73.1%) |
| Education, Arts & Media | 62 (25.1%) | 185 (74.9%) |
| Legal Services & Support | 80 (68.4%) | 37 (31.6%) |
| Education Instruction & Library | 281 (22.6%) | 964 (77.4%) |
| Arts, Media & Entertainment | 89 (30.4%) | 204 (69.6%) |
| Health Diagnosing & Treating | 171 (12.8%) | 1,166 (87.2%) |
| Health Technologists | 100 (12.9%) | 677 (87.1%) |
| Total (Category) | 3,164 (42.9%) | 4,219 (57.1%) |
| Total (Overall) | 14,030 (53.6%) | 12,121 (46.4%) |
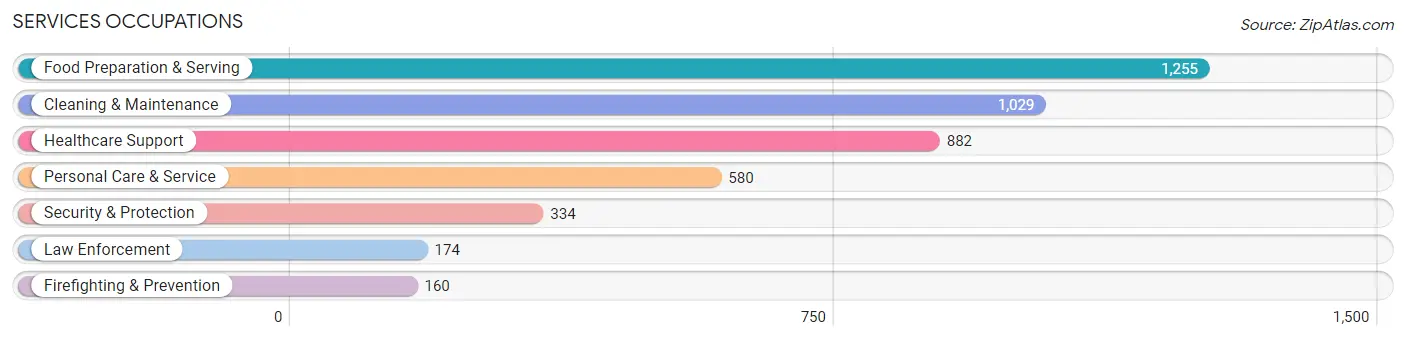
Services Occupations
The most common Services occupations in Waupaca County are Food Preparation & Serving (1,255 | 4.8%), Cleaning & Maintenance (1,029 | 3.9%), Healthcare Support (882 | 3.4%), Personal Care & Service (580 | 2.2%), and Security & Protection (334 | 1.3%).
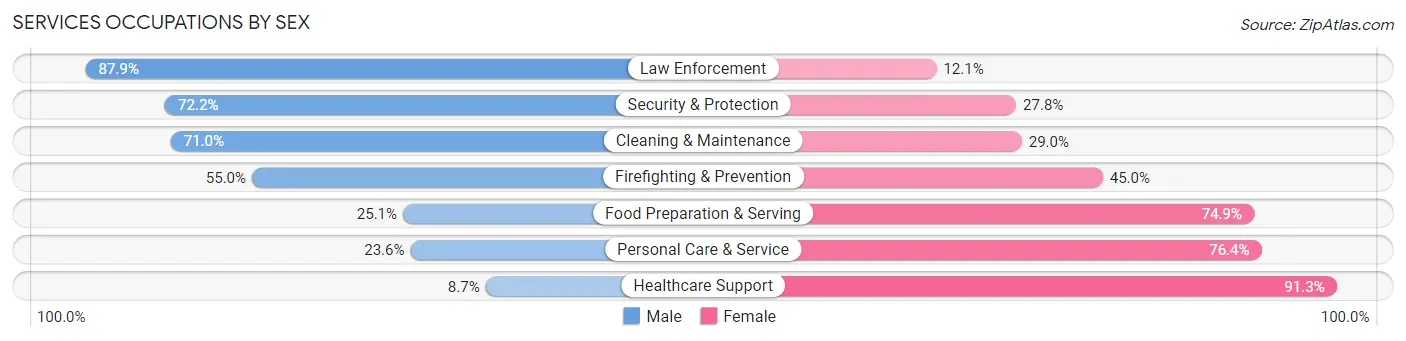
Services Occupations by Sex
Within the Services occupations in Waupaca County, the most male-oriented occupations are Law Enforcement (87.9%), Security & Protection (72.2%), and Cleaning & Maintenance (71.0%), while the most female-oriented occupations are Healthcare Support (91.3%), Personal Care & Service (76.4%), and Food Preparation & Serving (74.9%).
| Occupation | Male | Female |
| Healthcare Support | 77 (8.7%) | 805 (91.3%) |
| Security & Protection | 241 (72.2%) | 93 (27.8%) |
| Firefighting & Prevention | 88 (55.0%) | 72 (45.0%) |
| Law Enforcement | 153 (87.9%) | 21 (12.1%) |
| Food Preparation & Serving | 315 (25.1%) | 940 (74.9%) |
| Cleaning & Maintenance | 731 (71.0%) | 298 (29.0%) |
| Personal Care & Service | 137 (23.6%) | 443 (76.4%) |
| Total (Category) | 1,501 (36.8%) | 2,579 (63.2%) |
| Total (Overall) | 14,030 (53.6%) | 12,121 (46.4%) |
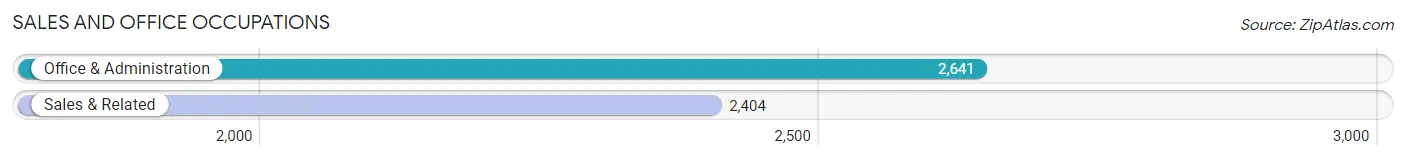
Sales and Office Occupations
The most common Sales and Office occupations in Waupaca County are Office & Administration (2,641 | 10.1%), and Sales & Related (2,404 | 9.2%).
Sales and Office Occupations by Sex
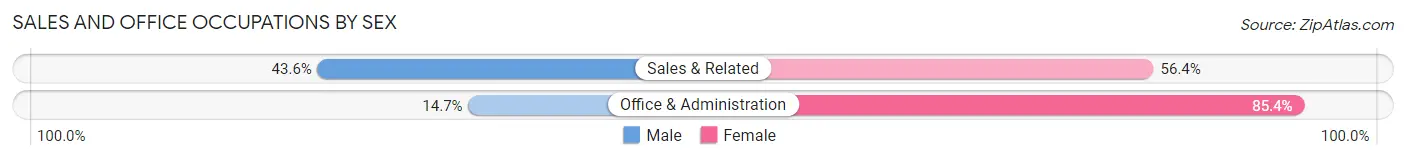
| Occupation | Male | Female |
| Sales & Related | 1,049 (43.6%) | 1,355 (56.4%) |
| Office & Administration | 387 (14.6%) | 2,254 (85.4%) |
| Total (Category) | 1,436 (28.5%) | 3,609 (71.5%) |
| Total (Overall) | 14,030 (53.6%) | 12,121 (46.4%) |
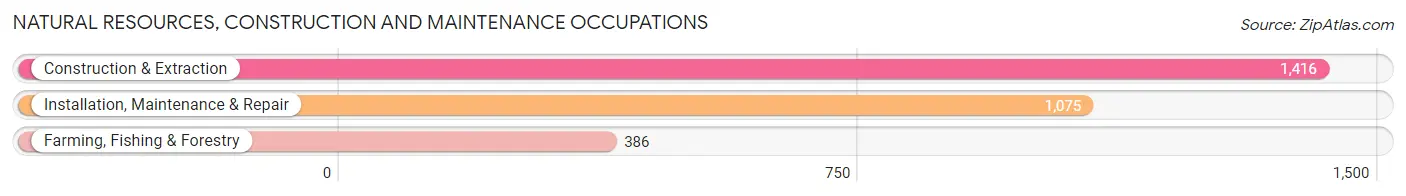
Natural Resources, Construction and Maintenance Occupations
The most common Natural Resources, Construction and Maintenance occupations in Waupaca County are Construction & Extraction (1,416 | 5.4%), Installation, Maintenance & Repair (1,075 | 4.1%), and Farming, Fishing & Forestry (386 | 1.5%).
Natural Resources, Construction and Maintenance Occupations by Sex
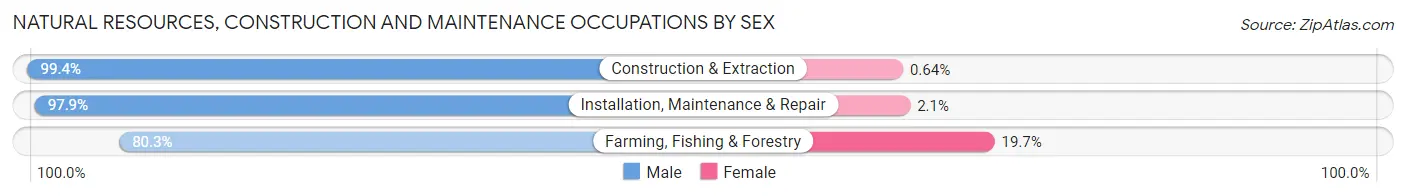
| Occupation | Male | Female |
| Farming, Fishing & Forestry | 310 (80.3%) | 76 (19.7%) |
| Construction & Extraction | 1,407 (99.4%) | 9 (0.6%) |
| Installation, Maintenance & Repair | 1,052 (97.9%) | 23 (2.1%) |
| Total (Category) | 2,769 (96.3%) | 108 (3.7%) |
| Total (Overall) | 14,030 (53.6%) | 12,121 (46.4%) |
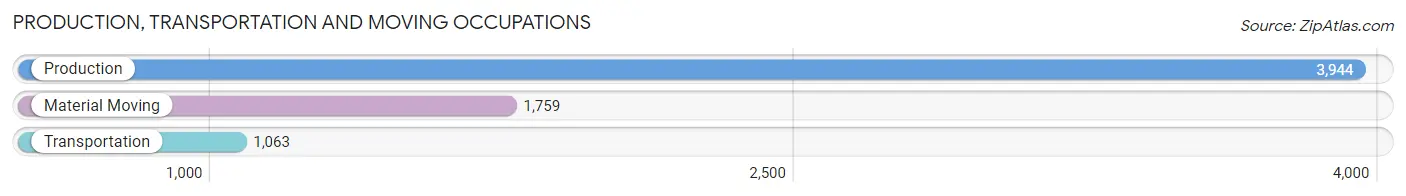
Production, Transportation and Moving Occupations
The most common Production, Transportation and Moving occupations in Waupaca County are Production (3,944 | 15.1%), Material Moving (1,759 | 6.7%), and Transportation (1,063 | 4.1%).
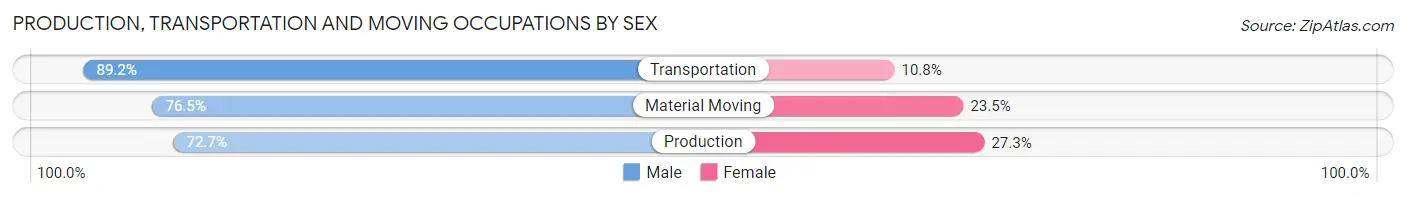
Production, Transportation and Moving Occupations by Sex
| Occupation | Male | Female |
| Production | 2,866 (72.7%) | 1,078 (27.3%) |
| Transportation | 948 (89.2%) | 115 (10.8%) |
| Material Moving | 1,346 (76.5%) | 413 (23.5%) |
| Total (Category) | 5,160 (76.3%) | 1,606 (23.7%) |
| Total (Overall) | 14,030 (53.6%) | 12,121 (46.4%) |
Employment Industries by Sex in Waupaca County
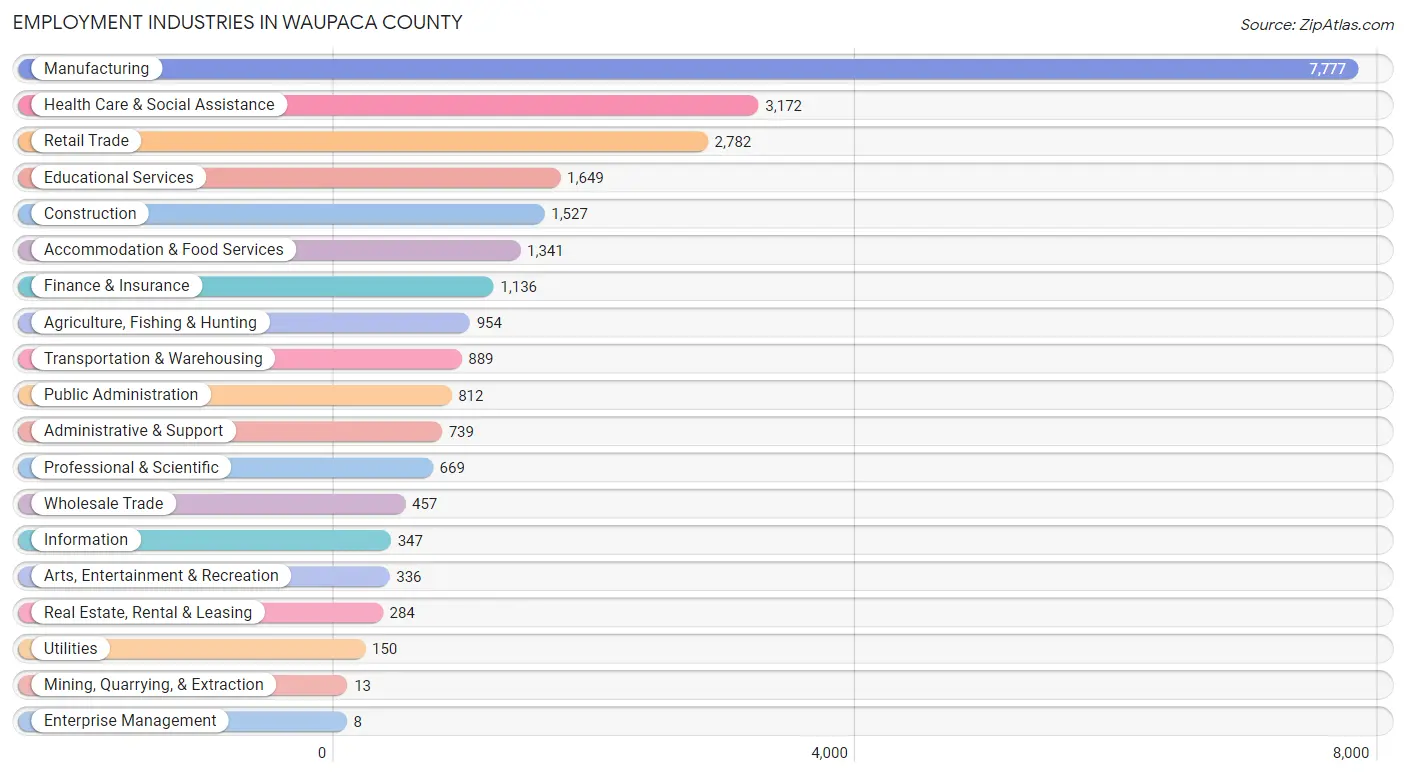
Employment Industries in Waupaca County
The major employment industries in Waupaca County include Manufacturing (7,777 | 29.7%), Health Care & Social Assistance (3,172 | 12.1%), Retail Trade (2,782 | 10.6%), Educational Services (1,649 | 6.3%), and Construction (1,527 | 5.8%).
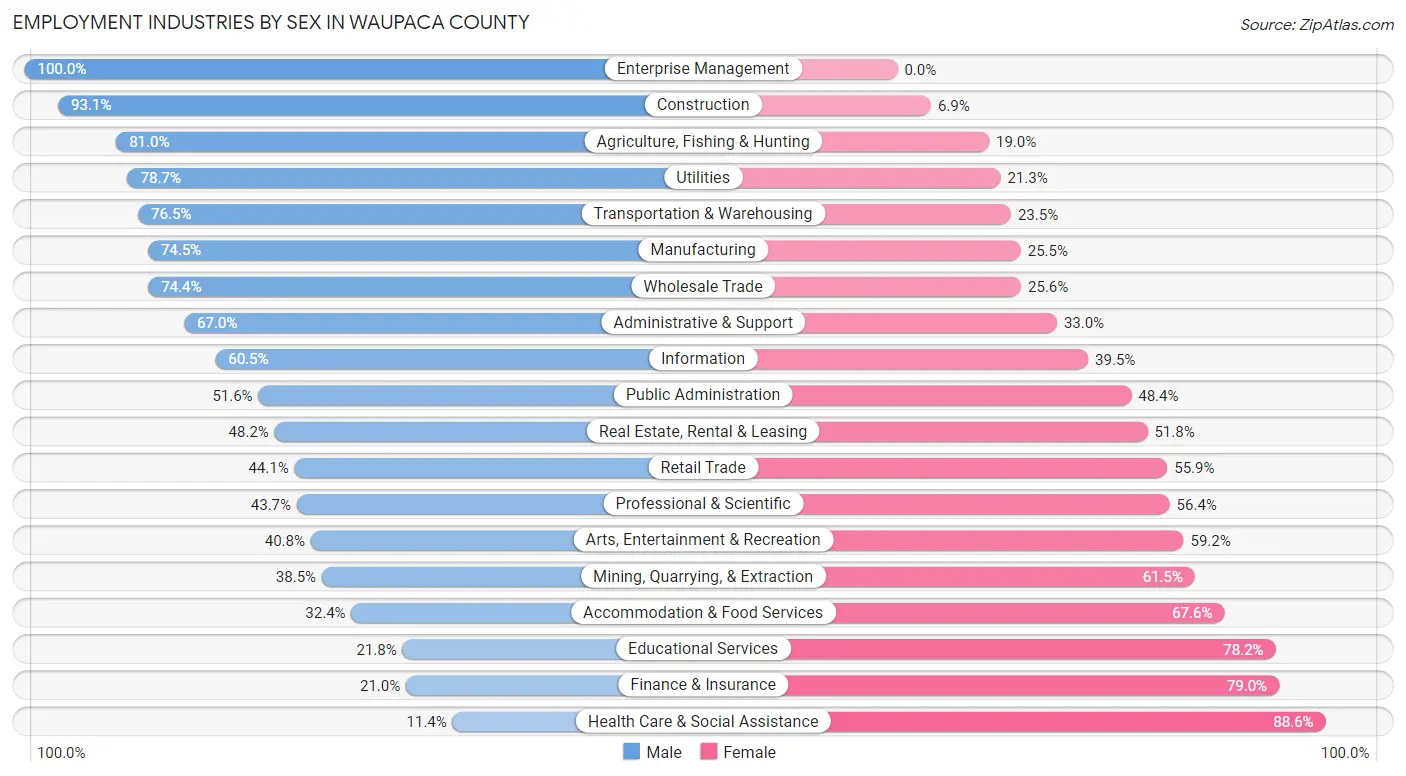
Employment Industries by Sex in Waupaca County
The Waupaca County industries that see more men than women are Enterprise Management (100.0%), Construction (93.1%), and Agriculture, Fishing & Hunting (81.0%), whereas the industries that tend to have a higher number of women are Health Care & Social Assistance (88.6%), Finance & Insurance (79.0%), and Educational Services (78.2%).
| Industry | Male | Female |
| Agriculture, Fishing & Hunting | 773 (81.0%) | 181 (19.0%) |
| Mining, Quarrying, & Extraction | 5 (38.5%) | 8 (61.5%) |
| Construction | 1,421 (93.1%) | 106 (6.9%) |
| Manufacturing | 5,791 (74.5%) | 1,986 (25.5%) |
| Wholesale Trade | 340 (74.4%) | 117 (25.6%) |
| Retail Trade | 1,228 (44.1%) | 1,554 (55.9%) |
| Transportation & Warehousing | 680 (76.5%) | 209 (23.5%) |
| Utilities | 118 (78.7%) | 32 (21.3%) |
| Information | 210 (60.5%) | 137 (39.5%) |
| Finance & Insurance | 239 (21.0%) | 897 (79.0%) |
| Real Estate, Rental & Leasing | 137 (48.2%) | 147 (51.8%) |
| Professional & Scientific | 292 (43.6%) | 377 (56.4%) |
| Enterprise Management | 8 (100.0%) | 0 (0.0%) |
| Administrative & Support | 495 (67.0%) | 244 (33.0%) |
| Educational Services | 359 (21.8%) | 1,290 (78.2%) |
| Health Care & Social Assistance | 362 (11.4%) | 2,810 (88.6%) |
| Arts, Entertainment & Recreation | 137 (40.8%) | 199 (59.2%) |
| Accommodation & Food Services | 434 (32.4%) | 907 (67.6%) |
| Public Administration | 419 (51.6%) | 393 (48.4%) |
| Total | 14,030 (53.6%) | 12,121 (46.4%) |
Education in Waupaca County
School Enrollment in Waupaca County
The most common levels of schooling among the 9,952 students in Waupaca County are high school (2,557 | 25.7%), middle school (2,473 | 24.8%), and elementary school (2,311 | 23.2%).
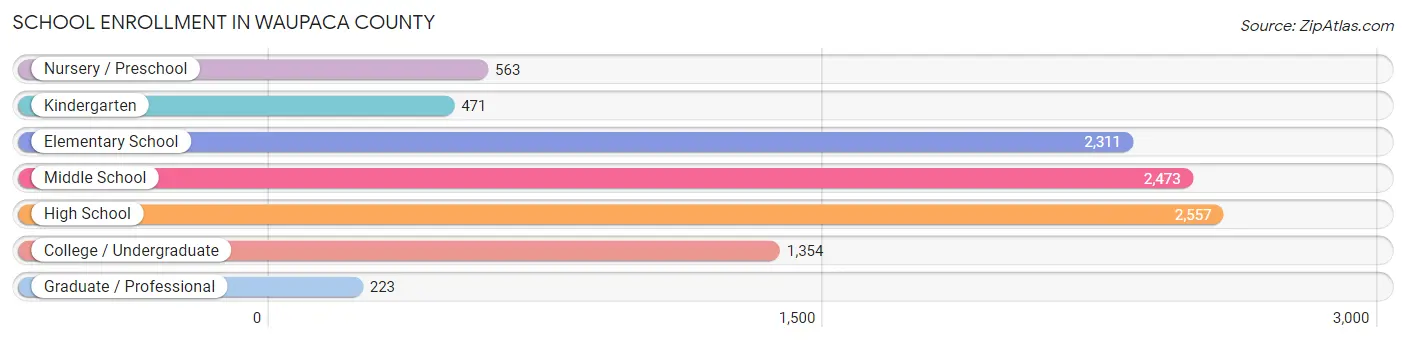
| School Level | # Students | % Students |
| Nursery / Preschool | 563 | 5.7% |
| Kindergarten | 471 | 4.7% |
| Elementary School | 2,311 | 23.2% |
| Middle School | 2,473 | 24.8% |
| High School | 2,557 | 25.7% |
| College / Undergraduate | 1,354 | 13.6% |
| Graduate / Professional | 223 | 2.2% |
| Total | 9,952 | 100.0% |
School Enrollment by Age by Funding Source in Waupaca County
Out of a total of 9,952 students who are enrolled in schools in Waupaca County, 1,383 (13.9%) attend a private institution, while the remaining 8,569 (86.1%) are enrolled in public schools. The age group of 3 to 4 year olds has the highest likelihood of being enrolled in private schools, with 81 (23.1% in the age bracket) enrolled. Conversely, the age group of 25 to 34 year olds has the lowest likelihood of being enrolled in a private school, with 371 (90.9% in the age bracket) attending a public institution.
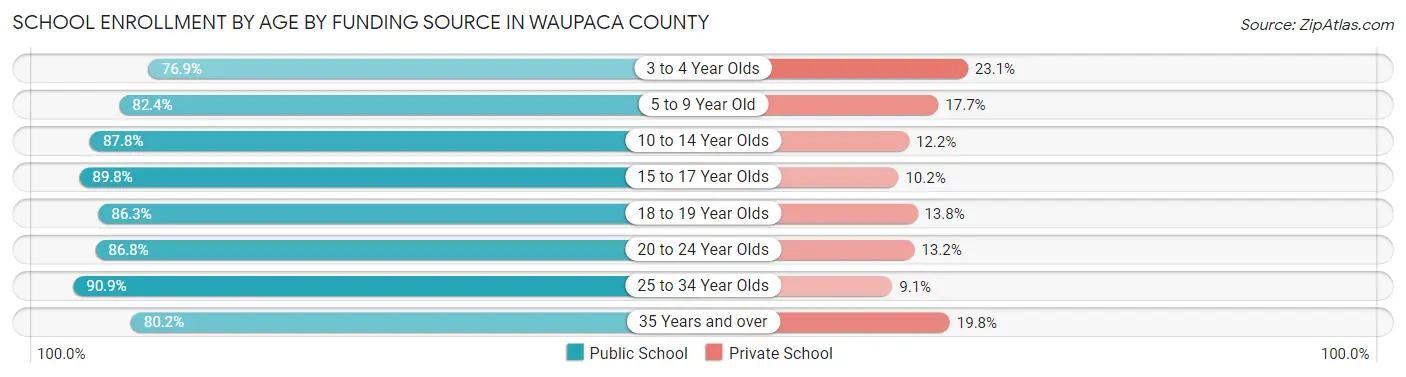
| Age Bracket | Public School | Private School |
| 3 to 4 Year Olds | 269 (76.9%) | 81 (23.1%) |
| 5 to 9 Year Old | 2,132 (82.4%) | 457 (17.6%) |
| 10 to 14 Year Olds | 2,762 (87.8%) | 383 (12.2%) |
| 15 to 17 Year Olds | 1,671 (89.8%) | 190 (10.2%) |
| 18 to 19 Year Olds | 577 (86.3%) | 92 (13.8%) |
| 20 to 24 Year Olds | 487 (86.8%) | 74 (13.2%) |
| 25 to 34 Year Olds | 371 (90.9%) | 37 (9.1%) |
| 35 Years and over | 296 (80.2%) | 73 (19.8%) |
| Total | 8,569 (86.1%) | 1,383 (13.9%) |
Educational Attainment by Field of Study in Waupaca County
Education (1,879 | 22.8%), business (1,231 | 15.0%), science & technology (1,069 | 13.0%), bio, nature & agricultural (755 | 9.2%), and arts & humanities (742 | 9.0%) are the most common fields of study among 8,231 individuals in Waupaca County who have obtained a bachelor's degree or higher.
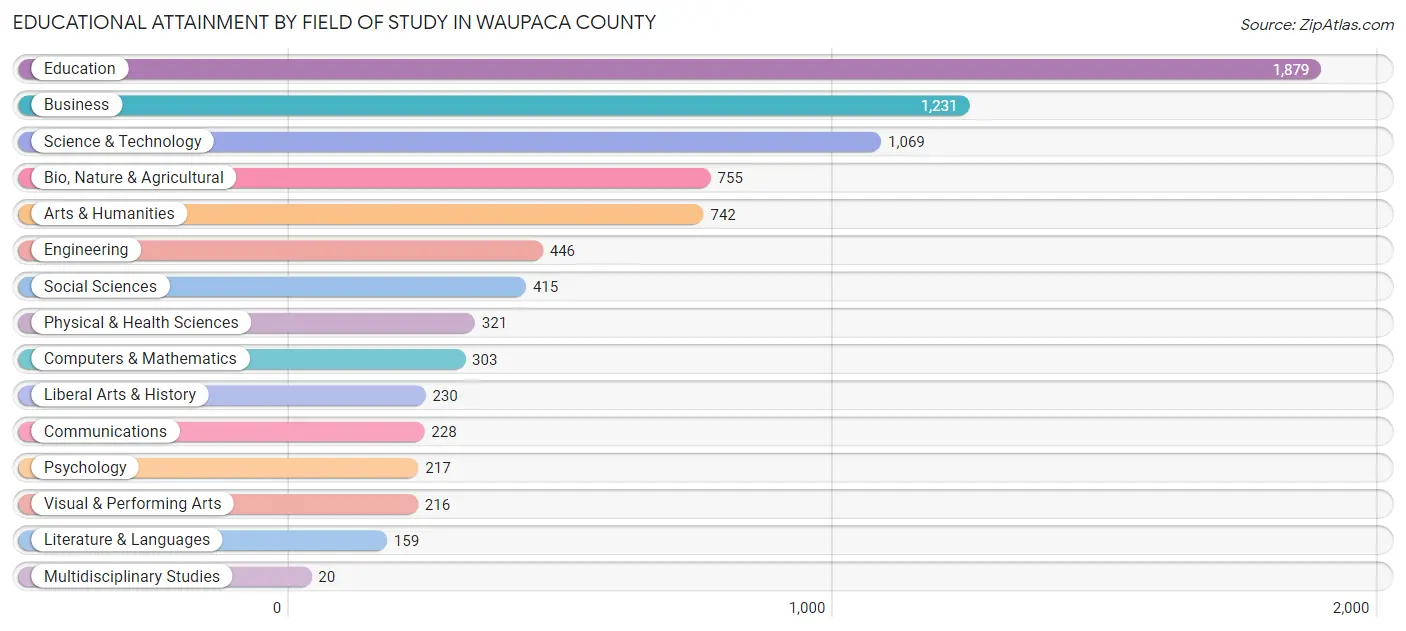
| Field of Study | # Graduates | % Graduates |
| Computers & Mathematics | 303 | 3.7% |
| Bio, Nature & Agricultural | 755 | 9.2% |
| Physical & Health Sciences | 321 | 3.9% |
| Psychology | 217 | 2.6% |
| Social Sciences | 415 | 5.0% |
| Engineering | 446 | 5.4% |
| Multidisciplinary Studies | 20 | 0.2% |
| Science & Technology | 1,069 | 13.0% |
| Business | 1,231 | 15.0% |
| Education | 1,879 | 22.8% |
| Literature & Languages | 159 | 1.9% |
| Liberal Arts & History | 230 | 2.8% |
| Visual & Performing Arts | 216 | 2.6% |
| Communications | 228 | 2.8% |
| Arts & Humanities | 742 | 9.0% |
| Total | 8,231 | 100.0% |
Transportation & Commute in Waupaca County
Vehicle Availability by Sex in Waupaca County
The most prevalent vehicle ownership categories in Waupaca County are males with 2 vehicles (5,346, accounting for 39.0%) and females with 2 vehicles (4,660, making up 45.2%).
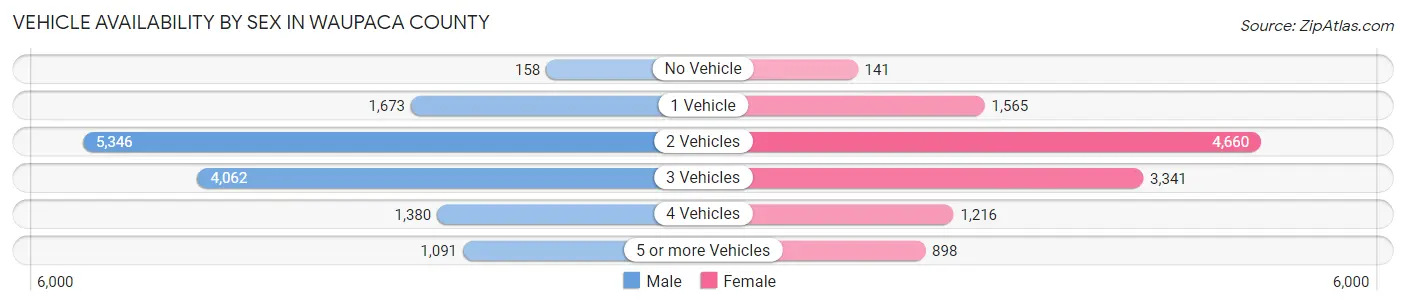
| Vehicles Available | Male | Female |
| No Vehicle | 158 (1.1%) | 141 (1.2%) |
| 1 Vehicle | 1,673 (12.2%) | 1,565 (13.2%) |
| 2 Vehicles | 5,346 (39.0%) | 4,660 (39.4%) |
| 3 Vehicles | 4,062 (29.6%) | 3,341 (28.3%) |
| 4 Vehicles | 1,380 (10.1%) | 1,216 (10.3%) |
| 5 or more Vehicles | 1,091 (8.0%) | 898 (7.6%) |
| Total | 13,710 (100.0%) | 11,821 (100.0%) |
Commute Time in Waupaca County
The most frequently occuring commute durations in Waupaca County are 5 to 9 minutes (3,984 commuters, 16.6%), 10 to 14 minutes (3,548 commuters, 14.8%), and 15 to 19 minutes (2,906 commuters, 12.1%).
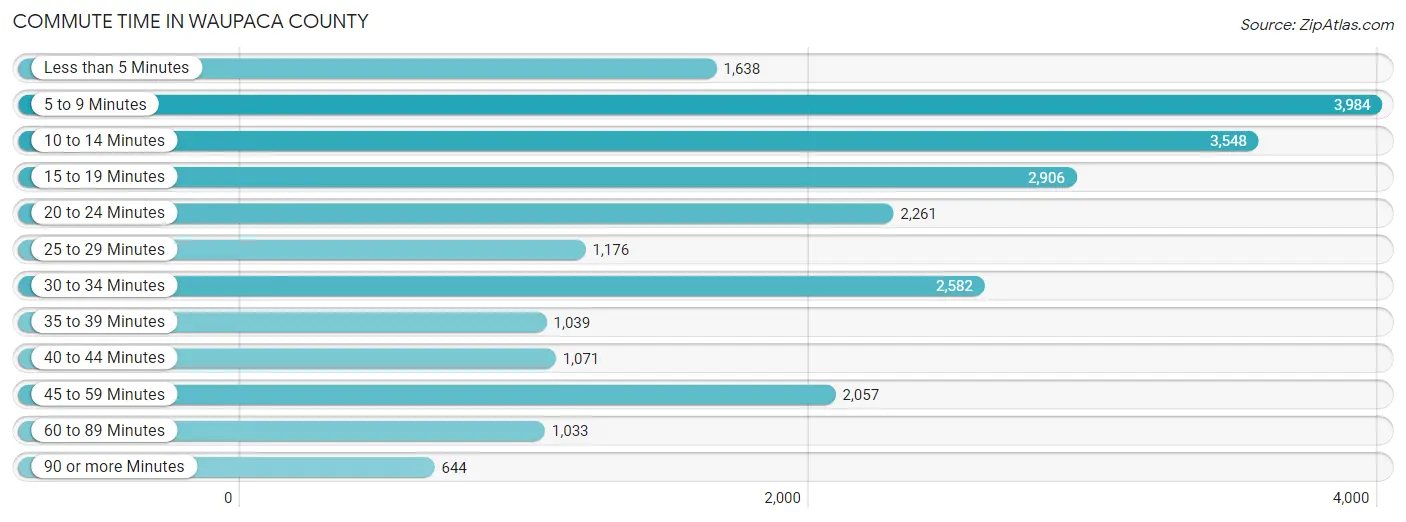
| Commute Time | # Commuters | % Commuters |
| Less than 5 Minutes | 1,638 | 6.8% |
| 5 to 9 Minutes | 3,984 | 16.6% |
| 10 to 14 Minutes | 3,548 | 14.8% |
| 15 to 19 Minutes | 2,906 | 12.1% |
| 20 to 24 Minutes | 2,261 | 9.4% |
| 25 to 29 Minutes | 1,176 | 4.9% |
| 30 to 34 Minutes | 2,582 | 10.8% |
| 35 to 39 Minutes | 1,039 | 4.3% |
| 40 to 44 Minutes | 1,071 | 4.5% |
| 45 to 59 Minutes | 2,057 | 8.6% |
| 60 to 89 Minutes | 1,033 | 4.3% |
| 90 or more Minutes | 644 | 2.7% |
Commute Time by Sex in Waupaca County
The most common commute times in Waupaca County are 5 to 9 minutes (1,856 commuters, 14.2%) for males and 5 to 9 minutes (2,128 commuters, 19.5%) for females.
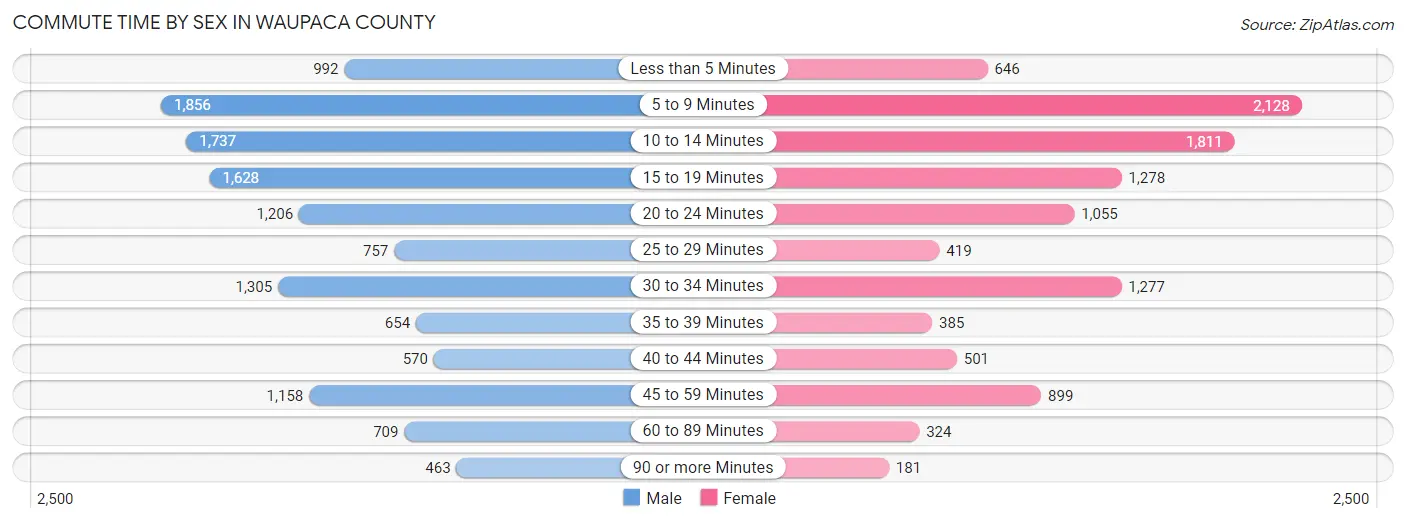
| Commute Time | Male | Female |
| Less than 5 Minutes | 992 (7.6%) | 646 (5.9%) |
| 5 to 9 Minutes | 1,856 (14.2%) | 2,128 (19.5%) |
| 10 to 14 Minutes | 1,737 (13.3%) | 1,811 (16.6%) |
| 15 to 19 Minutes | 1,628 (12.5%) | 1,278 (11.7%) |
| 20 to 24 Minutes | 1,206 (9.2%) | 1,055 (9.7%) |
| 25 to 29 Minutes | 757 (5.8%) | 419 (3.8%) |
| 30 to 34 Minutes | 1,305 (10.0%) | 1,277 (11.7%) |
| 35 to 39 Minutes | 654 (5.0%) | 385 (3.5%) |
| 40 to 44 Minutes | 570 (4.4%) | 501 (4.6%) |
| 45 to 59 Minutes | 1,158 (8.9%) | 899 (8.2%) |
| 60 to 89 Minutes | 709 (5.4%) | 324 (3.0%) |
| 90 or more Minutes | 463 (3.5%) | 181 (1.7%) |
Time of Departure to Work by Sex in Waupaca County
The most frequent times of departure to work in Waupaca County are 12:00 AM to 4:59 AM (2,181, 16.7%) for males and 7:00 AM to 7:29 AM (2,134, 19.6%) for females.
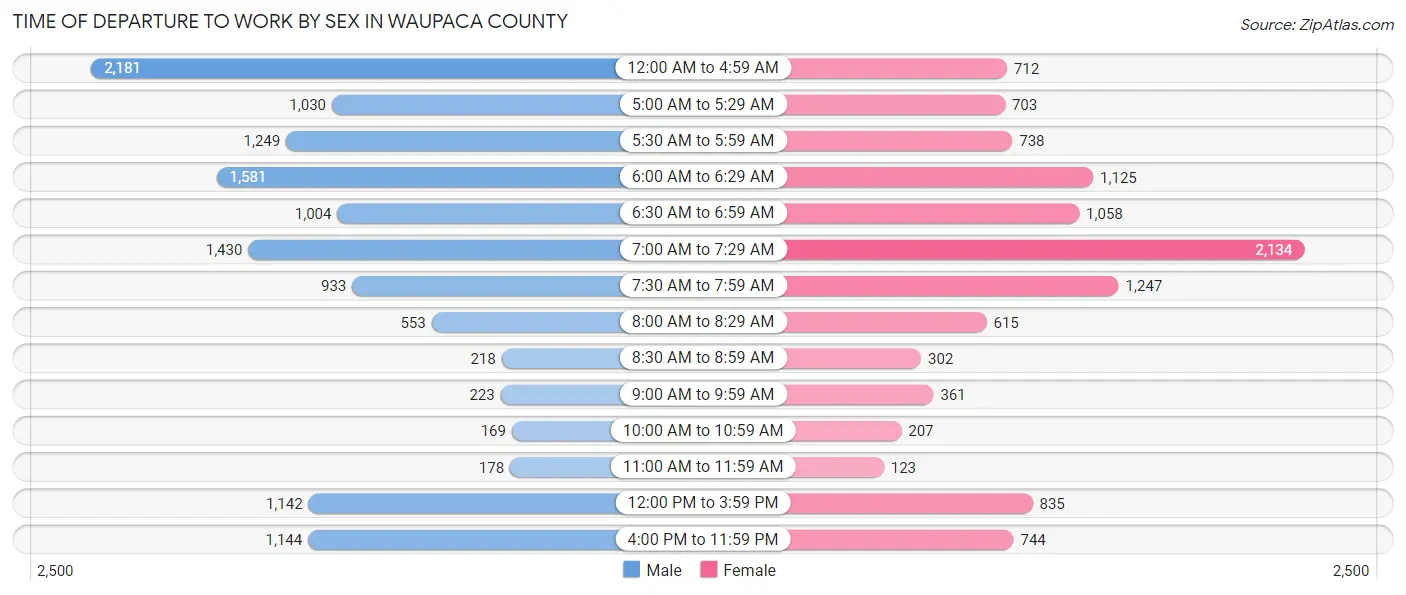
| Time of Departure | Male | Female |
| 12:00 AM to 4:59 AM | 2,181 (16.7%) | 712 (6.5%) |
| 5:00 AM to 5:29 AM | 1,030 (7.9%) | 703 (6.5%) |
| 5:30 AM to 5:59 AM | 1,249 (9.6%) | 738 (6.8%) |
| 6:00 AM to 6:29 AM | 1,581 (12.1%) | 1,125 (10.3%) |
| 6:30 AM to 6:59 AM | 1,004 (7.7%) | 1,058 (9.7%) |
| 7:00 AM to 7:29 AM | 1,430 (11.0%) | 2,134 (19.6%) |
| 7:30 AM to 7:59 AM | 933 (7.2%) | 1,247 (11.4%) |
| 8:00 AM to 8:29 AM | 553 (4.2%) | 615 (5.6%) |
| 8:30 AM to 8:59 AM | 218 (1.7%) | 302 (2.8%) |
| 9:00 AM to 9:59 AM | 223 (1.7%) | 361 (3.3%) |
| 10:00 AM to 10:59 AM | 169 (1.3%) | 207 (1.9%) |
| 11:00 AM to 11:59 AM | 178 (1.4%) | 123 (1.1%) |
| 12:00 PM to 3:59 PM | 1,142 (8.8%) | 835 (7.7%) |
| 4:00 PM to 11:59 PM | 1,144 (8.8%) | 744 (6.8%) |
| Total | 13,035 (100.0%) | 10,904 (100.0%) |
Housing Occupancy in Waupaca County
Occupancy by Ownership in Waupaca County
Of the total 22,355 dwellings in Waupaca County, owner-occupied units account for 17,026 (76.2%), while renter-occupied units make up 5,329 (23.8%).
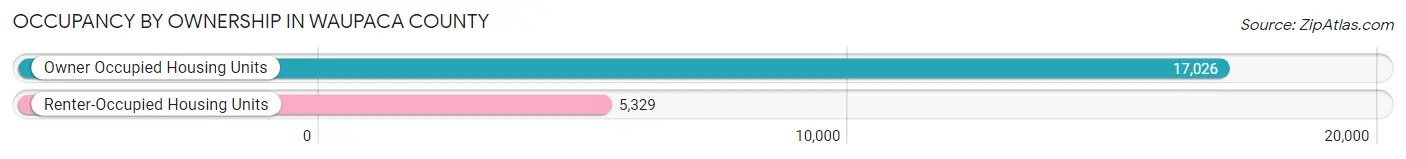
| Occupancy | # Housing Units | % Housing Units |
| Owner Occupied Housing Units | 17,026 | 76.2% |
| Renter-Occupied Housing Units | 5,329 | 23.8% |
| Total Occupied Housing Units | 22,355 | 100.0% |
Occupancy by Household Size in Waupaca County
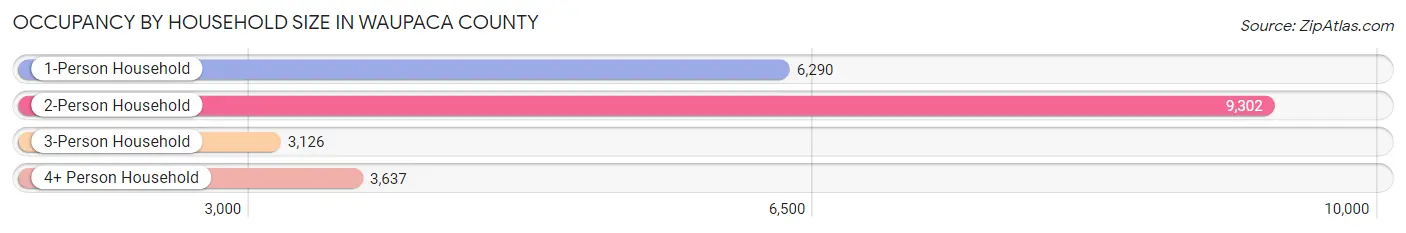
| Household Size | # Housing Units | % Housing Units |
| 1-Person Household | 6,290 | 28.1% |
| 2-Person Household | 9,302 | 41.6% |
| 3-Person Household | 3,126 | 14.0% |
| 4+ Person Household | 3,637 | 16.3% |
| Total Housing Units | 22,355 | 100.0% |
Occupancy by Ownership by Household Size in Waupaca County
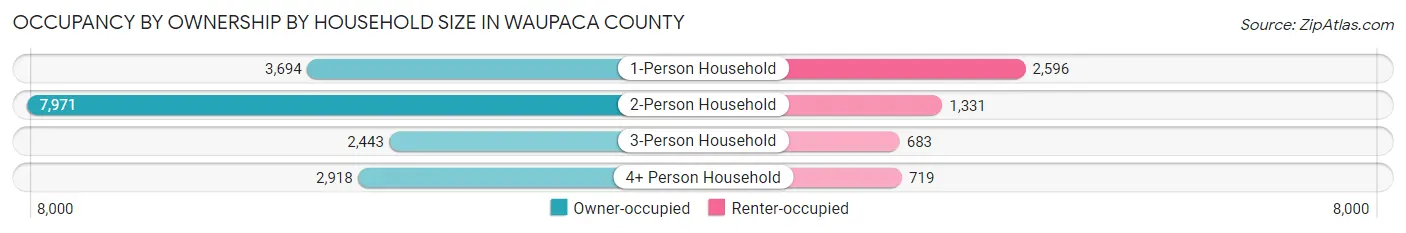
| Household Size | Owner-occupied | Renter-occupied |
| 1-Person Household | 3,694 (58.7%) | 2,596 (41.3%) |
| 2-Person Household | 7,971 (85.7%) | 1,331 (14.3%) |
| 3-Person Household | 2,443 (78.1%) | 683 (21.8%) |
| 4+ Person Household | 2,918 (80.2%) | 719 (19.8%) |
| Total Housing Units | 17,026 (76.2%) | 5,329 (23.8%) |
Occupancy by Educational Attainment in Waupaca County
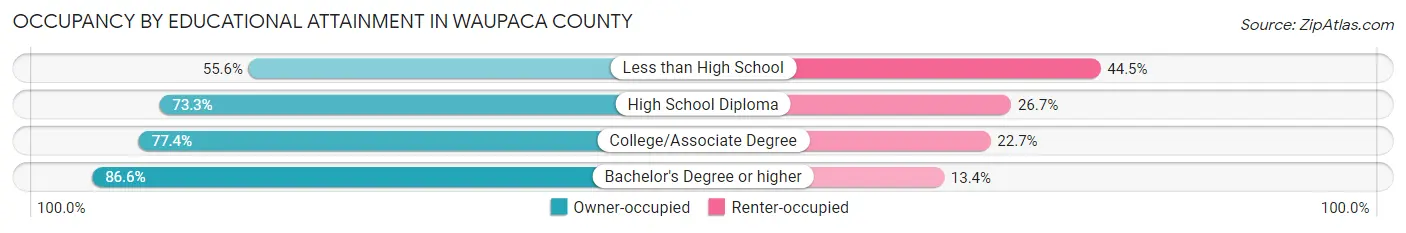
| Household Size | Owner-occupied | Renter-occupied |
| Less than High School | 826 (55.5%) | 661 (44.5%) |
| High School Diploma | 6,731 (73.3%) | 2,455 (26.7%) |
| College/Associate Degree | 5,405 (77.3%) | 1,583 (22.7%) |
| Bachelor's Degree or higher | 4,064 (86.6%) | 630 (13.4%) |
Occupancy by Age of Householder in Waupaca County
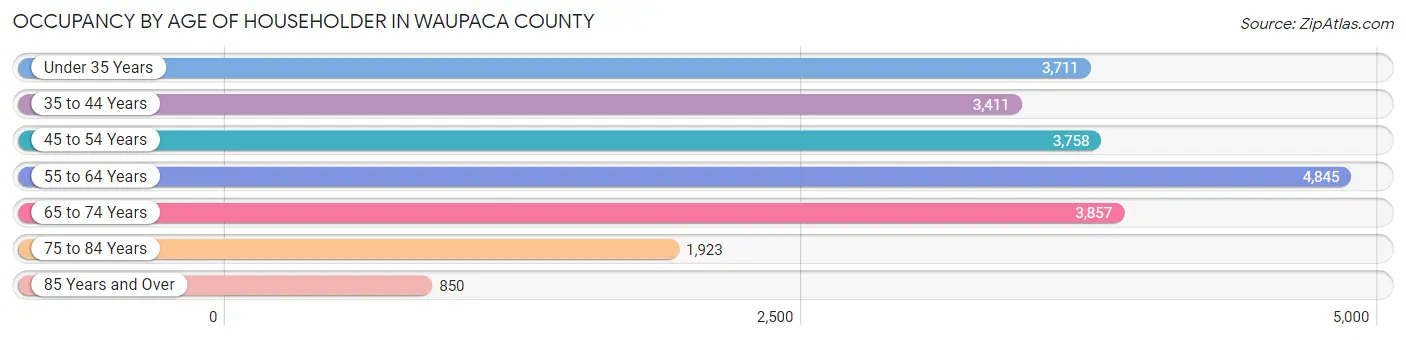
| Age Bracket | # Households | % Households |
| Under 35 Years | 3,711 | 16.6% |
| 35 to 44 Years | 3,411 | 15.3% |
| 45 to 54 Years | 3,758 | 16.8% |
| 55 to 64 Years | 4,845 | 21.7% |
| 65 to 74 Years | 3,857 | 17.2% |
| 75 to 84 Years | 1,923 | 8.6% |
| 85 Years and Over | 850 | 3.8% |
| Total | 22,355 | 100.0% |
Housing Finances in Waupaca County
Median Income by Occupancy in Waupaca County
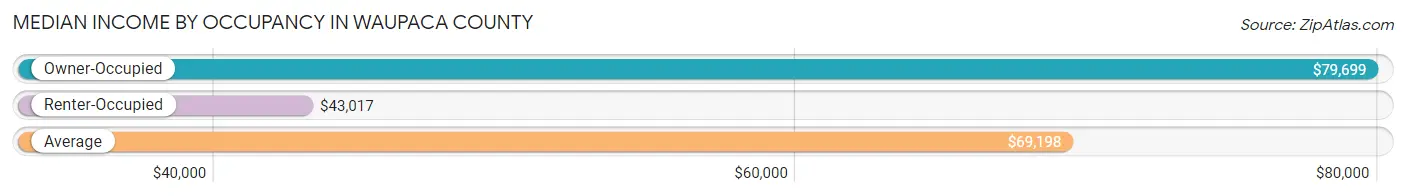
| Occupancy Type | # Households | Median Income |
| Owner-Occupied | 17,026 (76.2%) | $79,699 |
| Renter-Occupied | 5,329 (23.8%) | $43,017 |
| Average | 22,355 (100.0%) | $69,198 |
Occupancy by Householder Income Bracket in Waupaca County
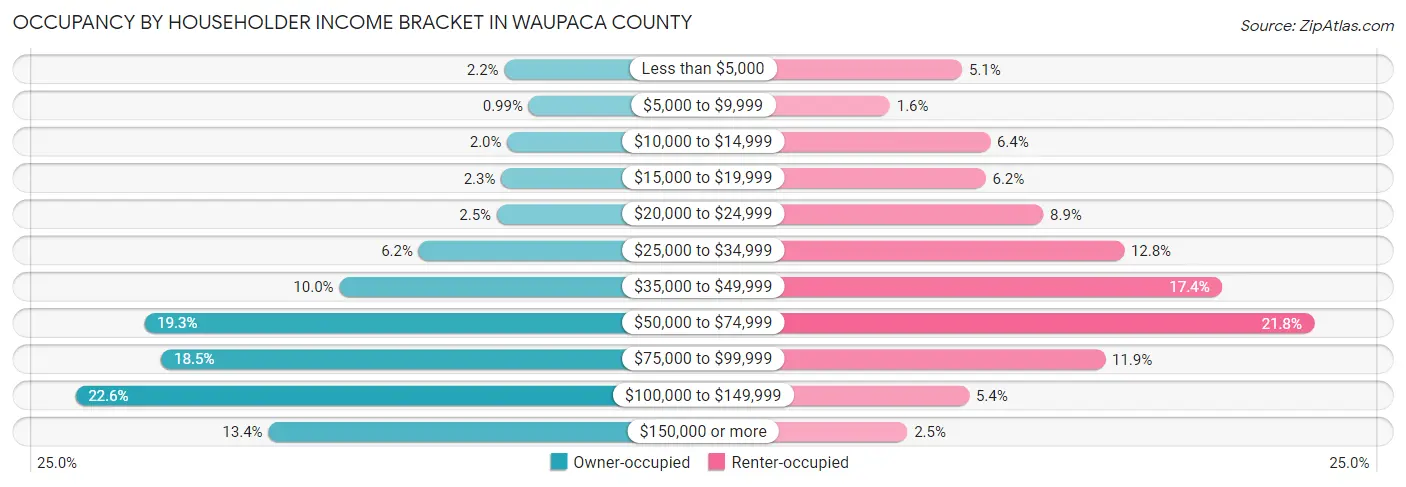
| Income Bracket | Owner-occupied | Renter-occupied |
| Less than $5,000 | 366 (2.1%) | 270 (5.1%) |
| $5,000 to $9,999 | 169 (1.0%) | 87 (1.6%) |
| $10,000 to $14,999 | 343 (2.0%) | 341 (6.4%) |
| $15,000 to $19,999 | 392 (2.3%) | 330 (6.2%) |
| $20,000 to $24,999 | 428 (2.5%) | 476 (8.9%) |
| $25,000 to $34,999 | 1,060 (6.2%) | 681 (12.8%) |
| $35,000 to $49,999 | 1,705 (10.0%) | 929 (17.4%) |
| $50,000 to $74,999 | 3,288 (19.3%) | 1,163 (21.8%) |
| $75,000 to $99,999 | 3,150 (18.5%) | 633 (11.9%) |
| $100,000 to $149,999 | 3,846 (22.6%) | 288 (5.4%) |
| $150,000 or more | 2,279 (13.4%) | 131 (2.5%) |
| Total | 17,026 (100.0%) | 5,329 (100.0%) |
Monthly Housing Cost Tiers in Waupaca County
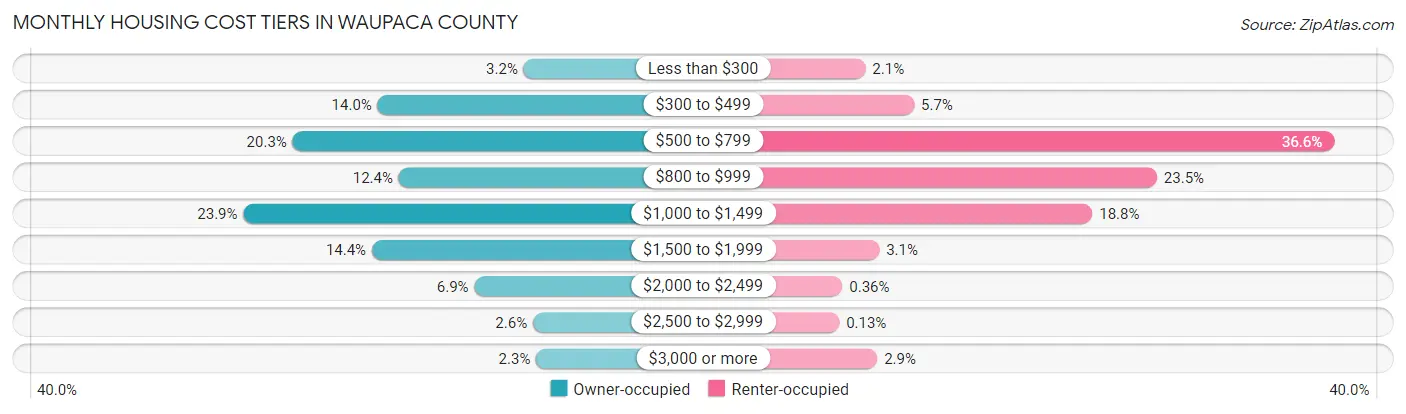
| Monthly Cost | Owner-occupied | Renter-occupied |
| Less than $300 | 552 (3.2%) | 110 (2.1%) |
| $300 to $499 | 2,384 (14.0%) | 301 (5.7%) |
| $500 to $799 | 3,449 (20.3%) | 1,949 (36.6%) |
| $800 to $999 | 2,118 (12.4%) | 1,254 (23.5%) |
| $1,000 to $1,499 | 4,068 (23.9%) | 1,000 (18.8%) |
| $1,500 to $1,999 | 2,455 (14.4%) | 164 (3.1%) |
| $2,000 to $2,499 | 1,169 (6.9%) | 19 (0.4%) |
| $2,500 to $2,999 | 436 (2.6%) | 7 (0.1%) |
| $3,000 or more | 395 (2.3%) | 156 (2.9%) |
| Total | 17,026 (100.0%) | 5,329 (100.0%) |
Physical Housing Characteristics in Waupaca County
Housing Structures in Waupaca County
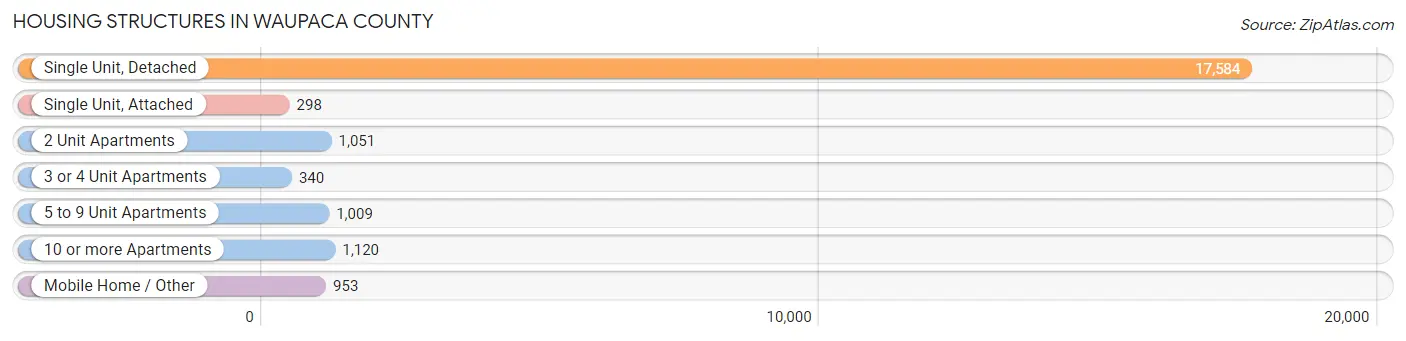
| Structure Type | # Housing Units | % Housing Units |
| Single Unit, Detached | 17,584 | 78.7% |
| Single Unit, Attached | 298 | 1.3% |
| 2 Unit Apartments | 1,051 | 4.7% |
| 3 or 4 Unit Apartments | 340 | 1.5% |
| 5 to 9 Unit Apartments | 1,009 | 4.5% |
| 10 or more Apartments | 1,120 | 5.0% |
| Mobile Home / Other | 953 | 4.3% |
| Total | 22,355 | 100.0% |
Housing Structures by Occupancy in Waupaca County
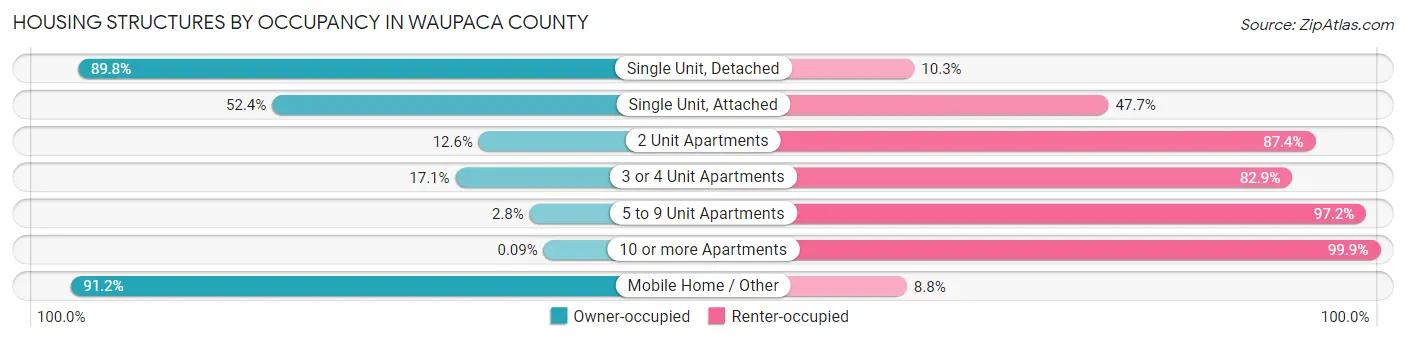
| Structure Type | Owner-occupied | Renter-occupied |
| Single Unit, Detached | 15,782 (89.7%) | 1,802 (10.2%) |
| Single Unit, Attached | 156 (52.3%) | 142 (47.6%) |
| 2 Unit Apartments | 132 (12.6%) | 919 (87.4%) |
| 3 or 4 Unit Apartments | 58 (17.1%) | 282 (82.9%) |
| 5 to 9 Unit Apartments | 28 (2.8%) | 981 (97.2%) |
| 10 or more Apartments | 1 (0.1%) | 1,119 (99.9%) |
| Mobile Home / Other | 869 (91.2%) | 84 (8.8%) |
| Total | 17,026 (76.2%) | 5,329 (23.8%) |
Housing Structures by Number of Rooms in Waupaca County
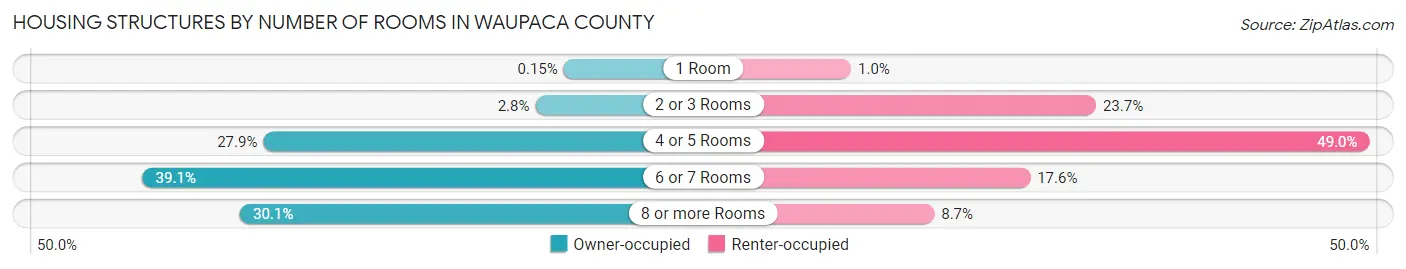
| Number of Rooms | Owner-occupied | Renter-occupied |
| 1 Room | 26 (0.2%) | 55 (1.0%) |
| 2 or 3 Rooms | 472 (2.8%) | 1,262 (23.7%) |
| 4 or 5 Rooms | 4,755 (27.9%) | 2,609 (49.0%) |
| 6 or 7 Rooms | 6,653 (39.1%) | 938 (17.6%) |
| 8 or more Rooms | 5,120 (30.1%) | 465 (8.7%) |
| Total | 17,026 (100.0%) | 5,329 (100.0%) |
Housing Structure by Heating Type in Waupaca County
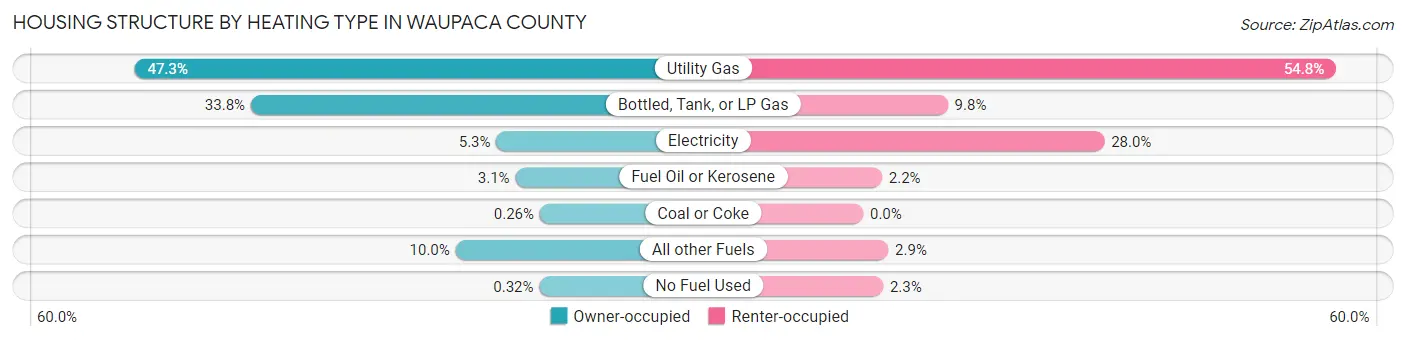
| Heating Type | Owner-occupied | Renter-occupied |
| Utility Gas | 8,044 (47.2%) | 2,922 (54.8%) |
| Bottled, Tank, or LP Gas | 5,748 (33.8%) | 523 (9.8%) |
| Electricity | 902 (5.3%) | 1,490 (28.0%) |
| Fuel Oil or Kerosene | 526 (3.1%) | 116 (2.2%) |
| Coal or Coke | 44 (0.3%) | 0 (0.0%) |
| All other Fuels | 1,708 (10.0%) | 155 (2.9%) |
| No Fuel Used | 54 (0.3%) | 123 (2.3%) |
| Total | 17,026 (100.0%) | 5,329 (100.0%) |
Household Vehicle Usage in Waupaca County
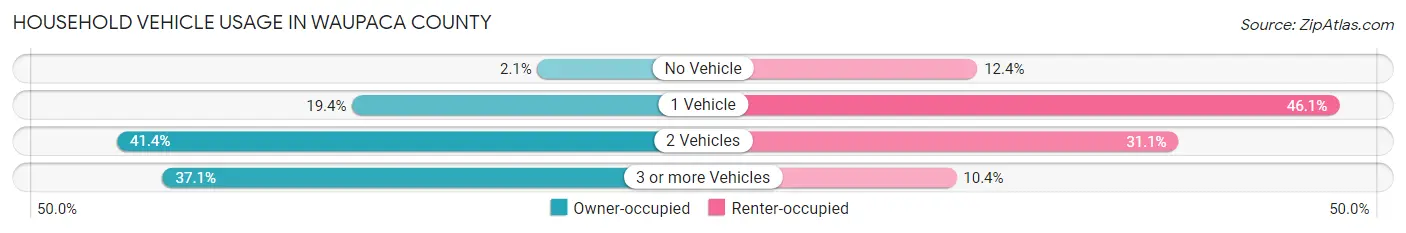
| Vehicles per Household | Owner-occupied | Renter-occupied |
| No Vehicle | 359 (2.1%) | 658 (12.3%) |
| 1 Vehicle | 3,305 (19.4%) | 2,458 (46.1%) |
| 2 Vehicles | 7,044 (41.4%) | 1,659 (31.1%) |
| 3 or more Vehicles | 6,318 (37.1%) | 554 (10.4%) |
| Total | 17,026 (100.0%) | 5,329 (100.0%) |
Real Estate & Mortgages in Waupaca County
Real Estate and Mortgage Overview in Waupaca County
| Characteristic | Without Mortgage | With Mortgage |
| Housing Units | 6,802 | 10,224 |
| Median Property Value | $162,700 | $187,400 |
| Median Household Income | $61,435 | $1,607 |
| Monthly Housing Costs | $552 | $390 |
| Real Estate Taxes | $2,788 | $81 |
Property Value by Mortgage Status in Waupaca County
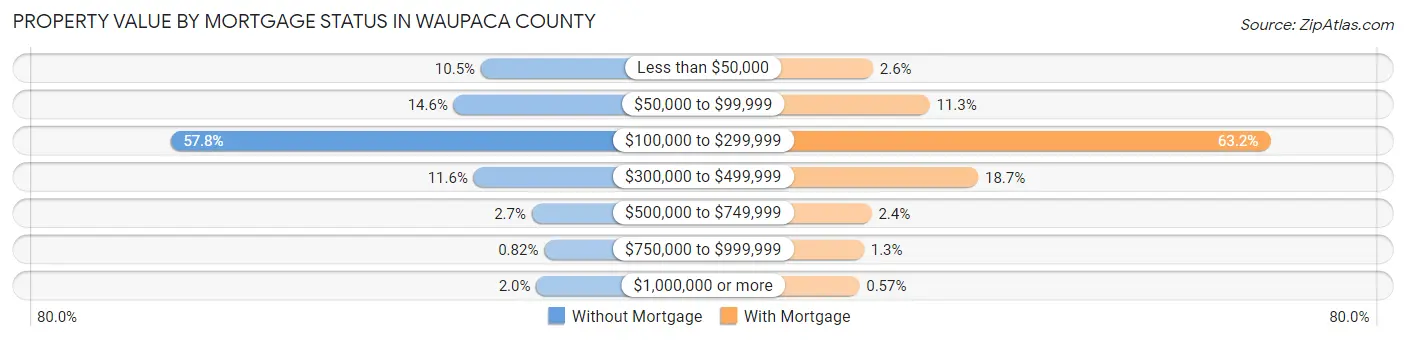
| Property Value | Without Mortgage | With Mortgage |
| Less than $50,000 | 712 (10.5%) | 270 (2.6%) |
| $50,000 to $99,999 | 994 (14.6%) | 1,153 (11.3%) |
| $100,000 to $299,999 | 3,932 (57.8%) | 6,459 (63.2%) |
| $300,000 to $499,999 | 786 (11.6%) | 1,909 (18.7%) |
| $500,000 to $749,999 | 184 (2.7%) | 247 (2.4%) |
| $750,000 to $999,999 | 56 (0.8%) | 128 (1.3%) |
| $1,000,000 or more | 138 (2.0%) | 58 (0.6%) |
| Total | 6,802 (100.0%) | 10,224 (100.0%) |
Household Income by Mortgage Status in Waupaca County
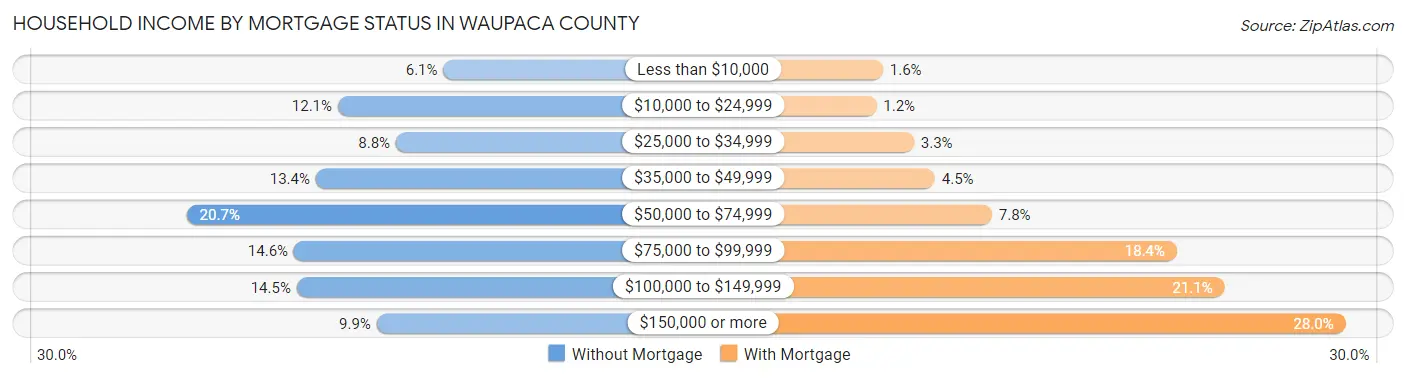
| Household Income | Without Mortgage | With Mortgage |
| Less than $10,000 | 413 (6.1%) | 159 (1.6%) |
| $10,000 to $24,999 | 823 (12.1%) | 122 (1.2%) |
| $25,000 to $34,999 | 597 (8.8%) | 340 (3.3%) |
| $35,000 to $49,999 | 909 (13.4%) | 463 (4.5%) |
| $50,000 to $74,999 | 1,411 (20.7%) | 796 (7.8%) |
| $75,000 to $99,999 | 994 (14.6%) | 1,877 (18.4%) |
| $100,000 to $149,999 | 983 (14.4%) | 2,156 (21.1%) |
| $150,000 or more | 672 (9.9%) | 2,863 (28.0%) |
| Total | 6,802 (100.0%) | 10,224 (100.0%) |
Property Value to Household Income Ratio in Waupaca County
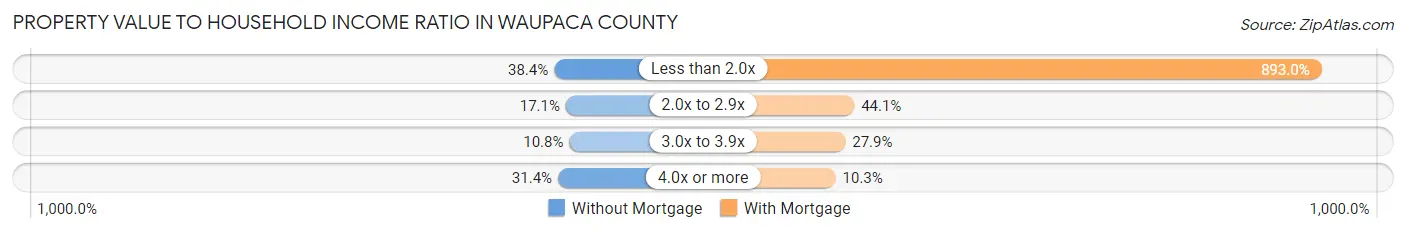
| Value-to-Income Ratio | Without Mortgage | With Mortgage |
| Less than 2.0x | 2,613 (38.4%) | 91,297 (893.0%) |
| 2.0x to 2.9x | 1,163 (17.1%) | 4,507 (44.1%) |
| 3.0x to 3.9x | 735 (10.8%) | 2,849 (27.9%) |
| 4.0x or more | 2,138 (31.4%) | 1,053 (10.3%) |
| Total | 6,802 (100.0%) | 10,224 (100.0%) |
Real Estate Taxes by Mortgage Status in Waupaca County
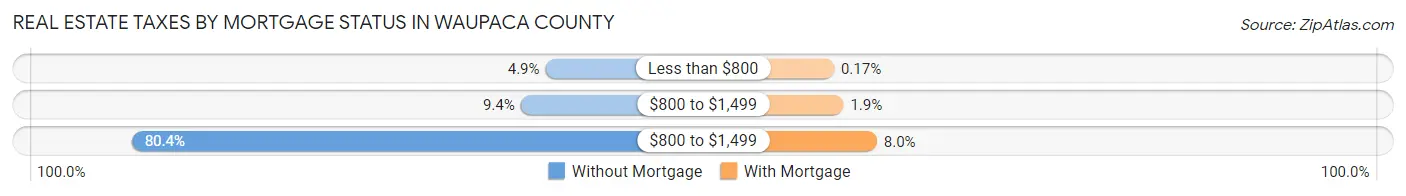
| Property Taxes | Without Mortgage | With Mortgage |
| Less than $800 | 332 (4.9%) | 17 (0.2%) |
| $800 to $1,499 | 640 (9.4%) | 194 (1.9%) |
| $800 to $1,499 | 5,471 (80.4%) | 818 (8.0%) |
| Total | 6,802 (100.0%) | 10,224 (100.0%) |
Health & Disability in Waupaca County
Health Insurance Coverage by Age in Waupaca County
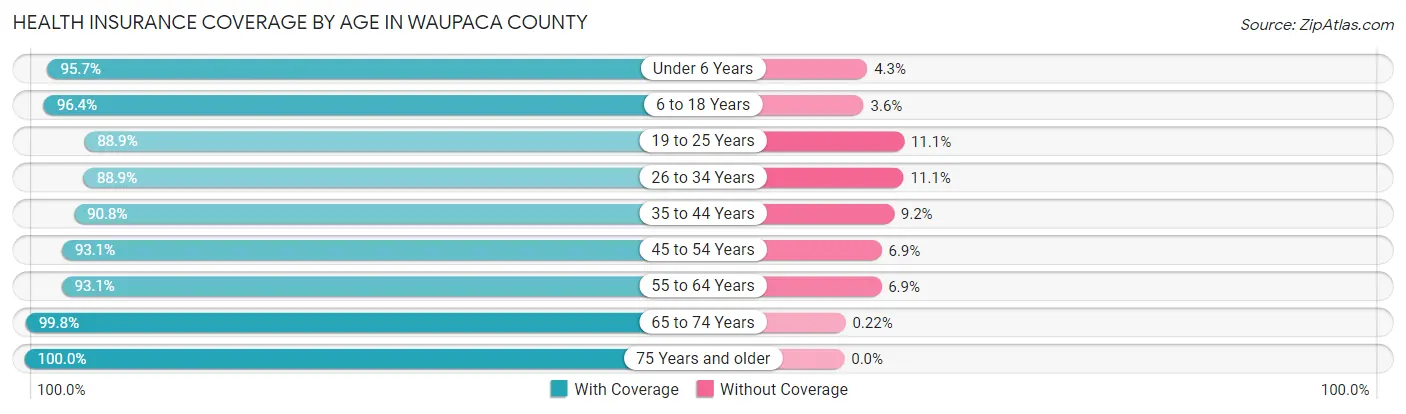
| Age Bracket | With Coverage | Without Coverage |
| Under 6 Years | 2,918 (95.7%) | 130 (4.3%) |
| 6 to 18 Years | 7,669 (96.4%) | 286 (3.6%) |
| 19 to 25 Years | 3,195 (88.9%) | 400 (11.1%) |
| 26 to 34 Years | 4,432 (88.9%) | 551 (11.1%) |
| 35 to 44 Years | 5,414 (90.8%) | 551 (9.2%) |
| 45 to 54 Years | 6,212 (93.1%) | 463 (6.9%) |
| 55 to 64 Years | 7,970 (93.1%) | 589 (6.9%) |
| 65 to 74 Years | 5,960 (99.8%) | 13 (0.2%) |
| 75 Years and older | 3,818 (100.0%) | 0 (0.0%) |
| Total | 47,588 (94.1%) | 2,983 (5.9%) |
Health Insurance Coverage by Citizenship Status in Waupaca County
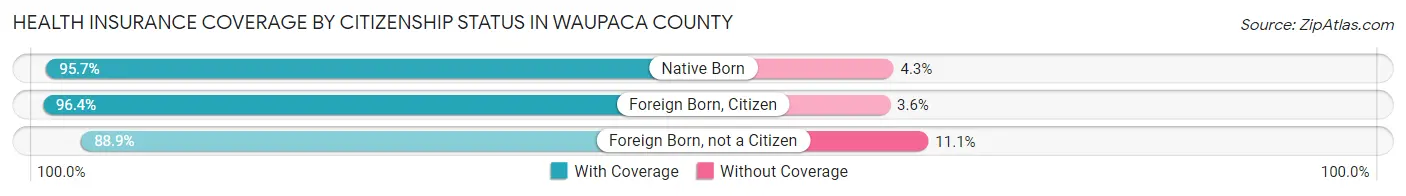
| Citizenship Status | With Coverage | Without Coverage |
| Native Born | 2,918 (95.7%) | 130 (4.3%) |
| Foreign Born, Citizen | 7,669 (96.4%) | 286 (3.6%) |
| Foreign Born, not a Citizen | 3,195 (88.9%) | 400 (11.1%) |
Health Insurance Coverage by Household Income in Waupaca County
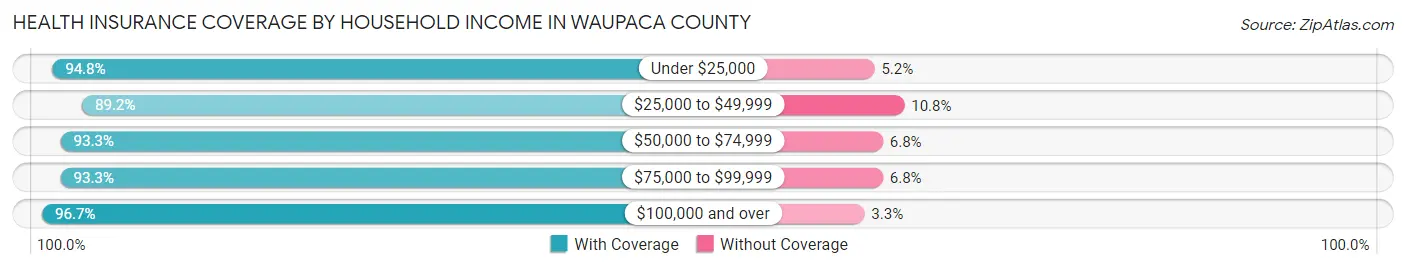
| Household Income | With Coverage | Without Coverage |
| Under $25,000 | 4,345 (94.8%) | 238 (5.2%) |
| $25,000 to $49,999 | 6,888 (89.2%) | 832 (10.8%) |
| $50,000 to $74,999 | 8,645 (93.2%) | 626 (6.8%) |
| $75,000 to $99,999 | 9,133 (93.2%) | 661 (6.8%) |
| $100,000 and over | 18,336 (96.7%) | 626 (3.3%) |
Public vs Private Health Insurance Coverage by Age in Waupaca County
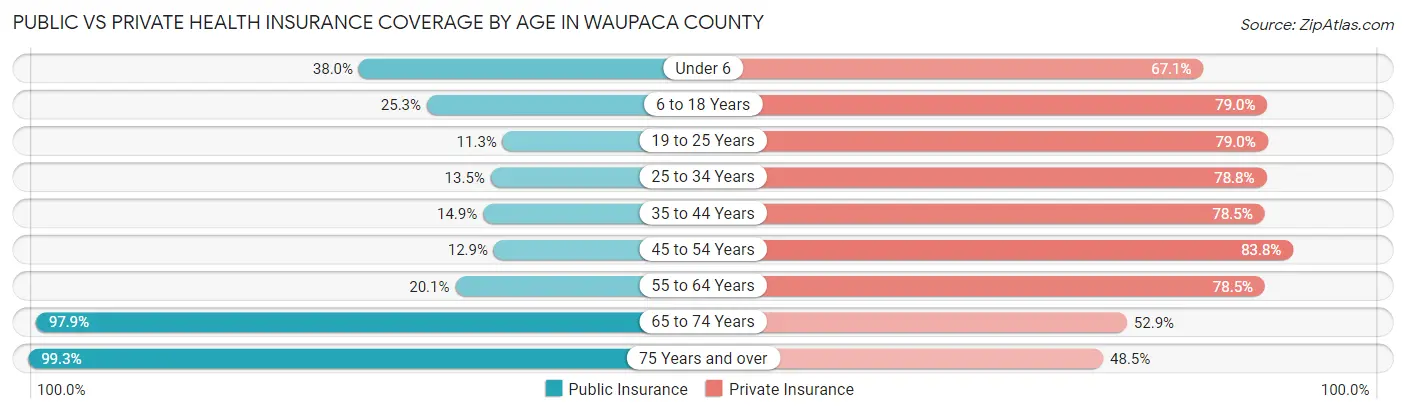
| Age Bracket | Public Insurance | Private Insurance |
| Under 6 | 1,157 (38.0%) | 2,045 (67.1%) |
| 6 to 18 Years | 2,015 (25.3%) | 6,283 (79.0%) |
| 19 to 25 Years | 405 (11.3%) | 2,841 (79.0%) |
| 25 to 34 Years | 672 (13.5%) | 3,926 (78.8%) |
| 35 to 44 Years | 889 (14.9%) | 4,680 (78.5%) |
| 45 to 54 Years | 862 (12.9%) | 5,592 (83.8%) |
| 55 to 64 Years | 1,717 (20.1%) | 6,721 (78.5%) |
| 65 to 74 Years | 5,848 (97.9%) | 3,161 (52.9%) |
| 75 Years and over | 3,792 (99.3%) | 1,852 (48.5%) |
| Total | 17,357 (34.3%) | 37,101 (73.4%) |
Disability Status by Sex by Age in Waupaca County
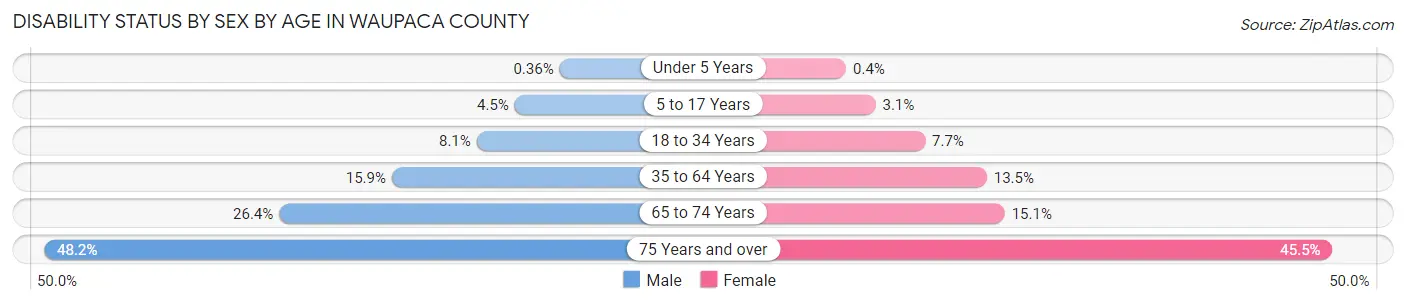
| Age Bracket | Male | Female |
| Under 5 Years | 5 (0.4%) | 5 (0.4%) |
| 5 to 17 Years | 180 (4.5%) | 120 (3.1%) |
| 18 to 34 Years | 386 (8.1%) | 336 (7.7%) |
| 35 to 64 Years | 1,721 (15.9%) | 1,398 (13.5%) |
| 65 to 74 Years | 780 (26.4%) | 456 (15.1%) |
| 75 Years and over | 734 (48.2%) | 1,045 (45.5%) |
Disability Class by Sex by Age in Waupaca County
Disability Class: Hearing Difficulty
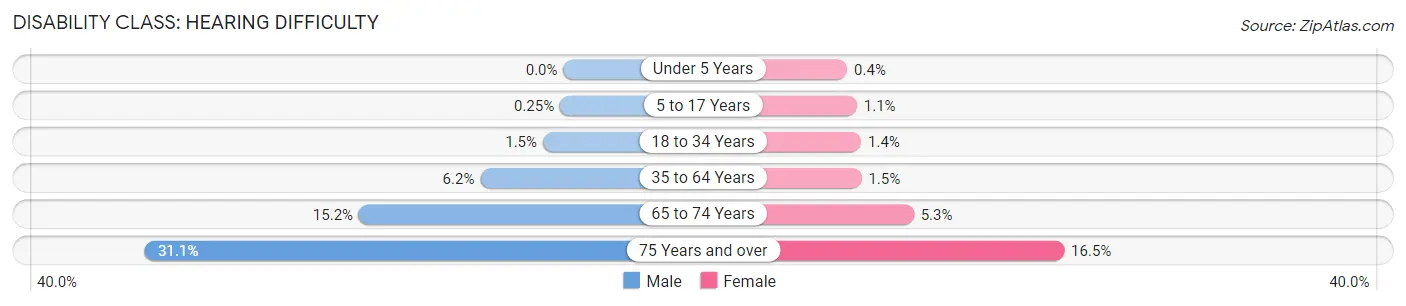
| Age Bracket | Male | Female |
| Under 5 Years | 0 (0.0%) | 5 (0.4%) |
| 5 to 17 Years | 10 (0.3%) | 43 (1.1%) |
| 18 to 34 Years | 73 (1.5%) | 62 (1.4%) |
| 35 to 64 Years | 667 (6.2%) | 152 (1.5%) |
| 65 to 74 Years | 449 (15.2%) | 161 (5.3%) |
| 75 Years and over | 473 (31.1%) | 379 (16.5%) |
Disability Class: Vision Difficulty
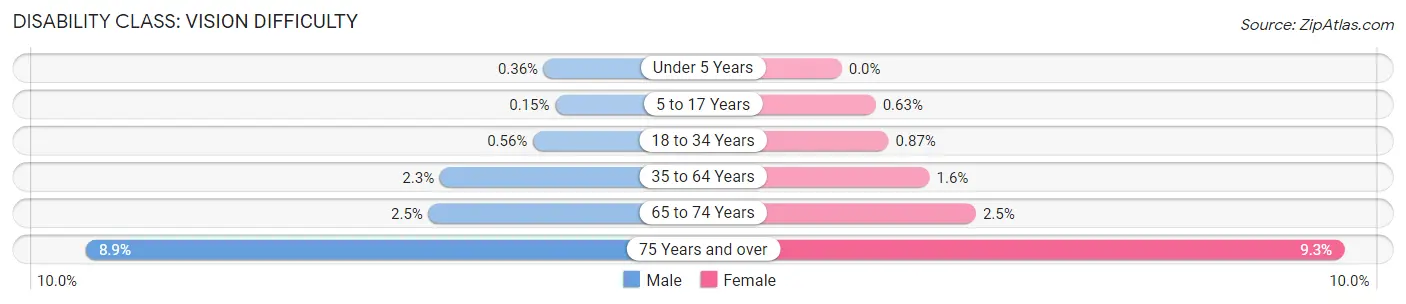
| Age Bracket | Male | Female |
| Under 5 Years | 5 (0.4%) | 0 (0.0%) |
| 5 to 17 Years | 6 (0.2%) | 24 (0.6%) |
| 18 to 34 Years | 27 (0.6%) | 38 (0.9%) |
| 35 to 64 Years | 248 (2.3%) | 169 (1.6%) |
| 65 to 74 Years | 74 (2.5%) | 75 (2.5%) |
| 75 Years and over | 135 (8.9%) | 214 (9.3%) |
Disability Class: Cognitive Difficulty
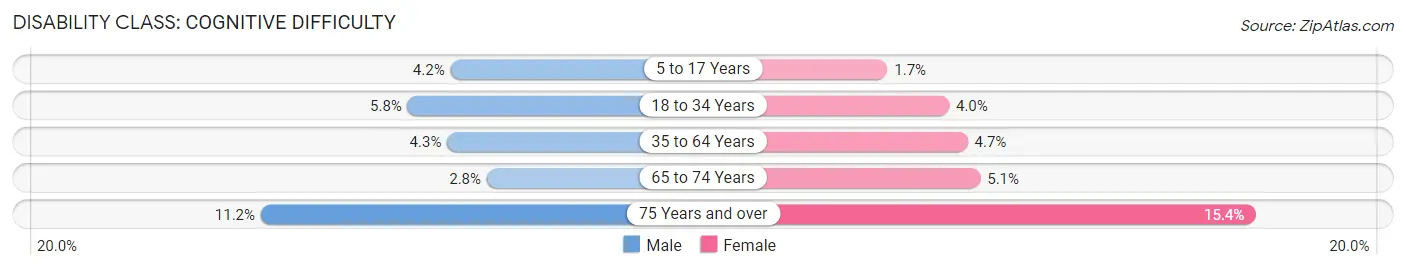
| Age Bracket | Male | Female |
| 5 to 17 Years | 167 (4.2%) | 65 (1.7%) |
| 18 to 34 Years | 277 (5.8%) | 173 (4.0%) |
| 35 to 64 Years | 466 (4.3%) | 485 (4.7%) |
| 65 to 74 Years | 84 (2.8%) | 155 (5.1%) |
| 75 Years and over | 171 (11.2%) | 353 (15.4%) |
Disability Class: Ambulatory Difficulty
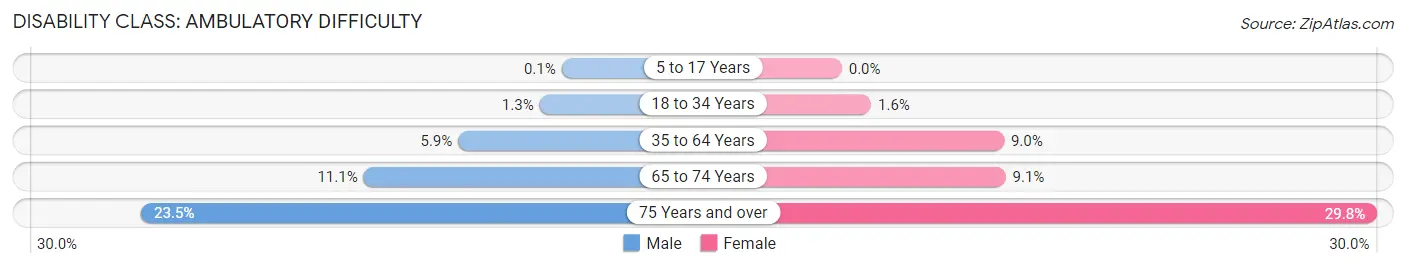
| Age Bracket | Male | Female |
| 5 to 17 Years | 4 (0.1%) | 0 (0.0%) |
| 18 to 34 Years | 64 (1.3%) | 71 (1.6%) |
| 35 to 64 Years | 633 (5.9%) | 938 (9.0%) |
| 65 to 74 Years | 329 (11.1%) | 275 (9.1%) |
| 75 Years and over | 358 (23.5%) | 684 (29.8%) |
Disability Class: Self-Care Difficulty
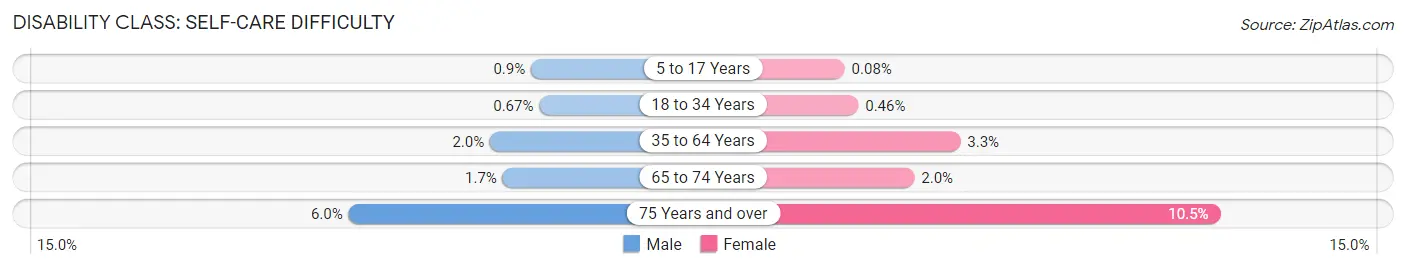
| Age Bracket | Male | Female |
| 5 to 17 Years | 36 (0.9%) | 3 (0.1%) |
| 18 to 34 Years | 32 (0.7%) | 20 (0.5%) |
| 35 to 64 Years | 220 (2.0%) | 343 (3.3%) |
| 65 to 74 Years | 50 (1.7%) | 61 (2.0%) |
| 75 Years and over | 91 (6.0%) | 242 (10.5%) |
Technology Access in Waupaca County
Computing Device Access in Waupaca County
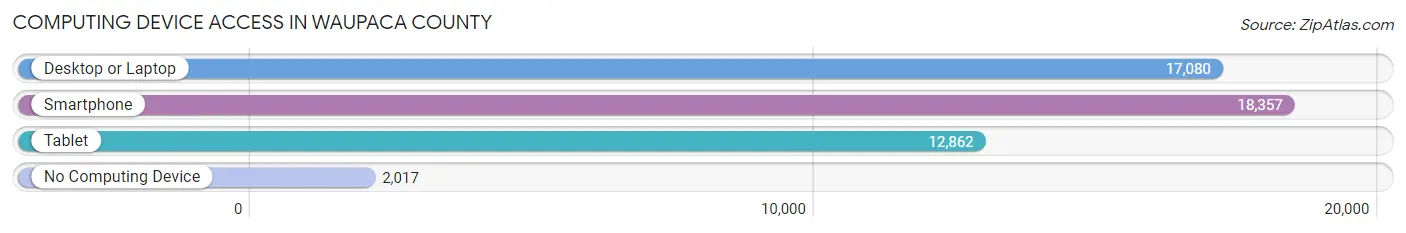
| Device Type | # Households | % Households |
| Desktop or Laptop | 17,080 | 76.4% |
| Smartphone | 18,357 | 82.1% |
| Tablet | 12,862 | 57.5% |
| No Computing Device | 2,017 | 9.0% |
| Total | 22,355 | 100.0% |
Internet Access in Waupaca County
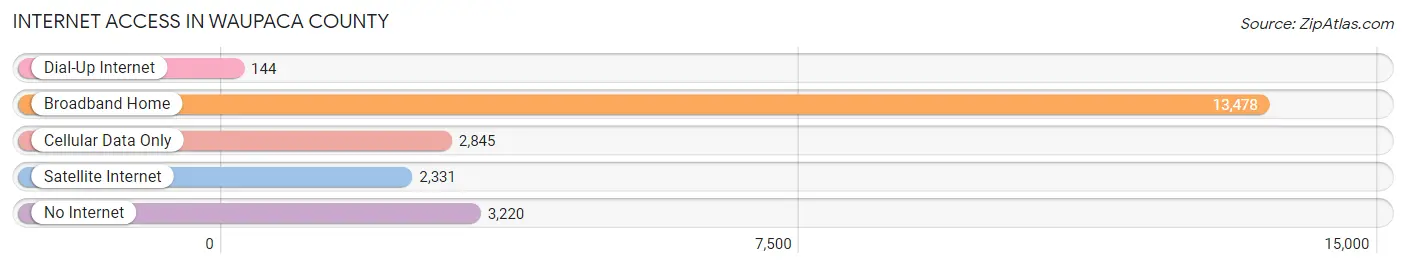
| Internet Type | # Households | % Households |
| Dial-Up Internet | 144 | 0.6% |
| Broadband Home | 13,478 | 60.3% |
| Cellular Data Only | 2,845 | 12.7% |
| Satellite Internet | 2,331 | 10.4% |
| No Internet | 3,220 | 14.4% |
| Total | 22,355 | 100.0% |
Waupaca County Summary
Waupaca County is located in the east-central region of Wisconsin, and is part of the Fox Valley region. It is bordered by Outagamie County to the north, Shawano County to the east, Portage County to the south, and Winnebago County to the west. The county seat is Waupaca, and the largest city is New London. The county has a total area of 845 square miles, and a population of 52,410 as of the 2010 census.
History
The area that is now Waupaca County was originally inhabited by the Menominee and Winnebago Native American tribes. The first European settlers arrived in the area in the early 1800s, and the county was officially organized in 1851. The county was named after the Waupaca River, which was named by the Menominee tribe and means “white sand bottom”.
The county was largely agricultural in the 19th century, with the main crops being wheat, oats, and potatoes. The county also had a thriving lumber industry, with several sawmills located along the Wolf River. The county also had several small manufacturing businesses, including a brickyard, a cheese factory, and a canning factory.
Geography
Waupaca County is located in the east-central region of Wisconsin, and is part of the Fox Valley region. It is bordered by Outagamie County to the north, Shawano County to the east, Portage County to the south, and Winnebago County to the west. The county has a total area of 845 square miles, and is mostly rural, with the majority of the land being used for agriculture. The Wolf River runs through the county, and there are several small lakes, including Big Eau Pleine Reservoir, Lake Poygan, and Lake Waupaca.
Economy
The economy of Waupaca County is largely based on agriculture, with the main crops being corn, soybeans, and hay. The county also has a thriving tourism industry, with several popular attractions, including the Waupaca County Fair, the Waupaca County Historical Society, and the Waupaca County Museum. The county also has several manufacturing businesses, including a paper mill, a cheese factory, and a canning factory.
Demographics
As of the 2010 census, Waupaca County had a population of 52,410. The racial makeup of the county was 95.3% White, 0.7% African American, 0.7% Native American, 0.7% Asian, 0.2% Pacific Islander, 1.3% from other races, and 1.2% from two or more races. Hispanic or Latino of any race were 3.2% of the population.
The median income for a household in the county was $45,945, and the median income for a family was $54,945. The per capita income for the county was $22,845. About 8.2% of families and 11.2% of the population were below the poverty line, including 15.2% of those under age 18 and 8.2% of those age 65 or over.
Common Questions
What is the Total Population of Waupaca County?
Total Population of Waupaca County is 51,822.
What is the Total Male Population of Waupaca County?
Total Male Population of Waupaca County is 26,448.
What is the Total Female Population of Waupaca County?
Total Female Population of Waupaca County is 25,374.
What is the Ratio of Males per 100 Females in Waupaca County?
There are 104.23 Males per 100 Females in Waupaca County.
What is the Ratio of Females per 100 Males in Waupaca County?
There are 95.94 Females per 100 Males in Waupaca County.
What is the Median Population Age in Waupaca County?
Median Population Age in Waupaca County is 45.3 Years.
What is the Average Family Size in Waupaca County
Average Family Size in Waupaca County is 2.7 People.
What is the Average Household Size in Waupaca County
Average Household Size in Waupaca County is 2.2 People.
What is Per Capita Income in Waupaca County?
Per Capita income in Waupaca County is $39,147.
What is the Median Family Income in Waupaca County?
Median Family Income in Waupaca County is $84,282.
What is the Median Household income in Waupaca County?
Median Household Income in Waupaca County is $69,198.
What is Income or Wage Gap in Waupaca County?
Income or Wage Gap in Waupaca County is 34.7%.
Women in Waupaca County earn 65.3 cents for every dollar earned by a man.
What is Family Income Deficit in Waupaca County?
Family Income Deficit in Waupaca County is $10,275.
Families that are below poverty line in Waupaca County earn $10,275 less on average than the poverty threshold level.
What is Inequality or Gini Index in Waupaca County?
Inequality or Gini Index in Waupaca County is 0.44.
How Large is the Labor Force in Waupaca County?
There are 26,893 People in the Labor Forcein in Waupaca County.
What is the Percentage of People in the Labor Force in Waupaca County?
63.0% of People are in the Labor Force in Waupaca County.
What is the Unemployment Rate in Waupaca County?
Unemployment Rate in Waupaca County is 2.7%.