Washington County, WI
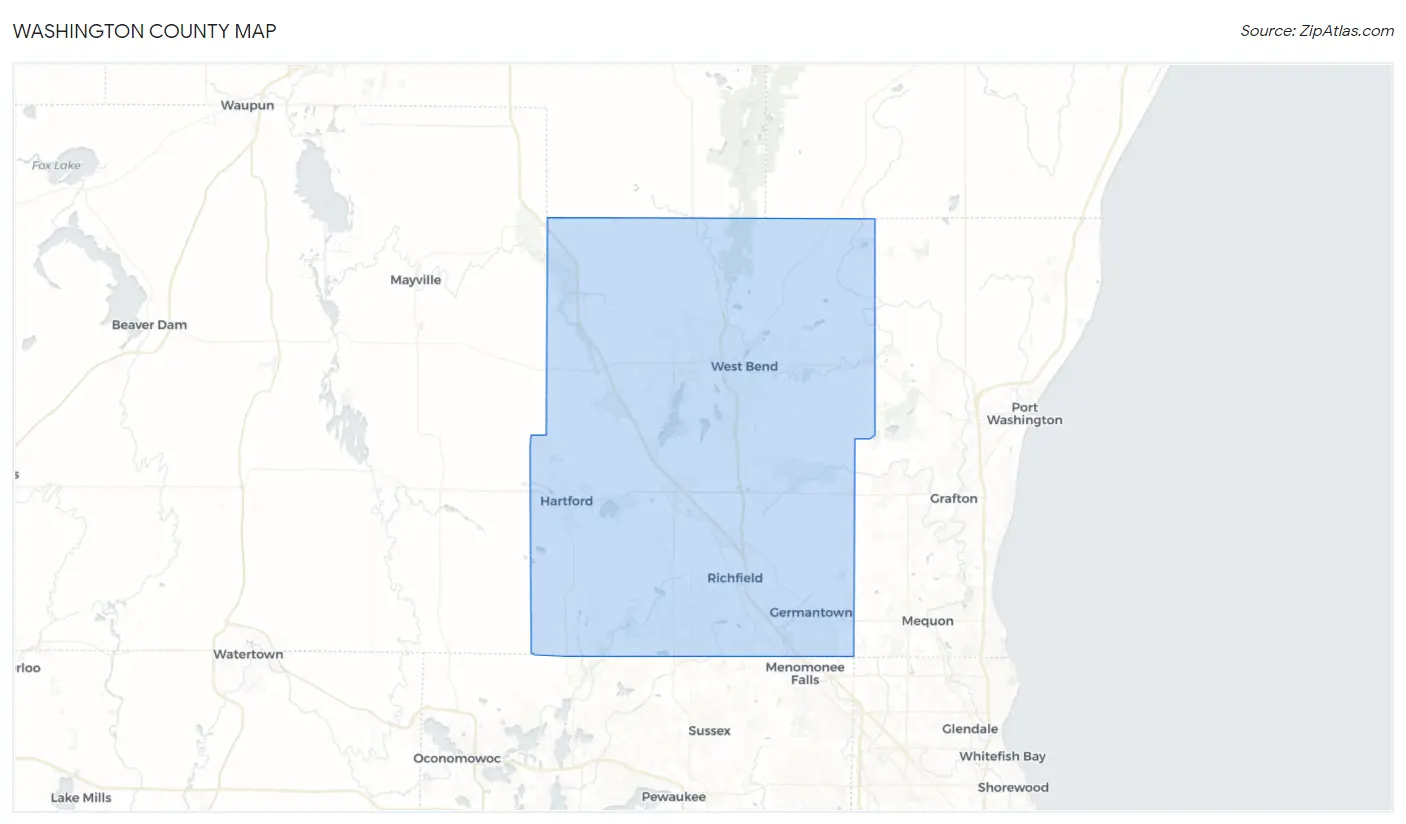
Washington County Map
Washington County Overview
136,842
TOTAL POPULATION
68,585
MALE POPULATION
68,257
FEMALE POPULATION
100.48
MALES / 100 FEMALES
99.52
FEMALES / 100 MALES
43.4
MEDIAN AGE
2.9
AVG FAMILY SIZE
2.4
AVG HOUSEHOLD SIZE
$45,821
PER CAPITA INCOME
$108,427
AVG FAMILY INCOME
$91,915
AVG HOUSEHOLD INCOME
28.5%
WAGE / INCOME GAP [ % ]
71.5¢/ $1
WAGE / INCOME GAP [ $ ]
$11,041
FAMILY INCOME DEFICIT
0.40
INEQUALITY / GINI INDEX
76,947
LABOR FORCE [ PEOPLE ]
69.0%
PERCENT IN LABOR FORCE
3.1%
UNEMPLOYMENT RATE
Washington County Area Codes
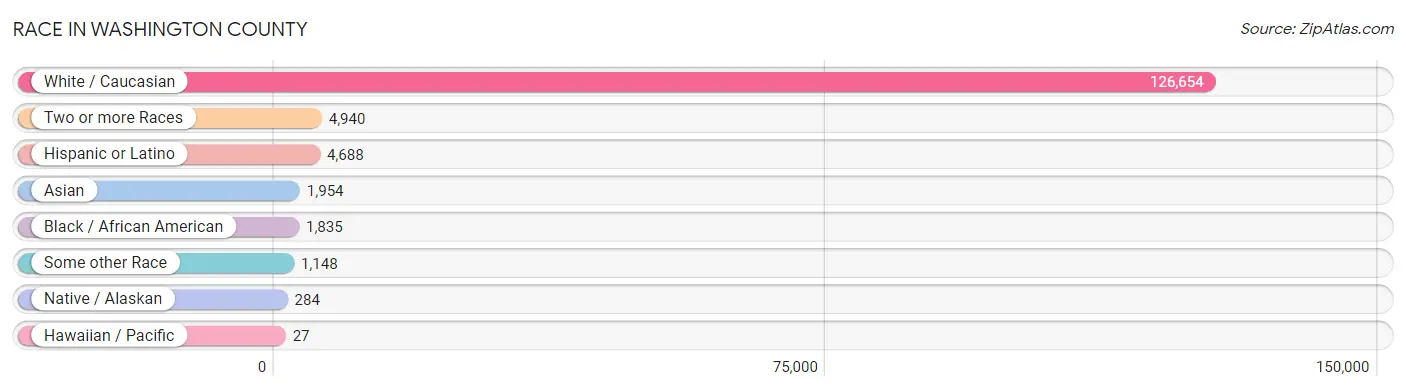
Race in Washington County
The most populous races in Washington County are White / Caucasian (126,654 | 92.5%), Two or more Races (4,940 | 3.6%), and Hispanic or Latino (4,688 | 3.4%).
| Race | # Population | % Population |
| Asian | 1,954 | 1.4% |
| Black / African American | 1,835 | 1.3% |
| Hawaiian / Pacific | 27 | 0.0% |
| Hispanic or Latino | 4,688 | 3.4% |
| Native / Alaskan | 284 | 0.2% |
| White / Caucasian | 126,654 | 92.5% |
| Two or more Races | 4,940 | 3.6% |
| Some other Race | 1,148 | 0.8% |
| Total | 136,842 | 100.0% |
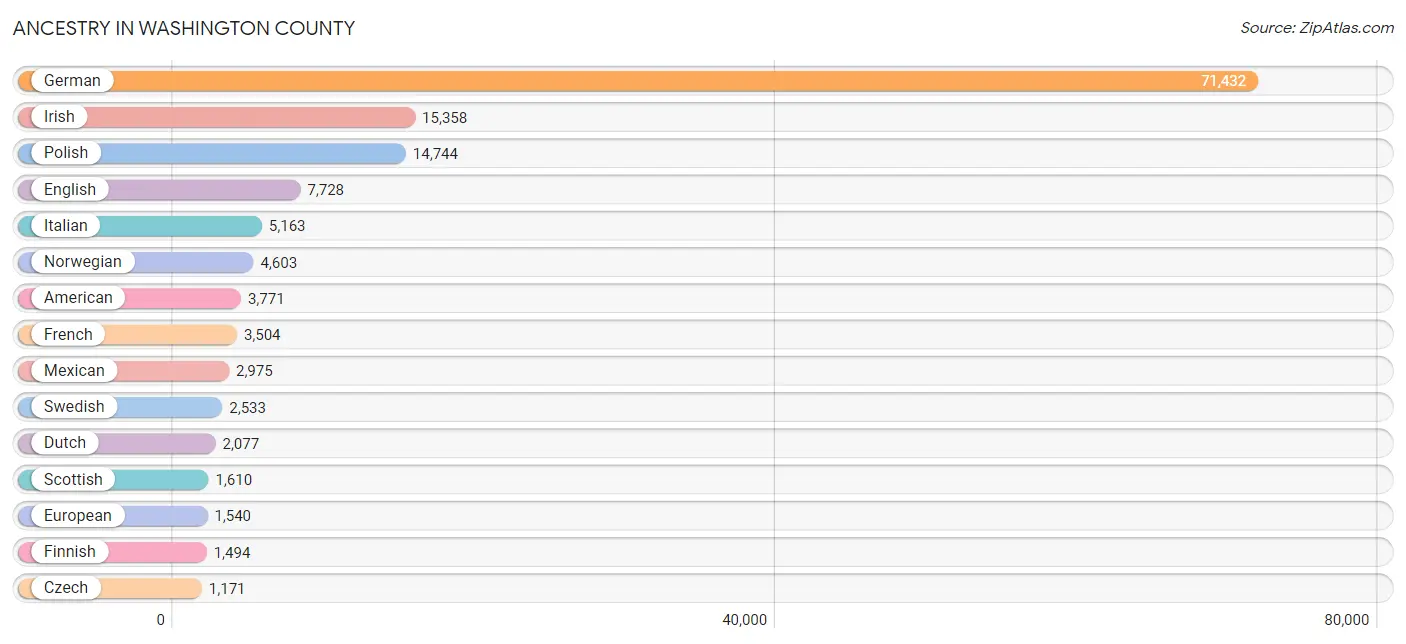
Ancestry in Washington County
The most populous ancestries reported in Washington County are German (71,432 | 52.2%), Irish (15,358 | 11.2%), Polish (14,744 | 10.8%), English (7,728 | 5.7%), and Italian (5,163 | 3.8%), together accounting for 83.6% of all Washington County residents.
| Ancestry | # Population | % Population |
| African | 62 | 0.1% |
| Albanian | 63 | 0.1% |
| Aleut | 4 | 0.0% |
| American | 3,771 | 2.8% |
| Apache | 98 | 0.1% |
| Arab | 116 | 0.1% |
| Argentinean | 46 | 0.0% |
| Austrian | 760 | 0.6% |
| Bangladeshi | 609 | 0.4% |
| Belgian | 509 | 0.4% |
| Bhutanese | 27 | 0.0% |
| Blackfeet | 11 | 0.0% |
| Bolivian | 46 | 0.0% |
| Brazilian | 13 | 0.0% |
| British | 176 | 0.1% |
| Bulgarian | 37 | 0.0% |
| Burmese | 171 | 0.1% |
| Cajun | 27 | 0.0% |
| Cambodian | 21 | 0.0% |
| Canadian | 86 | 0.1% |
| Celtic | 11 | 0.0% |
| Central American | 161 | 0.1% |
| Central American Indian | 152 | 0.1% |
| Cherokee | 53 | 0.0% |
| Chippewa | 217 | 0.2% |
| Colombian | 28 | 0.0% |
| Comanche | 66 | 0.1% |
| Costa Rican | 32 | 0.0% |
| Cree | 29 | 0.0% |
| Croatian | 351 | 0.3% |
| Cuban | 113 | 0.1% |
| Cypriot | 10 | 0.0% |
| Czech | 1,171 | 0.9% |
| Czechoslovakian | 487 | 0.4% |
| Danish | 883 | 0.6% |
| Dominican | 23 | 0.0% |
| Dutch | 2,077 | 1.5% |
| Eastern European | 384 | 0.3% |
| Egyptian | 5 | 0.0% |
| English | 7,728 | 5.7% |
| Estonian | 15 | 0.0% |
| European | 1,540 | 1.1% |
| Finnish | 1,494 | 1.1% |
| French | 3,504 | 2.6% |
| French Canadian | 882 | 0.6% |
| German | 71,432 | 52.2% |
| Greek | 652 | 0.5% |
| Guamanian / Chamorro | 23 | 0.0% |
| Guatemalan | 112 | 0.1% |
| Haitian | 12 | 0.0% |
| Hungarian | 1,038 | 0.8% |
| Icelander | 136 | 0.1% |
| Indian (Asian) | 383 | 0.3% |
| Iranian | 5 | 0.0% |
| Irish | 15,358 | 11.2% |
| Iroquois | 41 | 0.0% |
| Italian | 5,163 | 3.8% |
| Jamaican | 147 | 0.1% |
| Korean | 716 | 0.5% |
| Latvian | 10 | 0.0% |
| Lebanese | 73 | 0.1% |
| Liberian | 8 | 0.0% |
| Lithuanian | 409 | 0.3% |
| Luxembourger | 742 | 0.5% |
| Macedonian | 1 | 0.0% |
| Malaysian | 57 | 0.0% |
| Menominee | 12 | 0.0% |
| Mexican | 2,975 | 2.2% |
| Mexican American Indian | 254 | 0.2% |
| Native Hawaiian | 30 | 0.0% |
| Nigerian | 34 | 0.0% |
| Northern European | 156 | 0.1% |
| Norwegian | 4,603 | 3.4% |
| Ottawa | 75 | 0.1% |
| Panamanian | 10 | 0.0% |
| Peruvian | 3 | 0.0% |
| Polish | 14,744 | 10.8% |
| Portuguese | 99 | 0.1% |
| Potawatomi | 98 | 0.1% |
| Puerto Rican | 897 | 0.7% |
| Romanian | 64 | 0.1% |
| Russian | 936 | 0.7% |
| Salvadoran | 7 | 0.0% |
| Scandinavian | 512 | 0.4% |
| Scotch-Irish | 244 | 0.2% |
| Scottish | 1,610 | 1.2% |
| Serbian | 322 | 0.2% |
| Shoshone | 3 | 0.0% |
| Sioux | 3 | 0.0% |
| Slavic | 120 | 0.1% |
| Slovak | 585 | 0.4% |
| Slovene | 217 | 0.2% |
| South African | 7 | 0.0% |
| South American | 156 | 0.1% |
| South American Indian | 46 | 0.0% |
| Spaniard | 57 | 0.0% |
| Spanish | 126 | 0.1% |
| Sri Lankan | 22 | 0.0% |
| Subsaharan African | 111 | 0.1% |
| Swedish | 2,533 | 1.8% |
| Swiss | 927 | 0.7% |
| Thai | 694 | 0.5% |
| Ukrainian | 112 | 0.1% |
| Venezuelan | 33 | 0.0% |
| Welsh | 655 | 0.5% |
| Yugoslavian | 248 | 0.2% | View All 106 Rows |
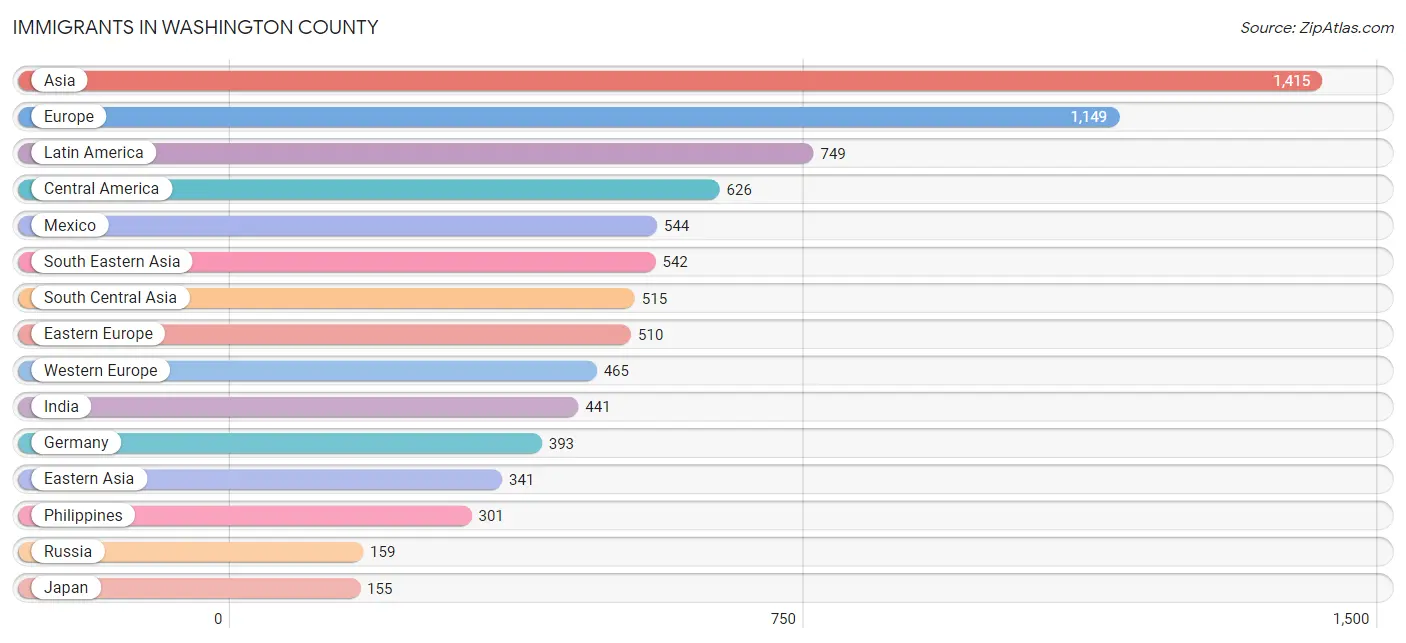
Immigrants in Washington County
The most numerous immigrant groups reported in Washington County came from Asia (1,415 | 1.0%), Europe (1,149 | 0.8%), Latin America (749 | 0.5%), Central America (626 | 0.5%), and Mexico (544 | 0.4%), together accounting for 3.3% of all Washington County residents.
| Immigration Origin | # Population | % Population |
| Africa | 75 | 0.1% |
| Argentina | 46 | 0.0% |
| Asia | 1,415 | 1.0% |
| Australia | 13 | 0.0% |
| Austria | 65 | 0.1% |
| Belgium | 7 | 0.0% |
| Bosnia and Herzegovina | 72 | 0.1% |
| Brazil | 16 | 0.0% |
| Bulgaria | 24 | 0.0% |
| Canada | 59 | 0.0% |
| Caribbean | 53 | 0.0% |
| Central America | 626 | 0.5% |
| China | 128 | 0.1% |
| Colombia | 8 | 0.0% |
| Croatia | 13 | 0.0% |
| Cuba | 6 | 0.0% |
| Czechoslovakia | 37 | 0.0% |
| Eastern Africa | 53 | 0.0% |
| Eastern Asia | 341 | 0.3% |
| Eastern Europe | 510 | 0.4% |
| Egypt | 5 | 0.0% |
| England | 34 | 0.0% |
| Ethiopia | 25 | 0.0% |
| Europe | 1,149 | 0.8% |
| Germany | 393 | 0.3% |
| Greece | 12 | 0.0% |
| Guatemala | 78 | 0.1% |
| India | 441 | 0.3% |
| Iran | 3 | 0.0% |
| Italy | 2 | 0.0% |
| Jamaica | 14 | 0.0% |
| Japan | 155 | 0.1% |
| Kenya | 3 | 0.0% |
| Korea | 49 | 0.0% |
| Kuwait | 7 | 0.0% |
| Laos | 112 | 0.1% |
| Latin America | 749 | 0.5% |
| Latvia | 13 | 0.0% |
| Lithuania | 8 | 0.0% |
| Malaysia | 22 | 0.0% |
| Mexico | 544 | 0.4% |
| Nepal | 68 | 0.1% |
| Northern Africa | 22 | 0.0% |
| Northern Europe | 130 | 0.1% |
| Norway | 19 | 0.0% |
| Oceania | 13 | 0.0% |
| Pakistan | 3 | 0.0% |
| Panama | 4 | 0.0% |
| Philippines | 301 | 0.2% |
| Poland | 62 | 0.1% |
| Romania | 26 | 0.0% |
| Russia | 159 | 0.1% |
| Scotland | 8 | 0.0% |
| South America | 70 | 0.1% |
| South Central Asia | 515 | 0.4% |
| South Eastern Asia | 542 | 0.4% |
| Southern Europe | 44 | 0.0% |
| Spain | 30 | 0.0% |
| Taiwan | 16 | 0.0% |
| Thailand | 38 | 0.0% |
| Trinidad and Tobago | 33 | 0.0% |
| Uganda | 25 | 0.0% |
| Ukraine | 48 | 0.0% |
| Vietnam | 69 | 0.1% |
| Western Asia | 17 | 0.0% |
| Western Europe | 465 | 0.3% | View All 66 Rows |
Sex and Age in Washington County
Sex and Age in Washington County
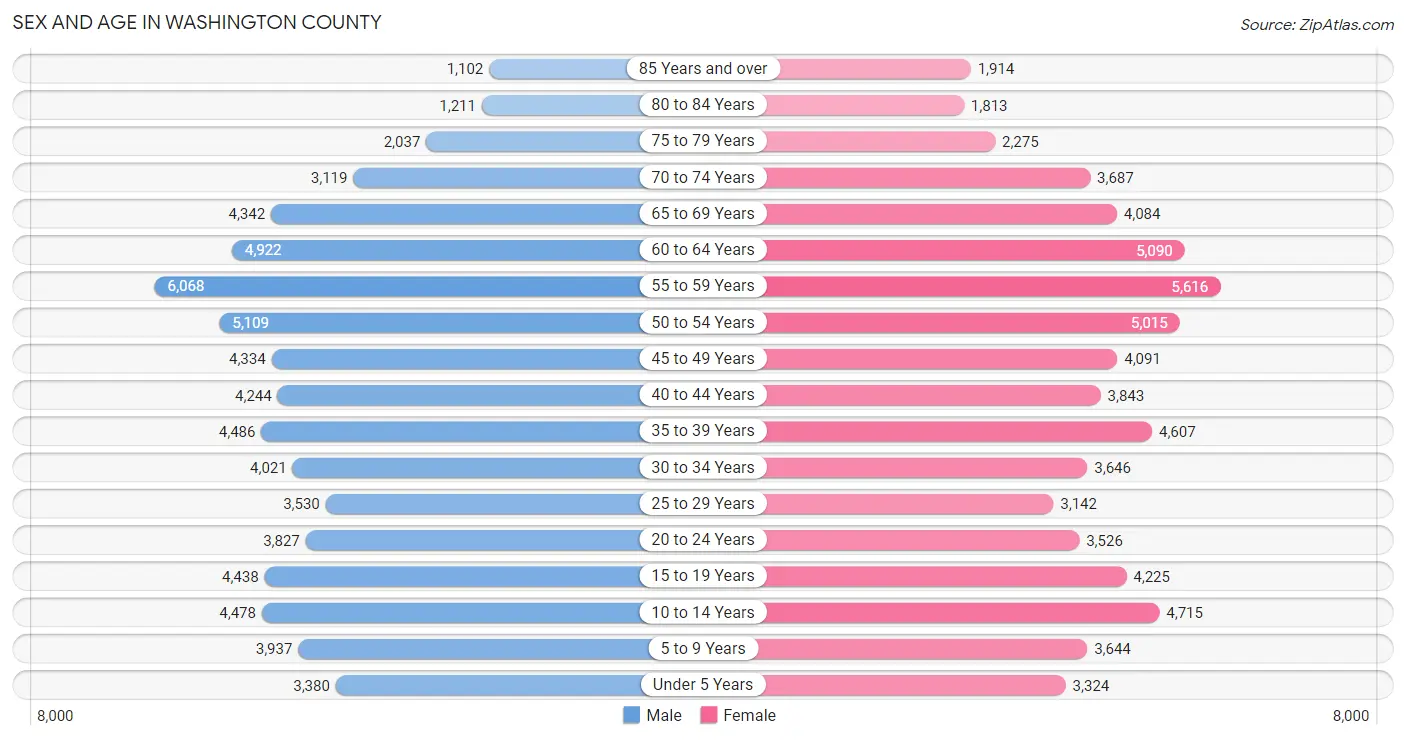
The most populous age groups in Washington County are 55 to 59 Years (6,068 | 8.8%) for men and 55 to 59 Years (5,616 | 8.2%) for women.
| Age Bracket | Male | Female |
| Under 5 Years | 3,380 (4.9%) | 3,324 (4.9%) |
| 5 to 9 Years | 3,937 (5.7%) | 3,644 (5.3%) |
| 10 to 14 Years | 4,478 (6.5%) | 4,715 (6.9%) |
| 15 to 19 Years | 4,438 (6.5%) | 4,225 (6.2%) |
| 20 to 24 Years | 3,827 (5.6%) | 3,526 (5.2%) |
| 25 to 29 Years | 3,530 (5.1%) | 3,142 (4.6%) |
| 30 to 34 Years | 4,021 (5.9%) | 3,646 (5.3%) |
| 35 to 39 Years | 4,486 (6.5%) | 4,607 (6.8%) |
| 40 to 44 Years | 4,244 (6.2%) | 3,843 (5.6%) |
| 45 to 49 Years | 4,334 (6.3%) | 4,091 (6.0%) |
| 50 to 54 Years | 5,109 (7.4%) | 5,015 (7.3%) |
| 55 to 59 Years | 6,068 (8.8%) | 5,616 (8.2%) |
| 60 to 64 Years | 4,922 (7.2%) | 5,090 (7.5%) |
| 65 to 69 Years | 4,342 (6.3%) | 4,084 (6.0%) |
| 70 to 74 Years | 3,119 (4.5%) | 3,687 (5.4%) |
| 75 to 79 Years | 2,037 (3.0%) | 2,275 (3.3%) |
| 80 to 84 Years | 1,211 (1.8%) | 1,813 (2.7%) |
| 85 Years and over | 1,102 (1.6%) | 1,914 (2.8%) |
| Total | 68,585 (100.0%) | 68,257 (100.0%) |
Families and Households in Washington County
Median Family Size in Washington County
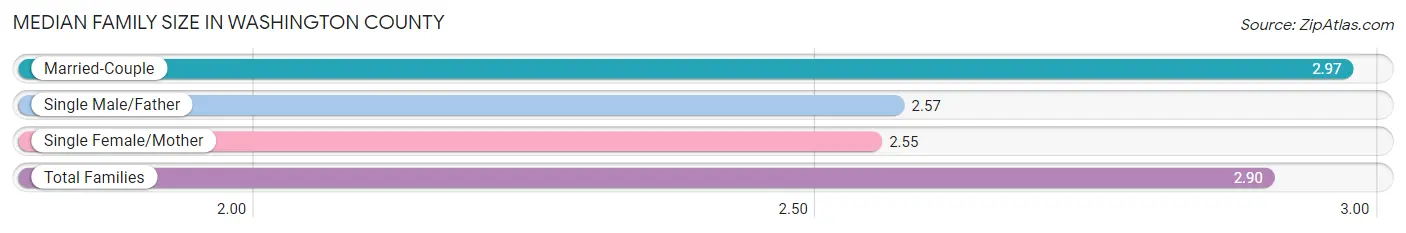
The median family size in Washington County is 2.90 persons per family, with married-couple families (32,215 | 83.0%) accounting for the largest median family size of 2.97 persons per family. On the other hand, single female/mother families (4,395 | 11.3%) represent the smallest median family size with 2.55 persons per family.
| Family Type | # Families | Family Size |
| Married-Couple | 32,215 (83.0%) | 2.97 |
| Single Male/Father | 2,198 (5.7%) | 2.57 |
| Single Female/Mother | 4,395 (11.3%) | 2.55 |
| Total Families | 38,808 (100.0%) | 2.90 |
Median Household Size in Washington County
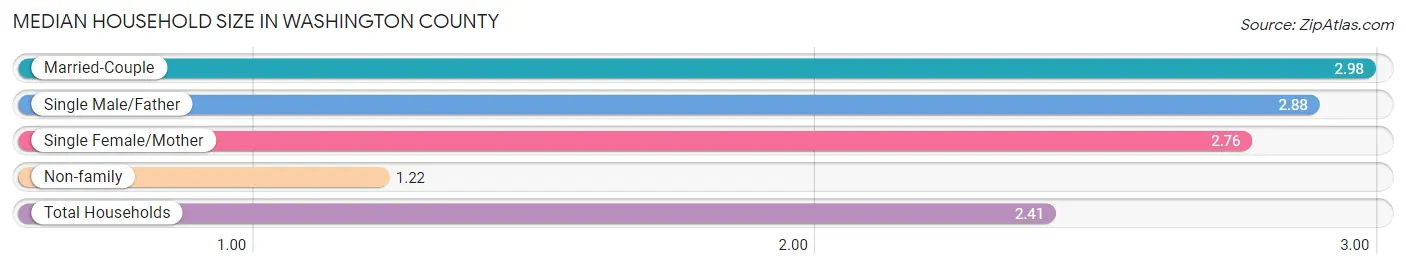
The median household size in Washington County is 2.41 persons per household, with married-couple households (32,215 | 57.2%) accounting for the largest median household size of 2.98 persons per household. non-family households (17,471 | 31.0%) represent the smallest median household size with 1.22 persons per household.
| Household Type | # Households | Household Size |
| Married-Couple | 32,215 (57.2%) | 2.98 |
| Single Male/Father | 2,198 (3.9%) | 2.88 |
| Single Female/Mother | 4,395 (7.8%) | 2.76 |
| Non-family | 17,471 (31.0%) | 1.22 |
| Total Households | 56,279 (100.0%) | 2.41 |
Household Size by Marriage Status in Washington County
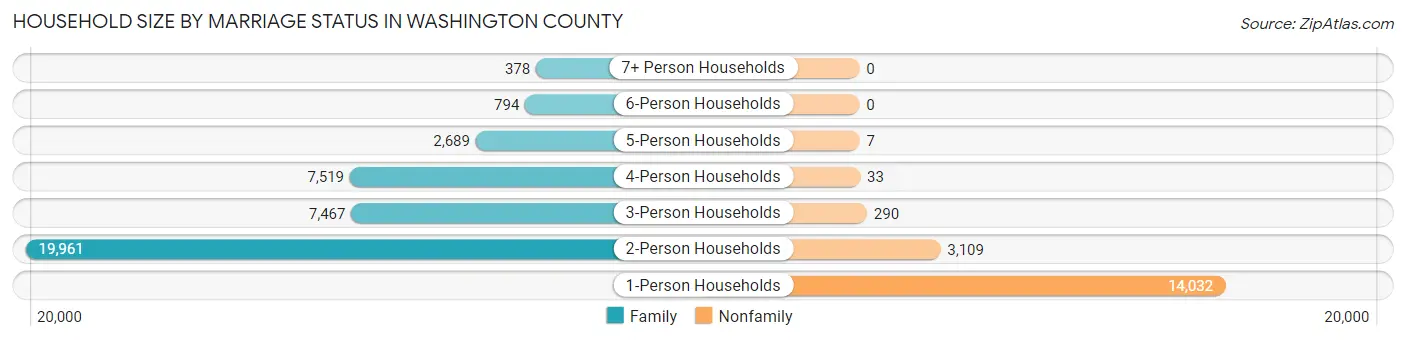
Out of a total of 56,279 households in Washington County, 38,808 (69.0%) are family households, while 17,471 (31.0%) are nonfamily households. The most numerous type of family households are 2-person households, comprising 19,961, and the most common type of nonfamily households are 1-person households, comprising 14,032.
| Household Size | Family Households | Nonfamily Households |
| 1-Person Households | - | 14,032 (24.9%) |
| 2-Person Households | 19,961 (35.5%) | 3,109 (5.5%) |
| 3-Person Households | 7,467 (13.3%) | 290 (0.5%) |
| 4-Person Households | 7,519 (13.4%) | 33 (0.1%) |
| 5-Person Households | 2,689 (4.8%) | 7 (0.0%) |
| 6-Person Households | 794 (1.4%) | 0 (0.0%) |
| 7+ Person Households | 378 (0.7%) | 0 (0.0%) |
| Total | 38,808 (69.0%) | 17,471 (31.0%) |
Female Fertility in Washington County
Fertility by Age in Washington County
Average fertility rate in Washington County is 51.0 births per 1,000 women. Women in the age bracket of 20 to 34 years have the highest fertility rate with 102.0 births per 1,000 women. Women in the age bracket of 20 to 34 years acount for 74.5% of all women with births.
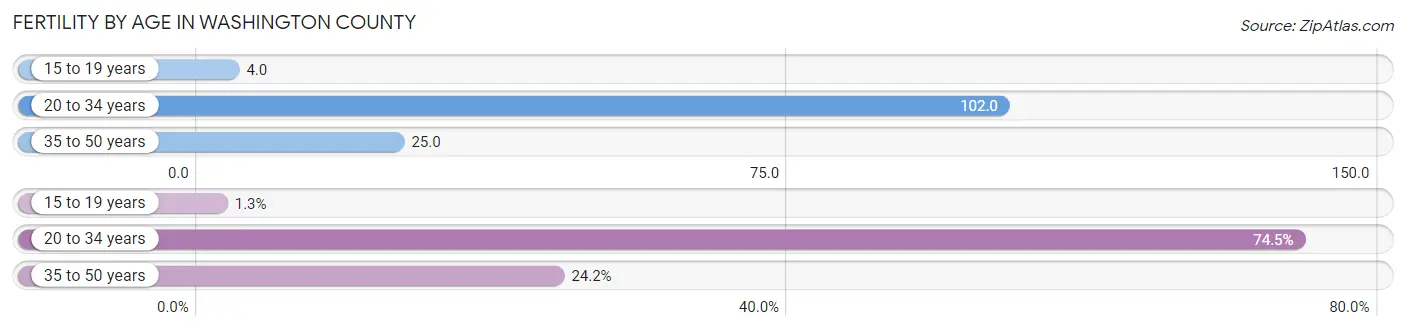
| Age Bracket | Women with Births | Births / 1,000 Women |
| 15 to 19 years | 19 (1.3%) | 4.0 |
| 20 to 34 years | 1,053 (74.5%) | 102.0 |
| 35 to 50 years | 342 (24.2%) | 25.0 |
| Total | 1,414 (100.0%) | 51.0 |
Fertility by Age by Marriage Status in Washington County
83.2% of women with births (1,414) in Washington County are married. The highest percentage of unmarried women with births falls into 15 to 19 years age bracket with 100.0% of them unmarried at the time of birth, while the lowest percentage of unmarried women with births belong to 20 to 34 years age bracket with 12.4% of them unmarried.
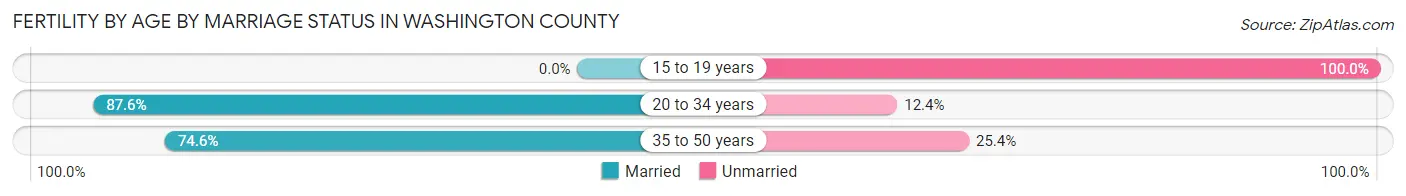
| Age Bracket | Married | Unmarried |
| 15 to 19 years | 0 (0.0%) | 19 (100.0%) |
| 20 to 34 years | 922 (87.6%) | 131 (12.4%) |
| 35 to 50 years | 255 (74.6%) | 87 (25.4%) |
| Total | 1,176 (83.2%) | 238 (16.8%) |
Fertility by Education in Washington County
Average fertility rate in Washington County is 51.0 births per 1,000 women. Women with the education attainment of graduate degree have the highest fertility rate of 73.0 births per 1,000 women, while women with the education attainment of less than high school have the lowest fertility at 5.0 births per 1,000 women. Women with the education attainment of bachelor's degree represent 38.4% of all women with births.
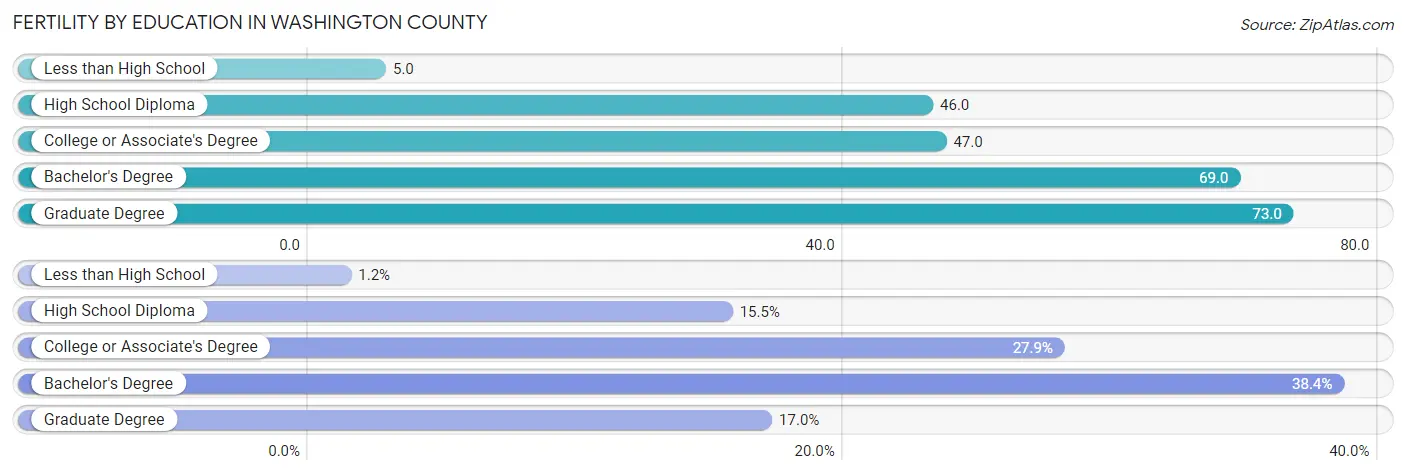
| Educational Attainment | Women with Births | Births / 1,000 Women |
| Less than High School | 17 (1.2%) | 5.0 |
| High School Diploma | 219 (15.5%) | 46.0 |
| College or Associate's Degree | 395 (27.9%) | 47.0 |
| Bachelor's Degree | 543 (38.4%) | 69.0 |
| Graduate Degree | 240 (17.0%) | 73.0 |
| Total | 1,414 (100.0%) | 51.0 |
Fertility by Education by Marriage Status in Washington County
16.8% of women with births in Washington County are unmarried. Women with the educational attainment of college or associate's degree are most likely to be married with 87.6% of them married at childbirth, while women with the educational attainment of less than high school are least likely to be married with 100.0% of them unmarried at childbirth.
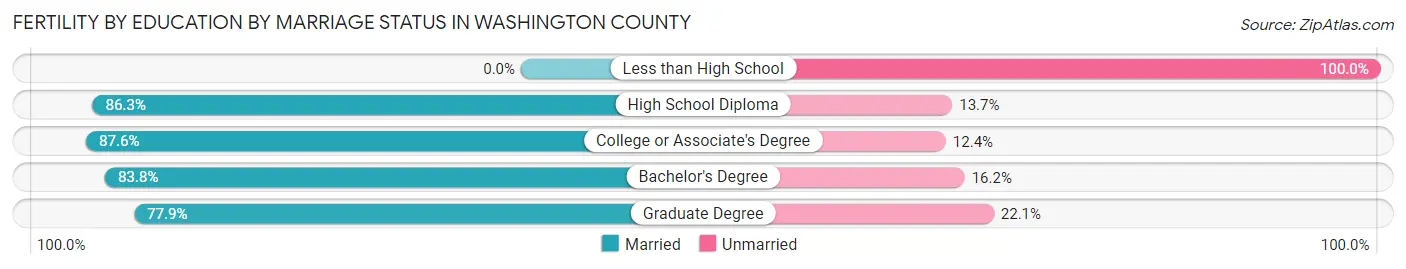
| Educational Attainment | Married | Unmarried |
| Less than High School | 0 (0.0%) | 17 (100.0%) |
| High School Diploma | 189 (86.3%) | 30 (13.7%) |
| College or Associate's Degree | 346 (87.6%) | 49 (12.4%) |
| Bachelor's Degree | 455 (83.8%) | 88 (16.2%) |
| Graduate Degree | 187 (77.9%) | 53 (22.1%) |
| Total | 1,176 (83.2%) | 238 (16.8%) |
Income in Washington County
Income Overview in Washington County
Per Capita Income in Washington County is $45,821, while median incomes of families and households are $108,427 and $91,915 respectively.
| Characteristic | Number | Measure |
| Per Capita Income | 136,842 | $45,821 |
| Median Family Income | 38,808 | $108,427 |
| Mean Family Income | 38,808 | $128,566 |
| Median Household Income | 56,279 | $91,915 |
| Mean Household Income | 56,279 | $109,392 |
| Income Deficit | 38,808 | $11,041 |
| Wage / Income Gap (%) | 136,842 | 28.47% |
| Wage / Income Gap ($) | 136,842 | 71.53¢ per $1 |
| Gini / Inequality Index | 136,842 | 0.40 |
Earnings by Sex in Washington County
Average Earnings in Washington County are $51,282, $59,606 for men and $42,637 for women, a difference of 28.5%.
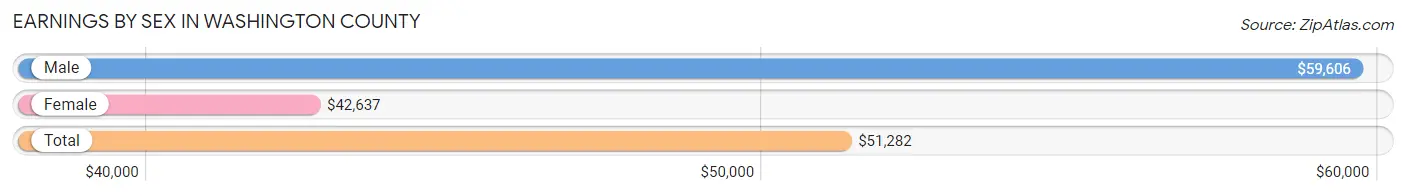
| Sex | Number | Average Earnings |
| Male | 42,874 (53.1%) | $59,606 |
| Female | 37,820 (46.9%) | $42,637 |
| Total | 80,694 (100.0%) | $51,282 |
Earnings by Sex by Income Bracket in Washington County
The most common earnings brackets in Washington County are $100,000+ for men (8,903 | 20.8%) and $75,000 to $99,999 for women (4,037 | 10.7%).
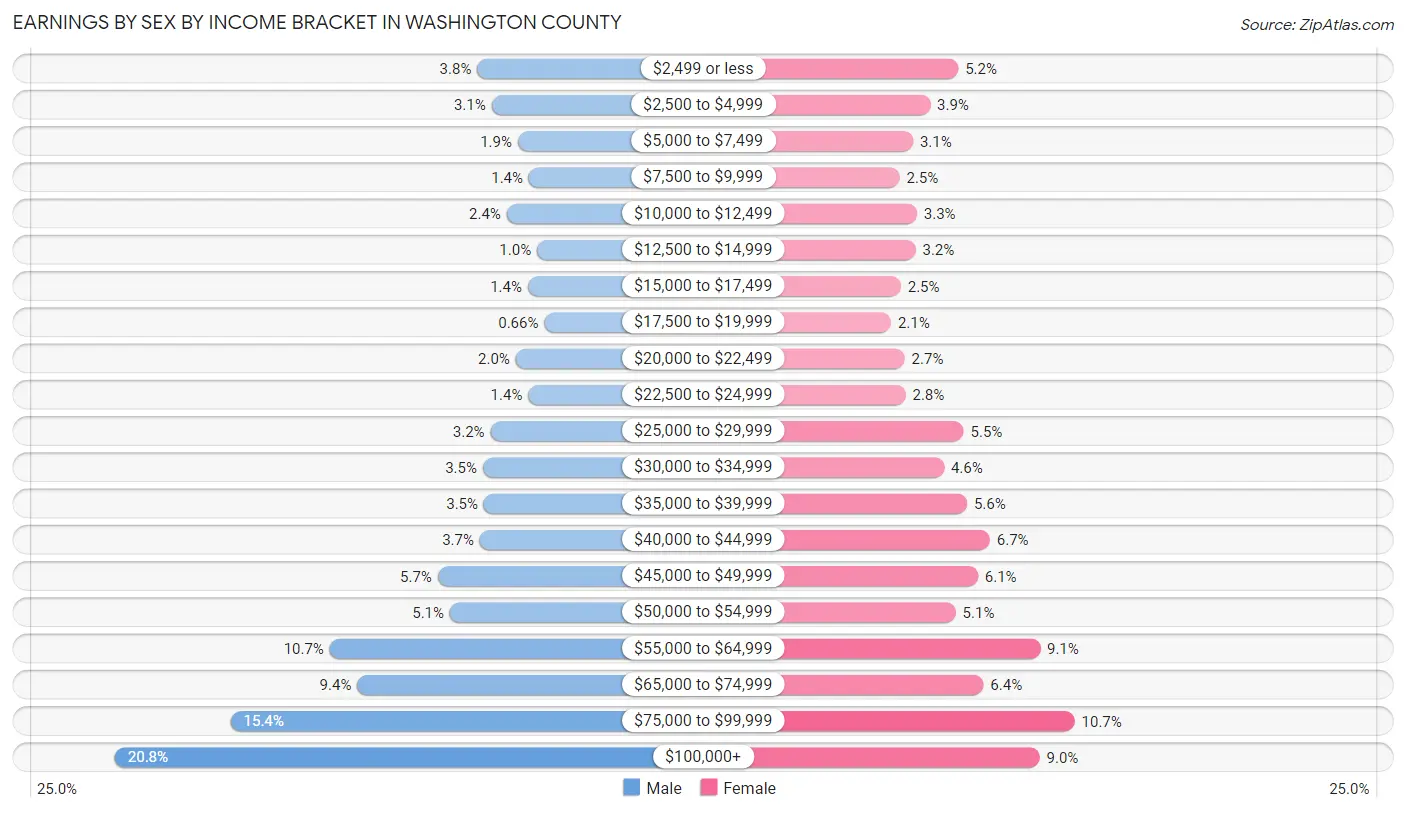
| Income | Male | Female |
| $2,499 or less | 1,630 (3.8%) | 1,973 (5.2%) |
| $2,500 to $4,999 | 1,340 (3.1%) | 1,474 (3.9%) |
| $5,000 to $7,499 | 816 (1.9%) | 1,172 (3.1%) |
| $7,500 to $9,999 | 592 (1.4%) | 936 (2.5%) |
| $10,000 to $12,499 | 1,037 (2.4%) | 1,240 (3.3%) |
| $12,500 to $14,999 | 428 (1.0%) | 1,219 (3.2%) |
| $15,000 to $17,499 | 615 (1.4%) | 958 (2.5%) |
| $17,500 to $19,999 | 285 (0.7%) | 781 (2.1%) |
| $20,000 to $22,499 | 859 (2.0%) | 1,026 (2.7%) |
| $22,500 to $24,999 | 604 (1.4%) | 1,039 (2.8%) |
| $25,000 to $29,999 | 1,364 (3.2%) | 2,067 (5.5%) |
| $30,000 to $34,999 | 1,516 (3.5%) | 1,721 (4.5%) |
| $35,000 to $39,999 | 1,496 (3.5%) | 2,131 (5.6%) |
| $40,000 to $44,999 | 1,579 (3.7%) | 2,535 (6.7%) |
| $45,000 to $49,999 | 2,421 (5.7%) | 2,322 (6.1%) |
| $50,000 to $54,999 | 2,176 (5.1%) | 1,930 (5.1%) |
| $55,000 to $64,999 | 4,590 (10.7%) | 3,423 (9.0%) |
| $65,000 to $74,999 | 4,040 (9.4%) | 2,419 (6.4%) |
| $75,000 to $99,999 | 6,583 (15.3%) | 4,037 (10.7%) |
| $100,000+ | 8,903 (20.8%) | 3,417 (9.0%) |
| Total | 42,874 (100.0%) | 37,820 (100.0%) |
Earnings by Sex by Educational Attainment in Washington County
Average earnings in Washington County are $66,642 for men and $47,151 for women, a difference of 29.2%. Men with an educational attainment of graduate degree enjoy the highest average annual earnings of $103,661, while those with less than high school education earn the least with $45,205. Women with an educational attainment of graduate degree earn the most with the average annual earnings of $77,641, while those with less than high school education have the smallest earnings of $27,483.
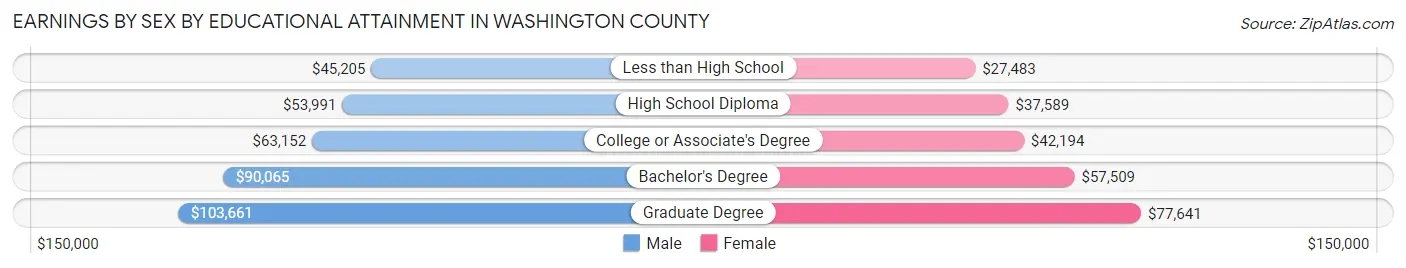
| Educational Attainment | Male Income | Female Income |
| Less than High School | $45,205 | $27,483 |
| High School Diploma | $53,991 | $37,589 |
| College or Associate's Degree | $63,152 | $42,194 |
| Bachelor's Degree | $90,065 | $57,509 |
| Graduate Degree | $103,661 | $77,641 |
| Total | $66,642 | $47,151 |
Family Income in Washington County
Family Income Brackets in Washington County
According to the Washington County family income data, there are 10,711 families falling into the $100,000 to $149,999 income range, which is the most common income bracket and makes up 27.6% of all families. Conversely, the $10,000 to $14,999 income bracket is the least frequent group with only 272 families (0.7%) belonging to this category.
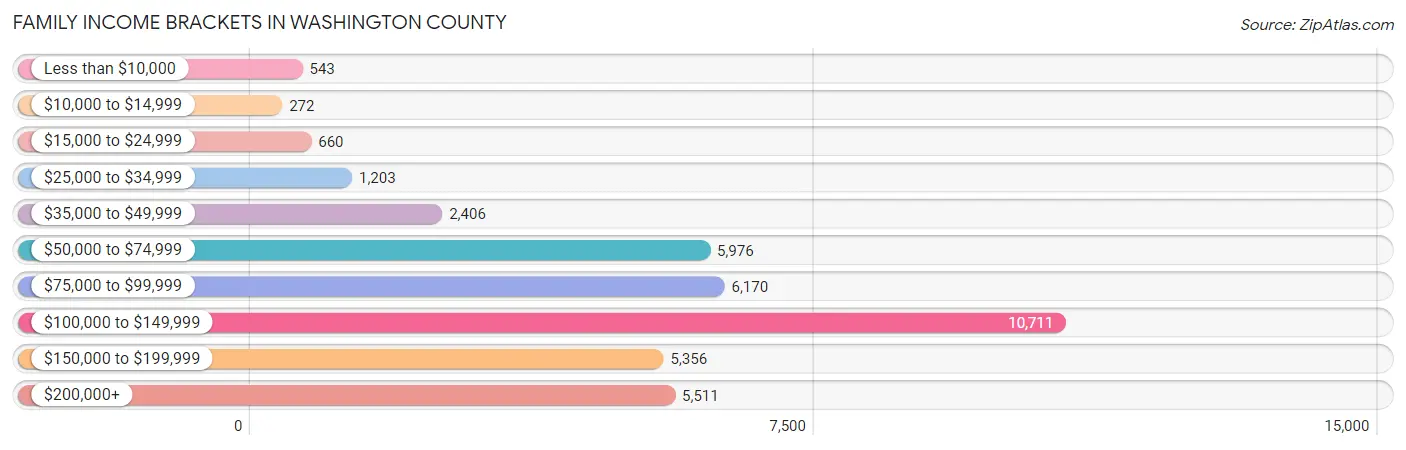
| Income Bracket | # Families | % Families |
| Less than $10,000 | 543 | 1.4% |
| $10,000 to $14,999 | 272 | 0.7% |
| $15,000 to $24,999 | 660 | 1.7% |
| $25,000 to $34,999 | 1,203 | 3.1% |
| $35,000 to $49,999 | 2,406 | 6.2% |
| $50,000 to $74,999 | 5,976 | 15.4% |
| $75,000 to $99,999 | 6,170 | 15.9% |
| $100,000 to $149,999 | 10,711 | 27.6% |
| $150,000 to $199,999 | 5,356 | 13.8% |
| $200,000+ | 5,511 | 14.2% |
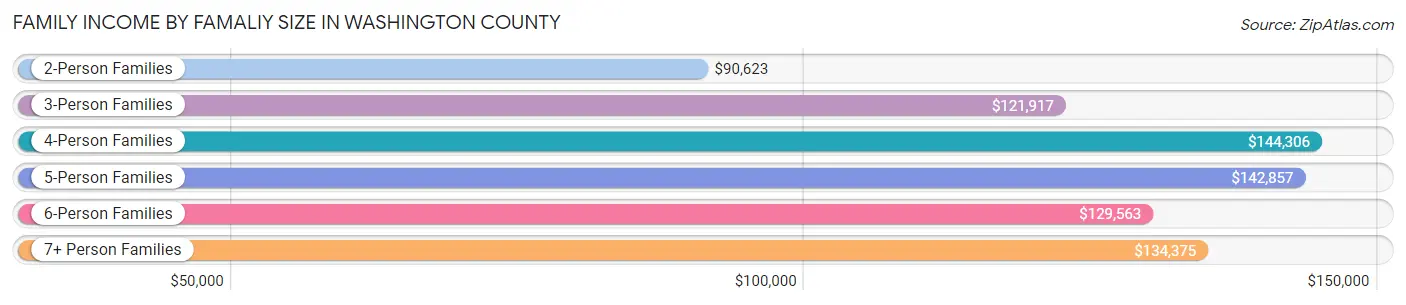
Family Income by Famaliy Size in Washington County
4-person families (7,005 | 18.0%) account for the highest median family income in Washington County with $144,306 per family, while 2-person families (20,813 | 53.6%) have the highest median income of $45,312 per family member.
| Income Bracket | # Families | Median Income |
| 2-Person Families | 20,813 (53.6%) | $90,623 |
| 3-Person Families | 7,305 (18.8%) | $121,917 |
| 4-Person Families | 7,005 (18.0%) | $144,306 |
| 5-Person Families | 2,594 (6.7%) | $142,857 |
| 6-Person Families | 733 (1.9%) | $129,563 |
| 7+ Person Families | 358 (0.9%) | $134,375 |
| Total | 38,808 (100.0%) | $108,427 |
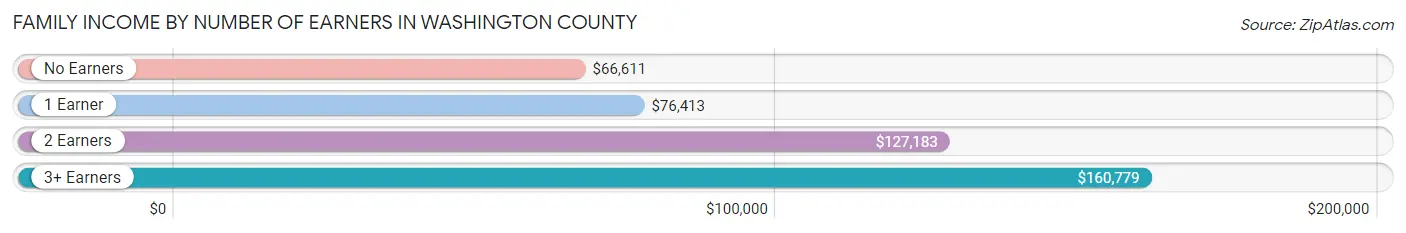
Family Income by Number of Earners in Washington County
The median family income in Washington County is $108,427, with families comprising 3+ earners (5,309) having the highest median family income of $160,779, while families with no earners (5,844) have the lowest median family income of $66,611, accounting for 13.7% and 15.1% of families, respectively.
| Number of Earners | # Families | Median Income |
| No Earners | 5,844 (15.1%) | $66,611 |
| 1 Earner | 9,421 (24.3%) | $76,413 |
| 2 Earners | 18,234 (47.0%) | $127,183 |
| 3+ Earners | 5,309 (13.7%) | $160,779 |
| Total | 38,808 (100.0%) | $108,427 |
Household Income in Washington County
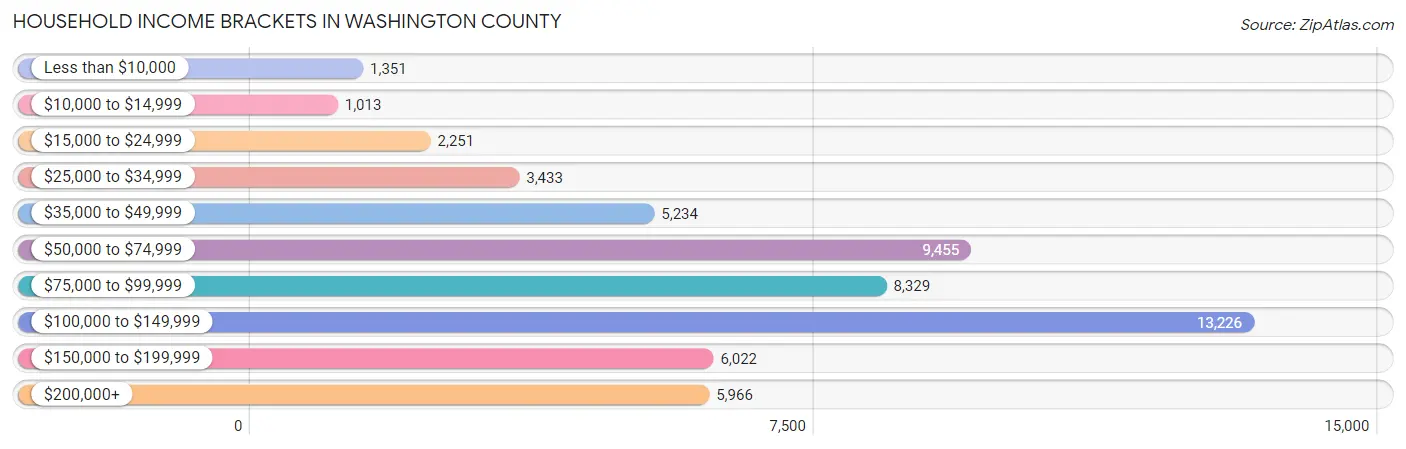
Household Income Brackets in Washington County
With 13,226 households falling in the category, the $100,000 to $149,999 income range is the most frequent in Washington County, accounting for 23.5% of all households. In contrast, only 1,013 households (1.8%) fall into the $10,000 to $14,999 income bracket, making it the least populous group.
| Income Bracket | # Households | % Households |
| Less than $10,000 | 1,351 | 2.4% |
| $10,000 to $14,999 | 1,013 | 1.8% |
| $15,000 to $24,999 | 2,251 | 4.0% |
| $25,000 to $34,999 | 3,433 | 6.1% |
| $35,000 to $49,999 | 5,234 | 9.3% |
| $50,000 to $74,999 | 9,455 | 16.8% |
| $75,000 to $99,999 | 8,329 | 14.8% |
| $100,000 to $149,999 | 13,226 | 23.5% |
| $150,000 to $199,999 | 6,022 | 10.7% |
| $200,000+ | 5,966 | 10.6% |
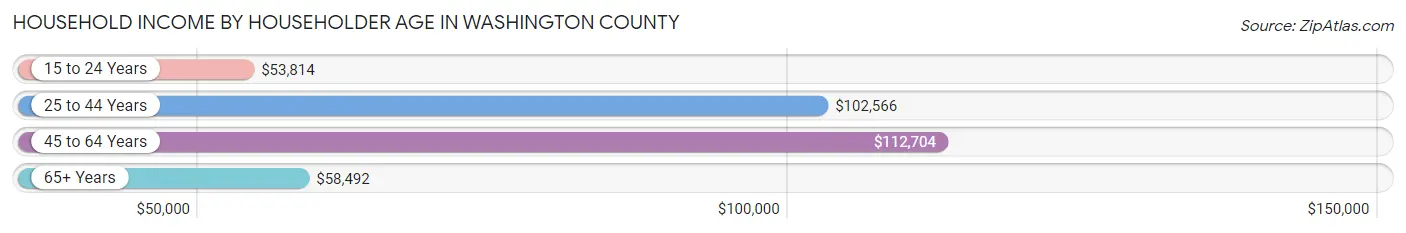
Household Income by Householder Age in Washington County
The median household income in Washington County is $91,915, with the highest median household income of $112,704 found in the 45 to 64 years age bracket for the primary householder. A total of 22,652 households (40.3%) fall into this category. Meanwhile, the 15 to 24 years age bracket for the primary householder has the lowest median household income of $53,814, with 1,575 households (2.8%) in this group.
| Income Bracket | # Households | Median Income |
| 15 to 24 Years | 1,575 (2.8%) | $53,814 |
| 25 to 44 Years | 15,748 (28.0%) | $102,566 |
| 45 to 64 Years | 22,652 (40.3%) | $112,704 |
| 65+ Years | 16,304 (29.0%) | $58,492 |
| Total | 56,279 (100.0%) | $91,915 |
Poverty in Washington County
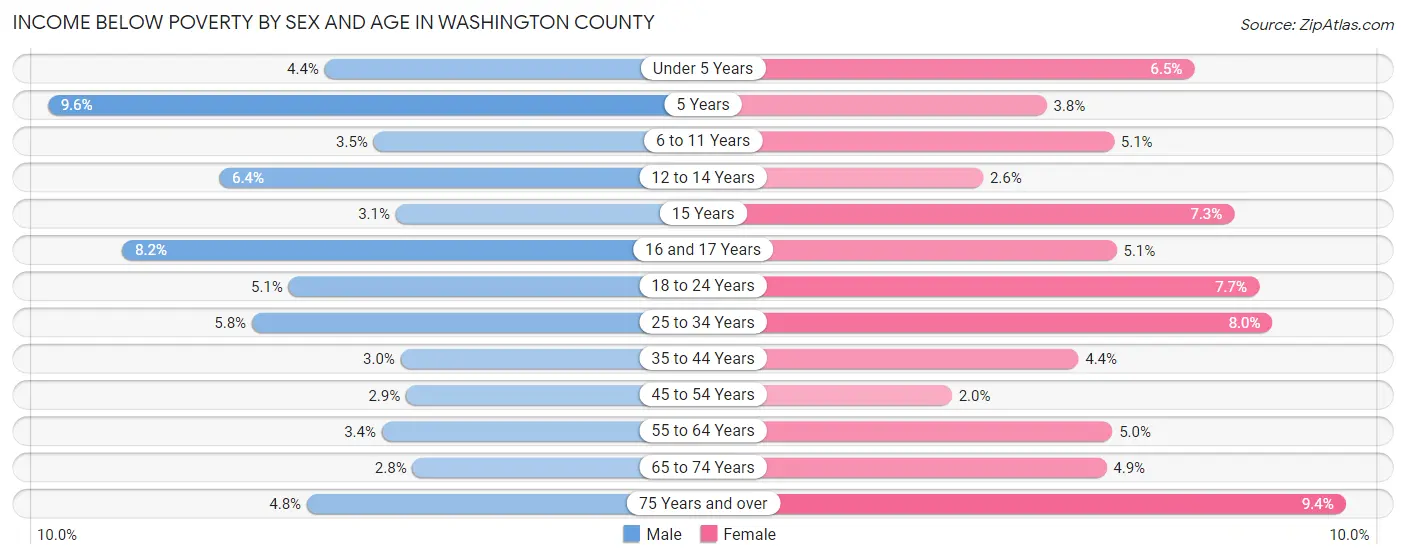
Income Below Poverty by Sex and Age in Washington County
With 4.1% poverty level for males and 5.4% for females among the residents of Washington County, 5 year old males and 75 year old and over females are the most vulnerable to poverty, with 75 males (9.6%) and 538 females (9.3%) in their respective age groups living below the poverty level.
| Age Bracket | Male | Female |
| Under 5 Years | 149 (4.4%) | 213 (6.5%) |
| 5 Years | 75 (9.6%) | 31 (3.8%) |
| 6 to 11 Years | 169 (3.5%) | 240 (5.1%) |
| 12 to 14 Years | 177 (6.4%) | 72 (2.6%) |
| 15 Years | 30 (3.1%) | 64 (7.3%) |
| 16 and 17 Years | 161 (8.2%) | 96 (5.1%) |
| 18 to 24 Years | 271 (5.1%) | 386 (7.7%) |
| 25 to 34 Years | 433 (5.8%) | 542 (8.0%) |
| 35 to 44 Years | 263 (3.0%) | 371 (4.4%) |
| 45 to 54 Years | 275 (2.9%) | 186 (2.0%) |
| 55 to 64 Years | 370 (3.4%) | 537 (5.0%) |
| 65 to 74 Years | 207 (2.8%) | 377 (4.9%) |
| 75 Years and over | 203 (4.8%) | 538 (9.3%) |
| Total | 2,783 (4.1%) | 3,653 (5.4%) |
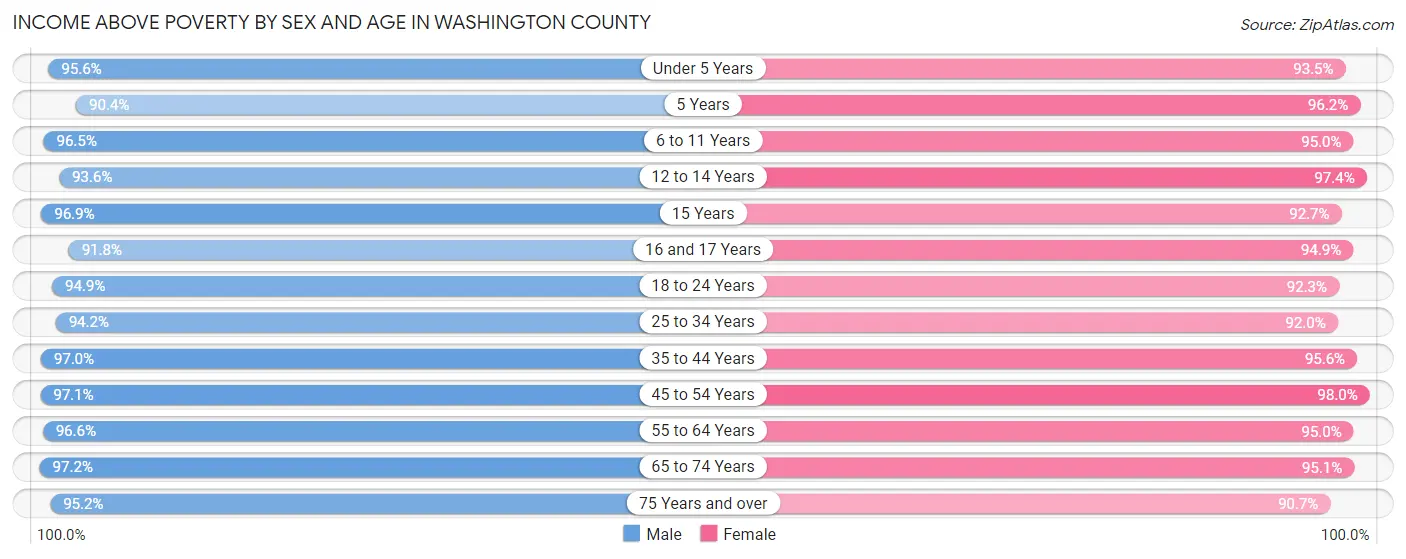
Income Above Poverty by Sex and Age in Washington County
According to the poverty statistics in Washington County, males aged 65 to 74 years and females aged 45 to 54 years are the age groups that are most secure financially, with 97.2% of males and 98.0% of females in these age groups living above the poverty line.
| Age Bracket | Male | Female |
| Under 5 Years | 3,215 (95.6%) | 3,045 (93.5%) |
| 5 Years | 709 (90.4%) | 784 (96.2%) |
| 6 to 11 Years | 4,632 (96.5%) | 4,517 (95.0%) |
| 12 to 14 Years | 2,591 (93.6%) | 2,674 (97.4%) |
| 15 Years | 936 (96.9%) | 815 (92.7%) |
| 16 and 17 Years | 1,804 (91.8%) | 1,787 (94.9%) |
| 18 to 24 Years | 5,038 (94.9%) | 4,603 (92.3%) |
| 25 to 34 Years | 7,052 (94.2%) | 6,245 (92.0%) |
| 35 to 44 Years | 8,441 (97.0%) | 8,079 (95.6%) |
| 45 to 54 Years | 9,150 (97.1%) | 8,914 (98.0%) |
| 55 to 64 Years | 10,597 (96.6%) | 10,164 (95.0%) |
| 65 to 74 Years | 7,199 (97.2%) | 7,308 (95.1%) |
| 75 Years and over | 4,060 (95.2%) | 5,215 (90.6%) |
| Total | 65,424 (95.9%) | 64,150 (94.6%) |
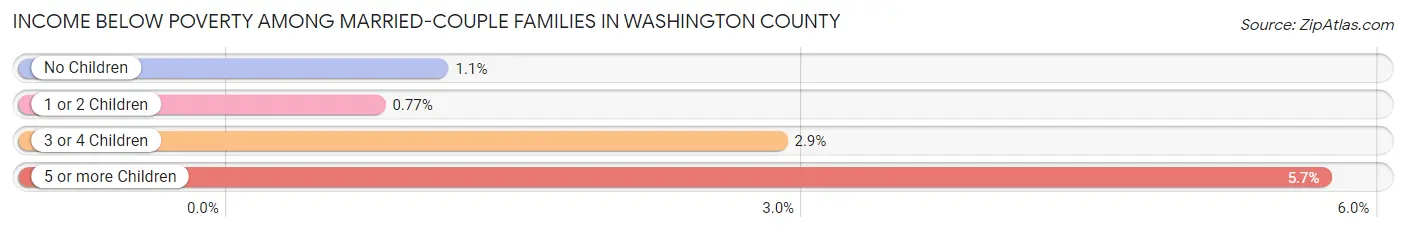
Income Below Poverty Among Married-Couple Families in Washington County
The poverty statistics for married-couple families in Washington County show that 1.2% or 375 of the total 32,215 families live below the poverty line. Families with 5 or more children have the highest poverty rate of 5.7%, comprising of 10 families. On the other hand, families with 1 or 2 children have the lowest poverty rate of 0.8%, which includes 74 families.
| Children | Above Poverty | Below Poverty |
| No Children | 19,707 (98.9%) | 220 (1.1%) |
| 1 or 2 Children | 9,561 (99.2%) | 74 (0.8%) |
| 3 or 4 Children | 2,407 (97.1%) | 71 (2.9%) |
| 5 or more Children | 165 (94.3%) | 10 (5.7%) |
| Total | 31,840 (98.8%) | 375 (1.2%) |
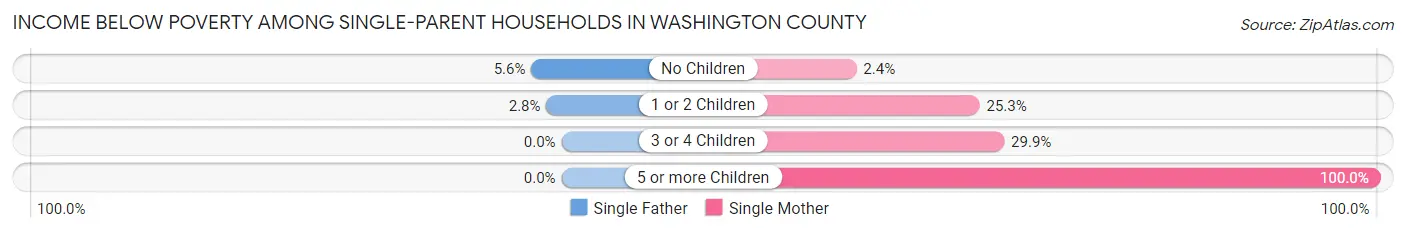
Income Below Poverty Among Single-Parent Households in Washington County
According to the poverty data in Washington County, 3.6% or 80 single-father households and 16.4% or 719 single-mother households are living below the poverty line. Among single-father households, those with no children have the highest poverty rate, with 46 households (5.6%) experiencing poverty. Likewise, among single-mother households, those with 5 or more children have the highest poverty rate, with 8 households (100.0%) falling below the poverty line.
| Children | Single Father | Single Mother |
| No Children | 46 (5.6%) | 42 (2.4%) |
| 1 or 2 Children | 34 (2.8%) | 617 (25.3%) |
| 3 or 4 Children | 0 (0.0%) | 52 (29.9%) |
| 5 or more Children | 0 (0.0%) | 8 (100.0%) |
| Total | 80 (3.6%) | 719 (16.4%) |
Income Below Poverty Among Married-Couple vs Single-Parent Households in Washington County
The poverty data for Washington County shows that 375 of the married-couple family households (1.2%) and 799 of the single-parent households (12.1%) are living below the poverty level. Within the married-couple family households, those with 5 or more children have the highest poverty rate, with 10 households (5.7%) falling below the poverty line. Among the single-parent households, those with 5 or more children have the highest poverty rate, with 8 household (100.0%) living below poverty.
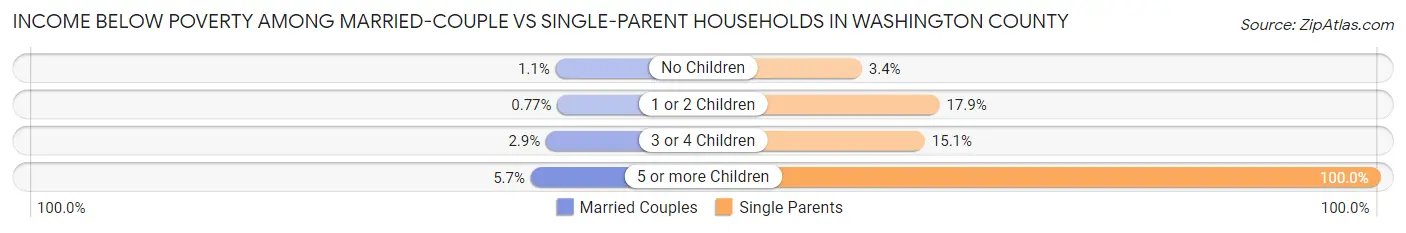
| Children | Married-Couple Families | Single-Parent Households |
| No Children | 220 (1.1%) | 88 (3.4%) |
| 1 or 2 Children | 74 (0.8%) | 651 (17.8%) |
| 3 or 4 Children | 71 (2.9%) | 52 (15.1%) |
| 5 or more Children | 10 (5.7%) | 8 (100.0%) |
| Total | 375 (1.2%) | 799 (12.1%) |
Employment Characteristics in Washington County
Employment by Class of Employer in Washington County
Among the 73,600 employed individuals in Washington County, private company employees (53,988 | 73.4%), not-for-profit organizations (6,542 | 8.9%), and local government employees (5,189 | 7.0%) make up the most common classes of employment.
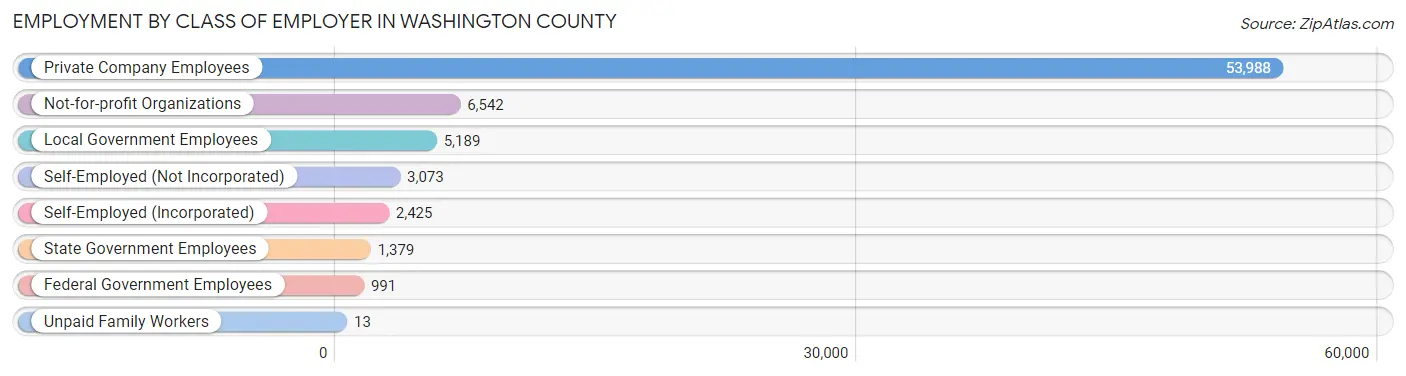
| Employer Class | # Employees | % Employees |
| Private Company Employees | 53,988 | 73.4% |
| Self-Employed (Incorporated) | 2,425 | 3.3% |
| Self-Employed (Not Incorporated) | 3,073 | 4.2% |
| Not-for-profit Organizations | 6,542 | 8.9% |
| Local Government Employees | 5,189 | 7.0% |
| State Government Employees | 1,379 | 1.9% |
| Federal Government Employees | 991 | 1.3% |
| Unpaid Family Workers | 13 | 0.0% |
| Total | 73,600 | 100.0% |
Employment Status by Age in Washington County
According to the labor force statistics for Washington County, out of the total population over 16 years of age (111,518), 69.0% or 76,947 individuals are in the labor force, with 3.1% or 2,385 of them unemployed. The age group with the highest labor force participation rate is 30 to 34 years, with 90.9% or 6,969 individuals in the labor force. Within the labor force, the 16 to 19 years age range has the highest percentage of unemployed individuals, with 9.5% or 416 of them being unemployed.
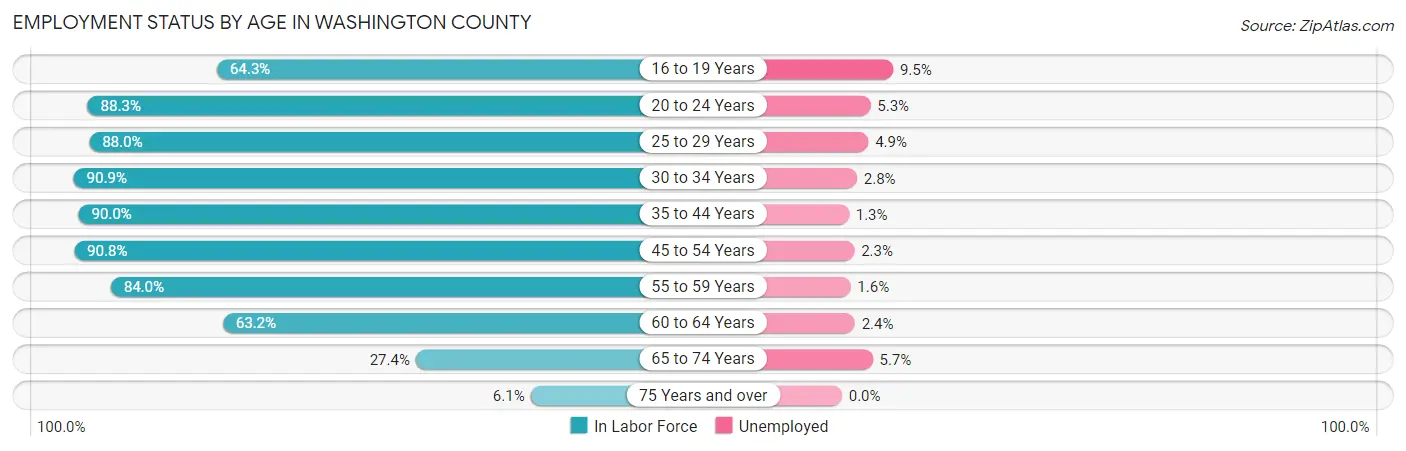
| Age Bracket | In Labor Force | Unemployed |
| 16 to 19 Years | 4,383 (64.3%) | 416 (9.5%) |
| 20 to 24 Years | 6,493 (88.3%) | 344 (5.3%) |
| 25 to 29 Years | 5,871 (88.0%) | 288 (4.9%) |
| 30 to 34 Years | 6,969 (90.9%) | 195 (2.8%) |
| 35 to 44 Years | 15,462 (90.0%) | 201 (1.3%) |
| 45 to 54 Years | 16,842 (90.8%) | 387 (2.3%) |
| 55 to 59 Years | 9,815 (84.0%) | 157 (1.6%) |
| 60 to 64 Years | 6,328 (63.2%) | 152 (2.4%) |
| 65 to 74 Years | 4,174 (27.4%) | 238 (5.7%) |
| 75 Years and over | 631 (6.1%) | 0 (0.0%) |
| Total | 76,947 (69.0%) | 2,385 (3.1%) |
Employment Status by Educational Attainment in Washington County
According to labor force statistics for Washington County, 85.4% of individuals (61,286) out of the total population between 25 and 64 years of age (71,764) are in the labor force, with 2.2% or 1,348 of them being unemployed. The group with the highest labor force participation rate are those with the educational attainment of bachelor's degree or higher, with 90.8% or 24,486 individuals in the labor force. Within the labor force, individuals with less than high school education have the highest percentage of unemployment, with 8.1% or 147 of them being unemployed.

| Educational Attainment | In Labor Force | Unemployed |
| Less than High School | 1,818 (67.4%) | 219 (8.1%) |
| High School Diploma | 14,367 (78.4%) | 733 (4.0%) |
| College / Associate Degree | 20,636 (86.8%) | 428 (1.8%) |
| Bachelor's Degree or higher | 24,486 (90.8%) | 297 (1.1%) |
| Total | 61,286 (85.4%) | 1,579 (2.2%) |
Employment Occupations by Sex in Washington County
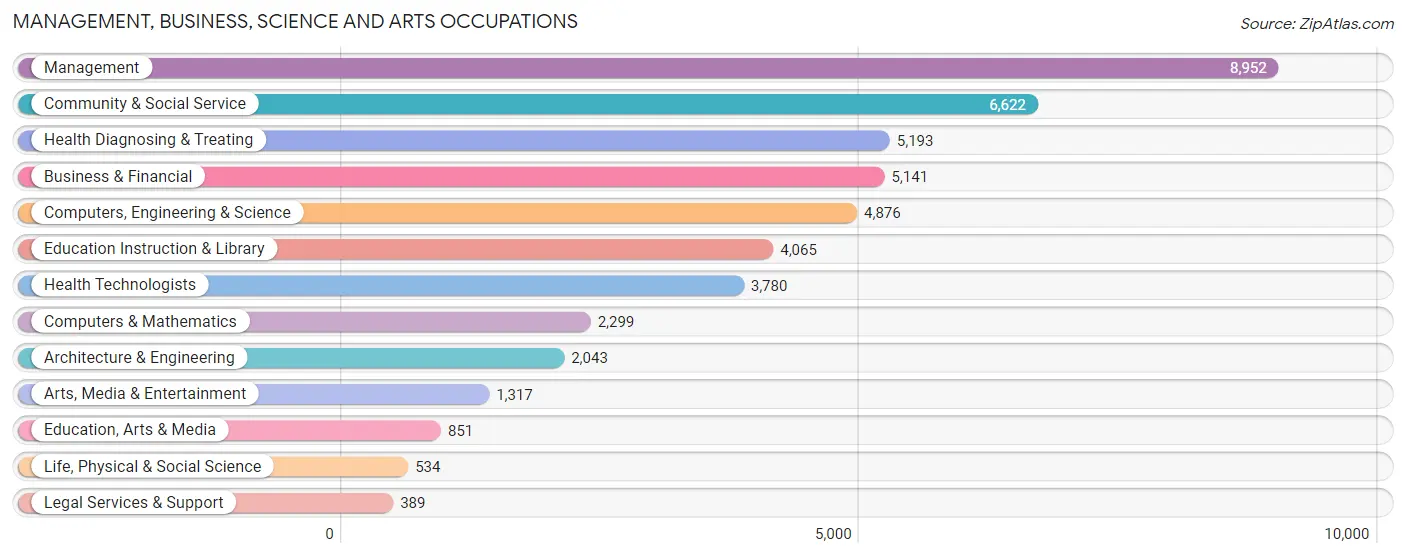
Management, Business, Science and Arts Occupations
The most common Management, Business, Science and Arts occupations in Washington County are Management (8,952 | 12.0%), Community & Social Service (6,622 | 8.9%), Health Diagnosing & Treating (5,193 | 7.0%), Business & Financial (5,141 | 6.9%), and Computers, Engineering & Science (4,876 | 6.5%).
Management, Business, Science and Arts Occupations by Sex
Within the Management, Business, Science and Arts occupations in Washington County, the most male-oriented occupations are Architecture & Engineering (84.8%), Computers, Engineering & Science (77.4%), and Computers & Mathematics (75.1%), while the most female-oriented occupations are Health Technologists (89.4%), Health Diagnosing & Treating (87.5%), and Education Instruction & Library (74.6%).
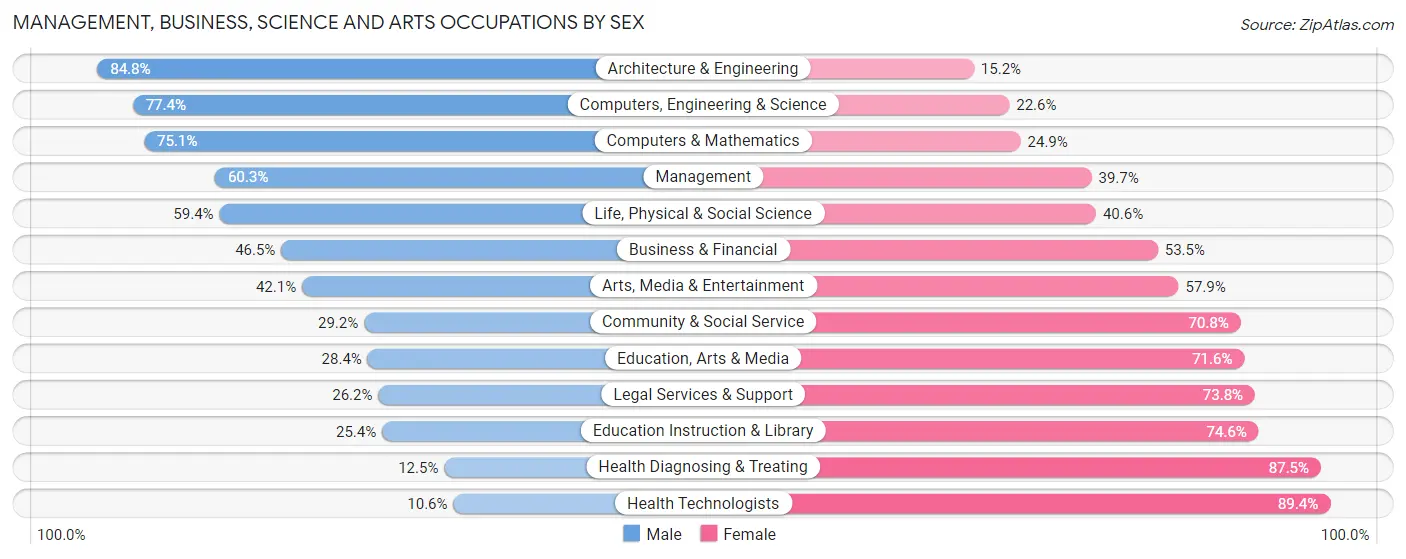
| Occupation | Male | Female |
| Management | 5,396 (60.3%) | 3,556 (39.7%) |
| Business & Financial | 2,389 (46.5%) | 2,752 (53.5%) |
| Computers, Engineering & Science | 3,776 (77.4%) | 1,100 (22.6%) |
| Computers & Mathematics | 1,726 (75.1%) | 573 (24.9%) |
| Architecture & Engineering | 1,733 (84.8%) | 310 (15.2%) |
| Life, Physical & Social Science | 317 (59.4%) | 217 (40.6%) |
| Community & Social Service | 1,933 (29.2%) | 4,689 (70.8%) |
| Education, Arts & Media | 242 (28.4%) | 609 (71.6%) |
| Legal Services & Support | 102 (26.2%) | 287 (73.8%) |
| Education Instruction & Library | 1,034 (25.4%) | 3,031 (74.6%) |
| Arts, Media & Entertainment | 555 (42.1%) | 762 (57.9%) |
| Health Diagnosing & Treating | 647 (12.5%) | 4,546 (87.5%) |
| Health Technologists | 399 (10.6%) | 3,381 (89.4%) |
| Total (Category) | 14,141 (45.9%) | 16,643 (54.1%) |
| Total (Overall) | 39,672 (53.2%) | 34,904 (46.8%) |
Services Occupations
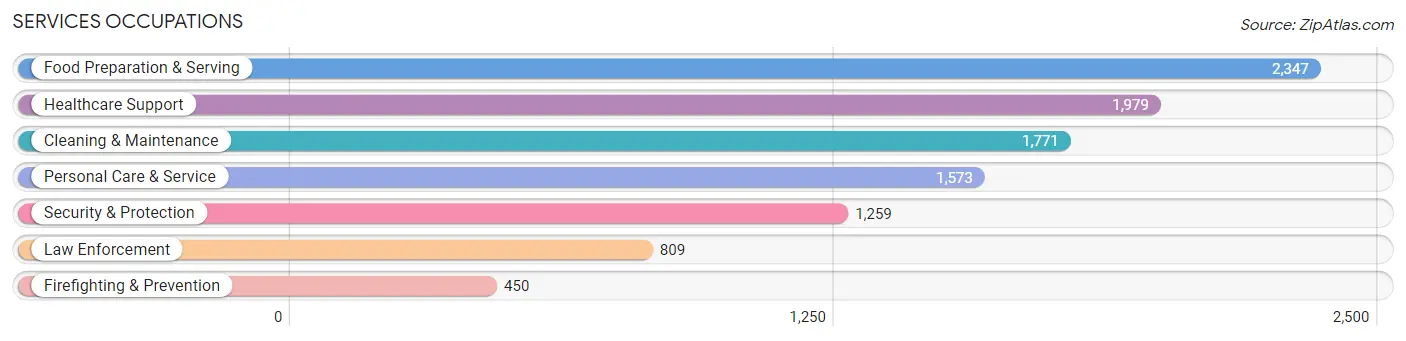
The most common Services occupations in Washington County are Food Preparation & Serving (2,347 | 3.2%), Healthcare Support (1,979 | 2.6%), Cleaning & Maintenance (1,771 | 2.4%), Personal Care & Service (1,573 | 2.1%), and Security & Protection (1,259 | 1.7%).
Services Occupations by Sex
Within the Services occupations in Washington County, the most male-oriented occupations are Law Enforcement (89.9%), Security & Protection (83.5%), and Firefighting & Prevention (72.0%), while the most female-oriented occupations are Personal Care & Service (87.8%), Healthcare Support (86.5%), and Food Preparation & Serving (64.1%).
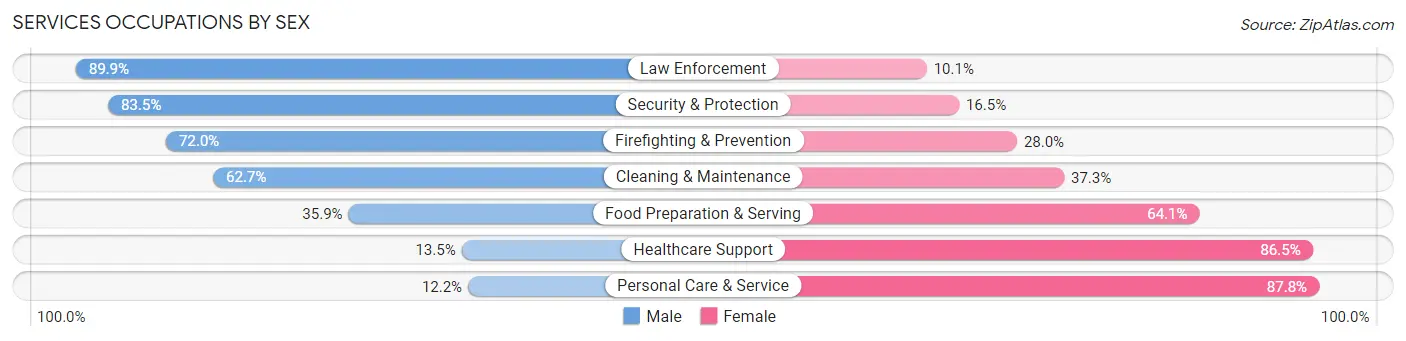
| Occupation | Male | Female |
| Healthcare Support | 267 (13.5%) | 1,712 (86.5%) |
| Security & Protection | 1,051 (83.5%) | 208 (16.5%) |
| Firefighting & Prevention | 324 (72.0%) | 126 (28.0%) |
| Law Enforcement | 727 (89.9%) | 82 (10.1%) |
| Food Preparation & Serving | 842 (35.9%) | 1,505 (64.1%) |
| Cleaning & Maintenance | 1,110 (62.7%) | 661 (37.3%) |
| Personal Care & Service | 192 (12.2%) | 1,381 (87.8%) |
| Total (Category) | 3,462 (38.8%) | 5,467 (61.2%) |
| Total (Overall) | 39,672 (53.2%) | 34,904 (46.8%) |
Sales and Office Occupations
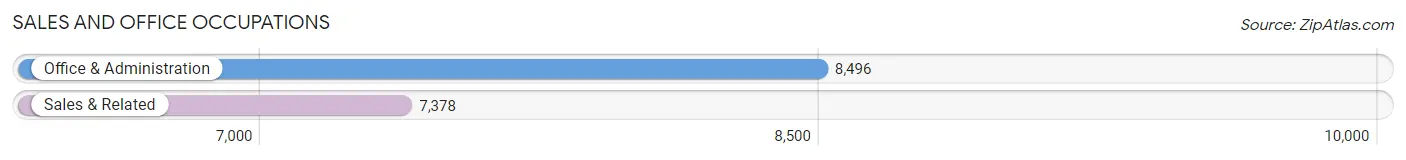
The most common Sales and Office occupations in Washington County are Office & Administration (8,496 | 11.4%), and Sales & Related (7,378 | 9.9%).
Sales and Office Occupations by Sex
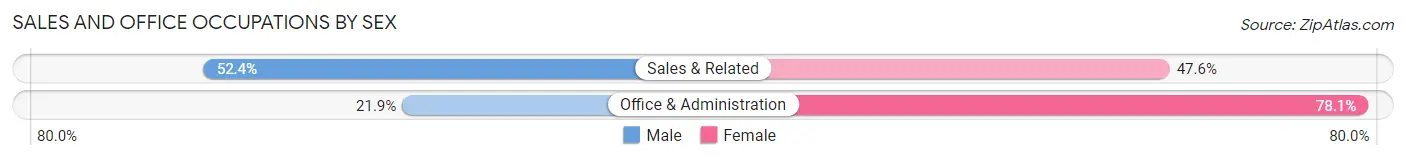
| Occupation | Male | Female |
| Sales & Related | 3,868 (52.4%) | 3,510 (47.6%) |
| Office & Administration | 1,862 (21.9%) | 6,634 (78.1%) |
| Total (Category) | 5,730 (36.1%) | 10,144 (63.9%) |
| Total (Overall) | 39,672 (53.2%) | 34,904 (46.8%) |
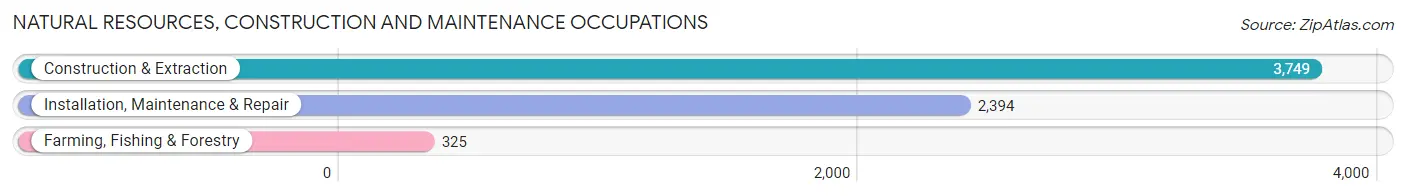
Natural Resources, Construction and Maintenance Occupations
The most common Natural Resources, Construction and Maintenance occupations in Washington County are Construction & Extraction (3,749 | 5.0%), Installation, Maintenance & Repair (2,394 | 3.2%), and Farming, Fishing & Forestry (325 | 0.4%).
Natural Resources, Construction and Maintenance Occupations by Sex
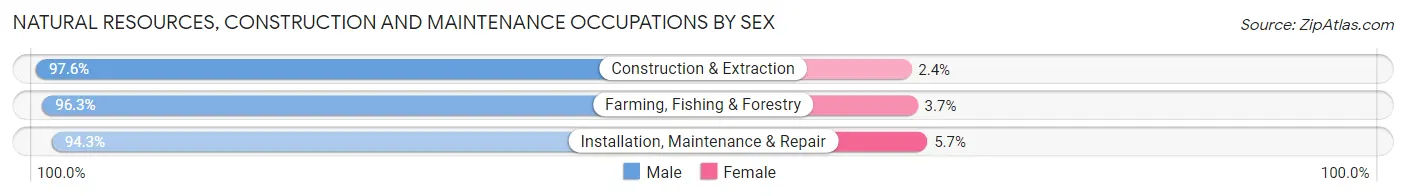
| Occupation | Male | Female |
| Farming, Fishing & Forestry | 313 (96.3%) | 12 (3.7%) |
| Construction & Extraction | 3,660 (97.6%) | 89 (2.4%) |
| Installation, Maintenance & Repair | 2,258 (94.3%) | 136 (5.7%) |
| Total (Category) | 6,231 (96.3%) | 237 (3.7%) |
| Total (Overall) | 39,672 (53.2%) | 34,904 (46.8%) |
Production, Transportation and Moving Occupations
The most common Production, Transportation and Moving occupations in Washington County are Production (8,071 | 10.8%), Material Moving (2,397 | 3.2%), and Transportation (2,053 | 2.8%).

Production, Transportation and Moving Occupations by Sex
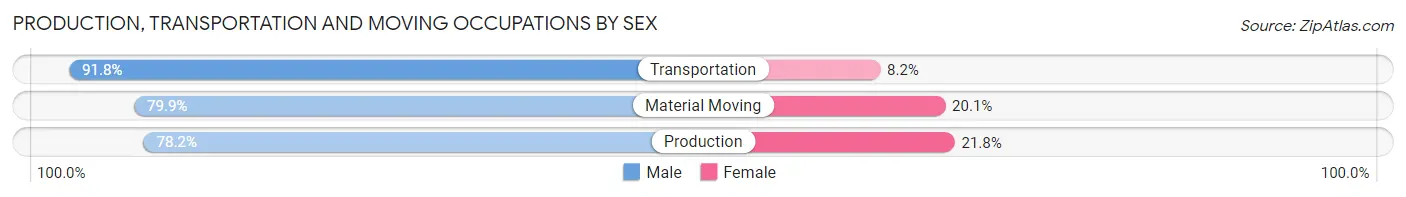
| Occupation | Male | Female |
| Production | 6,308 (78.2%) | 1,763 (21.8%) |
| Transportation | 1,885 (91.8%) | 168 (8.2%) |
| Material Moving | 1,915 (79.9%) | 482 (20.1%) |
| Total (Category) | 10,108 (80.7%) | 2,413 (19.3%) |
| Total (Overall) | 39,672 (53.2%) | 34,904 (46.8%) |
Employment Industries by Sex in Washington County
Employment Industries in Washington County
The major employment industries in Washington County include Manufacturing (17,005 | 22.8%), Health Care & Social Assistance (10,499 | 14.1%), Retail Trade (9,146 | 12.3%), Construction (5,261 | 7.0%), and Educational Services (5,158 | 6.9%).

Employment Industries by Sex in Washington County
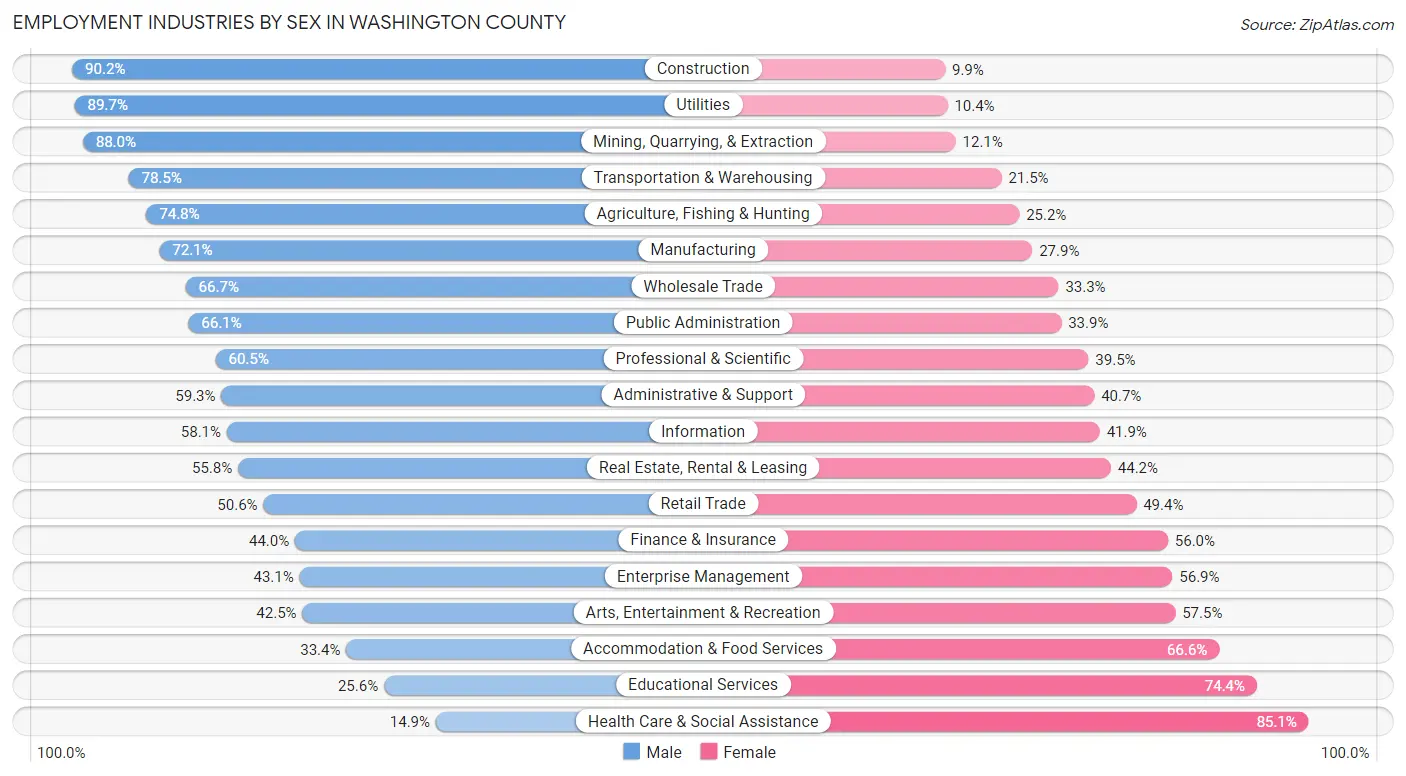
The Washington County industries that see more men than women are Construction (90.1%), Utilities (89.6%), and Mining, Quarrying, & Extraction (87.9%), whereas the industries that tend to have a higher number of women are Health Care & Social Assistance (85.1%), Educational Services (74.4%), and Accommodation & Food Services (66.6%).
| Industry | Male | Female |
| Agriculture, Fishing & Hunting | 632 (74.8%) | 213 (25.2%) |
| Mining, Quarrying, & Extraction | 73 (87.9%) | 10 (12.0%) |
| Construction | 4,743 (90.1%) | 518 (9.9%) |
| Manufacturing | 12,261 (72.1%) | 4,744 (27.9%) |
| Wholesale Trade | 1,676 (66.7%) | 838 (33.3%) |
| Retail Trade | 4,625 (50.6%) | 4,521 (49.4%) |
| Transportation & Warehousing | 1,560 (78.5%) | 428 (21.5%) |
| Utilities | 381 (89.6%) | 44 (10.3%) |
| Information | 658 (58.1%) | 474 (41.9%) |
| Finance & Insurance | 1,771 (44.0%) | 2,252 (56.0%) |
| Real Estate, Rental & Leasing | 556 (55.8%) | 440 (44.2%) |
| Professional & Scientific | 2,510 (60.5%) | 1,641 (39.5%) |
| Enterprise Management | 53 (43.1%) | 70 (56.9%) |
| Administrative & Support | 1,151 (59.3%) | 791 (40.7%) |
| Educational Services | 1,321 (25.6%) | 3,837 (74.4%) |
| Health Care & Social Assistance | 1,562 (14.9%) | 8,937 (85.1%) |
| Arts, Entertainment & Recreation | 490 (42.5%) | 663 (57.5%) |
| Accommodation & Food Services | 982 (33.4%) | 1,957 (66.6%) |
| Public Administration | 1,501 (66.1%) | 770 (33.9%) |
| Total | 39,672 (53.2%) | 34,904 (46.8%) |
Education in Washington County
School Enrollment in Washington County
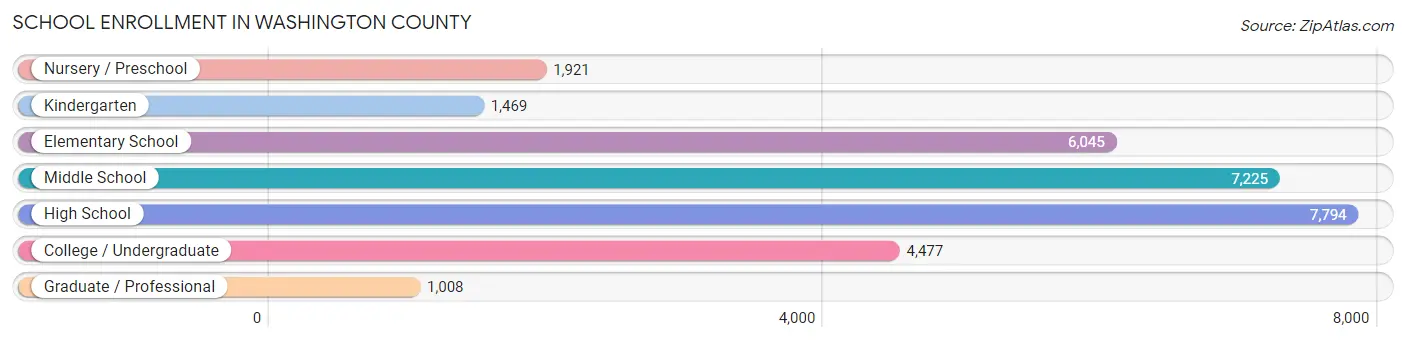
The most common levels of schooling among the 29,939 students in Washington County are high school (7,794 | 26.0%), middle school (7,225 | 24.1%), and elementary school (6,045 | 20.2%).
| School Level | # Students | % Students |
| Nursery / Preschool | 1,921 | 6.4% |
| Kindergarten | 1,469 | 4.9% |
| Elementary School | 6,045 | 20.2% |
| Middle School | 7,225 | 24.1% |
| High School | 7,794 | 26.0% |
| College / Undergraduate | 4,477 | 14.9% |
| Graduate / Professional | 1,008 | 3.4% |
| Total | 29,939 | 100.0% |
School Enrollment by Age by Funding Source in Washington County
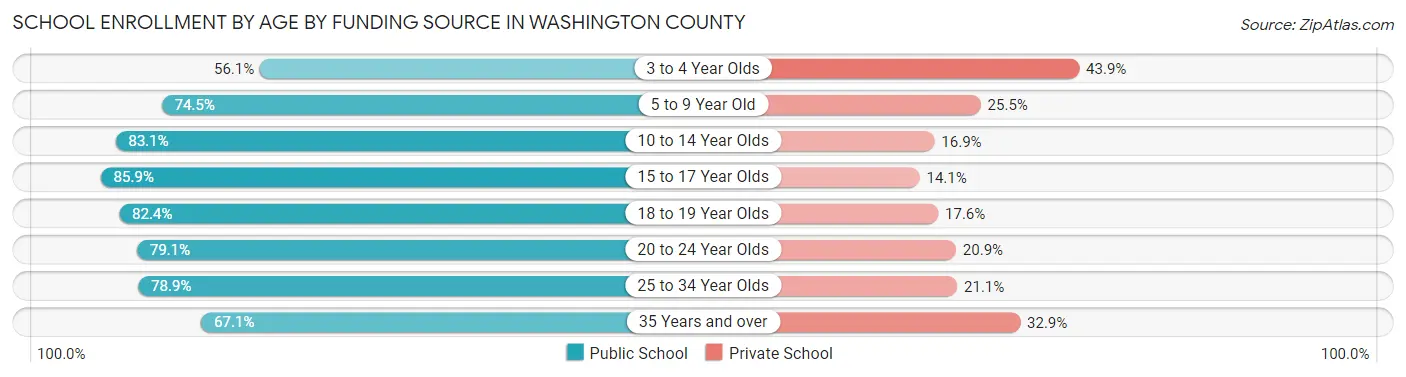
Out of a total of 29,939 students who are enrolled in schools in Washington County, 6,167 (20.6%) attend a private institution, while the remaining 23,772 (79.4%) are enrolled in public schools. The age group of 3 to 4 year olds has the highest likelihood of being enrolled in private schools, with 529 (43.9% in the age bracket) enrolled. Conversely, the age group of 15 to 17 year olds has the lowest likelihood of being enrolled in a private school, with 4,851 (85.9% in the age bracket) attending a public institution.
| Age Bracket | Public School | Private School |
| 3 to 4 Year Olds | 677 (56.1%) | 529 (43.9%) |
| 5 to 9 Year Old | 5,443 (74.5%) | 1,865 (25.5%) |
| 10 to 14 Year Olds | 7,516 (83.1%) | 1,529 (16.9%) |
| 15 to 17 Year Olds | 4,851 (85.9%) | 799 (14.1%) |
| 18 to 19 Year Olds | 1,696 (82.4%) | 362 (17.6%) |
| 20 to 24 Year Olds | 1,865 (79.1%) | 493 (20.9%) |
| 25 to 34 Year Olds | 1,045 (78.9%) | 280 (21.1%) |
| 35 Years and over | 664 (67.1%) | 325 (32.9%) |
| Total | 23,772 (79.4%) | 6,167 (20.6%) |
Educational Attainment by Field of Study in Washington County
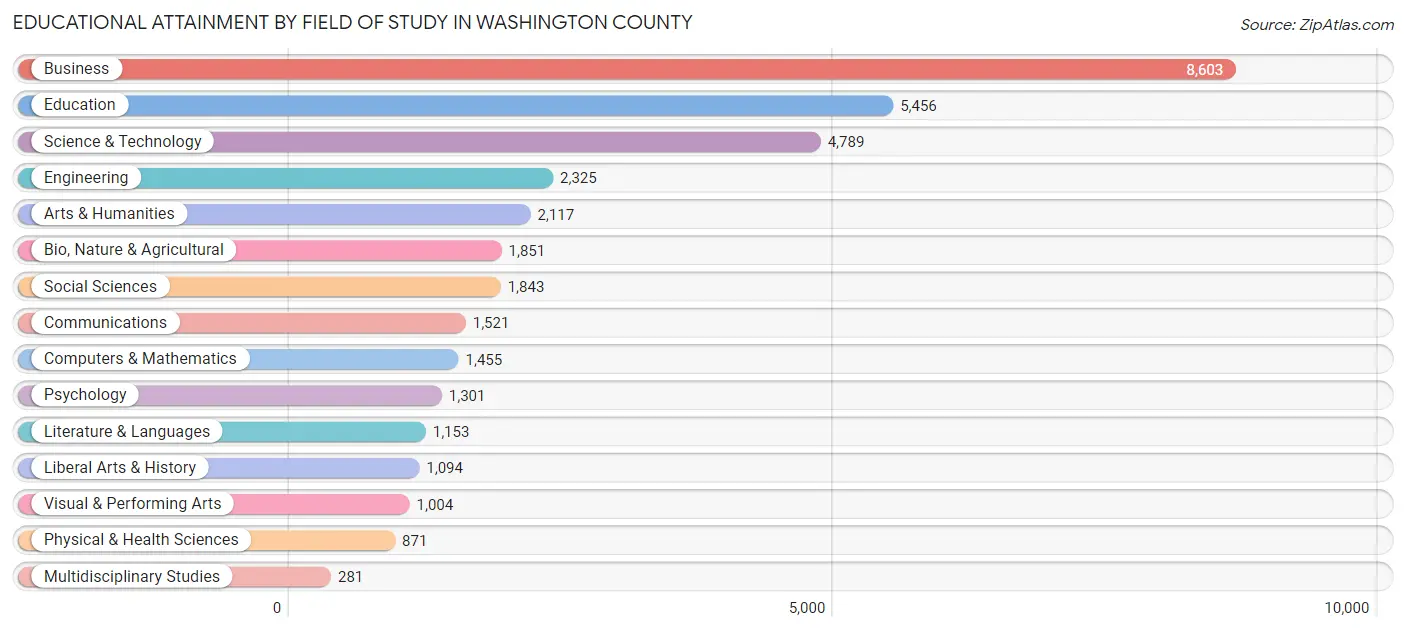
Business (8,603 | 24.1%), education (5,456 | 15.3%), science & technology (4,789 | 13.4%), engineering (2,325 | 6.5%), and arts & humanities (2,117 | 5.9%) are the most common fields of study among 35,664 individuals in Washington County who have obtained a bachelor's degree or higher.
| Field of Study | # Graduates | % Graduates |
| Computers & Mathematics | 1,455 | 4.1% |
| Bio, Nature & Agricultural | 1,851 | 5.2% |
| Physical & Health Sciences | 871 | 2.4% |
| Psychology | 1,301 | 3.6% |
| Social Sciences | 1,843 | 5.2% |
| Engineering | 2,325 | 6.5% |
| Multidisciplinary Studies | 281 | 0.8% |
| Science & Technology | 4,789 | 13.4% |
| Business | 8,603 | 24.1% |
| Education | 5,456 | 15.3% |
| Literature & Languages | 1,153 | 3.2% |
| Liberal Arts & History | 1,094 | 3.1% |
| Visual & Performing Arts | 1,004 | 2.8% |
| Communications | 1,521 | 4.3% |
| Arts & Humanities | 2,117 | 5.9% |
| Total | 35,664 | 100.0% |
Transportation & Commute in Washington County
Vehicle Availability by Sex in Washington County
The most prevalent vehicle ownership categories in Washington County are males with 2 vehicles (18,301, accounting for 46.6%) and females with 2 vehicles (16,150, making up 53.4%).
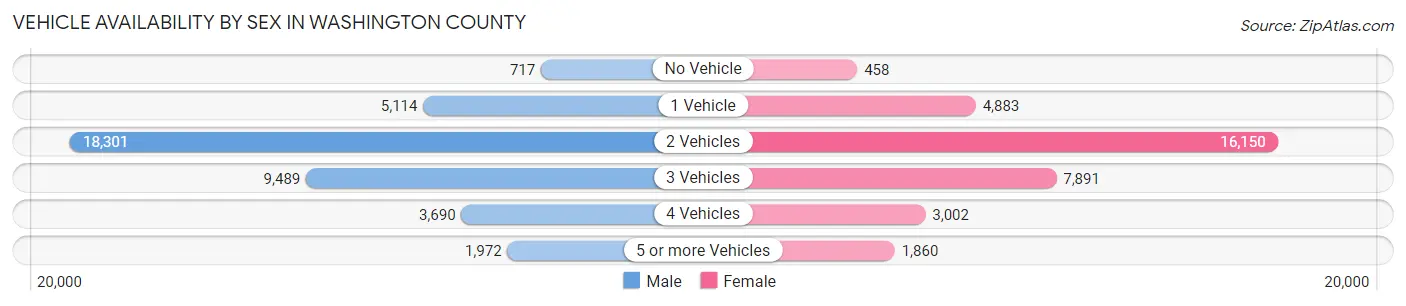
| Vehicles Available | Male | Female |
| No Vehicle | 717 (1.8%) | 458 (1.3%) |
| 1 Vehicle | 5,114 (13.0%) | 4,883 (14.3%) |
| 2 Vehicles | 18,301 (46.6%) | 16,150 (47.2%) |
| 3 Vehicles | 9,489 (24.2%) | 7,891 (23.0%) |
| 4 Vehicles | 3,690 (9.4%) | 3,002 (8.8%) |
| 5 or more Vehicles | 1,972 (5.0%) | 1,860 (5.4%) |
| Total | 39,283 (100.0%) | 34,244 (100.0%) |
Commute Time in Washington County
The most frequently occuring commute durations in Washington County are 30 to 34 minutes (10,253 commuters, 15.6%), 15 to 19 minutes (8,455 commuters, 12.9%), and 20 to 24 minutes (8,109 commuters, 12.3%).
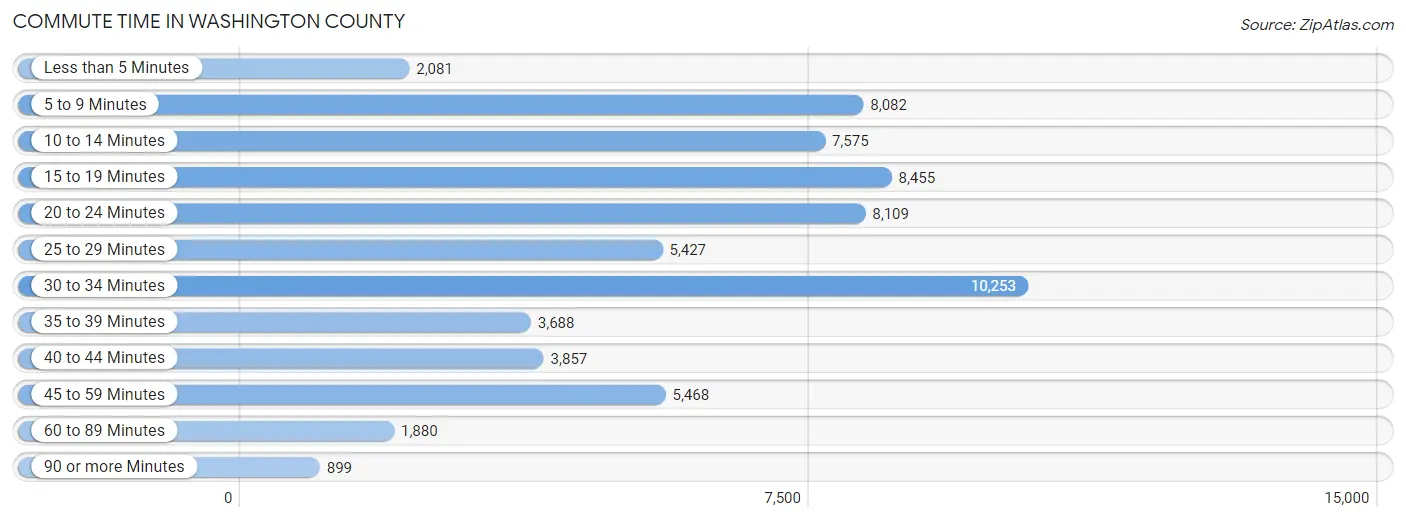
| Commute Time | # Commuters | % Commuters |
| Less than 5 Minutes | 2,081 | 3.2% |
| 5 to 9 Minutes | 8,082 | 12.3% |
| 10 to 14 Minutes | 7,575 | 11.5% |
| 15 to 19 Minutes | 8,455 | 12.9% |
| 20 to 24 Minutes | 8,109 | 12.3% |
| 25 to 29 Minutes | 5,427 | 8.3% |
| 30 to 34 Minutes | 10,253 | 15.6% |
| 35 to 39 Minutes | 3,688 | 5.6% |
| 40 to 44 Minutes | 3,857 | 5.9% |
| 45 to 59 Minutes | 5,468 | 8.3% |
| 60 to 89 Minutes | 1,880 | 2.9% |
| 90 or more Minutes | 899 | 1.4% |
Commute Time by Sex in Washington County
The most common commute times in Washington County are 30 to 34 minutes (5,850 commuters, 16.5%) for males and 15 to 19 minutes (4,442 commuters, 14.6%) for females.
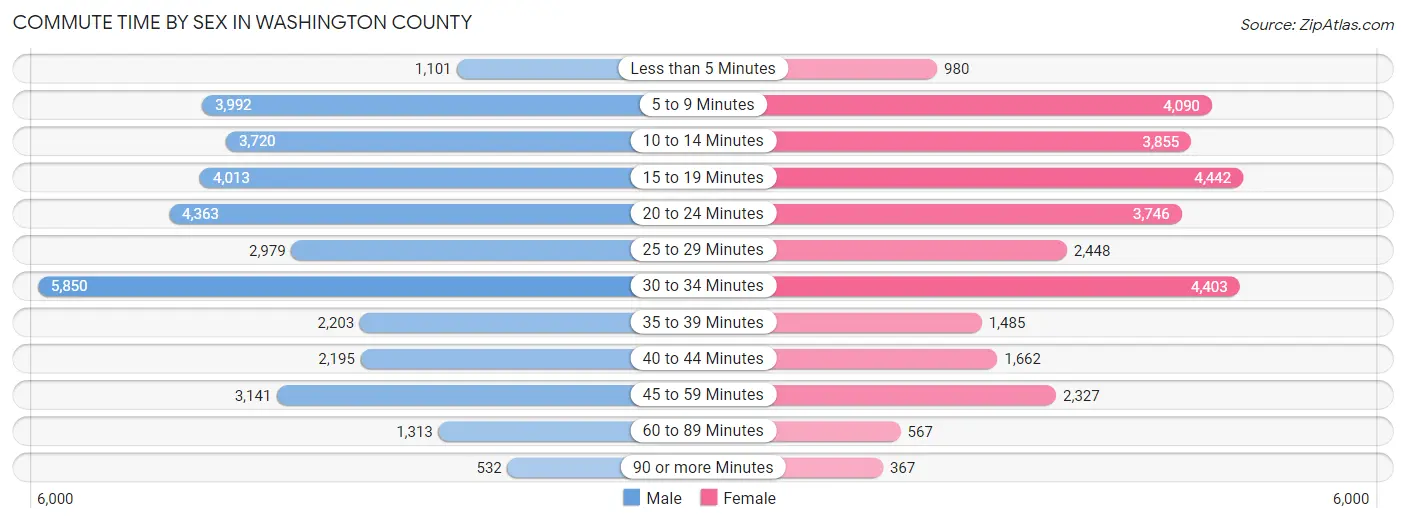
| Commute Time | Male | Female |
| Less than 5 Minutes | 1,101 (3.1%) | 980 (3.2%) |
| 5 to 9 Minutes | 3,992 (11.3%) | 4,090 (13.5%) |
| 10 to 14 Minutes | 3,720 (10.5%) | 3,855 (12.7%) |
| 15 to 19 Minutes | 4,013 (11.3%) | 4,442 (14.6%) |
| 20 to 24 Minutes | 4,363 (12.3%) | 3,746 (12.3%) |
| 25 to 29 Minutes | 2,979 (8.4%) | 2,448 (8.1%) |
| 30 to 34 Minutes | 5,850 (16.5%) | 4,403 (14.5%) |
| 35 to 39 Minutes | 2,203 (6.2%) | 1,485 (4.9%) |
| 40 to 44 Minutes | 2,195 (6.2%) | 1,662 (5.5%) |
| 45 to 59 Minutes | 3,141 (8.9%) | 2,327 (7.7%) |
| 60 to 89 Minutes | 1,313 (3.7%) | 567 (1.9%) |
| 90 or more Minutes | 532 (1.5%) | 367 (1.2%) |
Time of Departure to Work by Sex in Washington County
The most frequent times of departure to work in Washington County are 7:00 AM to 7:29 AM (4,882, 13.8%) for males and 7:00 AM to 7:29 AM (5,594, 18.4%) for females.
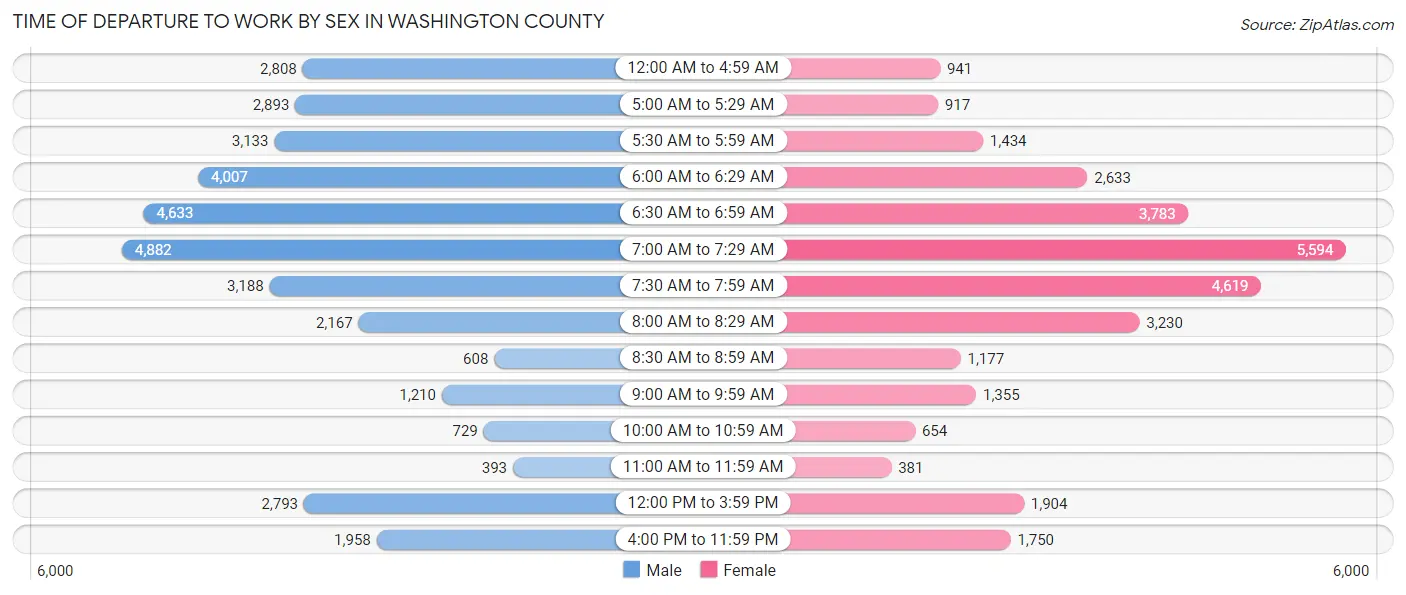
| Time of Departure | Male | Female |
| 12:00 AM to 4:59 AM | 2,808 (7.9%) | 941 (3.1%) |
| 5:00 AM to 5:29 AM | 2,893 (8.2%) | 917 (3.0%) |
| 5:30 AM to 5:59 AM | 3,133 (8.8%) | 1,434 (4.7%) |
| 6:00 AM to 6:29 AM | 4,007 (11.3%) | 2,633 (8.7%) |
| 6:30 AM to 6:59 AM | 4,633 (13.1%) | 3,783 (12.5%) |
| 7:00 AM to 7:29 AM | 4,882 (13.8%) | 5,594 (18.4%) |
| 7:30 AM to 7:59 AM | 3,188 (9.0%) | 4,619 (15.2%) |
| 8:00 AM to 8:29 AM | 2,167 (6.1%) | 3,230 (10.6%) |
| 8:30 AM to 8:59 AM | 608 (1.7%) | 1,177 (3.9%) |
| 9:00 AM to 9:59 AM | 1,210 (3.4%) | 1,355 (4.5%) |
| 10:00 AM to 10:59 AM | 729 (2.1%) | 654 (2.1%) |
| 11:00 AM to 11:59 AM | 393 (1.1%) | 381 (1.3%) |
| 12:00 PM to 3:59 PM | 2,793 (7.9%) | 1,904 (6.3%) |
| 4:00 PM to 11:59 PM | 1,958 (5.5%) | 1,750 (5.8%) |
| Total | 35,402 (100.0%) | 30,372 (100.0%) |
Housing Occupancy in Washington County
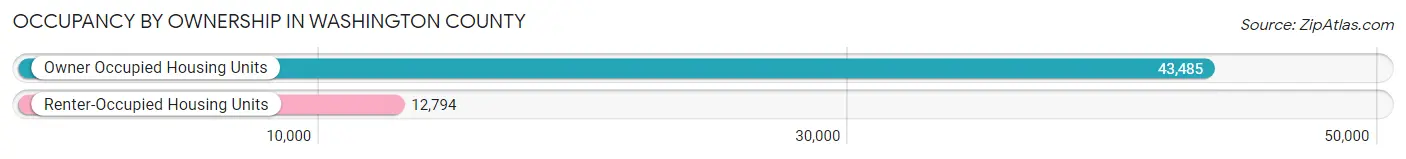
Occupancy by Ownership in Washington County
Of the total 56,279 dwellings in Washington County, owner-occupied units account for 43,485 (77.3%), while renter-occupied units make up 12,794 (22.7%).
| Occupancy | # Housing Units | % Housing Units |
| Owner Occupied Housing Units | 43,485 | 77.3% |
| Renter-Occupied Housing Units | 12,794 | 22.7% |
| Total Occupied Housing Units | 56,279 | 100.0% |
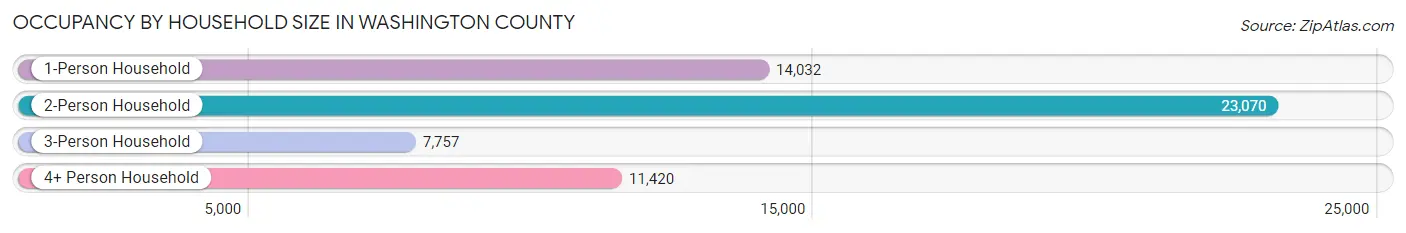
Occupancy by Household Size in Washington County
| Household Size | # Housing Units | % Housing Units |
| 1-Person Household | 14,032 | 24.9% |
| 2-Person Household | 23,070 | 41.0% |
| 3-Person Household | 7,757 | 13.8% |
| 4+ Person Household | 11,420 | 20.3% |
| Total Housing Units | 56,279 | 100.0% |
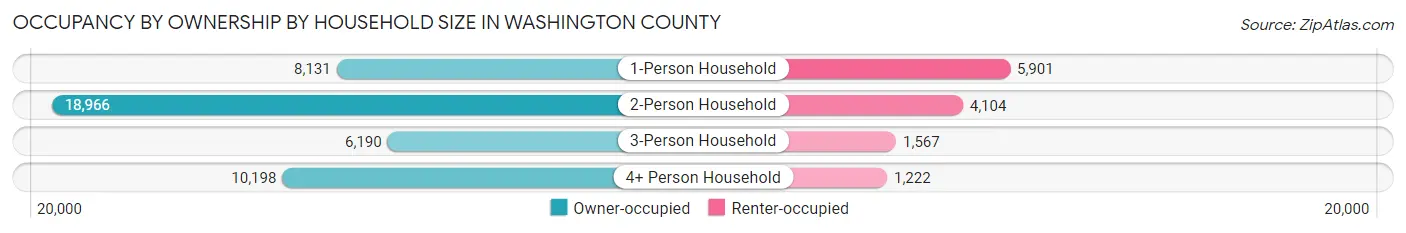
Occupancy by Ownership by Household Size in Washington County
| Household Size | Owner-occupied | Renter-occupied |
| 1-Person Household | 8,131 (58.0%) | 5,901 (42.0%) |
| 2-Person Household | 18,966 (82.2%) | 4,104 (17.8%) |
| 3-Person Household | 6,190 (79.8%) | 1,567 (20.2%) |
| 4+ Person Household | 10,198 (89.3%) | 1,222 (10.7%) |
| Total Housing Units | 43,485 (77.3%) | 12,794 (22.7%) |
Occupancy by Educational Attainment in Washington County

| Household Size | Owner-occupied | Renter-occupied |
| Less than High School | 1,361 (56.0%) | 1,069 (44.0%) |
| High School Diploma | 10,911 (72.6%) | 4,120 (27.4%) |
| College/Associate Degree | 14,047 (74.8%) | 4,726 (25.2%) |
| Bachelor's Degree or higher | 17,166 (85.6%) | 2,879 (14.4%) |
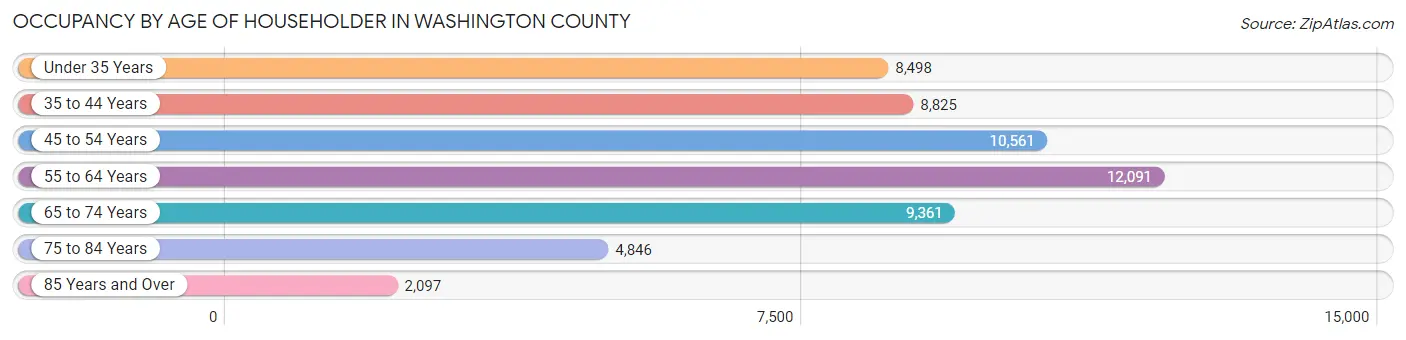
Occupancy by Age of Householder in Washington County
| Age Bracket | # Households | % Households |
| Under 35 Years | 8,498 | 15.1% |
| 35 to 44 Years | 8,825 | 15.7% |
| 45 to 54 Years | 10,561 | 18.8% |
| 55 to 64 Years | 12,091 | 21.5% |
| 65 to 74 Years | 9,361 | 16.6% |
| 75 to 84 Years | 4,846 | 8.6% |
| 85 Years and Over | 2,097 | 3.7% |
| Total | 56,279 | 100.0% |
Housing Finances in Washington County
Median Income by Occupancy in Washington County
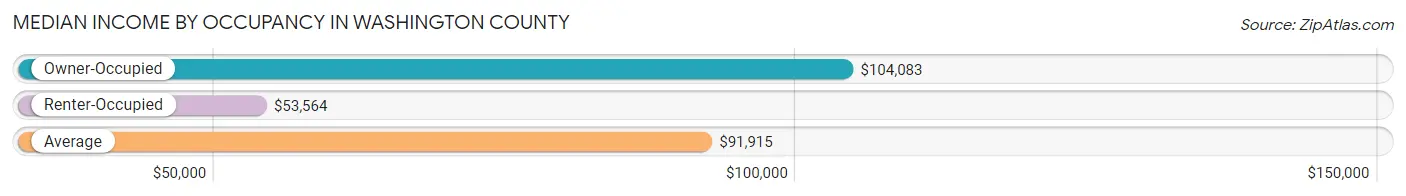
| Occupancy Type | # Households | Median Income |
| Owner-Occupied | 43,485 (77.3%) | $104,083 |
| Renter-Occupied | 12,794 (22.7%) | $53,564 |
| Average | 56,279 (100.0%) | $91,915 |
Occupancy by Householder Income Bracket in Washington County
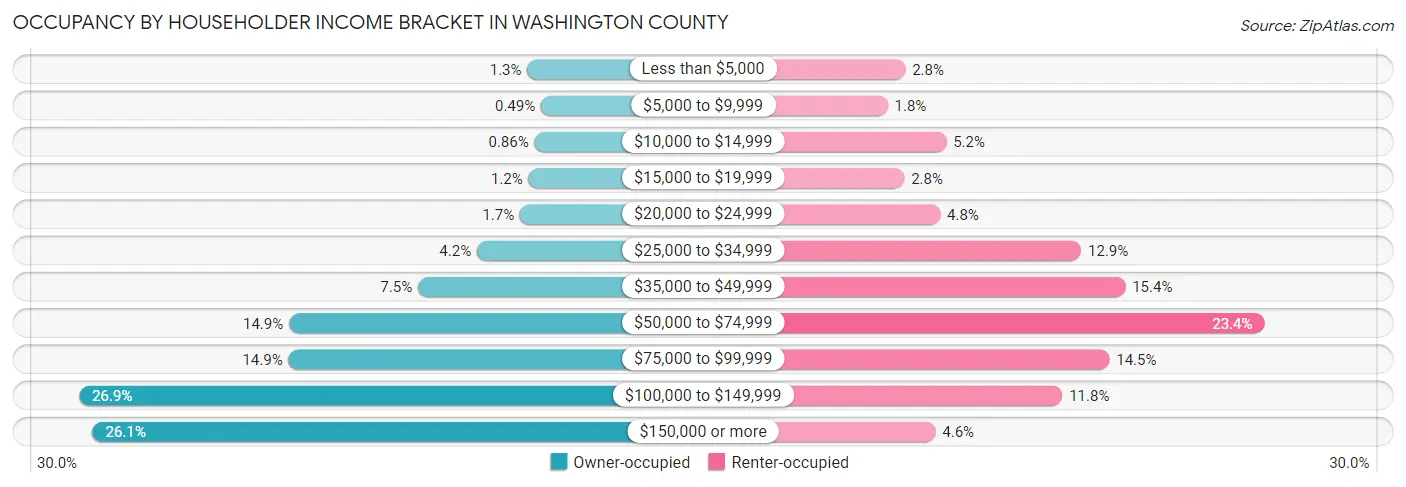
| Income Bracket | Owner-occupied | Renter-occupied |
| Less than $5,000 | 551 (1.3%) | 363 (2.8%) |
| $5,000 to $9,999 | 214 (0.5%) | 234 (1.8%) |
| $10,000 to $14,999 | 376 (0.9%) | 663 (5.2%) |
| $15,000 to $19,999 | 521 (1.2%) | 356 (2.8%) |
| $20,000 to $24,999 | 737 (1.7%) | 618 (4.8%) |
| $25,000 to $34,999 | 1,803 (4.2%) | 1,649 (12.9%) |
| $35,000 to $49,999 | 3,271 (7.5%) | 1,972 (15.4%) |
| $50,000 to $74,999 | 6,473 (14.9%) | 2,989 (23.4%) |
| $75,000 to $99,999 | 6,490 (14.9%) | 1,855 (14.5%) |
| $100,000 to $149,999 | 11,692 (26.9%) | 1,511 (11.8%) |
| $150,000 or more | 11,357 (26.1%) | 584 (4.6%) |
| Total | 43,485 (100.0%) | 12,794 (100.0%) |
Monthly Housing Cost Tiers in Washington County

| Monthly Cost | Owner-occupied | Renter-occupied |
| Less than $300 | 327 (0.7%) | 100 (0.8%) |
| $300 to $499 | 2,651 (6.1%) | 385 (3.0%) |
| $500 to $799 | 9,307 (21.4%) | 1,843 (14.4%) |
| $800 to $999 | 3,666 (8.4%) | 3,024 (23.6%) |
| $1,000 to $1,499 | 6,999 (16.1%) | 4,722 (36.9%) |
| $1,500 to $1,999 | 8,941 (20.6%) | 1,842 (14.4%) |
| $2,000 to $2,499 | 5,944 (13.7%) | 351 (2.7%) |
| $2,500 to $2,999 | 3,112 (7.2%) | 116 (0.9%) |
| $3,000 or more | 2,538 (5.8%) | 112 (0.9%) |
| Total | 43,485 (100.0%) | 12,794 (100.0%) |
Physical Housing Characteristics in Washington County
Housing Structures in Washington County
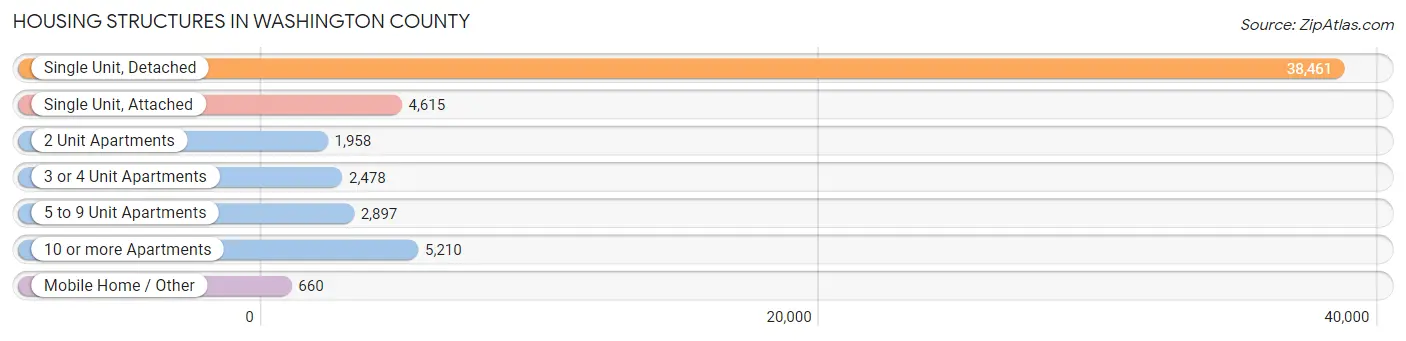
| Structure Type | # Housing Units | % Housing Units |
| Single Unit, Detached | 38,461 | 68.3% |
| Single Unit, Attached | 4,615 | 8.2% |
| 2 Unit Apartments | 1,958 | 3.5% |
| 3 or 4 Unit Apartments | 2,478 | 4.4% |
| 5 to 9 Unit Apartments | 2,897 | 5.1% |
| 10 or more Apartments | 5,210 | 9.3% |
| Mobile Home / Other | 660 | 1.2% |
| Total | 56,279 | 100.0% |
Housing Structures by Occupancy in Washington County
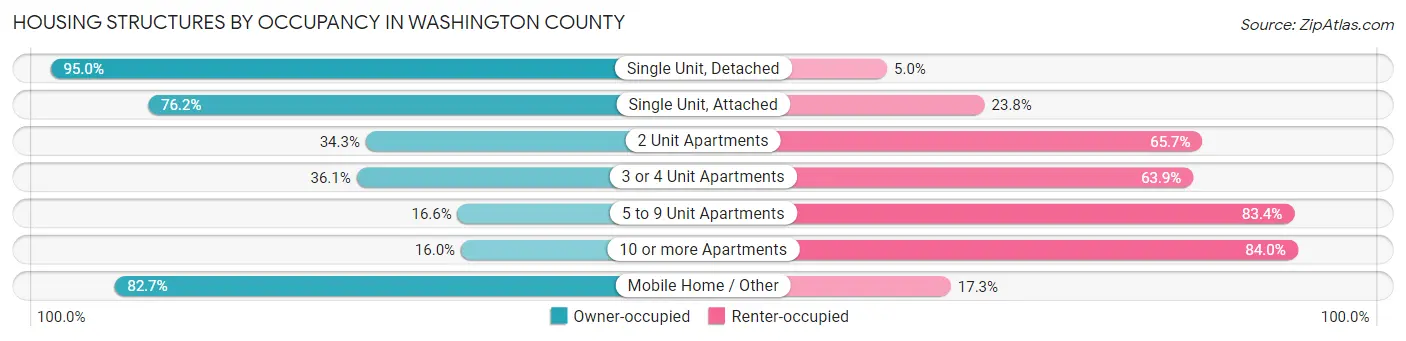
| Structure Type | Owner-occupied | Renter-occupied |
| Single Unit, Detached | 36,540 (95.0%) | 1,921 (5.0%) |
| Single Unit, Attached | 3,518 (76.2%) | 1,097 (23.8%) |
| 2 Unit Apartments | 672 (34.3%) | 1,286 (65.7%) |
| 3 or 4 Unit Apartments | 894 (36.1%) | 1,584 (63.9%) |
| 5 to 9 Unit Apartments | 482 (16.6%) | 2,415 (83.4%) |
| 10 or more Apartments | 833 (16.0%) | 4,377 (84.0%) |
| Mobile Home / Other | 546 (82.7%) | 114 (17.3%) |
| Total | 43,485 (77.3%) | 12,794 (22.7%) |
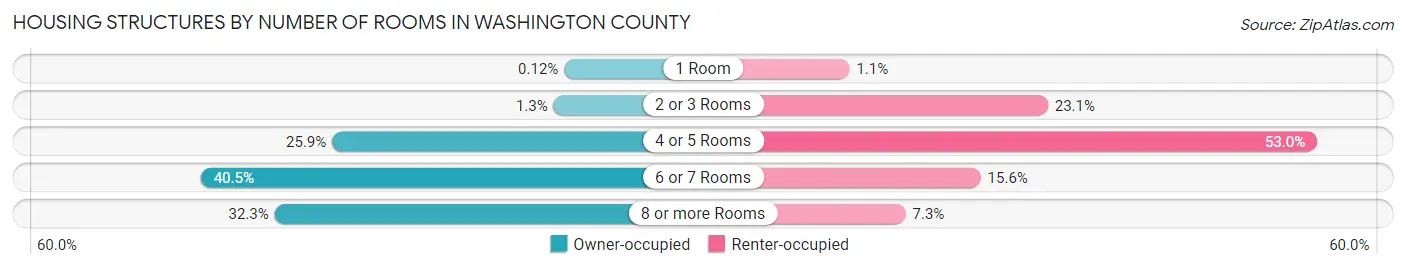
Housing Structures by Number of Rooms in Washington County
| Number of Rooms | Owner-occupied | Renter-occupied |
| 1 Room | 53 (0.1%) | 135 (1.1%) |
| 2 or 3 Rooms | 566 (1.3%) | 2,952 (23.1%) |
| 4 or 5 Rooms | 11,249 (25.9%) | 6,775 (52.9%) |
| 6 or 7 Rooms | 17,588 (40.5%) | 1,999 (15.6%) |
| 8 or more Rooms | 14,029 (32.3%) | 933 (7.3%) |
| Total | 43,485 (100.0%) | 12,794 (100.0%) |
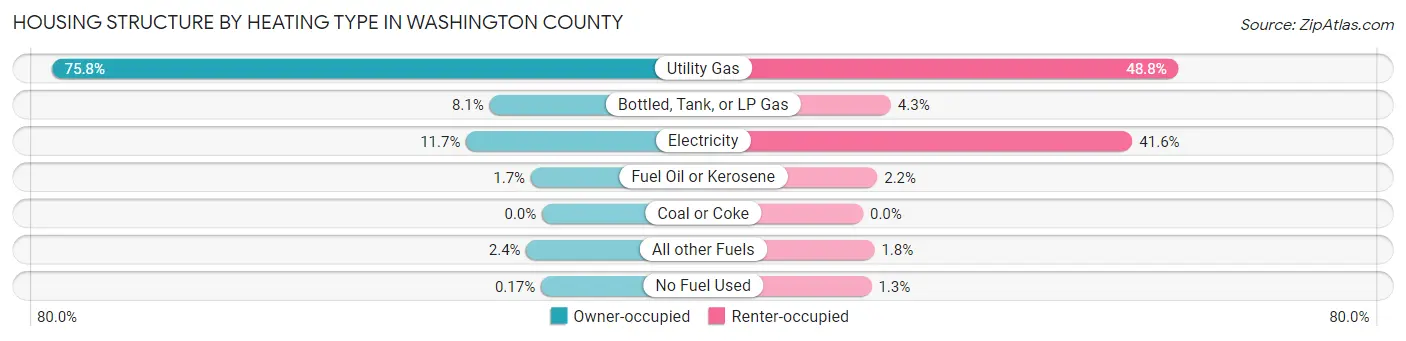
Housing Structure by Heating Type in Washington County
| Heating Type | Owner-occupied | Renter-occupied |
| Utility Gas | 32,969 (75.8%) | 6,240 (48.8%) |
| Bottled, Tank, or LP Gas | 3,537 (8.1%) | 552 (4.3%) |
| Electricity | 5,100 (11.7%) | 5,327 (41.6%) |
| Fuel Oil or Kerosene | 753 (1.7%) | 282 (2.2%) |
| Coal or Coke | 0 (0.0%) | 0 (0.0%) |
| All other Fuels | 1,054 (2.4%) | 227 (1.8%) |
| No Fuel Used | 72 (0.2%) | 166 (1.3%) |
| Total | 43,485 (100.0%) | 12,794 (100.0%) |
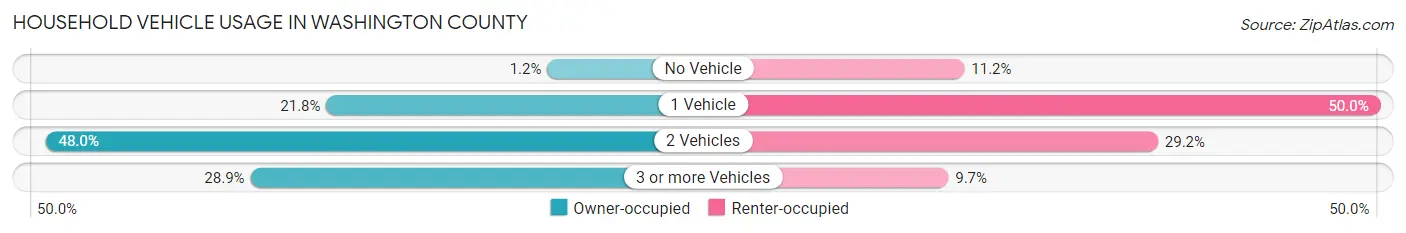
Household Vehicle Usage in Washington County
| Vehicles per Household | Owner-occupied | Renter-occupied |
| No Vehicle | 525 (1.2%) | 1,426 (11.2%) |
| 1 Vehicle | 9,493 (21.8%) | 6,396 (50.0%) |
| 2 Vehicles | 20,890 (48.0%) | 3,737 (29.2%) |
| 3 or more Vehicles | 12,577 (28.9%) | 1,235 (9.7%) |
| Total | 43,485 (100.0%) | 12,794 (100.0%) |
Real Estate & Mortgages in Washington County
Real Estate and Mortgage Overview in Washington County
| Characteristic | Without Mortgage | With Mortgage |
| Housing Units | 15,085 | 28,400 |
| Median Property Value | $277,400 | $305,400 |
| Median Household Income | $76,407 | $9,215 |
| Monthly Housing Costs | $652 | $2,493 |
| Real Estate Taxes | $3,625 | $120 |
Property Value by Mortgage Status in Washington County
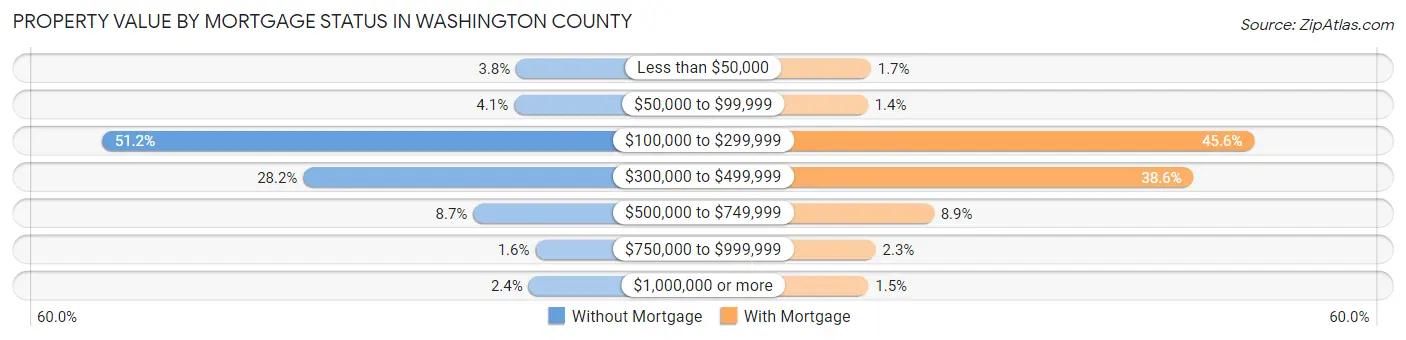
| Property Value | Without Mortgage | With Mortgage |
| Less than $50,000 | 578 (3.8%) | 494 (1.7%) |
| $50,000 to $99,999 | 614 (4.1%) | 394 (1.4%) |
| $100,000 to $299,999 | 7,719 (51.2%) | 12,940 (45.6%) |
| $300,000 to $499,999 | 4,248 (28.2%) | 10,972 (38.6%) |
| $500,000 to $749,999 | 1,317 (8.7%) | 2,537 (8.9%) |
| $750,000 to $999,999 | 246 (1.6%) | 649 (2.3%) |
| $1,000,000 or more | 363 (2.4%) | 414 (1.5%) |
| Total | 15,085 (100.0%) | 28,400 (100.0%) |
Household Income by Mortgage Status in Washington County

| Household Income | Without Mortgage | With Mortgage |
| Less than $10,000 | 454 (3.0%) | 461 (1.6%) |
| $10,000 to $24,999 | 945 (6.3%) | 311 (1.1%) |
| $25,000 to $34,999 | 1,271 (8.4%) | 689 (2.4%) |
| $35,000 to $49,999 | 1,740 (11.5%) | 532 (1.9%) |
| $50,000 to $74,999 | 2,976 (19.7%) | 1,531 (5.4%) |
| $75,000 to $99,999 | 2,288 (15.2%) | 3,497 (12.3%) |
| $100,000 to $149,999 | 3,269 (21.7%) | 4,202 (14.8%) |
| $150,000 or more | 2,142 (14.2%) | 8,423 (29.7%) |
| Total | 15,085 (100.0%) | 28,400 (100.0%) |
Property Value to Household Income Ratio in Washington County
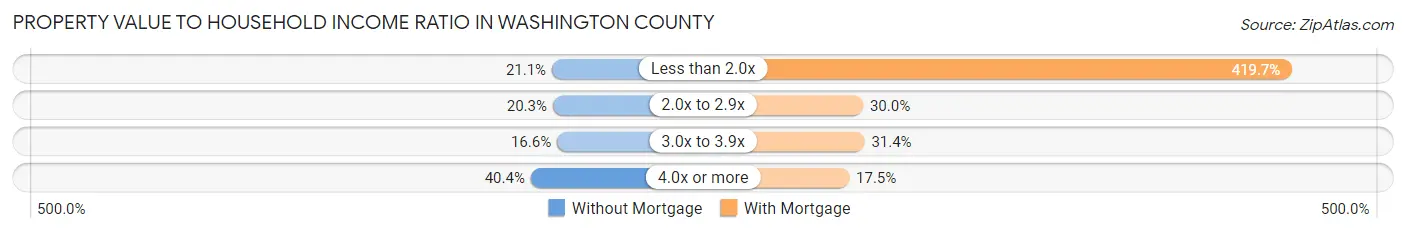
| Value-to-Income Ratio | Without Mortgage | With Mortgage |
| Less than 2.0x | 3,189 (21.1%) | 119,207 (419.7%) |
| 2.0x to 2.9x | 3,069 (20.3%) | 8,532 (30.0%) |
| 3.0x to 3.9x | 2,498 (16.6%) | 8,907 (31.4%) |
| 4.0x or more | 6,095 (40.4%) | 4,955 (17.4%) |
| Total | 15,085 (100.0%) | 28,400 (100.0%) |
Real Estate Taxes by Mortgage Status in Washington County
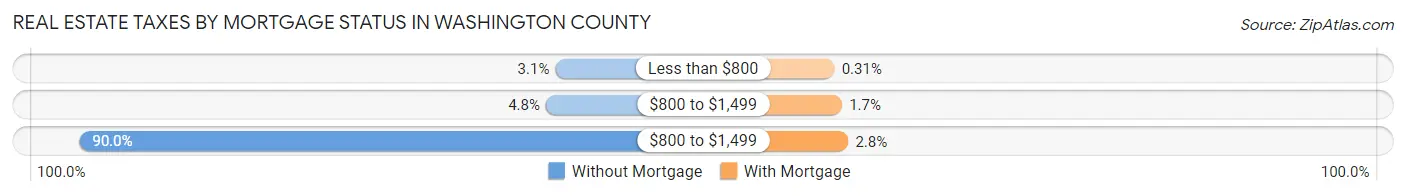
| Property Taxes | Without Mortgage | With Mortgage |
| Less than $800 | 465 (3.1%) | 87 (0.3%) |
| $800 to $1,499 | 725 (4.8%) | 477 (1.7%) |
| $800 to $1,499 | 13,576 (90.0%) | 802 (2.8%) |
| Total | 15,085 (100.0%) | 28,400 (100.0%) |
Health & Disability in Washington County
Health Insurance Coverage by Age in Washington County
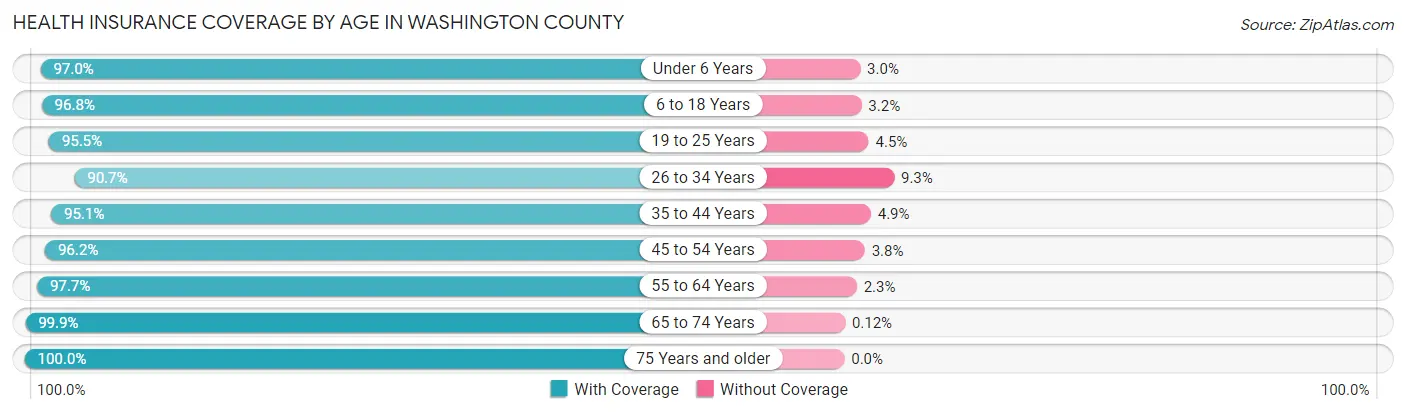
| Age Bracket | With Coverage | Without Coverage |
| Under 6 Years | 8,092 (97.0%) | 247 (3.0%) |
| 6 to 18 Years | 21,720 (96.8%) | 716 (3.2%) |
| 19 to 25 Years | 9,203 (95.5%) | 437 (4.5%) |
| 26 to 34 Years | 12,076 (90.7%) | 1,235 (9.3%) |
| 35 to 44 Years | 16,295 (95.1%) | 846 (4.9%) |
| 45 to 54 Years | 17,819 (96.2%) | 706 (3.8%) |
| 55 to 64 Years | 21,165 (97.7%) | 503 (2.3%) |
| 65 to 74 Years | 15,073 (99.9%) | 18 (0.1%) |
| 75 Years and older | 10,016 (100.0%) | 0 (0.0%) |
| Total | 131,459 (96.5%) | 4,708 (3.5%) |
Health Insurance Coverage by Citizenship Status in Washington County

| Citizenship Status | With Coverage | Without Coverage |
| Native Born | 8,092 (97.0%) | 247 (3.0%) |
| Foreign Born, Citizen | 21,720 (96.8%) | 716 (3.2%) |
| Foreign Born, not a Citizen | 9,203 (95.5%) | 437 (4.5%) |
Health Insurance Coverage by Household Income in Washington County
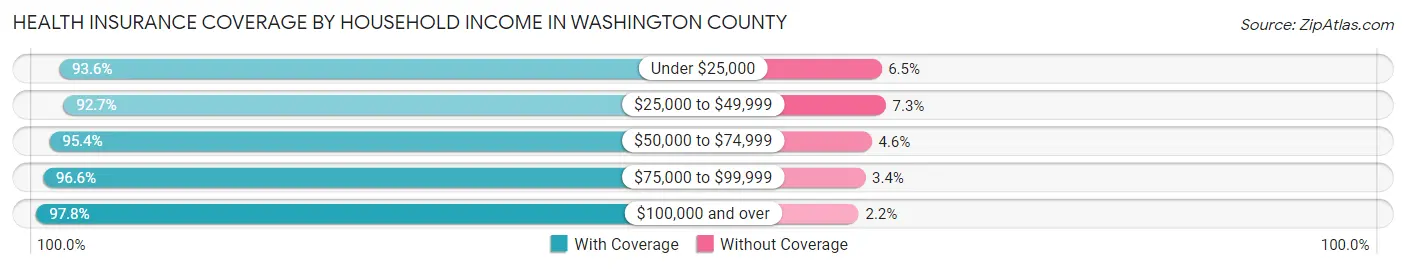
| Household Income | With Coverage | Without Coverage |
| Under $25,000 | 6,109 (93.5%) | 421 (6.5%) |
| $25,000 to $49,999 | 13,197 (92.7%) | 1,035 (7.3%) |
| $50,000 to $74,999 | 17,704 (95.4%) | 859 (4.6%) |
| $75,000 to $99,999 | 19,850 (96.6%) | 705 (3.4%) |
| $100,000 and over | 74,270 (97.8%) | 1,672 (2.2%) |
Public vs Private Health Insurance Coverage by Age in Washington County
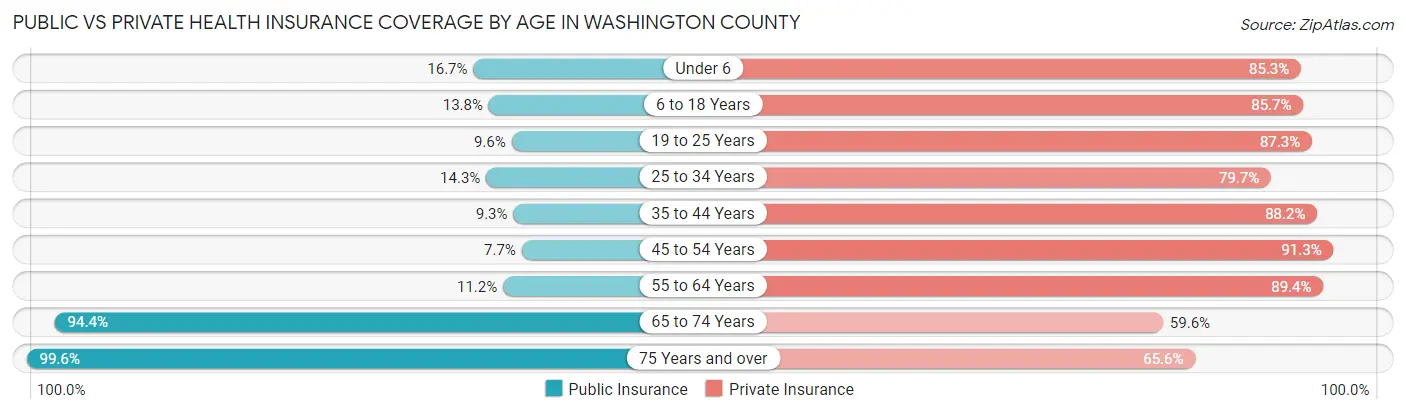
| Age Bracket | Public Insurance | Private Insurance |
| Under 6 | 1,393 (16.7%) | 7,109 (85.3%) |
| 6 to 18 Years | 3,105 (13.8%) | 19,219 (85.7%) |
| 19 to 25 Years | 927 (9.6%) | 8,413 (87.3%) |
| 25 to 34 Years | 1,908 (14.3%) | 10,606 (79.7%) |
| 35 to 44 Years | 1,591 (9.3%) | 15,126 (88.2%) |
| 45 to 54 Years | 1,432 (7.7%) | 16,906 (91.3%) |
| 55 to 64 Years | 2,426 (11.2%) | 19,363 (89.4%) |
| 65 to 74 Years | 14,247 (94.4%) | 8,994 (59.6%) |
| 75 Years and over | 9,980 (99.6%) | 6,571 (65.6%) |
| Total | 37,009 (27.2%) | 112,307 (82.5%) |
Disability Status by Sex by Age in Washington County
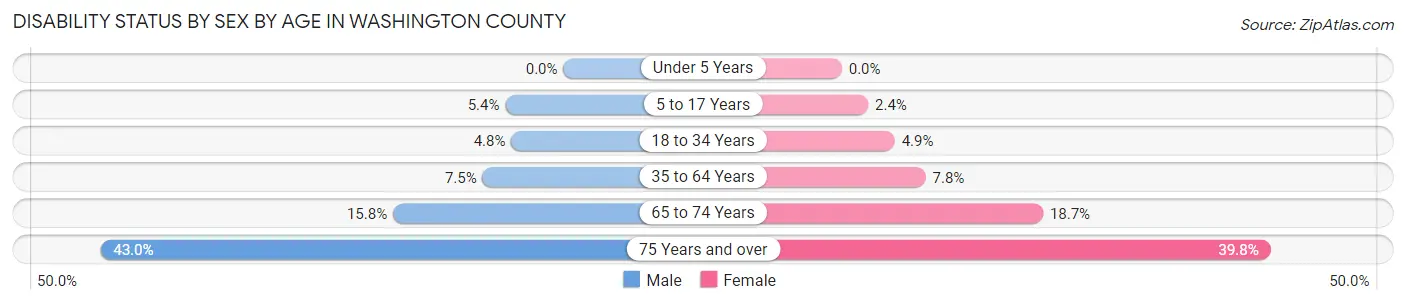
| Age Bracket | Male | Female |
| Under 5 Years | 0 (0.0%) | 0 (0.0%) |
| 5 to 17 Years | 612 (5.4%) | 271 (2.4%) |
| 18 to 34 Years | 617 (4.8%) | 578 (4.9%) |
| 35 to 64 Years | 2,181 (7.5%) | 2,199 (7.8%) |
| 65 to 74 Years | 1,171 (15.8%) | 1,435 (18.7%) |
| 75 Years and over | 1,832 (43.0%) | 2,289 (39.8%) |
Disability Class by Sex by Age in Washington County
Disability Class: Hearing Difficulty
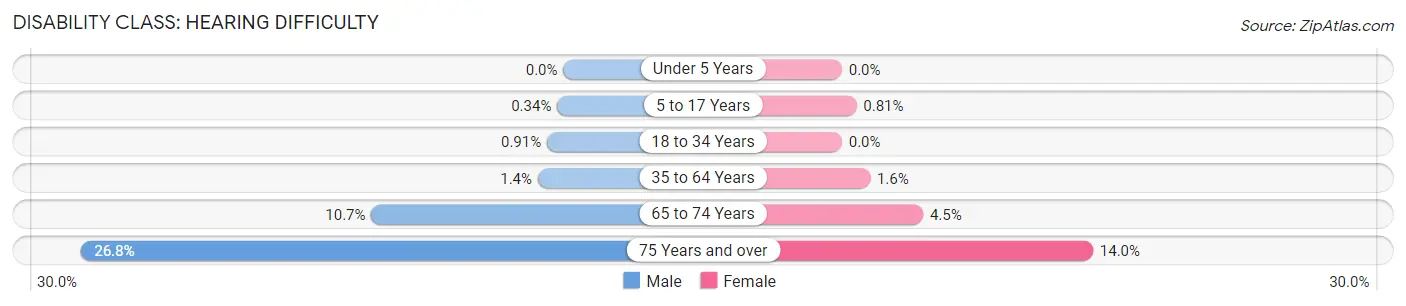
| Age Bracket | Male | Female |
| Under 5 Years | 0 (0.0%) | 0 (0.0%) |
| 5 to 17 Years | 39 (0.3%) | 90 (0.8%) |
| 18 to 34 Years | 116 (0.9%) | 0 (0.0%) |
| 35 to 64 Years | 414 (1.4%) | 444 (1.6%) |
| 65 to 74 Years | 792 (10.7%) | 347 (4.5%) |
| 75 Years and over | 1,144 (26.8%) | 804 (14.0%) |
Disability Class: Vision Difficulty
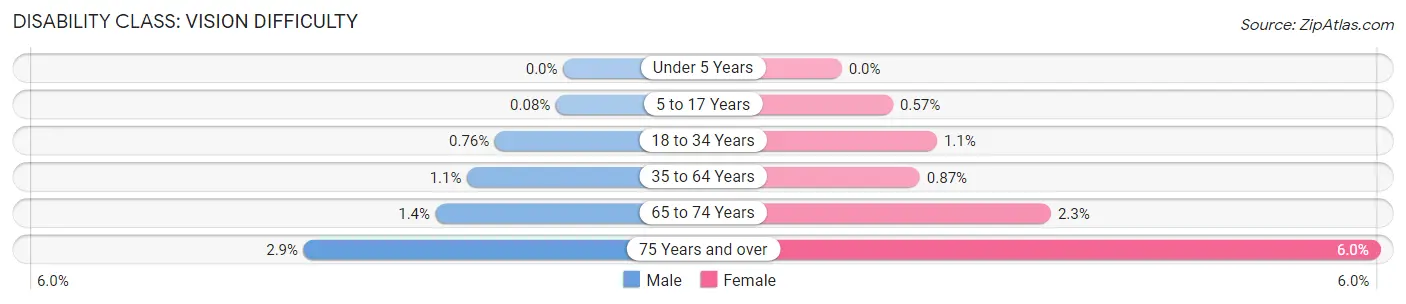
| Age Bracket | Male | Female |
| Under 5 Years | 0 (0.0%) | 0 (0.0%) |
| 5 to 17 Years | 9 (0.1%) | 63 (0.6%) |
| 18 to 34 Years | 97 (0.8%) | 125 (1.1%) |
| 35 to 64 Years | 312 (1.1%) | 246 (0.9%) |
| 65 to 74 Years | 105 (1.4%) | 179 (2.3%) |
| 75 Years and over | 123 (2.9%) | 345 (6.0%) |
Disability Class: Cognitive Difficulty
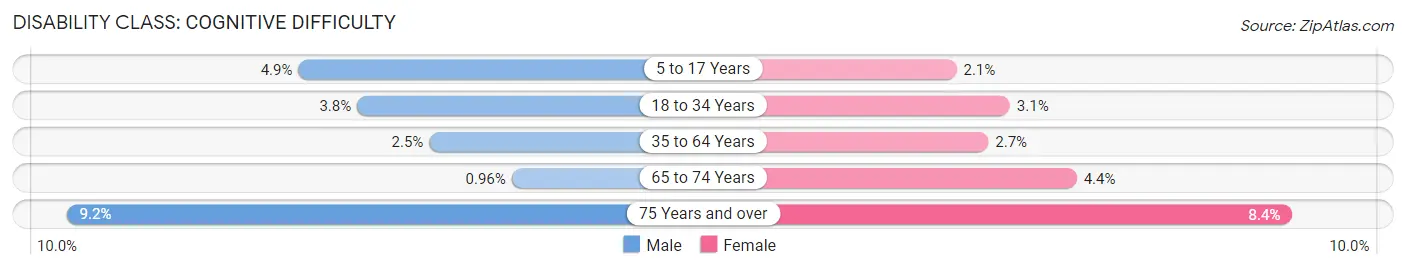
| Age Bracket | Male | Female |
| 5 to 17 Years | 558 (4.9%) | 237 (2.1%) |
| 18 to 34 Years | 490 (3.8%) | 367 (3.1%) |
| 35 to 64 Years | 724 (2.5%) | 769 (2.7%) |
| 65 to 74 Years | 71 (1.0%) | 335 (4.4%) |
| 75 Years and over | 393 (9.2%) | 481 (8.4%) |
Disability Class: Ambulatory Difficulty
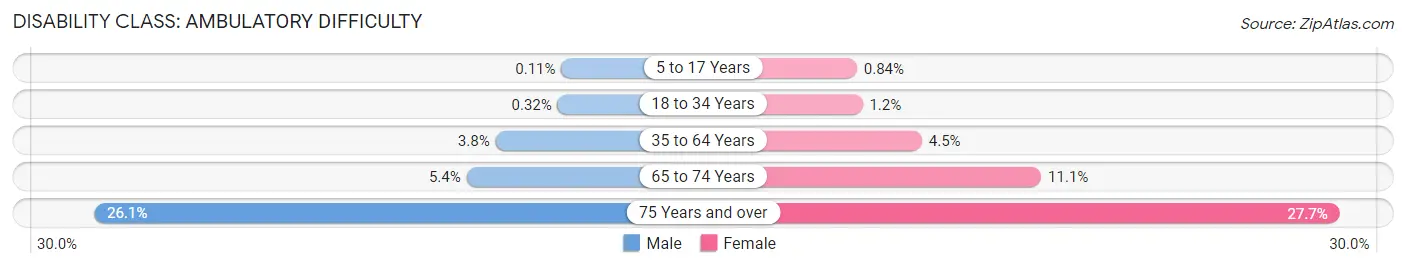
| Age Bracket | Male | Female |
| 5 to 17 Years | 12 (0.1%) | 93 (0.8%) |
| 18 to 34 Years | 41 (0.3%) | 135 (1.1%) |
| 35 to 64 Years | 1,099 (3.8%) | 1,260 (4.5%) |
| 65 to 74 Years | 399 (5.4%) | 853 (11.1%) |
| 75 Years and over | 1,114 (26.1%) | 1,595 (27.7%) |
Disability Class: Self-Care Difficulty
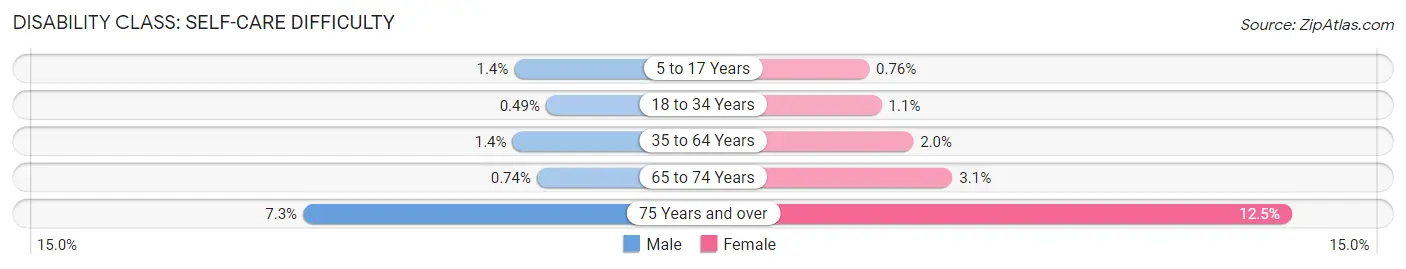
| Age Bracket | Male | Female |
| 5 to 17 Years | 155 (1.4%) | 84 (0.8%) |
| 18 to 34 Years | 62 (0.5%) | 131 (1.1%) |
| 35 to 64 Years | 412 (1.4%) | 561 (2.0%) |
| 65 to 74 Years | 55 (0.7%) | 237 (3.1%) |
| 75 Years and over | 309 (7.2%) | 720 (12.5%) |
Technology Access in Washington County
Computing Device Access in Washington County
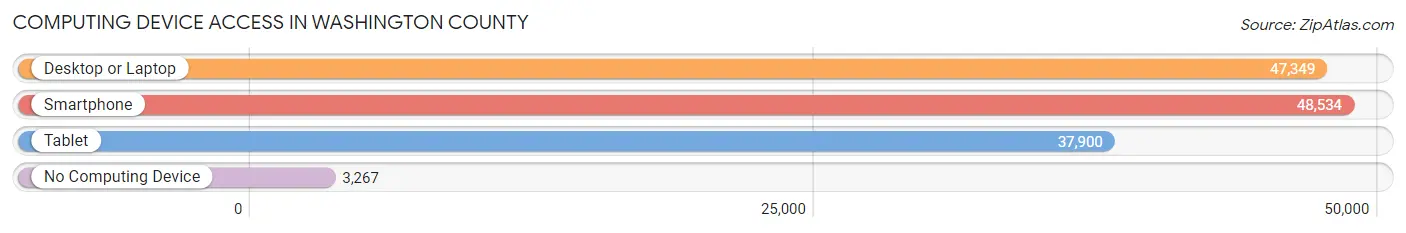
| Device Type | # Households | % Households |
| Desktop or Laptop | 47,349 | 84.1% |
| Smartphone | 48,534 | 86.2% |
| Tablet | 37,900 | 67.3% |
| No Computing Device | 3,267 | 5.8% |
| Total | 56,279 | 100.0% |
Internet Access in Washington County
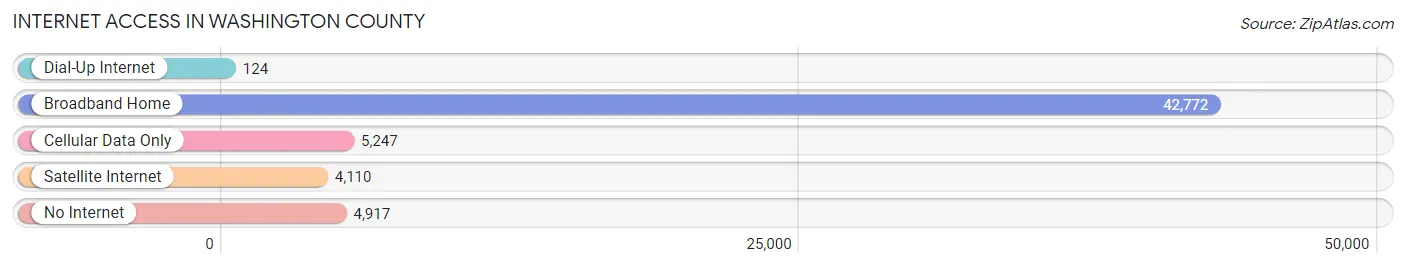
| Internet Type | # Households | % Households |
| Dial-Up Internet | 124 | 0.2% |
| Broadband Home | 42,772 | 76.0% |
| Cellular Data Only | 5,247 | 9.3% |
| Satellite Internet | 4,110 | 7.3% |
| No Internet | 4,917 | 8.7% |
| Total | 56,279 | 100.0% |
Washington County Summary
Introduction
Located in the southeastern corner of Wisconsin, Washington County is a vibrant and diverse county with a rich history and a bright future. With a population of 131,887 in 2019, Washington County is the 18th most populous county in Wisconsin. The county seat is West Bend, and the largest city is Germantown. Washington County is bordered by Ozaukee County to the north, Waukesha County to the west, Milwaukee County to the south, and Sheboygan County to the east.
History
Washington County was established in 1836 and named after George Washington, the first president of the United States. The county was originally part of Milwaukee County, but was split off in 1836. The first settlers in the area were German immigrants who arrived in the early 1800s. The first county seat was located in the town of Addison, but it was moved to West Bend in 1845.
The county experienced rapid growth in the late 19th and early 20th centuries, as the area became a popular destination for German immigrants. The county also experienced a surge in population during the 1950s and 1960s, as the area became a popular destination for people from Milwaukee and Chicago.
Geography
Washington County is located in the southeastern corner of Wisconsin, and is bordered by Ozaukee County to the north, Waukesha County to the west, Milwaukee County to the south, and Sheboygan County to the east. The county covers an area of 517 square miles, and is home to numerous lakes, rivers, and streams. The largest lake in the county is Lake Koshkonong, which covers an area of 8,000 acres.
The county is located in the Central Plain region of Wisconsin, and is characterized by rolling hills and flat plains. The highest point in the county is located in the town of Addison, and is 1,092 feet above sea level. The county is also home to numerous parks and recreational areas, including the Kettle Moraine State Forest, the Ice Age National Scenic Trail, and the Southern Unit of the Kettle Moraine State Forest.
Economy
Washington County has a diverse economy, with a variety of industries providing employment opportunities. The largest employers in the county are the West Bend School District, the West Bend Company, and the City of West Bend. Other major employers include Aurora Health Care, Quad Graphics, and Regal Ware.
The county is also home to numerous small businesses, including restaurants, retail stores, and service providers. The county is also home to numerous manufacturing companies, including Regal Ware, Quad Graphics, and West Bend Company.
Demographics
As of 2019, the population of Washington County was 131,887. The population is fairly evenly split between men and women, with 50.3% of the population being male and 49.7% being female. The median age of the population is 40.3 years, and the median household income is $71,845.
The largest racial group in the county is White, which makes up 87.3% of the population. Other racial groups include African American (4.7%), Hispanic (3.7%), Asian (2.2%), and Native American (0.5%). The county is also home to a large number of immigrants, with 8.3% of the population being foreign-born.
Conclusion
Washington County is a vibrant and diverse county with a rich history and a bright future. The county is home to numerous lakes, rivers, and streams, and is a popular destination for outdoor recreation. The county also has a diverse economy, with a variety of industries providing employment opportunities. The population of the county is fairly evenly split between men and women, and is largely composed of White residents. Washington County is a great place to live, work, and play.
Common Questions
What is the Total Population of Washington County?
Total Population of Washington County is 136,842.
What is the Total Male Population of Washington County?
Total Male Population of Washington County is 68,585.
What is the Total Female Population of Washington County?
Total Female Population of Washington County is 68,257.
What is the Ratio of Males per 100 Females in Washington County?
There are 100.48 Males per 100 Females in Washington County.
What is the Ratio of Females per 100 Males in Washington County?
There are 99.52 Females per 100 Males in Washington County.
What is the Median Population Age in Washington County?
Median Population Age in Washington County is 43.4 Years.
What is the Average Family Size in Washington County
Average Family Size in Washington County is 2.9 People.
What is the Average Household Size in Washington County
Average Household Size in Washington County is 2.4 People.
What is Per Capita Income in Washington County?
Per Capita income in Washington County is $45,821.
What is the Median Family Income in Washington County?
Median Family Income in Washington County is $108,427.
What is the Median Household income in Washington County?
Median Household Income in Washington County is $91,915.
What is Income or Wage Gap in Washington County?
Income or Wage Gap in Washington County is 28.5%.
Women in Washington County earn 71.5 cents for every dollar earned by a man.
What is Family Income Deficit in Washington County?
Family Income Deficit in Washington County is $11,041.
Families that are below poverty line in Washington County earn $11,041 less on average than the poverty threshold level.
What is Inequality or Gini Index in Washington County?
Inequality or Gini Index in Washington County is 0.40.
How Large is the Labor Force in Washington County?
There are 76,947 People in the Labor Forcein in Washington County.
What is the Percentage of People in the Labor Force in Washington County?
69.0% of People are in the Labor Force in Washington County.
What is the Unemployment Rate in Washington County?
Unemployment Rate in Washington County is 3.1%.