Walworth County, WI
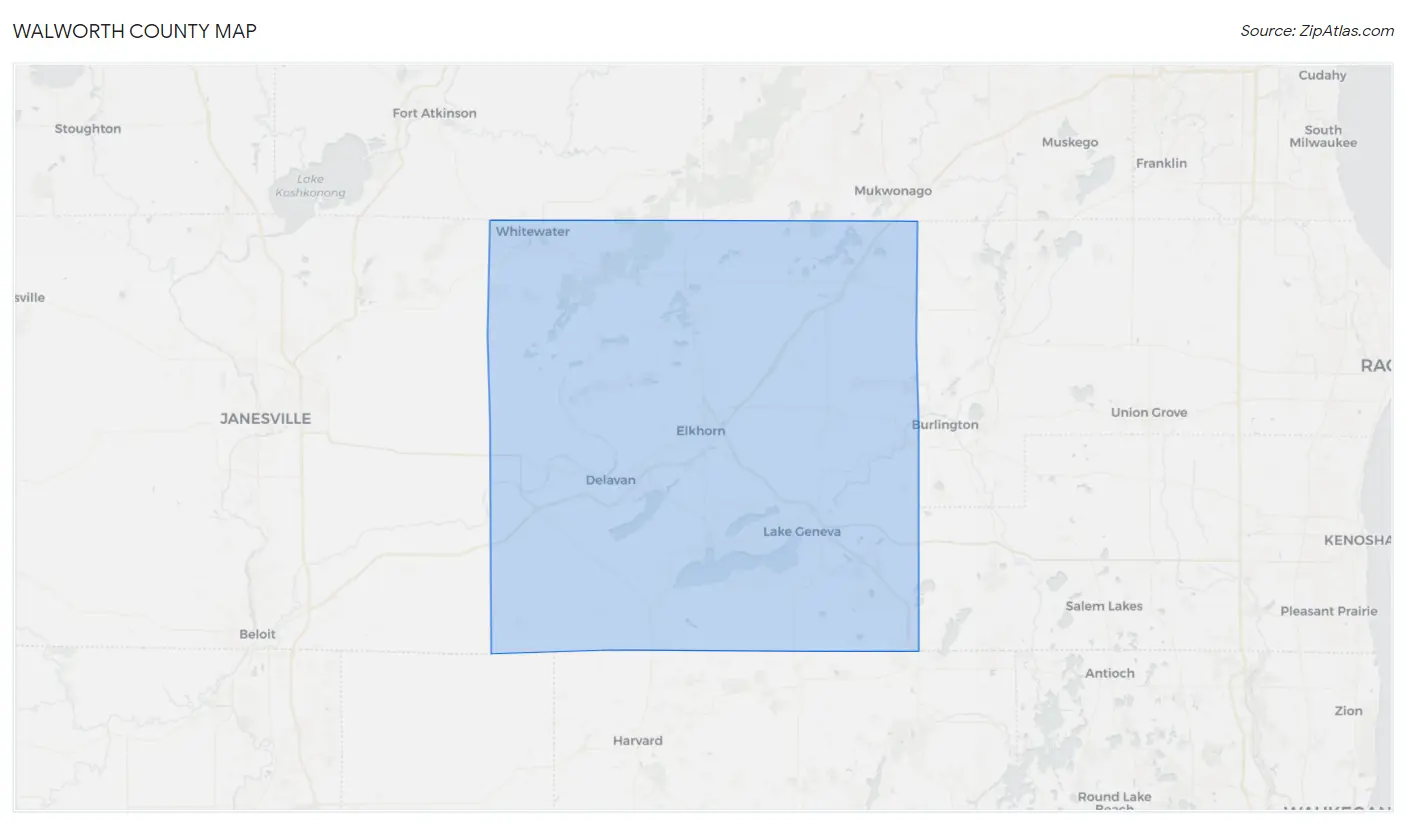
Walworth County Map
Walworth County Overview
105,127
TOTAL POPULATION
52,922
MALE POPULATION
52,205
FEMALE POPULATION
101.37
MALES / 100 FEMALES
98.65
FEMALES / 100 MALES
40.7
MEDIAN AGE
2.9
AVG FAMILY SIZE
2.4
AVG HOUSEHOLD SIZE
$40,386
PER CAPITA INCOME
$94,281
AVG FAMILY INCOME
$75,172
AVG HOUSEHOLD INCOME
37.1%
WAGE / INCOME GAP [ % ]
62.9¢/ $1
WAGE / INCOME GAP [ $ ]
$9,758
FAMILY INCOME DEFICIT
0.44
INEQUALITY / GINI INDEX
57,432
LABOR FORCE [ PEOPLE ]
66.1%
PERCENT IN LABOR FORCE
3.1%
UNEMPLOYMENT RATE
Race in Walworth County
The most populous races in Walworth County are White / Caucasian (93,316 | 88.8%), Hispanic or Latino (11,938 | 11.4%), and Two or more Races (6,383 | 6.1%).
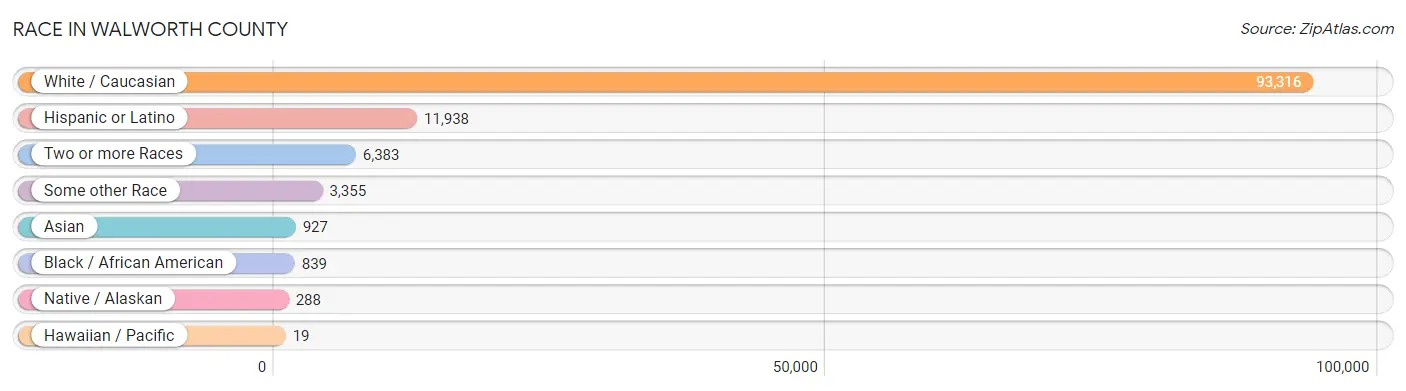
| Race | # Population | % Population |
| Asian | 927 | 0.9% |
| Black / African American | 839 | 0.8% |
| Hawaiian / Pacific | 19 | 0.0% |
| Hispanic or Latino | 11,938 | 11.4% |
| Native / Alaskan | 288 | 0.3% |
| White / Caucasian | 93,316 | 88.8% |
| Two or more Races | 6,383 | 6.1% |
| Some other Race | 3,355 | 3.2% |
| Total | 105,127 | 100.0% |
Ancestry in Walworth County
The most populous ancestries reported in Walworth County are German (36,508 | 34.7%), Irish (14,414 | 13.7%), Mexican (10,192 | 9.7%), Polish (9,161 | 8.7%), and English (8,379 | 8.0%), together accounting for 74.8% of all Walworth County residents.
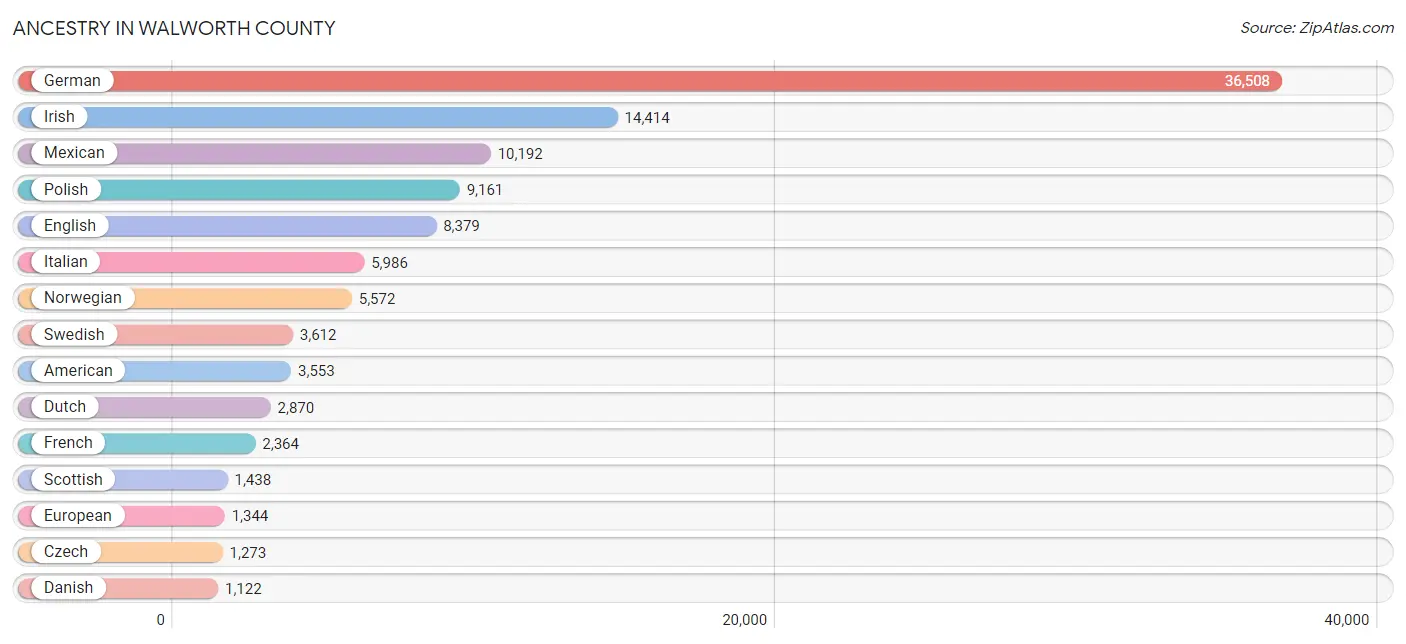
| Ancestry | # Population | % Population |
| African | 114 | 0.1% |
| Albanian | 52 | 0.1% |
| Alsatian | 1 | 0.0% |
| American | 3,553 | 3.4% |
| Apache | 4 | 0.0% |
| Arab | 106 | 0.1% |
| Argentinean | 9 | 0.0% |
| Armenian | 113 | 0.1% |
| Australian | 20 | 0.0% |
| Austrian | 289 | 0.3% |
| Bangladeshi | 389 | 0.4% |
| Barbadian | 41 | 0.0% |
| Belgian | 438 | 0.4% |
| Bhutanese | 129 | 0.1% |
| Blackfeet | 16 | 0.0% |
| British | 425 | 0.4% |
| Bulgarian | 24 | 0.0% |
| Burmese | 140 | 0.1% |
| Canadian | 35 | 0.0% |
| Carpatho Rusyn | 16 | 0.0% |
| Celtic | 7 | 0.0% |
| Central American | 320 | 0.3% |
| Cherokee | 124 | 0.1% |
| Chickasaw | 41 | 0.0% |
| Chippewa | 98 | 0.1% |
| Colombian | 24 | 0.0% |
| Costa Rican | 24 | 0.0% |
| Creek | 7 | 0.0% |
| Croatian | 331 | 0.3% |
| Cuban | 237 | 0.2% |
| Czech | 1,273 | 1.2% |
| Czechoslovakian | 330 | 0.3% |
| Danish | 1,122 | 1.1% |
| Delaware | 5 | 0.0% |
| Dominican | 13 | 0.0% |
| Dutch | 2,870 | 2.7% |
| Eastern European | 272 | 0.3% |
| Ecuadorian | 38 | 0.0% |
| Egyptian | 29 | 0.0% |
| English | 8,379 | 8.0% |
| Estonian | 3 | 0.0% |
| Ethiopian | 1 | 0.0% |
| European | 1,344 | 1.3% |
| Filipino | 3 | 0.0% |
| Finnish | 340 | 0.3% |
| French | 2,364 | 2.2% |
| French American Indian | 5 | 0.0% |
| French Canadian | 526 | 0.5% |
| German | 36,508 | 34.7% |
| German Russian | 23 | 0.0% |
| Greek | 532 | 0.5% |
| Guatemalan | 58 | 0.1% |
| Honduran | 45 | 0.0% |
| Hungarian | 372 | 0.4% |
| Icelander | 35 | 0.0% |
| Indian (Asian) | 140 | 0.1% |
| Indonesian | 9 | 0.0% |
| Inupiat | 20 | 0.0% |
| Iranian | 11 | 0.0% |
| Irish | 14,414 | 13.7% |
| Iroquois | 40 | 0.0% |
| Italian | 5,986 | 5.7% |
| Jamaican | 38 | 0.0% |
| Japanese | 31 | 0.0% |
| Korean | 484 | 0.5% |
| Laotian | 9 | 0.0% |
| Latvian | 41 | 0.0% |
| Lebanese | 38 | 0.0% |
| Liberian | 23 | 0.0% |
| Lithuanian | 504 | 0.5% |
| Luxembourger | 79 | 0.1% |
| Macedonian | 5 | 0.0% |
| Malaysian | 14 | 0.0% |
| Menominee | 7 | 0.0% |
| Mexican | 10,192 | 9.7% |
| Mexican American Indian | 80 | 0.1% |
| Moroccan | 16 | 0.0% |
| Native Hawaiian | 72 | 0.1% |
| Navajo | 11 | 0.0% |
| New Zealander | 37 | 0.0% |
| Nicaraguan | 149 | 0.1% |
| Northern European | 150 | 0.1% |
| Norwegian | 5,572 | 5.3% |
| Ottawa | 6 | 0.0% |
| Palestinian | 20 | 0.0% |
| Panamanian | 26 | 0.0% |
| Paraguayan | 2 | 0.0% |
| Pennsylvania German | 46 | 0.0% |
| Peruvian | 42 | 0.0% |
| Polish | 9,161 | 8.7% |
| Portuguese | 82 | 0.1% |
| Potawatomi | 38 | 0.0% |
| Puerto Rican | 537 | 0.5% |
| Romanian | 78 | 0.1% |
| Russian | 585 | 0.6% |
| Salvadoran | 18 | 0.0% |
| Samoan | 20 | 0.0% |
| Scandinavian | 313 | 0.3% |
| Scotch-Irish | 473 | 0.4% |
| Scottish | 1,438 | 1.4% |
| Serbian | 107 | 0.1% |
| Sioux | 1 | 0.0% |
| Slavic | 118 | 0.1% |
| Slovak | 219 | 0.2% |
| Slovene | 81 | 0.1% |
| South African | 9 | 0.0% |
| South American | 185 | 0.2% |
| South American Indian | 2 | 0.0% |
| Spaniard | 32 | 0.0% |
| Spanish | 129 | 0.1% |
| Sri Lankan | 338 | 0.3% |
| Subsaharan African | 147 | 0.1% |
| Swedish | 3,612 | 3.4% |
| Swiss | 696 | 0.7% |
| Thai | 63 | 0.1% |
| Tohono O'Odham | 28 | 0.0% |
| Turkish | 20 | 0.0% |
| Ukrainian | 252 | 0.2% |
| Uruguayan | 9 | 0.0% |
| Venezuelan | 61 | 0.1% |
| Vietnamese | 22 | 0.0% |
| Welsh | 647 | 0.6% |
| Yugoslavian | 65 | 0.1% | View All 123 Rows |
Immigrants in Walworth County
The most numerous immigrant groups reported in Walworth County came from Latin America (4,185 | 4.0%), Central America (4,079 | 3.9%), Mexico (3,830 | 3.6%), Europe (1,204 | 1.1%), and Asia (742 | 0.7%), together accounting for 13.4% of all Walworth County residents.
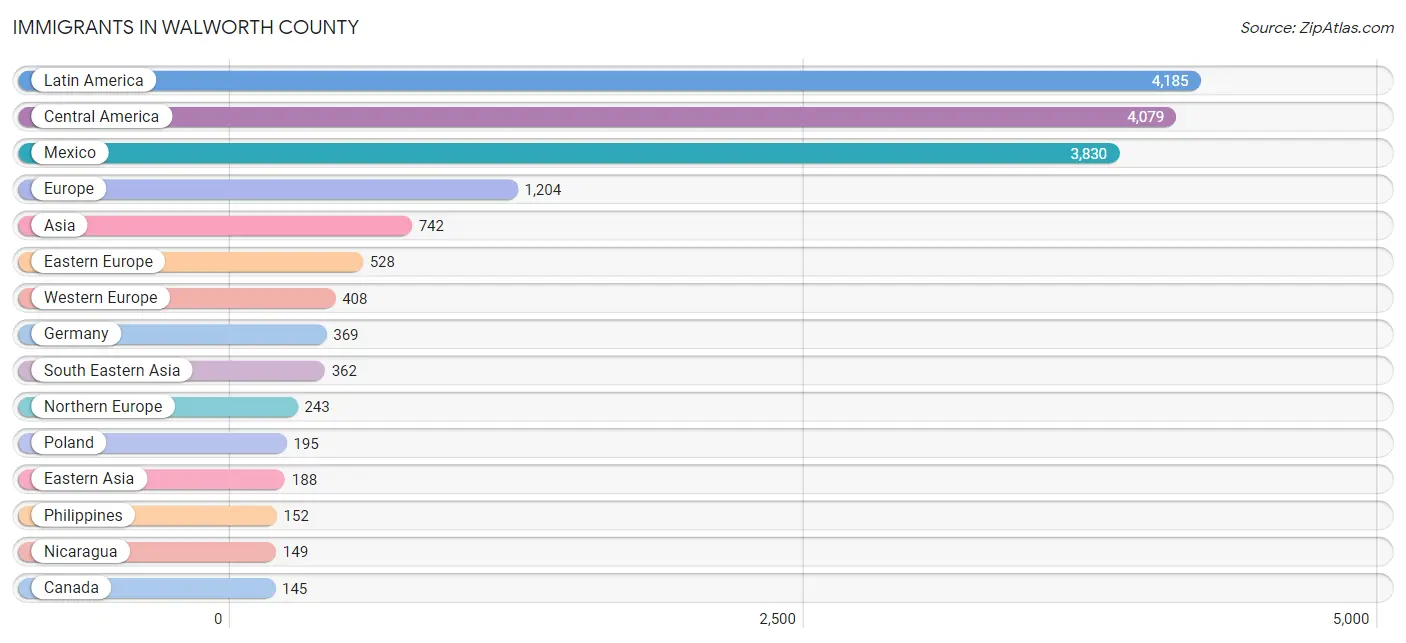
| Immigration Origin | # Population | % Population |
| Africa | 35 | 0.0% |
| Asia | 742 | 0.7% |
| Australia | 9 | 0.0% |
| Austria | 20 | 0.0% |
| Bangladesh | 22 | 0.0% |
| Belarus | 31 | 0.0% |
| Bosnia and Herzegovina | 10 | 0.0% |
| Brazil | 36 | 0.0% |
| Bulgaria | 7 | 0.0% |
| Cambodia | 27 | 0.0% |
| Canada | 145 | 0.1% |
| Caribbean | 7 | 0.0% |
| Central America | 4,079 | 3.9% |
| China | 86 | 0.1% |
| Costa Rica | 11 | 0.0% |
| Croatia | 59 | 0.1% |
| Czechoslovakia | 14 | 0.0% |
| Denmark | 45 | 0.0% |
| Eastern Africa | 19 | 0.0% |
| Eastern Asia | 188 | 0.2% |
| Eastern Europe | 528 | 0.5% |
| Ecuador | 34 | 0.0% |
| England | 87 | 0.1% |
| Ethiopia | 1 | 0.0% |
| Europe | 1,204 | 1.1% |
| France | 16 | 0.0% |
| Germany | 369 | 0.4% |
| Guatemala | 42 | 0.0% |
| Honduras | 45 | 0.0% |
| Hungary | 13 | 0.0% |
| India | 33 | 0.0% |
| Indonesia | 6 | 0.0% |
| Ireland | 3 | 0.0% |
| Italy | 16 | 0.0% |
| Jamaica | 7 | 0.0% |
| Japan | 43 | 0.0% |
| Jordan | 63 | 0.1% |
| Kenya | 18 | 0.0% |
| Korea | 59 | 0.1% |
| Laos | 126 | 0.1% |
| Latin America | 4,185 | 4.0% |
| Latvia | 10 | 0.0% |
| Lebanon | 24 | 0.0% |
| Lithuania | 7 | 0.0% |
| Mexico | 3,830 | 3.6% |
| Morocco | 16 | 0.0% |
| Nepal | 30 | 0.0% |
| Netherlands | 3 | 0.0% |
| Nicaragua | 149 | 0.1% |
| North Macedonia | 5 | 0.0% |
| Northern Africa | 16 | 0.0% |
| Northern Europe | 243 | 0.2% |
| Norway | 9 | 0.0% |
| Oceania | 22 | 0.0% |
| Panama | 2 | 0.0% |
| Peru | 8 | 0.0% |
| Philippines | 152 | 0.1% |
| Poland | 195 | 0.2% |
| Romania | 52 | 0.1% |
| Russia | 5 | 0.0% |
| Serbia | 10 | 0.0% |
| South America | 99 | 0.1% |
| South Central Asia | 85 | 0.1% |
| South Eastern Asia | 362 | 0.3% |
| Southern Europe | 25 | 0.0% |
| Spain | 9 | 0.0% |
| Sweden | 1 | 0.0% |
| Taiwan | 17 | 0.0% |
| Ukraine | 66 | 0.1% |
| Venezuela | 19 | 0.0% |
| Vietnam | 42 | 0.0% |
| Western Asia | 87 | 0.1% |
| Western Europe | 408 | 0.4% | View All 73 Rows |
Sex and Age in Walworth County
Sex and Age in Walworth County
The most populous age groups in Walworth County are 20 to 24 Years (5,024 | 9.5%) for men and 20 to 24 Years (4,856 | 9.3%) for women.
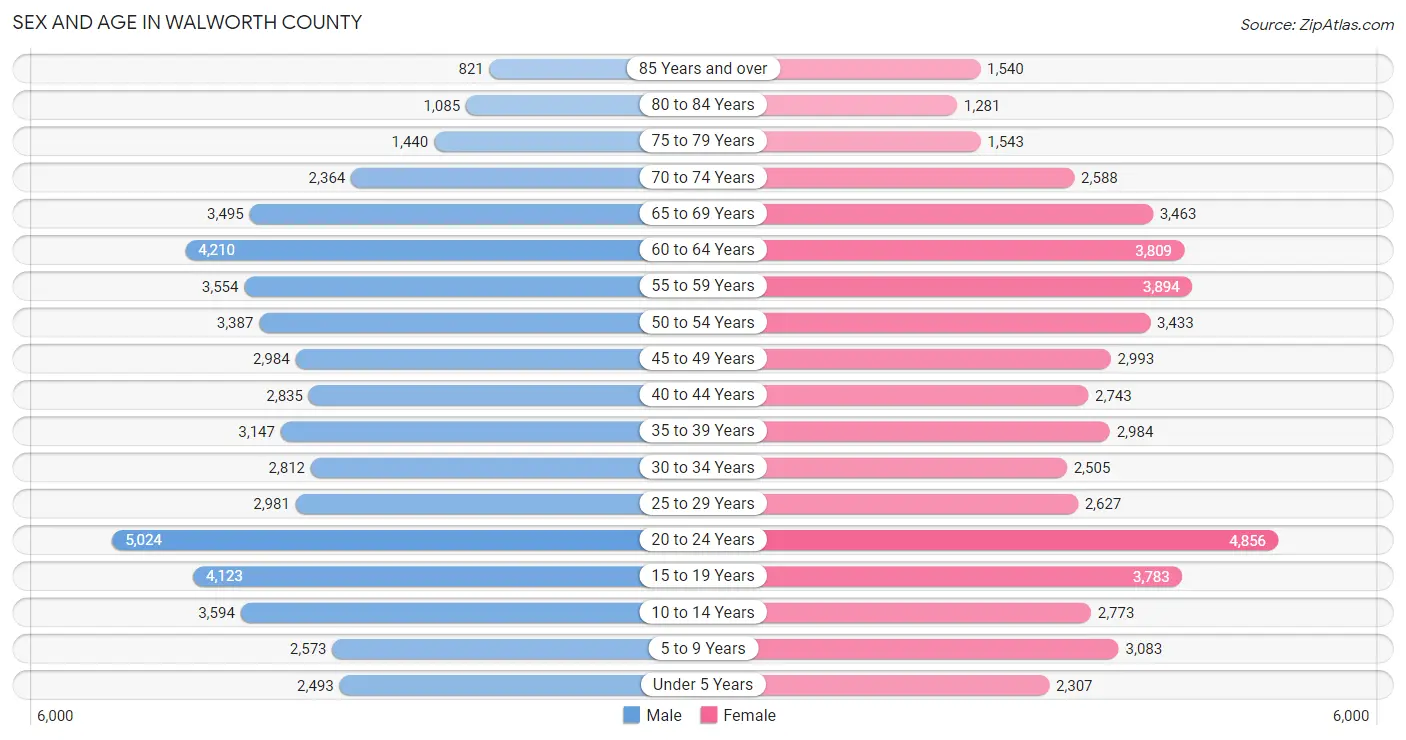
| Age Bracket | Male | Female |
| Under 5 Years | 2,493 (4.7%) | 2,307 (4.4%) |
| 5 to 9 Years | 2,573 (4.9%) | 3,083 (5.9%) |
| 10 to 14 Years | 3,594 (6.8%) | 2,773 (5.3%) |
| 15 to 19 Years | 4,123 (7.8%) | 3,783 (7.2%) |
| 20 to 24 Years | 5,024 (9.5%) | 4,856 (9.3%) |
| 25 to 29 Years | 2,981 (5.6%) | 2,627 (5.0%) |
| 30 to 34 Years | 2,812 (5.3%) | 2,505 (4.8%) |
| 35 to 39 Years | 3,147 (5.9%) | 2,984 (5.7%) |
| 40 to 44 Years | 2,835 (5.4%) | 2,743 (5.2%) |
| 45 to 49 Years | 2,984 (5.6%) | 2,993 (5.7%) |
| 50 to 54 Years | 3,387 (6.4%) | 3,433 (6.6%) |
| 55 to 59 Years | 3,554 (6.7%) | 3,894 (7.5%) |
| 60 to 64 Years | 4,210 (8.0%) | 3,809 (7.3%) |
| 65 to 69 Years | 3,495 (6.6%) | 3,463 (6.6%) |
| 70 to 74 Years | 2,364 (4.5%) | 2,588 (5.0%) |
| 75 to 79 Years | 1,440 (2.7%) | 1,543 (3.0%) |
| 80 to 84 Years | 1,085 (2.1%) | 1,281 (2.5%) |
| 85 Years and over | 821 (1.5%) | 1,540 (2.9%) |
| Total | 52,922 (100.0%) | 52,205 (100.0%) |
Families and Households in Walworth County
Median Family Size in Walworth County
The median family size in Walworth County is 2.94 persons per family, with single female/mother families (3,899 | 14.2%) accounting for the largest median family size of 3 persons per family. On the other hand, single male/father families (2,154 | 7.9%) represent the smallest median family size with 2.54 persons per family.
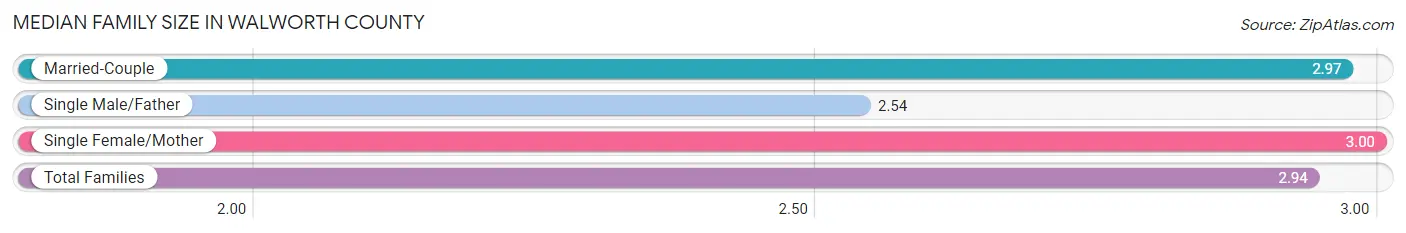
| Family Type | # Families | Family Size |
| Married-Couple | 21,363 (77.9%) | 2.97 |
| Single Male/Father | 2,154 (7.9%) | 2.54 |
| Single Female/Mother | 3,899 (14.2%) | 3.00 |
| Total Families | 27,416 (100.0%) | 2.94 |
Median Household Size in Walworth County
The median household size in Walworth County is 2.42 persons per household, with single female/mother households (3,899 | 9.2%) accounting for the largest median household size of 3.25 persons per household. non-family households (14,763 | 35.0%) represent the smallest median household size with 1.31 persons per household.
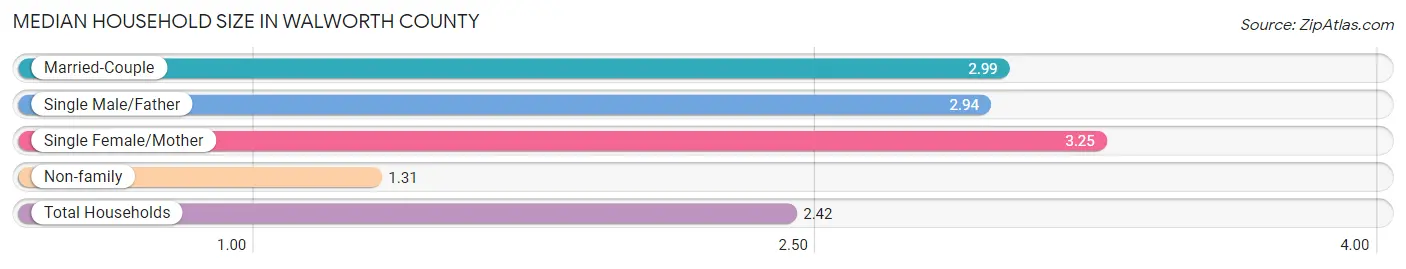
| Household Type | # Households | Household Size |
| Married-Couple | 21,363 (50.6%) | 2.99 |
| Single Male/Father | 2,154 (5.1%) | 2.94 |
| Single Female/Mother | 3,899 (9.2%) | 3.25 |
| Non-family | 14,763 (35.0%) | 1.31 |
| Total Households | 42,179 (100.0%) | 2.42 |
Household Size by Marriage Status in Walworth County
Out of a total of 42,179 households in Walworth County, 27,416 (65.0%) are family households, while 14,763 (35.0%) are nonfamily households. The most numerous type of family households are 2-person households, comprising 13,402, and the most common type of nonfamily households are 1-person households, comprising 11,559.
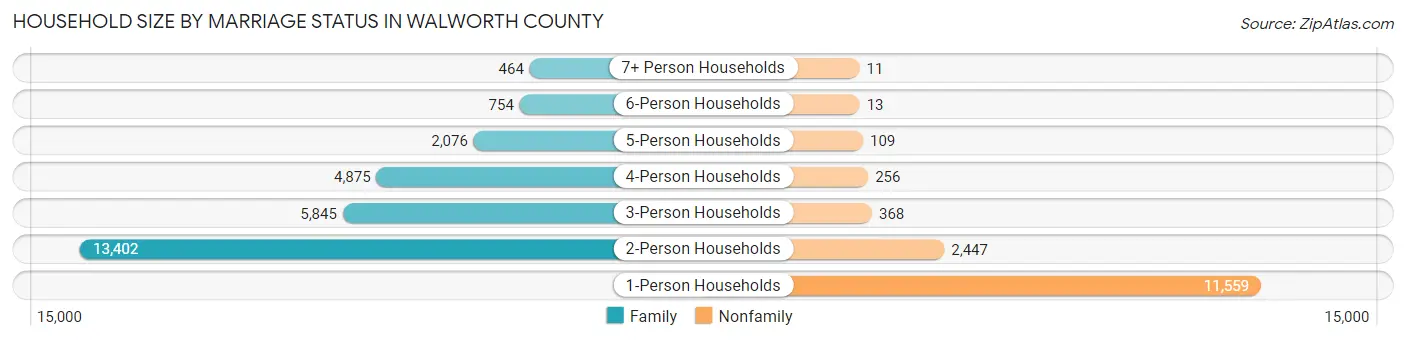
| Household Size | Family Households | Nonfamily Households |
| 1-Person Households | - | 11,559 (27.4%) |
| 2-Person Households | 13,402 (31.8%) | 2,447 (5.8%) |
| 3-Person Households | 5,845 (13.9%) | 368 (0.9%) |
| 4-Person Households | 4,875 (11.6%) | 256 (0.6%) |
| 5-Person Households | 2,076 (4.9%) | 109 (0.3%) |
| 6-Person Households | 754 (1.8%) | 13 (0.0%) |
| 7+ Person Households | 464 (1.1%) | 11 (0.0%) |
| Total | 27,416 (65.0%) | 14,763 (35.0%) |
Female Fertility in Walworth County
Fertility by Age in Walworth County
Average fertility rate in Walworth County is 38.0 births per 1,000 women. Women in the age bracket of 20 to 34 years have the highest fertility rate with 61.0 births per 1,000 women. Women in the age bracket of 20 to 34 years acount for 69.5% of all women with births.
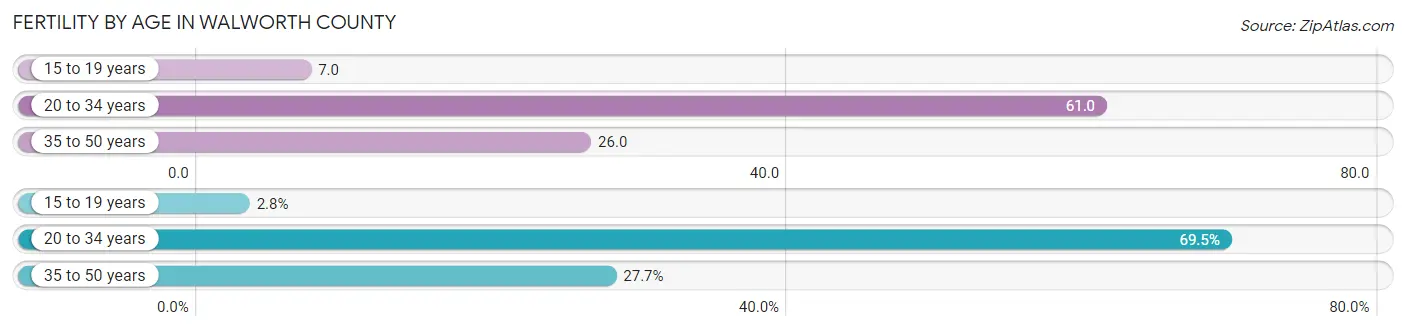
| Age Bracket | Women with Births | Births / 1,000 Women |
| 15 to 19 years | 25 (2.8%) | 7.0 |
| 20 to 34 years | 614 (69.5%) | 61.0 |
| 35 to 50 years | 245 (27.7%) | 26.0 |
| Total | 884 (100.0%) | 38.0 |
Fertility by Age by Marriage Status in Walworth County
69.8% of women with births (884) in Walworth County are married. The highest percentage of unmarried women with births falls into 15 to 19 years age bracket with 100.0% of them unmarried at the time of birth, while the lowest percentage of unmarried women with births belong to 20 to 34 years age bracket with 24.8% of them unmarried.

| Age Bracket | Married | Unmarried |
| 15 to 19 years | 0 (0.0%) | 25 (100.0%) |
| 20 to 34 years | 462 (75.2%) | 152 (24.8%) |
| 35 to 50 years | 155 (63.3%) | 90 (36.7%) |
| Total | 617 (69.8%) | 267 (30.2%) |
Fertility by Education in Walworth County
Average fertility rate in Walworth County is 38.0 births per 1,000 women. Women with the education attainment of graduate degree have the highest fertility rate of 65.0 births per 1,000 women, while women with the education attainment of less than high school have the lowest fertility at 7.0 births per 1,000 women. Women with the education attainment of college or associate's degree represent 31.3% of all women with births.
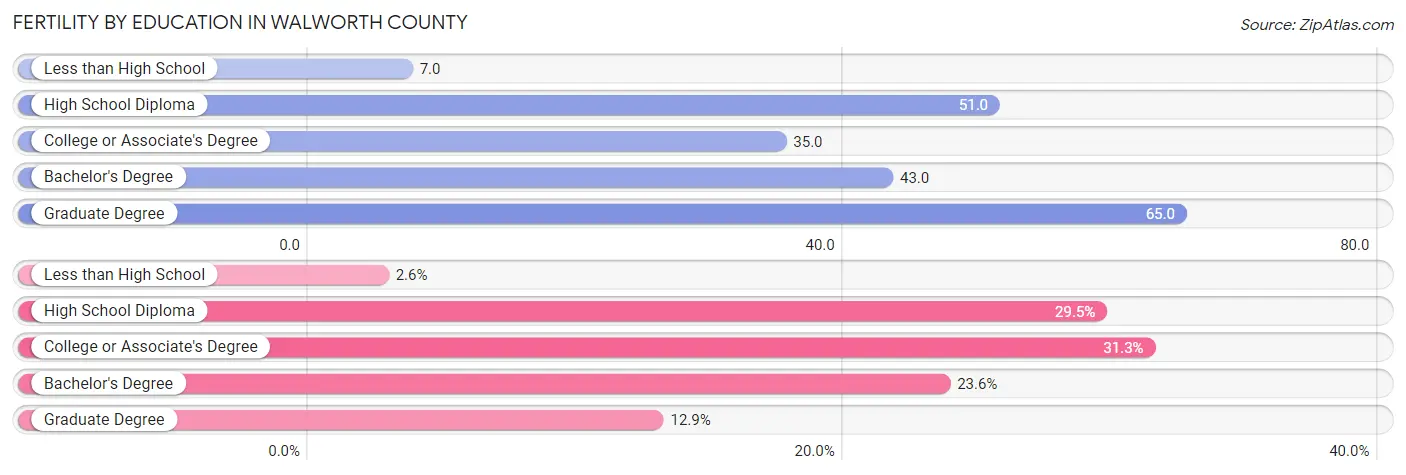
| Educational Attainment | Women with Births | Births / 1,000 Women |
| Less than High School | 23 (2.6%) | 7.0 |
| High School Diploma | 261 (29.5%) | 51.0 |
| College or Associate's Degree | 277 (31.3%) | 35.0 |
| Bachelor's Degree | 209 (23.6%) | 43.0 |
| Graduate Degree | 114 (12.9%) | 65.0 |
| Total | 884 (100.0%) | 38.0 |
Fertility by Education by Marriage Status in Walworth County
30.2% of women with births in Walworth County are unmarried. Women with the educational attainment of graduate degree are most likely to be married with 100.0% of them married at childbirth, while women with the educational attainment of high school diploma are least likely to be married with 60.9% of them unmarried at childbirth.

| Educational Attainment | Married | Unmarried |
| Less than High School | 19 (82.6%) | 4 (17.4%) |
| High School Diploma | 102 (39.1%) | 159 (60.9%) |
| College or Associate's Degree | 207 (74.7%) | 70 (25.3%) |
| Bachelor's Degree | 175 (83.7%) | 34 (16.3%) |
| Graduate Degree | 114 (100.0%) | 0 (0.0%) |
| Total | 617 (69.8%) | 267 (30.2%) |
Income in Walworth County
Income Overview in Walworth County
Per Capita Income in Walworth County is $40,386, while median incomes of families and households are $94,281 and $75,172 respectively.
| Characteristic | Number | Measure |
| Per Capita Income | 105,127 | $40,386 |
| Median Family Income | 27,416 | $94,281 |
| Mean Family Income | 27,416 | $117,897 |
| Median Household Income | 42,179 | $75,172 |
| Mean Household Income | 42,179 | $98,901 |
| Income Deficit | 27,416 | $9,758 |
| Wage / Income Gap (%) | 105,127 | 37.09% |
| Wage / Income Gap ($) | 105,127 | 62.91¢ per $1 |
| Gini / Inequality Index | 105,127 | 0.44 |
Earnings by Sex in Walworth County
Average Earnings in Walworth County are $38,709, $48,127 for men and $30,275 for women, a difference of 37.1%.
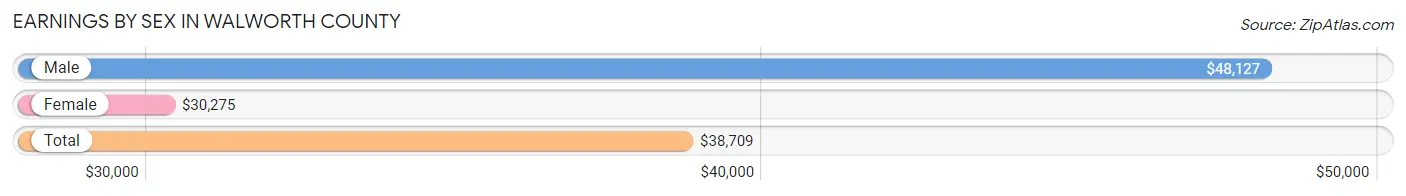
| Sex | Number | Average Earnings |
| Male | 32,690 (52.7%) | $48,127 |
| Female | 29,377 (47.3%) | $30,275 |
| Total | 62,067 (100.0%) | $38,709 |
Earnings by Sex by Income Bracket in Walworth County
The most common earnings brackets in Walworth County are $100,000+ for men (4,824 | 14.8%) and $35,000 to $39,999 for women (1,951 | 6.6%).
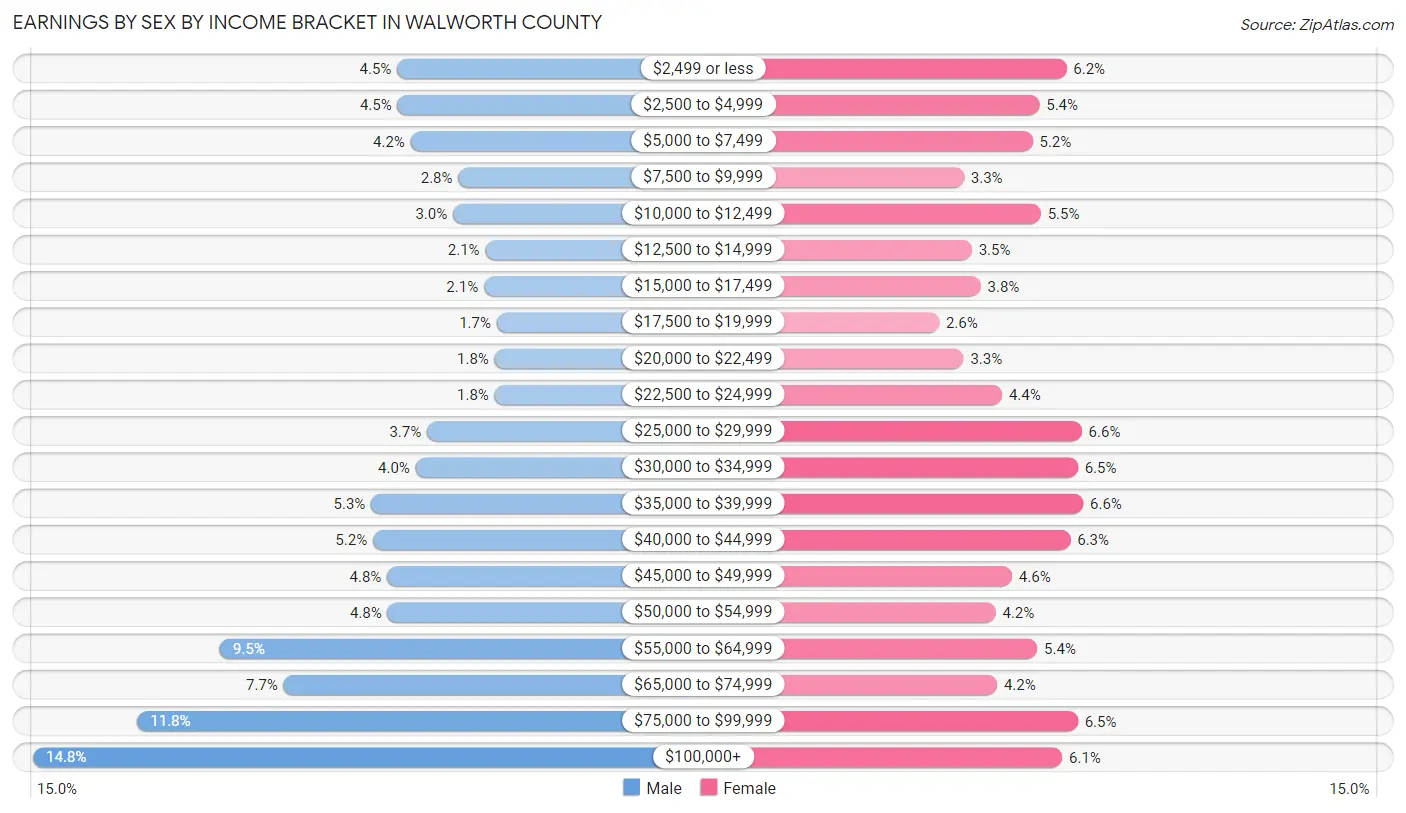
| Income | Male | Female |
| $2,499 or less | 1,482 (4.5%) | 1,813 (6.2%) |
| $2,500 to $4,999 | 1,477 (4.5%) | 1,590 (5.4%) |
| $5,000 to $7,499 | 1,358 (4.2%) | 1,534 (5.2%) |
| $7,500 to $9,999 | 917 (2.8%) | 966 (3.3%) |
| $10,000 to $12,499 | 967 (3.0%) | 1,601 (5.4%) |
| $12,500 to $14,999 | 671 (2.1%) | 1,032 (3.5%) |
| $15,000 to $17,499 | 684 (2.1%) | 1,106 (3.8%) |
| $17,500 to $19,999 | 565 (1.7%) | 760 (2.6%) |
| $20,000 to $22,499 | 584 (1.8%) | 965 (3.3%) |
| $22,500 to $24,999 | 585 (1.8%) | 1,282 (4.4%) |
| $25,000 to $29,999 | 1,205 (3.7%) | 1,940 (6.6%) |
| $30,000 to $34,999 | 1,310 (4.0%) | 1,906 (6.5%) |
| $35,000 to $39,999 | 1,718 (5.3%) | 1,951 (6.6%) |
| $40,000 to $44,999 | 1,702 (5.2%) | 1,844 (6.3%) |
| $45,000 to $49,999 | 1,571 (4.8%) | 1,362 (4.6%) |
| $50,000 to $54,999 | 1,568 (4.8%) | 1,228 (4.2%) |
| $55,000 to $64,999 | 3,109 (9.5%) | 1,572 (5.3%) |
| $65,000 to $74,999 | 2,525 (7.7%) | 1,241 (4.2%) |
| $75,000 to $99,999 | 3,868 (11.8%) | 1,907 (6.5%) |
| $100,000+ | 4,824 (14.8%) | 1,777 (6.0%) |
| Total | 32,690 (100.0%) | 29,377 (100.0%) |
Earnings by Sex by Educational Attainment in Walworth County
Average earnings in Walworth County are $57,963 for men and $37,743 for women, a difference of 34.9%. Men with an educational attainment of graduate degree enjoy the highest average annual earnings of $84,475, while those with less than high school education earn the least with $45,025. Women with an educational attainment of graduate degree earn the most with the average annual earnings of $68,542, while those with less than high school education have the smallest earnings of $25,568.
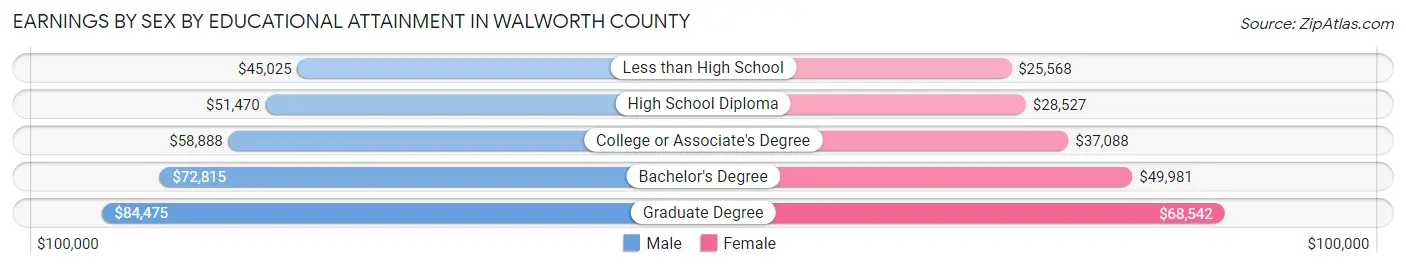
| Educational Attainment | Male Income | Female Income |
| Less than High School | $45,025 | $25,568 |
| High School Diploma | $51,470 | $28,527 |
| College or Associate's Degree | $58,888 | $37,088 |
| Bachelor's Degree | $72,815 | $49,981 |
| Graduate Degree | $84,475 | $68,542 |
| Total | $57,963 | $37,743 |
Family Income in Walworth County
Family Income Brackets in Walworth County
According to the Walworth County family income data, there are 6,196 families falling into the $100,000 to $149,999 income range, which is the most common income bracket and makes up 22.6% of all families. Conversely, the less than $10,000 income bracket is the least frequent group with only 329 families (1.2%) belonging to this category.
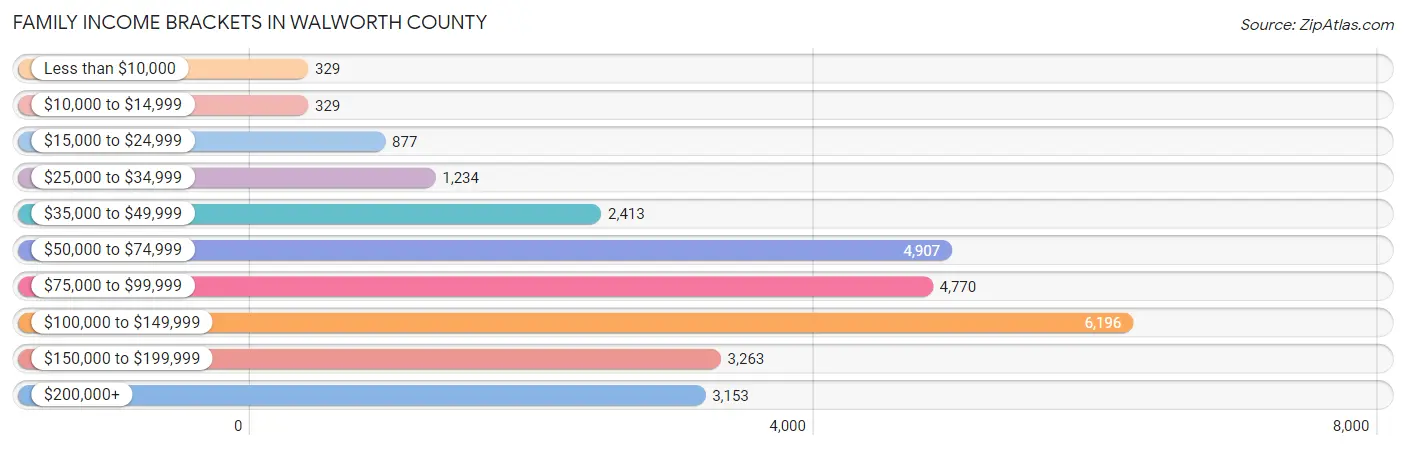
| Income Bracket | # Families | % Families |
| Less than $10,000 | 329 | 1.2% |
| $10,000 to $14,999 | 329 | 1.2% |
| $15,000 to $24,999 | 877 | 3.2% |
| $25,000 to $34,999 | 1,234 | 4.5% |
| $35,000 to $49,999 | 2,413 | 8.8% |
| $50,000 to $74,999 | 4,907 | 17.9% |
| $75,000 to $99,999 | 4,770 | 17.4% |
| $100,000 to $149,999 | 6,196 | 22.6% |
| $150,000 to $199,999 | 3,263 | 11.9% |
| $200,000+ | 3,153 | 11.5% |
Family Income by Famaliy Size in Walworth County
6-person families (673 | 2.5%) account for the highest median family income in Walworth County with $152,847 per family, while 2-person families (14,369 | 52.4%) have the highest median income of $41,658 per family member.
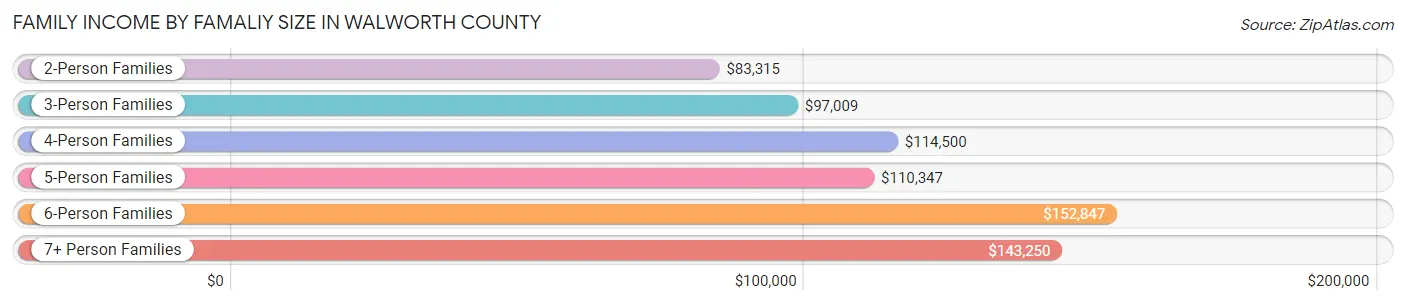
| Income Bracket | # Families | Median Income |
| 2-Person Families | 14,369 (52.4%) | $83,315 |
| 3-Person Families | 5,542 (20.2%) | $97,009 |
| 4-Person Families | 4,568 (16.7%) | $114,500 |
| 5-Person Families | 1,872 (6.8%) | $110,347 |
| 6-Person Families | 673 (2.5%) | $152,847 |
| 7+ Person Families | 392 (1.4%) | $143,250 |
| Total | 27,416 (100.0%) | $94,281 |
Family Income by Number of Earners in Walworth County
The median family income in Walworth County is $94,281, with families comprising 3+ earners (3,873) having the highest median family income of $138,125, while families with no earners (3,967) have the lowest median family income of $58,128, accounting for 14.1% and 14.5% of families, respectively.
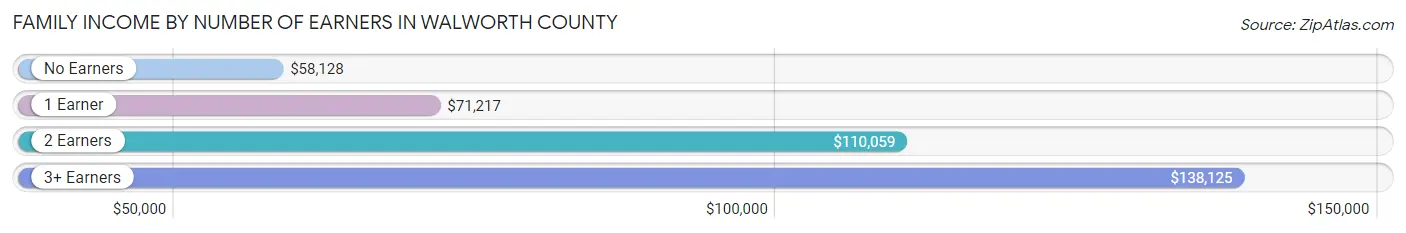
| Number of Earners | # Families | Median Income |
| No Earners | 3,967 (14.5%) | $58,128 |
| 1 Earner | 7,521 (27.4%) | $71,217 |
| 2 Earners | 12,055 (44.0%) | $110,059 |
| 3+ Earners | 3,873 (14.1%) | $138,125 |
| Total | 27,416 (100.0%) | $94,281 |
Household Income in Walworth County
Household Income Brackets in Walworth County
With 8,098 households falling in the category, the $50,000 to $74,999 income range is the most frequent in Walworth County, accounting for 19.2% of all households. In contrast, only 1,139 households (2.7%) fall into the $10,000 to $14,999 income bracket, making it the least populous group.
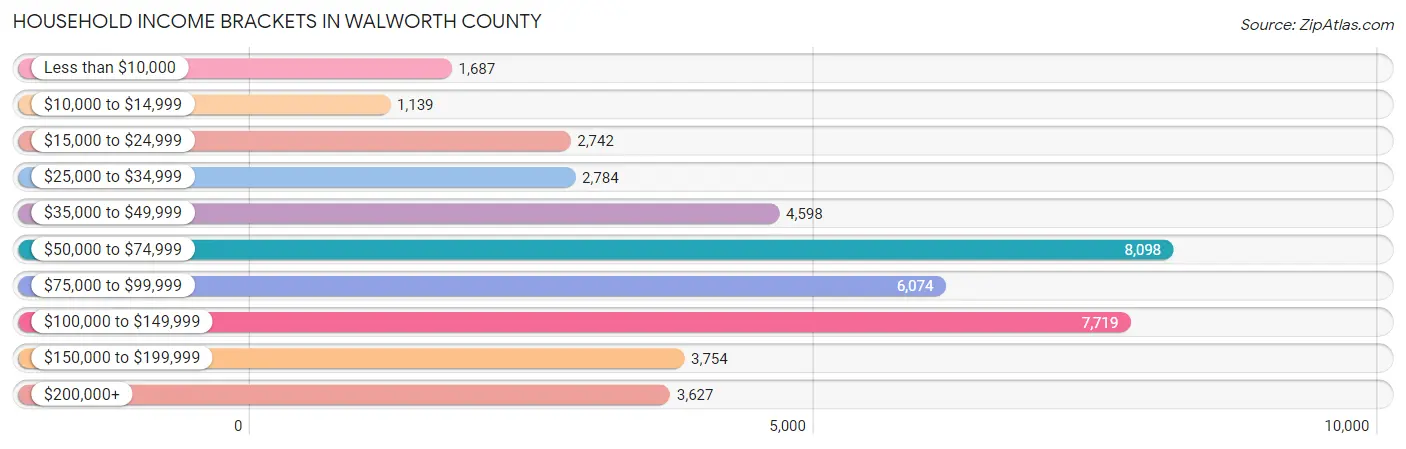
| Income Bracket | # Households | % Households |
| Less than $10,000 | 1,687 | 4.0% |
| $10,000 to $14,999 | 1,139 | 2.7% |
| $15,000 to $24,999 | 2,742 | 6.5% |
| $25,000 to $34,999 | 2,784 | 6.6% |
| $35,000 to $49,999 | 4,598 | 10.9% |
| $50,000 to $74,999 | 8,098 | 19.2% |
| $75,000 to $99,999 | 6,074 | 14.4% |
| $100,000 to $149,999 | 7,719 | 18.3% |
| $150,000 to $199,999 | 3,754 | 8.9% |
| $200,000+ | 3,627 | 8.6% |
Household Income by Householder Age in Walworth County
The median household income in Walworth County is $75,172, with the highest median household income of $96,786 found in the 45 to 64 years age bracket for the primary householder. A total of 15,867 households (37.6%) fall into this category. Meanwhile, the 15 to 24 years age bracket for the primary householder has the lowest median household income of $33,474, with 3,034 households (7.2%) in this group.
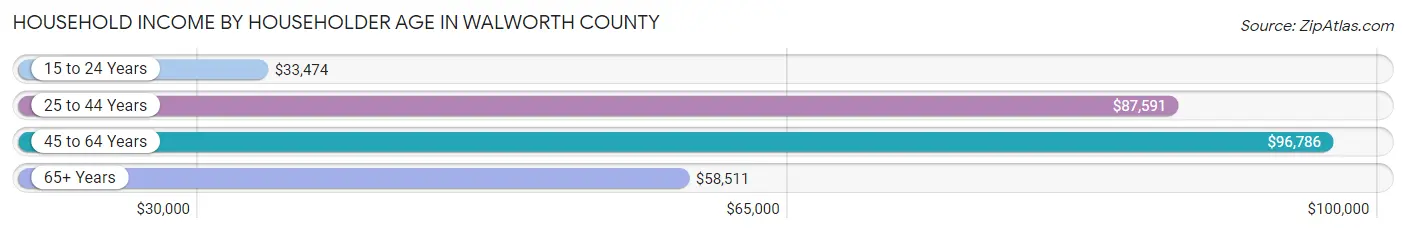
| Income Bracket | # Households | Median Income |
| 15 to 24 Years | 3,034 (7.2%) | $33,474 |
| 25 to 44 Years | 10,893 (25.8%) | $87,591 |
| 45 to 64 Years | 15,867 (37.6%) | $96,786 |
| 65+ Years | 12,385 (29.4%) | $58,511 |
| Total | 42,179 (100.0%) | $75,172 |
Poverty in Walworth County
Income Below Poverty by Sex and Age in Walworth County
With 9.0% poverty level for males and 10.1% for females among the residents of Walworth County, 18 to 24 year old males and 18 to 24 year old females are the most vulnerable to poverty, with 1,856 males (29.2%) and 1,350 females (24.6%) in their respective age groups living below the poverty level.
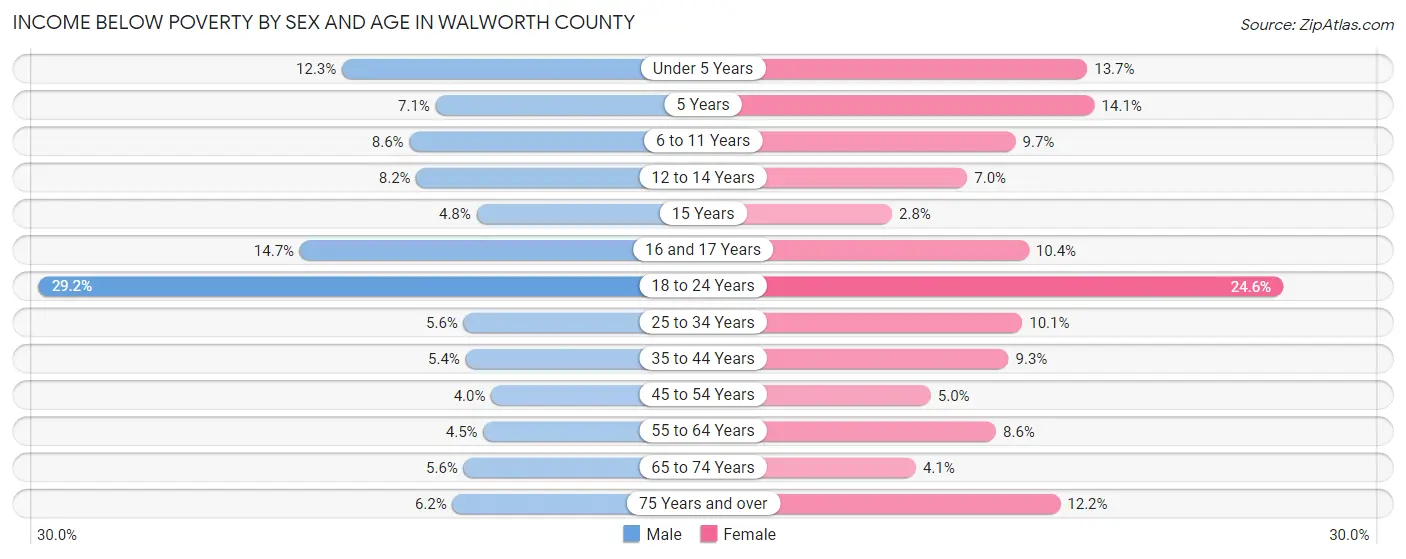
| Age Bracket | Male | Female |
| Under 5 Years | 305 (12.3%) | 312 (13.7%) |
| 5 Years | 29 (7.1%) | 58 (14.1%) |
| 6 to 11 Years | 323 (8.6%) | 365 (9.7%) |
| 12 to 14 Years | 154 (8.2%) | 104 (7.0%) |
| 15 Years | 39 (4.8%) | 17 (2.8%) |
| 16 and 17 Years | 196 (14.7%) | 145 (10.4%) |
| 18 to 24 Years | 1,856 (29.2%) | 1,350 (24.6%) |
| 25 to 34 Years | 319 (5.6%) | 516 (10.1%) |
| 35 to 44 Years | 324 (5.4%) | 531 (9.3%) |
| 45 to 54 Years | 255 (4.0%) | 318 (5.0%) |
| 55 to 64 Years | 344 (4.4%) | 659 (8.6%) |
| 65 to 74 Years | 324 (5.6%) | 248 (4.1%) |
| 75 Years and over | 200 (6.2%) | 495 (12.2%) |
| Total | 4,668 (9.0%) | 5,118 (10.1%) |
Income Above Poverty by Sex and Age in Walworth County
According to the poverty statistics in Walworth County, males aged 45 to 54 years and females aged 15 years are the age groups that are most secure financially, with 96.0% of males and 97.2% of females in these age groups living above the poverty line.
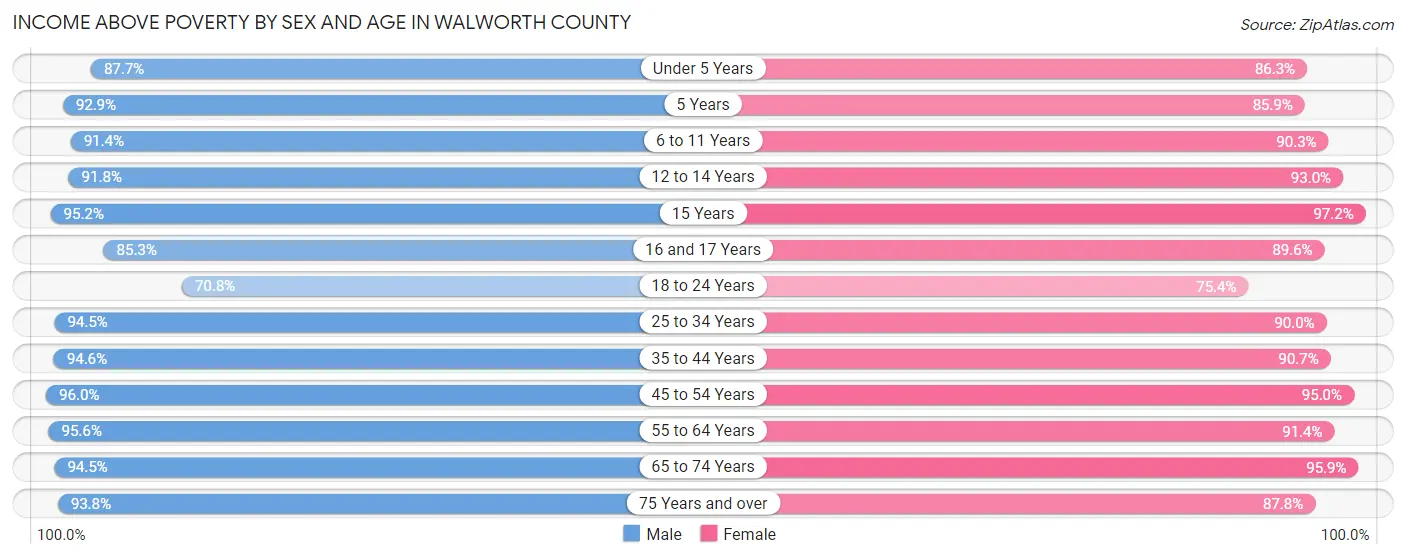
| Age Bracket | Male | Female |
| Under 5 Years | 2,170 (87.7%) | 1,970 (86.3%) |
| 5 Years | 379 (92.9%) | 354 (85.9%) |
| 6 to 11 Years | 3,445 (91.4%) | 3,407 (90.3%) |
| 12 to 14 Years | 1,729 (91.8%) | 1,383 (93.0%) |
| 15 Years | 769 (95.2%) | 591 (97.2%) |
| 16 and 17 Years | 1,140 (85.3%) | 1,246 (89.6%) |
| 18 to 24 Years | 4,497 (70.8%) | 4,146 (75.4%) |
| 25 to 34 Years | 5,433 (94.5%) | 4,616 (89.9%) |
| 35 to 44 Years | 5,631 (94.6%) | 5,183 (90.7%) |
| 45 to 54 Years | 6,100 (96.0%) | 6,094 (95.0%) |
| 55 to 64 Years | 7,386 (95.6%) | 7,013 (91.4%) |
| 65 to 74 Years | 5,519 (94.5%) | 5,758 (95.9%) |
| 75 Years and over | 3,039 (93.8%) | 3,571 (87.8%) |
| Total | 47,237 (91.0%) | 45,332 (89.9%) |
Income Below Poverty Among Married-Couple Families in Walworth County
The poverty statistics for married-couple families in Walworth County show that 2.3% or 492 of the total 21,363 families live below the poverty line. Families with 5 or more children have the highest poverty rate of 10.7%, comprising of 13 families. On the other hand, families with no children have the lowest poverty rate of 2.1%, which includes 288 families.
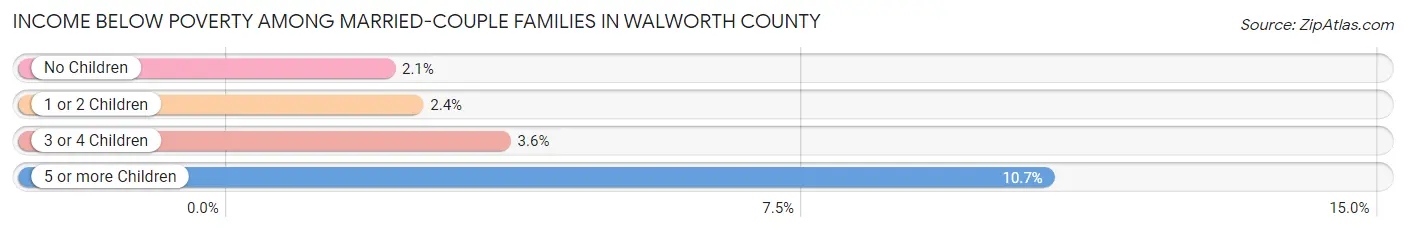
| Children | Above Poverty | Below Poverty |
| No Children | 13,740 (98.0%) | 288 (2.1%) |
| 1 or 2 Children | 5,642 (97.6%) | 140 (2.4%) |
| 3 or 4 Children | 1,380 (96.4%) | 51 (3.6%) |
| 5 or more Children | 109 (89.3%) | 13 (10.7%) |
| Total | 20,871 (97.7%) | 492 (2.3%) |
Income Below Poverty Among Single-Parent Households in Walworth County
According to the poverty data in Walworth County, 4.8% or 104 single-father households and 17.2% or 672 single-mother households are living below the poverty line. Among single-father households, those with 3 or 4 children have the highest poverty rate, with 9 households (6.2%) experiencing poverty. Likewise, among single-mother households, those with 5 or more children have the highest poverty rate, with 17 households (58.6%) falling below the poverty line.
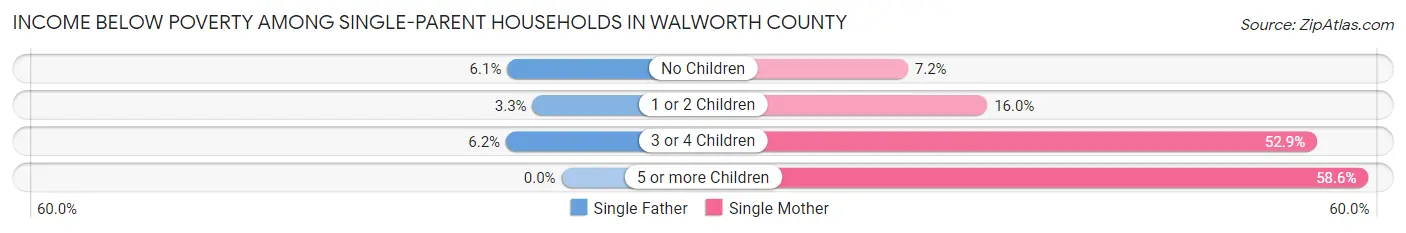
| Children | Single Father | Single Mother |
| No Children | 64 (6.1%) | 116 (7.2%) |
| 1 or 2 Children | 31 (3.3%) | 284 (16.0%) |
| 3 or 4 Children | 9 (6.2%) | 255 (52.9%) |
| 5 or more Children | 0 (0.0%) | 17 (58.6%) |
| Total | 104 (4.8%) | 672 (17.2%) |
Income Below Poverty Among Married-Couple vs Single-Parent Households in Walworth County
The poverty data for Walworth County shows that 492 of the married-couple family households (2.3%) and 776 of the single-parent households (12.8%) are living below the poverty level. Within the married-couple family households, those with 5 or more children have the highest poverty rate, with 13 households (10.7%) falling below the poverty line. Among the single-parent households, those with 5 or more children have the highest poverty rate, with 17 household (58.6%) living below poverty.
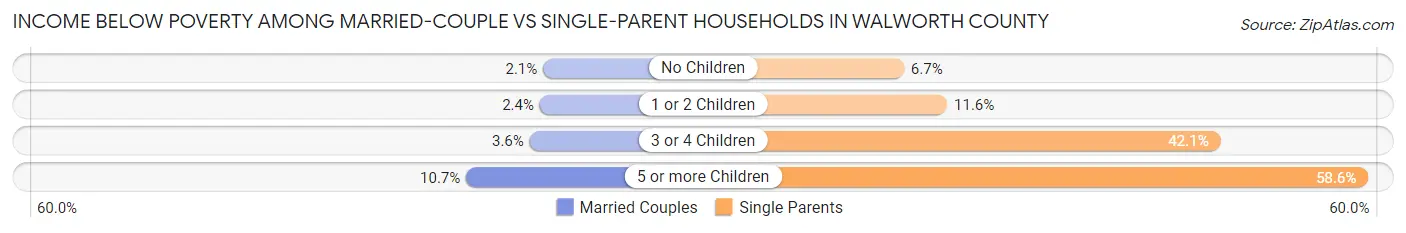
| Children | Married-Couple Families | Single-Parent Households |
| No Children | 288 (2.1%) | 180 (6.7%) |
| 1 or 2 Children | 140 (2.4%) | 315 (11.6%) |
| 3 or 4 Children | 51 (3.6%) | 264 (42.1%) |
| 5 or more Children | 13 (10.7%) | 17 (58.6%) |
| Total | 492 (2.3%) | 776 (12.8%) |
Employment Characteristics in Walworth County
Employment by Class of Employer in Walworth County
Among the 54,345 employed individuals in Walworth County, private company employees (37,830 | 69.6%), not-for-profit organizations (4,754 | 8.7%), and local government employees (4,418 | 8.1%) make up the most common classes of employment.
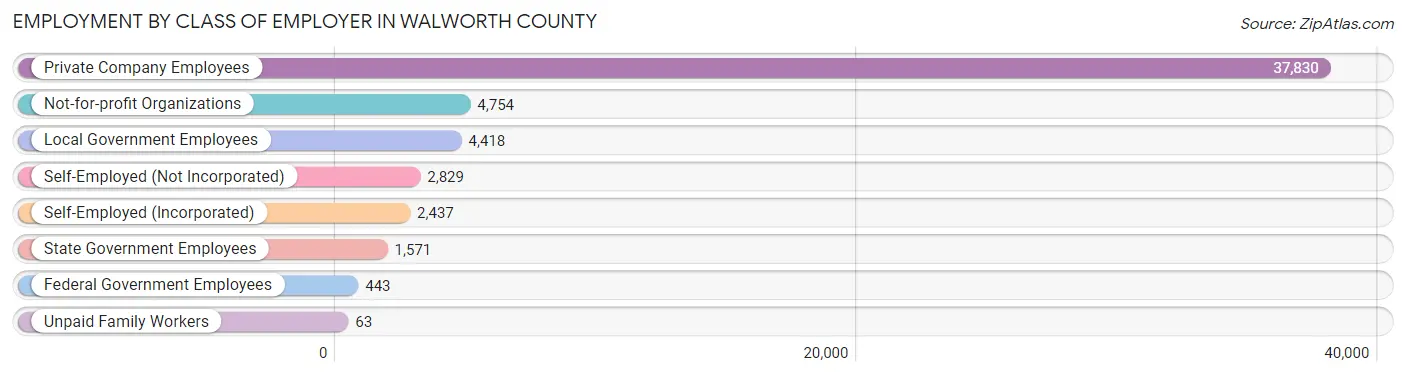
| Employer Class | # Employees | % Employees |
| Private Company Employees | 37,830 | 69.6% |
| Self-Employed (Incorporated) | 2,437 | 4.5% |
| Self-Employed (Not Incorporated) | 2,829 | 5.2% |
| Not-for-profit Organizations | 4,754 | 8.7% |
| Local Government Employees | 4,418 | 8.1% |
| State Government Employees | 1,571 | 2.9% |
| Federal Government Employees | 443 | 0.8% |
| Unpaid Family Workers | 63 | 0.1% |
| Total | 54,345 | 100.0% |
Employment Status by Age in Walworth County
According to the labor force statistics for Walworth County, out of the total population over 16 years of age (86,887), 66.1% or 57,432 individuals are in the labor force, with 3.1% or 1,780 of them unemployed. The age group with the highest labor force participation rate is 25 to 29 years, with 91.2% or 5,114 individuals in the labor force. Within the labor force, the 16 to 19 years age range has the highest percentage of unemployed individuals, with 4.6% or 163 of them being unemployed.
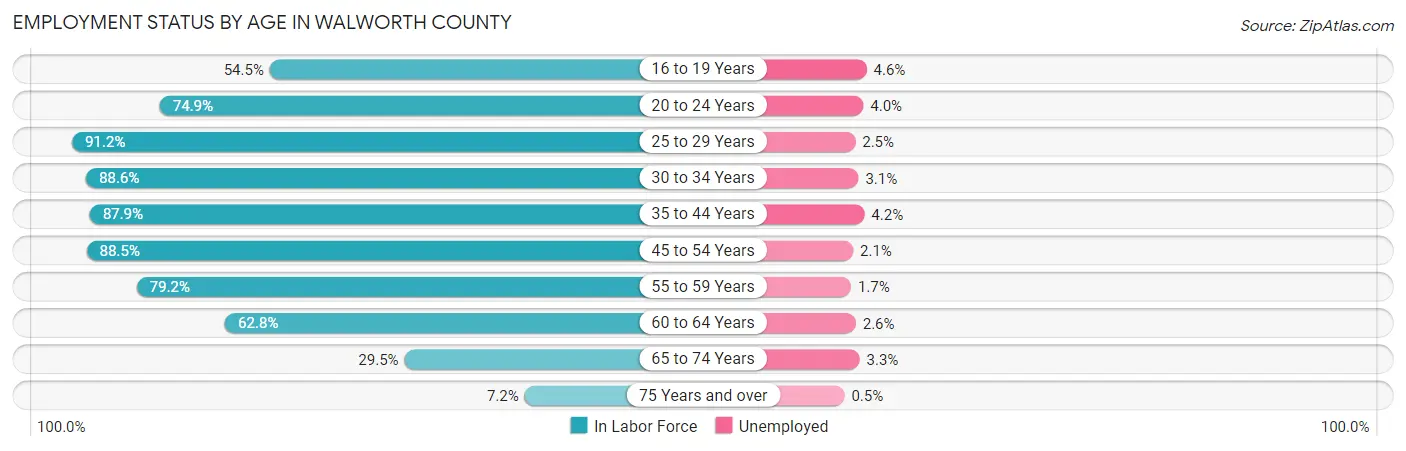
| Age Bracket | In Labor Force | Unemployed |
| 16 to 19 Years | 3,537 (54.5%) | 163 (4.6%) |
| 20 to 24 Years | 7,400 (74.9%) | 296 (4.0%) |
| 25 to 29 Years | 5,114 (91.2%) | 128 (2.5%) |
| 30 to 34 Years | 4,711 (88.6%) | 146 (3.1%) |
| 35 to 44 Years | 10,292 (87.9%) | 432 (4.2%) |
| 45 to 54 Years | 11,325 (88.5%) | 238 (2.1%) |
| 55 to 59 Years | 5,899 (79.2%) | 100 (1.7%) |
| 60 to 64 Years | 5,036 (62.8%) | 131 (2.6%) |
| 65 to 74 Years | 3,513 (29.5%) | 116 (3.3%) |
| 75 Years and over | 555 (7.2%) | 3 (0.5%) |
| Total | 57,432 (66.1%) | 1,780 (3.1%) |
Employment Status by Educational Attainment in Walworth County
According to labor force statistics for Walworth County, 83.3% of individuals (42,398) out of the total population between 25 and 64 years of age (50,898) are in the labor force, with 2.8% or 1,187 of them being unemployed. The group with the highest labor force participation rate are those with the educational attainment of bachelor's degree or higher, with 86.2% or 13,591 individuals in the labor force. Within the labor force, individuals with less than high school education have the highest percentage of unemployment, with 6.5% or 219 of them being unemployed.
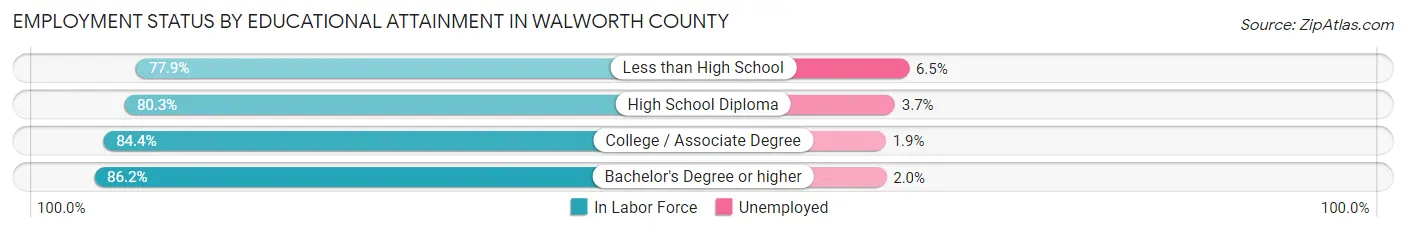
| Educational Attainment | In Labor Force | Unemployed |
| Less than High School | 3,370 (77.9%) | 281 (6.5%) |
| High School Diploma | 11,364 (80.3%) | 524 (3.7%) |
| College / Associate Degree | 14,055 (84.4%) | 316 (1.9%) |
| Bachelor's Degree or higher | 13,591 (86.2%) | 315 (2.0%) |
| Total | 42,398 (83.3%) | 1,425 (2.8%) |
Employment Occupations by Sex in Walworth County
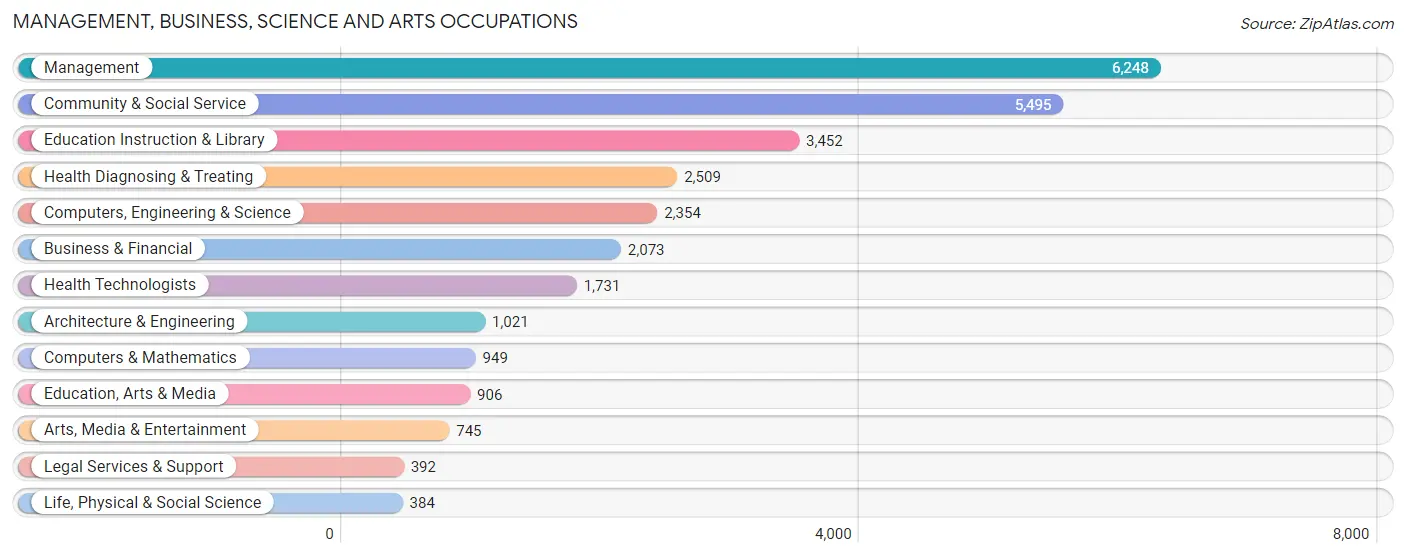
Management, Business, Science and Arts Occupations
The most common Management, Business, Science and Arts occupations in Walworth County are Management (6,248 | 11.2%), Community & Social Service (5,495 | 9.9%), Education Instruction & Library (3,452 | 6.2%), Health Diagnosing & Treating (2,509 | 4.5%), and Computers, Engineering & Science (2,354 | 4.2%).
Management, Business, Science and Arts Occupations by Sex
Within the Management, Business, Science and Arts occupations in Walworth County, the most male-oriented occupations are Architecture & Engineering (86.6%), Computers, Engineering & Science (70.8%), and Computers & Mathematics (70.2%), while the most female-oriented occupations are Health Diagnosing & Treating (79.9%), Education Instruction & Library (77.4%), and Health Technologists (75.4%).
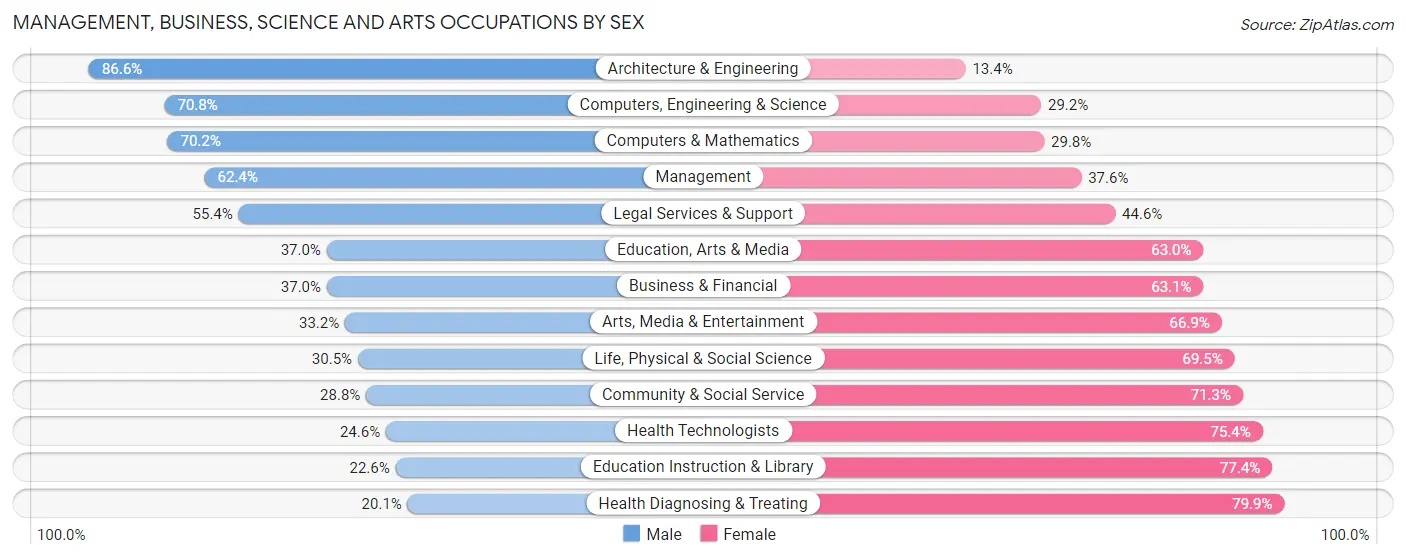
| Occupation | Male | Female |
| Management | 3,901 (62.4%) | 2,347 (37.6%) |
| Business & Financial | 766 (36.9%) | 1,307 (63.0%) |
| Computers, Engineering & Science | 1,667 (70.8%) | 687 (29.2%) |
| Computers & Mathematics | 666 (70.2%) | 283 (29.8%) |
| Architecture & Engineering | 884 (86.6%) | 137 (13.4%) |
| Life, Physical & Social Science | 117 (30.5%) | 267 (69.5%) |
| Community & Social Service | 1,580 (28.7%) | 3,915 (71.3%) |
| Education, Arts & Media | 335 (37.0%) | 571 (63.0%) |
| Legal Services & Support | 217 (55.4%) | 175 (44.6%) |
| Education Instruction & Library | 781 (22.6%) | 2,671 (77.4%) |
| Arts, Media & Entertainment | 247 (33.2%) | 498 (66.8%) |
| Health Diagnosing & Treating | 504 (20.1%) | 2,005 (79.9%) |
| Health Technologists | 426 (24.6%) | 1,305 (75.4%) |
| Total (Category) | 8,418 (45.1%) | 10,261 (54.9%) |
| Total (Overall) | 29,293 (52.7%) | 26,333 (47.3%) |
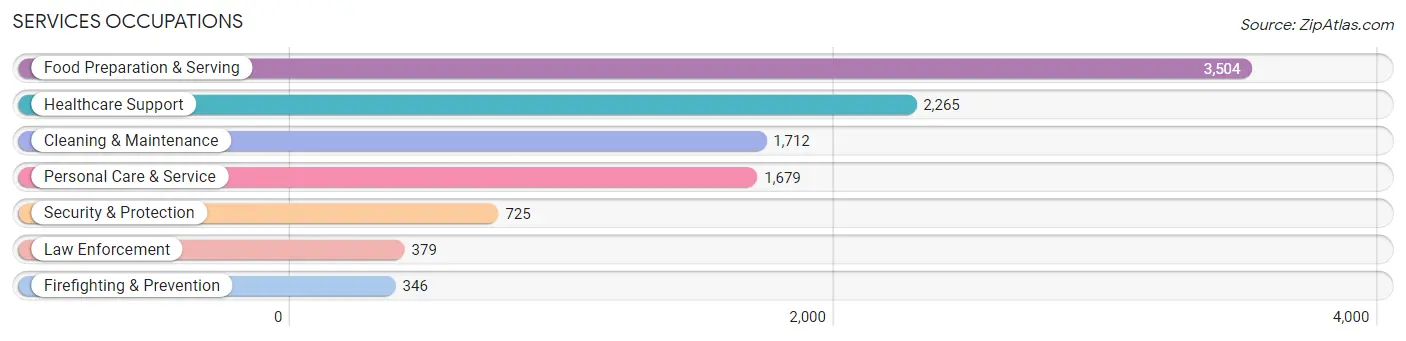
Services Occupations
The most common Services occupations in Walworth County are Food Preparation & Serving (3,504 | 6.3%), Healthcare Support (2,265 | 4.1%), Cleaning & Maintenance (1,712 | 3.1%), Personal Care & Service (1,679 | 3.0%), and Security & Protection (725 | 1.3%).
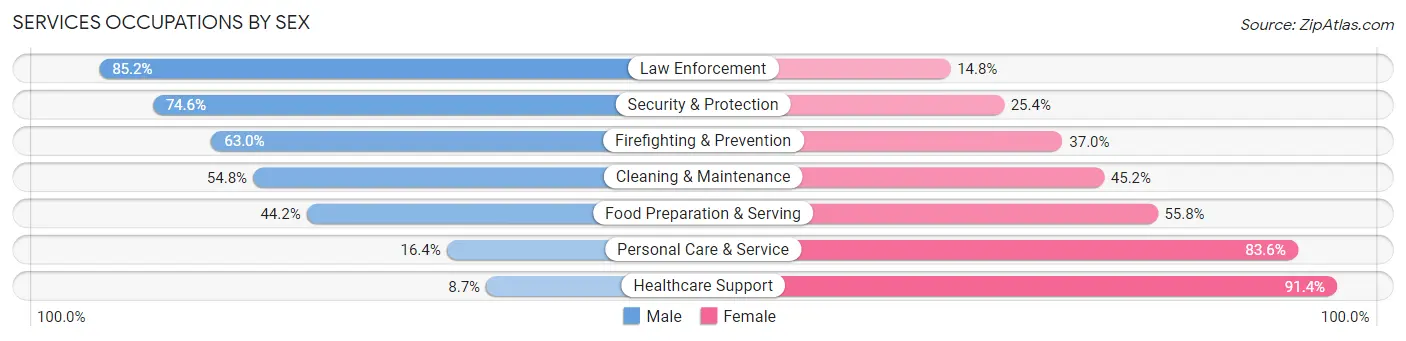
Services Occupations by Sex
Within the Services occupations in Walworth County, the most male-oriented occupations are Law Enforcement (85.2%), Security & Protection (74.6%), and Firefighting & Prevention (63.0%), while the most female-oriented occupations are Healthcare Support (91.3%), Personal Care & Service (83.6%), and Food Preparation & Serving (55.8%).
| Occupation | Male | Female |
| Healthcare Support | 196 (8.6%) | 2,069 (91.3%) |
| Security & Protection | 541 (74.6%) | 184 (25.4%) |
| Firefighting & Prevention | 218 (63.0%) | 128 (37.0%) |
| Law Enforcement | 323 (85.2%) | 56 (14.8%) |
| Food Preparation & Serving | 1,548 (44.2%) | 1,956 (55.8%) |
| Cleaning & Maintenance | 938 (54.8%) | 774 (45.2%) |
| Personal Care & Service | 276 (16.4%) | 1,403 (83.6%) |
| Total (Category) | 3,499 (35.4%) | 6,386 (64.6%) |
| Total (Overall) | 29,293 (52.7%) | 26,333 (47.3%) |
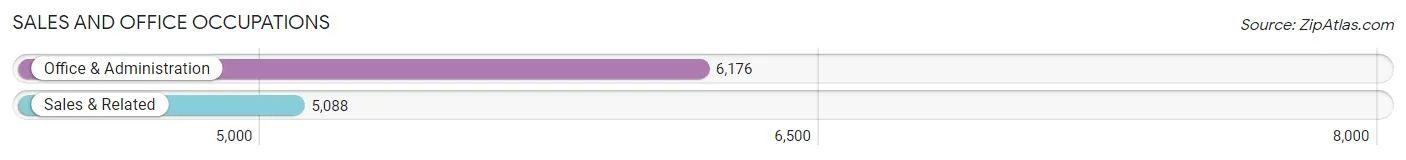
Sales and Office Occupations
The most common Sales and Office occupations in Walworth County are Office & Administration (6,176 | 11.1%), and Sales & Related (5,088 | 9.1%).
Sales and Office Occupations by Sex
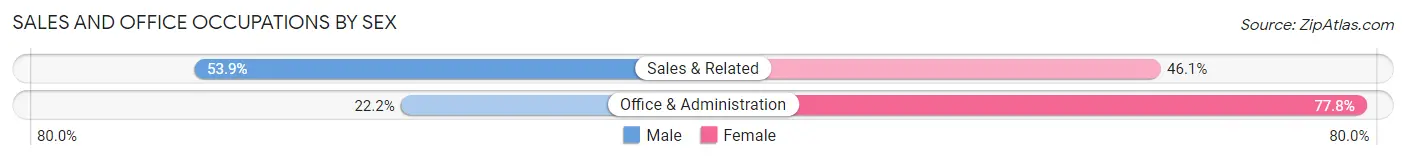
| Occupation | Male | Female |
| Sales & Related | 2,743 (53.9%) | 2,345 (46.1%) |
| Office & Administration | 1,369 (22.2%) | 4,807 (77.8%) |
| Total (Category) | 4,112 (36.5%) | 7,152 (63.5%) |
| Total (Overall) | 29,293 (52.7%) | 26,333 (47.3%) |
Natural Resources, Construction and Maintenance Occupations
The most common Natural Resources, Construction and Maintenance occupations in Walworth County are Construction & Extraction (3,270 | 5.9%), Installation, Maintenance & Repair (2,138 | 3.8%), and Farming, Fishing & Forestry (313 | 0.6%).
Natural Resources, Construction and Maintenance Occupations by Sex
| Occupation | Male | Female |
| Farming, Fishing & Forestry | 247 (78.9%) | 66 (21.1%) |
| Construction & Extraction | 3,225 (98.6%) | 45 (1.4%) |
| Installation, Maintenance & Repair | 2,099 (98.2%) | 39 (1.8%) |
| Total (Category) | 5,571 (97.4%) | 150 (2.6%) |
| Total (Overall) | 29,293 (52.7%) | 26,333 (47.3%) |
Production, Transportation and Moving Occupations
The most common Production, Transportation and Moving occupations in Walworth County are Production (5,646 | 10.2%), Material Moving (2,755 | 5.0%), and Transportation (1,676 | 3.0%).
Production, Transportation and Moving Occupations by Sex
| Occupation | Male | Female |
| Production | 4,222 (74.8%) | 1,424 (25.2%) |
| Transportation | 1,464 (87.4%) | 212 (12.7%) |
| Material Moving | 2,007 (72.9%) | 748 (27.2%) |
| Total (Category) | 7,693 (76.3%) | 2,384 (23.7%) |
| Total (Overall) | 29,293 (52.7%) | 26,333 (47.3%) |
Employment Industries by Sex in Walworth County
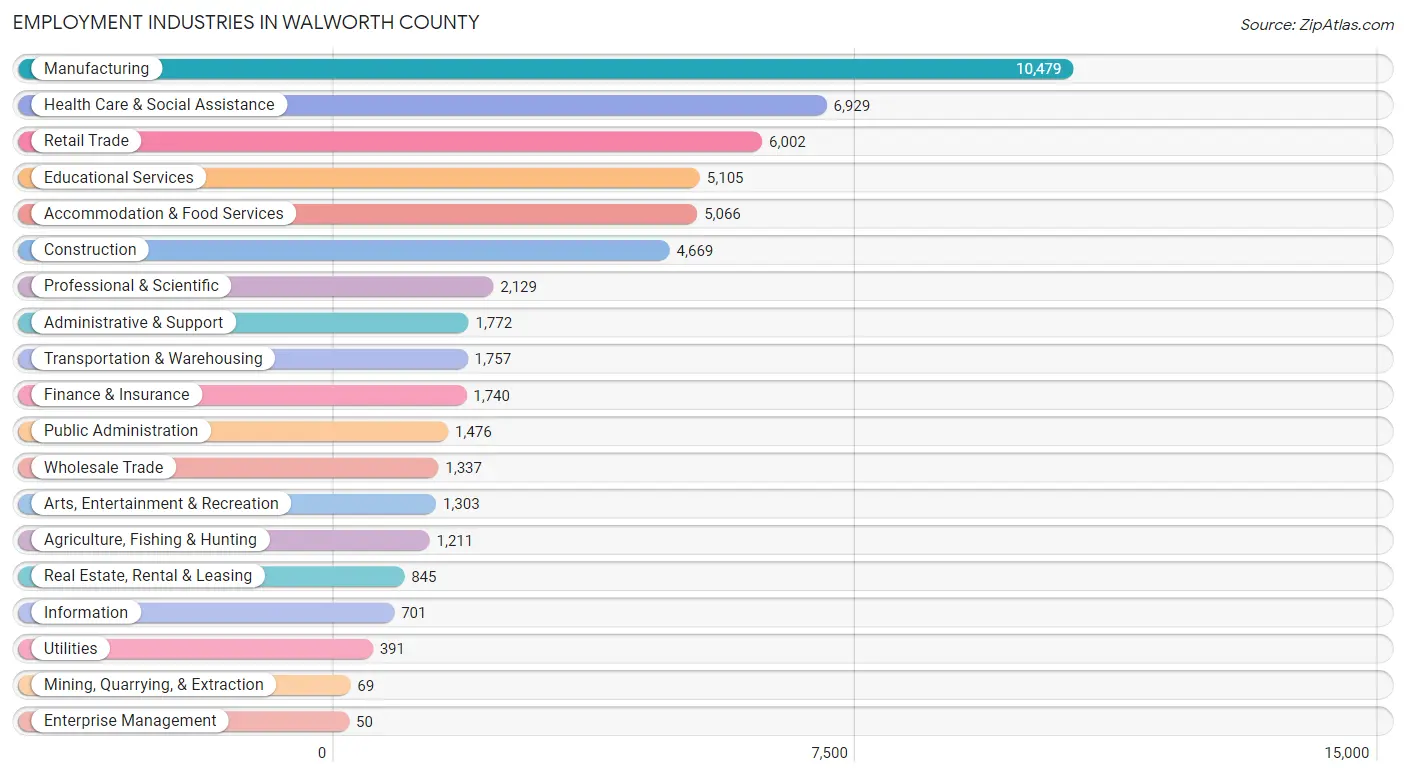
Employment Industries in Walworth County
The major employment industries in Walworth County include Manufacturing (10,479 | 18.8%), Health Care & Social Assistance (6,929 | 12.5%), Retail Trade (6,002 | 10.8%), Educational Services (5,105 | 9.2%), and Accommodation & Food Services (5,066 | 9.1%).
Employment Industries by Sex in Walworth County
The Walworth County industries that see more men than women are Utilities (89.8%), Construction (87.5%), and Agriculture, Fishing & Hunting (75.1%), whereas the industries that tend to have a higher number of women are Health Care & Social Assistance (84.9%), Educational Services (73.9%), and Finance & Insurance (66.7%).
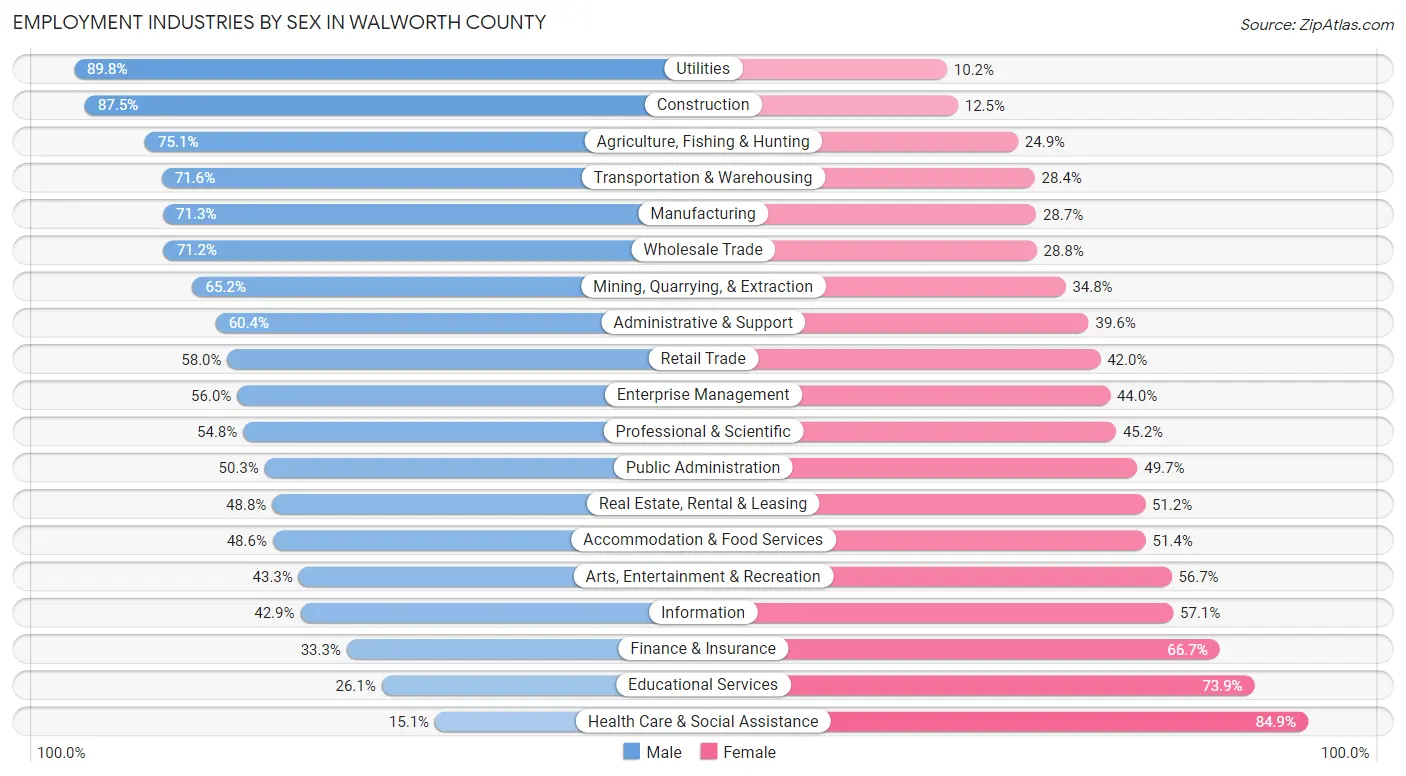
| Industry | Male | Female |
| Agriculture, Fishing & Hunting | 909 (75.1%) | 302 (24.9%) |
| Mining, Quarrying, & Extraction | 45 (65.2%) | 24 (34.8%) |
| Construction | 4,086 (87.5%) | 583 (12.5%) |
| Manufacturing | 7,474 (71.3%) | 3,005 (28.7%) |
| Wholesale Trade | 952 (71.2%) | 385 (28.8%) |
| Retail Trade | 3,483 (58.0%) | 2,519 (42.0%) |
| Transportation & Warehousing | 1,258 (71.6%) | 499 (28.4%) |
| Utilities | 351 (89.8%) | 40 (10.2%) |
| Information | 301 (42.9%) | 400 (57.1%) |
| Finance & Insurance | 580 (33.3%) | 1,160 (66.7%) |
| Real Estate, Rental & Leasing | 412 (48.8%) | 433 (51.2%) |
| Professional & Scientific | 1,166 (54.8%) | 963 (45.2%) |
| Enterprise Management | 28 (56.0%) | 22 (44.0%) |
| Administrative & Support | 1,071 (60.4%) | 701 (39.6%) |
| Educational Services | 1,333 (26.1%) | 3,772 (73.9%) |
| Health Care & Social Assistance | 1,044 (15.1%) | 5,885 (84.9%) |
| Arts, Entertainment & Recreation | 564 (43.3%) | 739 (56.7%) |
| Accommodation & Food Services | 2,464 (48.6%) | 2,602 (51.4%) |
| Public Administration | 743 (50.3%) | 733 (49.7%) |
| Total | 29,293 (52.7%) | 26,333 (47.3%) |
Education in Walworth County
School Enrollment in Walworth County
The most common levels of schooling among the 26,346 students in Walworth County are college / undergraduate (7,992 | 30.3%), high school (5,669 | 21.5%), and middle school (4,939 | 18.8%).
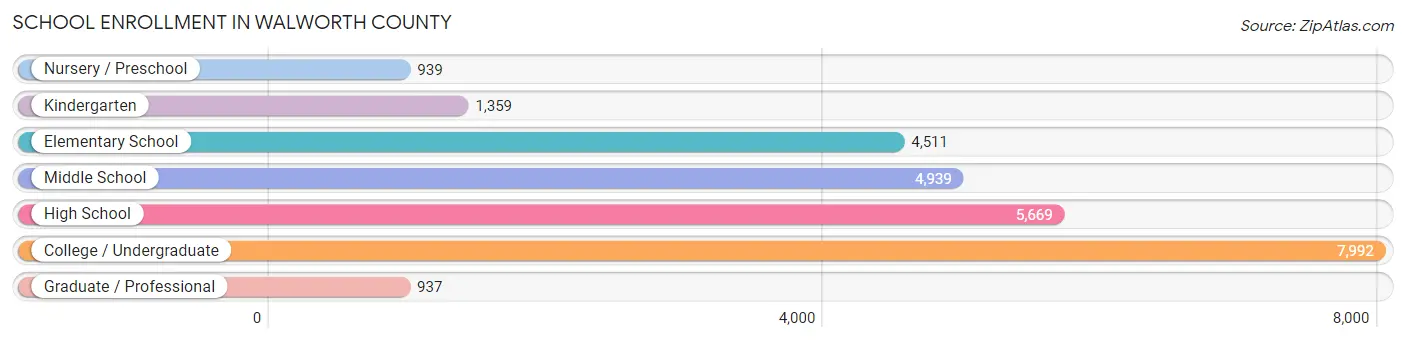
| School Level | # Students | % Students |
| Nursery / Preschool | 939 | 3.6% |
| Kindergarten | 1,359 | 5.2% |
| Elementary School | 4,511 | 17.1% |
| Middle School | 4,939 | 18.8% |
| High School | 5,669 | 21.5% |
| College / Undergraduate | 7,992 | 30.3% |
| Graduate / Professional | 937 | 3.6% |
| Total | 26,346 | 100.0% |
School Enrollment by Age by Funding Source in Walworth County
Out of a total of 26,346 students who are enrolled in schools in Walworth County, 2,898 (11.0%) attend a private institution, while the remaining 23,448 (89.0%) are enrolled in public schools. The age group of 35 years and over has the highest likelihood of being enrolled in private schools, with 320 (29.3% in the age bracket) enrolled. Conversely, the age group of 15 to 17 year olds has the lowest likelihood of being enrolled in a private school, with 3,849 (94.1% in the age bracket) attending a public institution.
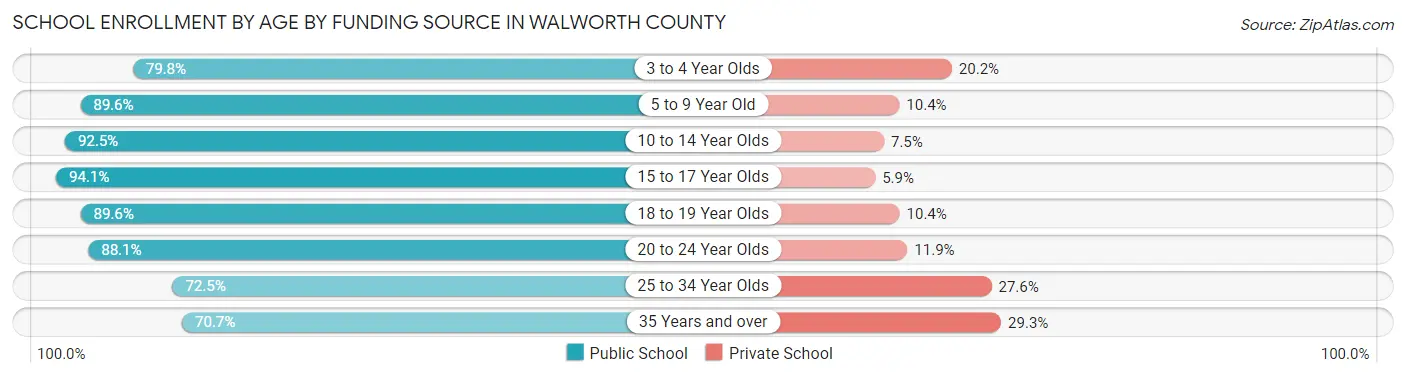
| Age Bracket | Public School | Private School |
| 3 to 4 Year Olds | 713 (79.8%) | 180 (20.2%) |
| 5 to 9 Year Old | 4,688 (89.6%) | 543 (10.4%) |
| 10 to 14 Year Olds | 5,764 (92.5%) | 469 (7.5%) |
| 15 to 17 Year Olds | 3,849 (94.1%) | 240 (5.9%) |
| 18 to 19 Year Olds | 2,408 (89.6%) | 280 (10.4%) |
| 20 to 24 Year Olds | 4,582 (88.1%) | 617 (11.9%) |
| 25 to 34 Year Olds | 668 (72.5%) | 254 (27.6%) |
| 35 Years and over | 771 (70.7%) | 320 (29.3%) |
| Total | 23,448 (89.0%) | 2,898 (11.0%) |
Educational Attainment by Field of Study in Walworth County
Education (4,456 | 18.9%), business (4,324 | 18.3%), science & technology (2,541 | 10.8%), social sciences (1,643 | 7.0%), and arts & humanities (1,553 | 6.6%) are the most common fields of study among 23,618 individuals in Walworth County who have obtained a bachelor's degree or higher.
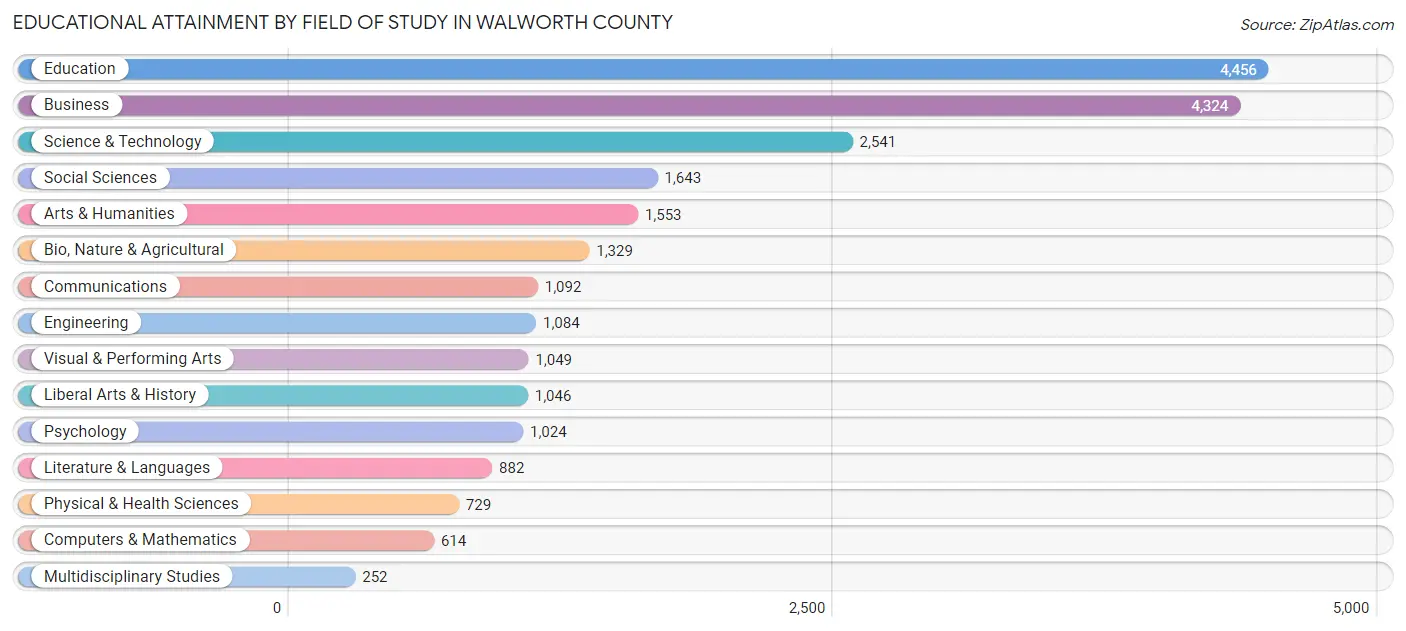
| Field of Study | # Graduates | % Graduates |
| Computers & Mathematics | 614 | 2.6% |
| Bio, Nature & Agricultural | 1,329 | 5.6% |
| Physical & Health Sciences | 729 | 3.1% |
| Psychology | 1,024 | 4.3% |
| Social Sciences | 1,643 | 7.0% |
| Engineering | 1,084 | 4.6% |
| Multidisciplinary Studies | 252 | 1.1% |
| Science & Technology | 2,541 | 10.8% |
| Business | 4,324 | 18.3% |
| Education | 4,456 | 18.9% |
| Literature & Languages | 882 | 3.7% |
| Liberal Arts & History | 1,046 | 4.4% |
| Visual & Performing Arts | 1,049 | 4.4% |
| Communications | 1,092 | 4.6% |
| Arts & Humanities | 1,553 | 6.6% |
| Total | 23,618 | 100.0% |
Transportation & Commute in Walworth County
Vehicle Availability by Sex in Walworth County
The most prevalent vehicle ownership categories in Walworth County are males with 2 vehicles (12,124, accounting for 42.8%) and females with 2 vehicles (10,414, making up 48.6%).
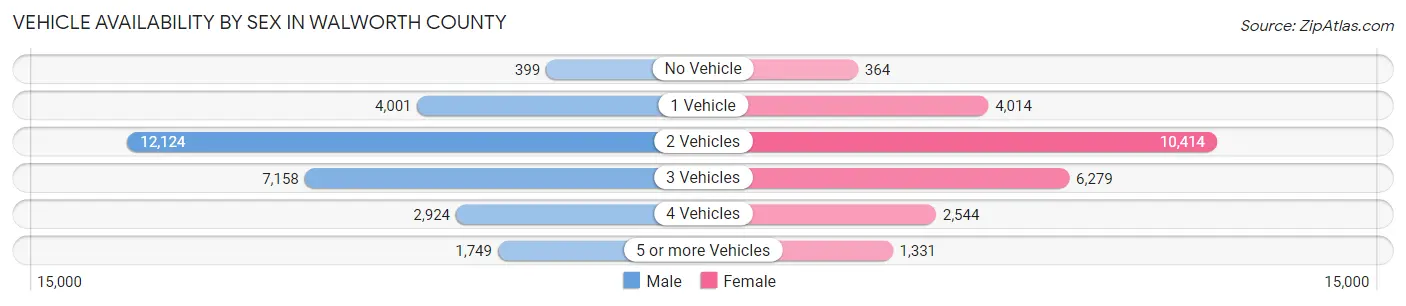
| Vehicles Available | Male | Female |
| No Vehicle | 399 (1.4%) | 364 (1.5%) |
| 1 Vehicle | 4,001 (14.1%) | 4,014 (16.1%) |
| 2 Vehicles | 12,124 (42.8%) | 10,414 (41.7%) |
| 3 Vehicles | 7,158 (25.2%) | 6,279 (25.2%) |
| 4 Vehicles | 2,924 (10.3%) | 2,544 (10.2%) |
| 5 or more Vehicles | 1,749 (6.2%) | 1,331 (5.3%) |
| Total | 28,355 (100.0%) | 24,946 (100.0%) |
Commute Time in Walworth County
The most frequently occuring commute durations in Walworth County are 10 to 14 minutes (7,924 commuters, 16.0%), 5 to 9 minutes (7,109 commuters, 14.4%), and 15 to 19 minutes (7,018 commuters, 14.2%).
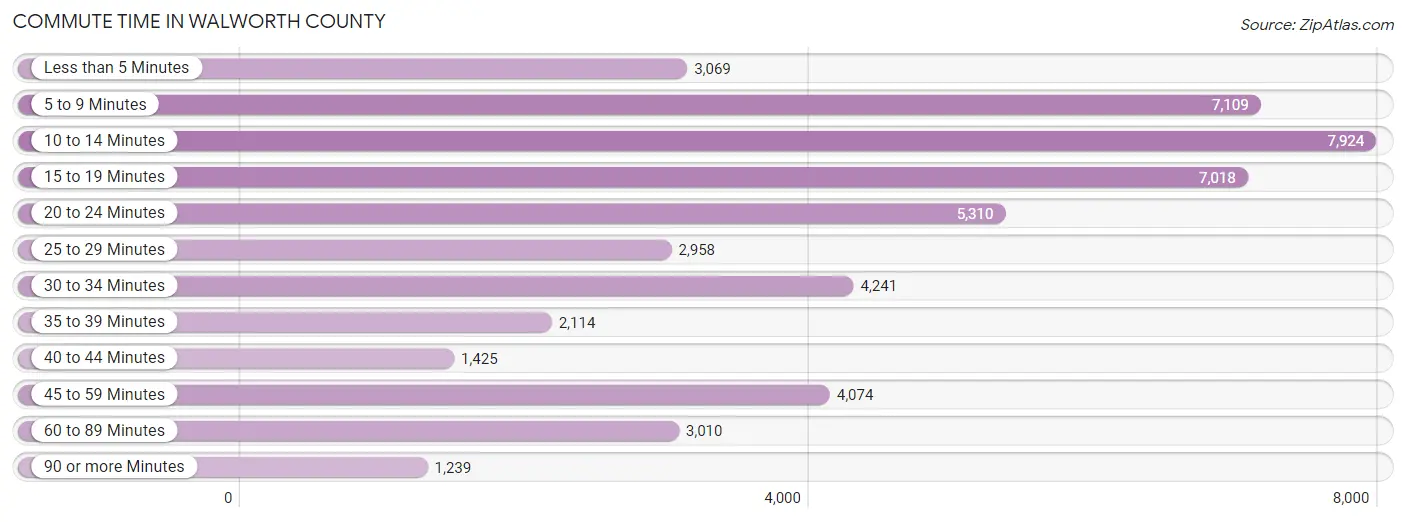
| Commute Time | # Commuters | % Commuters |
| Less than 5 Minutes | 3,069 | 6.2% |
| 5 to 9 Minutes | 7,109 | 14.4% |
| 10 to 14 Minutes | 7,924 | 16.0% |
| 15 to 19 Minutes | 7,018 | 14.2% |
| 20 to 24 Minutes | 5,310 | 10.7% |
| 25 to 29 Minutes | 2,958 | 6.0% |
| 30 to 34 Minutes | 4,241 | 8.6% |
| 35 to 39 Minutes | 2,114 | 4.3% |
| 40 to 44 Minutes | 1,425 | 2.9% |
| 45 to 59 Minutes | 4,074 | 8.2% |
| 60 to 89 Minutes | 3,010 | 6.1% |
| 90 or more Minutes | 1,239 | 2.5% |
Commute Time by Sex in Walworth County
The most common commute times in Walworth County are 15 to 19 minutes (3,770 commuters, 14.2%) for males and 10 to 14 minutes (4,302 commuters, 18.7%) for females.
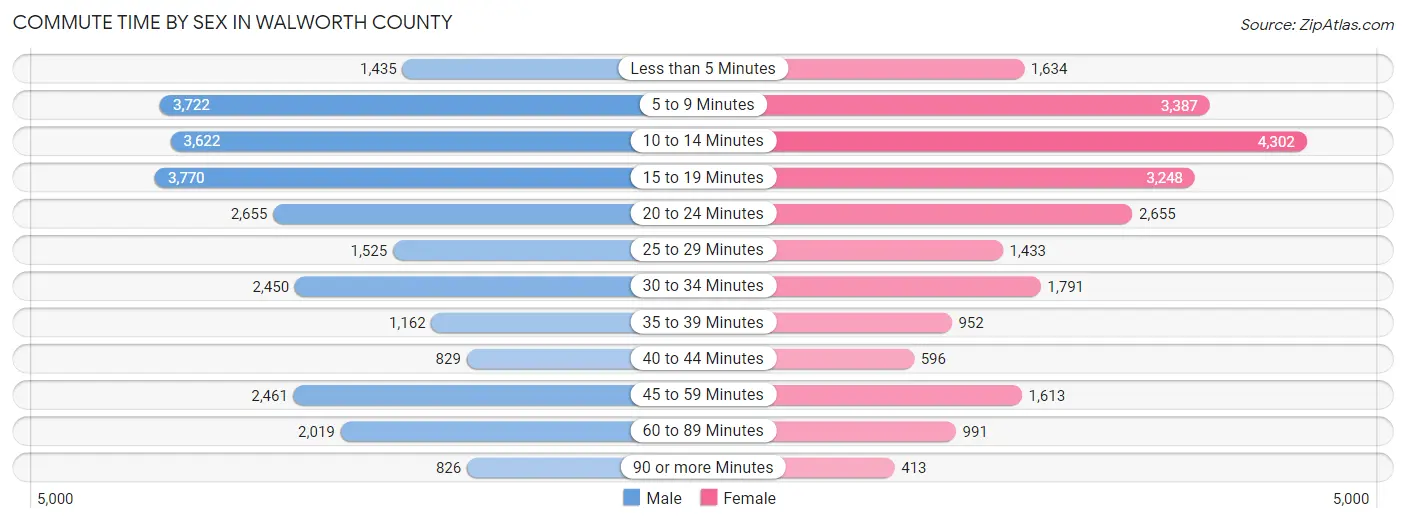
| Commute Time | Male | Female |
| Less than 5 Minutes | 1,435 (5.4%) | 1,634 (7.1%) |
| 5 to 9 Minutes | 3,722 (14.1%) | 3,387 (14.7%) |
| 10 to 14 Minutes | 3,622 (13.7%) | 4,302 (18.7%) |
| 15 to 19 Minutes | 3,770 (14.2%) | 3,248 (14.1%) |
| 20 to 24 Minutes | 2,655 (10.0%) | 2,655 (11.5%) |
| 25 to 29 Minutes | 1,525 (5.8%) | 1,433 (6.2%) |
| 30 to 34 Minutes | 2,450 (9.2%) | 1,791 (7.8%) |
| 35 to 39 Minutes | 1,162 (4.4%) | 952 (4.1%) |
| 40 to 44 Minutes | 829 (3.1%) | 596 (2.6%) |
| 45 to 59 Minutes | 2,461 (9.3%) | 1,613 (7.0%) |
| 60 to 89 Minutes | 2,019 (7.6%) | 991 (4.3%) |
| 90 or more Minutes | 826 (3.1%) | 413 (1.8%) |
Time of Departure to Work by Sex in Walworth County
The most frequent times of departure to work in Walworth County are 7:00 AM to 7:29 AM (3,306, 12.5%) for males and 7:00 AM to 7:29 AM (4,045, 17.6%) for females.
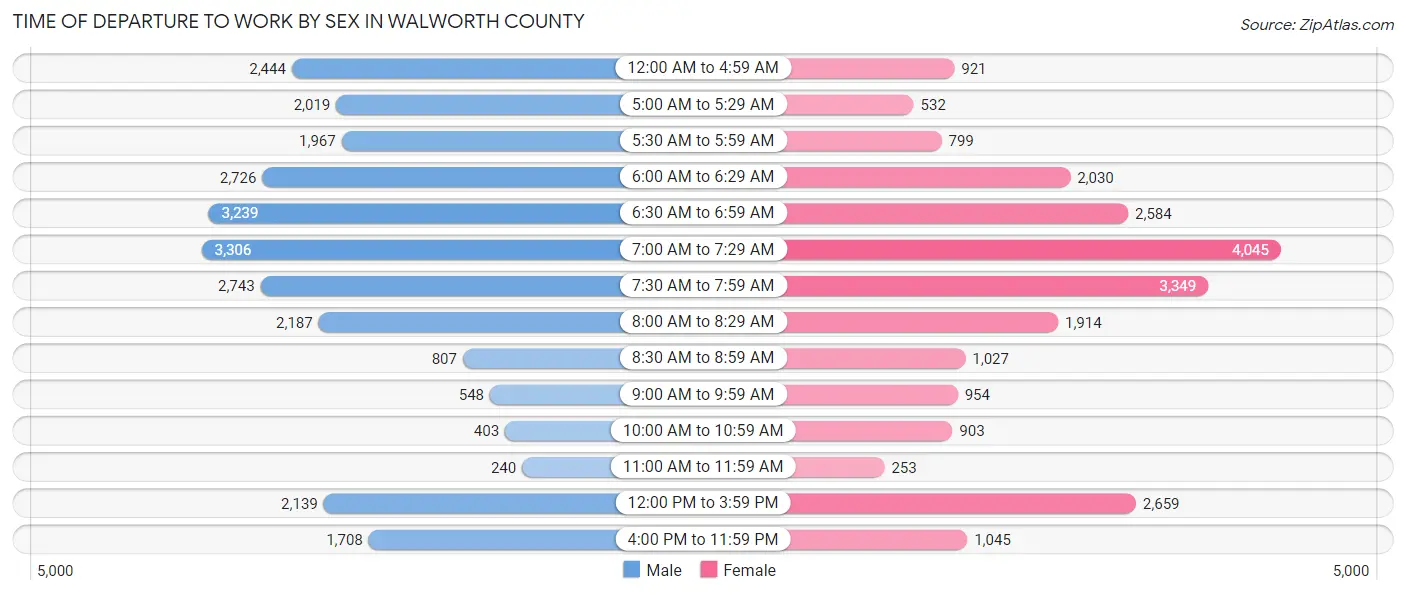
| Time of Departure | Male | Female |
| 12:00 AM to 4:59 AM | 2,444 (9.2%) | 921 (4.0%) |
| 5:00 AM to 5:29 AM | 2,019 (7.6%) | 532 (2.3%) |
| 5:30 AM to 5:59 AM | 1,967 (7.4%) | 799 (3.5%) |
| 6:00 AM to 6:29 AM | 2,726 (10.3%) | 2,030 (8.8%) |
| 6:30 AM to 6:59 AM | 3,239 (12.2%) | 2,584 (11.2%) |
| 7:00 AM to 7:29 AM | 3,306 (12.5%) | 4,045 (17.6%) |
| 7:30 AM to 7:59 AM | 2,743 (10.4%) | 3,349 (14.5%) |
| 8:00 AM to 8:29 AM | 2,187 (8.3%) | 1,914 (8.3%) |
| 8:30 AM to 8:59 AM | 807 (3.0%) | 1,027 (4.5%) |
| 9:00 AM to 9:59 AM | 548 (2.1%) | 954 (4.2%) |
| 10:00 AM to 10:59 AM | 403 (1.5%) | 903 (3.9%) |
| 11:00 AM to 11:59 AM | 240 (0.9%) | 253 (1.1%) |
| 12:00 PM to 3:59 PM | 2,139 (8.1%) | 2,659 (11.6%) |
| 4:00 PM to 11:59 PM | 1,708 (6.5%) | 1,045 (4.5%) |
| Total | 26,476 (100.0%) | 23,015 (100.0%) |
Housing Occupancy in Walworth County
Occupancy by Ownership in Walworth County
Of the total 42,179 dwellings in Walworth County, owner-occupied units account for 29,399 (69.7%), while renter-occupied units make up 12,780 (30.3%).
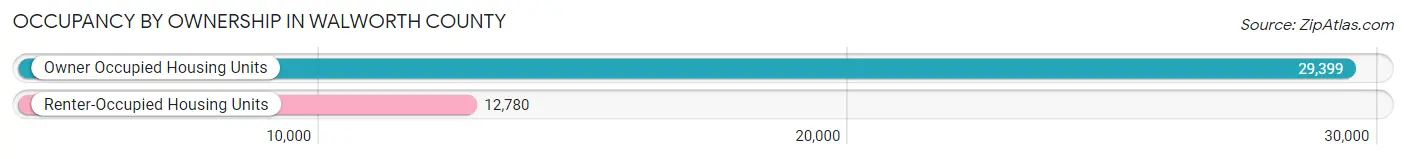
| Occupancy | # Housing Units | % Housing Units |
| Owner Occupied Housing Units | 29,399 | 69.7% |
| Renter-Occupied Housing Units | 12,780 | 30.3% |
| Total Occupied Housing Units | 42,179 | 100.0% |
Occupancy by Household Size in Walworth County
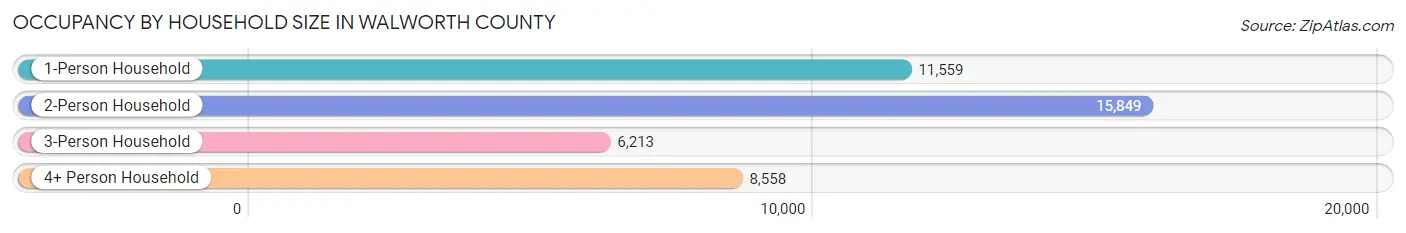
| Household Size | # Housing Units | % Housing Units |
| 1-Person Household | 11,559 | 27.4% |
| 2-Person Household | 15,849 | 37.6% |
| 3-Person Household | 6,213 | 14.7% |
| 4+ Person Household | 8,558 | 20.3% |
| Total Housing Units | 42,179 | 100.0% |
Occupancy by Ownership by Household Size in Walworth County
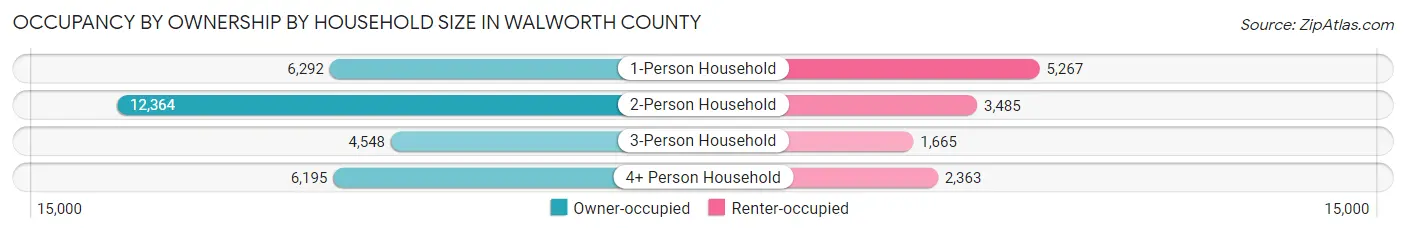
| Household Size | Owner-occupied | Renter-occupied |
| 1-Person Household | 6,292 (54.4%) | 5,267 (45.6%) |
| 2-Person Household | 12,364 (78.0%) | 3,485 (22.0%) |
| 3-Person Household | 4,548 (73.2%) | 1,665 (26.8%) |
| 4+ Person Household | 6,195 (72.4%) | 2,363 (27.6%) |
| Total Housing Units | 29,399 (69.7%) | 12,780 (30.3%) |
Occupancy by Educational Attainment in Walworth County
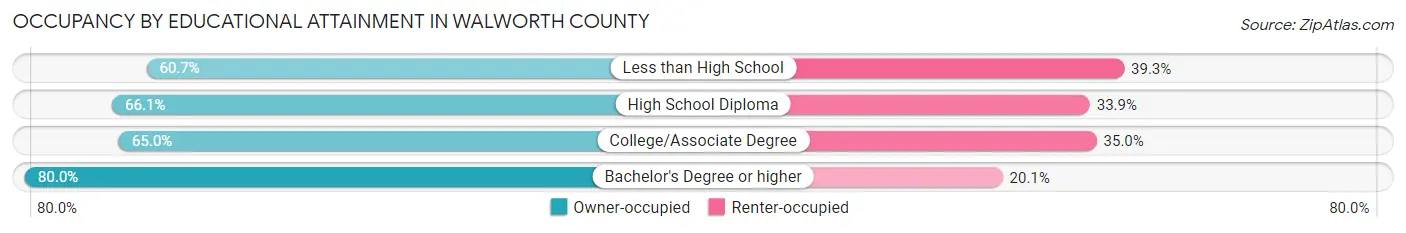
| Household Size | Owner-occupied | Renter-occupied |
| Less than High School | 1,695 (60.7%) | 1,099 (39.3%) |
| High School Diploma | 7,704 (66.1%) | 3,950 (33.9%) |
| College/Associate Degree | 9,473 (65.0%) | 5,091 (35.0%) |
| Bachelor's Degree or higher | 10,527 (79.9%) | 2,640 (20.1%) |
Occupancy by Age of Householder in Walworth County
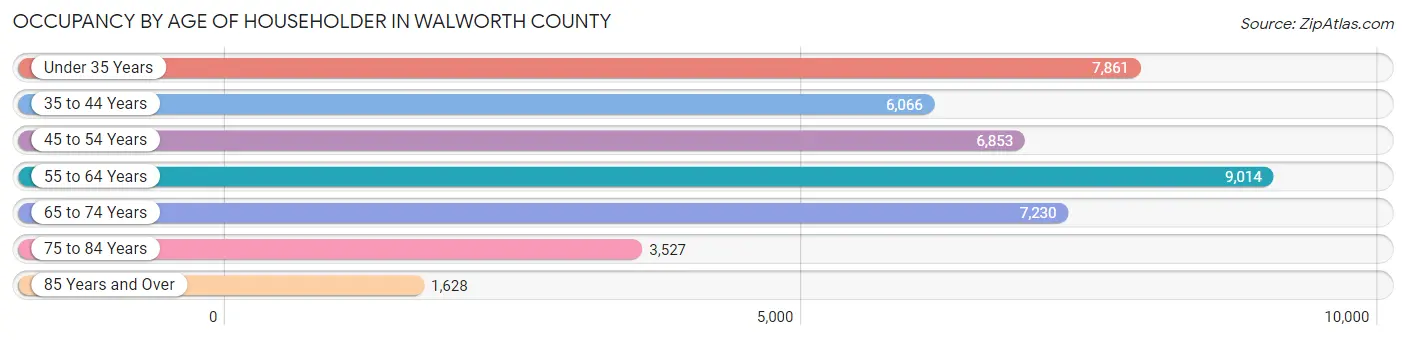
| Age Bracket | # Households | % Households |
| Under 35 Years | 7,861 | 18.6% |
| 35 to 44 Years | 6,066 | 14.4% |
| 45 to 54 Years | 6,853 | 16.3% |
| 55 to 64 Years | 9,014 | 21.4% |
| 65 to 74 Years | 7,230 | 17.1% |
| 75 to 84 Years | 3,527 | 8.4% |
| 85 Years and Over | 1,628 | 3.9% |
| Total | 42,179 | 100.0% |
Housing Finances in Walworth County
Median Income by Occupancy in Walworth County
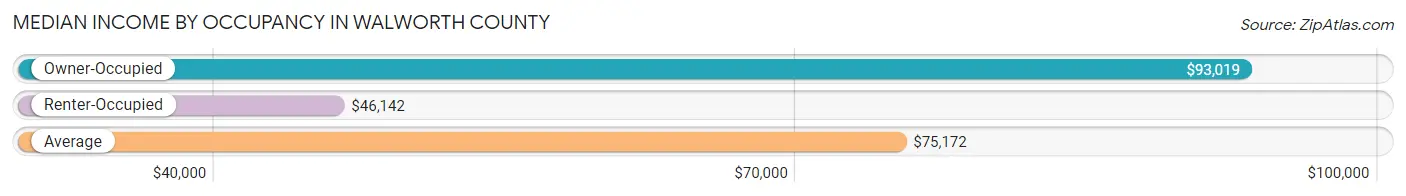
| Occupancy Type | # Households | Median Income |
| Owner-Occupied | 29,399 (69.7%) | $93,019 |
| Renter-Occupied | 12,780 (30.3%) | $46,142 |
| Average | 42,179 (100.0%) | $75,172 |
Occupancy by Householder Income Bracket in Walworth County
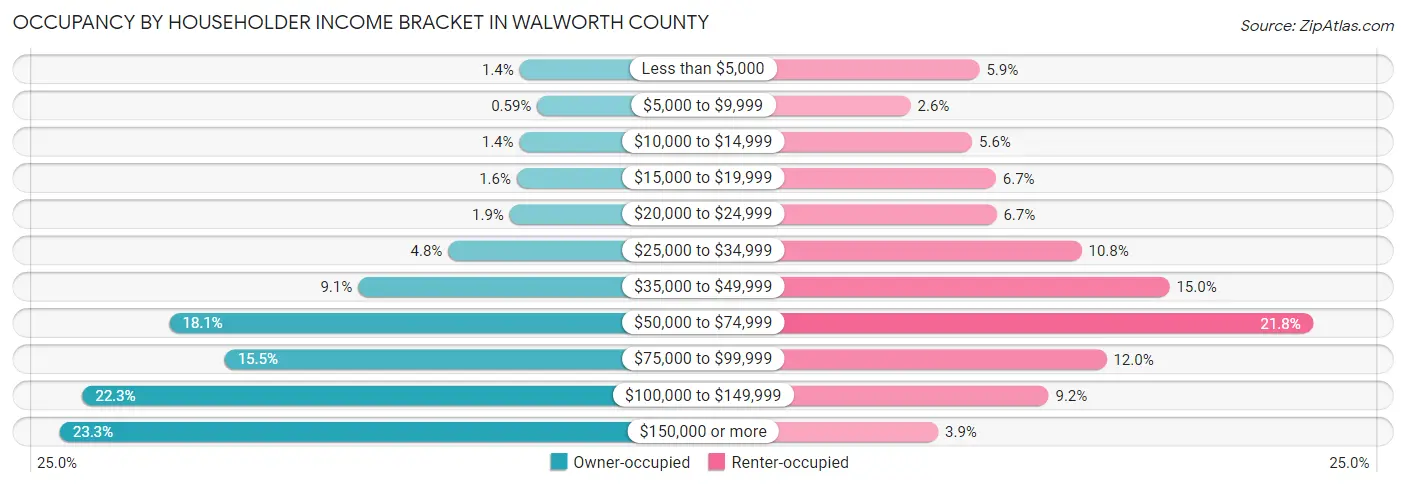
| Income Bracket | Owner-occupied | Renter-occupied |
| Less than $5,000 | 419 (1.4%) | 754 (5.9%) |
| $5,000 to $9,999 | 174 (0.6%) | 335 (2.6%) |
| $10,000 to $14,999 | 423 (1.4%) | 709 (5.6%) |
| $15,000 to $19,999 | 460 (1.6%) | 854 (6.7%) |
| $20,000 to $24,999 | 558 (1.9%) | 858 (6.7%) |
| $25,000 to $34,999 | 1,419 (4.8%) | 1,375 (10.8%) |
| $35,000 to $49,999 | 2,681 (9.1%) | 1,911 (14.9%) |
| $50,000 to $74,999 | 5,320 (18.1%) | 2,781 (21.8%) |
| $75,000 to $99,999 | 4,549 (15.5%) | 1,527 (11.9%) |
| $100,000 to $149,999 | 6,540 (22.3%) | 1,174 (9.2%) |
| $150,000 or more | 6,856 (23.3%) | 502 (3.9%) |
| Total | 29,399 (100.0%) | 12,780 (100.0%) |
Monthly Housing Cost Tiers in Walworth County
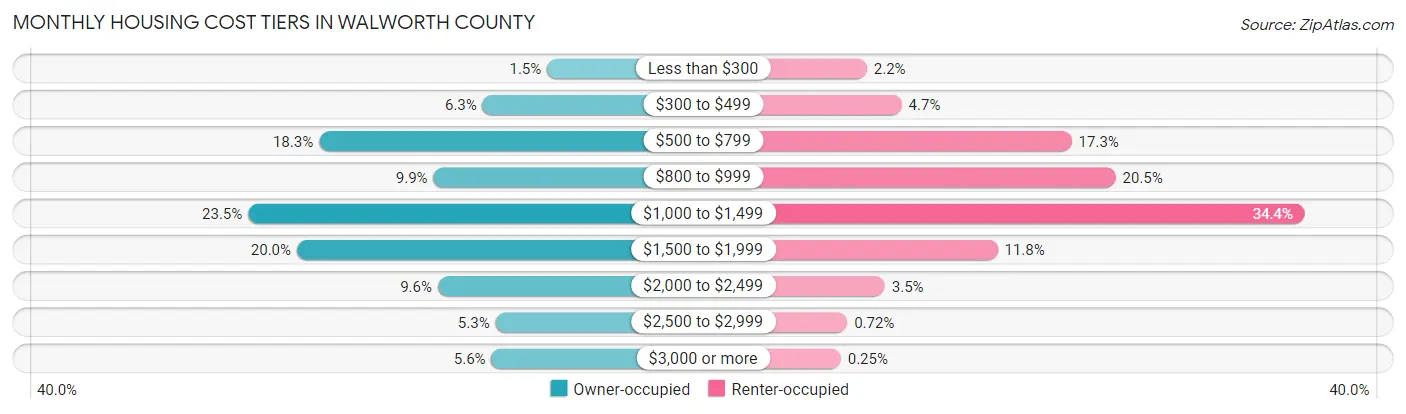
| Monthly Cost | Owner-occupied | Renter-occupied |
| Less than $300 | 448 (1.5%) | 277 (2.2%) |
| $300 to $499 | 1,842 (6.3%) | 604 (4.7%) |
| $500 to $799 | 5,386 (18.3%) | 2,204 (17.2%) |
| $800 to $999 | 2,908 (9.9%) | 2,619 (20.5%) |
| $1,000 to $1,499 | 6,920 (23.5%) | 4,399 (34.4%) |
| $1,500 to $1,999 | 5,866 (20.0%) | 1,507 (11.8%) |
| $2,000 to $2,499 | 2,813 (9.6%) | 446 (3.5%) |
| $2,500 to $2,999 | 1,564 (5.3%) | 92 (0.7%) |
| $3,000 or more | 1,652 (5.6%) | 32 (0.3%) |
| Total | 29,399 (100.0%) | 12,780 (100.0%) |
Physical Housing Characteristics in Walworth County
Housing Structures in Walworth County
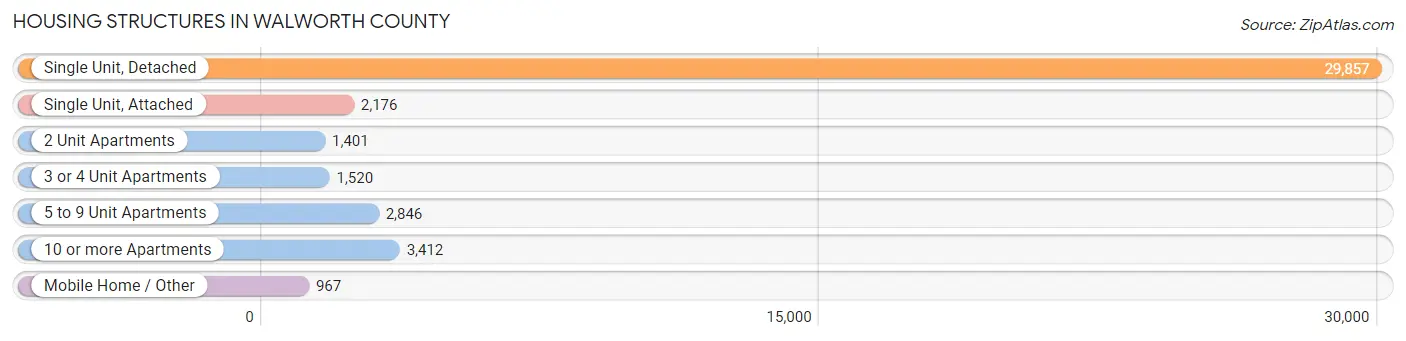
| Structure Type | # Housing Units | % Housing Units |
| Single Unit, Detached | 29,857 | 70.8% |
| Single Unit, Attached | 2,176 | 5.2% |
| 2 Unit Apartments | 1,401 | 3.3% |
| 3 or 4 Unit Apartments | 1,520 | 3.6% |
| 5 to 9 Unit Apartments | 2,846 | 6.8% |
| 10 or more Apartments | 3,412 | 8.1% |
| Mobile Home / Other | 967 | 2.3% |
| Total | 42,179 | 100.0% |
Housing Structures by Occupancy in Walworth County
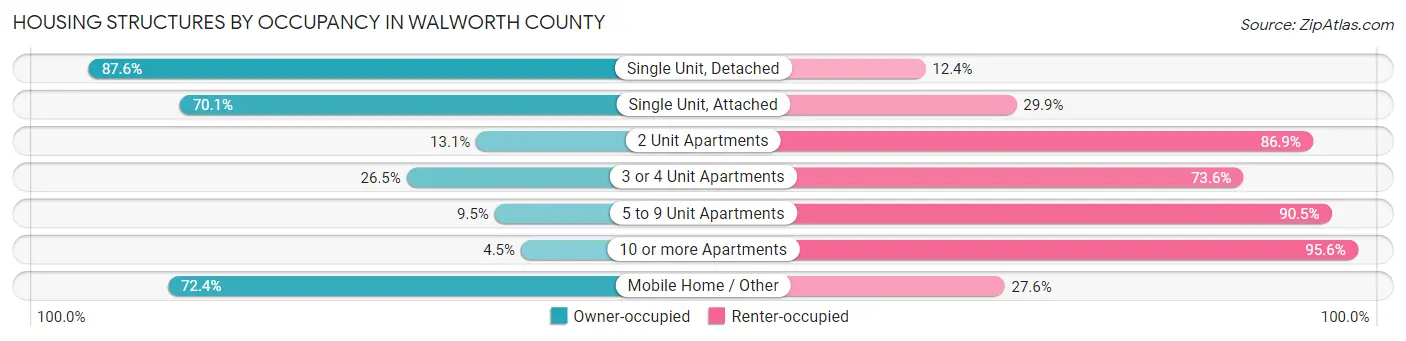
| Structure Type | Owner-occupied | Renter-occupied |
| Single Unit, Detached | 26,166 (87.6%) | 3,691 (12.4%) |
| Single Unit, Attached | 1,526 (70.1%) | 650 (29.9%) |
| 2 Unit Apartments | 183 (13.1%) | 1,218 (86.9%) |
| 3 or 4 Unit Apartments | 402 (26.5%) | 1,118 (73.6%) |
| 5 to 9 Unit Apartments | 270 (9.5%) | 2,576 (90.5%) |
| 10 or more Apartments | 152 (4.4%) | 3,260 (95.6%) |
| Mobile Home / Other | 700 (72.4%) | 267 (27.6%) |
| Total | 29,399 (69.7%) | 12,780 (30.3%) |
Housing Structures by Number of Rooms in Walworth County
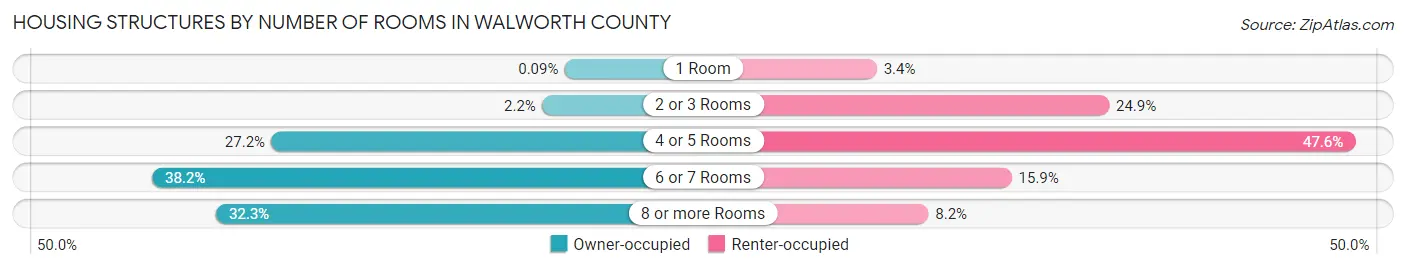
| Number of Rooms | Owner-occupied | Renter-occupied |
| 1 Room | 25 (0.1%) | 434 (3.4%) |
| 2 or 3 Rooms | 642 (2.2%) | 3,181 (24.9%) |
| 4 or 5 Rooms | 8,003 (27.2%) | 6,089 (47.6%) |
| 6 or 7 Rooms | 11,232 (38.2%) | 2,030 (15.9%) |
| 8 or more Rooms | 9,497 (32.3%) | 1,046 (8.2%) |
| Total | 29,399 (100.0%) | 12,780 (100.0%) |
Housing Structure by Heating Type in Walworth County
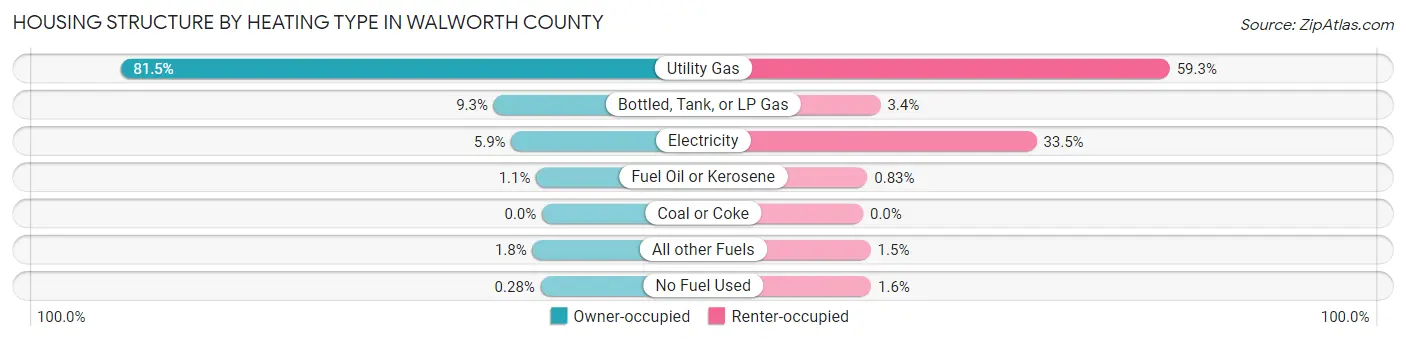
| Heating Type | Owner-occupied | Renter-occupied |
| Utility Gas | 23,958 (81.5%) | 7,574 (59.3%) |
| Bottled, Tank, or LP Gas | 2,744 (9.3%) | 431 (3.4%) |
| Electricity | 1,743 (5.9%) | 4,283 (33.5%) |
| Fuel Oil or Kerosene | 330 (1.1%) | 106 (0.8%) |
| Coal or Coke | 0 (0.0%) | 0 (0.0%) |
| All other Fuels | 542 (1.8%) | 188 (1.5%) |
| No Fuel Used | 82 (0.3%) | 198 (1.5%) |
| Total | 29,399 (100.0%) | 12,780 (100.0%) |
Household Vehicle Usage in Walworth County
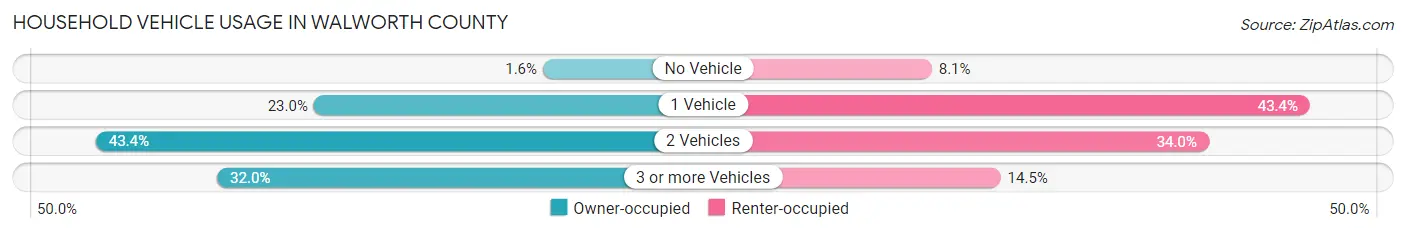
| Vehicles per Household | Owner-occupied | Renter-occupied |
| No Vehicle | 477 (1.6%) | 1,037 (8.1%) |
| 1 Vehicle | 6,765 (23.0%) | 5,545 (43.4%) |
| 2 Vehicles | 12,743 (43.3%) | 4,340 (34.0%) |
| 3 or more Vehicles | 9,414 (32.0%) | 1,858 (14.5%) |
| Total | 29,399 (100.0%) | 12,780 (100.0%) |
Real Estate & Mortgages in Walworth County
Real Estate and Mortgage Overview in Walworth County
| Characteristic | Without Mortgage | With Mortgage |
| Housing Units | 10,664 | 18,735 |
| Median Property Value | $252,000 | $255,600 |
| Median Household Income | $69,484 | $5,039 |
| Monthly Housing Costs | $692 | $1,579 |
| Real Estate Taxes | $3,817 | $116 |
Property Value by Mortgage Status in Walworth County
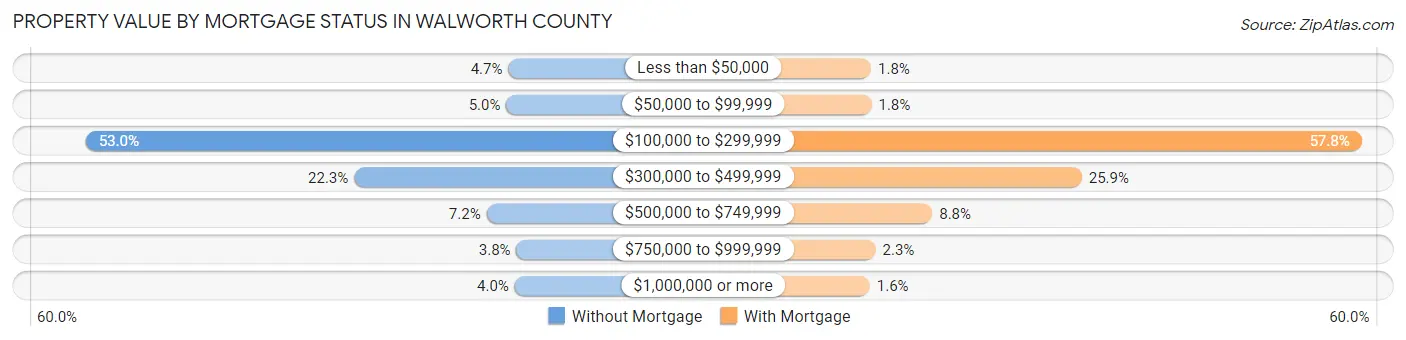
| Property Value | Without Mortgage | With Mortgage |
| Less than $50,000 | 503 (4.7%) | 333 (1.8%) |
| $50,000 to $99,999 | 528 (5.0%) | 342 (1.8%) |
| $100,000 to $299,999 | 5,653 (53.0%) | 10,837 (57.8%) |
| $300,000 to $499,999 | 2,382 (22.3%) | 4,845 (25.9%) |
| $500,000 to $749,999 | 769 (7.2%) | 1,643 (8.8%) |
| $750,000 to $999,999 | 404 (3.8%) | 429 (2.3%) |
| $1,000,000 or more | 425 (4.0%) | 306 (1.6%) |
| Total | 10,664 (100.0%) | 18,735 (100.0%) |
Household Income by Mortgage Status in Walworth County
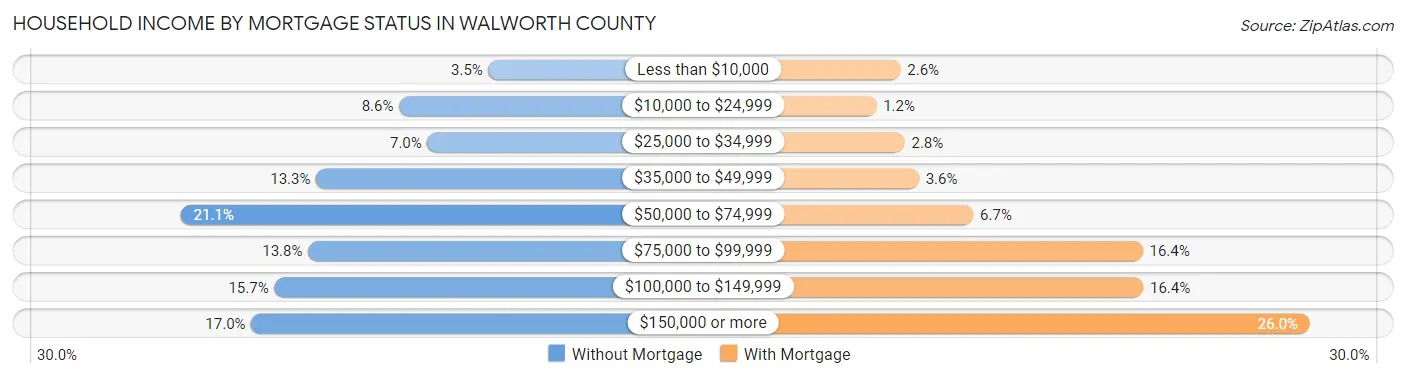
| Household Income | Without Mortgage | With Mortgage |
| Less than $10,000 | 371 (3.5%) | 480 (2.6%) |
| $10,000 to $24,999 | 916 (8.6%) | 222 (1.2%) |
| $25,000 to $34,999 | 743 (7.0%) | 525 (2.8%) |
| $35,000 to $49,999 | 1,422 (13.3%) | 676 (3.6%) |
| $50,000 to $74,999 | 2,248 (21.1%) | 1,259 (6.7%) |
| $75,000 to $99,999 | 1,471 (13.8%) | 3,072 (16.4%) |
| $100,000 to $149,999 | 1,676 (15.7%) | 3,078 (16.4%) |
| $150,000 or more | 1,817 (17.0%) | 4,864 (26.0%) |
| Total | 10,664 (100.0%) | 18,735 (100.0%) |
Property Value to Household Income Ratio in Walworth County
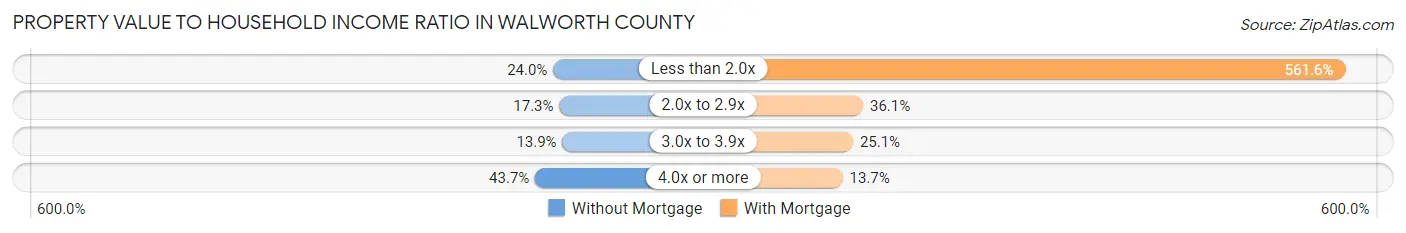
| Value-to-Income Ratio | Without Mortgage | With Mortgage |
| Less than 2.0x | 2,561 (24.0%) | 105,215 (561.6%) |
| 2.0x to 2.9x | 1,847 (17.3%) | 6,758 (36.1%) |
| 3.0x to 3.9x | 1,487 (13.9%) | 4,702 (25.1%) |
| 4.0x or more | 4,657 (43.7%) | 2,569 (13.7%) |
| Total | 10,664 (100.0%) | 18,735 (100.0%) |
Real Estate Taxes by Mortgage Status in Walworth County
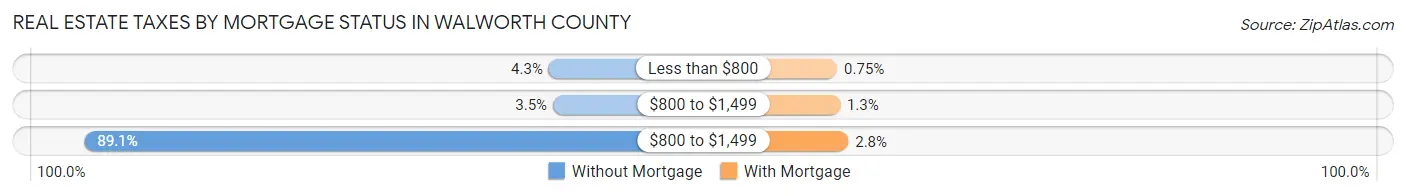
| Property Taxes | Without Mortgage | With Mortgage |
| Less than $800 | 455 (4.3%) | 140 (0.7%) |
| $800 to $1,499 | 373 (3.5%) | 236 (1.3%) |
| $800 to $1,499 | 9,499 (89.1%) | 521 (2.8%) |
| Total | 10,664 (100.0%) | 18,735 (100.0%) |
Health & Disability in Walworth County
Health Insurance Coverage by Age in Walworth County
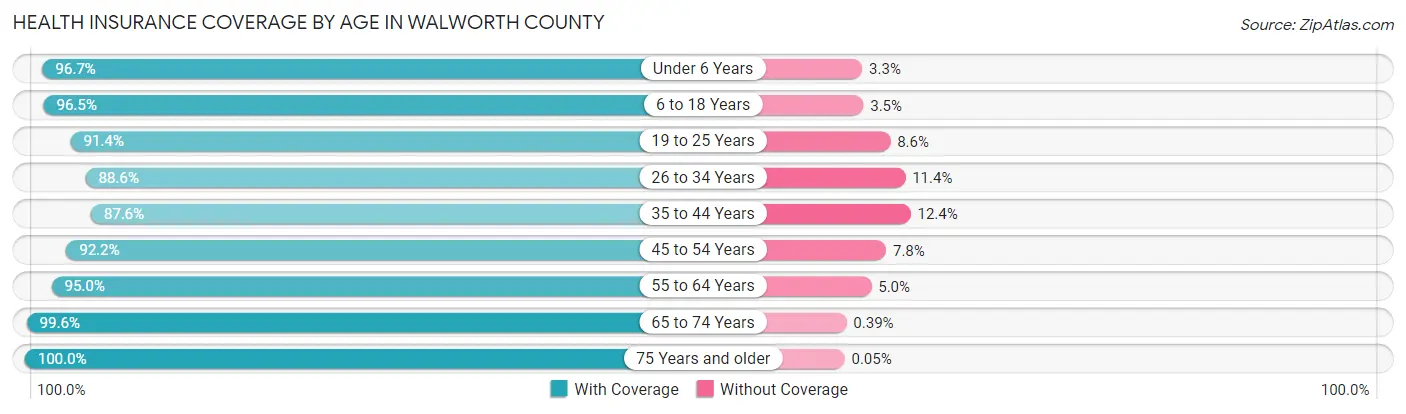
| Age Bracket | With Coverage | Without Coverage |
| Under 6 Years | 5,433 (96.7%) | 187 (3.3%) |
| 6 to 18 Years | 16,450 (96.5%) | 604 (3.5%) |
| 19 to 25 Years | 11,756 (91.4%) | 1,102 (8.6%) |
| 26 to 34 Years | 8,812 (88.6%) | 1,129 (11.4%) |
| 35 to 44 Years | 10,215 (87.6%) | 1,441 (12.4%) |
| 45 to 54 Years | 11,774 (92.2%) | 993 (7.8%) |
| 55 to 64 Years | 14,627 (95.0%) | 775 (5.0%) |
| 65 to 74 Years | 11,803 (99.6%) | 46 (0.4%) |
| 75 Years and older | 7,301 (100.0%) | 4 (0.1%) |
| Total | 98,171 (94.0%) | 6,281 (6.0%) |
Health Insurance Coverage by Citizenship Status in Walworth County
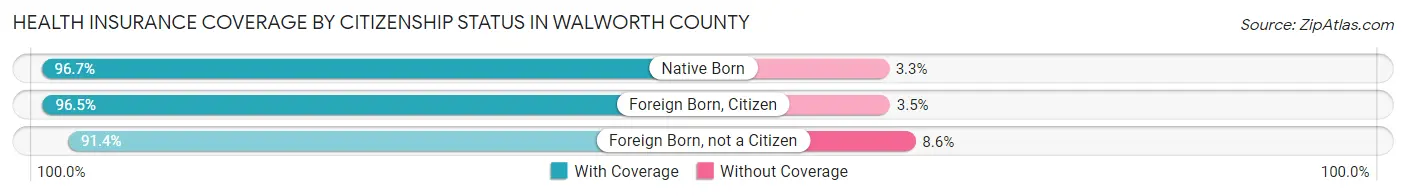
| Citizenship Status | With Coverage | Without Coverage |
| Native Born | 5,433 (96.7%) | 187 (3.3%) |
| Foreign Born, Citizen | 16,450 (96.5%) | 604 (3.5%) |
| Foreign Born, not a Citizen | 11,756 (91.4%) | 1,102 (8.6%) |
Health Insurance Coverage by Household Income in Walworth County
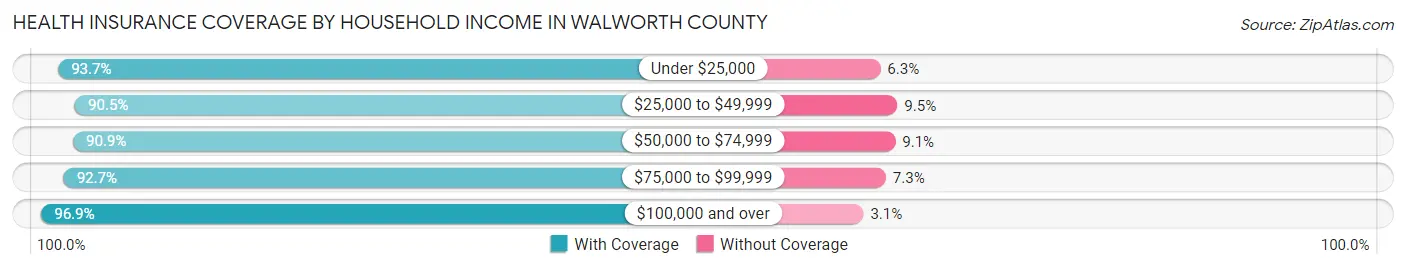
| Household Income | With Coverage | Without Coverage |
| Under $25,000 | 7,865 (93.7%) | 529 (6.3%) |
| $25,000 to $49,999 | 13,259 (90.5%) | 1,388 (9.5%) |
| $50,000 to $74,999 | 15,429 (90.9%) | 1,542 (9.1%) |
| $75,000 to $99,999 | 14,366 (92.7%) | 1,137 (7.3%) |
| $100,000 and over | 45,185 (96.9%) | 1,461 (3.1%) |
Public vs Private Health Insurance Coverage by Age in Walworth County

| Age Bracket | Public Insurance | Private Insurance |
| Under 6 | 1,943 (34.6%) | 3,848 (68.5%) |
| 6 to 18 Years | 5,051 (29.6%) | 12,546 (73.6%) |
| 19 to 25 Years | 1,698 (13.2%) | 10,287 (80.0%) |
| 25 to 34 Years | 1,602 (16.1%) | 7,534 (75.8%) |
| 35 to 44 Years | 1,585 (13.6%) | 9,142 (78.4%) |
| 45 to 54 Years | 1,546 (12.1%) | 10,853 (85.0%) |
| 55 to 64 Years | 2,890 (18.8%) | 12,646 (82.1%) |
| 65 to 74 Years | 11,206 (94.6%) | 7,083 (59.8%) |
| 75 Years and over | 7,279 (99.6%) | 5,025 (68.8%) |
| Total | 34,800 (33.3%) | 78,964 (75.6%) |
Disability Status by Sex by Age in Walworth County
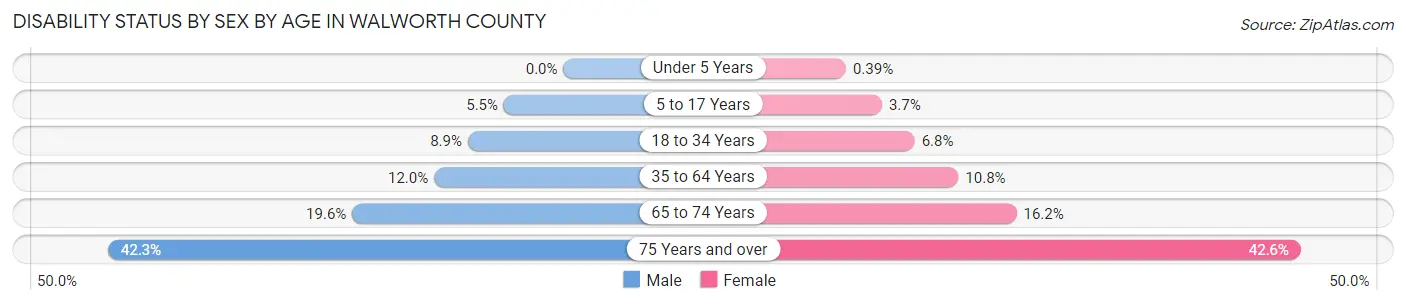
| Age Bracket | Male | Female |
| Under 5 Years | 0 (0.0%) | 9 (0.4%) |
| 5 to 17 Years | 459 (5.5%) | 293 (3.7%) |
| 18 to 34 Years | 1,130 (8.9%) | 797 (6.8%) |
| 35 to 64 Years | 2,403 (12.0%) | 2,141 (10.8%) |
| 65 to 74 Years | 1,145 (19.6%) | 974 (16.2%) |
| 75 Years and over | 1,369 (42.3%) | 1,732 (42.6%) |
Disability Class by Sex by Age in Walworth County
Disability Class: Hearing Difficulty
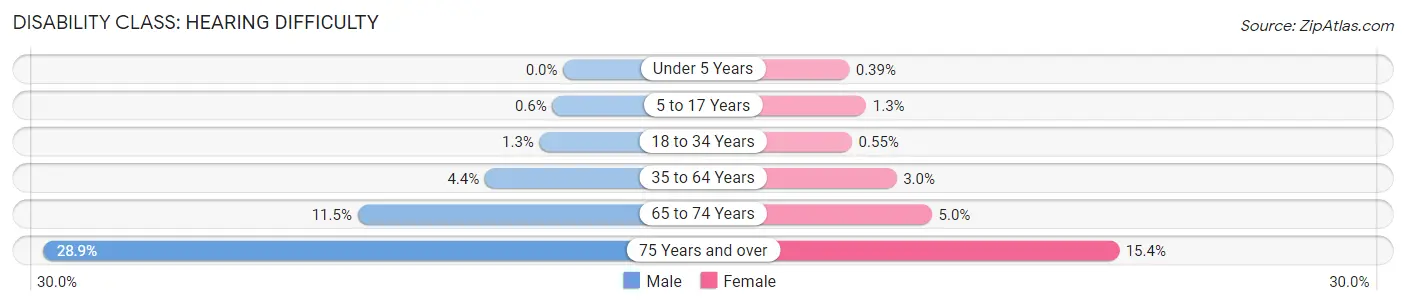
| Age Bracket | Male | Female |
| Under 5 Years | 0 (0.0%) | 9 (0.4%) |
| 5 to 17 Years | 50 (0.6%) | 105 (1.3%) |
| 18 to 34 Years | 168 (1.3%) | 65 (0.5%) |
| 35 to 64 Years | 874 (4.4%) | 600 (3.0%) |
| 65 to 74 Years | 669 (11.5%) | 300 (5.0%) |
| 75 Years and over | 937 (28.9%) | 627 (15.4%) |
Disability Class: Vision Difficulty
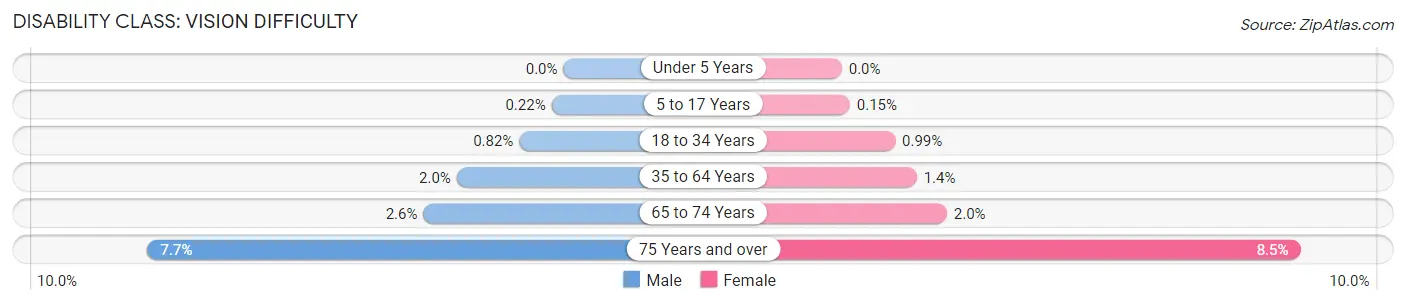
| Age Bracket | Male | Female |
| Under 5 Years | 0 (0.0%) | 0 (0.0%) |
| 5 to 17 Years | 18 (0.2%) | 12 (0.2%) |
| 18 to 34 Years | 104 (0.8%) | 117 (1.0%) |
| 35 to 64 Years | 396 (2.0%) | 275 (1.4%) |
| 65 to 74 Years | 152 (2.6%) | 117 (1.9%) |
| 75 Years and over | 250 (7.7%) | 346 (8.5%) |
Disability Class: Cognitive Difficulty
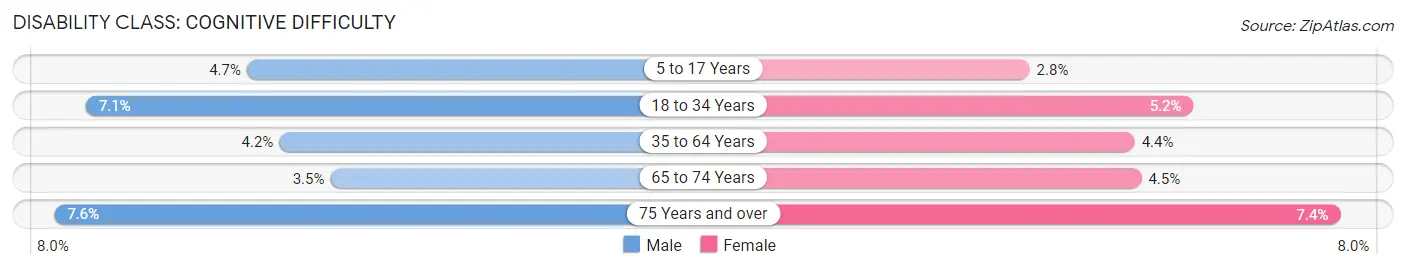
| Age Bracket | Male | Female |
| 5 to 17 Years | 391 (4.7%) | 219 (2.8%) |
| 18 to 34 Years | 903 (7.1%) | 614 (5.2%) |
| 35 to 64 Years | 846 (4.2%) | 861 (4.3%) |
| 65 to 74 Years | 202 (3.5%) | 267 (4.4%) |
| 75 Years and over | 245 (7.6%) | 301 (7.4%) |
Disability Class: Ambulatory Difficulty
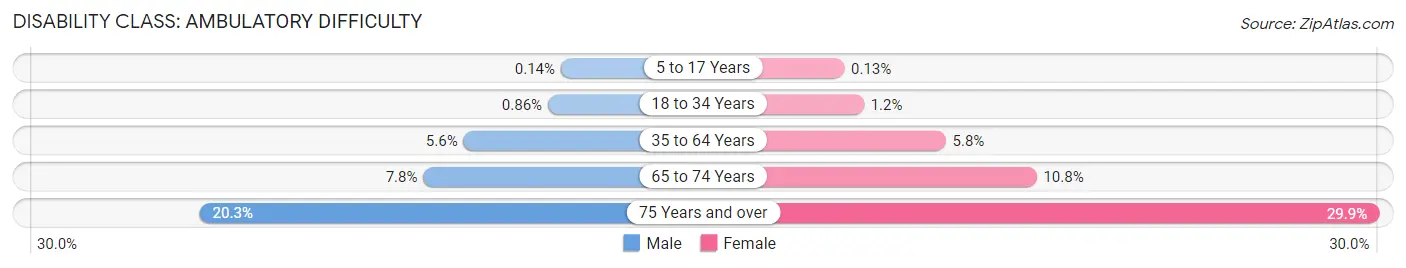
| Age Bracket | Male | Female |
| 5 to 17 Years | 12 (0.1%) | 10 (0.1%) |
| 18 to 34 Years | 109 (0.9%) | 144 (1.2%) |
| 35 to 64 Years | 1,113 (5.6%) | 1,144 (5.8%) |
| 65 to 74 Years | 456 (7.8%) | 651 (10.8%) |
| 75 Years and over | 656 (20.3%) | 1,216 (29.9%) |
Disability Class: Self-Care Difficulty
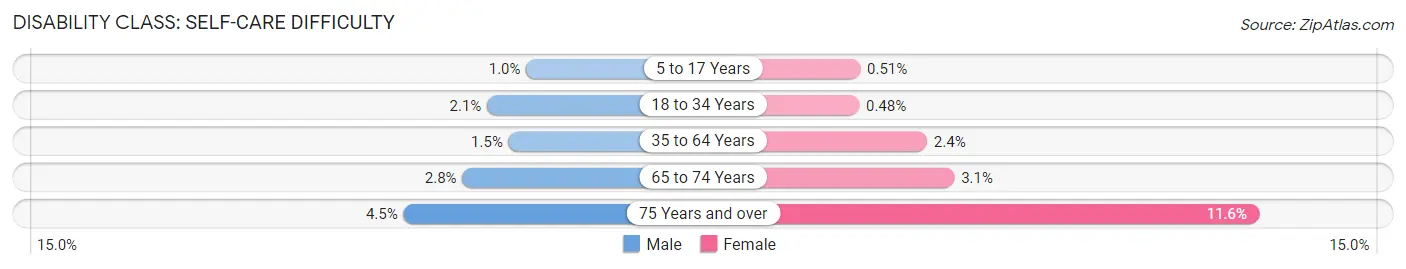
| Age Bracket | Male | Female |
| 5 to 17 Years | 86 (1.0%) | 40 (0.5%) |
| 18 to 34 Years | 270 (2.1%) | 56 (0.5%) |
| 35 to 64 Years | 305 (1.5%) | 470 (2.4%) |
| 65 to 74 Years | 164 (2.8%) | 188 (3.1%) |
| 75 Years and over | 144 (4.4%) | 472 (11.6%) |
Technology Access in Walworth County
Computing Device Access in Walworth County
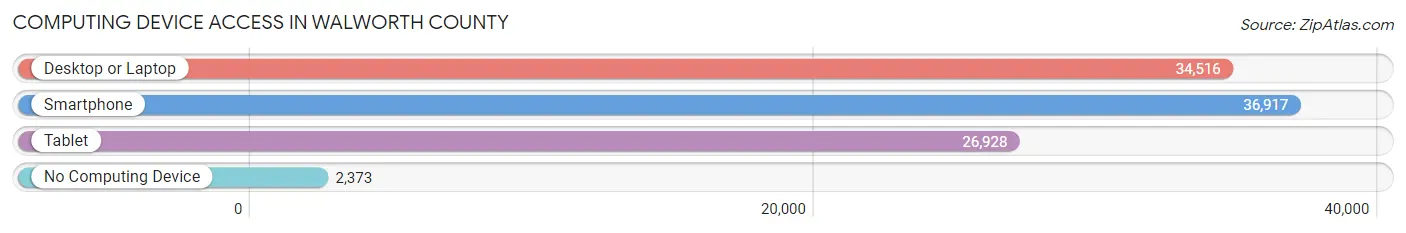
| Device Type | # Households | % Households |
| Desktop or Laptop | 34,516 | 81.8% |
| Smartphone | 36,917 | 87.5% |
| Tablet | 26,928 | 63.8% |
| No Computing Device | 2,373 | 5.6% |
| Total | 42,179 | 100.0% |
Internet Access in Walworth County
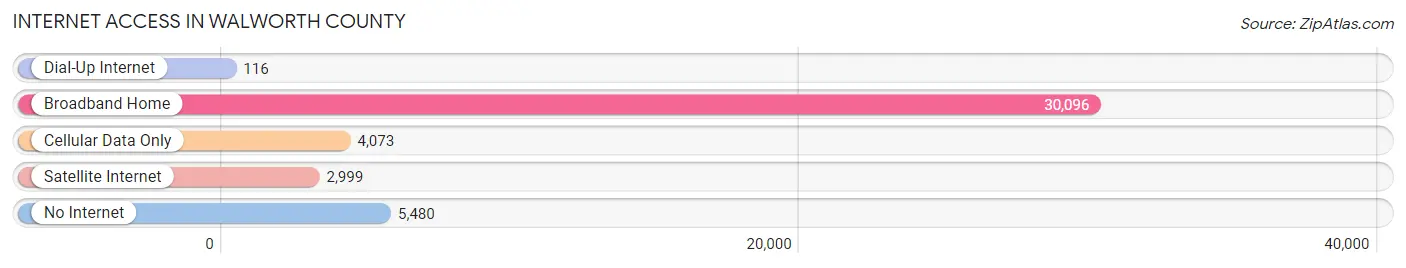
| Internet Type | # Households | % Households |
| Dial-Up Internet | 116 | 0.3% |
| Broadband Home | 30,096 | 71.4% |
| Cellular Data Only | 4,073 | 9.7% |
| Satellite Internet | 2,999 | 7.1% |
| No Internet | 5,480 | 13.0% |
| Total | 42,179 | 100.0% |
Walworth County Summary
Walworth County is located in southeastern Wisconsin, and is part of the Milwaukee-Waukesha-West Allis Metropolitan Statistical Area. It is bordered by Racine County to the north, Waukesha County to the east, Jefferson County to the south, and Rock County to the west. The county seat is Elkhorn, and the largest city is Whitewater. As of the 2010 census, the population of Walworth County was 102,228.
Geography
Walworth County covers an area of 576 square miles, making it the fourth largest county in Wisconsin. The county is located in the southeastern corner of the state, and is bordered by Racine County to the north, Waukesha County to the east, Jefferson County to the south, and Rock County to the west. The county is mostly rural, with rolling hills and valleys. The highest point in the county is located in the town of Lyons, at an elevation of 1,092 feet. The county is drained by the Fox River, which flows through the county from north to south.
History
Walworth County was established in 1836, and was named after Reuben H. Walworth, the first chancellor of New York State. The county was originally part of Milwaukee County, and was later split off to form its own county. The first settlers arrived in the area in the early 1830s, and the county was officially organized in 1839. The county seat was originally located in the town of Geneva, but was moved to Elkhorn in 1841.
Economy
The economy of Walworth County is largely based on agriculture and manufacturing. The county is home to several large agricultural operations, including dairy farms, beef farms, and vegetable farms. The county is also home to several large manufacturing companies, including Briggs & Stratton, which produces small engines, and Regal Beloit, which produces electric motors. The county is also home to several large retail stores, including Walmart and Target.
Demographics
As of the 2010 census, the population of Walworth County was 102,228, making it the fourth most populous county in Wisconsin. The population is spread out across the county, with the largest cities being Whitewater (14,390), Elkhorn (10,084), and Delavan (8,463). The racial makeup of the county is 94.3% White, 1.7% Black or African American, 0.5% Native American, 1.2% Asian, 0.1% Pacific Islander, 1.2% from other races, and 1.1% from two or more races. The median household income in the county is $54,845, and the median family income is $63,945. The per capita income in the county is $25,845.
Walworth County is home to several higher education institutions, including the University of Wisconsin-Whitewater, Carroll University, and Gateway Technical College. The county is also home to several large healthcare facilities, including Mercy Walworth Medical Center and Aurora Lakeland Medical Center. The county is served by several major highways, including Interstate 43, Interstate 90, and US Highway 12.
Common Questions
What is the Total Population of Walworth County?
Total Population of Walworth County is 105,127.
What is the Total Male Population of Walworth County?
Total Male Population of Walworth County is 52,922.
What is the Total Female Population of Walworth County?
Total Female Population of Walworth County is 52,205.
What is the Ratio of Males per 100 Females in Walworth County?
There are 101.37 Males per 100 Females in Walworth County.
What is the Ratio of Females per 100 Males in Walworth County?
There are 98.65 Females per 100 Males in Walworth County.
What is the Median Population Age in Walworth County?
Median Population Age in Walworth County is 40.7 Years.
What is the Average Family Size in Walworth County
Average Family Size in Walworth County is 2.9 People.
What is the Average Household Size in Walworth County
Average Household Size in Walworth County is 2.4 People.
What is Per Capita Income in Walworth County?
Per Capita income in Walworth County is $40,386.
What is the Median Family Income in Walworth County?
Median Family Income in Walworth County is $94,281.
What is the Median Household income in Walworth County?
Median Household Income in Walworth County is $75,172.
What is Income or Wage Gap in Walworth County?
Income or Wage Gap in Walworth County is 37.1%.
Women in Walworth County earn 62.9 cents for every dollar earned by a man.
What is Family Income Deficit in Walworth County?
Family Income Deficit in Walworth County is $9,758.
Families that are below poverty line in Walworth County earn $9,758 less on average than the poverty threshold level.
What is Inequality or Gini Index in Walworth County?
Inequality or Gini Index in Walworth County is 0.44.
How Large is the Labor Force in Walworth County?
There are 57,432 People in the Labor Forcein in Walworth County.
What is the Percentage of People in the Labor Force in Walworth County?
66.1% of People are in the Labor Force in Walworth County.
What is the Unemployment Rate in Walworth County?
Unemployment Rate in Walworth County is 3.1%.