St. Croix County, WI
St. Croix County Overview
93,752
TOTAL POPULATION
47,359
MALE POPULATION
46,393
FEMALE POPULATION
102.08
MALES / 100 FEMALES
97.96
FEMALES / 100 MALES
39.7
MEDIAN AGE
3.0
AVG FAMILY SIZE
2.6
AVG HOUSEHOLD SIZE
$45,810
PER CAPITA INCOME
$114,534
AVG FAMILY INCOME
$97,950
AVG HOUSEHOLD INCOME
28.0%
WAGE / INCOME GAP [ % ]
72.0¢/ $1
WAGE / INCOME GAP [ $ ]
$11,683
FAMILY INCOME DEFICIT
0.39
INEQUALITY / GINI INDEX
52,246
LABOR FORCE [ PEOPLE ]
70.8%
PERCENT IN LABOR FORCE
2.2%
UNEMPLOYMENT RATE
St. Croix County Area Codes
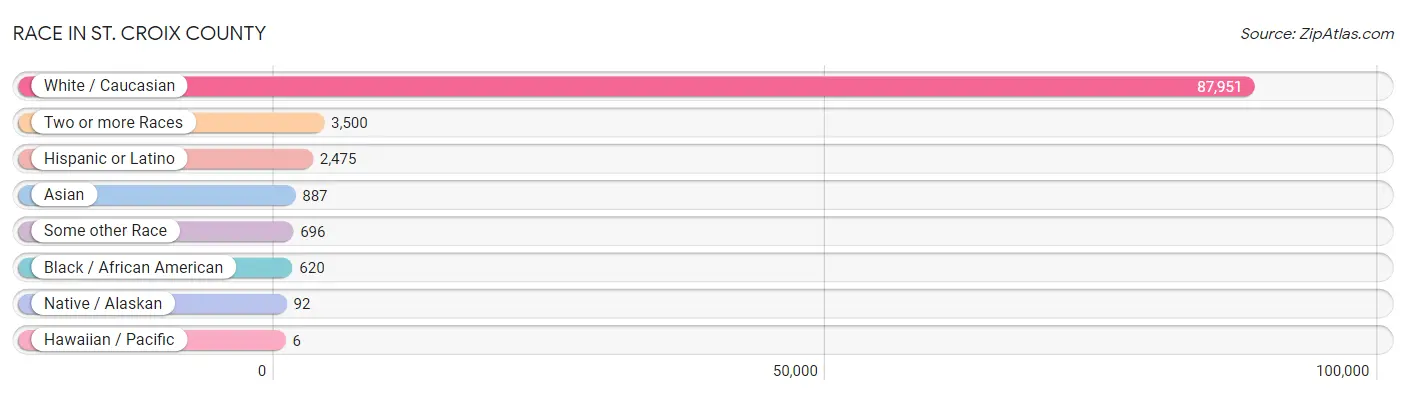
Race in St. Croix County
The most populous races in St. Croix County are White / Caucasian (87,951 | 93.8%), Two or more Races (3,500 | 3.7%), and Hispanic or Latino (2,475 | 2.6%).
| Race | # Population | % Population |
| Asian | 887 | 0.9% |
| Black / African American | 620 | 0.7% |
| Hawaiian / Pacific | 6 | 0.0% |
| Hispanic or Latino | 2,475 | 2.6% |
| Native / Alaskan | 92 | 0.1% |
| White / Caucasian | 87,951 | 93.8% |
| Two or more Races | 3,500 | 3.7% |
| Some other Race | 696 | 0.7% |
| Total | 93,752 | 100.0% |
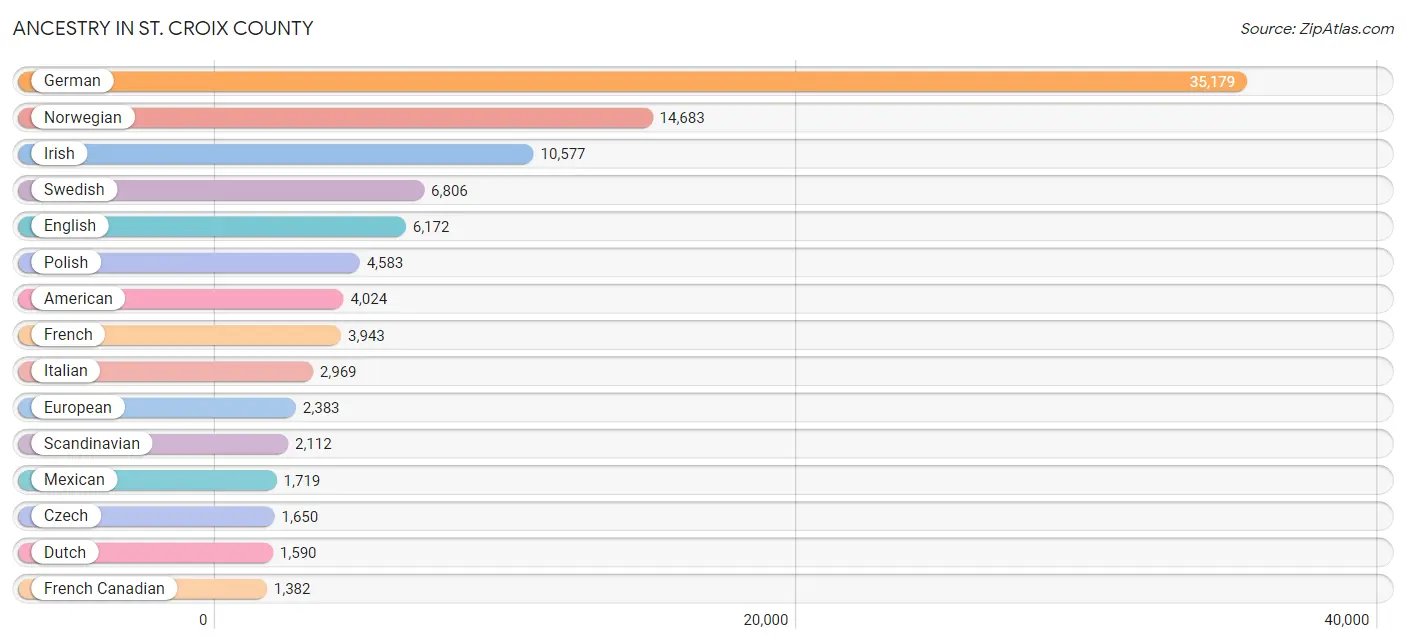
Ancestry in St. Croix County
The most populous ancestries reported in St. Croix County are German (35,179 | 37.5%), Norwegian (14,683 | 15.7%), Irish (10,577 | 11.3%), Swedish (6,806 | 7.3%), and English (6,172 | 6.6%), together accounting for 78.3% of all St. Croix County residents.
| Ancestry | # Population | % Population |
| African | 26 | 0.0% |
| American | 4,024 | 4.3% |
| Apache | 62 | 0.1% |
| Arab | 276 | 0.3% |
| Australian | 60 | 0.1% |
| Austrian | 323 | 0.3% |
| Bangladeshi | 547 | 0.6% |
| Belgian | 301 | 0.3% |
| Bhutanese | 163 | 0.2% |
| Blackfeet | 5 | 0.0% |
| Brazilian | 11 | 0.0% |
| British | 382 | 0.4% |
| Bulgarian | 5 | 0.0% |
| Burmese | 324 | 0.4% |
| Cajun | 1 | 0.0% |
| Canadian | 72 | 0.1% |
| Celtic | 3 | 0.0% |
| Central American | 146 | 0.2% |
| Central American Indian | 3 | 0.0% |
| Cherokee | 100 | 0.1% |
| Chilean | 38 | 0.0% |
| Chippewa | 218 | 0.2% |
| Colombian | 104 | 0.1% |
| Costa Rican | 36 | 0.0% |
| Cree | 1 | 0.0% |
| Creek | 16 | 0.0% |
| Croatian | 164 | 0.2% |
| Cuban | 121 | 0.1% |
| Czech | 1,650 | 1.8% |
| Czechoslovakian | 110 | 0.1% |
| Danish | 972 | 1.0% |
| Dominican | 21 | 0.0% |
| Dutch | 1,590 | 1.7% |
| Eastern European | 191 | 0.2% |
| Ecuadorian | 18 | 0.0% |
| Egyptian | 1 | 0.0% |
| English | 6,172 | 6.6% |
| European | 2,383 | 2.5% |
| Filipino | 41 | 0.0% |
| Finnish | 963 | 1.0% |
| French | 3,943 | 4.2% |
| French American Indian | 5 | 0.0% |
| French Canadian | 1,382 | 1.5% |
| German | 35,179 | 37.5% |
| Greek | 42 | 0.0% |
| Guatemalan | 31 | 0.0% |
| Honduran | 3 | 0.0% |
| Hungarian | 262 | 0.3% |
| Icelander | 29 | 0.0% |
| Indian (Asian) | 48 | 0.1% |
| Inupiat | 48 | 0.1% |
| Iranian | 7 | 0.0% |
| Irish | 10,577 | 11.3% |
| Iroquois | 12 | 0.0% |
| Italian | 2,969 | 3.2% |
| Japanese | 10 | 0.0% |
| Kiowa | 2 | 0.0% |
| Korean | 424 | 0.4% |
| Latvian | 16 | 0.0% |
| Lebanese | 206 | 0.2% |
| Liberian | 50 | 0.1% |
| Lithuanian | 133 | 0.1% |
| Luxembourger | 152 | 0.2% |
| Malaysian | 5 | 0.0% |
| Menominee | 2 | 0.0% |
| Mexican | 1,719 | 1.8% |
| Mexican American Indian | 42 | 0.0% |
| Moroccan | 4 | 0.0% |
| Native Hawaiian | 44 | 0.1% |
| Nicaraguan | 2 | 0.0% |
| Northern European | 238 | 0.3% |
| Norwegian | 14,683 | 15.7% |
| Pakistani | 1 | 0.0% |
| Pennsylvania German | 3 | 0.0% |
| Polish | 4,583 | 4.9% |
| Portuguese | 61 | 0.1% |
| Potawatomi | 7 | 0.0% |
| Puerto Rican | 85 | 0.1% |
| Romanian | 34 | 0.0% |
| Russian | 515 | 0.5% |
| Salvadoran | 74 | 0.1% |
| Scandinavian | 2,112 | 2.2% |
| Scotch-Irish | 306 | 0.3% |
| Scottish | 1,236 | 1.3% |
| Serbian | 159 | 0.2% |
| Sioux | 22 | 0.0% |
| Slavic | 54 | 0.1% |
| Slovak | 30 | 0.0% |
| Slovene | 95 | 0.1% |
| South American | 187 | 0.2% |
| Spaniard | 23 | 0.0% |
| Spanish | 72 | 0.1% |
| Spanish American | 25 | 0.0% |
| Sri Lankan | 99 | 0.1% |
| Subsaharan African | 77 | 0.1% |
| Sudanese | 1 | 0.0% |
| Swedish | 6,806 | 7.3% |
| Swiss | 504 | 0.5% |
| Syrian | 7 | 0.0% |
| Thai | 71 | 0.1% |
| Ukrainian | 199 | 0.2% |
| Uruguayan | 26 | 0.0% |
| Welsh | 338 | 0.4% |
| Yugoslavian | 21 | 0.0% | View All 104 Rows |
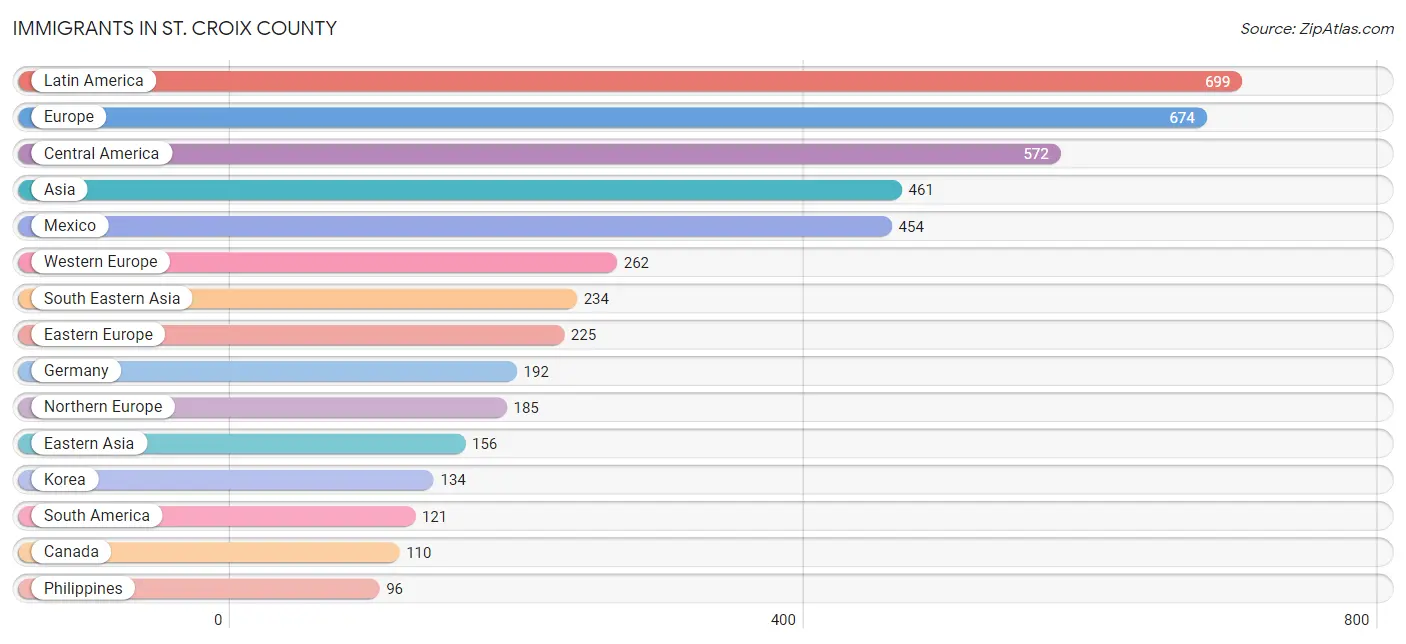
Immigrants in St. Croix County
The most numerous immigrant groups reported in St. Croix County came from Latin America (699 | 0.7%), Europe (674 | 0.7%), Central America (572 | 0.6%), Asia (461 | 0.5%), and Mexico (454 | 0.5%), together accounting for 3.0% of all St. Croix County residents.
| Immigration Origin | # Population | % Population |
| Africa | 92 | 0.1% |
| Asia | 461 | 0.5% |
| Australia | 34 | 0.0% |
| Belarus | 17 | 0.0% |
| Bosnia and Herzegovina | 34 | 0.0% |
| Brazil | 5 | 0.0% |
| Canada | 110 | 0.1% |
| Caribbean | 6 | 0.0% |
| Central America | 572 | 0.6% |
| Chile | 38 | 0.0% |
| China | 20 | 0.0% |
| Colombia | 59 | 0.1% |
| Costa Rica | 18 | 0.0% |
| Cuba | 6 | 0.0% |
| Czechoslovakia | 8 | 0.0% |
| Denmark | 15 | 0.0% |
| Eastern Africa | 7 | 0.0% |
| Eastern Asia | 156 | 0.2% |
| Eastern Europe | 225 | 0.2% |
| Ecuador | 18 | 0.0% |
| El Salvador | 85 | 0.1% |
| England | 22 | 0.0% |
| Ethiopia | 7 | 0.0% |
| Europe | 674 | 0.7% |
| France | 19 | 0.0% |
| Germany | 192 | 0.2% |
| Guatemala | 11 | 0.0% |
| Honduras | 2 | 0.0% |
| India | 54 | 0.1% |
| Iran | 7 | 0.0% |
| Ireland | 22 | 0.0% |
| Italy | 2 | 0.0% |
| Japan | 2 | 0.0% |
| Korea | 134 | 0.1% |
| Laos | 56 | 0.1% |
| Latin America | 699 | 0.7% |
| Latvia | 16 | 0.0% |
| Liberia | 60 | 0.1% |
| Mexico | 454 | 0.5% |
| Morocco | 24 | 0.0% |
| Netherlands | 19 | 0.0% |
| Nicaragua | 2 | 0.0% |
| Northern Africa | 25 | 0.0% |
| Northern Europe | 185 | 0.2% |
| Oceania | 34 | 0.0% |
| Pakistan | 10 | 0.0% |
| Philippines | 96 | 0.1% |
| Poland | 54 | 0.1% |
| Romania | 3 | 0.0% |
| Russia | 43 | 0.1% |
| Scotland | 23 | 0.0% |
| South America | 121 | 0.1% |
| South Central Asia | 71 | 0.1% |
| South Eastern Asia | 234 | 0.3% |
| Southern Europe | 2 | 0.0% |
| Sudan | 1 | 0.0% |
| Sweden | 95 | 0.1% |
| Switzerland | 32 | 0.0% |
| Thailand | 35 | 0.0% |
| Ukraine | 50 | 0.1% |
| Vietnam | 47 | 0.1% |
| Western Africa | 60 | 0.1% |
| Western Europe | 262 | 0.3% | View All 63 Rows |
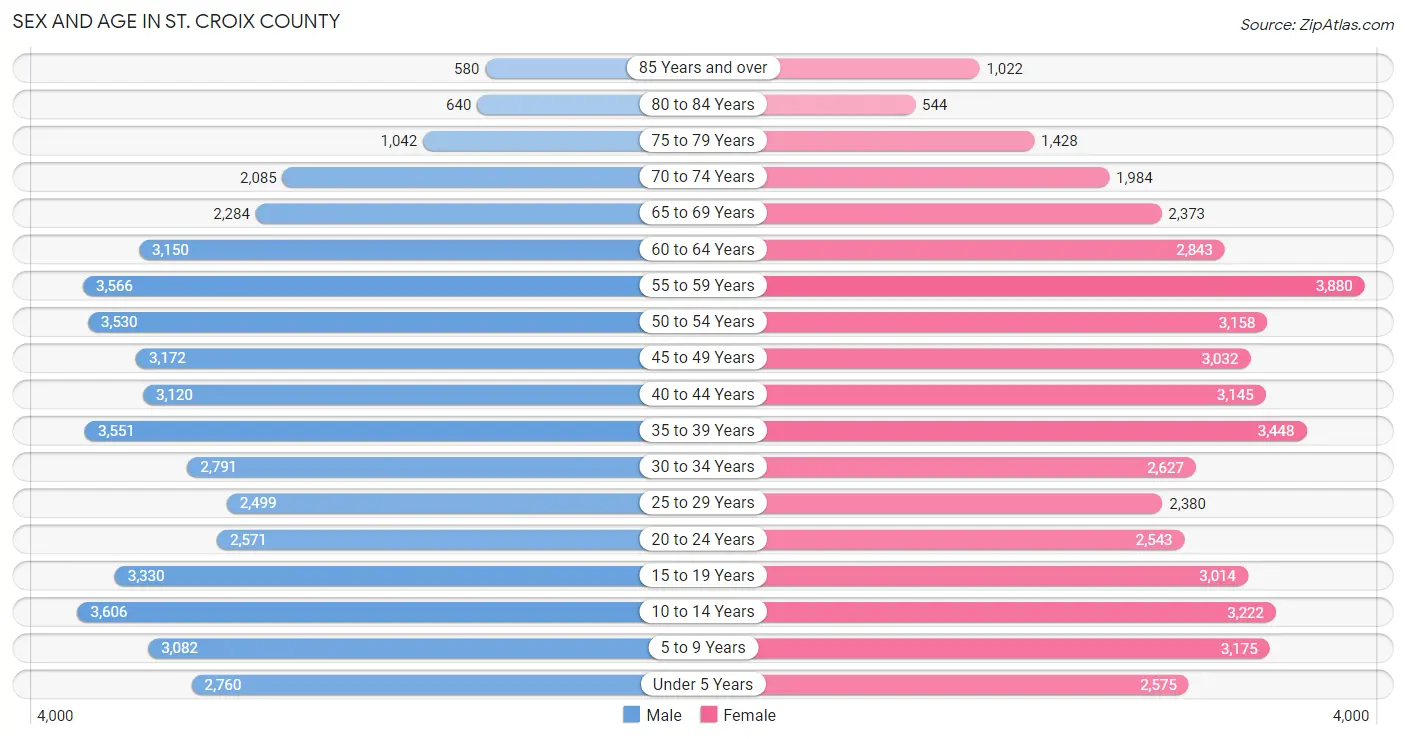
Sex and Age in St. Croix County
Sex and Age in St. Croix County
The most populous age groups in St. Croix County are 10 to 14 Years (3,606 | 7.6%) for men and 55 to 59 Years (3,880 | 8.4%) for women.
| Age Bracket | Male | Female |
| Under 5 Years | 2,760 (5.8%) | 2,575 (5.6%) |
| 5 to 9 Years | 3,082 (6.5%) | 3,175 (6.8%) |
| 10 to 14 Years | 3,606 (7.6%) | 3,222 (7.0%) |
| 15 to 19 Years | 3,330 (7.0%) | 3,014 (6.5%) |
| 20 to 24 Years | 2,571 (5.4%) | 2,543 (5.5%) |
| 25 to 29 Years | 2,499 (5.3%) | 2,380 (5.1%) |
| 30 to 34 Years | 2,791 (5.9%) | 2,627 (5.7%) |
| 35 to 39 Years | 3,551 (7.5%) | 3,448 (7.4%) |
| 40 to 44 Years | 3,120 (6.6%) | 3,145 (6.8%) |
| 45 to 49 Years | 3,172 (6.7%) | 3,032 (6.5%) |
| 50 to 54 Years | 3,530 (7.4%) | 3,158 (6.8%) |
| 55 to 59 Years | 3,566 (7.5%) | 3,880 (8.4%) |
| 60 to 64 Years | 3,150 (6.7%) | 2,843 (6.1%) |
| 65 to 69 Years | 2,284 (4.8%) | 2,373 (5.1%) |
| 70 to 74 Years | 2,085 (4.4%) | 1,984 (4.3%) |
| 75 to 79 Years | 1,042 (2.2%) | 1,428 (3.1%) |
| 80 to 84 Years | 640 (1.3%) | 544 (1.2%) |
| 85 Years and over | 580 (1.2%) | 1,022 (2.2%) |
| Total | 47,359 (100.0%) | 46,393 (100.0%) |
Families and Households in St. Croix County
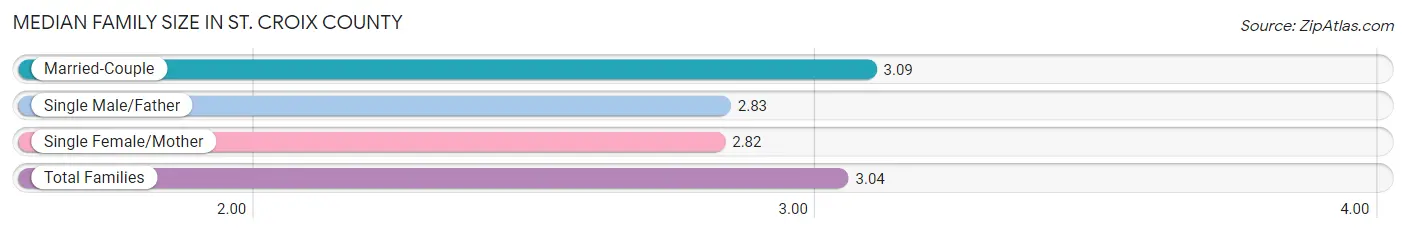
Median Family Size in St. Croix County
The median family size in St. Croix County is 3.04 persons per family, with married-couple families (20,917 | 81.7%) accounting for the largest median family size of 3.09 persons per family. On the other hand, single female/mother families (3,014 | 11.8%) represent the smallest median family size with 2.82 persons per family.
| Family Type | # Families | Family Size |
| Married-Couple | 20,917 (81.7%) | 3.09 |
| Single Male/Father | 1,686 (6.6%) | 2.83 |
| Single Female/Mother | 3,014 (11.8%) | 2.82 |
| Total Families | 25,617 (100.0%) | 3.04 |
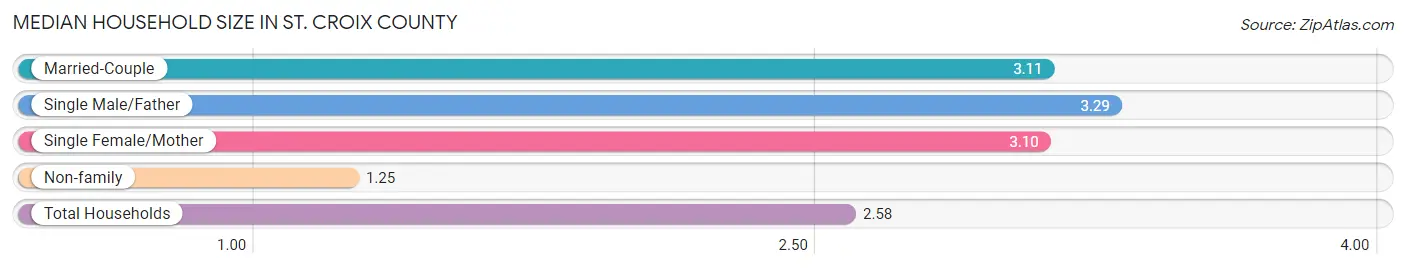
Median Household Size in St. Croix County
The median household size in St. Croix County is 2.58 persons per household, with single male/father households (1,686 | 4.7%) accounting for the largest median household size of 3.29 persons per household. non-family households (10,387 | 28.8%) represent the smallest median household size with 1.25 persons per household.
| Household Type | # Households | Household Size |
| Married-Couple | 20,917 (58.1%) | 3.11 |
| Single Male/Father | 1,686 (4.7%) | 3.29 |
| Single Female/Mother | 3,014 (8.4%) | 3.10 |
| Non-family | 10,387 (28.8%) | 1.25 |
| Total Households | 36,004 (100.0%) | 2.58 |
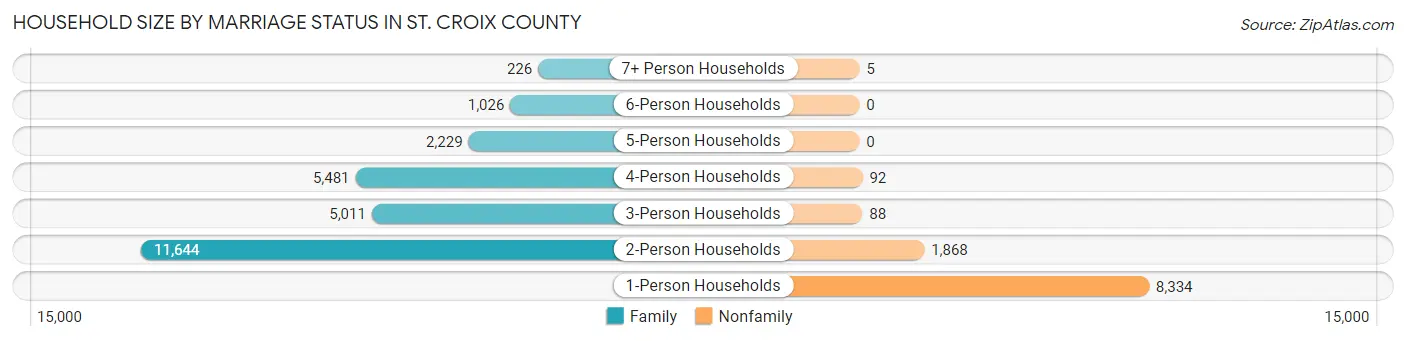
Household Size by Marriage Status in St. Croix County
Out of a total of 36,004 households in St. Croix County, 25,617 (71.2%) are family households, while 10,387 (28.8%) are nonfamily households. The most numerous type of family households are 2-person households, comprising 11,644, and the most common type of nonfamily households are 1-person households, comprising 8,334.
| Household Size | Family Households | Nonfamily Households |
| 1-Person Households | - | 8,334 (23.2%) |
| 2-Person Households | 11,644 (32.3%) | 1,868 (5.2%) |
| 3-Person Households | 5,011 (13.9%) | 88 (0.2%) |
| 4-Person Households | 5,481 (15.2%) | 92 (0.3%) |
| 5-Person Households | 2,229 (6.2%) | 0 (0.0%) |
| 6-Person Households | 1,026 (2.9%) | 0 (0.0%) |
| 7+ Person Households | 226 (0.6%) | 5 (0.0%) |
| Total | 25,617 (71.2%) | 10,387 (28.8%) |
Female Fertility in St. Croix County
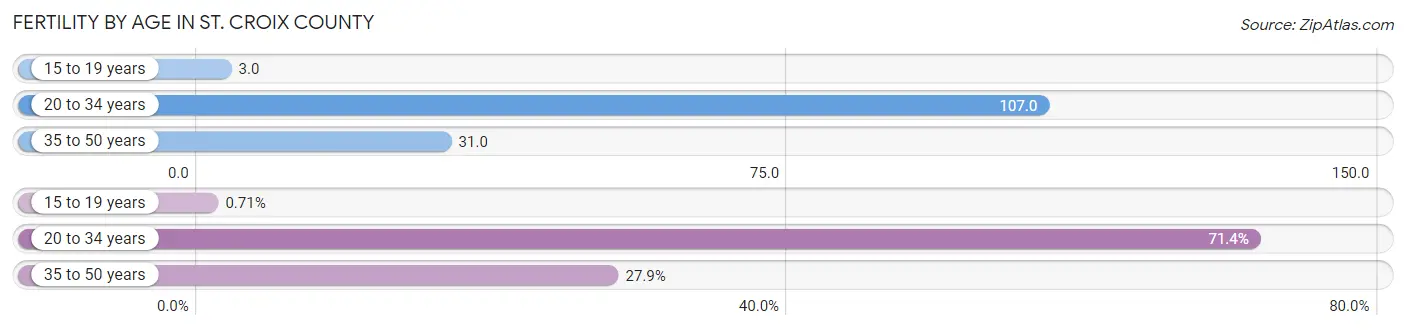
Fertility by Age in St. Croix County
Average fertility rate in St. Croix County is 54.0 births per 1,000 women. Women in the age bracket of 20 to 34 years have the highest fertility rate with 107.0 births per 1,000 women. Women in the age bracket of 20 to 34 years acount for 71.4% of all women with births.
| Age Bracket | Women with Births | Births / 1,000 Women |
| 15 to 19 years | 8 (0.7%) | 3.0 |
| 20 to 34 years | 805 (71.4%) | 107.0 |
| 35 to 50 years | 314 (27.9%) | 31.0 |
| Total | 1,127 (100.0%) | 54.0 |
Fertility by Age by Marriage Status in St. Croix County
84.6% of women with births (1,127) in St. Croix County are married. The highest percentage of unmarried women with births falls into 15 to 19 years age bracket with 100.0% of them unmarried at the time of birth, while the lowest percentage of unmarried women with births belong to 35 to 50 years age bracket with 11.2% of them unmarried.
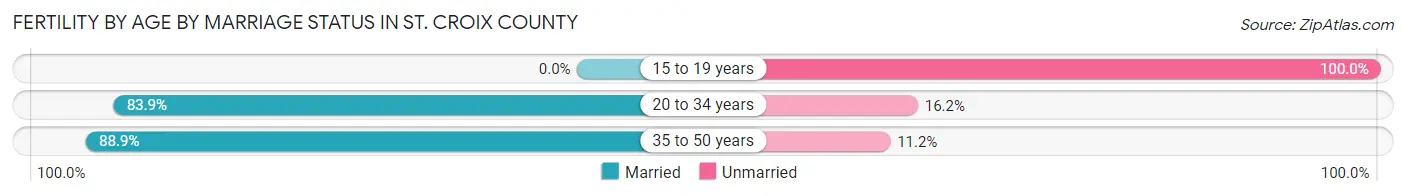
| Age Bracket | Married | Unmarried |
| 15 to 19 years | 0 (0.0%) | 8 (100.0%) |
| 20 to 34 years | 675 (83.9%) | 130 (16.2%) |
| 35 to 50 years | 279 (88.8%) | 35 (11.2%) |
| Total | 953 (84.6%) | 174 (15.4%) |
Fertility by Education in St. Croix County
Average fertility rate in St. Croix County is 54.0 births per 1,000 women. Women with the education attainment of graduate degree have the highest fertility rate of 80.0 births per 1,000 women, while women with the education attainment of less than high school have the lowest fertility at 5.0 births per 1,000 women. Women with the education attainment of bachelor's degree represent 41.3% of all women with births.
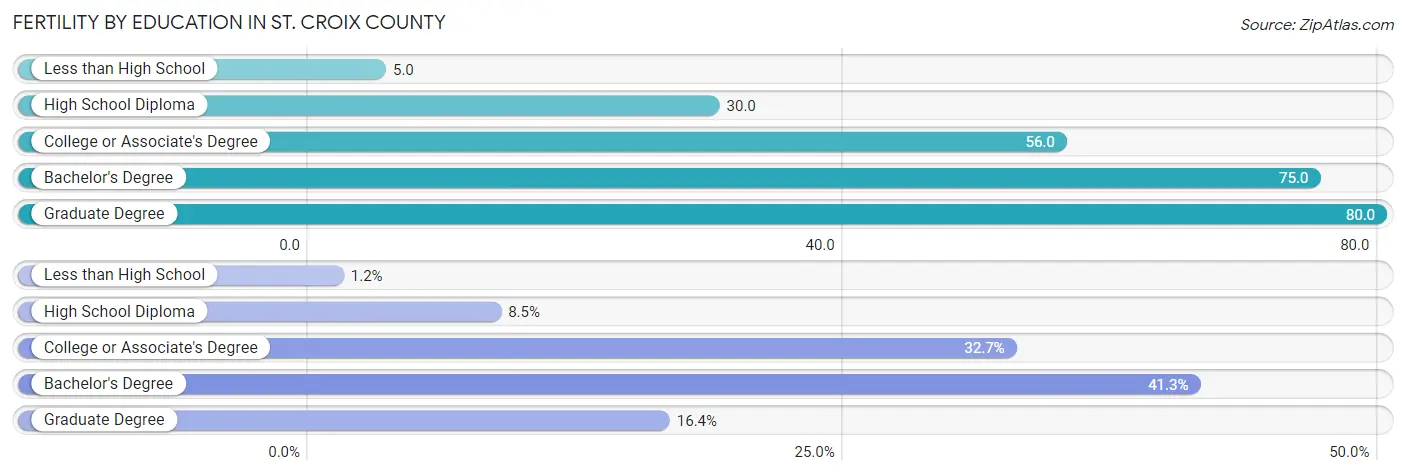
| Educational Attainment | Women with Births | Births / 1,000 Women |
| Less than High School | 13 (1.1%) | 5.0 |
| High School Diploma | 96 (8.5%) | 30.0 |
| College or Associate's Degree | 368 (32.7%) | 56.0 |
| Bachelor's Degree | 465 (41.3%) | 75.0 |
| Graduate Degree | 185 (16.4%) | 80.0 |
| Total | 1,127 (100.0%) | 54.0 |
Fertility by Education by Marriage Status in St. Croix County
15.4% of women with births in St. Croix County are unmarried. Women with the educational attainment of graduate degree are most likely to be married with 96.8% of them married at childbirth, while women with the educational attainment of less than high school are least likely to be married with 61.5% of them unmarried at childbirth.
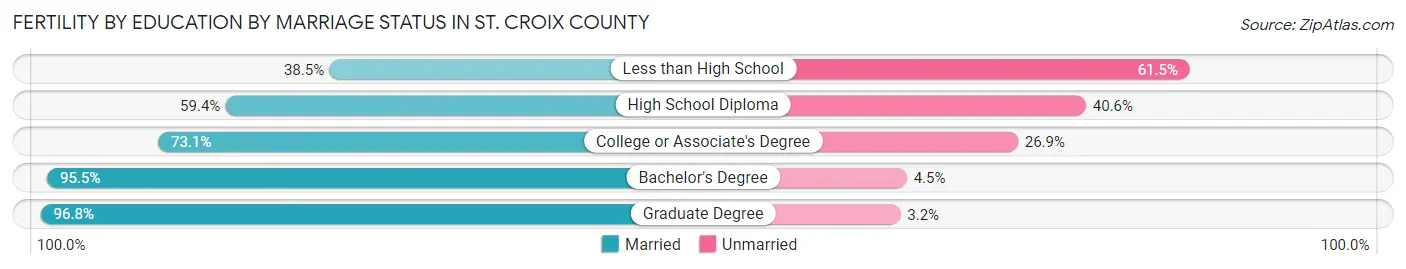
| Educational Attainment | Married | Unmarried |
| Less than High School | 5 (38.5%) | 8 (61.5%) |
| High School Diploma | 57 (59.4%) | 39 (40.6%) |
| College or Associate's Degree | 269 (73.1%) | 99 (26.9%) |
| Bachelor's Degree | 444 (95.5%) | 21 (4.5%) |
| Graduate Degree | 179 (96.8%) | 6 (3.2%) |
| Total | 953 (84.6%) | 174 (15.4%) |
Income in St. Croix County
Income Overview in St. Croix County
Per Capita Income in St. Croix County is $45,810, while median incomes of families and households are $114,534 and $97,950 respectively.
| Characteristic | Number | Measure |
| Per Capita Income | 93,752 | $45,810 |
| Median Family Income | 25,617 | $114,534 |
| Mean Family Income | 25,617 | $133,794 |
| Median Household Income | 36,004 | $97,950 |
| Mean Household Income | 36,004 | $116,715 |
| Income Deficit | 25,617 | $11,683 |
| Wage / Income Gap (%) | 93,752 | 27.95% |
| Wage / Income Gap ($) | 93,752 | 72.05¢ per $1 |
| Gini / Inequality Index | 93,752 | 0.39 |
Earnings by Sex in St. Croix County
Average Earnings in St. Croix County are $50,700, $58,860 for men and $42,408 for women, a difference of 28.0%.
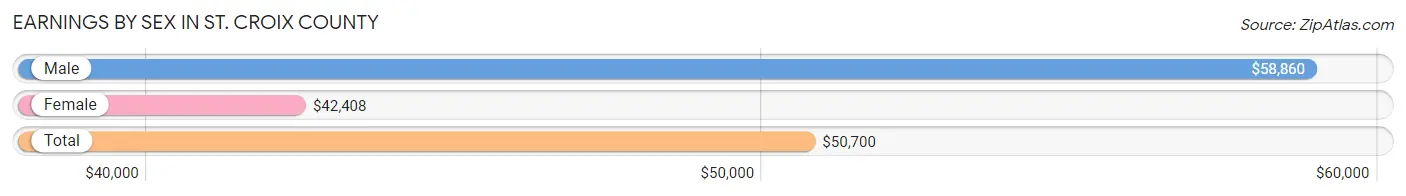
| Sex | Number | Average Earnings |
| Male | 28,754 (52.6%) | $58,860 |
| Female | 25,944 (47.4%) | $42,408 |
| Total | 54,698 (100.0%) | $50,700 |
Earnings by Sex by Income Bracket in St. Croix County
The most common earnings brackets in St. Croix County are $100,000+ for men (6,608 | 23.0%) and $100,000+ for women (2,872 | 11.1%).
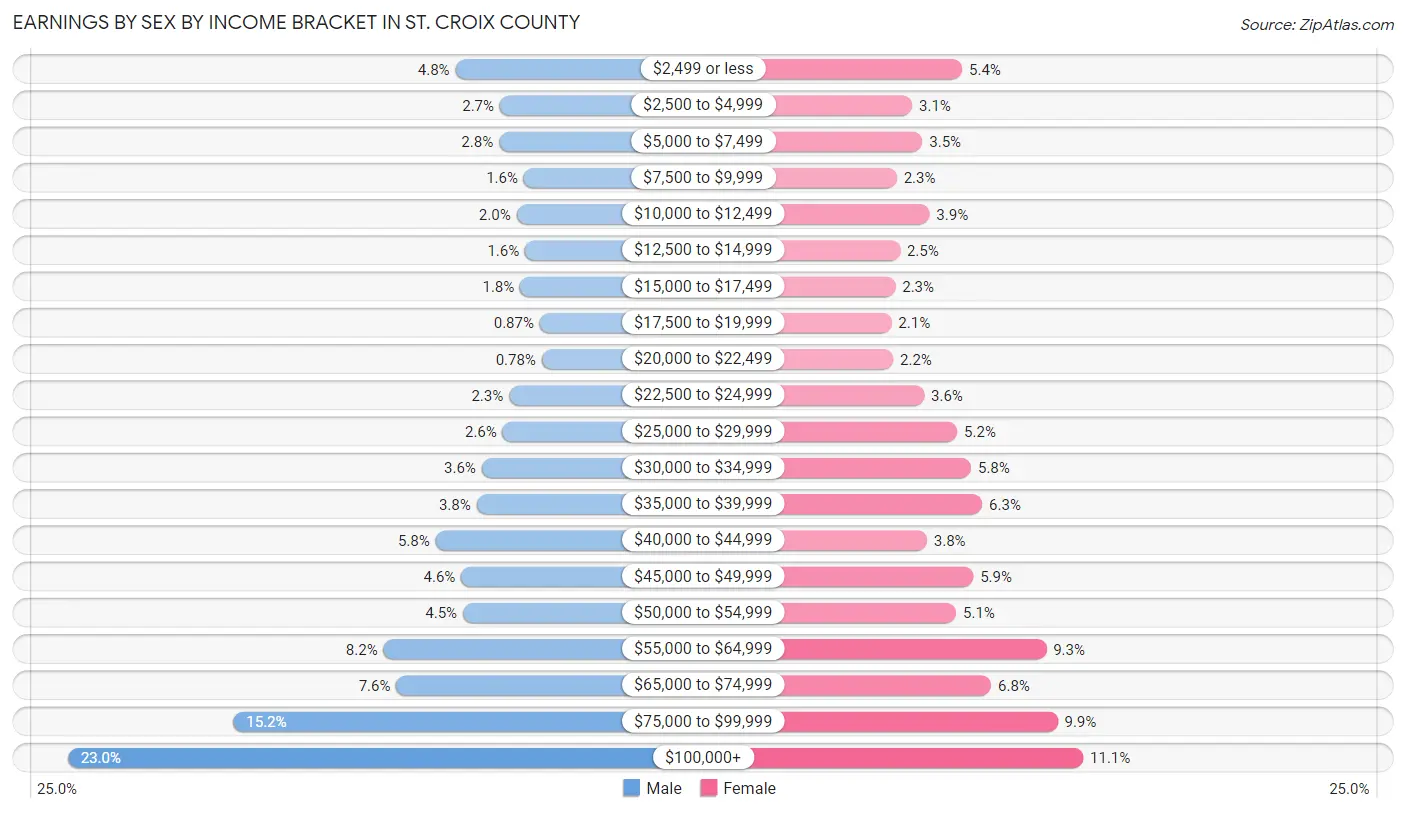
| Income | Male | Female |
| $2,499 or less | 1,385 (4.8%) | 1,401 (5.4%) |
| $2,500 to $4,999 | 787 (2.7%) | 793 (3.1%) |
| $5,000 to $7,499 | 800 (2.8%) | 919 (3.5%) |
| $7,500 to $9,999 | 465 (1.6%) | 607 (2.3%) |
| $10,000 to $12,499 | 564 (2.0%) | 1,004 (3.9%) |
| $12,500 to $14,999 | 449 (1.6%) | 647 (2.5%) |
| $15,000 to $17,499 | 515 (1.8%) | 590 (2.3%) |
| $17,500 to $19,999 | 249 (0.9%) | 541 (2.1%) |
| $20,000 to $22,499 | 223 (0.8%) | 563 (2.2%) |
| $22,500 to $24,999 | 664 (2.3%) | 938 (3.6%) |
| $25,000 to $29,999 | 750 (2.6%) | 1,341 (5.2%) |
| $30,000 to $34,999 | 1,032 (3.6%) | 1,510 (5.8%) |
| $35,000 to $39,999 | 1,102 (3.8%) | 1,645 (6.3%) |
| $40,000 to $44,999 | 1,652 (5.8%) | 972 (3.7%) |
| $45,000 to $49,999 | 1,309 (4.5%) | 1,535 (5.9%) |
| $50,000 to $54,999 | 1,286 (4.5%) | 1,329 (5.1%) |
| $55,000 to $64,999 | 2,355 (8.2%) | 2,423 (9.3%) |
| $65,000 to $74,999 | 2,183 (7.6%) | 1,754 (6.8%) |
| $75,000 to $99,999 | 4,376 (15.2%) | 2,560 (9.9%) |
| $100,000+ | 6,608 (23.0%) | 2,872 (11.1%) |
| Total | 28,754 (100.0%) | 25,944 (100.0%) |
Earnings by Sex by Educational Attainment in St. Croix County
Average earnings in St. Croix County are $68,837 for men and $49,112 for women, a difference of 28.6%. Men with an educational attainment of graduate degree enjoy the highest average annual earnings of $102,905, while those with less than high school education earn the least with $44,625. Women with an educational attainment of graduate degree earn the most with the average annual earnings of $70,850, while those with less than high school education have the smallest earnings of $29,601.
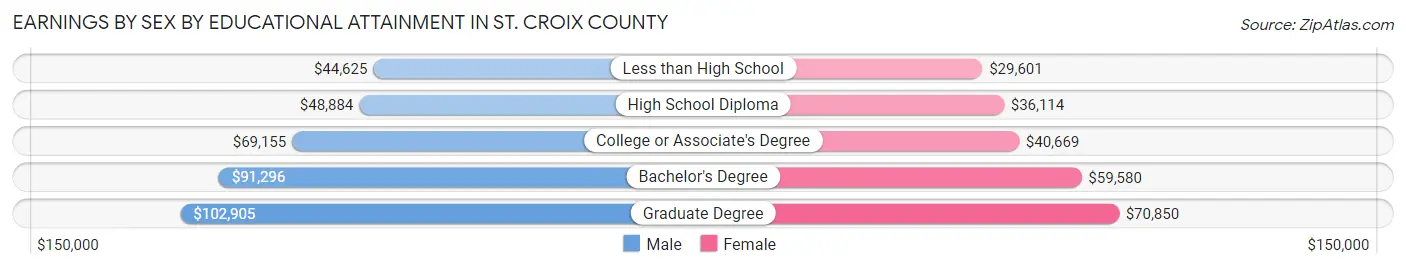
| Educational Attainment | Male Income | Female Income |
| Less than High School | $44,625 | $29,601 |
| High School Diploma | $48,884 | $36,114 |
| College or Associate's Degree | $69,155 | $40,669 |
| Bachelor's Degree | $91,296 | $59,580 |
| Graduate Degree | $102,905 | $70,850 |
| Total | $68,837 | $49,112 |
Family Income in St. Croix County
Family Income Brackets in St. Croix County
According to the St. Croix County family income data, there are 7,045 families falling into the $100,000 to $149,999 income range, which is the most common income bracket and makes up 27.5% of all families. Conversely, the $10,000 to $14,999 income bracket is the least frequent group with only 77 families (0.3%) belonging to this category.
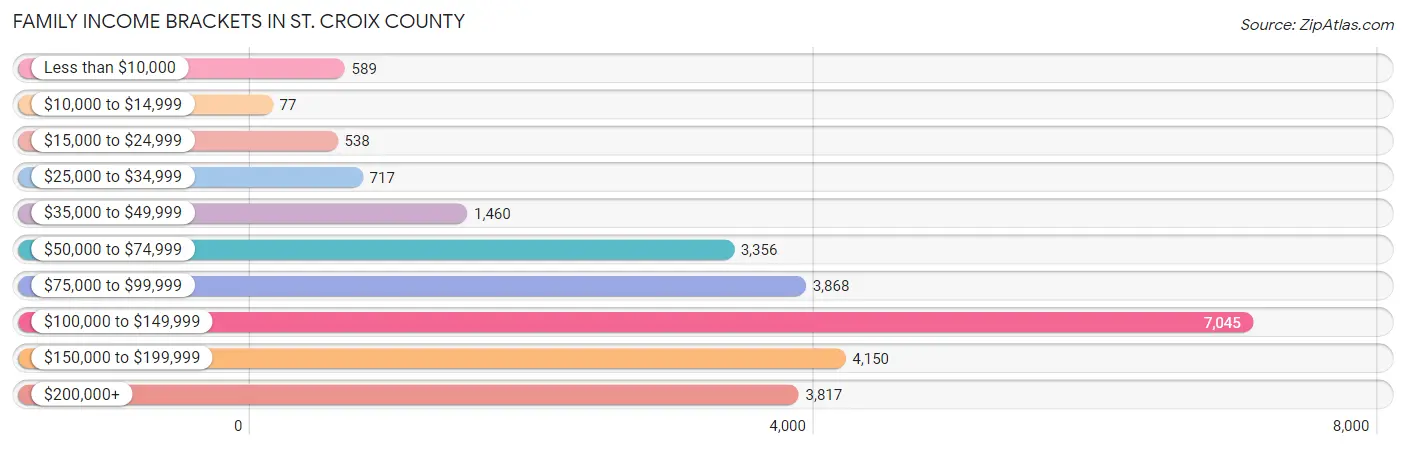
| Income Bracket | # Families | % Families |
| Less than $10,000 | 589 | 2.3% |
| $10,000 to $14,999 | 77 | 0.3% |
| $15,000 to $24,999 | 538 | 2.1% |
| $25,000 to $34,999 | 717 | 2.8% |
| $35,000 to $49,999 | 1,460 | 5.7% |
| $50,000 to $74,999 | 3,356 | 13.1% |
| $75,000 to $99,999 | 3,868 | 15.1% |
| $100,000 to $149,999 | 7,045 | 27.5% |
| $150,000 to $199,999 | 4,150 | 16.2% |
| $200,000+ | 3,817 | 14.9% |
Family Income by Famaliy Size in St. Croix County
6-person families (949 | 3.7%) account for the highest median family income in St. Croix County with $157,232 per family, while 2-person families (12,401 | 48.4%) have the highest median income of $47,620 per family member.
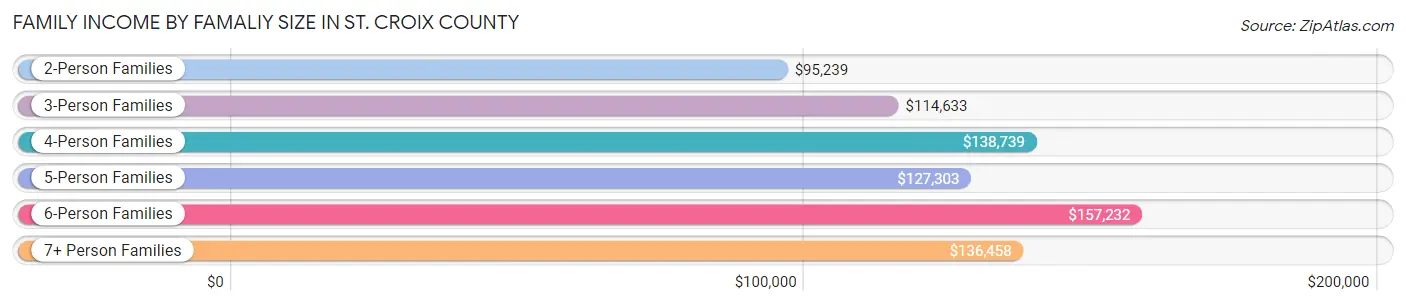
| Income Bracket | # Families | Median Income |
| 2-Person Families | 12,401 (48.4%) | $95,239 |
| 3-Person Families | 4,787 (18.7%) | $114,633 |
| 4-Person Families | 5,391 (21.0%) | $138,739 |
| 5-Person Families | 1,948 (7.6%) | $127,303 |
| 6-Person Families | 949 (3.7%) | $157,232 |
| 7+ Person Families | 141 (0.5%) | $136,458 |
| Total | 25,617 (100.0%) | $114,534 |
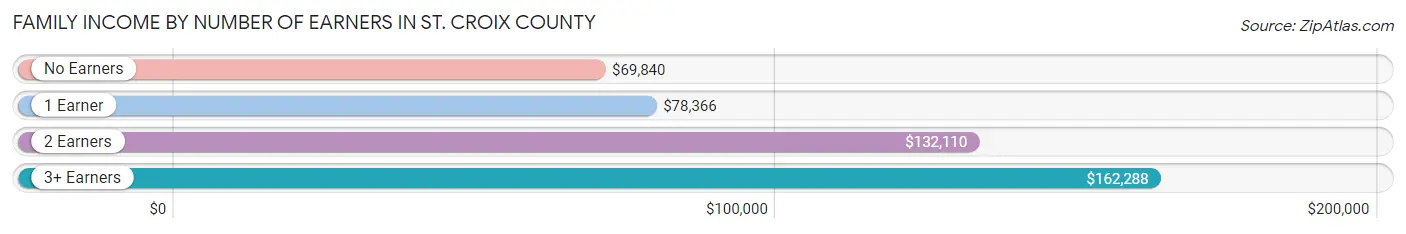
Family Income by Number of Earners in St. Croix County
The median family income in St. Croix County is $114,534, with families comprising 3+ earners (3,414) having the highest median family income of $162,288, while families with no earners (3,378) have the lowest median family income of $69,840, accounting for 13.3% and 13.2% of families, respectively.
| Number of Earners | # Families | Median Income |
| No Earners | 3,378 (13.2%) | $69,840 |
| 1 Earner | 6,099 (23.8%) | $78,366 |
| 2 Earners | 12,726 (49.7%) | $132,110 |
| 3+ Earners | 3,414 (13.3%) | $162,288 |
| Total | 25,617 (100.0%) | $114,534 |
Household Income in St. Croix County
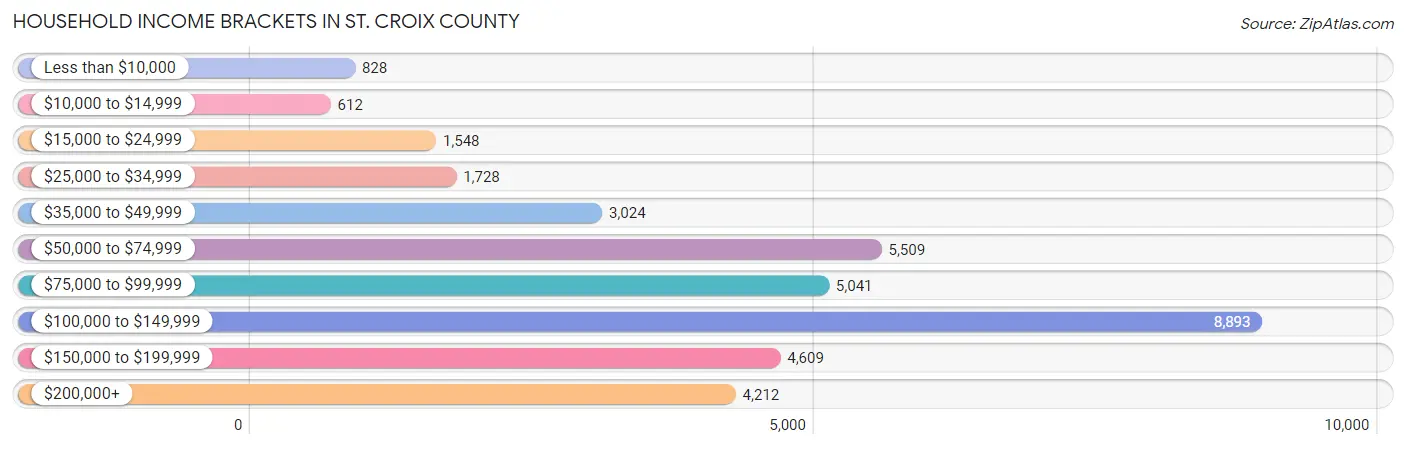
Household Income Brackets in St. Croix County
With 8,893 households falling in the category, the $100,000 to $149,999 income range is the most frequent in St. Croix County, accounting for 24.7% of all households. In contrast, only 612 households (1.7%) fall into the $10,000 to $14,999 income bracket, making it the least populous group.
| Income Bracket | # Households | % Households |
| Less than $10,000 | 828 | 2.3% |
| $10,000 to $14,999 | 612 | 1.7% |
| $15,000 to $24,999 | 1,548 | 4.3% |
| $25,000 to $34,999 | 1,728 | 4.8% |
| $35,000 to $49,999 | 3,024 | 8.4% |
| $50,000 to $74,999 | 5,509 | 15.3% |
| $75,000 to $99,999 | 5,041 | 14.0% |
| $100,000 to $149,999 | 8,893 | 24.7% |
| $150,000 to $199,999 | 4,609 | 12.8% |
| $200,000+ | 4,212 | 11.7% |
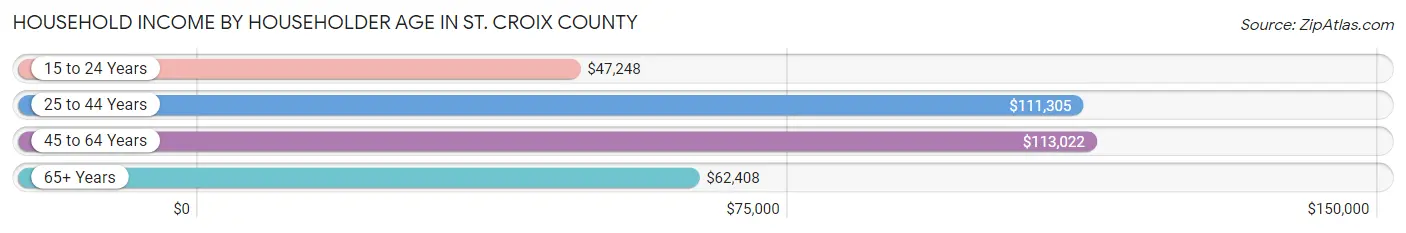
Household Income by Householder Age in St. Croix County
The median household income in St. Croix County is $97,950, with the highest median household income of $113,022 found in the 45 to 64 years age bracket for the primary householder. A total of 15,037 households (41.8%) fall into this category. Meanwhile, the 15 to 24 years age bracket for the primary householder has the lowest median household income of $47,248, with 980 households (2.7%) in this group.
| Income Bracket | # Households | Median Income |
| 15 to 24 Years | 980 (2.7%) | $47,248 |
| 25 to 44 Years | 11,586 (32.2%) | $111,305 |
| 45 to 64 Years | 15,037 (41.8%) | $113,022 |
| 65+ Years | 8,401 (23.3%) | $62,408 |
| Total | 36,004 (100.0%) | $97,950 |
Poverty in St. Croix County
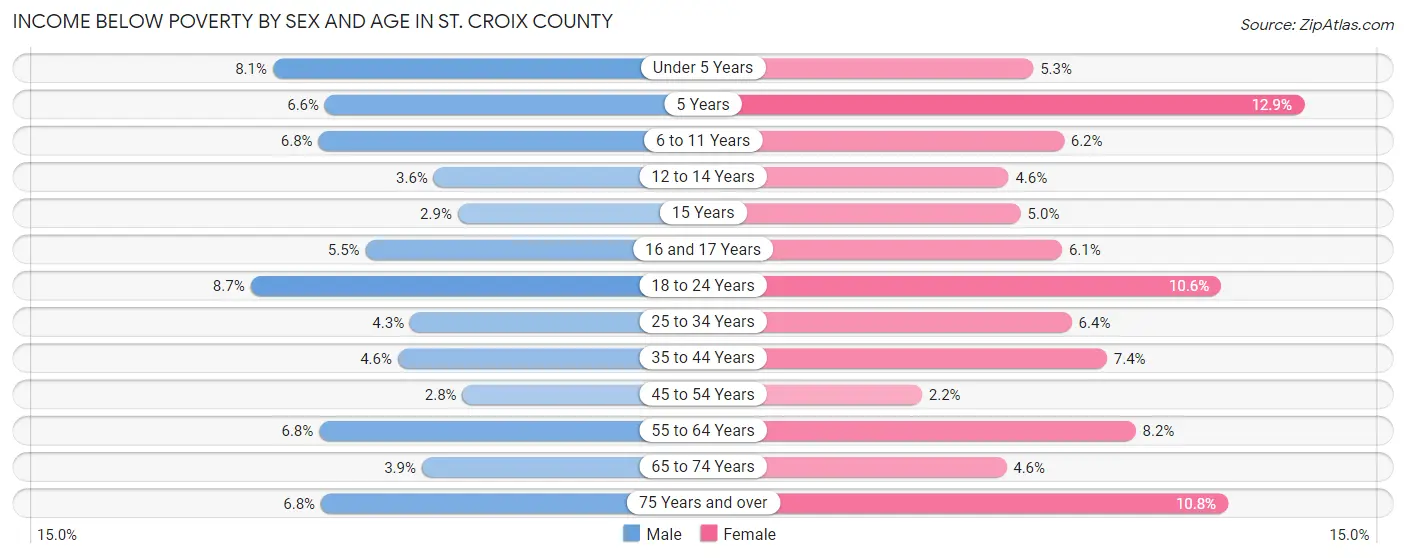
Income Below Poverty by Sex and Age in St. Croix County
With 5.3% poverty level for males and 6.5% for females among the residents of St. Croix County, 18 to 24 year old males and 5 year old females are the most vulnerable to poverty, with 318 males (8.7%) and 71 females (12.9%) in their respective age groups living below the poverty level.
| Age Bracket | Male | Female |
| Under 5 Years | 222 (8.1%) | 136 (5.3%) |
| 5 Years | 46 (6.6%) | 71 (12.9%) |
| 6 to 11 Years | 251 (6.8%) | 236 (6.2%) |
| 12 to 14 Years | 76 (3.6%) | 91 (4.6%) |
| 15 Years | 21 (2.9%) | 41 (5.0%) |
| 16 and 17 Years | 81 (5.5%) | 73 (6.1%) |
| 18 to 24 Years | 318 (8.7%) | 374 (10.6%) |
| 25 to 34 Years | 224 (4.3%) | 320 (6.4%) |
| 35 to 44 Years | 306 (4.6%) | 486 (7.4%) |
| 45 to 54 Years | 187 (2.8%) | 138 (2.2%) |
| 55 to 64 Years | 456 (6.8%) | 550 (8.2%) |
| 65 to 74 Years | 172 (3.9%) | 199 (4.6%) |
| 75 Years and over | 139 (6.8%) | 299 (10.7%) |
| Total | 2,499 (5.3%) | 3,014 (6.5%) |
Income Above Poverty by Sex and Age in St. Croix County
According to the poverty statistics in St. Croix County, males aged 45 to 54 years and females aged 45 to 54 years are the age groups that are most secure financially, with 97.2% of males and 97.8% of females in these age groups living above the poverty line.
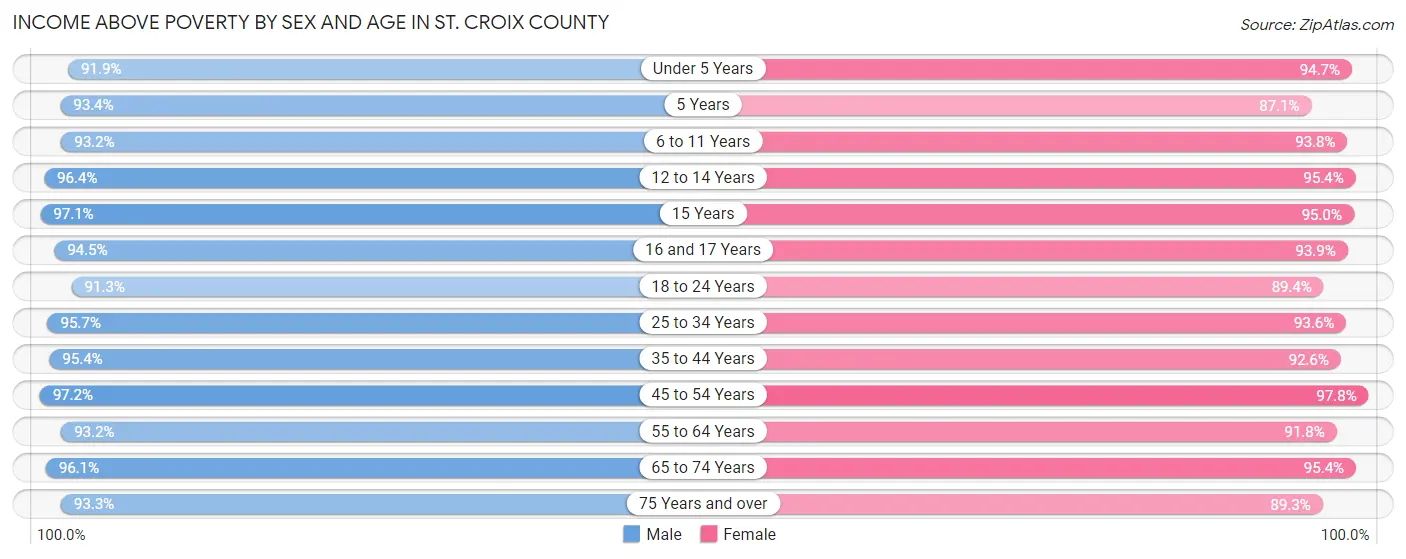
| Age Bracket | Male | Female |
| Under 5 Years | 2,523 (91.9%) | 2,416 (94.7%) |
| 5 Years | 647 (93.4%) | 481 (87.1%) |
| 6 to 11 Years | 3,432 (93.2%) | 3,580 (93.8%) |
| 12 to 14 Years | 2,031 (96.4%) | 1,872 (95.4%) |
| 15 Years | 694 (97.1%) | 782 (95.0%) |
| 16 and 17 Years | 1,390 (94.5%) | 1,117 (93.9%) |
| 18 to 24 Years | 3,335 (91.3%) | 3,168 (89.4%) |
| 25 to 34 Years | 5,021 (95.7%) | 4,683 (93.6%) |
| 35 to 44 Years | 6,325 (95.4%) | 6,101 (92.6%) |
| 45 to 54 Years | 6,471 (97.2%) | 6,052 (97.8%) |
| 55 to 64 Years | 6,254 (93.2%) | 6,172 (91.8%) |
| 65 to 74 Years | 4,195 (96.1%) | 4,142 (95.4%) |
| 75 Years and over | 1,921 (93.2%) | 2,483 (89.2%) |
| Total | 44,239 (94.7%) | 43,049 (93.5%) |
Income Below Poverty Among Married-Couple Families in St. Croix County
The poverty statistics for married-couple families in St. Croix County show that 2.2% or 455 of the total 20,917 families live below the poverty line. Families with 5 or more children have the highest poverty rate of 6.1%, comprising of 6 families. On the other hand, families with 1 or 2 children have the lowest poverty rate of 1.5%, which includes 100 families.
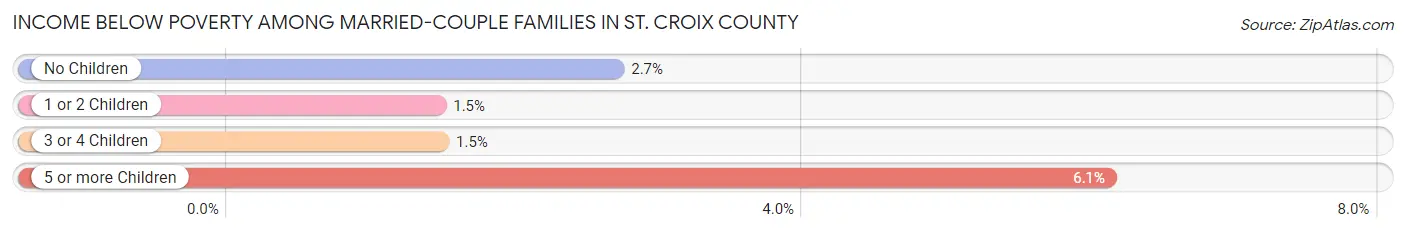
| Children | Above Poverty | Below Poverty |
| No Children | 11,449 (97.3%) | 317 (2.7%) |
| 1 or 2 Children | 6,782 (98.6%) | 100 (1.5%) |
| 3 or 4 Children | 2,139 (98.5%) | 32 (1.5%) |
| 5 or more Children | 92 (93.9%) | 6 (6.1%) |
| Total | 20,462 (97.8%) | 455 (2.2%) |
Income Below Poverty Among Single-Parent Households in St. Croix County
According to the poverty data in St. Croix County, 2.7% or 45 single-father households and 21.4% or 645 single-mother households are living below the poverty line. Among single-father households, those with no children have the highest poverty rate, with 29 households (5.7%) experiencing poverty. Likewise, among single-mother households, those with 5 or more children have the highest poverty rate, with 23 households (71.9%) falling below the poverty line.
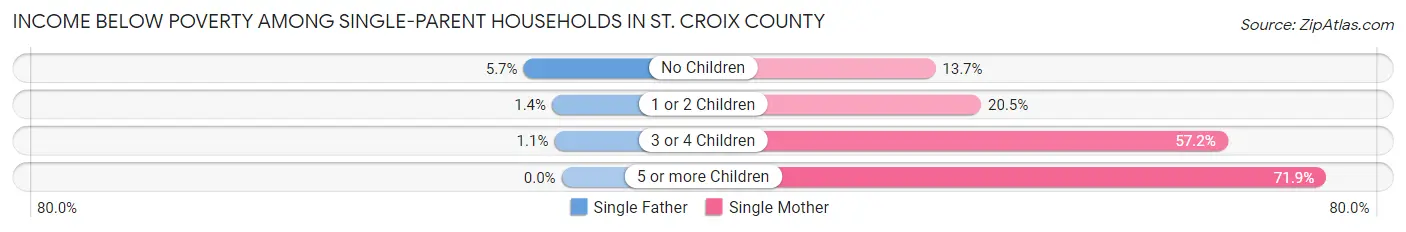
| Children | Single Father | Single Mother |
| No Children | 29 (5.7%) | 156 (13.7%) |
| 1 or 2 Children | 14 (1.4%) | 327 (20.5%) |
| 3 or 4 Children | 2 (1.1%) | 139 (57.2%) |
| 5 or more Children | 0 (0.0%) | 23 (71.9%) |
| Total | 45 (2.7%) | 645 (21.4%) |
Income Below Poverty Among Married-Couple vs Single-Parent Households in St. Croix County
The poverty data for St. Croix County shows that 455 of the married-couple family households (2.2%) and 690 of the single-parent households (14.7%) are living below the poverty level. Within the married-couple family households, those with 5 or more children have the highest poverty rate, with 6 households (6.1%) falling below the poverty line. Among the single-parent households, those with 5 or more children have the highest poverty rate, with 23 household (59.0%) living below poverty.
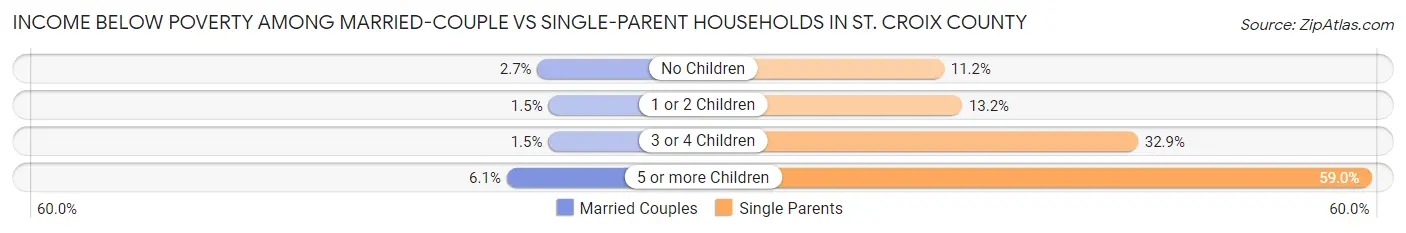
| Children | Married-Couple Families | Single-Parent Households |
| No Children | 317 (2.7%) | 185 (11.2%) |
| 1 or 2 Children | 100 (1.5%) | 341 (13.2%) |
| 3 or 4 Children | 32 (1.5%) | 141 (32.9%) |
| 5 or more Children | 6 (6.1%) | 23 (59.0%) |
| Total | 455 (2.2%) | 690 (14.7%) |
Employment Characteristics in St. Croix County
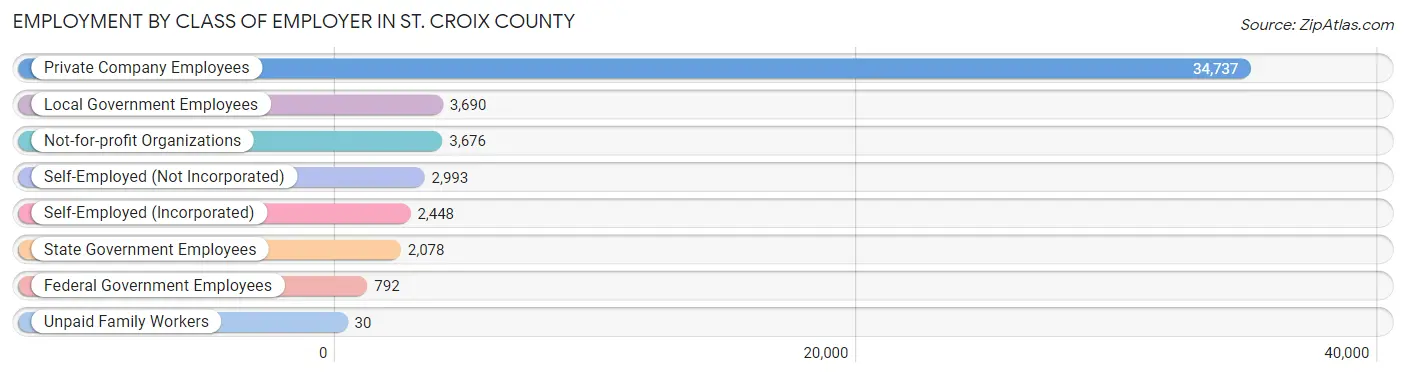
Employment by Class of Employer in St. Croix County
Among the 50,444 employed individuals in St. Croix County, private company employees (34,737 | 68.9%), local government employees (3,690 | 7.3%), and not-for-profit organizations (3,676 | 7.3%) make up the most common classes of employment.
| Employer Class | # Employees | % Employees |
| Private Company Employees | 34,737 | 68.9% |
| Self-Employed (Incorporated) | 2,448 | 4.9% |
| Self-Employed (Not Incorporated) | 2,993 | 5.9% |
| Not-for-profit Organizations | 3,676 | 7.3% |
| Local Government Employees | 3,690 | 7.3% |
| State Government Employees | 2,078 | 4.1% |
| Federal Government Employees | 792 | 1.6% |
| Unpaid Family Workers | 30 | 0.1% |
| Total | 50,444 | 100.0% |
Employment Status by Age in St. Croix County
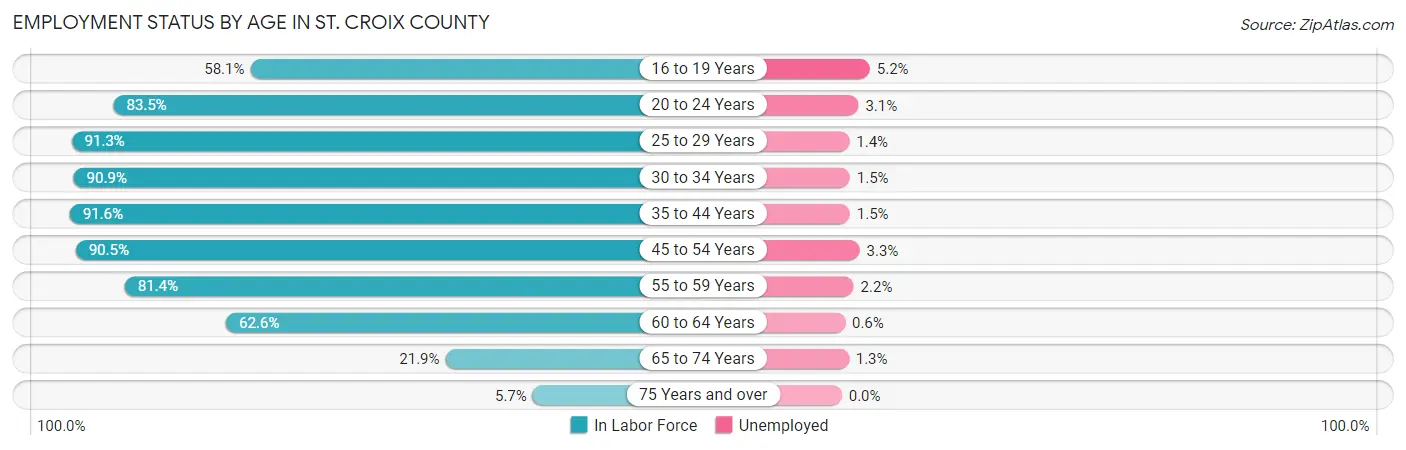
According to the labor force statistics for St. Croix County, out of the total population over 16 years of age (73,794), 70.8% or 52,246 individuals are in the labor force, with 2.2% or 1,149 of them unemployed. The age group with the highest labor force participation rate is 35 to 44 years, with 91.6% or 12,150 individuals in the labor force. Within the labor force, the 16 to 19 years age range has the highest percentage of unemployed individuals, with 5.2% or 145 of them being unemployed.
| Age Bracket | In Labor Force | Unemployed |
| 16 to 19 Years | 2,792 (58.1%) | 145 (5.2%) |
| 20 to 24 Years | 4,270 (83.5%) | 132 (3.1%) |
| 25 to 29 Years | 4,455 (91.3%) | 62 (1.4%) |
| 30 to 34 Years | 4,925 (90.9%) | 74 (1.5%) |
| 35 to 44 Years | 12,150 (91.6%) | 182 (1.5%) |
| 45 to 54 Years | 11,667 (90.5%) | 385 (3.3%) |
| 55 to 59 Years | 6,061 (81.4%) | 133 (2.2%) |
| 60 to 64 Years | 3,752 (62.6%) | 23 (0.6%) |
| 65 to 74 Years | 1,911 (21.9%) | 25 (1.3%) |
| 75 Years and over | 300 (5.7%) | 0 (0.0%) |
| Total | 52,246 (70.8%) | 1,149 (2.2%) |
Employment Status by Educational Attainment in St. Croix County
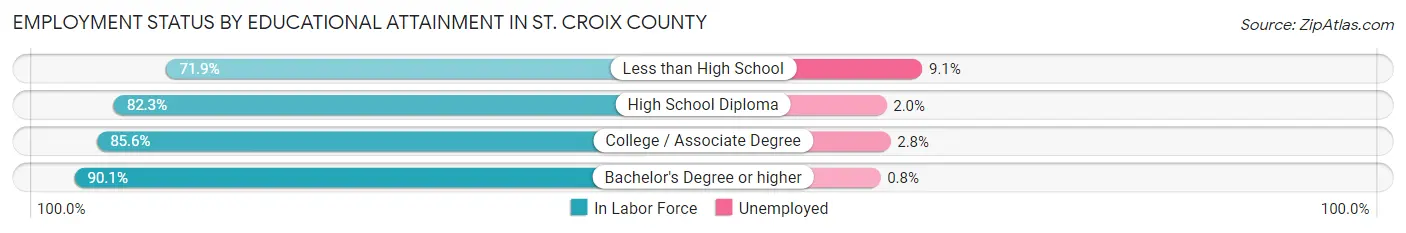
According to labor force statistics for St. Croix County, 86.2% of individuals (43,007) out of the total population between 25 and 64 years of age (49,892) are in the labor force, with 2.0% or 860 of them being unemployed. The group with the highest labor force participation rate are those with the educational attainment of bachelor's degree or higher, with 90.1% or 17,846 individuals in the labor force. Within the labor force, individuals with less than high school education have the highest percentage of unemployment, with 9.1% or 114 of them being unemployed.
| Educational Attainment | In Labor Force | Unemployed |
| Less than High School | 1,250 (71.9%) | 158 (9.1%) |
| High School Diploma | 8,693 (82.3%) | 211 (2.0%) |
| College / Associate Degree | 15,223 (85.6%) | 498 (2.8%) |
| Bachelor's Degree or higher | 17,846 (90.1%) | 158 (0.8%) |
| Total | 43,007 (86.2%) | 998 (2.0%) |
Employment Occupations by Sex in St. Croix County
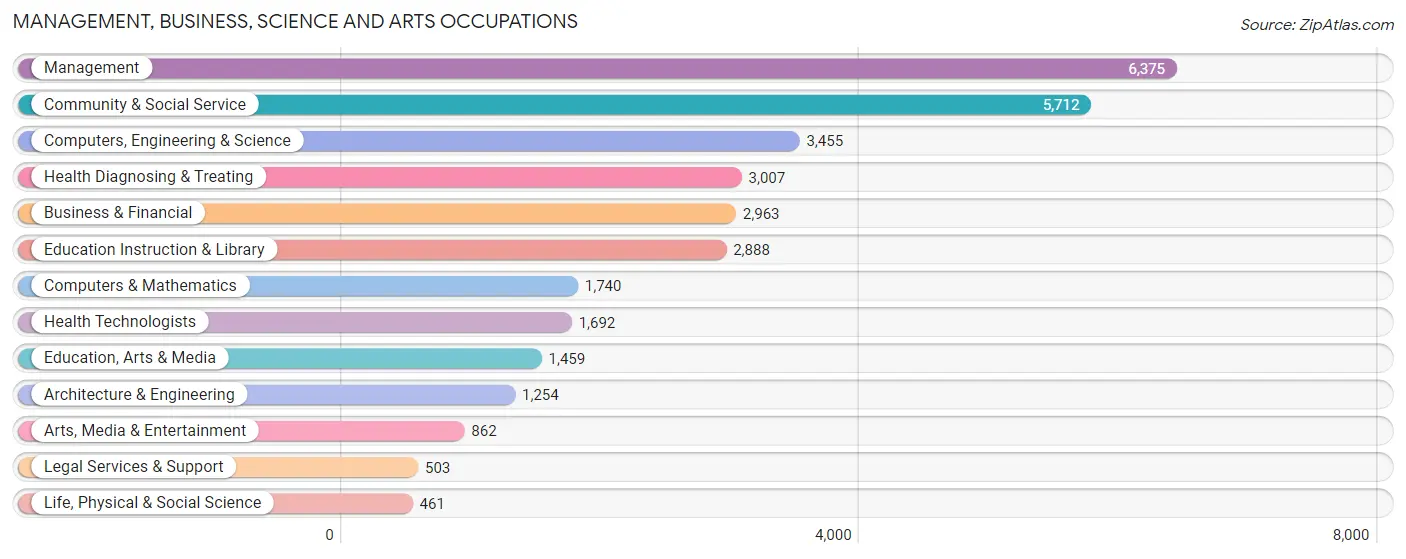
Management, Business, Science and Arts Occupations
The most common Management, Business, Science and Arts occupations in St. Croix County are Management (6,375 | 12.5%), Community & Social Service (5,712 | 11.2%), Computers, Engineering & Science (3,455 | 6.8%), Health Diagnosing & Treating (3,007 | 5.9%), and Business & Financial (2,963 | 5.8%).
Management, Business, Science and Arts Occupations by Sex
Within the Management, Business, Science and Arts occupations in St. Croix County, the most male-oriented occupations are Architecture & Engineering (87.7%), Computers, Engineering & Science (71.4%), and Computers & Mathematics (65.6%), while the most female-oriented occupations are Health Technologists (85.2%), Education Instruction & Library (79.7%), and Education, Arts & Media (78.9%).
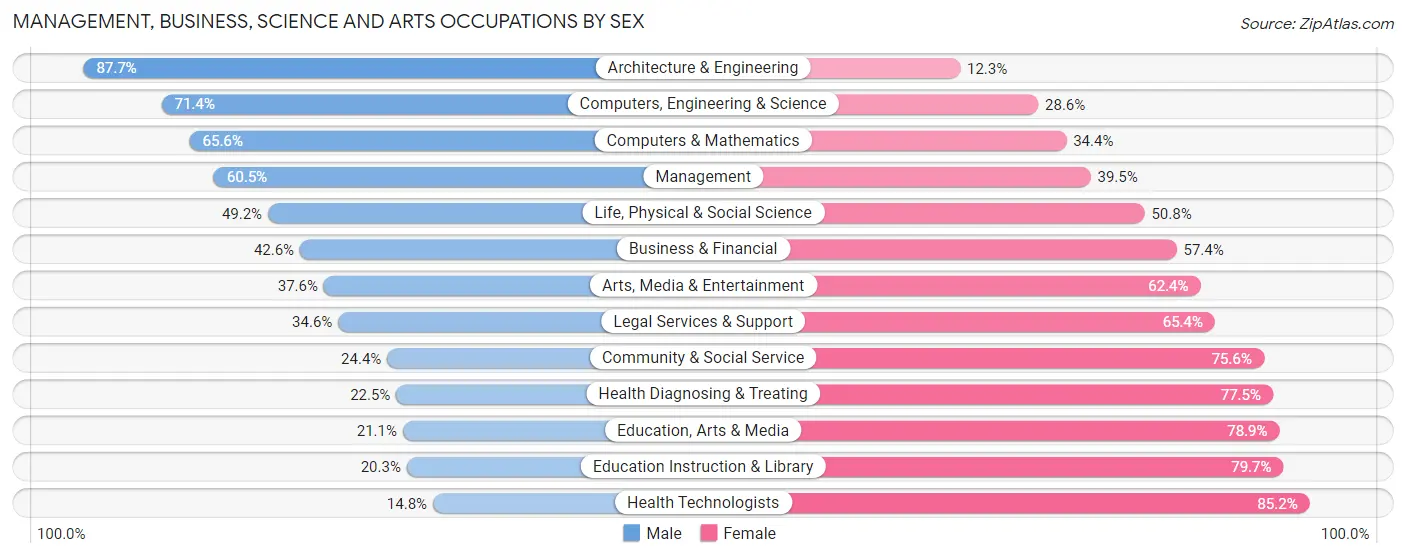
| Occupation | Male | Female |
| Management | 3,857 (60.5%) | 2,518 (39.5%) |
| Business & Financial | 1,261 (42.6%) | 1,702 (57.4%) |
| Computers, Engineering & Science | 2,468 (71.4%) | 987 (28.6%) |
| Computers & Mathematics | 1,141 (65.6%) | 599 (34.4%) |
| Architecture & Engineering | 1,100 (87.7%) | 154 (12.3%) |
| Life, Physical & Social Science | 227 (49.2%) | 234 (50.8%) |
| Community & Social Service | 1,392 (24.4%) | 4,320 (75.6%) |
| Education, Arts & Media | 308 (21.1%) | 1,151 (78.9%) |
| Legal Services & Support | 174 (34.6%) | 329 (65.4%) |
| Education Instruction & Library | 586 (20.3%) | 2,302 (79.7%) |
| Arts, Media & Entertainment | 324 (37.6%) | 538 (62.4%) |
| Health Diagnosing & Treating | 676 (22.5%) | 2,331 (77.5%) |
| Health Technologists | 251 (14.8%) | 1,441 (85.2%) |
| Total (Category) | 9,654 (44.9%) | 11,858 (55.1%) |
| Total (Overall) | 26,676 (52.2%) | 24,391 (47.8%) |
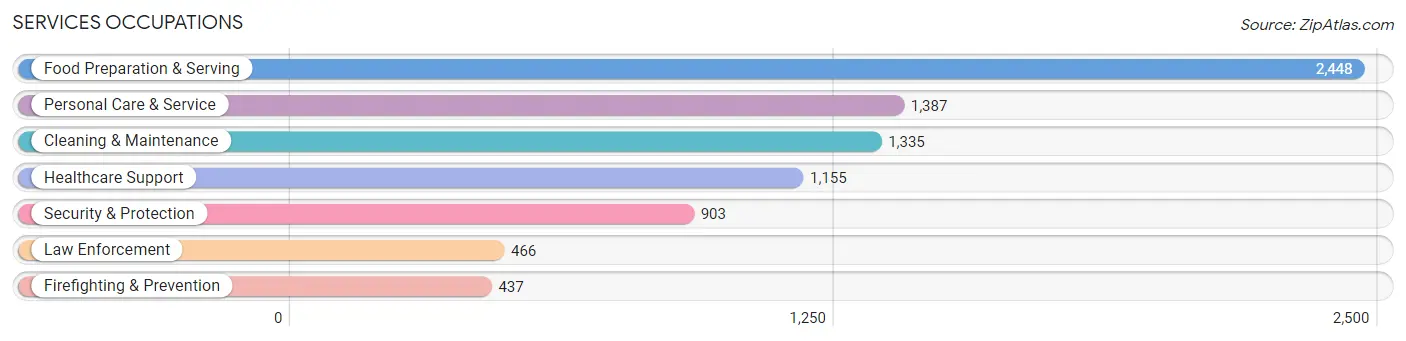
Services Occupations
The most common Services occupations in St. Croix County are Food Preparation & Serving (2,448 | 4.8%), Personal Care & Service (1,387 | 2.7%), Cleaning & Maintenance (1,335 | 2.6%), Healthcare Support (1,155 | 2.3%), and Security & Protection (903 | 1.8%).
Services Occupations by Sex
Within the Services occupations in St. Croix County, the most male-oriented occupations are Law Enforcement (74.3%), Security & Protection (71.7%), and Firefighting & Prevention (68.9%), while the most female-oriented occupations are Healthcare Support (90.7%), Personal Care & Service (81.0%), and Food Preparation & Serving (58.5%).
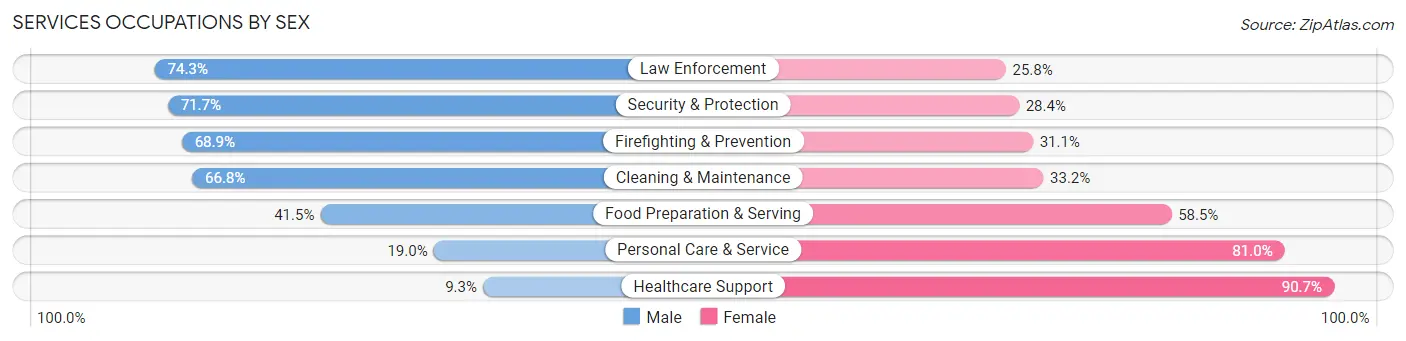
| Occupation | Male | Female |
| Healthcare Support | 107 (9.3%) | 1,048 (90.7%) |
| Security & Protection | 647 (71.7%) | 256 (28.3%) |
| Firefighting & Prevention | 301 (68.9%) | 136 (31.1%) |
| Law Enforcement | 346 (74.3%) | 120 (25.8%) |
| Food Preparation & Serving | 1,015 (41.5%) | 1,433 (58.5%) |
| Cleaning & Maintenance | 892 (66.8%) | 443 (33.2%) |
| Personal Care & Service | 264 (19.0%) | 1,123 (81.0%) |
| Total (Category) | 2,925 (40.5%) | 4,303 (59.5%) |
| Total (Overall) | 26,676 (52.2%) | 24,391 (47.8%) |
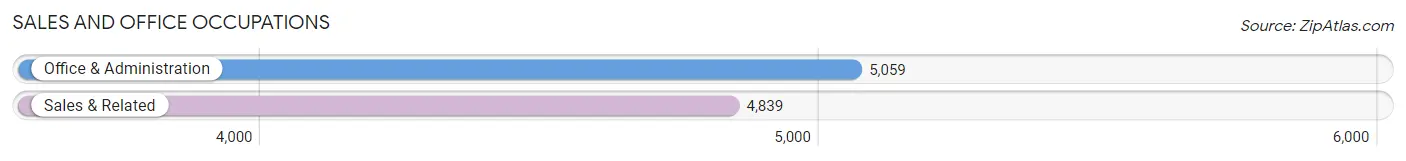
Sales and Office Occupations
The most common Sales and Office occupations in St. Croix County are Office & Administration (5,059 | 9.9%), and Sales & Related (4,839 | 9.5%).
Sales and Office Occupations by Sex
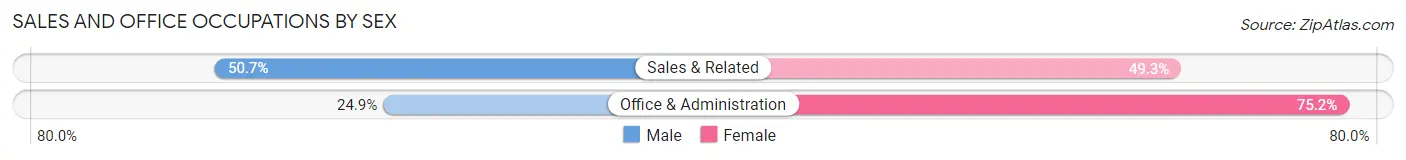
| Occupation | Male | Female |
| Sales & Related | 2,453 (50.7%) | 2,386 (49.3%) |
| Office & Administration | 1,257 (24.8%) | 3,802 (75.1%) |
| Total (Category) | 3,710 (37.5%) | 6,188 (62.5%) |
| Total (Overall) | 26,676 (52.2%) | 24,391 (47.8%) |
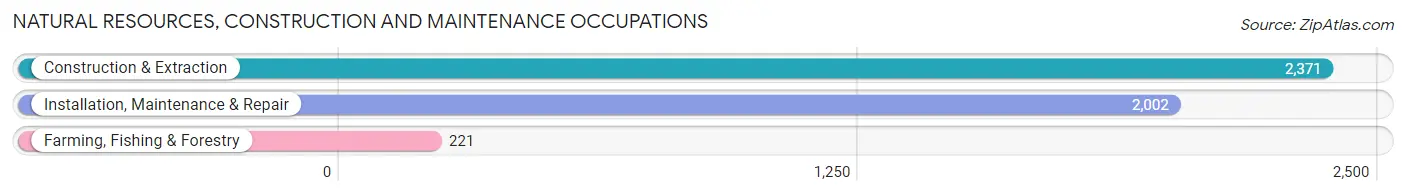
Natural Resources, Construction and Maintenance Occupations
The most common Natural Resources, Construction and Maintenance occupations in St. Croix County are Construction & Extraction (2,371 | 4.6%), Installation, Maintenance & Repair (2,002 | 3.9%), and Farming, Fishing & Forestry (221 | 0.4%).
Natural Resources, Construction and Maintenance Occupations by Sex
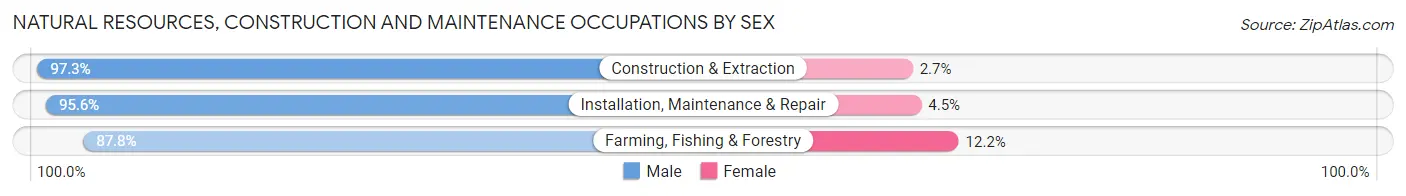
| Occupation | Male | Female |
| Farming, Fishing & Forestry | 194 (87.8%) | 27 (12.2%) |
| Construction & Extraction | 2,308 (97.3%) | 63 (2.7%) |
| Installation, Maintenance & Repair | 1,913 (95.6%) | 89 (4.4%) |
| Total (Category) | 4,415 (96.1%) | 179 (3.9%) |
| Total (Overall) | 26,676 (52.2%) | 24,391 (47.8%) |
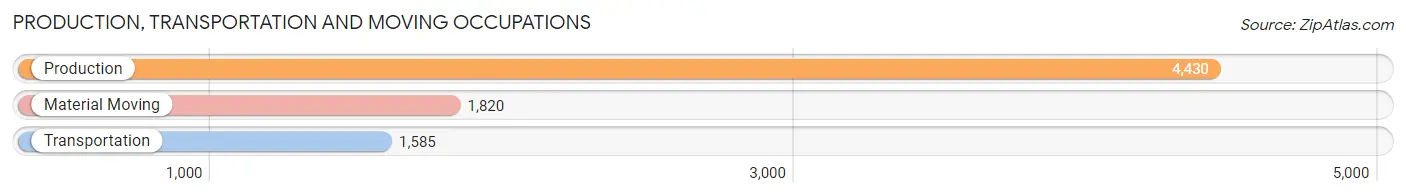
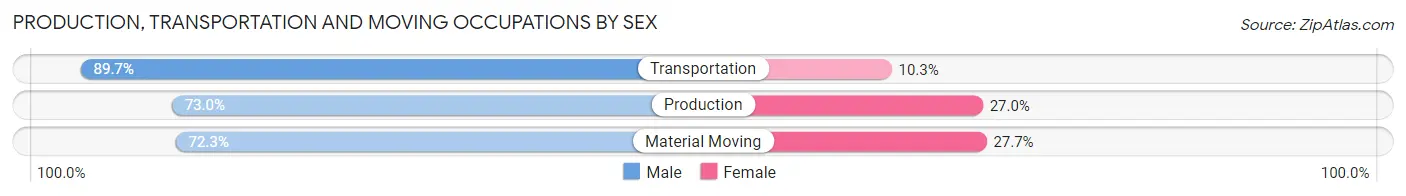
Production, Transportation and Moving Occupations
The most common Production, Transportation and Moving occupations in St. Croix County are Production (4,430 | 8.7%), Material Moving (1,820 | 3.6%), and Transportation (1,585 | 3.1%).
Production, Transportation and Moving Occupations by Sex
| Occupation | Male | Female |
| Production | 3,234 (73.0%) | 1,196 (27.0%) |
| Transportation | 1,422 (89.7%) | 163 (10.3%) |
| Material Moving | 1,316 (72.3%) | 504 (27.7%) |
| Total (Category) | 5,972 (76.2%) | 1,863 (23.8%) |
| Total (Overall) | 26,676 (52.2%) | 24,391 (47.8%) |
Employment Industries by Sex in St. Croix County
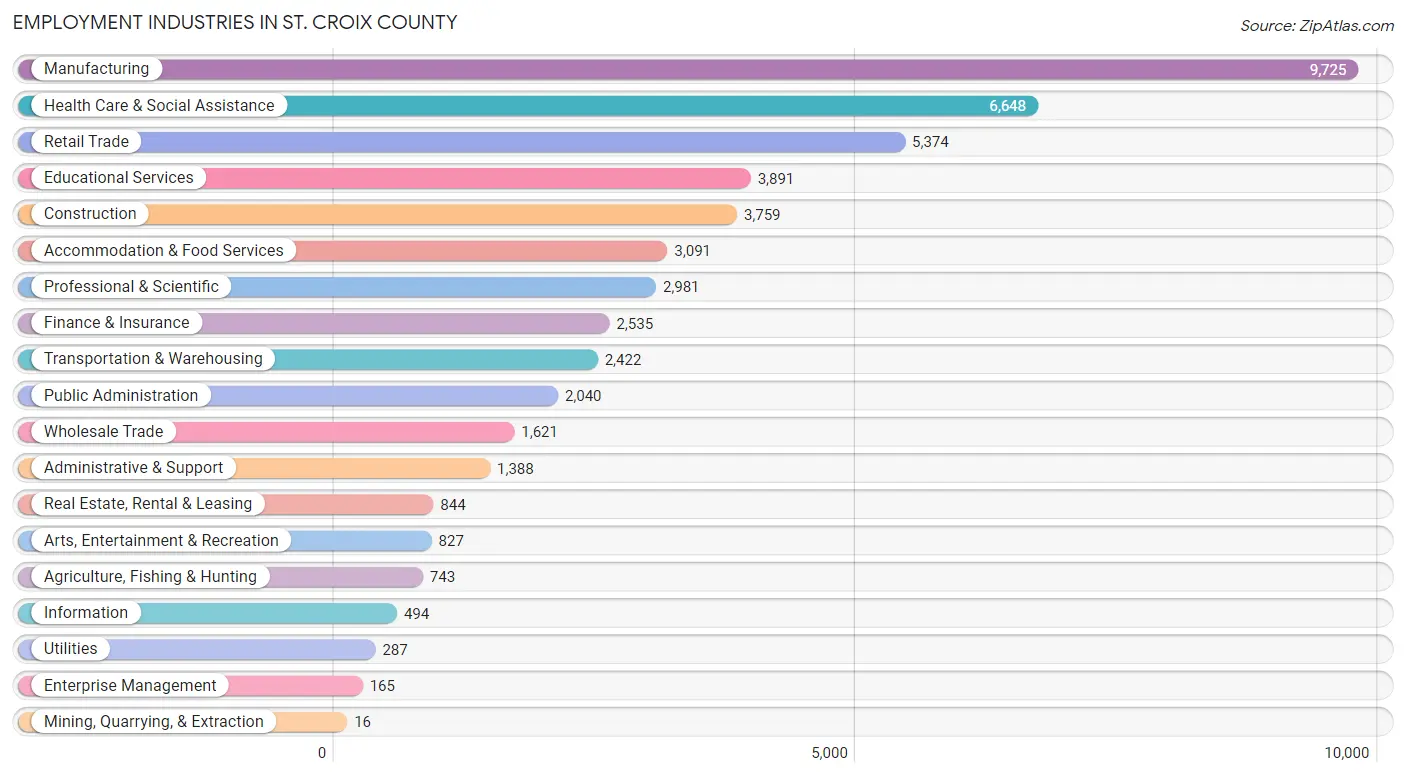
Employment Industries in St. Croix County
The major employment industries in St. Croix County include Manufacturing (9,725 | 19.0%), Health Care & Social Assistance (6,648 | 13.0%), Retail Trade (5,374 | 10.5%), Educational Services (3,891 | 7.6%), and Construction (3,759 | 7.4%).
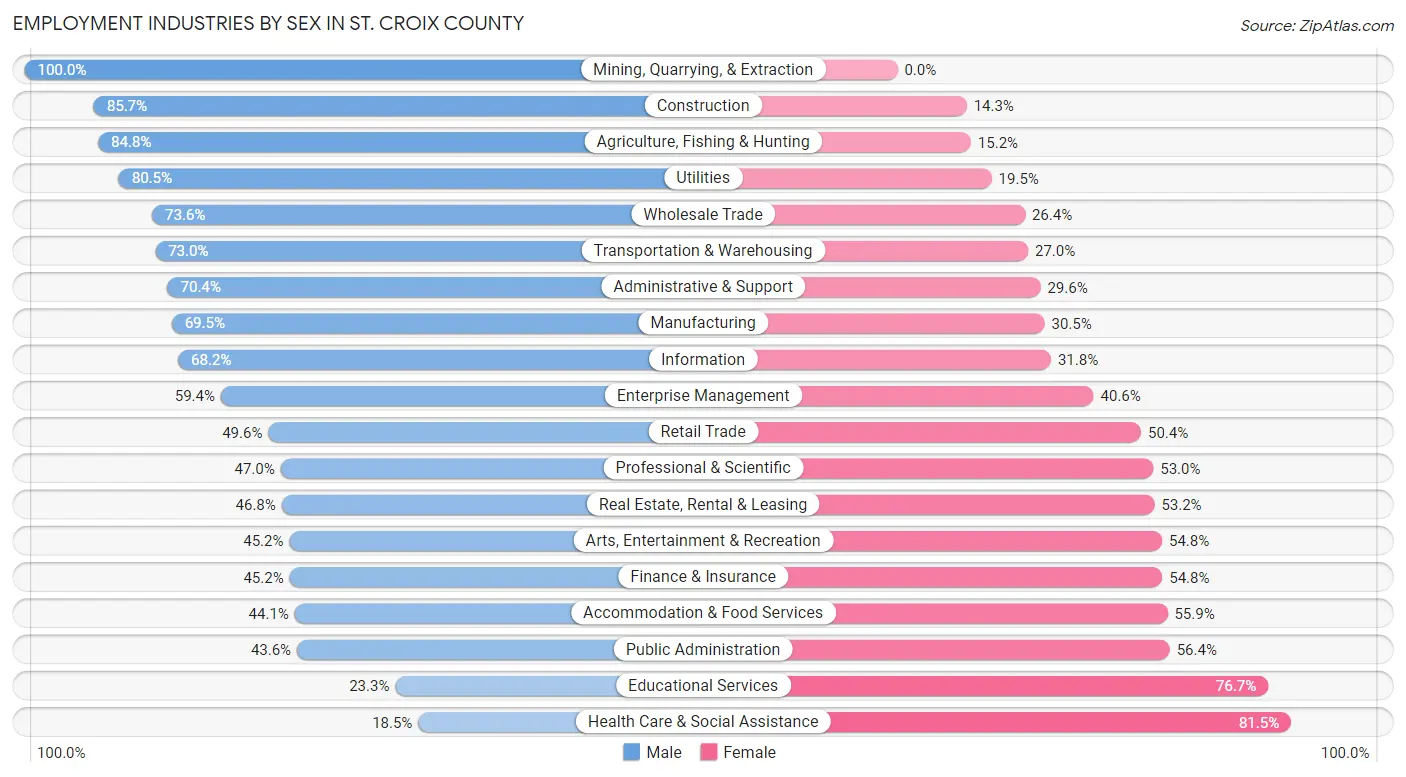
Employment Industries by Sex in St. Croix County
The St. Croix County industries that see more men than women are Mining, Quarrying, & Extraction (100.0%), Construction (85.7%), and Agriculture, Fishing & Hunting (84.8%), whereas the industries that tend to have a higher number of women are Health Care & Social Assistance (81.5%), Educational Services (76.7%), and Public Administration (56.4%).
| Industry | Male | Female |
| Agriculture, Fishing & Hunting | 630 (84.8%) | 113 (15.2%) |
| Mining, Quarrying, & Extraction | 16 (100.0%) | 0 (0.0%) |
| Construction | 3,220 (85.7%) | 539 (14.3%) |
| Manufacturing | 6,763 (69.5%) | 2,962 (30.5%) |
| Wholesale Trade | 1,193 (73.6%) | 428 (26.4%) |
| Retail Trade | 2,664 (49.6%) | 2,710 (50.4%) |
| Transportation & Warehousing | 1,767 (73.0%) | 655 (27.0%) |
| Utilities | 231 (80.5%) | 56 (19.5%) |
| Information | 337 (68.2%) | 157 (31.8%) |
| Finance & Insurance | 1,145 (45.2%) | 1,390 (54.8%) |
| Real Estate, Rental & Leasing | 395 (46.8%) | 449 (53.2%) |
| Professional & Scientific | 1,402 (47.0%) | 1,579 (53.0%) |
| Enterprise Management | 98 (59.4%) | 67 (40.6%) |
| Administrative & Support | 977 (70.4%) | 411 (29.6%) |
| Educational Services | 906 (23.3%) | 2,985 (76.7%) |
| Health Care & Social Assistance | 1,232 (18.5%) | 5,416 (81.5%) |
| Arts, Entertainment & Recreation | 374 (45.2%) | 453 (54.8%) |
| Accommodation & Food Services | 1,363 (44.1%) | 1,728 (55.9%) |
| Public Administration | 890 (43.6%) | 1,150 (56.4%) |
| Total | 26,676 (52.2%) | 24,391 (47.8%) |
Education in St. Croix County
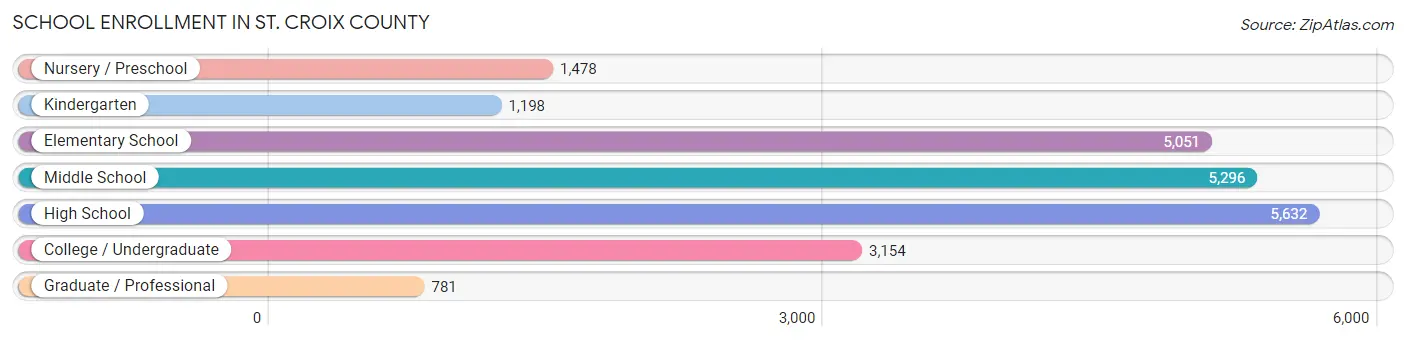
School Enrollment in St. Croix County
The most common levels of schooling among the 22,590 students in St. Croix County are high school (5,632 | 24.9%), middle school (5,296 | 23.4%), and elementary school (5,051 | 22.4%).
| School Level | # Students | % Students |
| Nursery / Preschool | 1,478 | 6.5% |
| Kindergarten | 1,198 | 5.3% |
| Elementary School | 5,051 | 22.4% |
| Middle School | 5,296 | 23.4% |
| High School | 5,632 | 24.9% |
| College / Undergraduate | 3,154 | 14.0% |
| Graduate / Professional | 781 | 3.5% |
| Total | 22,590 | 100.0% |
School Enrollment by Age by Funding Source in St. Croix County
Out of a total of 22,590 students who are enrolled in schools in St. Croix County, 2,462 (10.9%) attend a private institution, while the remaining 20,128 (89.1%) are enrolled in public schools. The age group of 3 to 4 year olds has the highest likelihood of being enrolled in private schools, with 221 (26.5% in the age bracket) enrolled. Conversely, the age group of 18 to 19 year olds has the lowest likelihood of being enrolled in a private school, with 1,486 (96.9% in the age bracket) attending a public institution.
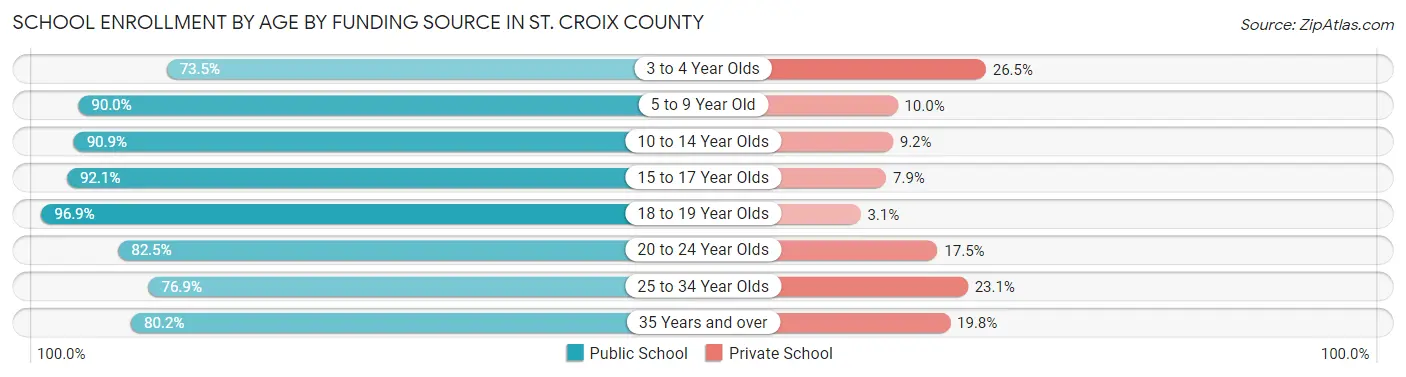
| Age Bracket | Public School | Private School |
| 3 to 4 Year Olds | 614 (73.5%) | 221 (26.5%) |
| 5 to 9 Year Old | 5,406 (90.0%) | 602 (10.0%) |
| 10 to 14 Year Olds | 6,115 (90.8%) | 616 (9.1%) |
| 15 to 17 Year Olds | 3,799 (92.1%) | 326 (7.9%) |
| 18 to 19 Year Olds | 1,486 (96.9%) | 48 (3.1%) |
| 20 to 24 Year Olds | 1,399 (82.5%) | 296 (17.5%) |
| 25 to 34 Year Olds | 646 (76.9%) | 194 (23.1%) |
| 35 Years and over | 659 (80.2%) | 163 (19.8%) |
| Total | 20,128 (89.1%) | 2,462 (10.9%) |
Educational Attainment by Field of Study in St. Croix County
Business (5,576 | 20.9%), education (3,608 | 13.5%), science & technology (2,778 | 10.4%), bio, nature & agricultural (1,921 | 7.2%), and psychology (1,818 | 6.8%) are the most common fields of study among 26,677 individuals in St. Croix County who have obtained a bachelor's degree or higher.
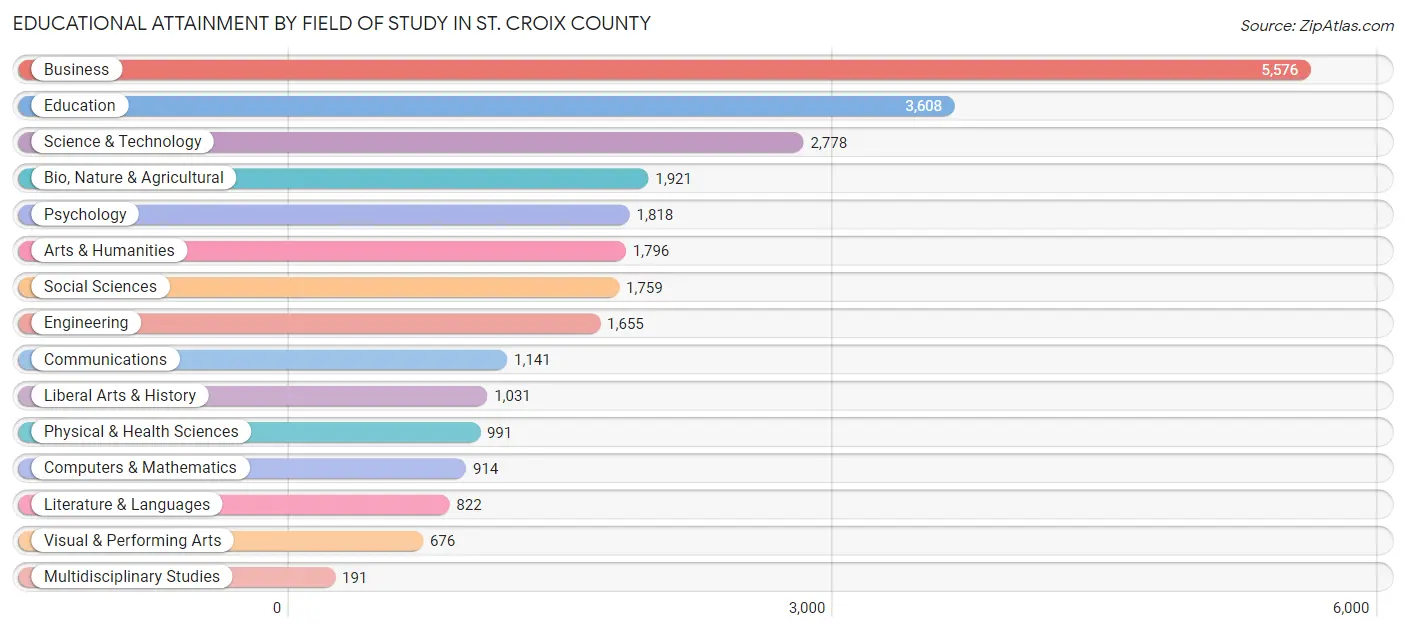
| Field of Study | # Graduates | % Graduates |
| Computers & Mathematics | 914 | 3.4% |
| Bio, Nature & Agricultural | 1,921 | 7.2% |
| Physical & Health Sciences | 991 | 3.7% |
| Psychology | 1,818 | 6.8% |
| Social Sciences | 1,759 | 6.6% |
| Engineering | 1,655 | 6.2% |
| Multidisciplinary Studies | 191 | 0.7% |
| Science & Technology | 2,778 | 10.4% |
| Business | 5,576 | 20.9% |
| Education | 3,608 | 13.5% |
| Literature & Languages | 822 | 3.1% |
| Liberal Arts & History | 1,031 | 3.9% |
| Visual & Performing Arts | 676 | 2.5% |
| Communications | 1,141 | 4.3% |
| Arts & Humanities | 1,796 | 6.7% |
| Total | 26,677 | 100.0% |
Transportation & Commute in St. Croix County
Vehicle Availability by Sex in St. Croix County
The most prevalent vehicle ownership categories in St. Croix County are males with 2 vehicles (11,470, accounting for 43.5%) and females with 2 vehicles (10,033, making up 47.7%).
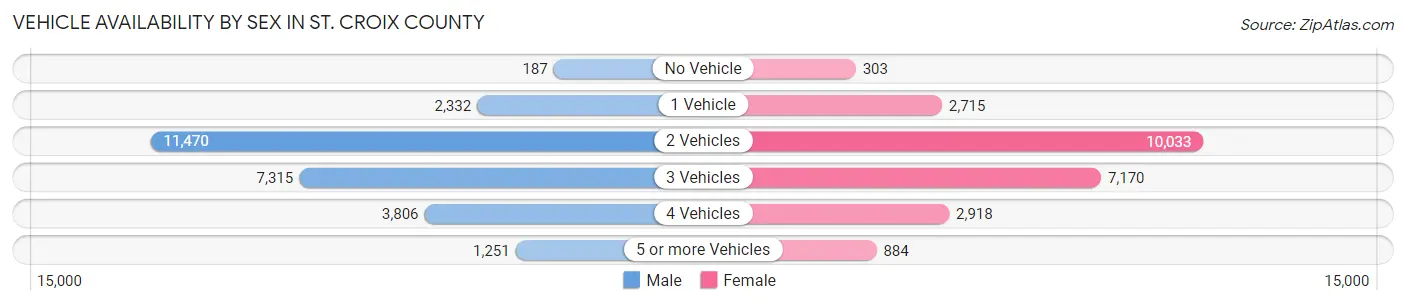
| Vehicles Available | Male | Female |
| No Vehicle | 187 (0.7%) | 303 (1.3%) |
| 1 Vehicle | 2,332 (8.8%) | 2,715 (11.3%) |
| 2 Vehicles | 11,470 (43.5%) | 10,033 (41.8%) |
| 3 Vehicles | 7,315 (27.8%) | 7,170 (29.8%) |
| 4 Vehicles | 3,806 (14.4%) | 2,918 (12.1%) |
| 5 or more Vehicles | 1,251 (4.8%) | 884 (3.7%) |
| Total | 26,361 (100.0%) | 24,023 (100.0%) |
Commute Time in St. Croix County
The most frequently occuring commute durations in St. Croix County are 15 to 19 minutes (5,769 commuters, 13.0%), 30 to 34 minutes (5,391 commuters, 12.2%), and 20 to 24 minutes (5,356 commuters, 12.1%).
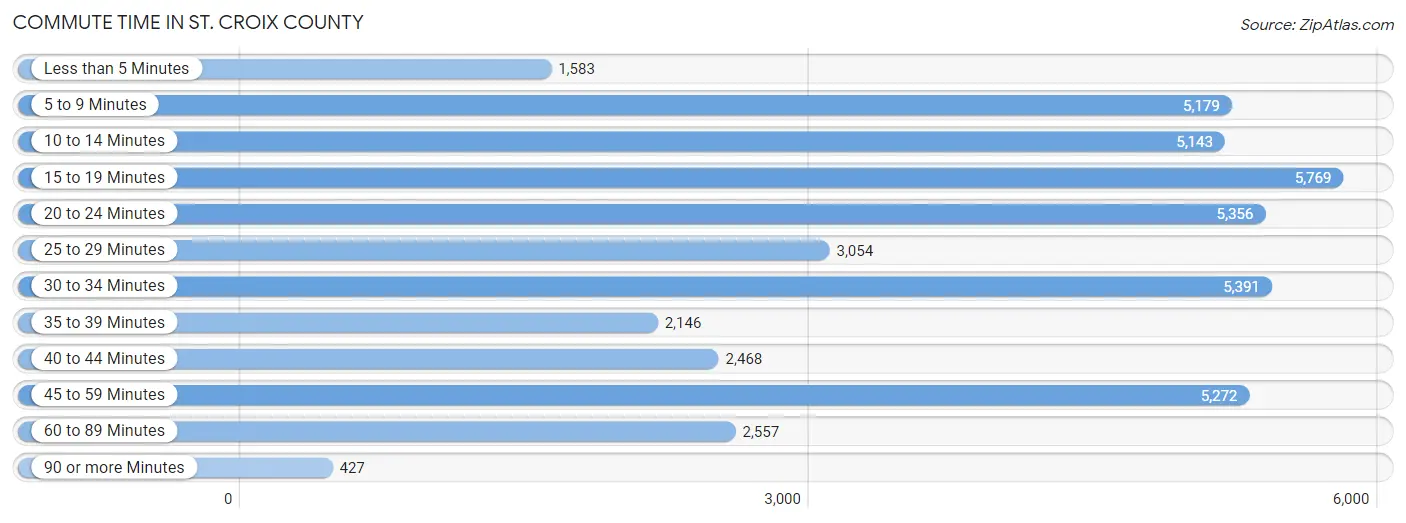
| Commute Time | # Commuters | % Commuters |
| Less than 5 Minutes | 1,583 | 3.6% |
| 5 to 9 Minutes | 5,179 | 11.7% |
| 10 to 14 Minutes | 5,143 | 11.6% |
| 15 to 19 Minutes | 5,769 | 13.0% |
| 20 to 24 Minutes | 5,356 | 12.1% |
| 25 to 29 Minutes | 3,054 | 6.9% |
| 30 to 34 Minutes | 5,391 | 12.2% |
| 35 to 39 Minutes | 2,146 | 4.8% |
| 40 to 44 Minutes | 2,468 | 5.6% |
| 45 to 59 Minutes | 5,272 | 11.9% |
| 60 to 89 Minutes | 2,557 | 5.8% |
| 90 or more Minutes | 427 | 1.0% |
Commute Time by Sex in St. Croix County
The most common commute times in St. Croix County are 15 to 19 minutes (3,077 commuters, 13.0%) for males and 5 to 9 minutes (2,714 commuters, 13.1%) for females.
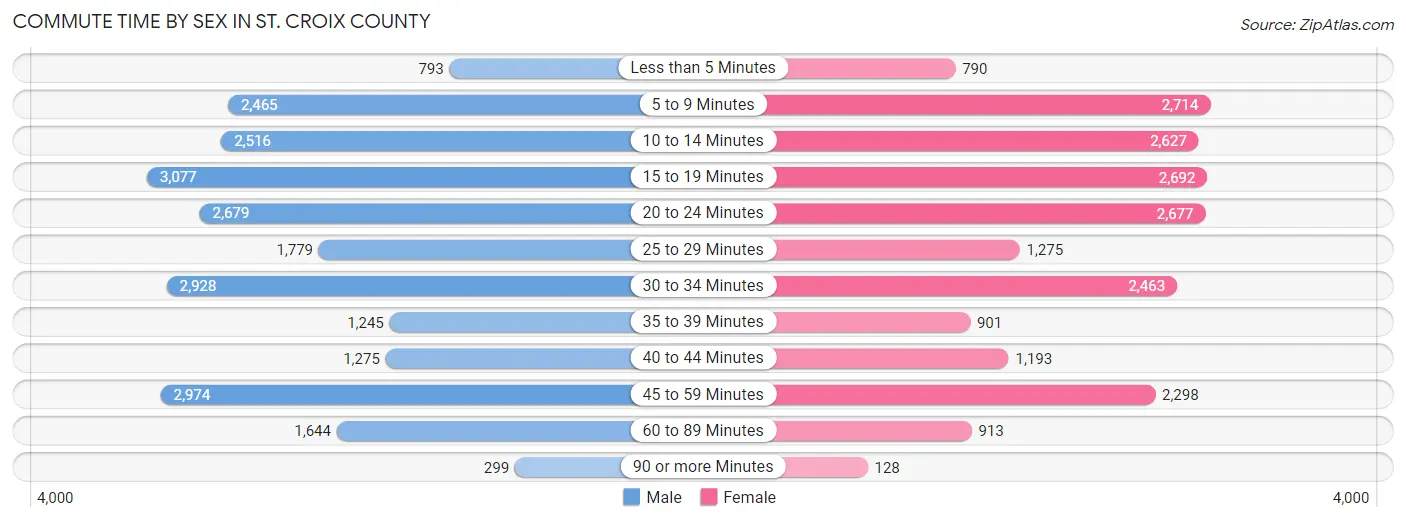
| Commute Time | Male | Female |
| Less than 5 Minutes | 793 (3.4%) | 790 (3.8%) |
| 5 to 9 Minutes | 2,465 (10.4%) | 2,714 (13.1%) |
| 10 to 14 Minutes | 2,516 (10.6%) | 2,627 (12.7%) |
| 15 to 19 Minutes | 3,077 (13.0%) | 2,692 (13.0%) |
| 20 to 24 Minutes | 2,679 (11.3%) | 2,677 (13.0%) |
| 25 to 29 Minutes | 1,779 (7.5%) | 1,275 (6.2%) |
| 30 to 34 Minutes | 2,928 (12.4%) | 2,463 (11.9%) |
| 35 to 39 Minutes | 1,245 (5.3%) | 901 (4.4%) |
| 40 to 44 Minutes | 1,275 (5.4%) | 1,193 (5.8%) |
| 45 to 59 Minutes | 2,974 (12.6%) | 2,298 (11.1%) |
| 60 to 89 Minutes | 1,644 (6.9%) | 913 (4.4%) |
| 90 or more Minutes | 299 (1.3%) | 128 (0.6%) |
Time of Departure to Work by Sex in St. Croix County
The most frequent times of departure to work in St. Croix County are 7:00 AM to 7:29 AM (3,191, 13.5%) for males and 7:00 AM to 7:29 AM (3,392, 16.4%) for females.
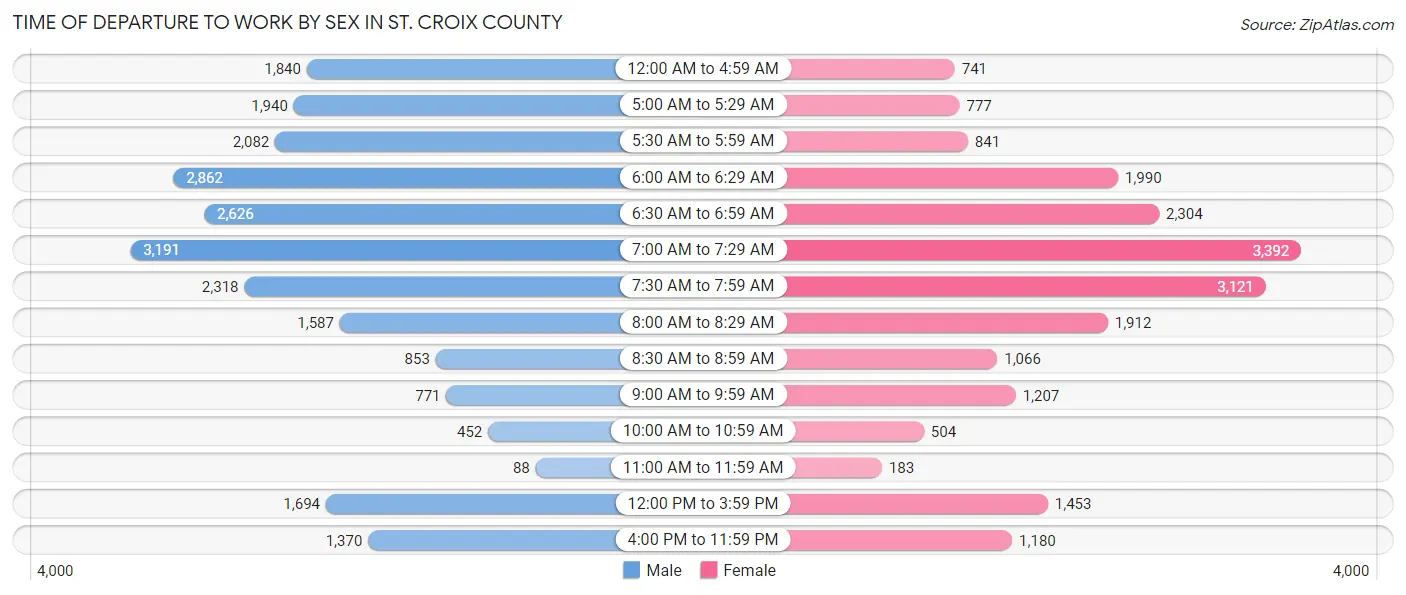
| Time of Departure | Male | Female |
| 12:00 AM to 4:59 AM | 1,840 (7.8%) | 741 (3.6%) |
| 5:00 AM to 5:29 AM | 1,940 (8.2%) | 777 (3.8%) |
| 5:30 AM to 5:59 AM | 2,082 (8.8%) | 841 (4.1%) |
| 6:00 AM to 6:29 AM | 2,862 (12.1%) | 1,990 (9.6%) |
| 6:30 AM to 6:59 AM | 2,626 (11.1%) | 2,304 (11.2%) |
| 7:00 AM to 7:29 AM | 3,191 (13.5%) | 3,392 (16.4%) |
| 7:30 AM to 7:59 AM | 2,318 (9.8%) | 3,121 (15.1%) |
| 8:00 AM to 8:29 AM | 1,587 (6.7%) | 1,912 (9.2%) |
| 8:30 AM to 8:59 AM | 853 (3.6%) | 1,066 (5.2%) |
| 9:00 AM to 9:59 AM | 771 (3.3%) | 1,207 (5.8%) |
| 10:00 AM to 10:59 AM | 452 (1.9%) | 504 (2.4%) |
| 11:00 AM to 11:59 AM | 88 (0.4%) | 183 (0.9%) |
| 12:00 PM to 3:59 PM | 1,694 (7.2%) | 1,453 (7.0%) |
| 4:00 PM to 11:59 PM | 1,370 (5.8%) | 1,180 (5.7%) |
| Total | 23,674 (100.0%) | 20,671 (100.0%) |
Housing Occupancy in St. Croix County
Occupancy by Ownership in St. Croix County
Of the total 36,004 dwellings in St. Croix County, owner-occupied units account for 28,486 (79.1%), while renter-occupied units make up 7,518 (20.9%).
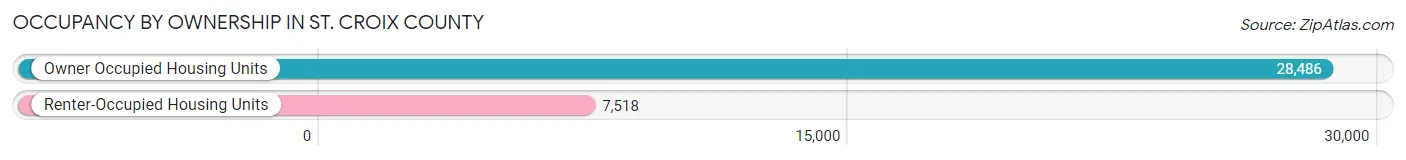
| Occupancy | # Housing Units | % Housing Units |
| Owner Occupied Housing Units | 28,486 | 79.1% |
| Renter-Occupied Housing Units | 7,518 | 20.9% |
| Total Occupied Housing Units | 36,004 | 100.0% |
Occupancy by Household Size in St. Croix County
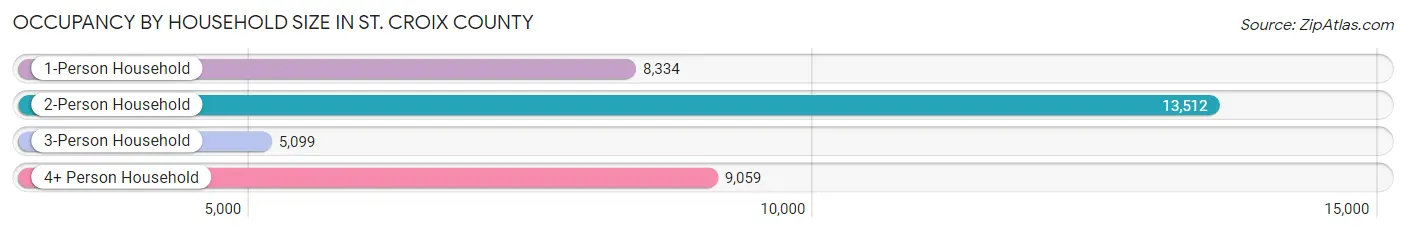
| Household Size | # Housing Units | % Housing Units |
| 1-Person Household | 8,334 | 23.2% |
| 2-Person Household | 13,512 | 37.5% |
| 3-Person Household | 5,099 | 14.2% |
| 4+ Person Household | 9,059 | 25.2% |
| Total Housing Units | 36,004 | 100.0% |
Occupancy by Ownership by Household Size in St. Croix County
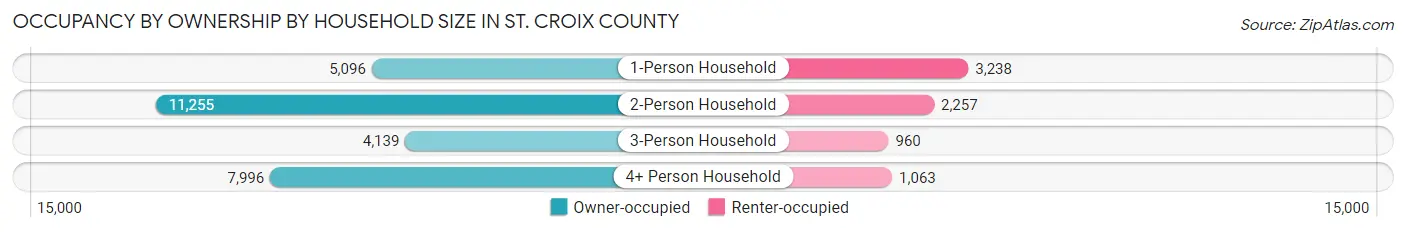
| Household Size | Owner-occupied | Renter-occupied |
| 1-Person Household | 5,096 (61.2%) | 3,238 (38.9%) |
| 2-Person Household | 11,255 (83.3%) | 2,257 (16.7%) |
| 3-Person Household | 4,139 (81.2%) | 960 (18.8%) |
| 4+ Person Household | 7,996 (88.3%) | 1,063 (11.7%) |
| Total Housing Units | 28,486 (79.1%) | 7,518 (20.9%) |
Occupancy by Educational Attainment in St. Croix County
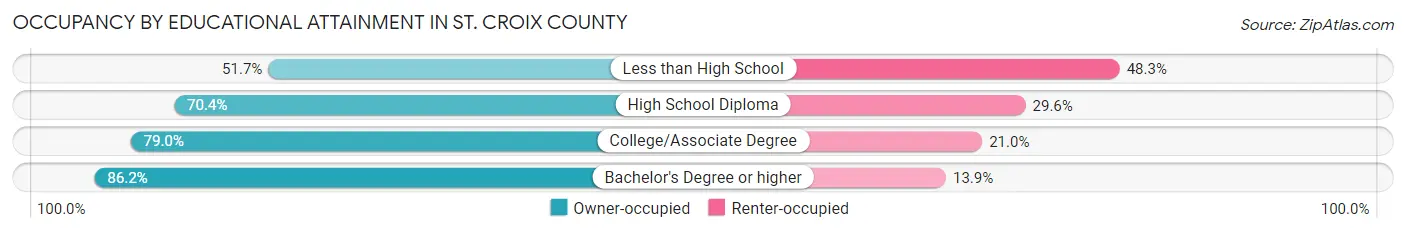
| Household Size | Owner-occupied | Renter-occupied |
| Less than High School | 575 (51.7%) | 537 (48.3%) |
| High School Diploma | 5,720 (70.4%) | 2,408 (29.6%) |
| College/Associate Degree | 9,525 (79.0%) | 2,536 (21.0%) |
| Bachelor's Degree or higher | 12,666 (86.2%) | 2,037 (13.9%) |
Occupancy by Age of Householder in St. Croix County
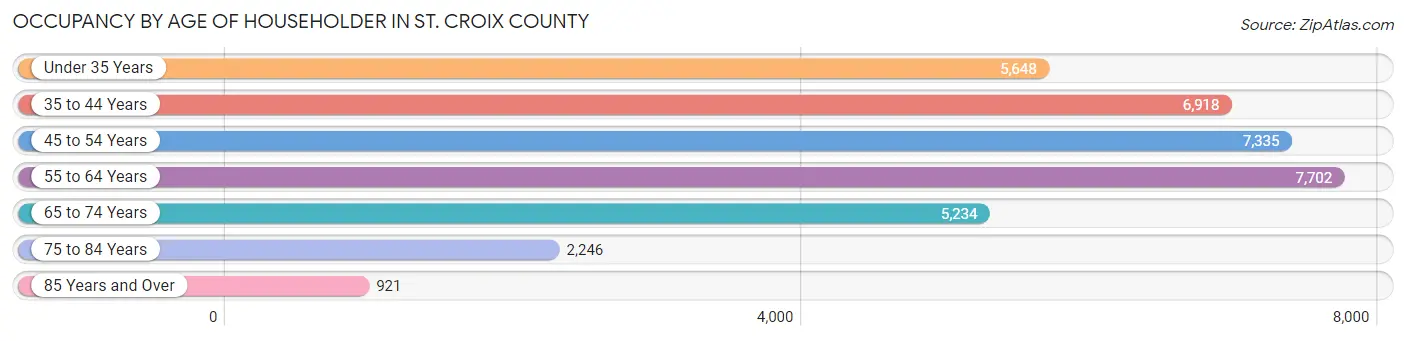
| Age Bracket | # Households | % Households |
| Under 35 Years | 5,648 | 15.7% |
| 35 to 44 Years | 6,918 | 19.2% |
| 45 to 54 Years | 7,335 | 20.4% |
| 55 to 64 Years | 7,702 | 21.4% |
| 65 to 74 Years | 5,234 | 14.5% |
| 75 to 84 Years | 2,246 | 6.2% |
| 85 Years and Over | 921 | 2.6% |
| Total | 36,004 | 100.0% |
Housing Finances in St. Croix County
Median Income by Occupancy in St. Croix County
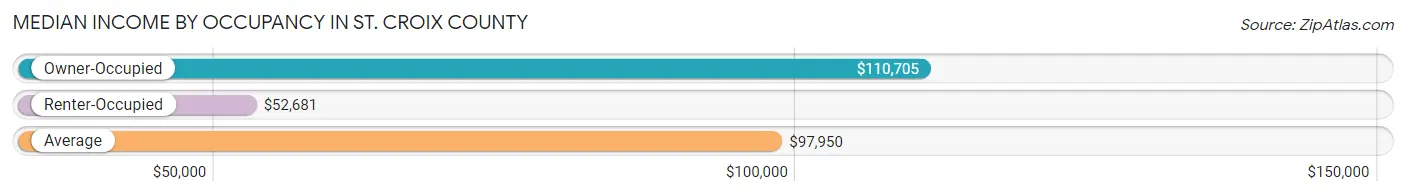
| Occupancy Type | # Households | Median Income |
| Owner-Occupied | 28,486 (79.1%) | $110,705 |
| Renter-Occupied | 7,518 (20.9%) | $52,681 |
| Average | 36,004 (100.0%) | $97,950 |
Occupancy by Householder Income Bracket in St. Croix County
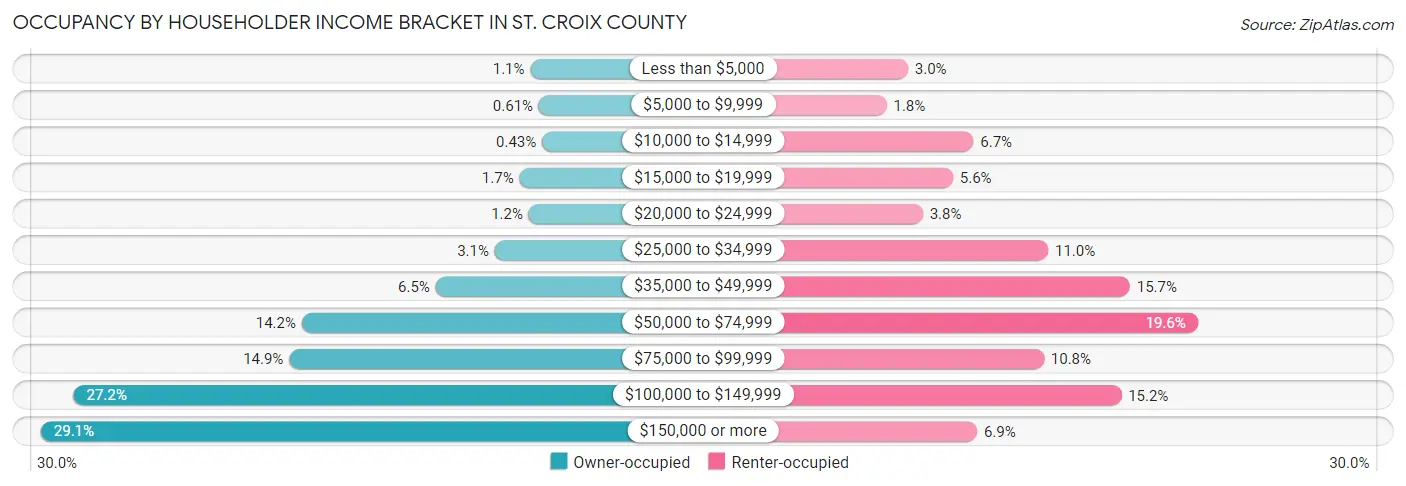
| Income Bracket | Owner-occupied | Renter-occupied |
| Less than $5,000 | 314 (1.1%) | 225 (3.0%) |
| $5,000 to $9,999 | 173 (0.6%) | 133 (1.8%) |
| $10,000 to $14,999 | 122 (0.4%) | 506 (6.7%) |
| $15,000 to $19,999 | 491 (1.7%) | 418 (5.6%) |
| $20,000 to $24,999 | 340 (1.2%) | 289 (3.8%) |
| $25,000 to $34,999 | 891 (3.1%) | 827 (11.0%) |
| $35,000 to $49,999 | 1,855 (6.5%) | 1,178 (15.7%) |
| $50,000 to $74,999 | 4,033 (14.2%) | 1,470 (19.6%) |
| $75,000 to $99,999 | 4,238 (14.9%) | 809 (10.8%) |
| $100,000 to $149,999 | 7,747 (27.2%) | 1,141 (15.2%) |
| $150,000 or more | 8,282 (29.1%) | 522 (6.9%) |
| Total | 28,486 (100.0%) | 7,518 (100.0%) |
Monthly Housing Cost Tiers in St. Croix County
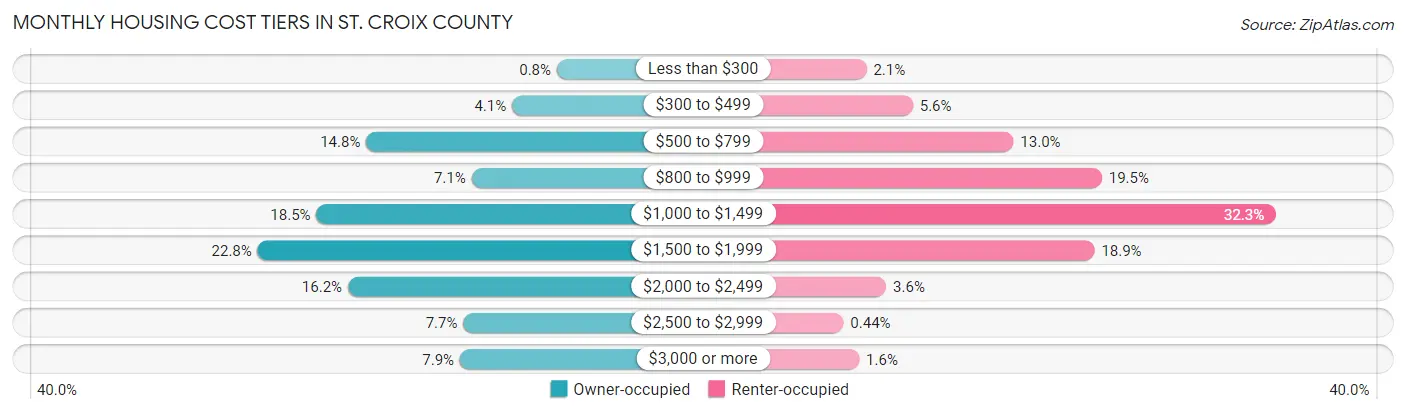
| Monthly Cost | Owner-occupied | Renter-occupied |
| Less than $300 | 227 (0.8%) | 161 (2.1%) |
| $300 to $499 | 1,169 (4.1%) | 417 (5.6%) |
| $500 to $799 | 4,228 (14.8%) | 974 (13.0%) |
| $800 to $999 | 2,018 (7.1%) | 1,464 (19.5%) |
| $1,000 to $1,499 | 5,272 (18.5%) | 2,428 (32.3%) |
| $1,500 to $1,999 | 6,506 (22.8%) | 1,423 (18.9%) |
| $2,000 to $2,499 | 4,612 (16.2%) | 270 (3.6%) |
| $2,500 to $2,999 | 2,191 (7.7%) | 33 (0.4%) |
| $3,000 or more | 2,263 (7.9%) | 120 (1.6%) |
| Total | 28,486 (100.0%) | 7,518 (100.0%) |
Physical Housing Characteristics in St. Croix County
Housing Structures in St. Croix County
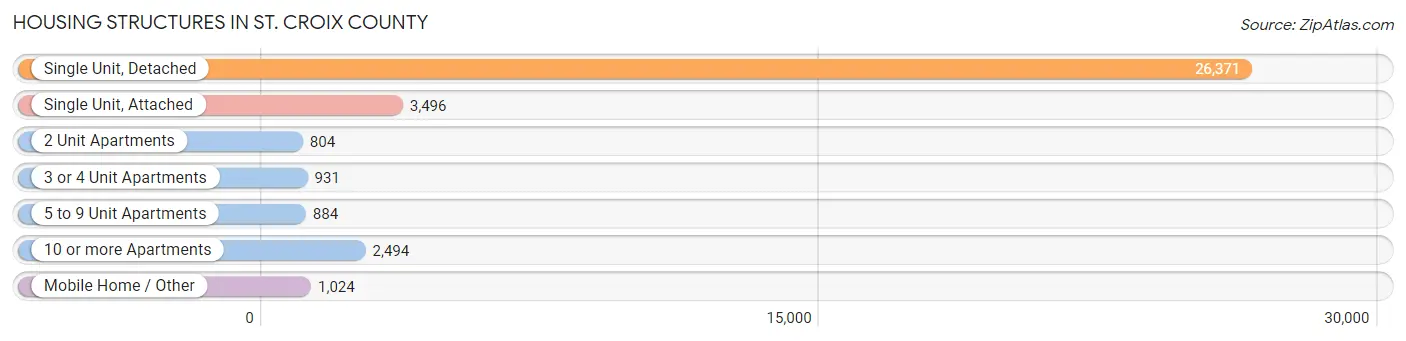
| Structure Type | # Housing Units | % Housing Units |
| Single Unit, Detached | 26,371 | 73.2% |
| Single Unit, Attached | 3,496 | 9.7% |
| 2 Unit Apartments | 804 | 2.2% |
| 3 or 4 Unit Apartments | 931 | 2.6% |
| 5 to 9 Unit Apartments | 884 | 2.5% |
| 10 or more Apartments | 2,494 | 6.9% |
| Mobile Home / Other | 1,024 | 2.8% |
| Total | 36,004 | 100.0% |
Housing Structures by Occupancy in St. Croix County
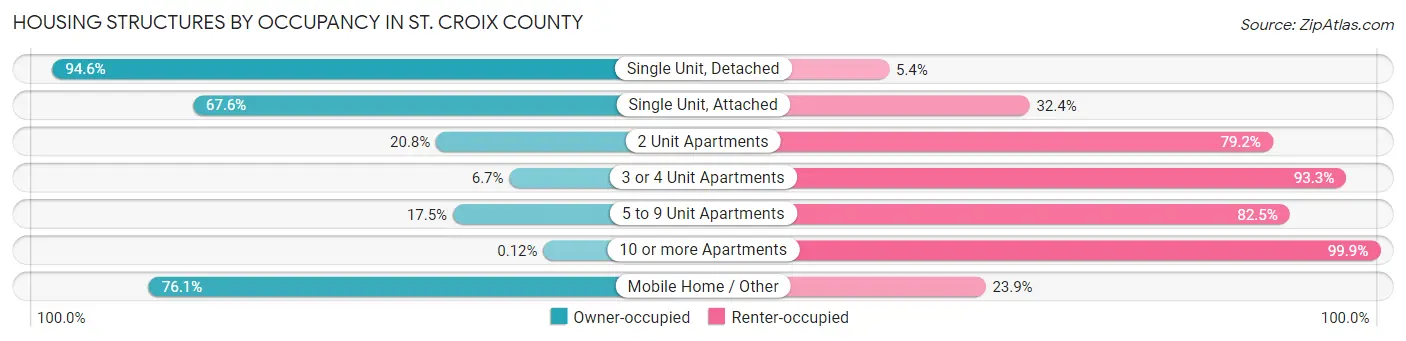
| Structure Type | Owner-occupied | Renter-occupied |
| Single Unit, Detached | 24,957 (94.6%) | 1,414 (5.4%) |
| Single Unit, Attached | 2,363 (67.6%) | 1,133 (32.4%) |
| 2 Unit Apartments | 167 (20.8%) | 637 (79.2%) |
| 3 or 4 Unit Apartments | 62 (6.7%) | 869 (93.3%) |
| 5 to 9 Unit Apartments | 155 (17.5%) | 729 (82.5%) |
| 10 or more Apartments | 3 (0.1%) | 2,491 (99.9%) |
| Mobile Home / Other | 779 (76.1%) | 245 (23.9%) |
| Total | 28,486 (79.1%) | 7,518 (20.9%) |
Housing Structures by Number of Rooms in St. Croix County
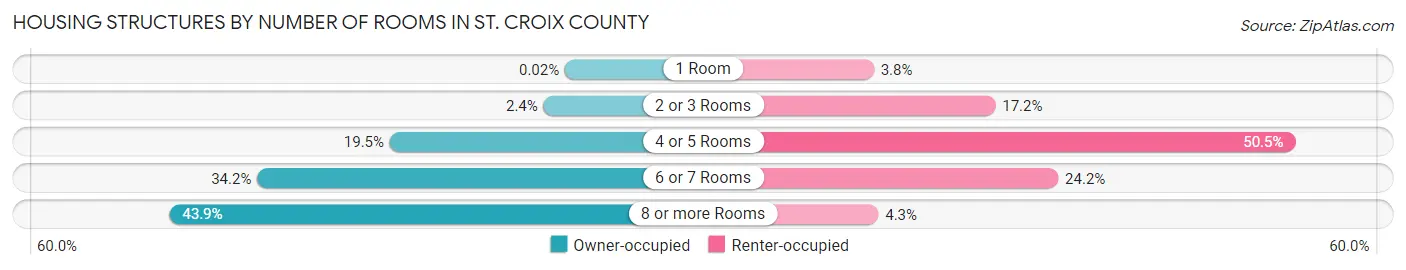
| Number of Rooms | Owner-occupied | Renter-occupied |
| 1 Room | 7 (0.0%) | 282 (3.7%) |
| 2 or 3 Rooms | 685 (2.4%) | 1,296 (17.2%) |
| 4 or 5 Rooms | 5,543 (19.5%) | 3,799 (50.5%) |
| 6 or 7 Rooms | 9,736 (34.2%) | 1,821 (24.2%) |
| 8 or more Rooms | 12,515 (43.9%) | 320 (4.3%) |
| Total | 28,486 (100.0%) | 7,518 (100.0%) |
Housing Structure by Heating Type in St. Croix County
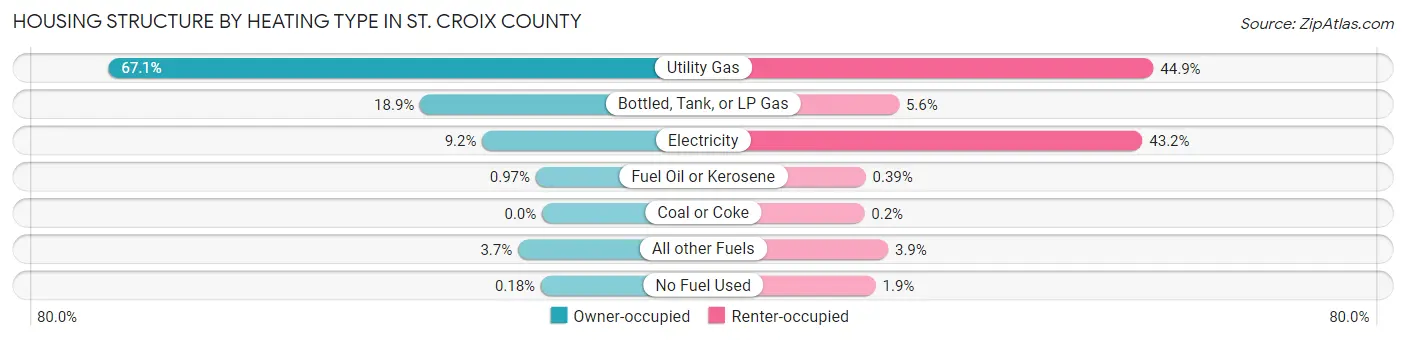
| Heating Type | Owner-occupied | Renter-occupied |
| Utility Gas | 19,100 (67.0%) | 3,375 (44.9%) |
| Bottled, Tank, or LP Gas | 5,371 (18.9%) | 417 (5.6%) |
| Electricity | 2,631 (9.2%) | 3,246 (43.2%) |
| Fuel Oil or Kerosene | 275 (1.0%) | 29 (0.4%) |
| Coal or Coke | 0 (0.0%) | 15 (0.2%) |
| All other Fuels | 1,059 (3.7%) | 290 (3.9%) |
| No Fuel Used | 50 (0.2%) | 146 (1.9%) |
| Total | 28,486 (100.0%) | 7,518 (100.0%) |
Household Vehicle Usage in St. Croix County
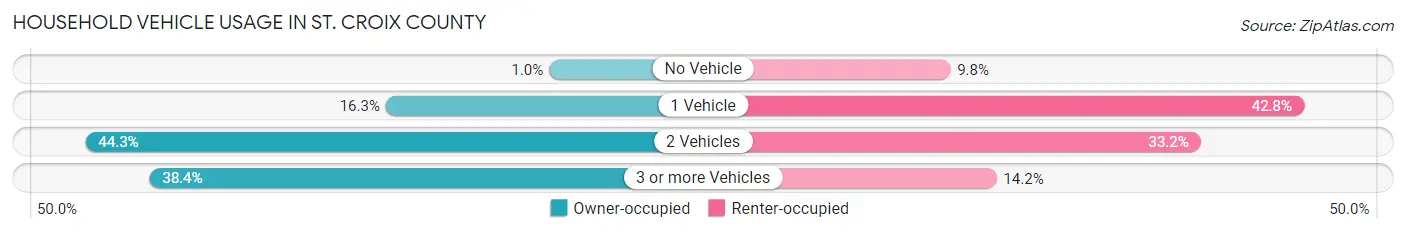
| Vehicles per Household | Owner-occupied | Renter-occupied |
| No Vehicle | 295 (1.0%) | 739 (9.8%) |
| 1 Vehicle | 4,641 (16.3%) | 3,220 (42.8%) |
| 2 Vehicles | 12,624 (44.3%) | 2,495 (33.2%) |
| 3 or more Vehicles | 10,926 (38.4%) | 1,064 (14.1%) |
| Total | 28,486 (100.0%) | 7,518 (100.0%) |
Real Estate & Mortgages in St. Croix County
Real Estate and Mortgage Overview in St. Croix County
| Characteristic | Without Mortgage | With Mortgage |
| Housing Units | 7,672 | 20,814 |
| Median Property Value | $313,200 | $328,000 |
| Median Household Income | $82,926 | $6,739 |
| Monthly Housing Costs | $685 | $2,263 |
| Real Estate Taxes | $4,029 | $189 |
Property Value by Mortgage Status in St. Croix County
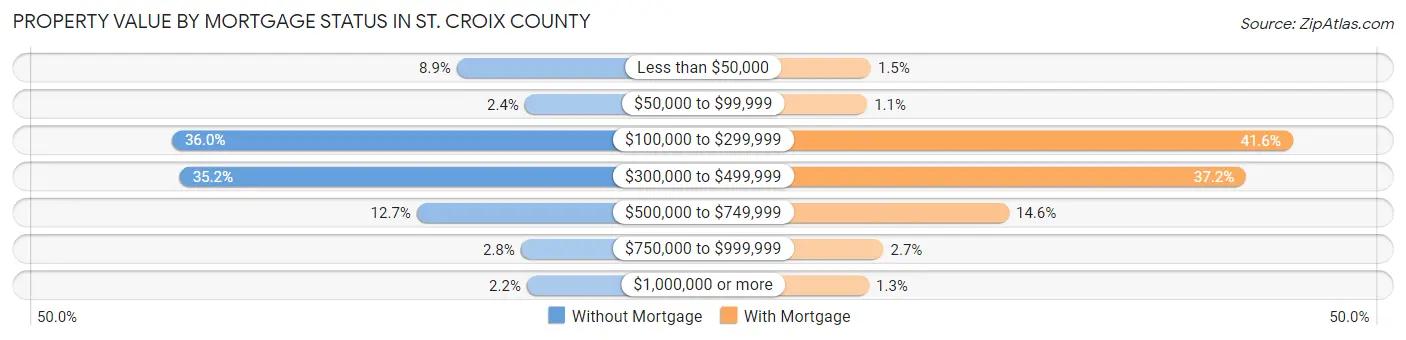
| Property Value | Without Mortgage | With Mortgage |
| Less than $50,000 | 679 (8.8%) | 307 (1.5%) |
| $50,000 to $99,999 | 182 (2.4%) | 230 (1.1%) |
| $100,000 to $299,999 | 2,759 (36.0%) | 8,666 (41.6%) |
| $300,000 to $499,999 | 2,702 (35.2%) | 7,742 (37.2%) |
| $500,000 to $749,999 | 971 (12.7%) | 3,044 (14.6%) |
| $750,000 to $999,999 | 212 (2.8%) | 556 (2.7%) |
| $1,000,000 or more | 167 (2.2%) | 269 (1.3%) |
| Total | 7,672 (100.0%) | 20,814 (100.0%) |
Household Income by Mortgage Status in St. Croix County
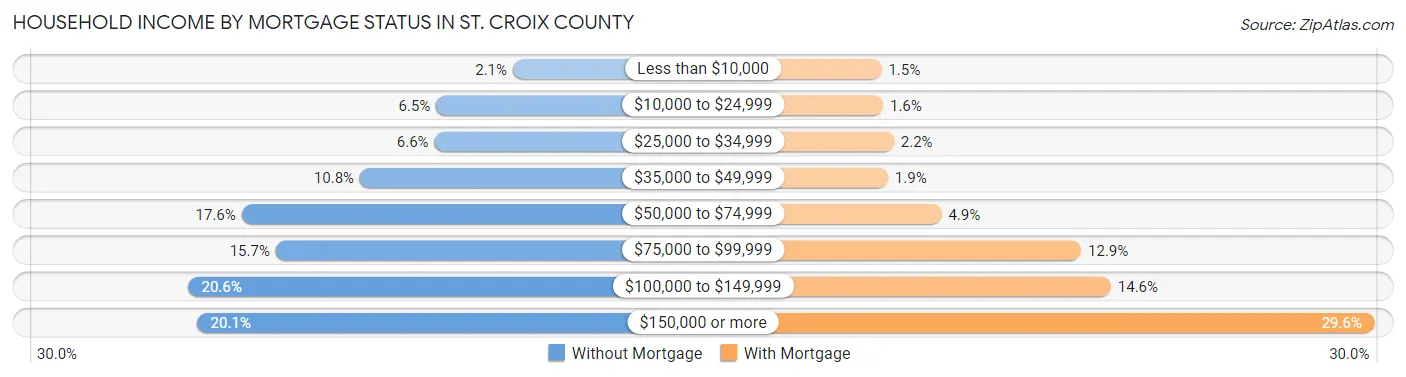
| Household Income | Without Mortgage | With Mortgage |
| Less than $10,000 | 161 (2.1%) | 308 (1.5%) |
| $10,000 to $24,999 | 497 (6.5%) | 326 (1.6%) |
| $25,000 to $34,999 | 505 (6.6%) | 456 (2.2%) |
| $35,000 to $49,999 | 832 (10.8%) | 386 (1.8%) |
| $50,000 to $74,999 | 1,350 (17.6%) | 1,023 (4.9%) |
| $75,000 to $99,999 | 1,201 (15.7%) | 2,683 (12.9%) |
| $100,000 to $149,999 | 1,583 (20.6%) | 3,037 (14.6%) |
| $150,000 or more | 1,543 (20.1%) | 6,164 (29.6%) |
| Total | 7,672 (100.0%) | 20,814 (100.0%) |
Property Value to Household Income Ratio in St. Croix County
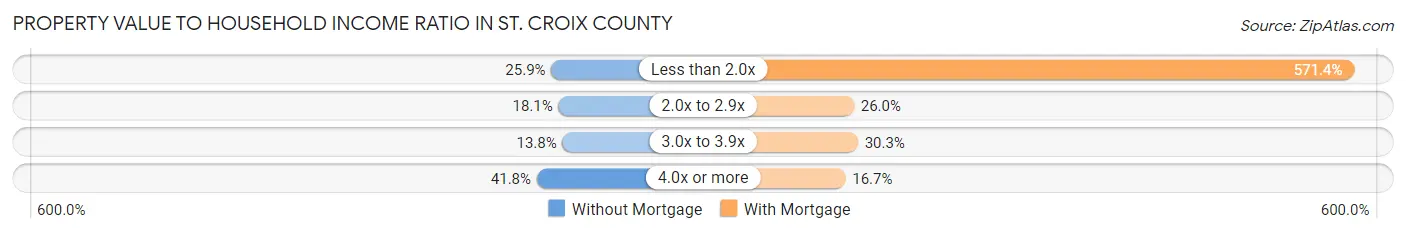
| Value-to-Income Ratio | Without Mortgage | With Mortgage |
| Less than 2.0x | 1,989 (25.9%) | 118,929 (571.4%) |
| 2.0x to 2.9x | 1,387 (18.1%) | 5,414 (26.0%) |
| 3.0x to 3.9x | 1,060 (13.8%) | 6,301 (30.3%) |
| 4.0x or more | 3,206 (41.8%) | 3,483 (16.7%) |
| Total | 7,672 (100.0%) | 20,814 (100.0%) |
Real Estate Taxes by Mortgage Status in St. Croix County
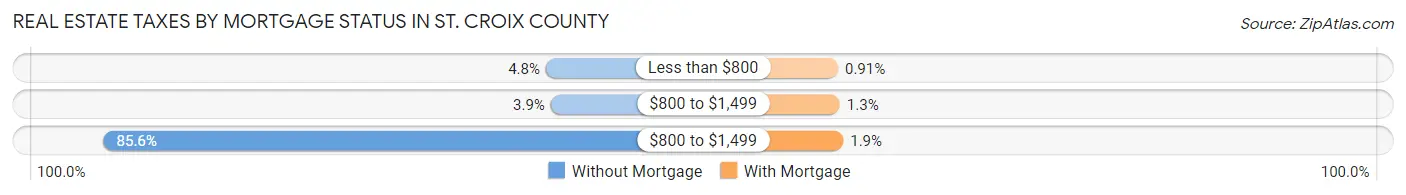
| Property Taxes | Without Mortgage | With Mortgage |
| Less than $800 | 369 (4.8%) | 190 (0.9%) |
| $800 to $1,499 | 301 (3.9%) | 260 (1.3%) |
| $800 to $1,499 | 6,564 (85.6%) | 390 (1.9%) |
| Total | 7,672 (100.0%) | 20,814 (100.0%) |
Health & Disability in St. Croix County
Health Insurance Coverage by Age in St. Croix County
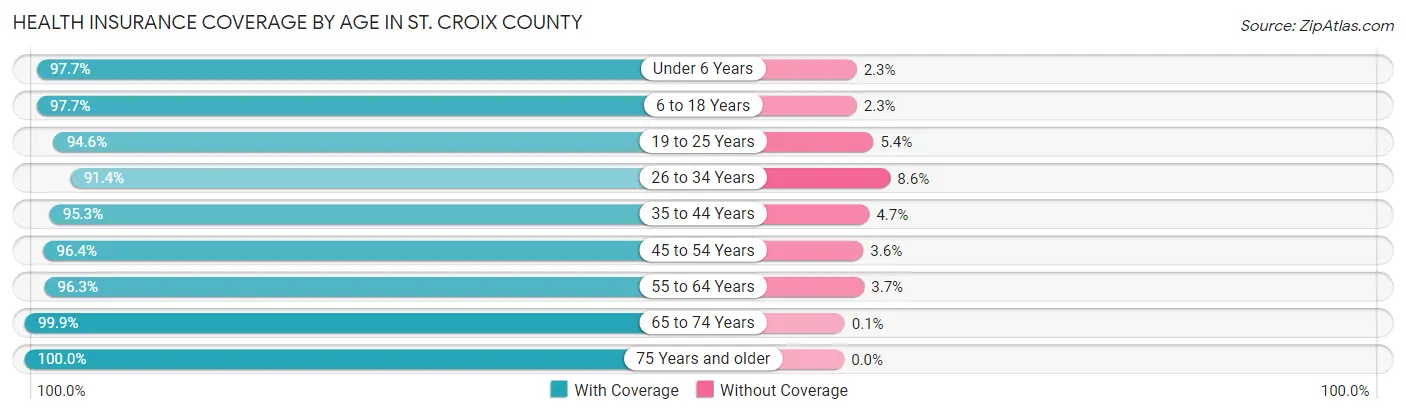
| Age Bracket | With Coverage | Without Coverage |
| Under 6 Years | 6,431 (97.7%) | 153 (2.3%) |
| 6 to 18 Years | 16,854 (97.7%) | 403 (2.3%) |
| 19 to 25 Years | 6,206 (94.6%) | 357 (5.4%) |
| 26 to 34 Years | 8,819 (91.4%) | 830 (8.6%) |
| 35 to 44 Years | 12,571 (95.3%) | 620 (4.7%) |
| 45 to 54 Years | 12,365 (96.4%) | 457 (3.6%) |
| 55 to 64 Years | 12,930 (96.3%) | 502 (3.7%) |
| 65 to 74 Years | 8,699 (99.9%) | 9 (0.1%) |
| 75 Years and older | 4,842 (100.0%) | 0 (0.0%) |
| Total | 89,717 (96.4%) | 3,331 (3.6%) |
Health Insurance Coverage by Citizenship Status in St. Croix County
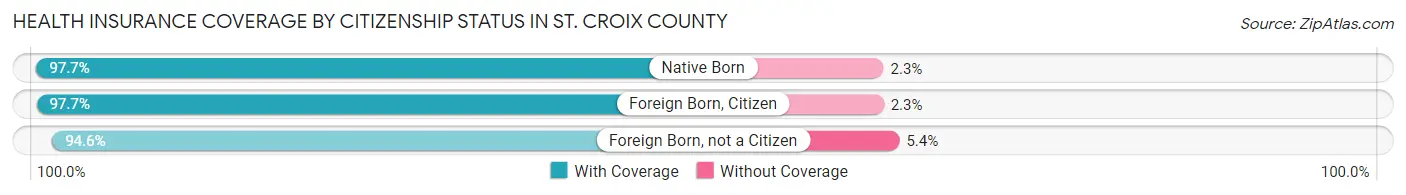
| Citizenship Status | With Coverage | Without Coverage |
| Native Born | 6,431 (97.7%) | 153 (2.3%) |
| Foreign Born, Citizen | 16,854 (97.7%) | 403 (2.3%) |
| Foreign Born, not a Citizen | 6,206 (94.6%) | 357 (5.4%) |
Health Insurance Coverage by Household Income in St. Croix County
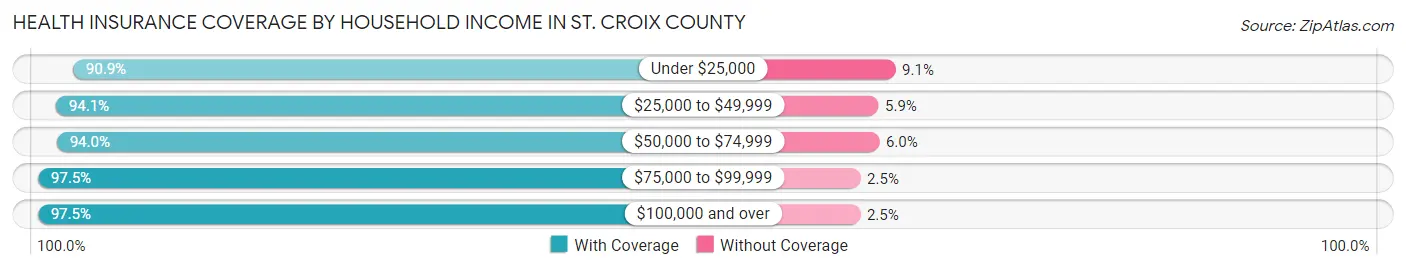
| Household Income | With Coverage | Without Coverage |
| Under $25,000 | 4,055 (90.9%) | 404 (9.1%) |
| $25,000 to $49,999 | 8,197 (94.1%) | 511 (5.9%) |
| $50,000 to $74,999 | 10,817 (94.0%) | 694 (6.0%) |
| $75,000 to $99,999 | 12,735 (97.5%) | 327 (2.5%) |
| $100,000 and over | 53,700 (97.5%) | 1,353 (2.5%) |
Public vs Private Health Insurance Coverage by Age in St. Croix County
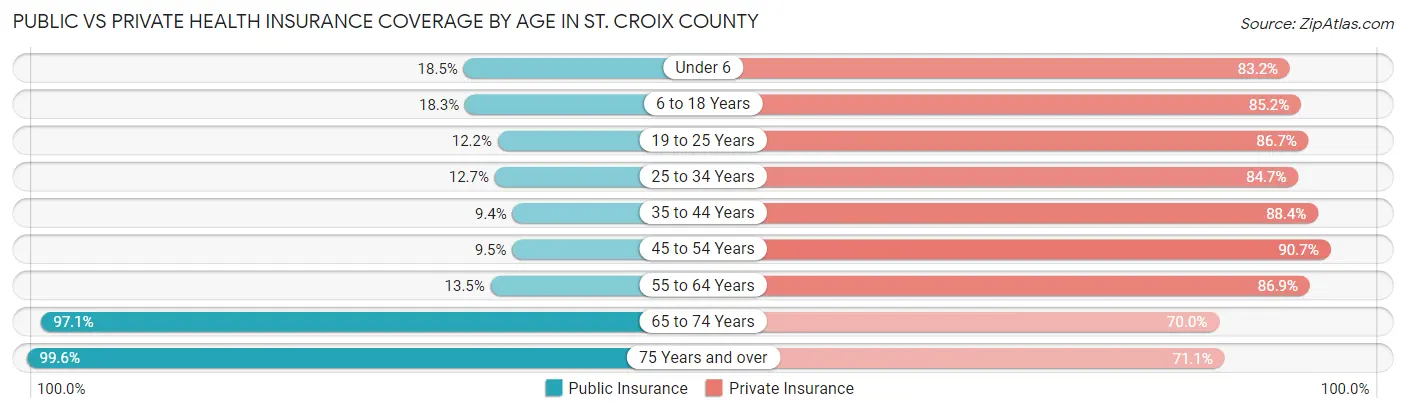
| Age Bracket | Public Insurance | Private Insurance |
| Under 6 | 1,218 (18.5%) | 5,476 (83.2%) |
| 6 to 18 Years | 3,149 (18.2%) | 14,710 (85.2%) |
| 19 to 25 Years | 799 (12.2%) | 5,687 (86.7%) |
| 25 to 34 Years | 1,227 (12.7%) | 8,175 (84.7%) |
| 35 to 44 Years | 1,243 (9.4%) | 11,664 (88.4%) |
| 45 to 54 Years | 1,213 (9.5%) | 11,629 (90.7%) |
| 55 to 64 Years | 1,813 (13.5%) | 11,669 (86.9%) |
| 65 to 74 Years | 8,454 (97.1%) | 6,099 (70.0%) |
| 75 Years and over | 4,824 (99.6%) | 3,442 (71.1%) |
| Total | 23,940 (25.7%) | 78,551 (84.4%) |
Disability Status by Sex by Age in St. Croix County
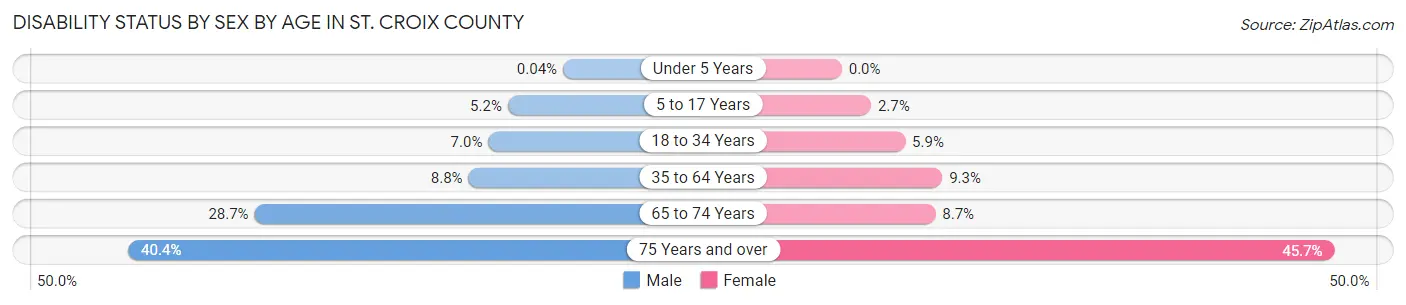
| Age Bracket | Male | Female |
| Under 5 Years | 1 (0.0%) | 0 (0.0%) |
| 5 to 17 Years | 458 (5.2%) | 228 (2.7%) |
| 18 to 34 Years | 620 (7.0%) | 502 (5.9%) |
| 35 to 64 Years | 1,757 (8.8%) | 1,818 (9.3%) |
| 65 to 74 Years | 1,252 (28.7%) | 377 (8.7%) |
| 75 Years and over | 832 (40.4%) | 1,272 (45.7%) |
Disability Class by Sex by Age in St. Croix County
Disability Class: Hearing Difficulty
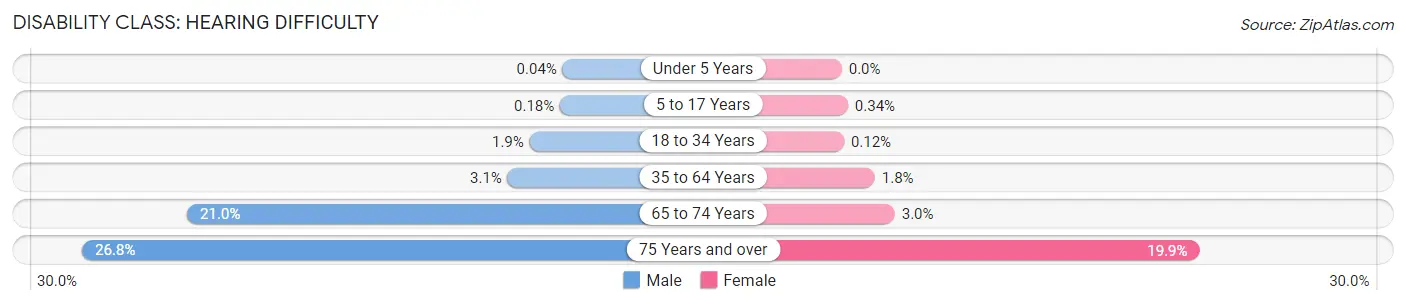
| Age Bracket | Male | Female |
| Under 5 Years | 1 (0.0%) | 0 (0.0%) |
| 5 to 17 Years | 16 (0.2%) | 29 (0.3%) |
| 18 to 34 Years | 167 (1.9%) | 10 (0.1%) |
| 35 to 64 Years | 619 (3.1%) | 358 (1.8%) |
| 65 to 74 Years | 915 (20.9%) | 128 (2.9%) |
| 75 Years and over | 552 (26.8%) | 554 (19.9%) |
Disability Class: Vision Difficulty
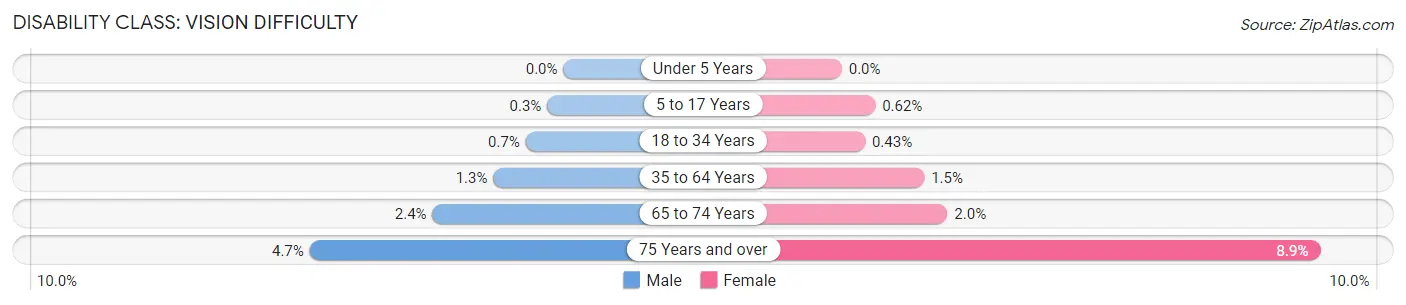
| Age Bracket | Male | Female |
| Under 5 Years | 0 (0.0%) | 0 (0.0%) |
| 5 to 17 Years | 27 (0.3%) | 52 (0.6%) |
| 18 to 34 Years | 62 (0.7%) | 37 (0.4%) |
| 35 to 64 Years | 260 (1.3%) | 299 (1.5%) |
| 65 to 74 Years | 106 (2.4%) | 85 (2.0%) |
| 75 Years and over | 97 (4.7%) | 247 (8.9%) |
Disability Class: Cognitive Difficulty
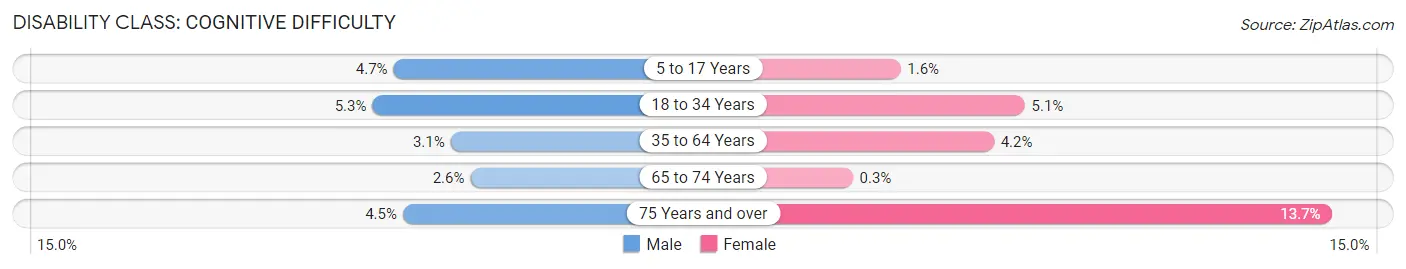
| Age Bracket | Male | Female |
| 5 to 17 Years | 420 (4.7%) | 137 (1.6%) |
| 18 to 34 Years | 473 (5.3%) | 435 (5.1%) |
| 35 to 64 Years | 627 (3.1%) | 825 (4.2%) |
| 65 to 74 Years | 113 (2.6%) | 13 (0.3%) |
| 75 Years and over | 92 (4.5%) | 380 (13.7%) |
Disability Class: Ambulatory Difficulty
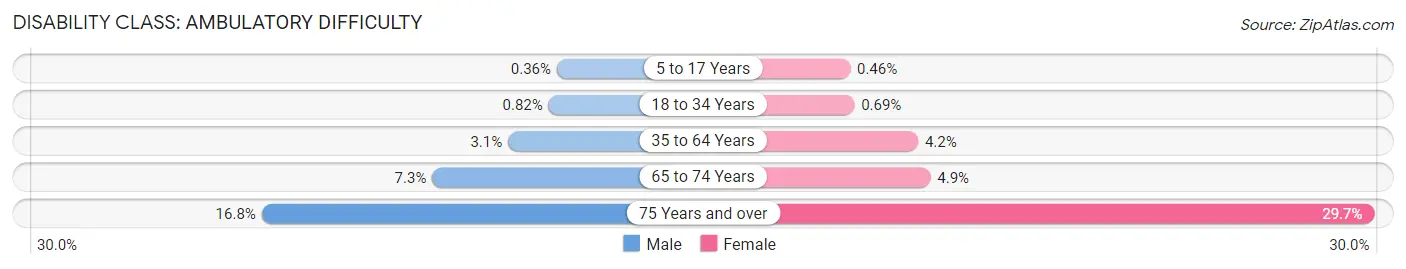
| Age Bracket | Male | Female |
| 5 to 17 Years | 32 (0.4%) | 39 (0.5%) |
| 18 to 34 Years | 73 (0.8%) | 59 (0.7%) |
| 35 to 64 Years | 615 (3.1%) | 827 (4.2%) |
| 65 to 74 Years | 319 (7.3%) | 214 (4.9%) |
| 75 Years and over | 346 (16.8%) | 825 (29.6%) |
Disability Class: Self-Care Difficulty
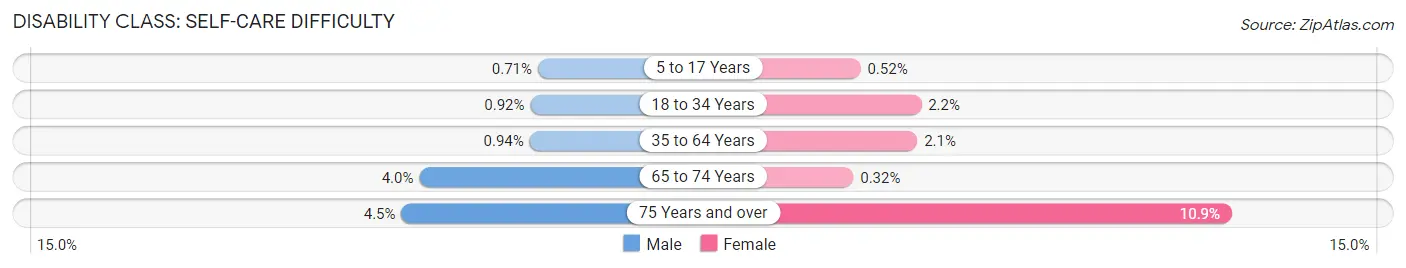
| Age Bracket | Male | Female |
| 5 to 17 Years | 63 (0.7%) | 44 (0.5%) |
| 18 to 34 Years | 82 (0.9%) | 189 (2.2%) |
| 35 to 64 Years | 187 (0.9%) | 410 (2.1%) |
| 65 to 74 Years | 175 (4.0%) | 14 (0.3%) |
| 75 Years and over | 93 (4.5%) | 302 (10.9%) |
Technology Access in St. Croix County
Computing Device Access in St. Croix County
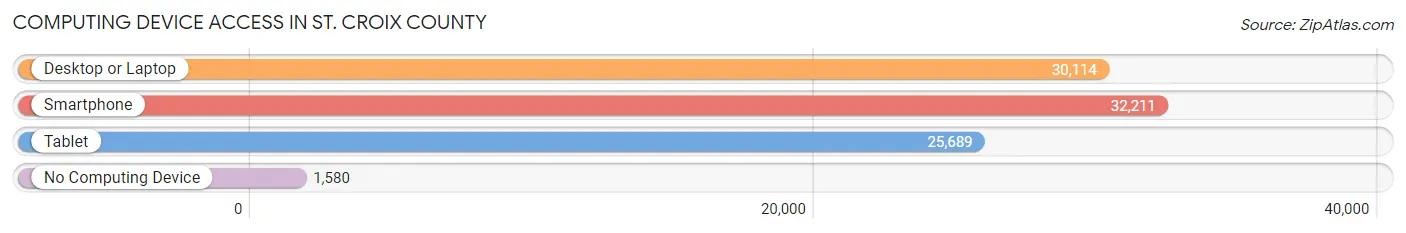
| Device Type | # Households | % Households |
| Desktop or Laptop | 30,114 | 83.6% |
| Smartphone | 32,211 | 89.5% |
| Tablet | 25,689 | 71.4% |
| No Computing Device | 1,580 | 4.4% |
| Total | 36,004 | 100.0% |
Internet Access in St. Croix County
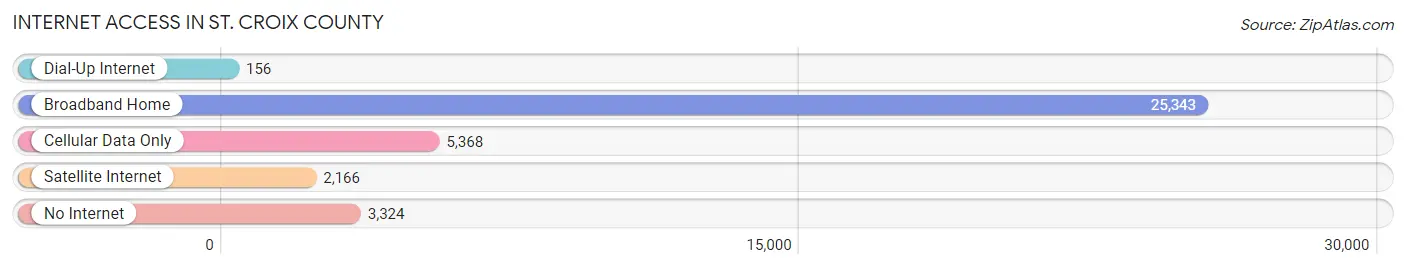
| Internet Type | # Households | % Households |
| Dial-Up Internet | 156 | 0.4% |
| Broadband Home | 25,343 | 70.4% |
| Cellular Data Only | 5,368 | 14.9% |
| Satellite Internet | 2,166 | 6.0% |
| No Internet | 3,324 | 9.2% |
| Total | 36,004 | 100.0% |
St. Croix County Summary
St. Croix County is located in the western part of Wisconsin, along the Minnesota border. It is part of the Twin Cities metropolitan area and is home to a population of over 84,000 people. The county seat is Hudson, and other major cities include New Richmond, Roberts, and Baldwin.
History
St. Croix County was established in 1840, and was named after the St. Croix River, which forms the county’s western border. The area was originally inhabited by the Ojibwe people, who were later displaced by European settlers. The first settlers arrived in the area in the early 1800s, and the county was officially organized in 1840.
The county was initially an agricultural area, with the main crops being wheat, corn, and oats. In the late 1800s, the area began to industrialize, with the construction of the St. Croix Valley Railroad in 1871. This allowed for the transportation of goods and people to and from the county.
In the early 1900s, the county experienced a population boom, as people moved to the area for jobs in the lumber and paper industries. The county also experienced a surge in tourism, as people flocked to the area to take advantage of the natural beauty of the St. Croix River.
Geography
St. Croix County is located in the western part of Wisconsin, along the Minnesota border. It is part of the Twin Cities metropolitan area and is home to a population of over 84,000 people. The county covers an area of 845 square miles, and is bordered by Pierce County to the north, Polk County to the east, Washington County to the south, and the St. Croix River to the west.
The county is mostly rural, with the majority of the population living in small towns and villages. The largest city in the county is Hudson, which is located on the St. Croix River. Other major cities include New Richmond, Roberts, and Baldwin.
The county is home to a variety of natural features, including the St. Croix River, which forms the county’s western border. The river is a popular destination for fishing, boating, and other recreational activities. The county also contains several lakes, including Big Lake, Lake Mallalieu, and Lake St. Croix.
Economy
St. Croix County’s economy is largely based on agriculture, manufacturing, and tourism. The county is home to several large agricultural operations, including dairy farms, beef farms, and vegetable farms. The county is also home to several manufacturing companies, including paper mills, furniture factories, and food processing plants.
The county is also a popular tourist destination, with visitors coming to take advantage of the natural beauty of the St. Croix River. The county is home to several state parks, including Interstate State Park, Kinnickinnic State Park, and St. Croix State Park.
Demographics
As of the 2010 census, St. Croix County had a population of 84,345 people. The population is spread out, with the largest city, Hudson, having a population of 13,061. The county is predominantly white, with 87.3% of the population identifying as white. The next largest racial group is Hispanic or Latino, which makes up 5.3% of the population.
The median household income in the county is $60,945, and the median home value is $182,400. The unemployment rate in the county is 3.7%, which is lower than the national average. The poverty rate in the county is 8.2%, which is also lower than the national average.
Common Questions
What is the Total Population of St. Croix County?
Total Population of St. Croix County is 93,752.
What is the Total Male Population of St. Croix County?
Total Male Population of St. Croix County is 47,359.
What is the Total Female Population of St. Croix County?
Total Female Population of St. Croix County is 46,393.
What is the Ratio of Males per 100 Females in St. Croix County?
There are 102.08 Males per 100 Females in St. Croix County.
What is the Ratio of Females per 100 Males in St. Croix County?
There are 97.96 Females per 100 Males in St. Croix County.
What is the Median Population Age in St. Croix County?
Median Population Age in St. Croix County is 39.7 Years.
What is the Average Family Size in St. Croix County
Average Family Size in St. Croix County is 3.0 People.
What is the Average Household Size in St. Croix County
Average Household Size in St. Croix County is 2.6 People.
What is Per Capita Income in St. Croix County?
Per Capita income in St. Croix County is $45,810.
What is the Median Family Income in St. Croix County?
Median Family Income in St. Croix County is $114,534.
What is the Median Household income in St. Croix County?
Median Household Income in St. Croix County is $97,950.
What is Income or Wage Gap in St. Croix County?
Income or Wage Gap in St. Croix County is 28.0%.
Women in St. Croix County earn 72.0 cents for every dollar earned by a man.
What is Family Income Deficit in St. Croix County?
Family Income Deficit in St. Croix County is $11,683.
Families that are below poverty line in St. Croix County earn $11,683 less on average than the poverty threshold level.
What is Inequality or Gini Index in St. Croix County?
Inequality or Gini Index in St. Croix County is 0.39.
How Large is the Labor Force in St. Croix County?
There are 52,246 People in the Labor Forcein in St. Croix County.
What is the Percentage of People in the Labor Force in St. Croix County?
70.8% of People are in the Labor Force in St. Croix County.
What is the Unemployment Rate in St. Croix County?
Unemployment Rate in St. Croix County is 2.2%.