Sheboygan County, WI
Sheboygan County Map
Sheboygan County Overview
117,741
TOTAL POPULATION
59,860
MALE POPULATION
57,881
FEMALE POPULATION
103.42
MALES / 100 FEMALES
96.69
FEMALES / 100 MALES
41.5
MEDIAN AGE
3.0
AVG FAMILY SIZE
2.3
AVG HOUSEHOLD SIZE
$37,454
PER CAPITA INCOME
$87,694
AVG FAMILY INCOME
$68,969
AVG HOUSEHOLD INCOME
27.9%
WAGE / INCOME GAP [ % ]
72.1¢/ $1
WAGE / INCOME GAP [ $ ]
$11,023
FAMILY INCOME DEFICIT
0.41
INEQUALITY / GINI INDEX
62,857
LABOR FORCE [ PEOPLE ]
66.0%
PERCENT IN LABOR FORCE
2.8%
UNEMPLOYMENT RATE
Sheboygan County Area Codes
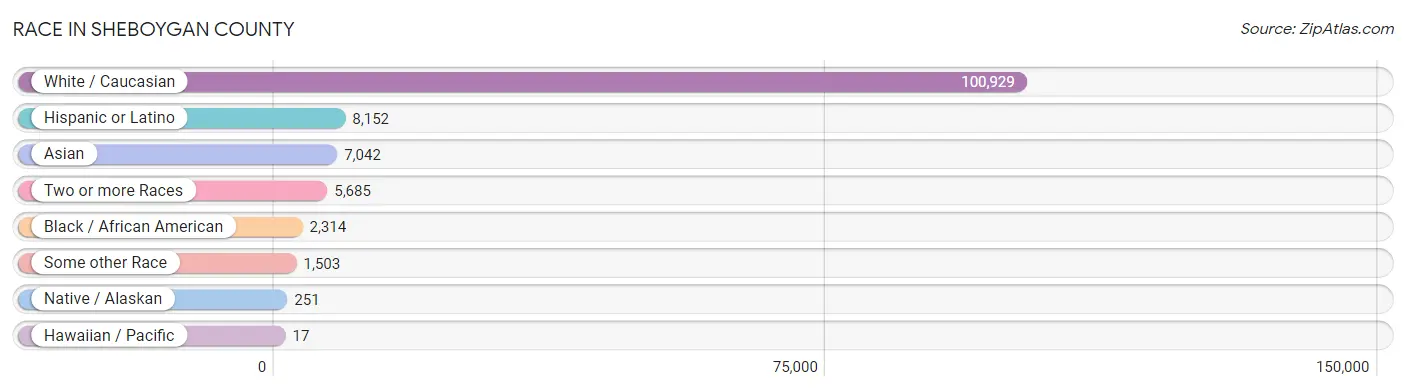
Race in Sheboygan County
The most populous races in Sheboygan County are White / Caucasian (100,929 | 85.7%), Hispanic or Latino (8,152 | 6.9%), and Asian (7,042 | 6.0%).
| Race | # Population | % Population |
| Asian | 7,042 | 6.0% |
| Black / African American | 2,314 | 2.0% |
| Hawaiian / Pacific | 17 | 0.0% |
| Hispanic or Latino | 8,152 | 6.9% |
| Native / Alaskan | 251 | 0.2% |
| White / Caucasian | 100,929 | 85.7% |
| Two or more Races | 5,685 | 4.8% |
| Some other Race | 1,503 | 1.3% |
| Total | 117,741 | 100.0% |
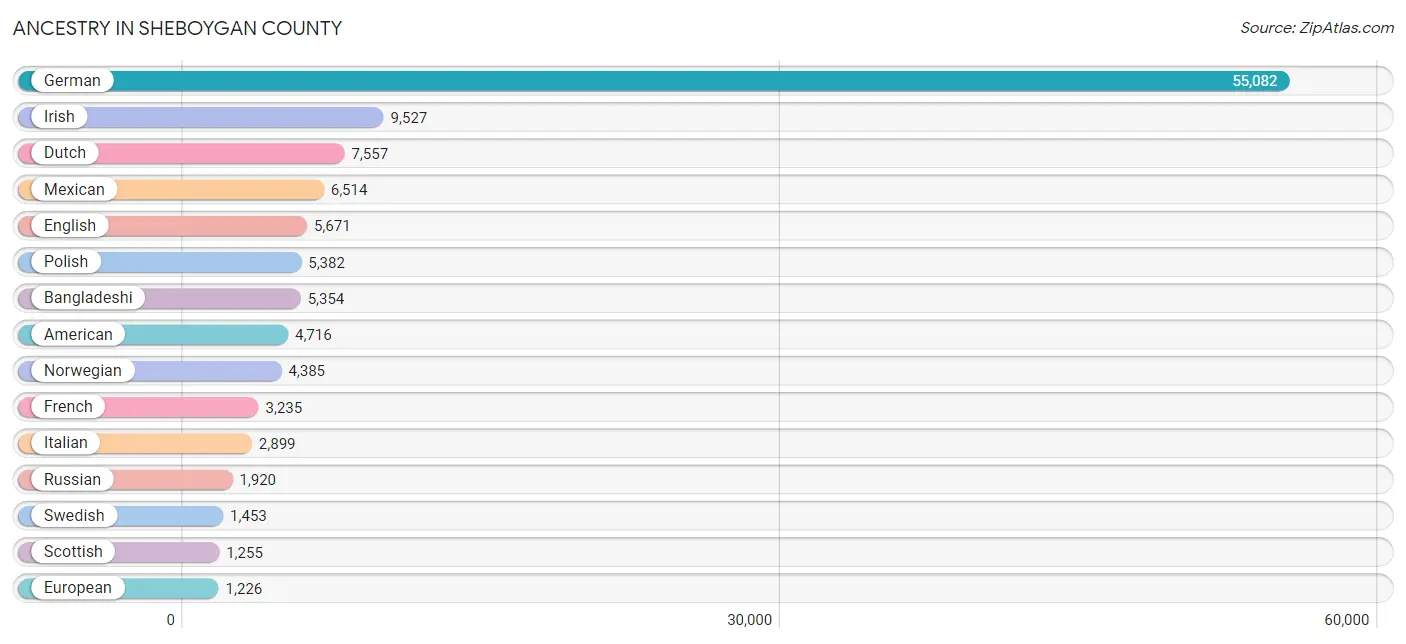
Ancestry in Sheboygan County
The most populous ancestries reported in Sheboygan County are German (55,082 | 46.8%), Irish (9,527 | 8.1%), Dutch (7,557 | 6.4%), Mexican (6,514 | 5.5%), and English (5,671 | 4.8%), together accounting for 71.6% of all Sheboygan County residents.
| Ancestry | # Population | % Population |
| African | 252 | 0.2% |
| Alaska Native | 10 | 0.0% |
| Albanian | 323 | 0.3% |
| American | 4,716 | 4.0% |
| Apache | 8 | 0.0% |
| Arab | 75 | 0.1% |
| Armenian | 13 | 0.0% |
| Australian | 40 | 0.0% |
| Austrian | 522 | 0.4% |
| Bangladeshi | 5,354 | 4.5% |
| Belgian | 502 | 0.4% |
| Belizean | 15 | 0.0% |
| Bhutanese | 187 | 0.2% |
| Blackfeet | 58 | 0.1% |
| Brazilian | 49 | 0.0% |
| British | 358 | 0.3% |
| Bulgarian | 24 | 0.0% |
| Burmese | 153 | 0.1% |
| Canadian | 92 | 0.1% |
| Central American | 227 | 0.2% |
| Central American Indian | 24 | 0.0% |
| Cherokee | 65 | 0.1% |
| Chilean | 41 | 0.0% |
| Chippewa | 158 | 0.1% |
| Choctaw | 13 | 0.0% |
| Colombian | 47 | 0.0% |
| Costa Rican | 48 | 0.0% |
| Cree | 30 | 0.0% |
| Creek | 5 | 0.0% |
| Croatian | 557 | 0.5% |
| Cuban | 24 | 0.0% |
| Czech | 820 | 0.7% |
| Czechoslovakian | 99 | 0.1% |
| Danish | 513 | 0.4% |
| Dominican | 14 | 0.0% |
| Dutch | 7,557 | 6.4% |
| Eastern European | 272 | 0.2% |
| Ecuadorian | 2 | 0.0% |
| English | 5,671 | 4.8% |
| Estonian | 15 | 0.0% |
| Ethiopian | 41 | 0.0% |
| European | 1,226 | 1.0% |
| Finnish | 835 | 0.7% |
| French | 3,235 | 2.8% |
| French American Indian | 10 | 0.0% |
| French Canadian | 526 | 0.4% |
| German | 55,082 | 46.8% |
| German Russian | 10 | 0.0% |
| Greek | 356 | 0.3% |
| Guatemalan | 73 | 0.1% |
| Honduran | 1 | 0.0% |
| Hungarian | 353 | 0.3% |
| Icelander | 66 | 0.1% |
| Indian (Asian) | 624 | 0.5% |
| Iranian | 7 | 0.0% |
| Irish | 9,527 | 8.1% |
| Iroquois | 107 | 0.1% |
| Italian | 2,899 | 2.5% |
| Jamaican | 114 | 0.1% |
| Japanese | 62 | 0.1% |
| Jordanian | 42 | 0.0% |
| Kenyan | 13 | 0.0% |
| Korean | 733 | 0.6% |
| Laotian | 55 | 0.1% |
| Latvian | 81 | 0.1% |
| Lebanese | 22 | 0.0% |
| Lithuanian | 617 | 0.5% |
| Luxembourger | 642 | 0.5% |
| Malaysian | 62 | 0.1% |
| Menominee | 59 | 0.1% |
| Mexican | 6,514 | 5.5% |
| Mexican American Indian | 16 | 0.0% |
| Native Hawaiian | 17 | 0.0% |
| Nicaraguan | 48 | 0.0% |
| Nigerian | 12 | 0.0% |
| Northern European | 149 | 0.1% |
| Norwegian | 4,385 | 3.7% |
| Ottawa | 7 | 0.0% |
| Pakistani | 73 | 0.1% |
| Panamanian | 22 | 0.0% |
| Pennsylvania German | 85 | 0.1% |
| Peruvian | 11 | 0.0% |
| Polish | 5,382 | 4.6% |
| Portuguese | 109 | 0.1% |
| Potawatomi | 39 | 0.0% |
| Puerto Rican | 842 | 0.7% |
| Romanian | 158 | 0.1% |
| Russian | 1,920 | 1.6% |
| Salvadoran | 35 | 0.0% |
| Scandinavian | 836 | 0.7% |
| Scotch-Irish | 364 | 0.3% |
| Scottish | 1,255 | 1.1% |
| Serbian | 69 | 0.1% |
| Sioux | 24 | 0.0% |
| Slavic | 37 | 0.0% |
| Slovak | 217 | 0.2% |
| Slovene | 588 | 0.5% |
| South American | 146 | 0.1% |
| Spaniard | 17 | 0.0% |
| Spanish | 120 | 0.1% |
| Sri Lankan | 85 | 0.1% |
| Subsaharan African | 336 | 0.3% |
| Swedish | 1,453 | 1.2% |
| Swiss | 483 | 0.4% |
| Thai | 286 | 0.2% |
| Turkish | 7 | 0.0% |
| Ukrainian | 32 | 0.0% |
| Uruguayan | 6 | 0.0% |
| Venezuelan | 39 | 0.0% |
| Welsh | 363 | 0.3% |
| Yugoslavian | 226 | 0.2% | View All 111 Rows |
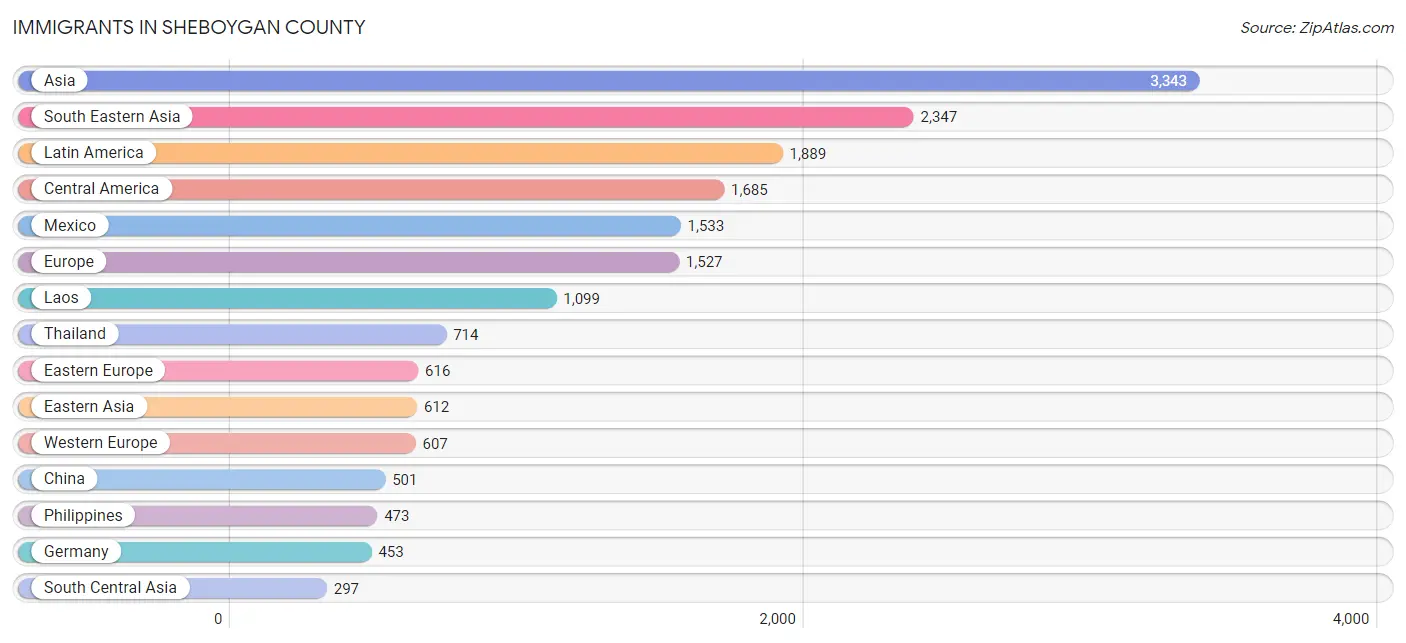
Immigrants in Sheboygan County
The most numerous immigrant groups reported in Sheboygan County came from Asia (3,343 | 2.8%), South Eastern Asia (2,347 | 2.0%), Latin America (1,889 | 1.6%), Central America (1,685 | 1.4%), and Mexico (1,533 | 1.3%), together accounting for 9.2% of all Sheboygan County residents.
| Immigration Origin | # Population | % Population |
| Africa | 94 | 0.1% |
| Albania | 34 | 0.0% |
| Asia | 3,343 | 2.8% |
| Australia | 77 | 0.1% |
| Austria | 108 | 0.1% |
| Belize | 5 | 0.0% |
| Bosnia and Herzegovina | 37 | 0.0% |
| Brazil | 8 | 0.0% |
| Bulgaria | 7 | 0.0% |
| Canada | 162 | 0.1% |
| Caribbean | 46 | 0.0% |
| Central America | 1,685 | 1.4% |
| China | 501 | 0.4% |
| Colombia | 20 | 0.0% |
| Croatia | 7 | 0.0% |
| Czechoslovakia | 24 | 0.0% |
| Eastern Africa | 13 | 0.0% |
| Eastern Asia | 612 | 0.5% |
| Eastern Europe | 616 | 0.5% |
| Ecuador | 4 | 0.0% |
| El Salvador | 11 | 0.0% |
| England | 104 | 0.1% |
| Europe | 1,527 | 1.3% |
| France | 3 | 0.0% |
| Germany | 453 | 0.4% |
| Greece | 56 | 0.1% |
| Guatemala | 52 | 0.0% |
| Hong Kong | 12 | 0.0% |
| India | 257 | 0.2% |
| Indonesia | 44 | 0.0% |
| Iran | 7 | 0.0% |
| Iraq | 34 | 0.0% |
| Ireland | 14 | 0.0% |
| Italy | 24 | 0.0% |
| Jamaica | 46 | 0.0% |
| Japan | 49 | 0.0% |
| Jordan | 42 | 0.0% |
| Kenya | 13 | 0.0% |
| Korea | 62 | 0.1% |
| Kuwait | 11 | 0.0% |
| Laos | 1,099 | 0.9% |
| Latin America | 1,889 | 1.6% |
| Mexico | 1,533 | 1.3% |
| Moldova | 25 | 0.0% |
| Morocco | 24 | 0.0% |
| Netherlands | 23 | 0.0% |
| Nicaragua | 48 | 0.0% |
| Nigeria | 12 | 0.0% |
| North Macedonia | 124 | 0.1% |
| Northern Africa | 24 | 0.0% |
| Northern Europe | 224 | 0.2% |
| Oceania | 77 | 0.1% |
| Pakistan | 33 | 0.0% |
| Panama | 36 | 0.0% |
| Peru | 56 | 0.1% |
| Philippines | 473 | 0.4% |
| Poland | 17 | 0.0% |
| Romania | 3 | 0.0% |
| Russia | 76 | 0.1% |
| Serbia | 2 | 0.0% |
| South Africa | 4 | 0.0% |
| South America | 158 | 0.1% |
| South Central Asia | 297 | 0.3% |
| South Eastern Asia | 2,347 | 2.0% |
| Southern Europe | 80 | 0.1% |
| Switzerland | 20 | 0.0% |
| Thailand | 714 | 0.6% |
| Ukraine | 5 | 0.0% |
| Uruguay | 23 | 0.0% |
| Venezuela | 47 | 0.0% |
| Vietnam | 17 | 0.0% |
| Western Africa | 12 | 0.0% |
| Western Asia | 87 | 0.1% |
| Western Europe | 607 | 0.5% | View All 74 Rows |
Sex and Age in Sheboygan County
Sex and Age in Sheboygan County
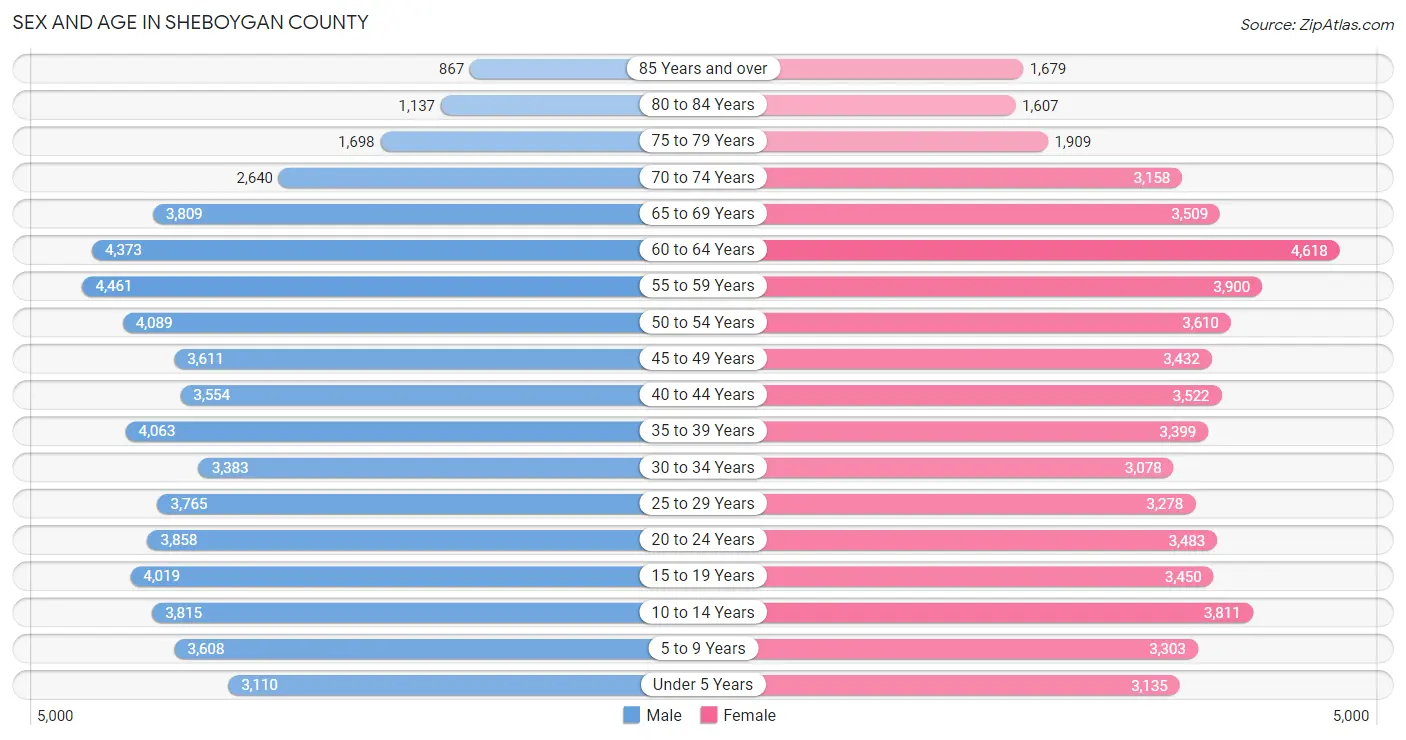
The most populous age groups in Sheboygan County are 55 to 59 Years (4,461 | 7.4%) for men and 60 to 64 Years (4,618 | 8.0%) for women.
| Age Bracket | Male | Female |
| Under 5 Years | 3,110 (5.2%) | 3,135 (5.4%) |
| 5 to 9 Years | 3,608 (6.0%) | 3,303 (5.7%) |
| 10 to 14 Years | 3,815 (6.4%) | 3,811 (6.6%) |
| 15 to 19 Years | 4,019 (6.7%) | 3,450 (6.0%) |
| 20 to 24 Years | 3,858 (6.5%) | 3,483 (6.0%) |
| 25 to 29 Years | 3,765 (6.3%) | 3,278 (5.7%) |
| 30 to 34 Years | 3,383 (5.7%) | 3,078 (5.3%) |
| 35 to 39 Years | 4,063 (6.8%) | 3,399 (5.9%) |
| 40 to 44 Years | 3,554 (5.9%) | 3,522 (6.1%) |
| 45 to 49 Years | 3,611 (6.0%) | 3,432 (5.9%) |
| 50 to 54 Years | 4,089 (6.8%) | 3,610 (6.2%) |
| 55 to 59 Years | 4,461 (7.4%) | 3,900 (6.7%) |
| 60 to 64 Years | 4,373 (7.3%) | 4,618 (8.0%) |
| 65 to 69 Years | 3,809 (6.4%) | 3,509 (6.1%) |
| 70 to 74 Years | 2,640 (4.4%) | 3,158 (5.5%) |
| 75 to 79 Years | 1,698 (2.8%) | 1,909 (3.3%) |
| 80 to 84 Years | 1,137 (1.9%) | 1,607 (2.8%) |
| 85 Years and over | 867 (1.5%) | 1,679 (2.9%) |
| Total | 59,860 (100.0%) | 57,881 (100.0%) |
Families and Households in Sheboygan County
Median Family Size in Sheboygan County
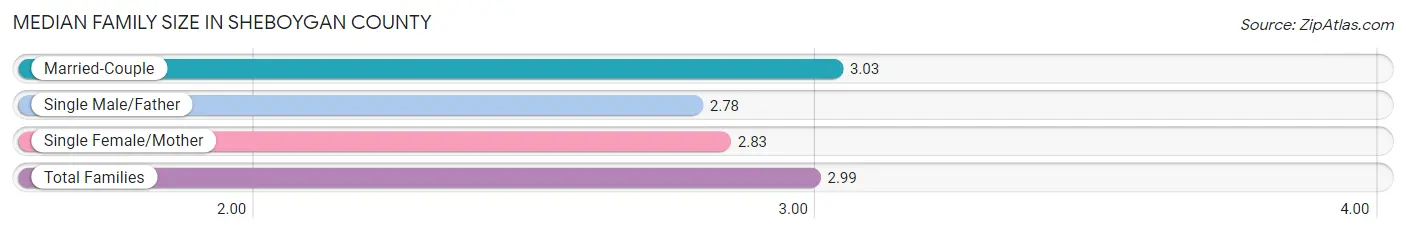
The median family size in Sheboygan County is 2.99 persons per family, with married-couple families (24,401 | 80.9%) accounting for the largest median family size of 3.03 persons per family. On the other hand, single male/father families (1,802 | 6.0%) represent the smallest median family size with 2.78 persons per family.
| Family Type | # Families | Family Size |
| Married-Couple | 24,401 (80.9%) | 3.03 |
| Single Male/Father | 1,802 (6.0%) | 2.78 |
| Single Female/Mother | 3,950 (13.1%) | 2.83 |
| Total Families | 30,153 (100.0%) | 2.99 |
Median Household Size in Sheboygan County
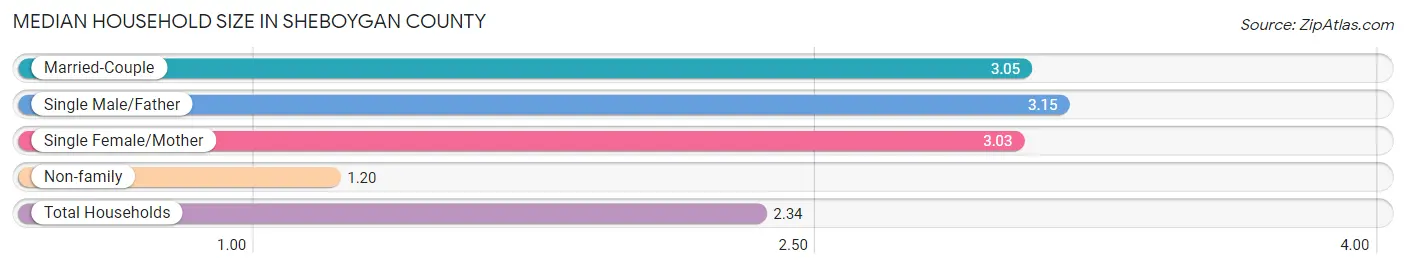
The median household size in Sheboygan County is 2.34 persons per household, with single male/father households (1,802 | 3.7%) accounting for the largest median household size of 3.15 persons per household. non-family households (18,882 | 38.5%) represent the smallest median household size with 1.20 persons per household.
| Household Type | # Households | Household Size |
| Married-Couple | 24,401 (49.8%) | 3.05 |
| Single Male/Father | 1,802 (3.7%) | 3.15 |
| Single Female/Mother | 3,950 (8.1%) | 3.03 |
| Non-family | 18,882 (38.5%) | 1.20 |
| Total Households | 49,035 (100.0%) | 2.34 |
Household Size by Marriage Status in Sheboygan County
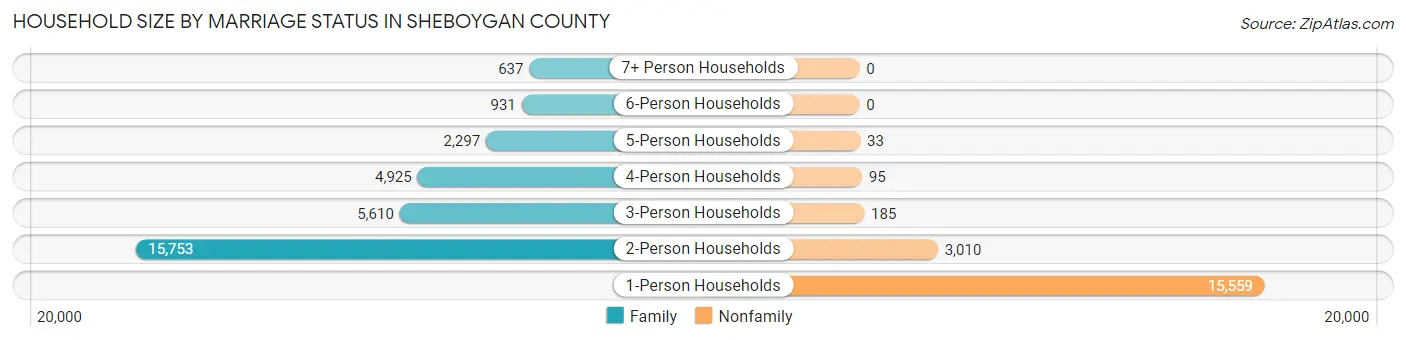
Out of a total of 49,035 households in Sheboygan County, 30,153 (61.5%) are family households, while 18,882 (38.5%) are nonfamily households. The most numerous type of family households are 2-person households, comprising 15,753, and the most common type of nonfamily households are 1-person households, comprising 15,559.
| Household Size | Family Households | Nonfamily Households |
| 1-Person Households | - | 15,559 (31.7%) |
| 2-Person Households | 15,753 (32.1%) | 3,010 (6.1%) |
| 3-Person Households | 5,610 (11.4%) | 185 (0.4%) |
| 4-Person Households | 4,925 (10.0%) | 95 (0.2%) |
| 5-Person Households | 2,297 (4.7%) | 33 (0.1%) |
| 6-Person Households | 931 (1.9%) | 0 (0.0%) |
| 7+ Person Households | 637 (1.3%) | 0 (0.0%) |
| Total | 30,153 (61.5%) | 18,882 (38.5%) |
Female Fertility in Sheboygan County
Fertility by Age in Sheboygan County
Average fertility rate in Sheboygan County is 60.0 births per 1,000 women. Women in the age bracket of 20 to 34 years have the highest fertility rate with 101.0 births per 1,000 women. Women in the age bracket of 20 to 34 years acount for 68.6% of all women with births.
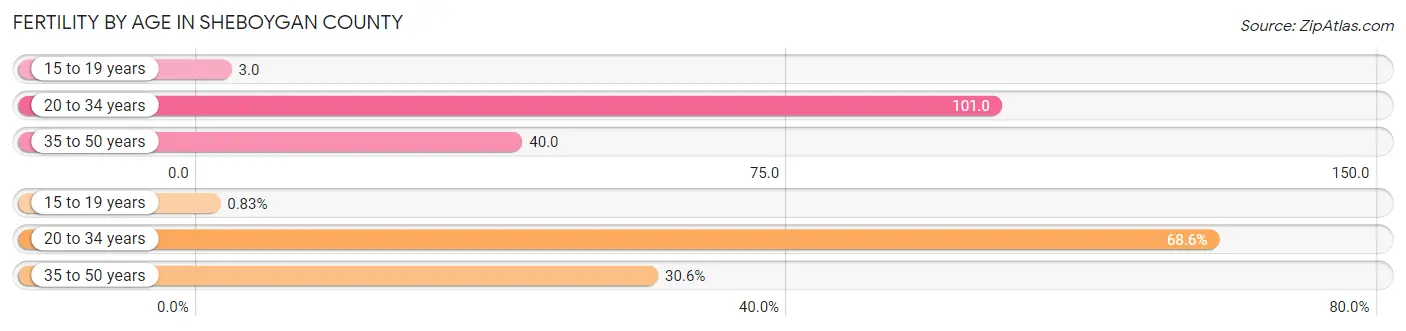
| Age Bracket | Women with Births | Births / 1,000 Women |
| 15 to 19 years | 12 (0.8%) | 3.0 |
| 20 to 34 years | 993 (68.6%) | 101.0 |
| 35 to 50 years | 442 (30.5%) | 40.0 |
| Total | 1,447 (100.0%) | 60.0 |
Fertility by Age by Marriage Status in Sheboygan County
80.5% of women with births (1,447) in Sheboygan County are married. The highest percentage of unmarried women with births falls into 15 to 19 years age bracket with 100.0% of them unmarried at the time of birth, while the lowest percentage of unmarried women with births belong to 35 to 50 years age bracket with 10.6% of them unmarried.
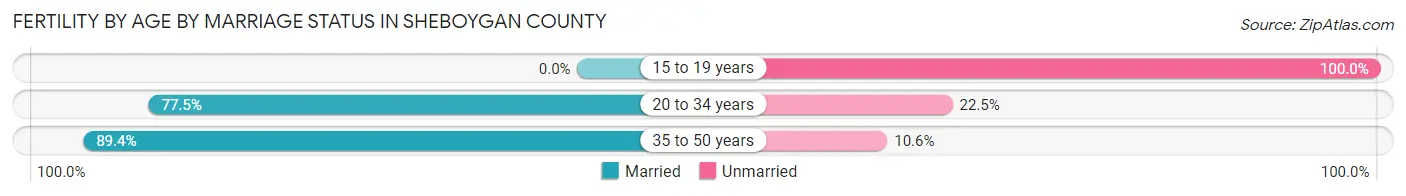
| Age Bracket | Married | Unmarried |
| 15 to 19 years | 0 (0.0%) | 12 (100.0%) |
| 20 to 34 years | 770 (77.5%) | 223 (22.5%) |
| 35 to 50 years | 395 (89.4%) | 47 (10.6%) |
| Total | 1,165 (80.5%) | 282 (19.5%) |
Fertility by Education in Sheboygan County
Average fertility rate in Sheboygan County is 60.0 births per 1,000 women. Women with the education attainment of bachelor's degree have the highest fertility rate of 83.0 births per 1,000 women, while women with the education attainment of graduate degree have the lowest fertility at 36.0 births per 1,000 women. Women with the education attainment of college or associate's degree represent 32.2% of all women with births.
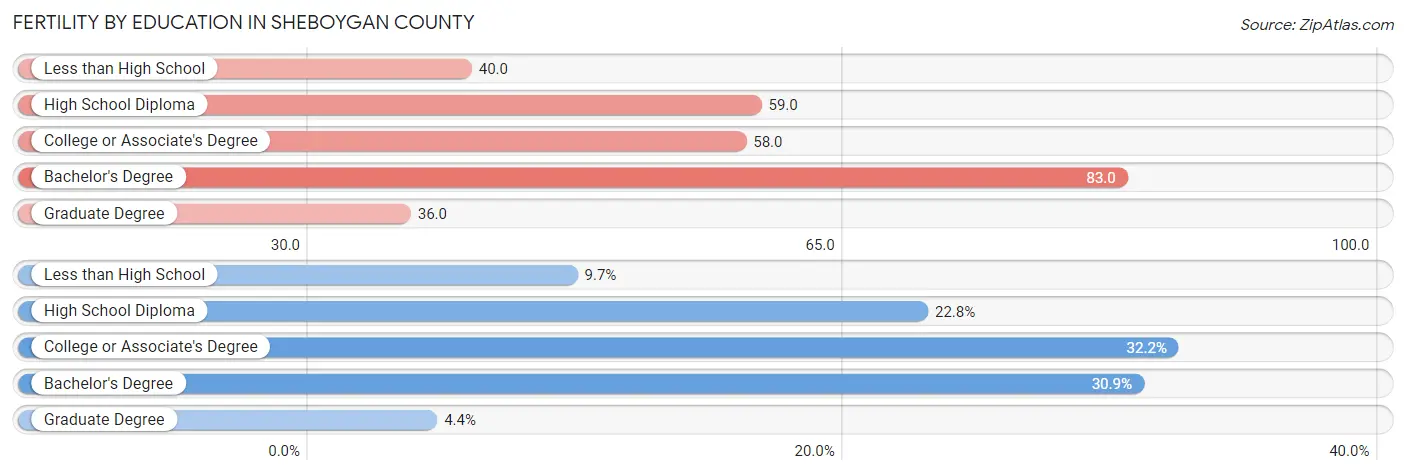
| Educational Attainment | Women with Births | Births / 1,000 Women |
| Less than High School | 140 (9.7%) | 40.0 |
| High School Diploma | 330 (22.8%) | 59.0 |
| College or Associate's Degree | 466 (32.2%) | 58.0 |
| Bachelor's Degree | 447 (30.9%) | 83.0 |
| Graduate Degree | 64 (4.4%) | 36.0 |
| Total | 1,447 (100.0%) | 60.0 |
Fertility by Education by Marriage Status in Sheboygan County
19.5% of women with births in Sheboygan County are unmarried. Women with the educational attainment of graduate degree are most likely to be married with 96.9% of them married at childbirth, while women with the educational attainment of less than high school are least likely to be married with 31.4% of them unmarried at childbirth.
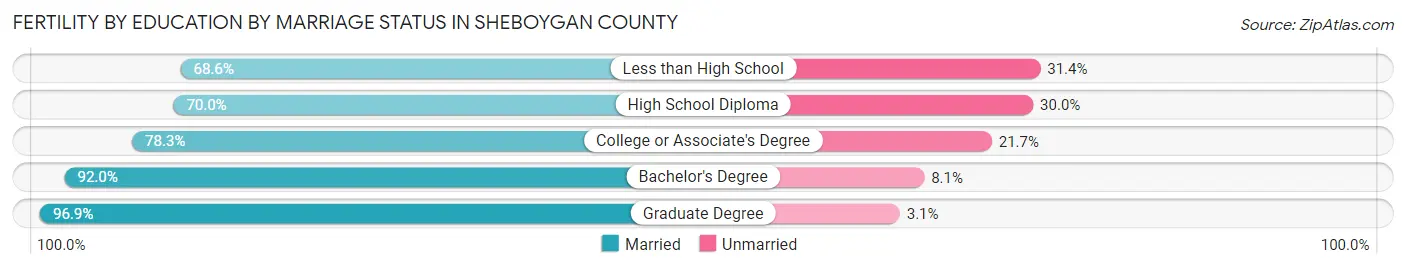
| Educational Attainment | Married | Unmarried |
| Less than High School | 96 (68.6%) | 44 (31.4%) |
| High School Diploma | 231 (70.0%) | 99 (30.0%) |
| College or Associate's Degree | 365 (78.3%) | 101 (21.7%) |
| Bachelor's Degree | 411 (91.9%) | 36 (8.1%) |
| Graduate Degree | 62 (96.9%) | 2 (3.1%) |
| Total | 1,165 (80.5%) | 282 (19.5%) |
Income in Sheboygan County
Income Overview in Sheboygan County
Per Capita Income in Sheboygan County is $37,454, while median incomes of families and households are $87,694 and $68,969 respectively.
| Characteristic | Number | Measure |
| Per Capita Income | 117,741 | $37,454 |
| Median Family Income | 30,153 | $87,694 |
| Mean Family Income | 30,153 | $107,275 |
| Median Household Income | 49,035 | $68,969 |
| Mean Household Income | 49,035 | $87,894 |
| Income Deficit | 30,153 | $11,023 |
| Wage / Income Gap (%) | 117,741 | 27.92% |
| Wage / Income Gap ($) | 117,741 | 72.08¢ per $1 |
| Gini / Inequality Index | 117,741 | 0.41 |
Earnings by Sex in Sheboygan County
Average Earnings in Sheboygan County are $43,955, $50,633 for men and $36,495 for women, a difference of 27.9%.
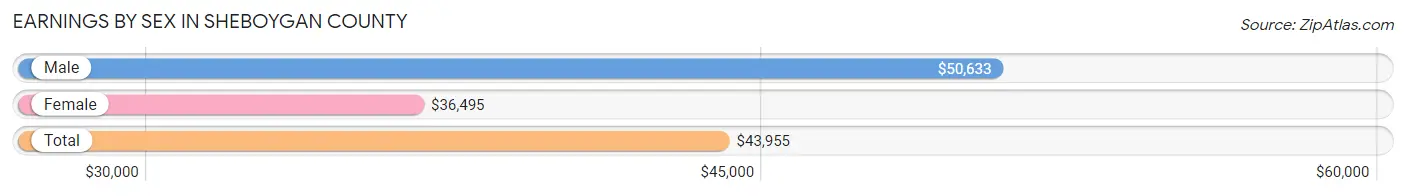
| Sex | Number | Average Earnings |
| Male | 35,560 (53.5%) | $50,633 |
| Female | 30,904 (46.5%) | $36,495 |
| Total | 66,464 (100.0%) | $43,955 |
Earnings by Sex by Income Bracket in Sheboygan County
The most common earnings brackets in Sheboygan County are $75,000 to $99,999 for men (4,443 | 12.5%) and $55,000 to $64,999 for women (2,421 | 7.8%).
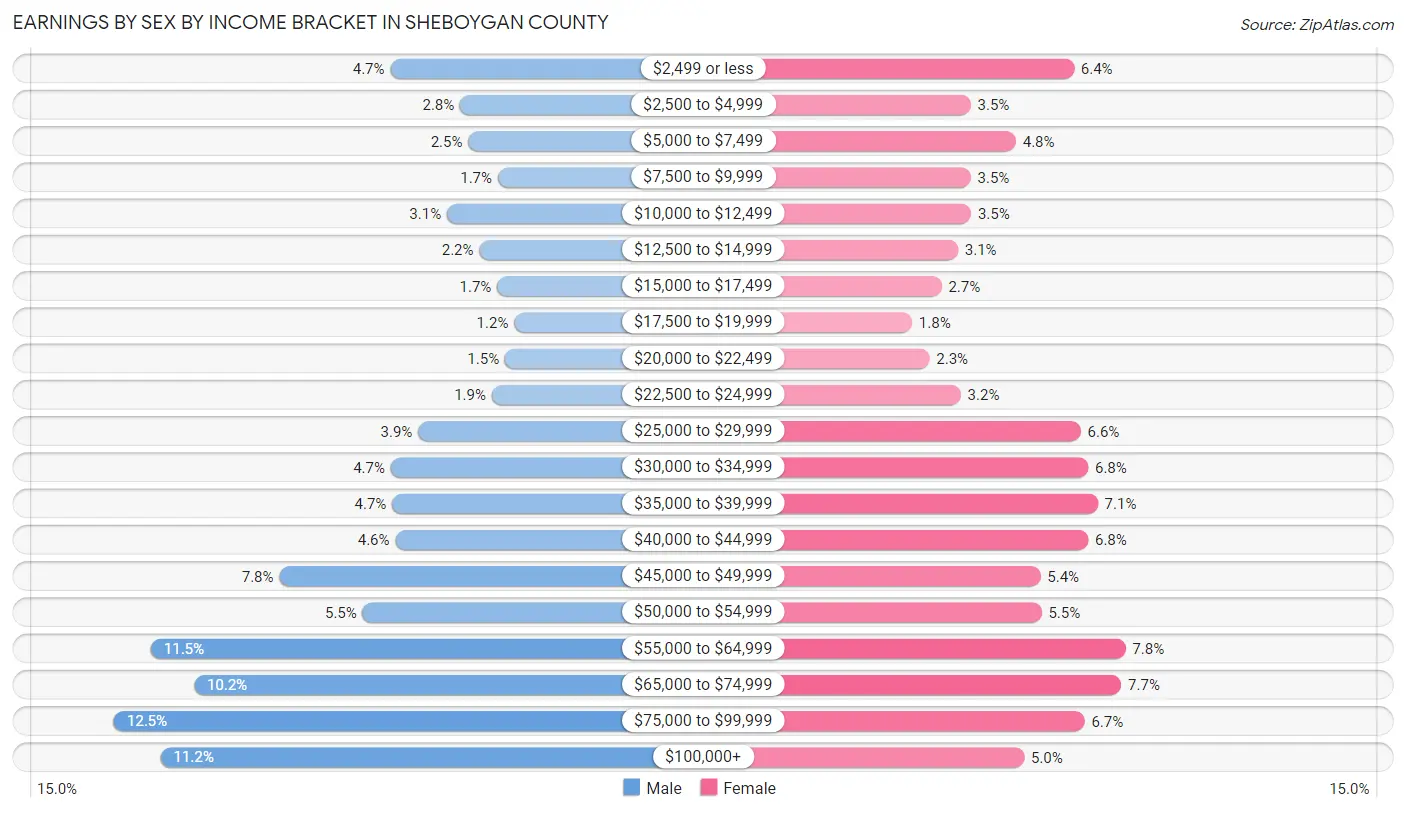
| Income | Male | Female |
| $2,499 or less | 1,678 (4.7%) | 1,973 (6.4%) |
| $2,500 to $4,999 | 982 (2.8%) | 1,074 (3.5%) |
| $5,000 to $7,499 | 901 (2.5%) | 1,469 (4.8%) |
| $7,500 to $9,999 | 604 (1.7%) | 1,077 (3.5%) |
| $10,000 to $12,499 | 1,113 (3.1%) | 1,079 (3.5%) |
| $12,500 to $14,999 | 788 (2.2%) | 965 (3.1%) |
| $15,000 to $17,499 | 611 (1.7%) | 821 (2.7%) |
| $17,500 to $19,999 | 441 (1.2%) | 567 (1.8%) |
| $20,000 to $22,499 | 533 (1.5%) | 718 (2.3%) |
| $22,500 to $24,999 | 666 (1.9%) | 988 (3.2%) |
| $25,000 to $29,999 | 1,400 (3.9%) | 2,029 (6.6%) |
| $30,000 to $34,999 | 1,675 (4.7%) | 2,094 (6.8%) |
| $35,000 to $39,999 | 1,661 (4.7%) | 2,180 (7.0%) |
| $40,000 to $44,999 | 1,627 (4.6%) | 2,094 (6.8%) |
| $45,000 to $49,999 | 2,789 (7.8%) | 1,680 (5.4%) |
| $50,000 to $54,999 | 1,957 (5.5%) | 1,689 (5.5%) |
| $55,000 to $64,999 | 4,072 (11.5%) | 2,421 (7.8%) |
| $65,000 to $74,999 | 3,642 (10.2%) | 2,383 (7.7%) |
| $75,000 to $99,999 | 4,443 (12.5%) | 2,065 (6.7%) |
| $100,000+ | 3,977 (11.2%) | 1,538 (5.0%) |
| Total | 35,560 (100.0%) | 30,904 (100.0%) |
Earnings by Sex by Educational Attainment in Sheboygan County
Average earnings in Sheboygan County are $56,458 for men and $39,967 for women, a difference of 29.2%. Men with an educational attainment of graduate degree enjoy the highest average annual earnings of $84,492, while those with less than high school education earn the least with $43,039. Women with an educational attainment of graduate degree earn the most with the average annual earnings of $70,504, while those with less than high school education have the smallest earnings of $27,177.
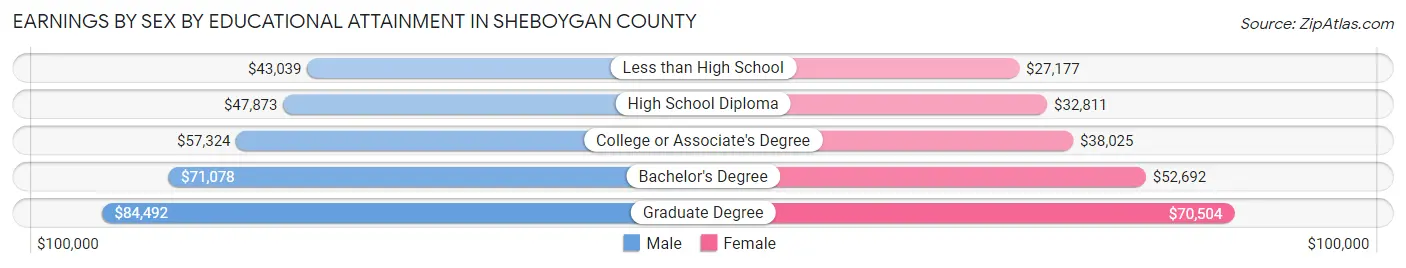
| Educational Attainment | Male Income | Female Income |
| Less than High School | $43,039 | $27,177 |
| High School Diploma | $47,873 | $32,811 |
| College or Associate's Degree | $57,324 | $38,025 |
| Bachelor's Degree | $71,078 | $52,692 |
| Graduate Degree | $84,492 | $70,504 |
| Total | $56,458 | $39,967 |
Family Income in Sheboygan County
Family Income Brackets in Sheboygan County
According to the Sheboygan County family income data, there are 6,905 families falling into the $100,000 to $149,999 income range, which is the most common income bracket and makes up 22.9% of all families. Conversely, the $10,000 to $14,999 income bracket is the least frequent group with only 181 families (0.6%) belonging to this category.
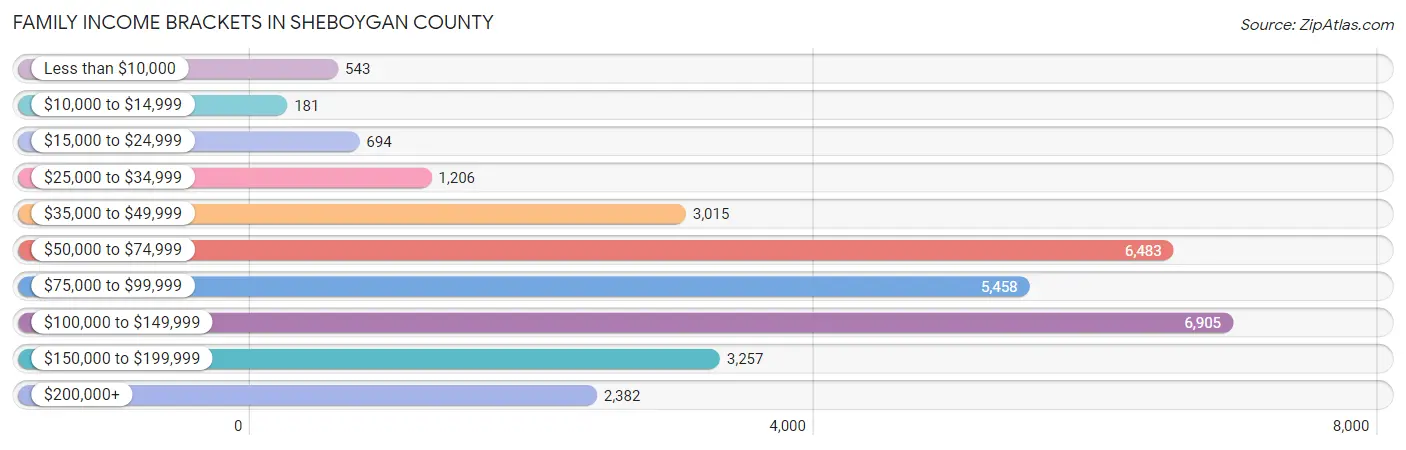
| Income Bracket | # Families | % Families |
| Less than $10,000 | 543 | 1.8% |
| $10,000 to $14,999 | 181 | 0.6% |
| $15,000 to $24,999 | 694 | 2.3% |
| $25,000 to $34,999 | 1,206 | 4.0% |
| $35,000 to $49,999 | 3,015 | 10.0% |
| $50,000 to $74,999 | 6,483 | 21.5% |
| $75,000 to $99,999 | 5,458 | 18.1% |
| $100,000 to $149,999 | 6,905 | 22.9% |
| $150,000 to $199,999 | 3,257 | 10.8% |
| $200,000+ | 2,382 | 7.9% |
Family Income by Famaliy Size in Sheboygan County
6-person families (819 | 2.7%) account for the highest median family income in Sheboygan County with $114,637 per family, while 2-person families (16,497 | 54.7%) have the highest median income of $38,651 per family member.
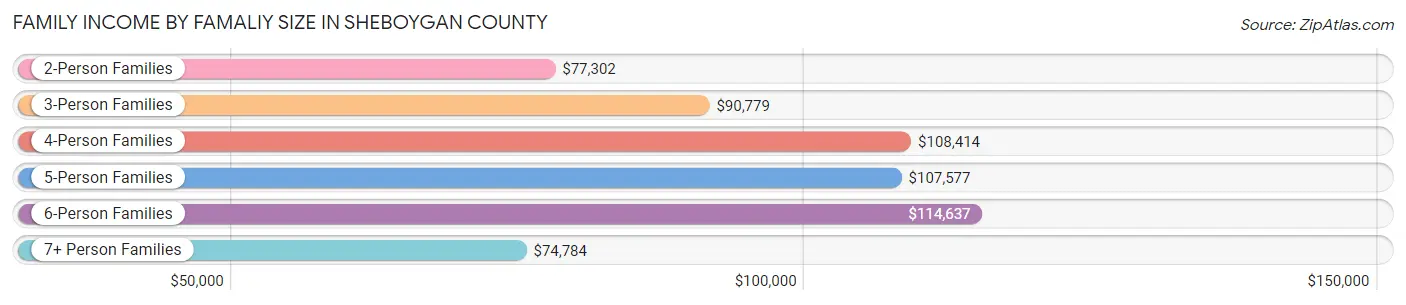
| Income Bracket | # Families | Median Income |
| 2-Person Families | 16,497 (54.7%) | $77,302 |
| 3-Person Families | 5,383 (17.8%) | $90,779 |
| 4-Person Families | 4,644 (15.4%) | $108,414 |
| 5-Person Families | 2,217 (7.3%) | $107,577 |
| 6-Person Families | 819 (2.7%) | $114,637 |
| 7+ Person Families | 593 (2.0%) | $74,784 |
| Total | 30,153 (100.0%) | $87,694 |
Family Income by Number of Earners in Sheboygan County
The median family income in Sheboygan County is $87,694, with families comprising 3+ earners (4,188) having the highest median family income of $136,978, while families with no earners (4,818) have the lowest median family income of $55,615, accounting for 13.9% and 16.0% of families, respectively.
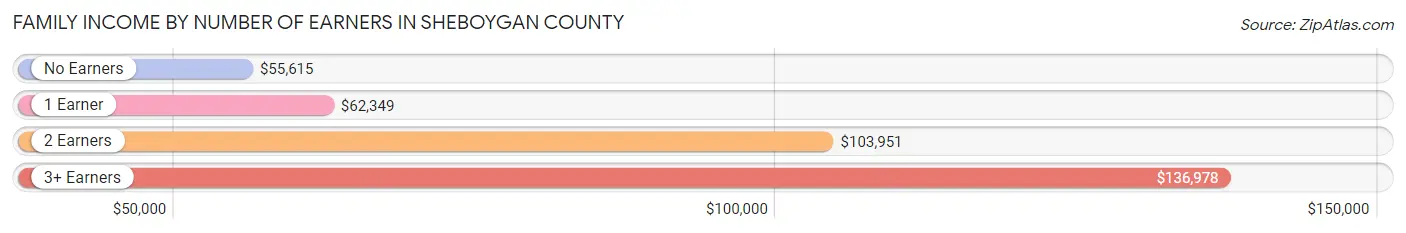
| Number of Earners | # Families | Median Income |
| No Earners | 4,818 (16.0%) | $55,615 |
| 1 Earner | 7,909 (26.2%) | $62,349 |
| 2 Earners | 13,238 (43.9%) | $103,951 |
| 3+ Earners | 4,188 (13.9%) | $136,978 |
| Total | 30,153 (100.0%) | $87,694 |
Household Income in Sheboygan County
Household Income Brackets in Sheboygan County
With 10,641 households falling in the category, the $50,000 to $74,999 income range is the most frequent in Sheboygan County, accounting for 21.7% of all households. In contrast, only 1,177 households (2.4%) fall into the $10,000 to $14,999 income bracket, making it the least populous group.
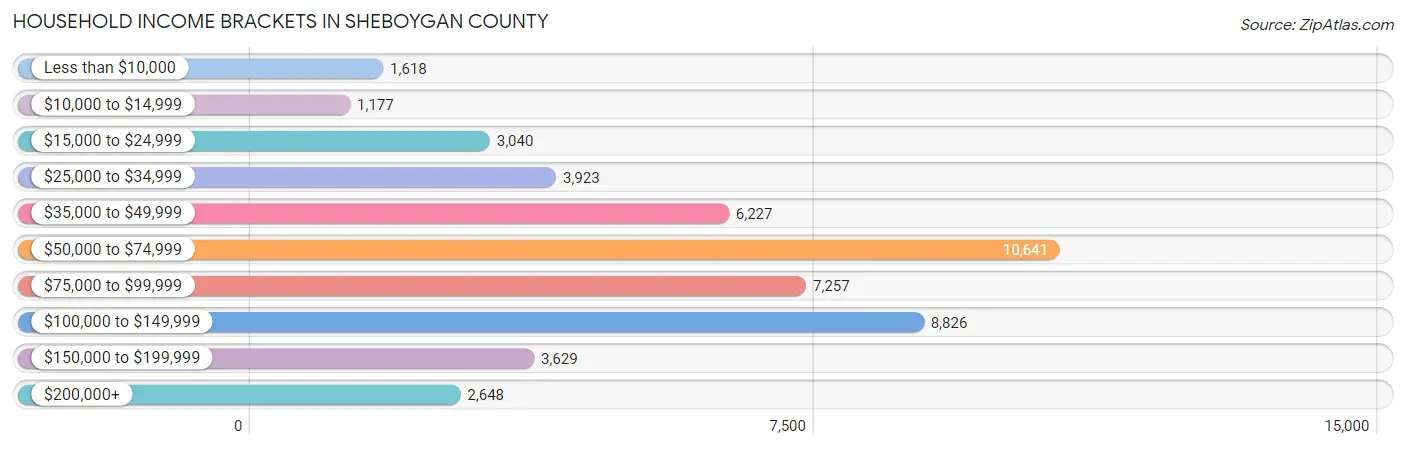
| Income Bracket | # Households | % Households |
| Less than $10,000 | 1,618 | 3.3% |
| $10,000 to $14,999 | 1,177 | 2.4% |
| $15,000 to $24,999 | 3,040 | 6.2% |
| $25,000 to $34,999 | 3,923 | 8.0% |
| $35,000 to $49,999 | 6,227 | 12.7% |
| $50,000 to $74,999 | 10,641 | 21.7% |
| $75,000 to $99,999 | 7,257 | 14.8% |
| $100,000 to $149,999 | 8,826 | 18.0% |
| $150,000 to $199,999 | 3,629 | 7.4% |
| $200,000+ | 2,648 | 5.4% |
Household Income by Householder Age in Sheboygan County
The median household income in Sheboygan County is $68,969, with the highest median household income of $85,314 found in the 45 to 64 years age bracket for the primary householder. A total of 18,582 households (37.9%) fall into this category. Meanwhile, the 15 to 24 years age bracket for the primary householder has the lowest median household income of $47,316, with 1,845 households (3.8%) in this group.
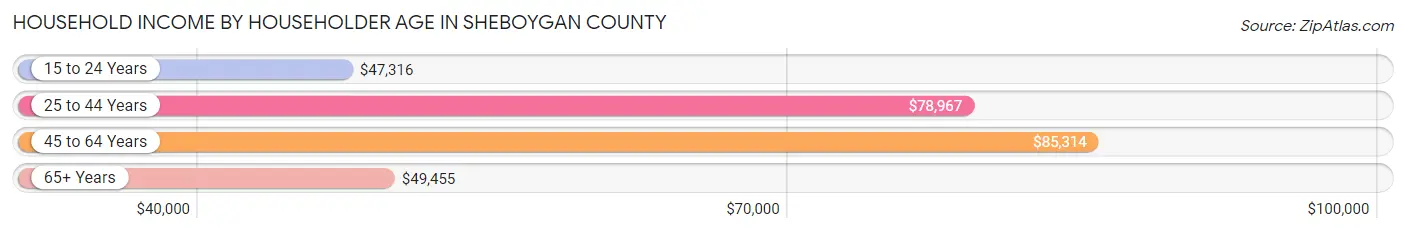
| Income Bracket | # Households | Median Income |
| 15 to 24 Years | 1,845 (3.8%) | $47,316 |
| 25 to 44 Years | 13,947 (28.4%) | $78,967 |
| 45 to 64 Years | 18,582 (37.9%) | $85,314 |
| 65+ Years | 14,661 (29.9%) | $49,455 |
| Total | 49,035 (100.0%) | $68,969 |
Poverty in Sheboygan County
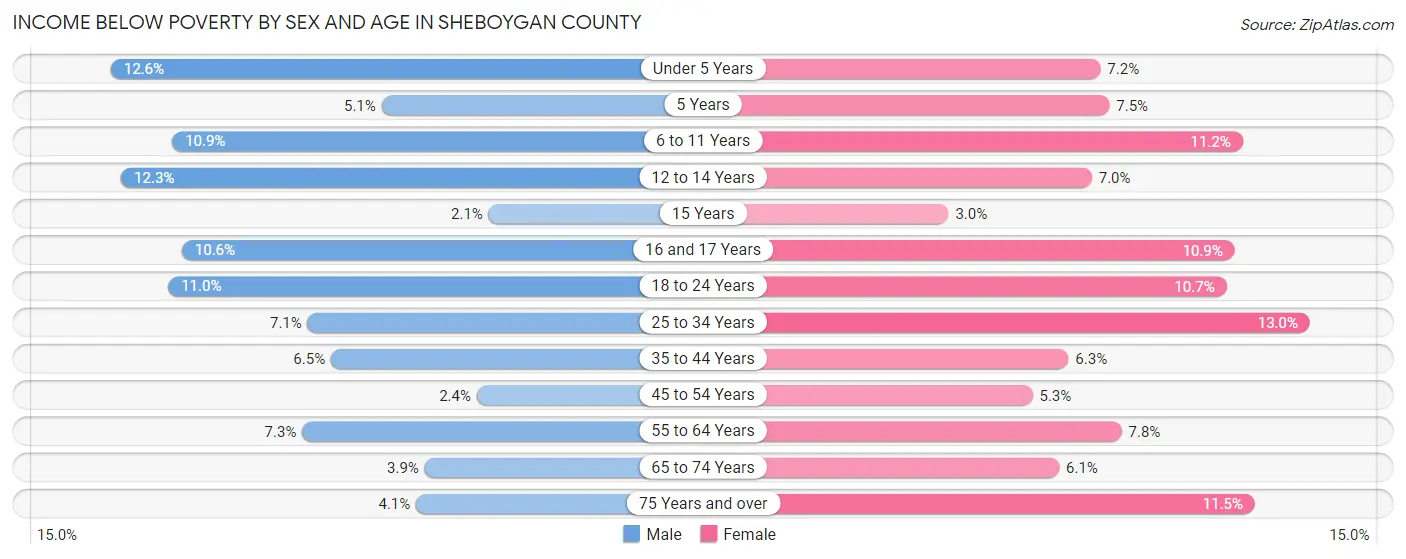
Income Below Poverty by Sex and Age in Sheboygan County
With 7.0% poverty level for males and 8.4% for females among the residents of Sheboygan County, under 5 year old males and 25 to 34 year old females are the most vulnerable to poverty, with 392 males (12.6%) and 825 females (13.0%) in their respective age groups living below the poverty level.
| Age Bracket | Male | Female |
| Under 5 Years | 392 (12.6%) | 224 (7.2%) |
| 5 Years | 36 (5.1%) | 60 (7.4%) |
| 6 to 11 Years | 456 (10.9%) | 420 (11.2%) |
| 12 to 14 Years | 289 (12.3%) | 166 (7.0%) |
| 15 Years | 18 (2.1%) | 25 (3.0%) |
| 16 and 17 Years | 170 (10.6%) | 155 (10.9%) |
| 18 to 24 Years | 543 (11.0%) | 478 (10.7%) |
| 25 to 34 Years | 477 (7.1%) | 825 (13.0%) |
| 35 to 44 Years | 468 (6.5%) | 433 (6.3%) |
| 45 to 54 Years | 179 (2.4%) | 373 (5.3%) |
| 55 to 64 Years | 629 (7.3%) | 662 (7.8%) |
| 65 to 74 Years | 245 (3.9%) | 398 (6.0%) |
| 75 Years and over | 147 (4.1%) | 549 (11.5%) |
| Total | 4,049 (7.0%) | 4,768 (8.4%) |
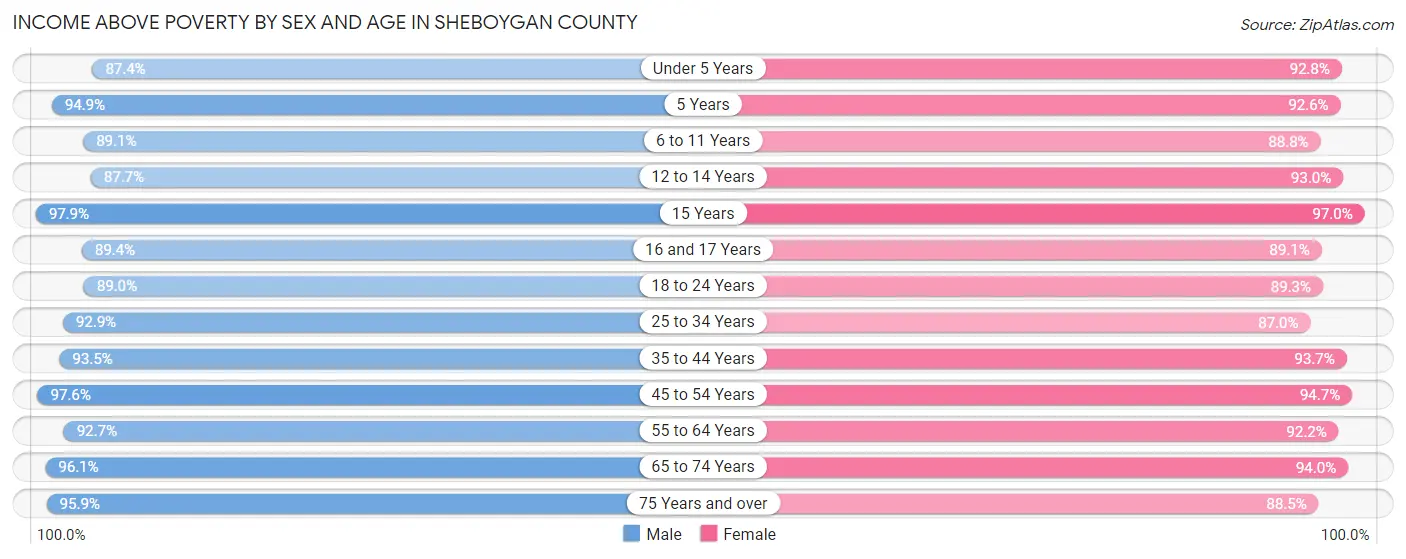
Income Above Poverty by Sex and Age in Sheboygan County
According to the poverty statistics in Sheboygan County, males aged 15 years and females aged 15 years are the age groups that are most secure financially, with 97.9% of males and 97.0% of females in these age groups living above the poverty line.
| Age Bracket | Male | Female |
| Under 5 Years | 2,718 (87.4%) | 2,885 (92.8%) |
| 5 Years | 675 (94.9%) | 745 (92.5%) |
| 6 to 11 Years | 3,730 (89.1%) | 3,342 (88.8%) |
| 12 to 14 Years | 2,058 (87.7%) | 2,219 (93.0%) |
| 15 Years | 848 (97.9%) | 817 (97.0%) |
| 16 and 17 Years | 1,431 (89.4%) | 1,262 (89.1%) |
| 18 to 24 Years | 4,395 (89.0%) | 3,985 (89.3%) |
| 25 to 34 Years | 6,227 (92.9%) | 5,507 (87.0%) |
| 35 to 44 Years | 6,770 (93.5%) | 6,431 (93.7%) |
| 45 to 54 Years | 7,257 (97.6%) | 6,653 (94.7%) |
| 55 to 64 Years | 8,025 (92.7%) | 7,835 (92.2%) |
| 65 to 74 Years | 6,109 (96.1%) | 6,183 (94.0%) |
| 75 Years and over | 3,442 (95.9%) | 4,223 (88.5%) |
| Total | 53,685 (93.0%) | 52,087 (91.6%) |
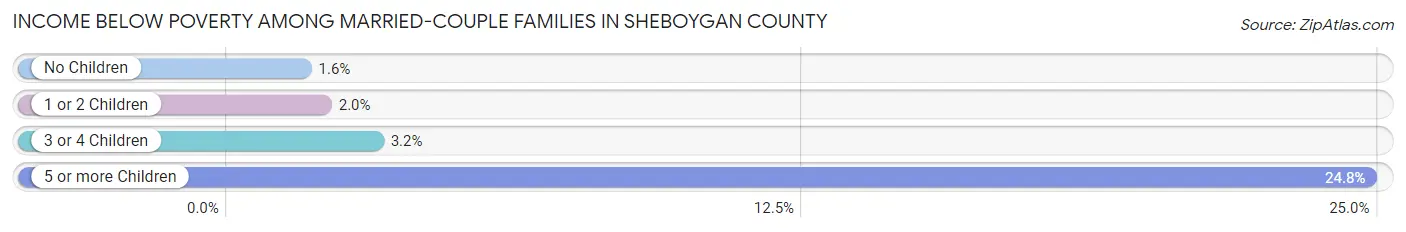
Income Below Poverty Among Married-Couple Families in Sheboygan County
The poverty statistics for married-couple families in Sheboygan County show that 2.2% or 533 of the total 24,401 families live below the poverty line. Families with 5 or more children have the highest poverty rate of 24.8%, comprising of 89 families. On the other hand, families with no children have the lowest poverty rate of 1.6%, which includes 258 families.
| Children | Above Poverty | Below Poverty |
| No Children | 15,845 (98.4%) | 258 (1.6%) |
| 1 or 2 Children | 5,704 (98.0%) | 119 (2.0%) |
| 3 or 4 Children | 2,049 (96.8%) | 67 (3.2%) |
| 5 or more Children | 270 (75.2%) | 89 (24.8%) |
| Total | 23,868 (97.8%) | 533 (2.2%) |
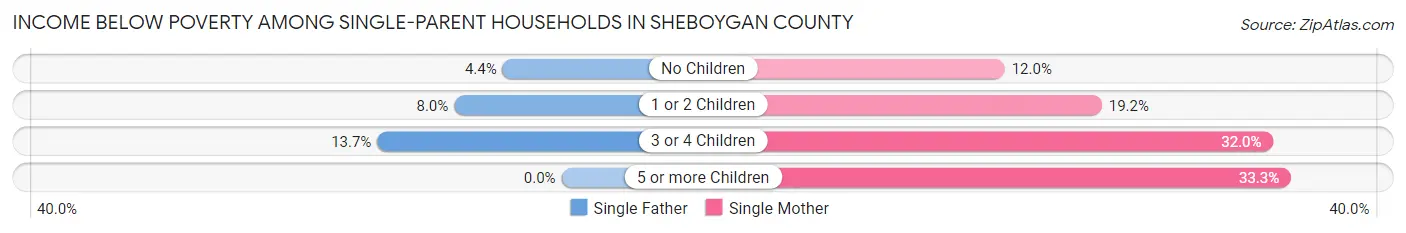
Income Below Poverty Among Single-Parent Households in Sheboygan County
According to the poverty data in Sheboygan County, 7.0% or 126 single-father households and 18.9% or 747 single-mother households are living below the poverty line. Among single-father households, those with 3 or 4 children have the highest poverty rate, with 14 households (13.7%) experiencing poverty. Likewise, among single-mother households, those with 5 or more children have the highest poverty rate, with 16 households (33.3%) falling below the poverty line.
| Children | Single Father | Single Mother |
| No Children | 27 (4.4%) | 144 (12.0%) |
| 1 or 2 Children | 85 (8.0%) | 418 (19.2%) |
| 3 or 4 Children | 14 (13.7%) | 169 (32.0%) |
| 5 or more Children | 0 (0.0%) | 16 (33.3%) |
| Total | 126 (7.0%) | 747 (18.9%) |
Income Below Poverty Among Married-Couple vs Single-Parent Households in Sheboygan County
The poverty data for Sheboygan County shows that 533 of the married-couple family households (2.2%) and 873 of the single-parent households (15.2%) are living below the poverty level. Within the married-couple family households, those with 5 or more children have the highest poverty rate, with 89 households (24.8%) falling below the poverty line. Among the single-parent households, those with 3 or 4 children have the highest poverty rate, with 183 household (29.0%) living below poverty.
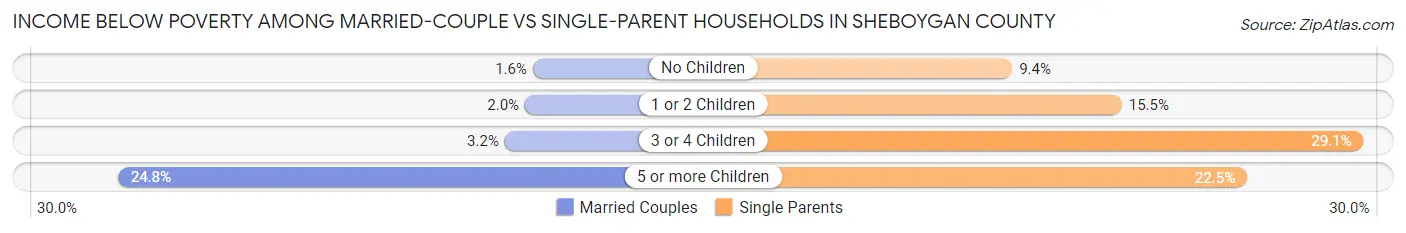
| Children | Married-Couple Families | Single-Parent Households |
| No Children | 258 (1.6%) | 171 (9.4%) |
| 1 or 2 Children | 119 (2.0%) | 503 (15.5%) |
| 3 or 4 Children | 67 (3.2%) | 183 (29.0%) |
| 5 or more Children | 89 (24.8%) | 16 (22.5%) |
| Total | 533 (2.2%) | 873 (15.2%) |
Employment Characteristics in Sheboygan County
Employment by Class of Employer in Sheboygan County
Among the 60,282 employed individuals in Sheboygan County, private company employees (45,317 | 75.2%), not-for-profit organizations (4,611 | 7.6%), and local government employees (4,148 | 6.9%) make up the most common classes of employment.
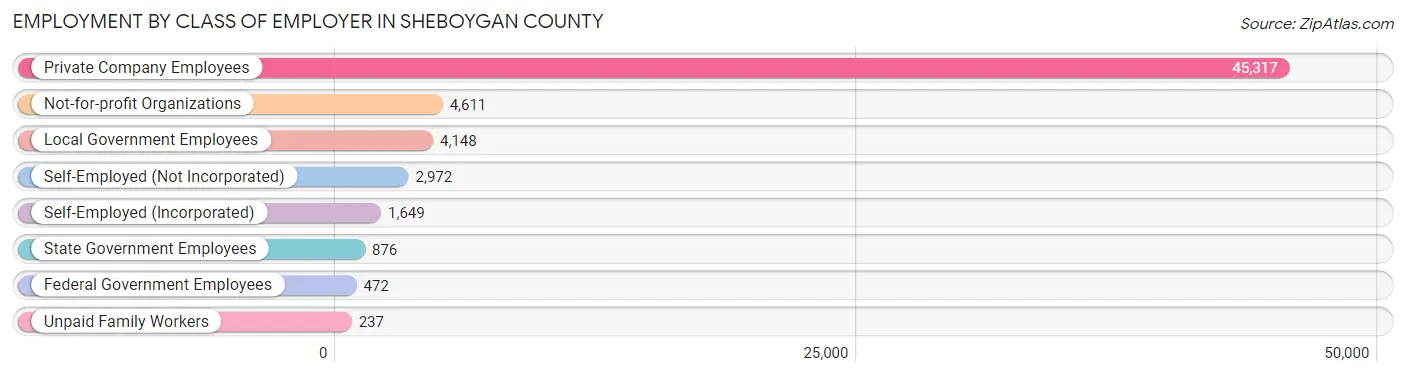
| Employer Class | # Employees | % Employees |
| Private Company Employees | 45,317 | 75.2% |
| Self-Employed (Incorporated) | 1,649 | 2.7% |
| Self-Employed (Not Incorporated) | 2,972 | 4.9% |
| Not-for-profit Organizations | 4,611 | 7.6% |
| Local Government Employees | 4,148 | 6.9% |
| State Government Employees | 876 | 1.5% |
| Federal Government Employees | 472 | 0.8% |
| Unpaid Family Workers | 237 | 0.4% |
| Total | 60,282 | 100.0% |
Employment Status by Age in Sheboygan County
According to the labor force statistics for Sheboygan County, out of the total population over 16 years of age (95,238), 66.0% or 62,857 individuals are in the labor force, with 2.8% or 1,760 of them unemployed. The age group with the highest labor force participation rate is 45 to 54 years, with 88.7% or 13,076 individuals in the labor force. Within the labor force, the 16 to 19 years age range has the highest percentage of unemployed individuals, with 7.7% or 251 of them being unemployed.
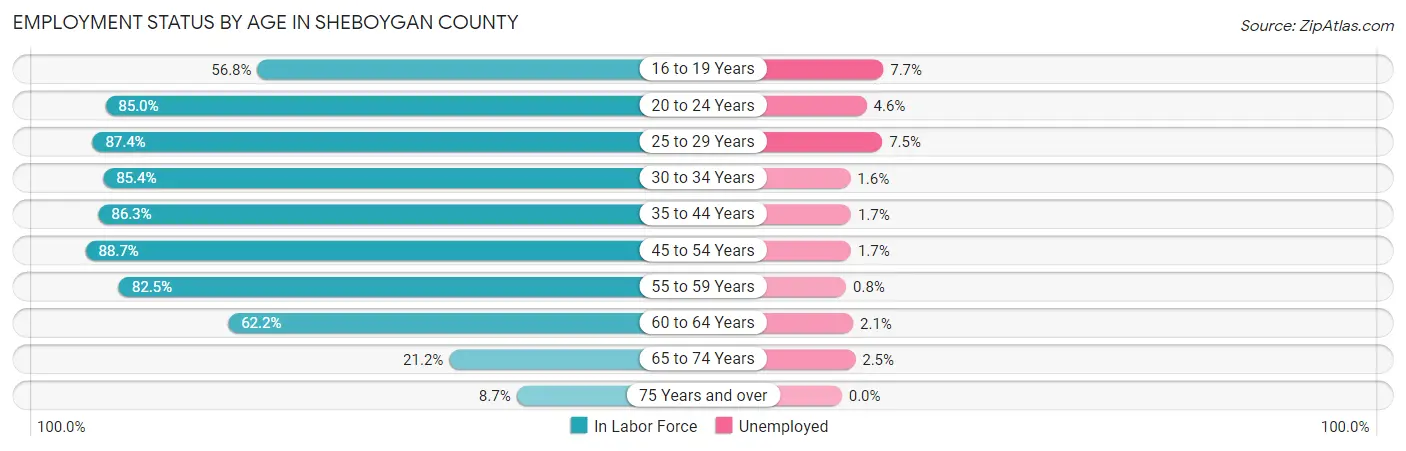
| Age Bracket | In Labor Force | Unemployed |
| 16 to 19 Years | 3,265 (56.8%) | 251 (7.7%) |
| 20 to 24 Years | 6,240 (85.0%) | 287 (4.6%) |
| 25 to 29 Years | 6,156 (87.4%) | 462 (7.5%) |
| 30 to 34 Years | 5,518 (85.4%) | 88 (1.6%) |
| 35 to 44 Years | 12,546 (86.3%) | 213 (1.7%) |
| 45 to 54 Years | 13,076 (88.7%) | 222 (1.7%) |
| 55 to 59 Years | 6,898 (82.5%) | 55 (0.8%) |
| 60 to 64 Years | 5,592 (62.2%) | 117 (2.1%) |
| 65 to 74 Years | 2,781 (21.2%) | 70 (2.5%) |
| 75 Years and over | 774 (8.7%) | 0 (0.0%) |
| Total | 62,857 (66.0%) | 1,760 (2.8%) |
Employment Status by Educational Attainment in Sheboygan County
According to labor force statistics for Sheboygan County, 82.8% of individuals (49,793) out of the total population between 25 and 64 years of age (60,136) are in the labor force, with 2.3% or 1,145 of them being unemployed. The group with the highest labor force participation rate are those with the educational attainment of bachelor's degree or higher, with 89.1% or 15,466 individuals in the labor force. Within the labor force, individuals with high school diploma education have the highest percentage of unemployment, with 4.3% or 621 of them being unemployed.
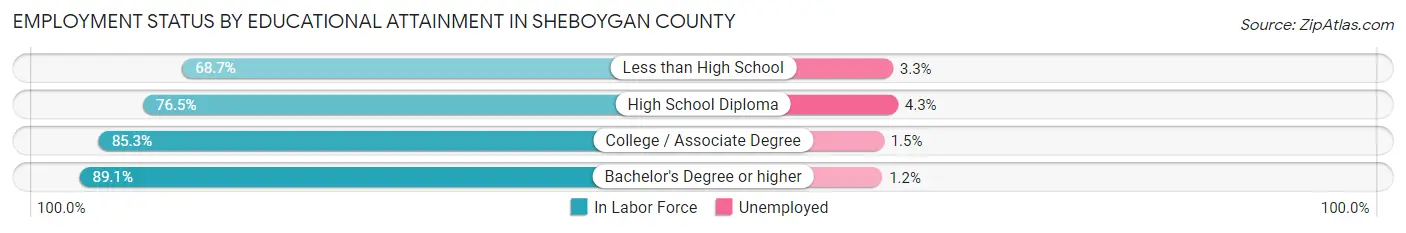
| Educational Attainment | In Labor Force | Unemployed |
| Less than High School | 2,096 (68.7%) | 101 (3.3%) |
| High School Diploma | 14,440 (76.5%) | 812 (4.3%) |
| College / Associate Degree | 17,786 (85.3%) | 313 (1.5%) |
| Bachelor's Degree or higher | 15,466 (89.1%) | 208 (1.2%) |
| Total | 49,793 (82.8%) | 1,383 (2.3%) |
Employment Occupations by Sex in Sheboygan County
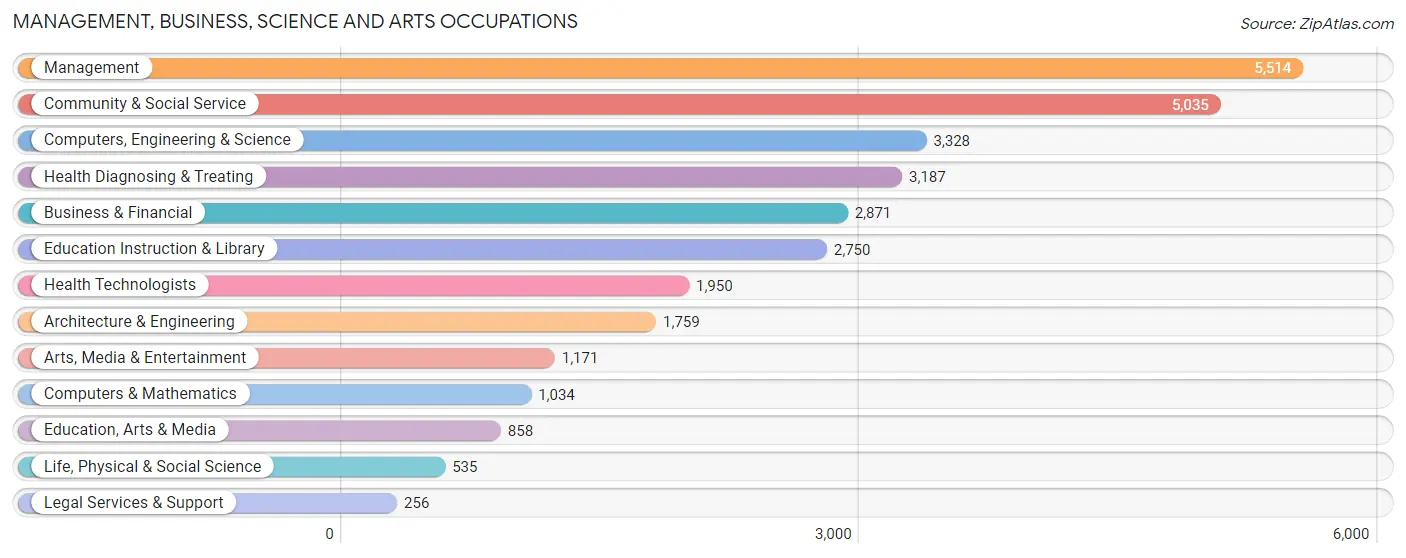
Management, Business, Science and Arts Occupations
The most common Management, Business, Science and Arts occupations in Sheboygan County are Management (5,514 | 9.0%), Community & Social Service (5,035 | 8.3%), Computers, Engineering & Science (3,328 | 5.4%), Health Diagnosing & Treating (3,187 | 5.2%), and Business & Financial (2,871 | 4.7%).
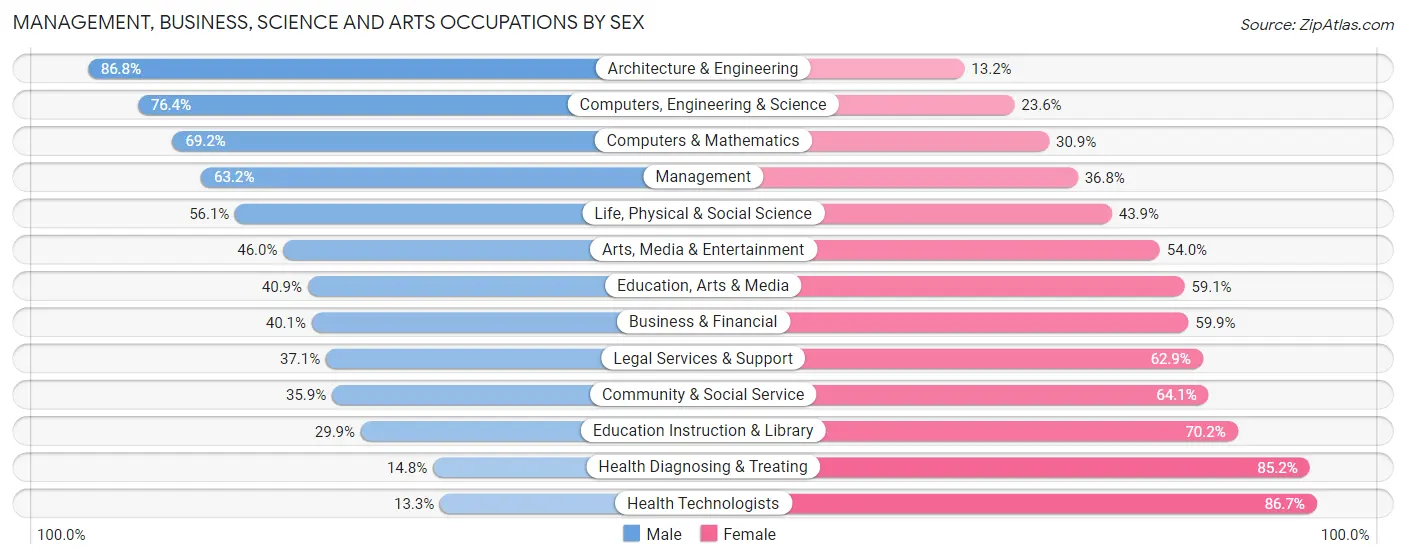
Management, Business, Science and Arts Occupations by Sex
Within the Management, Business, Science and Arts occupations in Sheboygan County, the most male-oriented occupations are Architecture & Engineering (86.8%), Computers, Engineering & Science (76.4%), and Computers & Mathematics (69.2%), while the most female-oriented occupations are Health Technologists (86.7%), Health Diagnosing & Treating (85.2%), and Education Instruction & Library (70.2%).
| Occupation | Male | Female |
| Management | 3,484 (63.2%) | 2,030 (36.8%) |
| Business & Financial | 1,151 (40.1%) | 1,720 (59.9%) |
| Computers, Engineering & Science | 2,542 (76.4%) | 786 (23.6%) |
| Computers & Mathematics | 715 (69.2%) | 319 (30.8%) |
| Architecture & Engineering | 1,527 (86.8%) | 232 (13.2%) |
| Life, Physical & Social Science | 300 (56.1%) | 235 (43.9%) |
| Community & Social Service | 1,806 (35.9%) | 3,229 (64.1%) |
| Education, Arts & Media | 351 (40.9%) | 507 (59.1%) |
| Legal Services & Support | 95 (37.1%) | 161 (62.9%) |
| Education Instruction & Library | 821 (29.8%) | 1,929 (70.2%) |
| Arts, Media & Entertainment | 539 (46.0%) | 632 (54.0%) |
| Health Diagnosing & Treating | 472 (14.8%) | 2,715 (85.2%) |
| Health Technologists | 260 (13.3%) | 1,690 (86.7%) |
| Total (Category) | 9,455 (47.4%) | 10,480 (52.6%) |
| Total (Overall) | 32,683 (53.5%) | 28,379 (46.5%) |
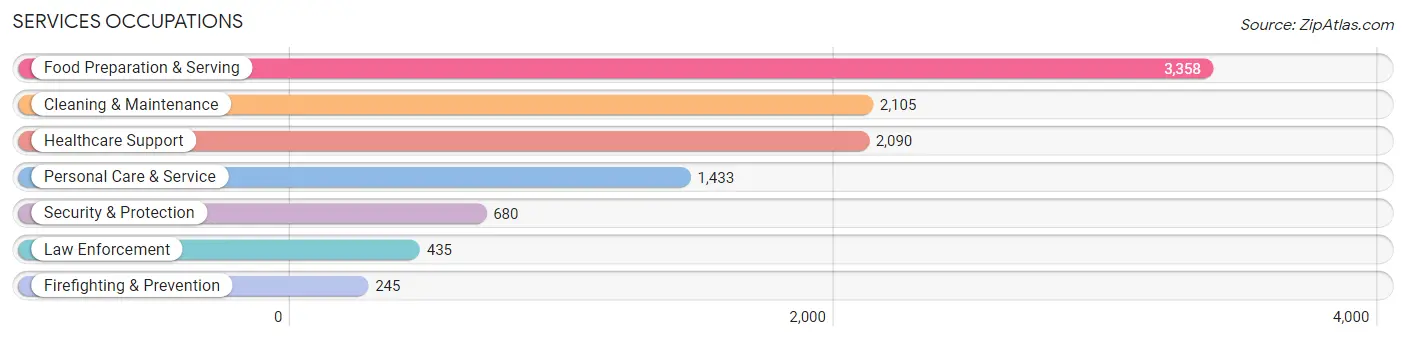
Services Occupations
The most common Services occupations in Sheboygan County are Food Preparation & Serving (3,358 | 5.5%), Cleaning & Maintenance (2,105 | 3.5%), Healthcare Support (2,090 | 3.4%), Personal Care & Service (1,433 | 2.4%), and Security & Protection (680 | 1.1%).
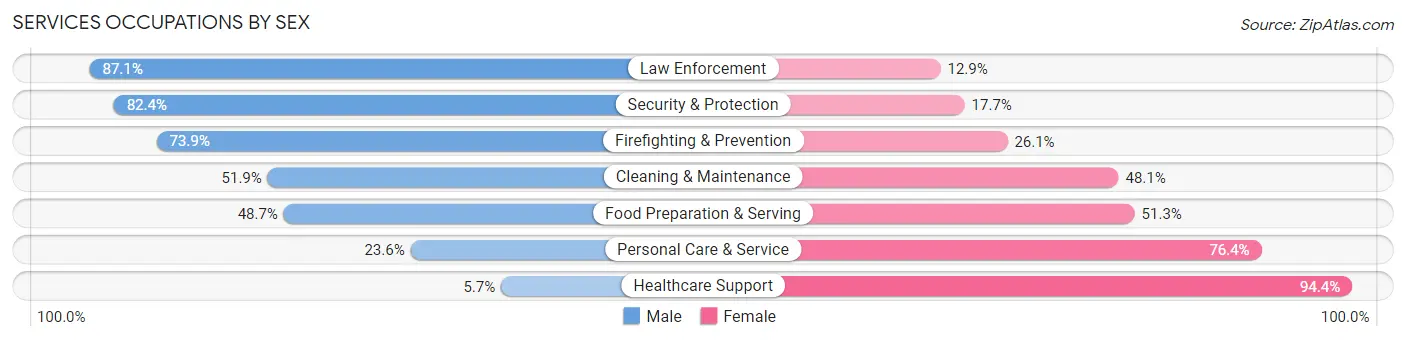
Services Occupations by Sex
Within the Services occupations in Sheboygan County, the most male-oriented occupations are Law Enforcement (87.1%), Security & Protection (82.4%), and Firefighting & Prevention (73.9%), while the most female-oriented occupations are Healthcare Support (94.4%), Personal Care & Service (76.4%), and Food Preparation & Serving (51.3%).
| Occupation | Male | Female |
| Healthcare Support | 118 (5.7%) | 1,972 (94.4%) |
| Security & Protection | 560 (82.4%) | 120 (17.6%) |
| Firefighting & Prevention | 181 (73.9%) | 64 (26.1%) |
| Law Enforcement | 379 (87.1%) | 56 (12.9%) |
| Food Preparation & Serving | 1,635 (48.7%) | 1,723 (51.3%) |
| Cleaning & Maintenance | 1,092 (51.9%) | 1,013 (48.1%) |
| Personal Care & Service | 338 (23.6%) | 1,095 (76.4%) |
| Total (Category) | 3,743 (38.7%) | 5,923 (61.3%) |
| Total (Overall) | 32,683 (53.5%) | 28,379 (46.5%) |
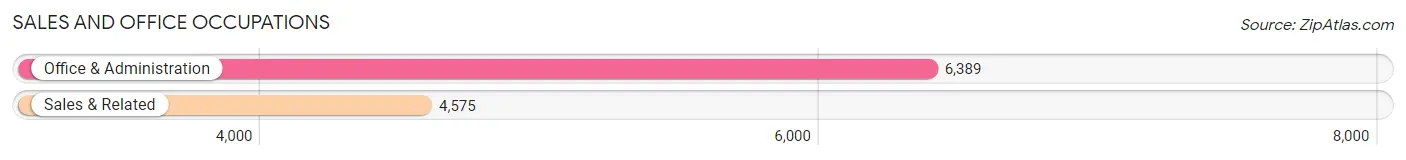
Sales and Office Occupations
The most common Sales and Office occupations in Sheboygan County are Office & Administration (6,389 | 10.5%), and Sales & Related (4,575 | 7.5%).
Sales and Office Occupations by Sex
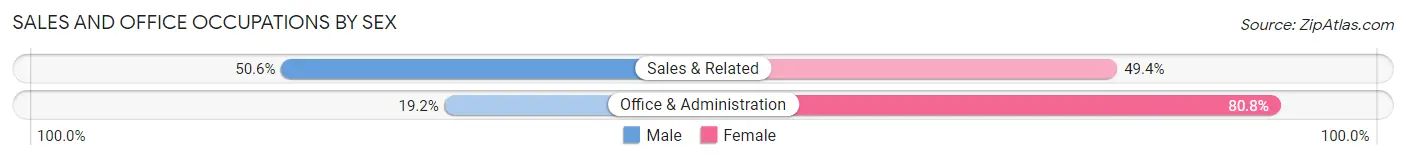
| Occupation | Male | Female |
| Sales & Related | 2,317 (50.6%) | 2,258 (49.4%) |
| Office & Administration | 1,229 (19.2%) | 5,160 (80.8%) |
| Total (Category) | 3,546 (32.3%) | 7,418 (67.7%) |
| Total (Overall) | 32,683 (53.5%) | 28,379 (46.5%) |
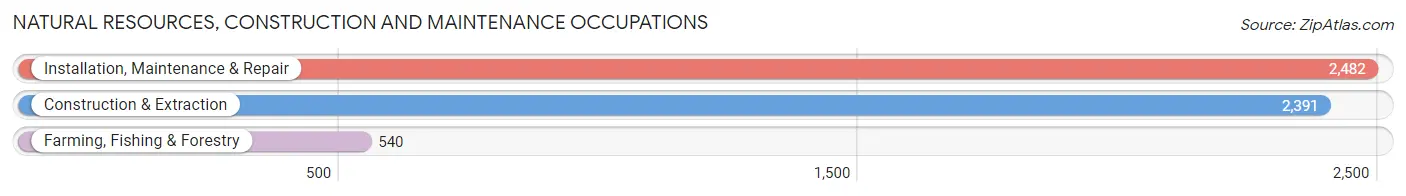
Natural Resources, Construction and Maintenance Occupations
The most common Natural Resources, Construction and Maintenance occupations in Sheboygan County are Installation, Maintenance & Repair (2,482 | 4.1%), Construction & Extraction (2,391 | 3.9%), and Farming, Fishing & Forestry (540 | 0.9%).
Natural Resources, Construction and Maintenance Occupations by Sex
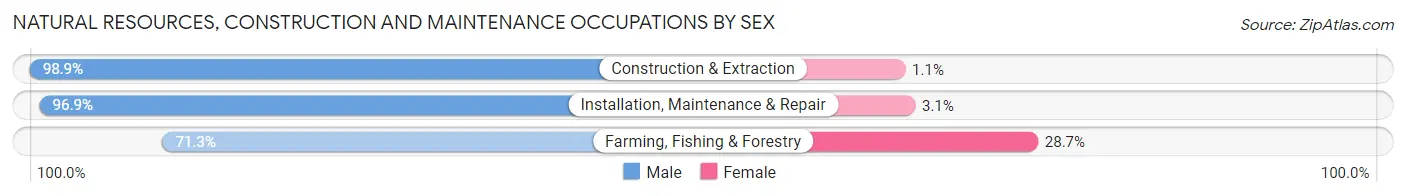
| Occupation | Male | Female |
| Farming, Fishing & Forestry | 385 (71.3%) | 155 (28.7%) |
| Construction & Extraction | 2,365 (98.9%) | 26 (1.1%) |
| Installation, Maintenance & Repair | 2,404 (96.9%) | 78 (3.1%) |
| Total (Category) | 5,154 (95.2%) | 259 (4.8%) |
| Total (Overall) | 32,683 (53.5%) | 28,379 (46.5%) |
Production, Transportation and Moving Occupations
The most common Production, Transportation and Moving occupations in Sheboygan County are Production (9,133 | 15.0%), Material Moving (4,156 | 6.8%), and Transportation (1,795 | 2.9%).
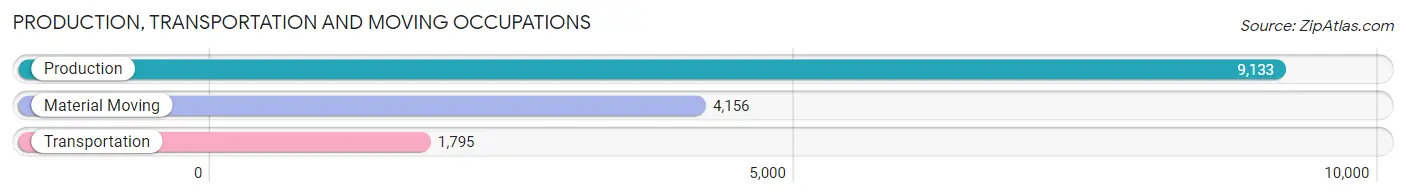
Production, Transportation and Moving Occupations by Sex
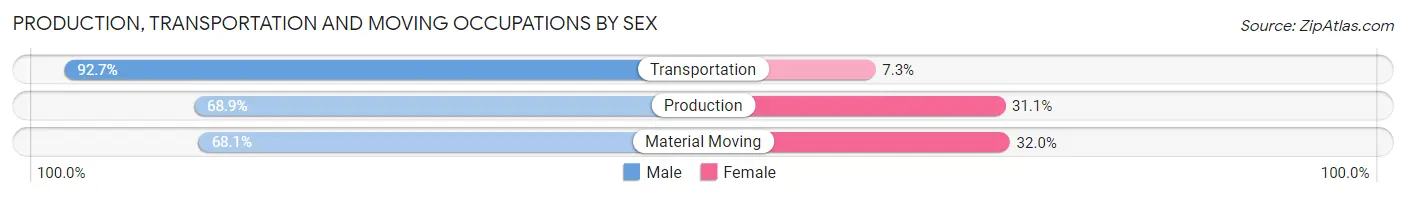
| Occupation | Male | Female |
| Production | 6,293 (68.9%) | 2,840 (31.1%) |
| Transportation | 1,664 (92.7%) | 131 (7.3%) |
| Material Moving | 2,828 (68.0%) | 1,328 (32.0%) |
| Total (Category) | 10,785 (71.5%) | 4,299 (28.5%) |
| Total (Overall) | 32,683 (53.5%) | 28,379 (46.5%) |
Employment Industries by Sex in Sheboygan County
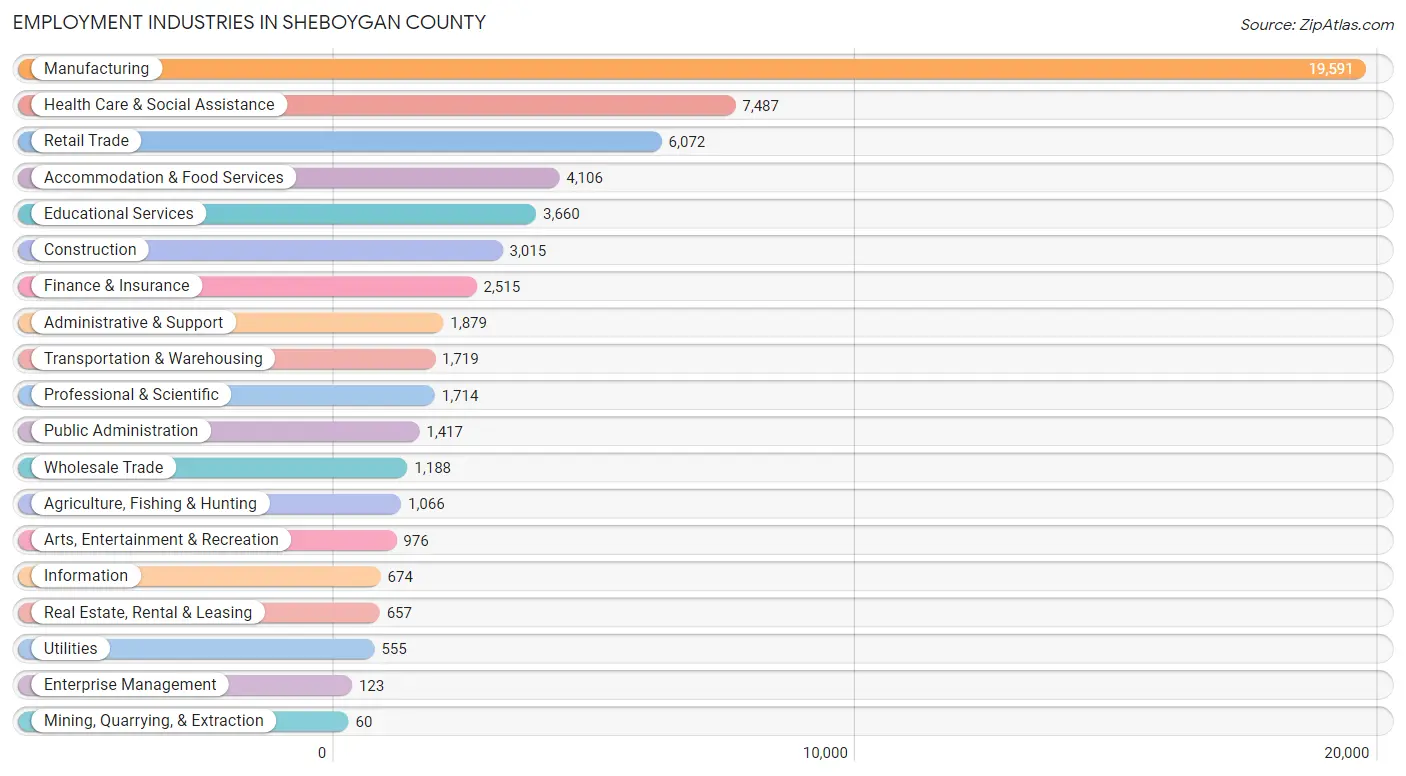
Employment Industries in Sheboygan County
The major employment industries in Sheboygan County include Manufacturing (19,591 | 32.1%), Health Care & Social Assistance (7,487 | 12.3%), Retail Trade (6,072 | 9.9%), Accommodation & Food Services (4,106 | 6.7%), and Educational Services (3,660 | 6.0%).
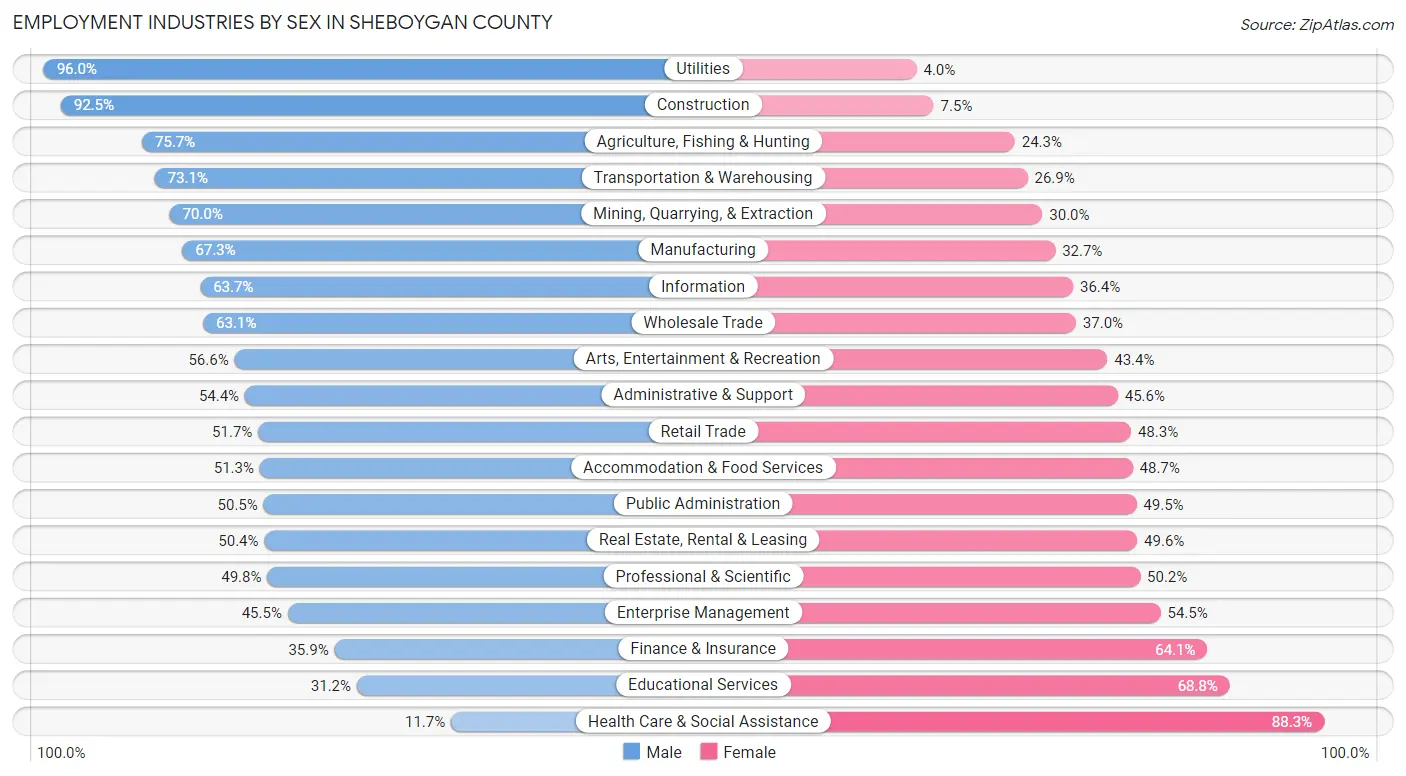
Employment Industries by Sex in Sheboygan County
The Sheboygan County industries that see more men than women are Utilities (96.0%), Construction (92.5%), and Agriculture, Fishing & Hunting (75.7%), whereas the industries that tend to have a higher number of women are Health Care & Social Assistance (88.3%), Educational Services (68.8%), and Finance & Insurance (64.1%).
| Industry | Male | Female |
| Agriculture, Fishing & Hunting | 807 (75.7%) | 259 (24.3%) |
| Mining, Quarrying, & Extraction | 42 (70.0%) | 18 (30.0%) |
| Construction | 2,789 (92.5%) | 226 (7.5%) |
| Manufacturing | 13,193 (67.3%) | 6,398 (32.7%) |
| Wholesale Trade | 749 (63.0%) | 439 (36.9%) |
| Retail Trade | 3,137 (51.7%) | 2,935 (48.3%) |
| Transportation & Warehousing | 1,256 (73.1%) | 463 (26.9%) |
| Utilities | 533 (96.0%) | 22 (4.0%) |
| Information | 429 (63.6%) | 245 (36.3%) |
| Finance & Insurance | 902 (35.9%) | 1,613 (64.1%) |
| Real Estate, Rental & Leasing | 331 (50.4%) | 326 (49.6%) |
| Professional & Scientific | 853 (49.8%) | 861 (50.2%) |
| Enterprise Management | 56 (45.5%) | 67 (54.5%) |
| Administrative & Support | 1,022 (54.4%) | 857 (45.6%) |
| Educational Services | 1,143 (31.2%) | 2,517 (68.8%) |
| Health Care & Social Assistance | 878 (11.7%) | 6,609 (88.3%) |
| Arts, Entertainment & Recreation | 552 (56.6%) | 424 (43.4%) |
| Accommodation & Food Services | 2,107 (51.3%) | 1,999 (48.7%) |
| Public Administration | 716 (50.5%) | 701 (49.5%) |
| Total | 32,683 (53.5%) | 28,379 (46.5%) |
Education in Sheboygan County
School Enrollment in Sheboygan County
The most common levels of schooling among the 26,232 students in Sheboygan County are high school (6,173 | 23.5%), middle school (6,008 | 22.9%), and elementary school (5,546 | 21.1%).
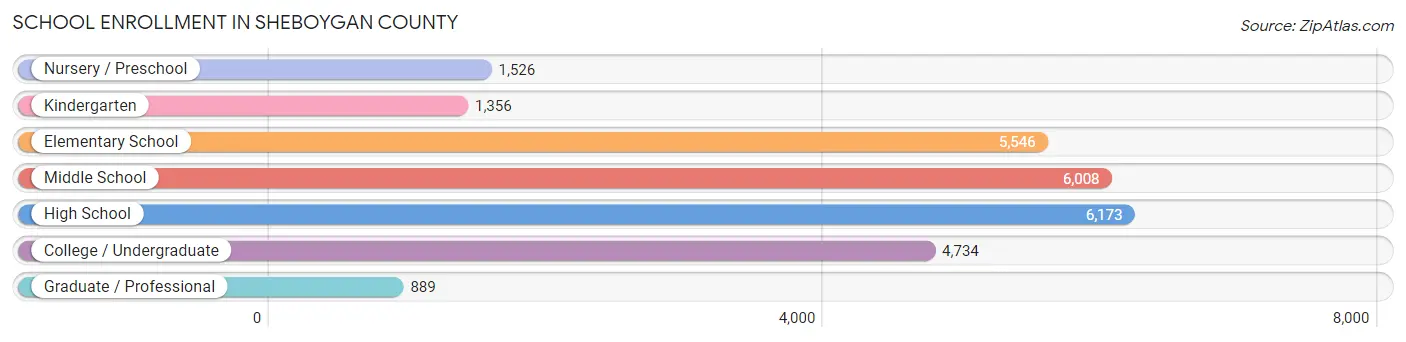
| School Level | # Students | % Students |
| Nursery / Preschool | 1,526 | 5.8% |
| Kindergarten | 1,356 | 5.2% |
| Elementary School | 5,546 | 21.1% |
| Middle School | 6,008 | 22.9% |
| High School | 6,173 | 23.5% |
| College / Undergraduate | 4,734 | 18.0% |
| Graduate / Professional | 889 | 3.4% |
| Total | 26,232 | 100.0% |
School Enrollment by Age by Funding Source in Sheboygan County
Out of a total of 26,232 students who are enrolled in schools in Sheboygan County, 5,220 (19.9%) attend a private institution, while the remaining 21,012 (80.1%) are enrolled in public schools. The age group of 20 to 24 year olds has the highest likelihood of being enrolled in private schools, with 882 (42.6% in the age bracket) enrolled. Conversely, the age group of 15 to 17 year olds has the lowest likelihood of being enrolled in a private school, with 4,116 (88.4% in the age bracket) attending a public institution.
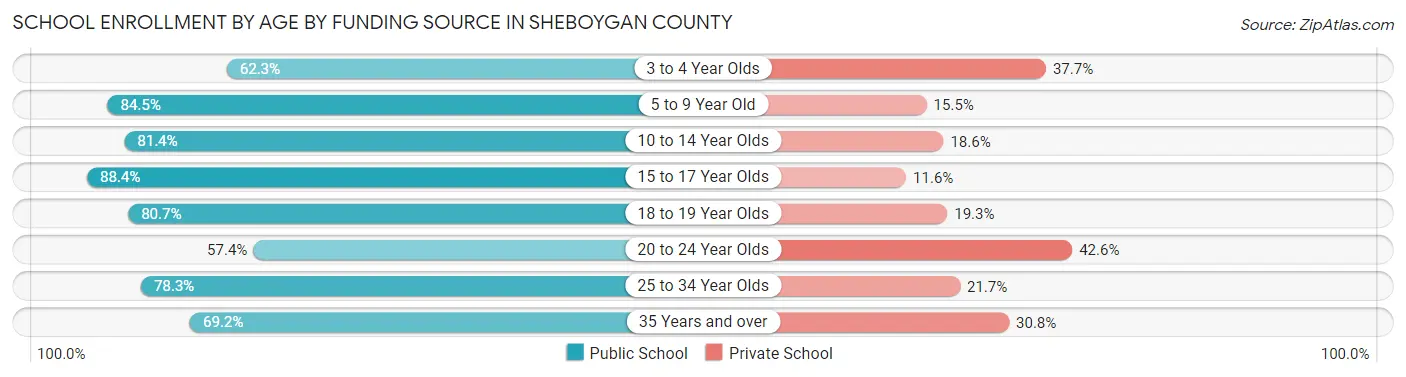
| Age Bracket | Public School | Private School |
| 3 to 4 Year Olds | 559 (62.3%) | 338 (37.7%) |
| 5 to 9 Year Old | 5,663 (84.5%) | 1,036 (15.5%) |
| 10 to 14 Year Olds | 6,031 (81.4%) | 1,377 (18.6%) |
| 15 to 17 Year Olds | 4,116 (88.4%) | 542 (11.6%) |
| 18 to 19 Year Olds | 1,517 (80.7%) | 363 (19.3%) |
| 20 to 24 Year Olds | 1,190 (57.4%) | 882 (42.6%) |
| 25 to 34 Year Olds | 968 (78.3%) | 268 (21.7%) |
| 35 Years and over | 956 (69.2%) | 426 (30.8%) |
| Total | 21,012 (80.1%) | 5,220 (19.9%) |
Educational Attainment by Field of Study in Sheboygan County
Business (5,278 | 22.0%), education (3,722 | 15.5%), science & technology (2,550 | 10.6%), engineering (1,682 | 7.0%), and social sciences (1,506 | 6.3%) are the most common fields of study among 24,046 individuals in Sheboygan County who have obtained a bachelor's degree or higher.
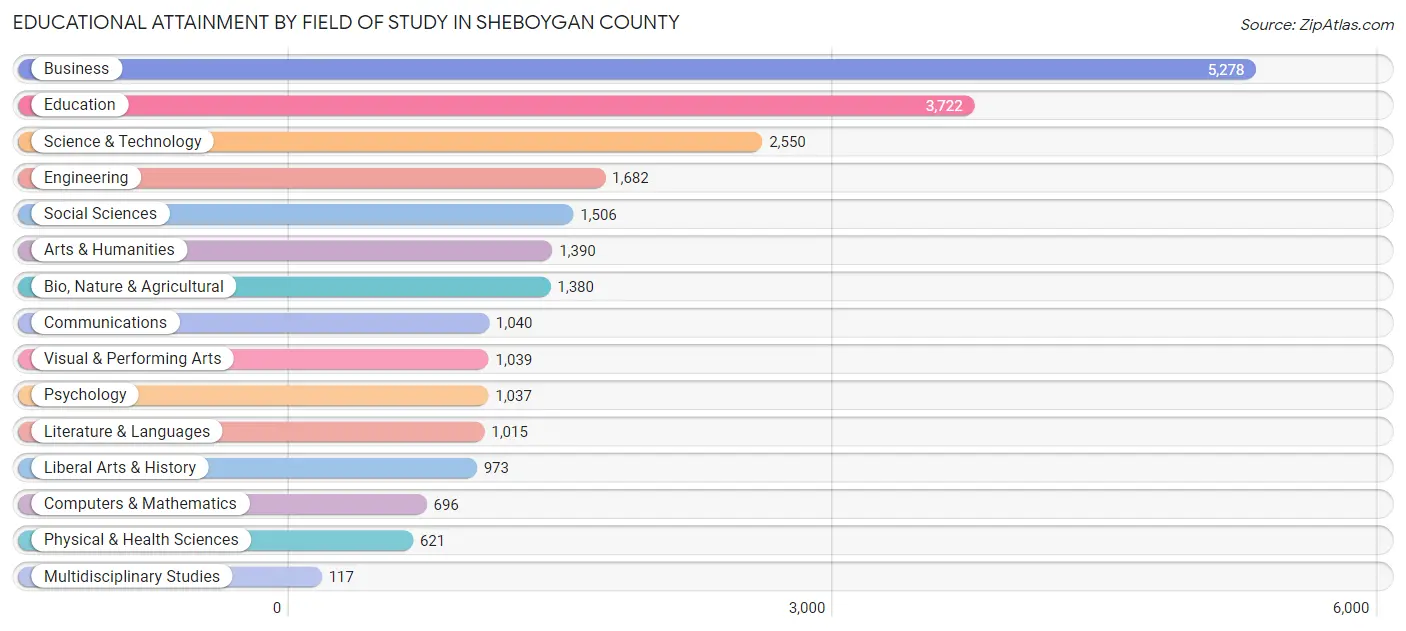
| Field of Study | # Graduates | % Graduates |
| Computers & Mathematics | 696 | 2.9% |
| Bio, Nature & Agricultural | 1,380 | 5.7% |
| Physical & Health Sciences | 621 | 2.6% |
| Psychology | 1,037 | 4.3% |
| Social Sciences | 1,506 | 6.3% |
| Engineering | 1,682 | 7.0% |
| Multidisciplinary Studies | 117 | 0.5% |
| Science & Technology | 2,550 | 10.6% |
| Business | 5,278 | 22.0% |
| Education | 3,722 | 15.5% |
| Literature & Languages | 1,015 | 4.2% |
| Liberal Arts & History | 973 | 4.1% |
| Visual & Performing Arts | 1,039 | 4.3% |
| Communications | 1,040 | 4.3% |
| Arts & Humanities | 1,390 | 5.8% |
| Total | 24,046 | 100.0% |
Transportation & Commute in Sheboygan County
Vehicle Availability by Sex in Sheboygan County
The most prevalent vehicle ownership categories in Sheboygan County are males with 2 vehicles (14,442, accounting for 44.9%) and females with 2 vehicles (12,497, making up 52.0%).
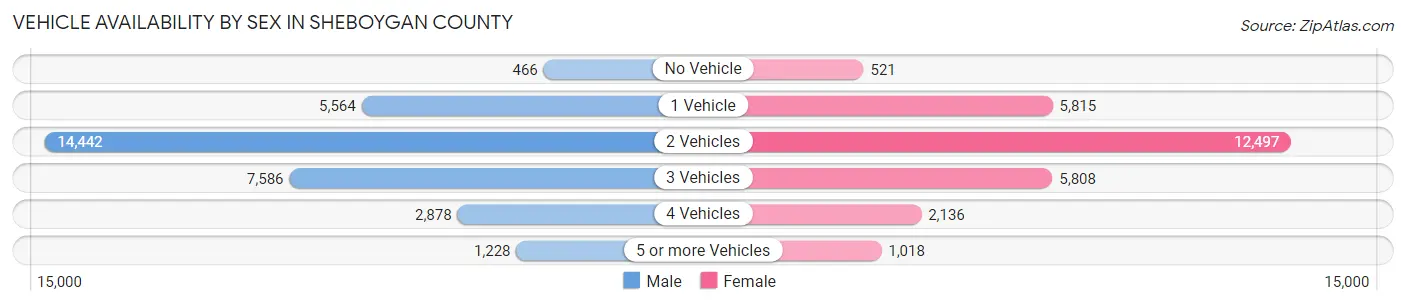
| Vehicles Available | Male | Female |
| No Vehicle | 466 (1.5%) | 521 (1.9%) |
| 1 Vehicle | 5,564 (17.3%) | 5,815 (20.9%) |
| 2 Vehicles | 14,442 (44.9%) | 12,497 (45.0%) |
| 3 Vehicles | 7,586 (23.6%) | 5,808 (20.9%) |
| 4 Vehicles | 2,878 (8.9%) | 2,136 (7.7%) |
| 5 or more Vehicles | 1,228 (3.8%) | 1,018 (3.7%) |
| Total | 32,164 (100.0%) | 27,795 (100.0%) |
Commute Time in Sheboygan County
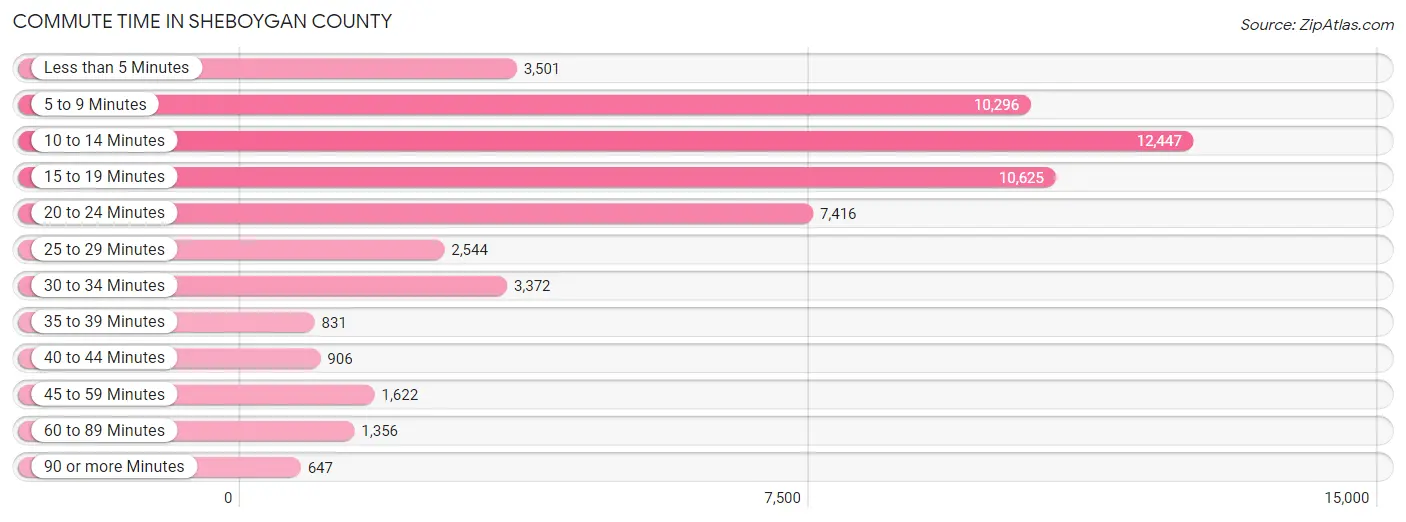
The most frequently occuring commute durations in Sheboygan County are 10 to 14 minutes (12,447 commuters, 22.4%), 15 to 19 minutes (10,625 commuters, 19.1%), and 5 to 9 minutes (10,296 commuters, 18.5%).
| Commute Time | # Commuters | % Commuters |
| Less than 5 Minutes | 3,501 | 6.3% |
| 5 to 9 Minutes | 10,296 | 18.5% |
| 10 to 14 Minutes | 12,447 | 22.4% |
| 15 to 19 Minutes | 10,625 | 19.1% |
| 20 to 24 Minutes | 7,416 | 13.4% |
| 25 to 29 Minutes | 2,544 | 4.6% |
| 30 to 34 Minutes | 3,372 | 6.1% |
| 35 to 39 Minutes | 831 | 1.5% |
| 40 to 44 Minutes | 906 | 1.6% |
| 45 to 59 Minutes | 1,622 | 2.9% |
| 60 to 89 Minutes | 1,356 | 2.4% |
| 90 or more Minutes | 647 | 1.2% |
Commute Time by Sex in Sheboygan County
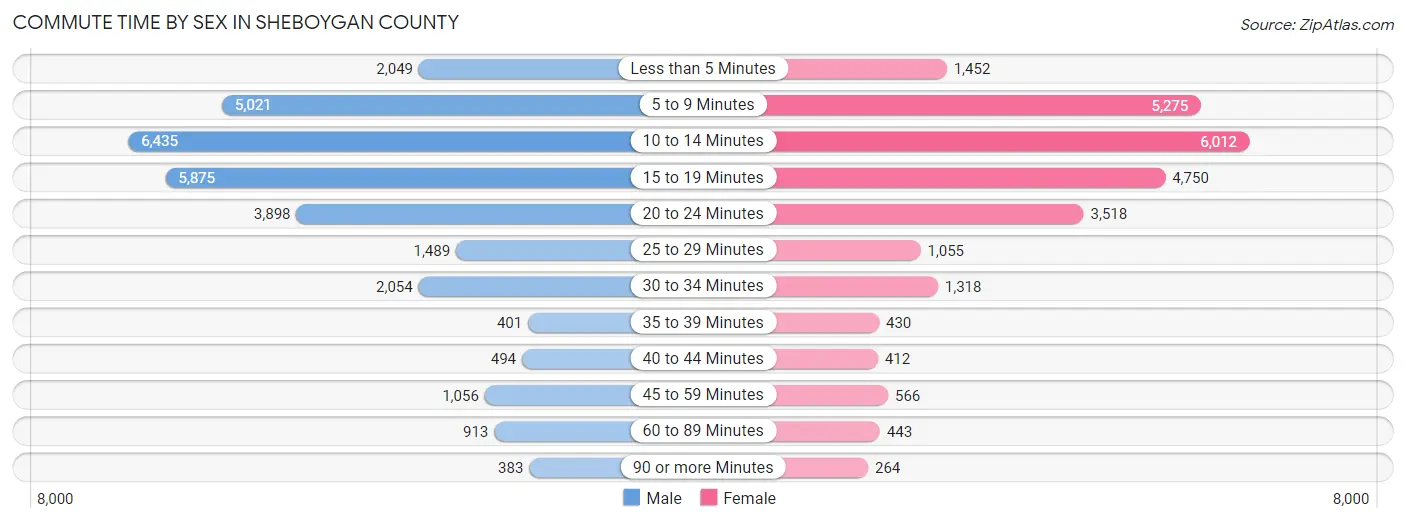
The most common commute times in Sheboygan County are 10 to 14 minutes (6,435 commuters, 21.4%) for males and 10 to 14 minutes (6,012 commuters, 23.6%) for females.
| Commute Time | Male | Female |
| Less than 5 Minutes | 2,049 (6.8%) | 1,452 (5.7%) |
| 5 to 9 Minutes | 5,021 (16.7%) | 5,275 (20.7%) |
| 10 to 14 Minutes | 6,435 (21.4%) | 6,012 (23.6%) |
| 15 to 19 Minutes | 5,875 (19.5%) | 4,750 (18.6%) |
| 20 to 24 Minutes | 3,898 (13.0%) | 3,518 (13.8%) |
| 25 to 29 Minutes | 1,489 (5.0%) | 1,055 (4.1%) |
| 30 to 34 Minutes | 2,054 (6.8%) | 1,318 (5.2%) |
| 35 to 39 Minutes | 401 (1.3%) | 430 (1.7%) |
| 40 to 44 Minutes | 494 (1.6%) | 412 (1.6%) |
| 45 to 59 Minutes | 1,056 (3.5%) | 566 (2.2%) |
| 60 to 89 Minutes | 913 (3.0%) | 443 (1.7%) |
| 90 or more Minutes | 383 (1.3%) | 264 (1.0%) |
Time of Departure to Work by Sex in Sheboygan County
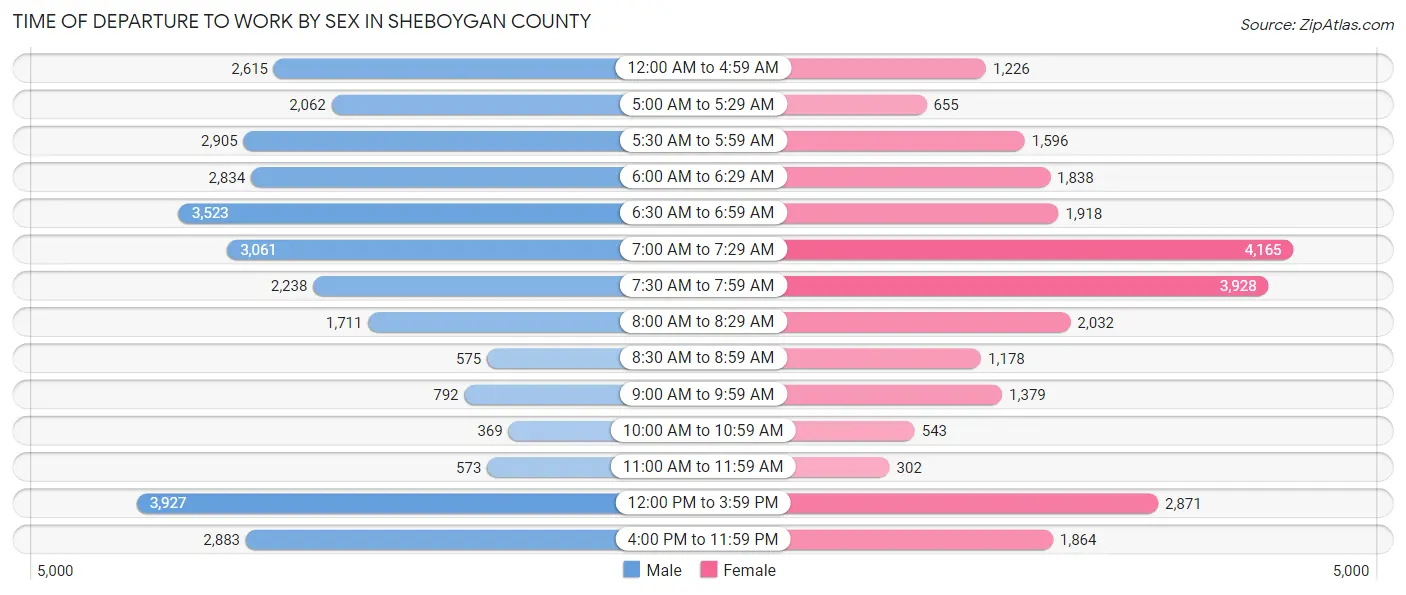
The most frequent times of departure to work in Sheboygan County are 12:00 PM to 3:59 PM (3,927, 13.1%) for males and 7:00 AM to 7:29 AM (4,165, 16.3%) for females.
| Time of Departure | Male | Female |
| 12:00 AM to 4:59 AM | 2,615 (8.7%) | 1,226 (4.8%) |
| 5:00 AM to 5:29 AM | 2,062 (6.9%) | 655 (2.6%) |
| 5:30 AM to 5:59 AM | 2,905 (9.7%) | 1,596 (6.3%) |
| 6:00 AM to 6:29 AM | 2,834 (9.4%) | 1,838 (7.2%) |
| 6:30 AM to 6:59 AM | 3,523 (11.7%) | 1,918 (7.5%) |
| 7:00 AM to 7:29 AM | 3,061 (10.2%) | 4,165 (16.3%) |
| 7:30 AM to 7:59 AM | 2,238 (7.4%) | 3,928 (15.4%) |
| 8:00 AM to 8:29 AM | 1,711 (5.7%) | 2,032 (8.0%) |
| 8:30 AM to 8:59 AM | 575 (1.9%) | 1,178 (4.6%) |
| 9:00 AM to 9:59 AM | 792 (2.6%) | 1,379 (5.4%) |
| 10:00 AM to 10:59 AM | 369 (1.2%) | 543 (2.1%) |
| 11:00 AM to 11:59 AM | 573 (1.9%) | 302 (1.2%) |
| 12:00 PM to 3:59 PM | 3,927 (13.1%) | 2,871 (11.3%) |
| 4:00 PM to 11:59 PM | 2,883 (9.6%) | 1,864 (7.3%) |
| Total | 30,068 (100.0%) | 25,495 (100.0%) |
Housing Occupancy in Sheboygan County
Occupancy by Ownership in Sheboygan County
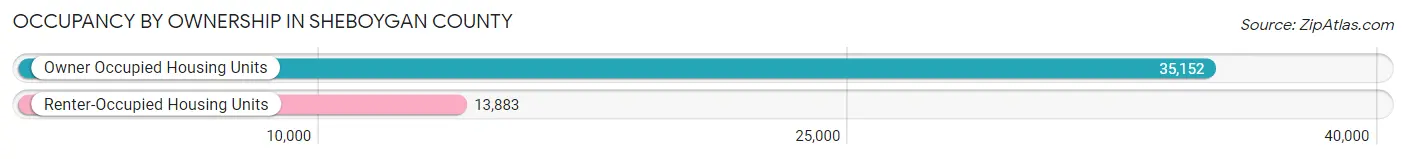
Of the total 49,035 dwellings in Sheboygan County, owner-occupied units account for 35,152 (71.7%), while renter-occupied units make up 13,883 (28.3%).
| Occupancy | # Housing Units | % Housing Units |
| Owner Occupied Housing Units | 35,152 | 71.7% |
| Renter-Occupied Housing Units | 13,883 | 28.3% |
| Total Occupied Housing Units | 49,035 | 100.0% |
Occupancy by Household Size in Sheboygan County
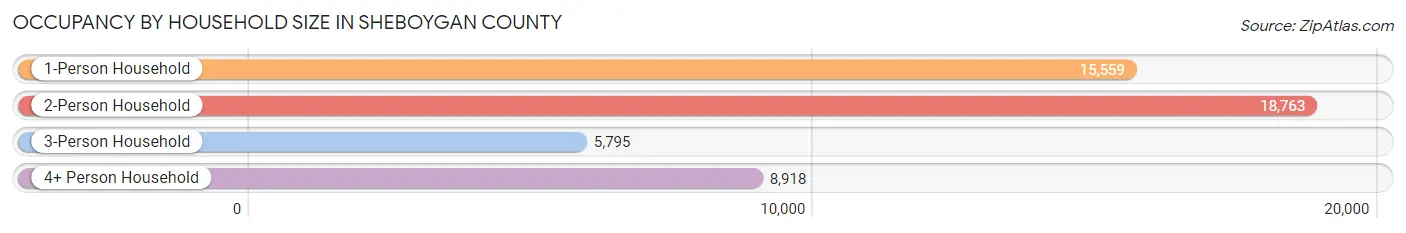
| Household Size | # Housing Units | % Housing Units |
| 1-Person Household | 15,559 | 31.7% |
| 2-Person Household | 18,763 | 38.3% |
| 3-Person Household | 5,795 | 11.8% |
| 4+ Person Household | 8,918 | 18.2% |
| Total Housing Units | 49,035 | 100.0% |
Occupancy by Ownership by Household Size in Sheboygan County
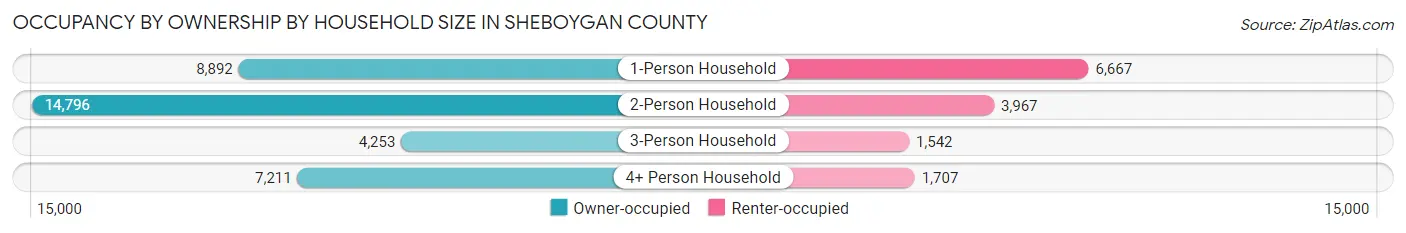
| Household Size | Owner-occupied | Renter-occupied |
| 1-Person Household | 8,892 (57.2%) | 6,667 (42.8%) |
| 2-Person Household | 14,796 (78.9%) | 3,967 (21.1%) |
| 3-Person Household | 4,253 (73.4%) | 1,542 (26.6%) |
| 4+ Person Household | 7,211 (80.9%) | 1,707 (19.1%) |
| Total Housing Units | 35,152 (71.7%) | 13,883 (28.3%) |
Occupancy by Educational Attainment in Sheboygan County
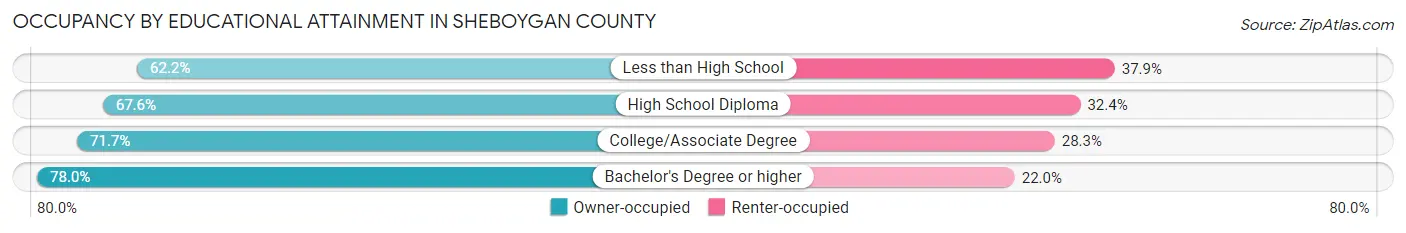
| Household Size | Owner-occupied | Renter-occupied |
| Less than High School | 1,662 (62.2%) | 1,012 (37.9%) |
| High School Diploma | 10,532 (67.6%) | 5,050 (32.4%) |
| College/Associate Degree | 11,895 (71.7%) | 4,702 (28.3%) |
| Bachelor's Degree or higher | 11,063 (78.0%) | 3,119 (22.0%) |
Occupancy by Age of Householder in Sheboygan County
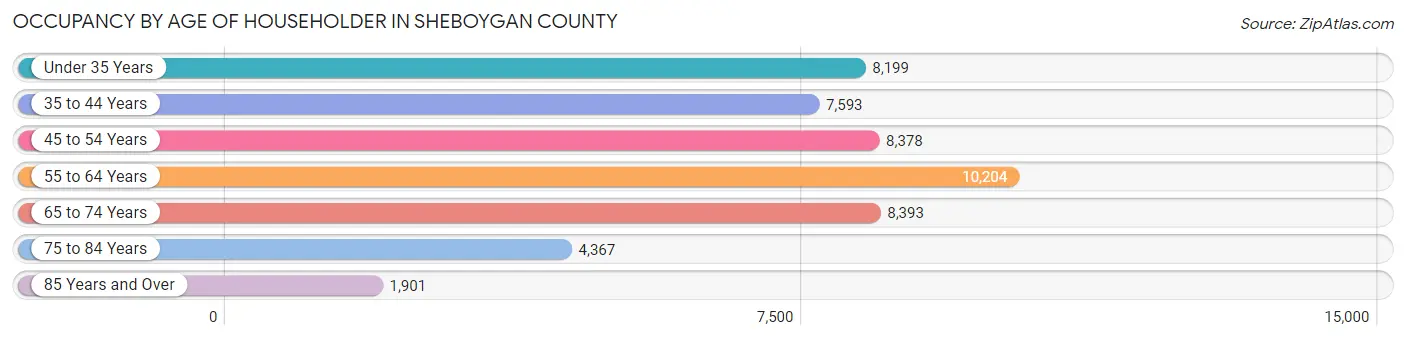
| Age Bracket | # Households | % Households |
| Under 35 Years | 8,199 | 16.7% |
| 35 to 44 Years | 7,593 | 15.5% |
| 45 to 54 Years | 8,378 | 17.1% |
| 55 to 64 Years | 10,204 | 20.8% |
| 65 to 74 Years | 8,393 | 17.1% |
| 75 to 84 Years | 4,367 | 8.9% |
| 85 Years and Over | 1,901 | 3.9% |
| Total | 49,035 | 100.0% |
Housing Finances in Sheboygan County
Median Income by Occupancy in Sheboygan County
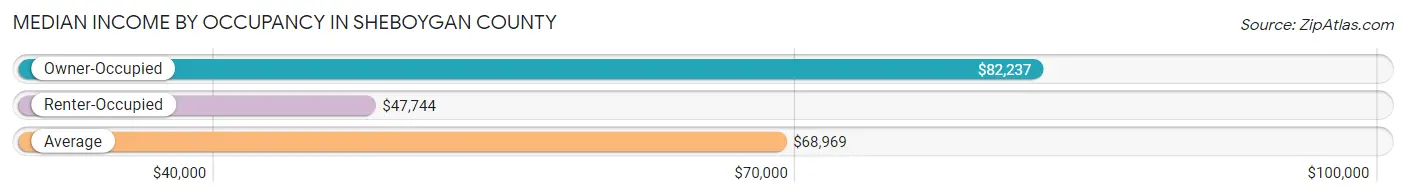
| Occupancy Type | # Households | Median Income |
| Owner-Occupied | 35,152 (71.7%) | $82,237 |
| Renter-Occupied | 13,883 (28.3%) | $47,744 |
| Average | 49,035 (100.0%) | $68,969 |
Occupancy by Householder Income Bracket in Sheboygan County
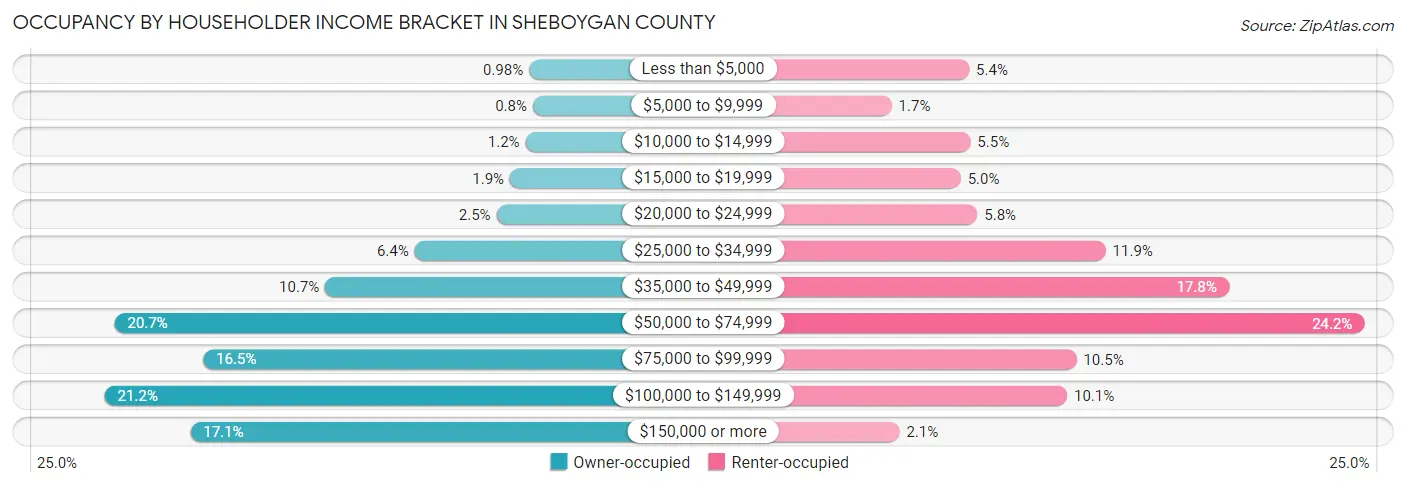
| Income Bracket | Owner-occupied | Renter-occupied |
| Less than $5,000 | 344 (1.0%) | 751 (5.4%) |
| $5,000 to $9,999 | 280 (0.8%) | 239 (1.7%) |
| $10,000 to $14,999 | 406 (1.1%) | 760 (5.5%) |
| $15,000 to $19,999 | 664 (1.9%) | 696 (5.0%) |
| $20,000 to $24,999 | 891 (2.5%) | 805 (5.8%) |
| $25,000 to $34,999 | 2,262 (6.4%) | 1,654 (11.9%) |
| $35,000 to $49,999 | 3,757 (10.7%) | 2,467 (17.8%) |
| $50,000 to $74,999 | 7,285 (20.7%) | 3,363 (24.2%) |
| $75,000 to $99,999 | 5,799 (16.5%) | 1,460 (10.5%) |
| $100,000 to $149,999 | 7,448 (21.2%) | 1,398 (10.1%) |
| $150,000 or more | 6,016 (17.1%) | 290 (2.1%) |
| Total | 35,152 (100.0%) | 13,883 (100.0%) |
Monthly Housing Cost Tiers in Sheboygan County
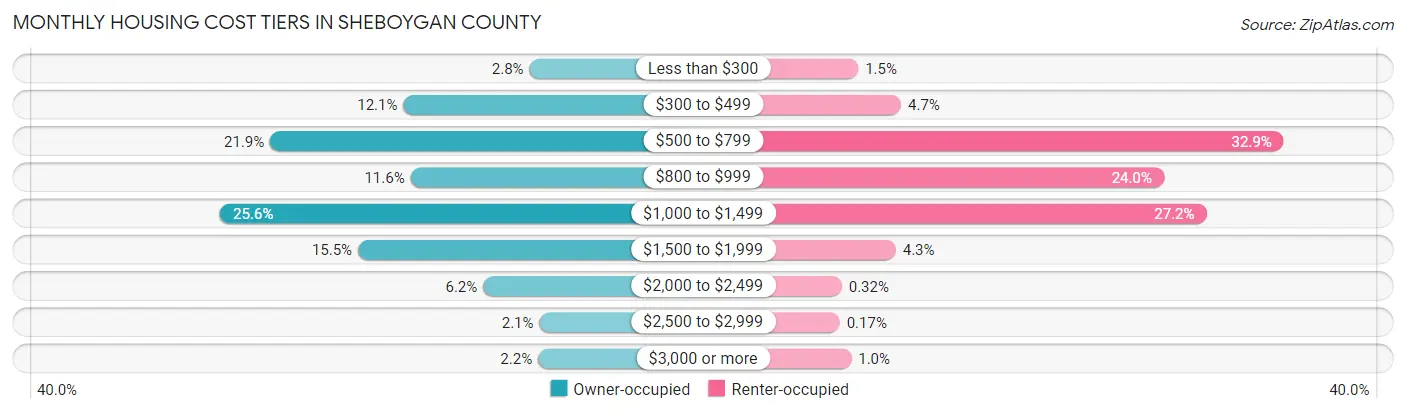
| Monthly Cost | Owner-occupied | Renter-occupied |
| Less than $300 | 992 (2.8%) | 212 (1.5%) |
| $300 to $499 | 4,258 (12.1%) | 651 (4.7%) |
| $500 to $799 | 7,707 (21.9%) | 4,562 (32.9%) |
| $800 to $999 | 4,071 (11.6%) | 3,336 (24.0%) |
| $1,000 to $1,499 | 8,999 (25.6%) | 3,772 (27.2%) |
| $1,500 to $1,999 | 5,430 (15.4%) | 597 (4.3%) |
| $2,000 to $2,499 | 2,189 (6.2%) | 45 (0.3%) |
| $2,500 to $2,999 | 736 (2.1%) | 23 (0.2%) |
| $3,000 or more | 770 (2.2%) | 142 (1.0%) |
| Total | 35,152 (100.0%) | 13,883 (100.0%) |
Physical Housing Characteristics in Sheboygan County
Housing Structures in Sheboygan County
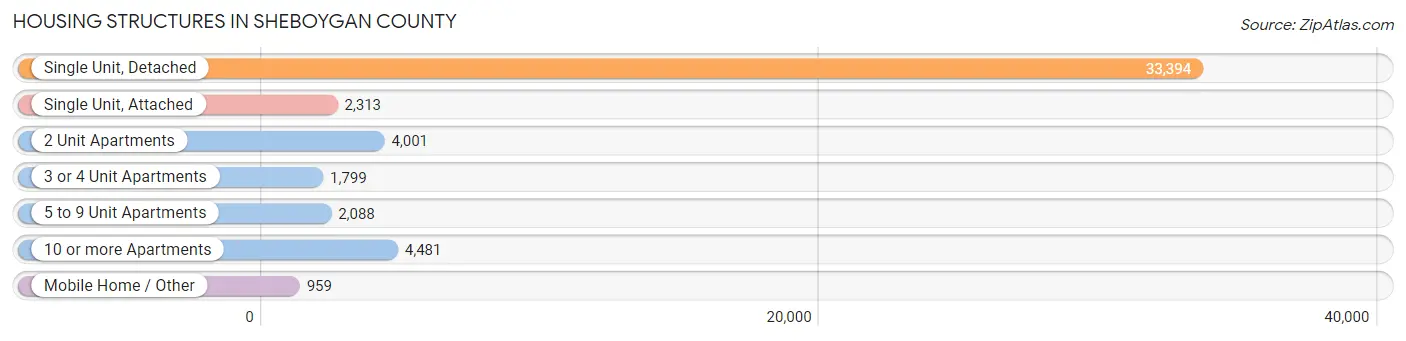
| Structure Type | # Housing Units | % Housing Units |
| Single Unit, Detached | 33,394 | 68.1% |
| Single Unit, Attached | 2,313 | 4.7% |
| 2 Unit Apartments | 4,001 | 8.2% |
| 3 or 4 Unit Apartments | 1,799 | 3.7% |
| 5 to 9 Unit Apartments | 2,088 | 4.3% |
| 10 or more Apartments | 4,481 | 9.1% |
| Mobile Home / Other | 959 | 2.0% |
| Total | 49,035 | 100.0% |
Housing Structures by Occupancy in Sheboygan County
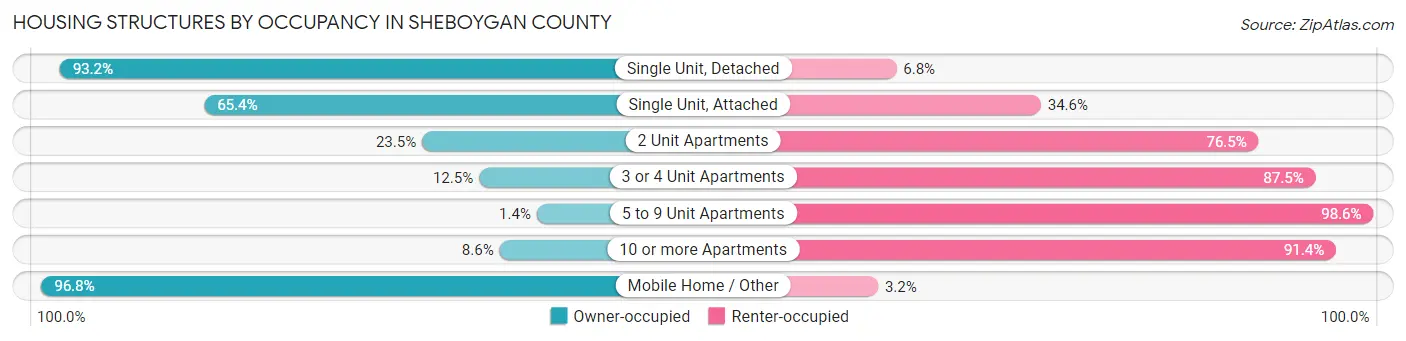
| Structure Type | Owner-occupied | Renter-occupied |
| Single Unit, Detached | 31,133 (93.2%) | 2,261 (6.8%) |
| Single Unit, Attached | 1,513 (65.4%) | 800 (34.6%) |
| 2 Unit Apartments | 940 (23.5%) | 3,061 (76.5%) |
| 3 or 4 Unit Apartments | 225 (12.5%) | 1,574 (87.5%) |
| 5 to 9 Unit Apartments | 29 (1.4%) | 2,059 (98.6%) |
| 10 or more Apartments | 384 (8.6%) | 4,097 (91.4%) |
| Mobile Home / Other | 928 (96.8%) | 31 (3.2%) |
| Total | 35,152 (71.7%) | 13,883 (28.3%) |
Housing Structures by Number of Rooms in Sheboygan County
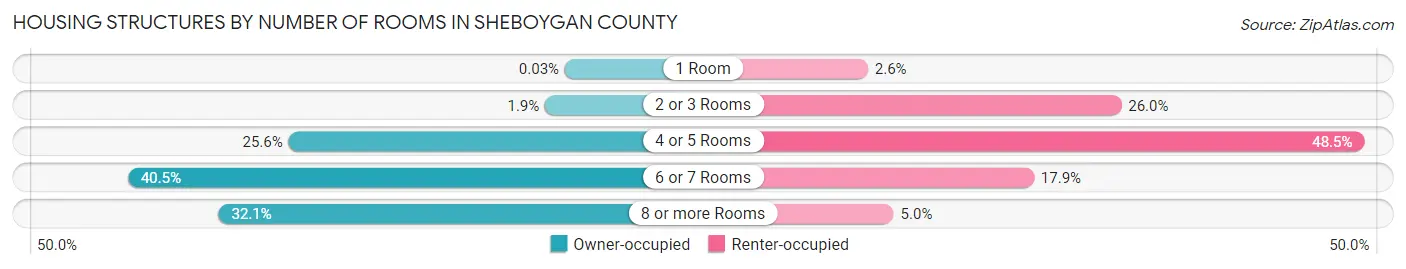
| Number of Rooms | Owner-occupied | Renter-occupied |
| 1 Room | 10 (0.0%) | 358 (2.6%) |
| 2 or 3 Rooms | 654 (1.9%) | 3,613 (26.0%) |
| 4 or 5 Rooms | 8,994 (25.6%) | 6,732 (48.5%) |
| 6 or 7 Rooms | 14,221 (40.5%) | 2,490 (17.9%) |
| 8 or more Rooms | 11,273 (32.1%) | 690 (5.0%) |
| Total | 35,152 (100.0%) | 13,883 (100.0%) |
Housing Structure by Heating Type in Sheboygan County
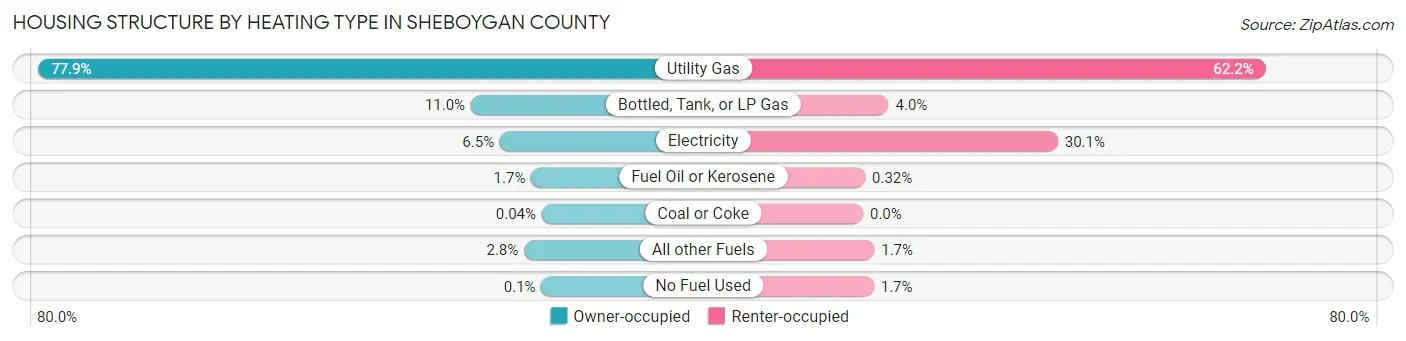
| Heating Type | Owner-occupied | Renter-occupied |
| Utility Gas | 27,379 (77.9%) | 8,638 (62.2%) |
| Bottled, Tank, or LP Gas | 3,868 (11.0%) | 548 (4.0%) |
| Electricity | 2,287 (6.5%) | 4,179 (30.1%) |
| Fuel Oil or Kerosene | 591 (1.7%) | 45 (0.3%) |
| Coal or Coke | 15 (0.0%) | 0 (0.0%) |
| All other Fuels | 976 (2.8%) | 242 (1.7%) |
| No Fuel Used | 36 (0.1%) | 231 (1.7%) |
| Total | 35,152 (100.0%) | 13,883 (100.0%) |
Household Vehicle Usage in Sheboygan County
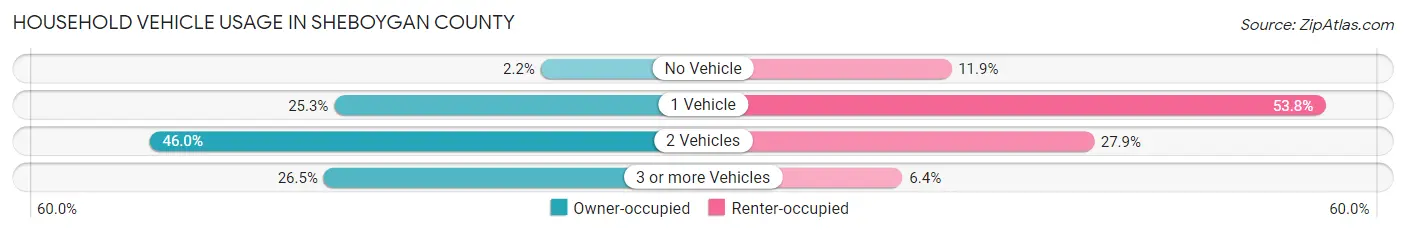
| Vehicles per Household | Owner-occupied | Renter-occupied |
| No Vehicle | 770 (2.2%) | 1,654 (11.9%) |
| 1 Vehicle | 8,899 (25.3%) | 7,465 (53.8%) |
| 2 Vehicles | 16,170 (46.0%) | 3,870 (27.9%) |
| 3 or more Vehicles | 9,313 (26.5%) | 894 (6.4%) |
| Total | 35,152 (100.0%) | 13,883 (100.0%) |
Real Estate & Mortgages in Sheboygan County
Real Estate and Mortgage Overview in Sheboygan County
| Characteristic | Without Mortgage | With Mortgage |
| Housing Units | 13,749 | 21,403 |
| Median Property Value | $195,600 | $200,800 |
| Median Household Income | $62,313 | $4,296 |
| Monthly Housing Costs | $560 | $714 |
| Real Estate Taxes | $3,248 | $284 |
Property Value by Mortgage Status in Sheboygan County
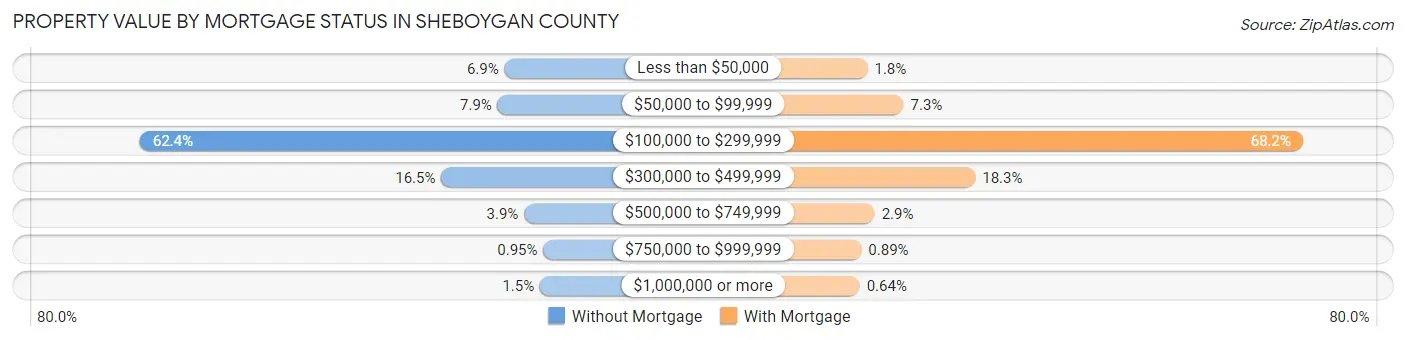
| Property Value | Without Mortgage | With Mortgage |
| Less than $50,000 | 945 (6.9%) | 391 (1.8%) |
| $50,000 to $99,999 | 1,087 (7.9%) | 1,566 (7.3%) |
| $100,000 to $299,999 | 8,585 (62.4%) | 14,587 (68.1%) |
| $300,000 to $499,999 | 2,269 (16.5%) | 3,906 (18.2%) |
| $500,000 to $749,999 | 532 (3.9%) | 626 (2.9%) |
| $750,000 to $999,999 | 131 (0.9%) | 191 (0.9%) |
| $1,000,000 or more | 200 (1.5%) | 136 (0.6%) |
| Total | 13,749 (100.0%) | 21,403 (100.0%) |
Household Income by Mortgage Status in Sheboygan County
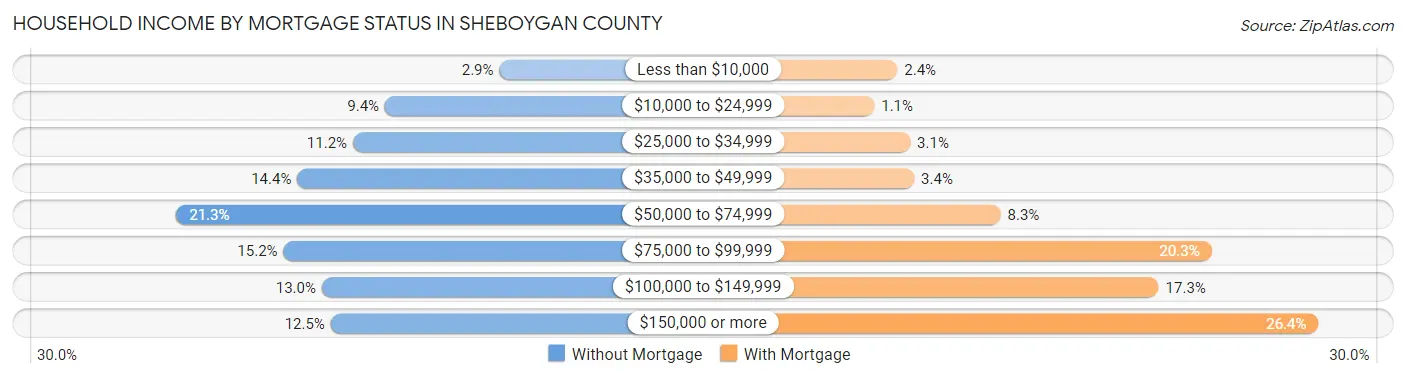
| Household Income | Without Mortgage | With Mortgage |
| Less than $10,000 | 394 (2.9%) | 512 (2.4%) |
| $10,000 to $24,999 | 1,294 (9.4%) | 230 (1.1%) |
| $25,000 to $34,999 | 1,546 (11.2%) | 667 (3.1%) |
| $35,000 to $49,999 | 1,982 (14.4%) | 716 (3.4%) |
| $50,000 to $74,999 | 2,932 (21.3%) | 1,775 (8.3%) |
| $75,000 to $99,999 | 2,091 (15.2%) | 4,353 (20.3%) |
| $100,000 to $149,999 | 1,790 (13.0%) | 3,708 (17.3%) |
| $150,000 or more | 1,720 (12.5%) | 5,658 (26.4%) |
| Total | 13,749 (100.0%) | 21,403 (100.0%) |
Property Value to Household Income Ratio in Sheboygan County
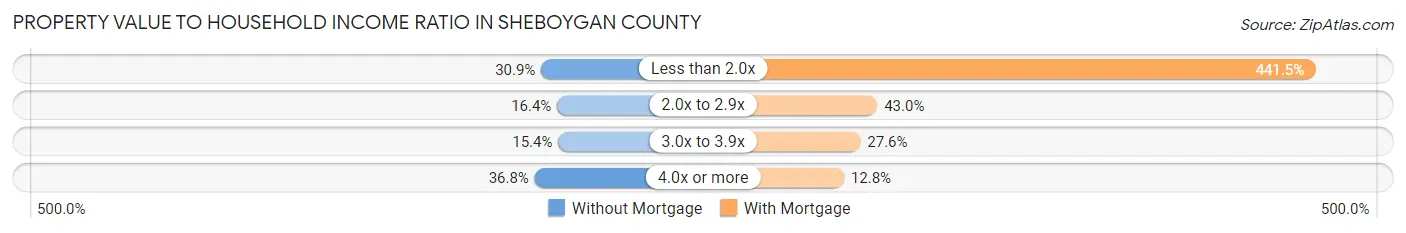
| Value-to-Income Ratio | Without Mortgage | With Mortgage |
| Less than 2.0x | 4,250 (30.9%) | 94,487 (441.5%) |
| 2.0x to 2.9x | 2,252 (16.4%) | 9,202 (43.0%) |
| 3.0x to 3.9x | 2,119 (15.4%) | 5,911 (27.6%) |
| 4.0x or more | 5,058 (36.8%) | 2,728 (12.8%) |
| Total | 13,749 (100.0%) | 21,403 (100.0%) |
Real Estate Taxes by Mortgage Status in Sheboygan County
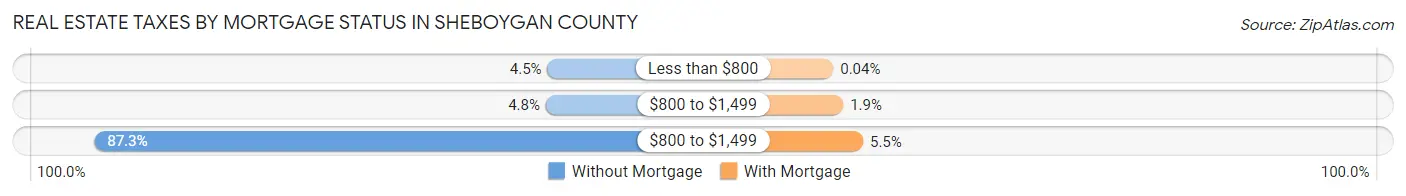
| Property Taxes | Without Mortgage | With Mortgage |
| Less than $800 | 619 (4.5%) | 8 (0.0%) |
| $800 to $1,499 | 662 (4.8%) | 399 (1.9%) |
| $800 to $1,499 | 11,998 (87.3%) | 1,173 (5.5%) |
| Total | 13,749 (100.0%) | 21,403 (100.0%) |
Health & Disability in Sheboygan County
Health Insurance Coverage by Age in Sheboygan County
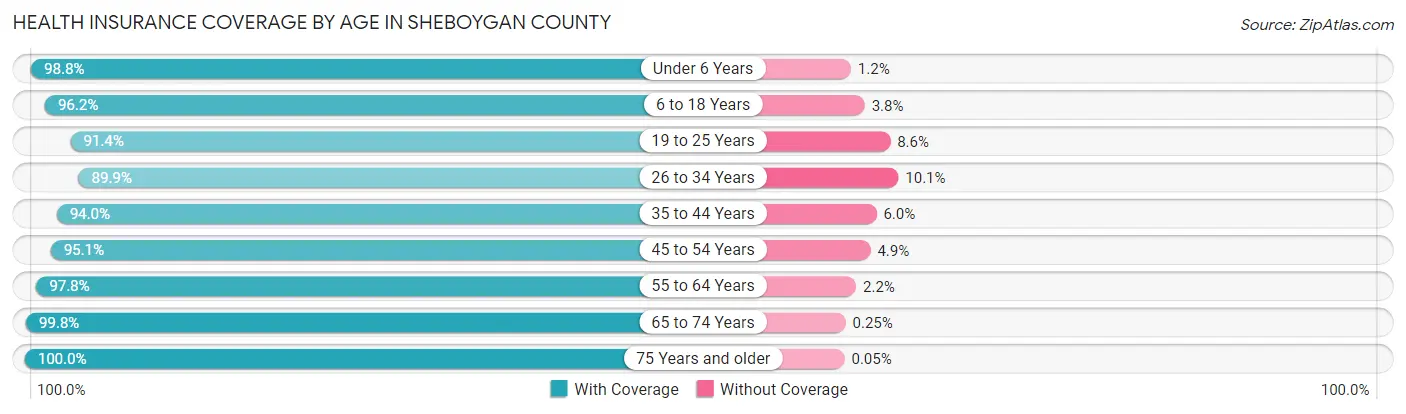
| Age Bracket | With Coverage | Without Coverage |
| Under 6 Years | 7,693 (98.8%) | 96 (1.2%) |
| 6 to 18 Years | 18,380 (96.2%) | 729 (3.8%) |
| 19 to 25 Years | 9,516 (91.4%) | 891 (8.6%) |
| 26 to 34 Years | 10,055 (89.9%) | 1,127 (10.1%) |
| 35 to 44 Years | 13,241 (94.0%) | 845 (6.0%) |
| 45 to 54 Years | 13,756 (95.1%) | 706 (4.9%) |
| 55 to 64 Years | 16,773 (97.8%) | 378 (2.2%) |
| 65 to 74 Years | 12,903 (99.8%) | 32 (0.3%) |
| 75 Years and older | 8,357 (100.0%) | 4 (0.1%) |
| Total | 110,674 (95.8%) | 4,808 (4.2%) |
Health Insurance Coverage by Citizenship Status in Sheboygan County
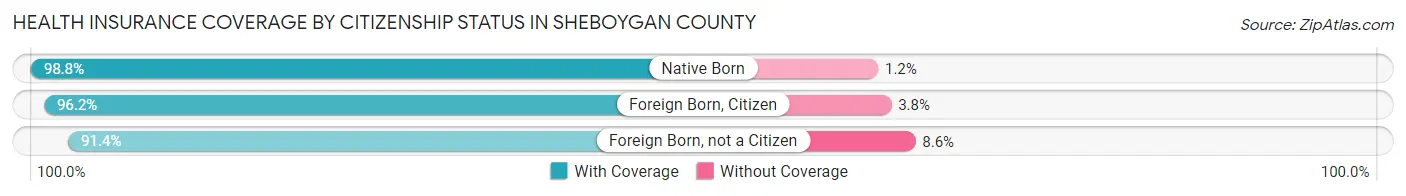
| Citizenship Status | With Coverage | Without Coverage |
| Native Born | 7,693 (98.8%) | 96 (1.2%) |
| Foreign Born, Citizen | 18,380 (96.2%) | 729 (3.8%) |
| Foreign Born, not a Citizen | 9,516 (91.4%) | 891 (8.6%) |
Health Insurance Coverage by Household Income in Sheboygan County
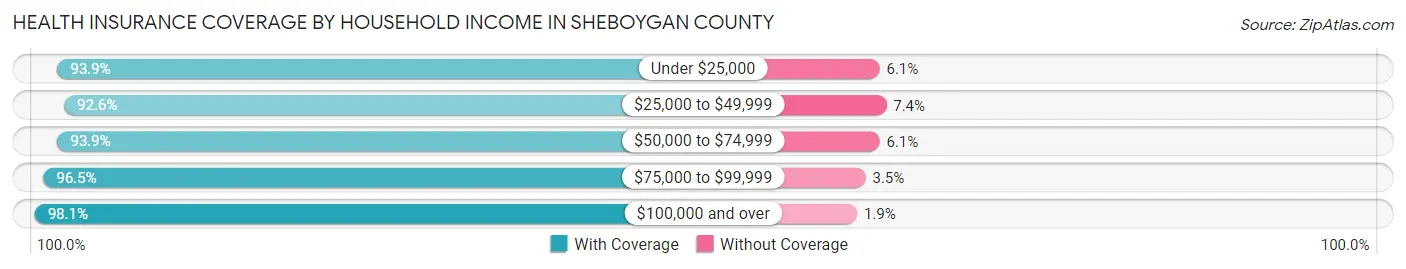
| Household Income | With Coverage | Without Coverage |
| Under $25,000 | 7,689 (93.9%) | 503 (6.1%) |
| $25,000 to $49,999 | 16,468 (92.6%) | 1,316 (7.4%) |
| $50,000 to $74,999 | 22,037 (93.9%) | 1,438 (6.1%) |
| $75,000 to $99,999 | 17,866 (96.5%) | 649 (3.5%) |
| $100,000 and over | 45,744 (98.1%) | 885 (1.9%) |
Public vs Private Health Insurance Coverage by Age in Sheboygan County
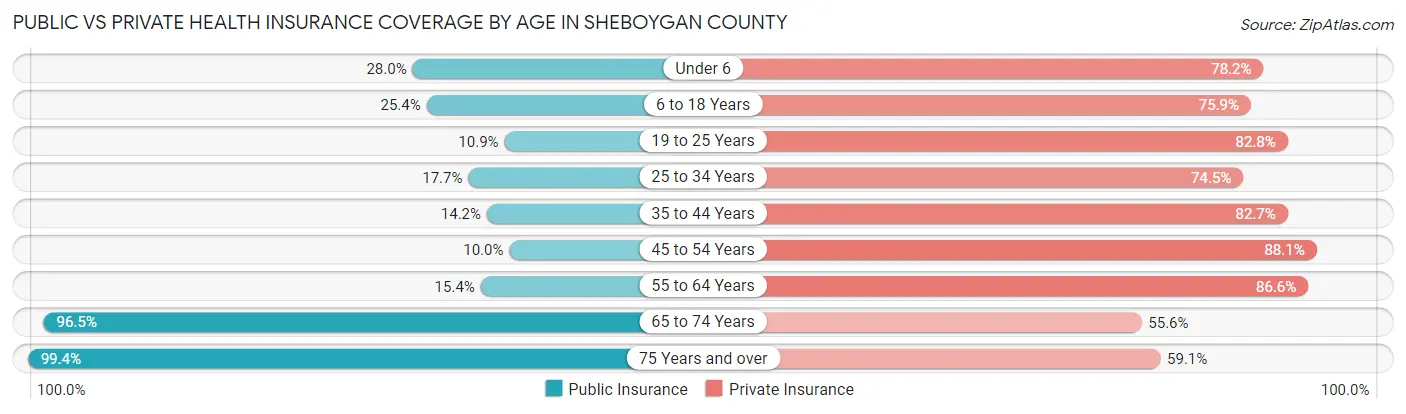
| Age Bracket | Public Insurance | Private Insurance |
| Under 6 | 2,181 (28.0%) | 6,094 (78.2%) |
| 6 to 18 Years | 4,851 (25.4%) | 14,507 (75.9%) |
| 19 to 25 Years | 1,139 (10.9%) | 8,612 (82.8%) |
| 25 to 34 Years | 1,974 (17.6%) | 8,329 (74.5%) |
| 35 to 44 Years | 2,000 (14.2%) | 11,655 (82.7%) |
| 45 to 54 Years | 1,452 (10.0%) | 12,741 (88.1%) |
| 55 to 64 Years | 2,633 (15.3%) | 14,845 (86.6%) |
| 65 to 74 Years | 12,478 (96.5%) | 7,192 (55.6%) |
| 75 Years and over | 8,312 (99.4%) | 4,940 (59.1%) |
| Total | 37,020 (32.1%) | 88,915 (77.0%) |
Disability Status by Sex by Age in Sheboygan County
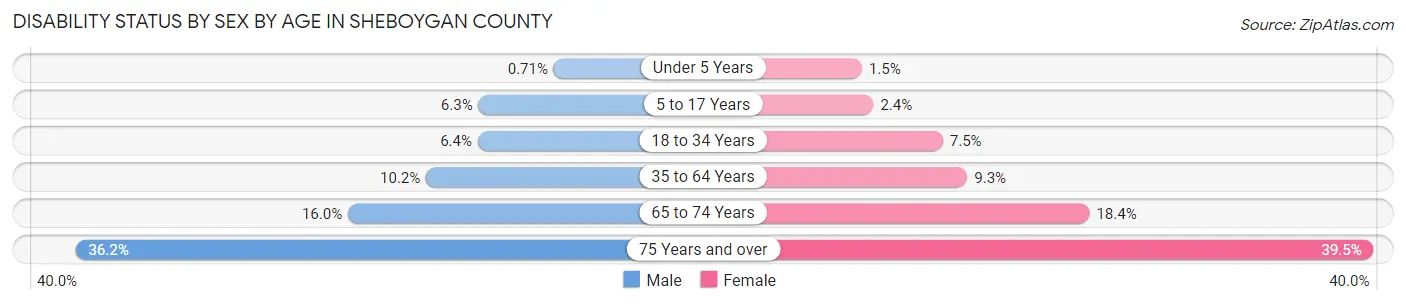
| Age Bracket | Male | Female |
| Under 5 Years | 22 (0.7%) | 47 (1.5%) |
| 5 to 17 Years | 623 (6.3%) | 220 (2.4%) |
| 18 to 34 Years | 761 (6.4%) | 826 (7.5%) |
| 35 to 64 Years | 2,375 (10.2%) | 2,087 (9.3%) |
| 65 to 74 Years | 1,016 (16.0%) | 1,210 (18.4%) |
| 75 Years and over | 1,300 (36.2%) | 1,884 (39.5%) |
Disability Class by Sex by Age in Sheboygan County
Disability Class: Hearing Difficulty
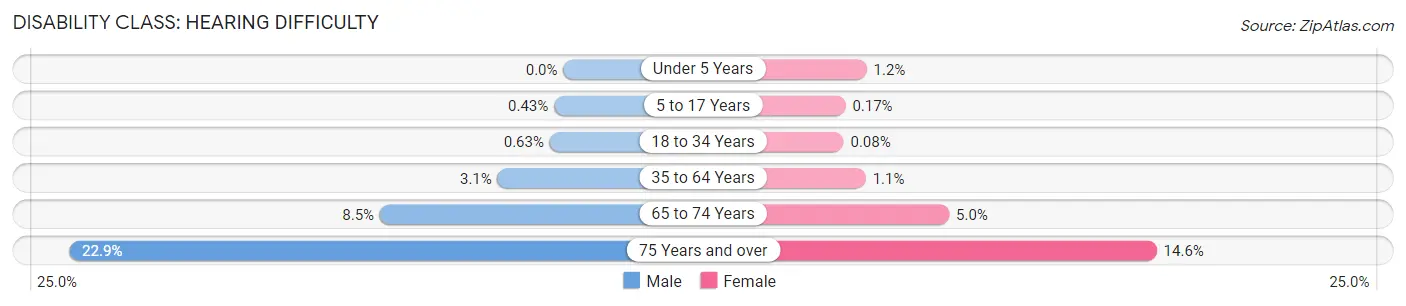
| Age Bracket | Male | Female |
| Under 5 Years | 0 (0.0%) | 36 (1.1%) |
| 5 to 17 Years | 42 (0.4%) | 16 (0.2%) |
| 18 to 34 Years | 75 (0.6%) | 9 (0.1%) |
| 35 to 64 Years | 710 (3.0%) | 249 (1.1%) |
| 65 to 74 Years | 541 (8.5%) | 328 (5.0%) |
| 75 Years and over | 823 (22.9%) | 697 (14.6%) |
Disability Class: Vision Difficulty
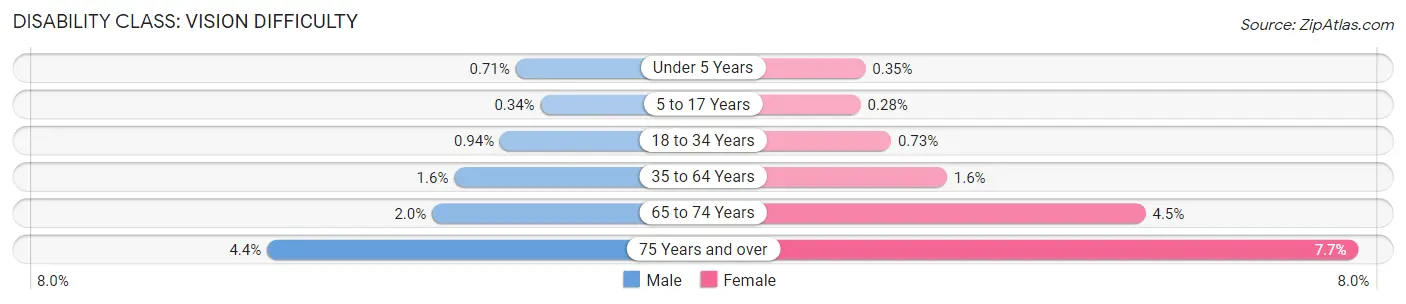
| Age Bracket | Male | Female |
| Under 5 Years | 22 (0.7%) | 11 (0.4%) |
| 5 to 17 Years | 34 (0.3%) | 26 (0.3%) |
| 18 to 34 Years | 113 (0.9%) | 80 (0.7%) |
| 35 to 64 Years | 378 (1.6%) | 349 (1.6%) |
| 65 to 74 Years | 124 (1.9%) | 297 (4.5%) |
| 75 Years and over | 158 (4.4%) | 366 (7.7%) |
Disability Class: Cognitive Difficulty
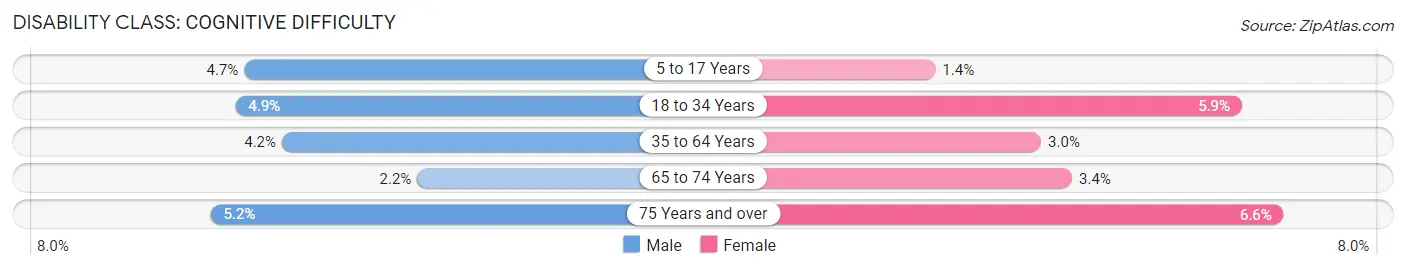
| Age Bracket | Male | Female |
| 5 to 17 Years | 468 (4.7%) | 130 (1.4%) |
| 18 to 34 Years | 583 (4.9%) | 654 (5.9%) |
| 35 to 64 Years | 974 (4.2%) | 663 (3.0%) |
| 65 to 74 Years | 138 (2.2%) | 225 (3.4%) |
| 75 Years and over | 188 (5.2%) | 313 (6.6%) |
Disability Class: Ambulatory Difficulty
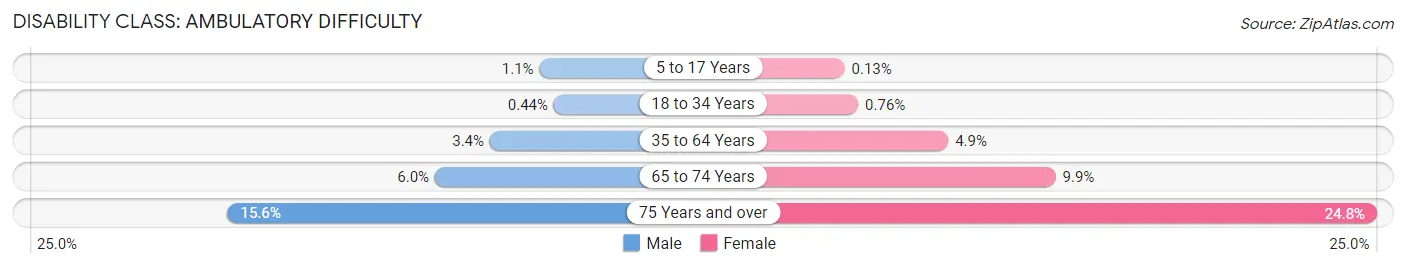
| Age Bracket | Male | Female |
| 5 to 17 Years | 110 (1.1%) | 12 (0.1%) |
| 18 to 34 Years | 53 (0.4%) | 84 (0.8%) |
| 35 to 64 Years | 796 (3.4%) | 1,106 (4.9%) |
| 65 to 74 Years | 379 (6.0%) | 653 (9.9%) |
| 75 Years and over | 559 (15.6%) | 1,185 (24.8%) |
Disability Class: Self-Care Difficulty
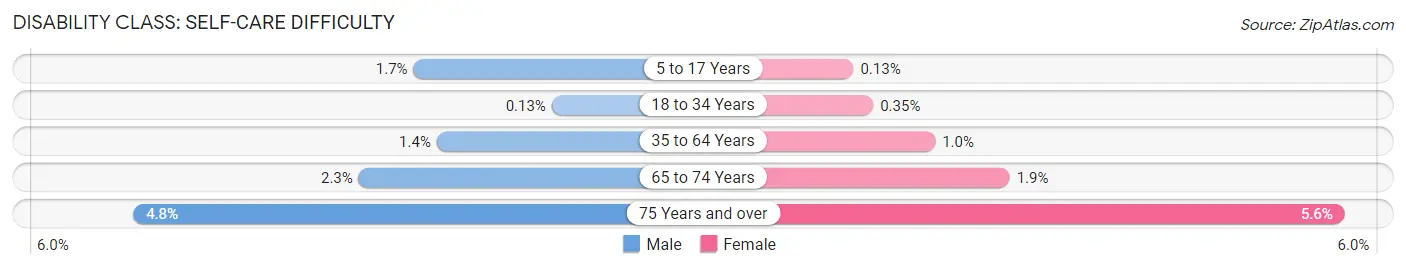
| Age Bracket | Male | Female |
| 5 to 17 Years | 165 (1.7%) | 12 (0.1%) |
| 18 to 34 Years | 16 (0.1%) | 38 (0.4%) |
| 35 to 64 Years | 329 (1.4%) | 233 (1.0%) |
| 65 to 74 Years | 145 (2.3%) | 123 (1.9%) |
| 75 Years and over | 172 (4.8%) | 267 (5.6%) |
Technology Access in Sheboygan County
Computing Device Access in Sheboygan County
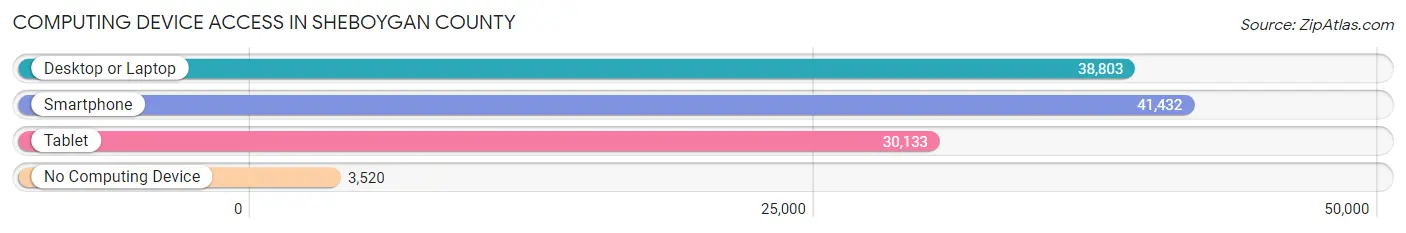
| Device Type | # Households | % Households |
| Desktop or Laptop | 38,803 | 79.1% |
| Smartphone | 41,432 | 84.5% |
| Tablet | 30,133 | 61.5% |
| No Computing Device | 3,520 | 7.2% |
| Total | 49,035 | 100.0% |
Internet Access in Sheboygan County
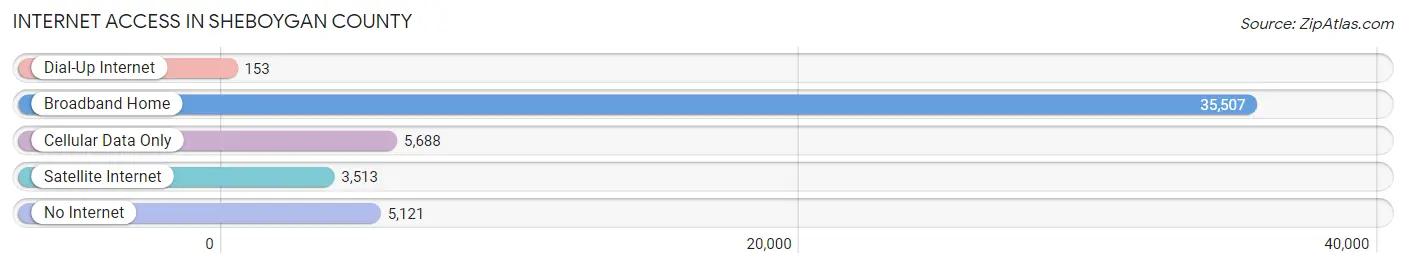
| Internet Type | # Households | % Households |
| Dial-Up Internet | 153 | 0.3% |
| Broadband Home | 35,507 | 72.4% |
| Cellular Data Only | 5,688 | 11.6% |
| Satellite Internet | 3,513 | 7.2% |
| No Internet | 5,121 | 10.4% |
| Total | 49,035 | 100.0% |
Sheboygan County Summary
Sheboygan County, Wisconsin is located in the east-central part of the state, along the western shore of Lake Michigan. It is bordered by Manitowoc County to the north, Fond du Lac County to the east, Ozaukee County to the south, and the Lake Michigan shoreline to the west. The county seat is Sheboygan, and the largest city is Sheboygan Falls.
History
The area that is now Sheboygan County was originally inhabited by Native American tribes, including the Potawatomi, Menominee, and Winnebago. The first Europeans to settle in the area were French fur traders in the late 1600s. The first permanent settlers arrived in the early 1800s, and the county was officially organized in 1836.
The county was named after the Sheboygan River, which was named by the Potawatomi for the sound made by the river’s rapids. The name is believed to mean “noisy water” or “place of the loud noise.”
The county’s economy was initially based on lumber and agriculture, but it quickly diversified to include manufacturing, shipping, and tourism. The city of Sheboygan was an important port for the Great Lakes shipping industry, and it was also home to several large manufacturing companies, including Kohler Company and Sheboygan Chair Company.
Geography
Sheboygan County covers an area of 545 square miles, with a population of 115,507 as of the 2020 census. The county is divided into two distinct regions: the eastern part is mostly flat and agricultural, while the western part is hilly and heavily forested.
The county is home to several rivers, including the Sheboygan, Mullet, and Pigeon. The Sheboygan River is the largest and most important, as it is used for both recreational and commercial purposes. The county also contains several lakes, including Lake Michigan, Lake Winnebago, and Lake Pigeon.
Economy
Sheboygan County’s economy is largely based on manufacturing, agriculture, and tourism. The county is home to several large manufacturing companies, including Kohler Company, Sargento Foods, and Johnsonville Sausage. The county is also home to several agricultural operations, including dairy farms, vegetable farms, and fruit orchards.
Tourism is an important part of the county’s economy, as it is home to several popular attractions, including the John Michael Kohler Arts Center, the Sheboygan County Historical Museum, and the Blue Harbor Resort and Conference Center.
Demographics
As of the 2020 census, Sheboygan County had a population of 115,507. The population is predominantly white (93.3%), with small percentages of African American (2.2%), Hispanic (2.1%), and Asian (1.7%) residents. The median household income is $60,945, and the median home value is $179,400.
Sheboygan County is home to several higher education institutions, including the University of Wisconsin-Sheboygan, Lakeshore Technical College, and Sheboygan County Christian College. The county is also home to several public school districts, including Sheboygan Area School District, Sheboygan Falls School District, and Elkhart Lake-Glenbeulah School District.
Common Questions
What is the Total Population of Sheboygan County?
Total Population of Sheboygan County is 117,741.
What is the Total Male Population of Sheboygan County?
Total Male Population of Sheboygan County is 59,860.
What is the Total Female Population of Sheboygan County?
Total Female Population of Sheboygan County is 57,881.
What is the Ratio of Males per 100 Females in Sheboygan County?
There are 103.42 Males per 100 Females in Sheboygan County.
What is the Ratio of Females per 100 Males in Sheboygan County?
There are 96.69 Females per 100 Males in Sheboygan County.
What is the Median Population Age in Sheboygan County?
Median Population Age in Sheboygan County is 41.5 Years.
What is the Average Family Size in Sheboygan County
Average Family Size in Sheboygan County is 3.0 People.
What is the Average Household Size in Sheboygan County
Average Household Size in Sheboygan County is 2.3 People.
What is Per Capita Income in Sheboygan County?
Per Capita income in Sheboygan County is $37,454.
What is the Median Family Income in Sheboygan County?
Median Family Income in Sheboygan County is $87,694.
What is the Median Household income in Sheboygan County?
Median Household Income in Sheboygan County is $68,969.
What is Income or Wage Gap in Sheboygan County?
Income or Wage Gap in Sheboygan County is 27.9%.
Women in Sheboygan County earn 72.1 cents for every dollar earned by a man.
What is Family Income Deficit in Sheboygan County?
Family Income Deficit in Sheboygan County is $11,023.
Families that are below poverty line in Sheboygan County earn $11,023 less on average than the poverty threshold level.
What is Inequality or Gini Index in Sheboygan County?
Inequality or Gini Index in Sheboygan County is 0.41.
How Large is the Labor Force in Sheboygan County?
There are 62,857 People in the Labor Forcein in Sheboygan County.
What is the Percentage of People in the Labor Force in Sheboygan County?
66.0% of People are in the Labor Force in Sheboygan County.
What is the Unemployment Rate in Sheboygan County?
Unemployment Rate in Sheboygan County is 2.8%.