Sauk County, WI
Sauk County Map
Sauk County Overview
65,664
TOTAL POPULATION
32,918
MALE POPULATION
32,746
FEMALE POPULATION
100.53
MALES / 100 FEMALES
99.48
FEMALES / 100 MALES
41.1
MEDIAN AGE
2.9
AVG FAMILY SIZE
2.4
AVG HOUSEHOLD SIZE
$37,431
PER CAPITA INCOME
$91,153
AVG FAMILY INCOME
$72,930
AVG HOUSEHOLD INCOME
24.9%
WAGE / INCOME GAP [ % ]
75.1¢/ $1
WAGE / INCOME GAP [ $ ]
$11,125
FAMILY INCOME DEFICIT
0.41
INEQUALITY / GINI INDEX
35,255
LABOR FORCE [ PEOPLE ]
67.0%
PERCENT IN LABOR FORCE
2.8%
UNEMPLOYMENT RATE
Sauk County Area Codes
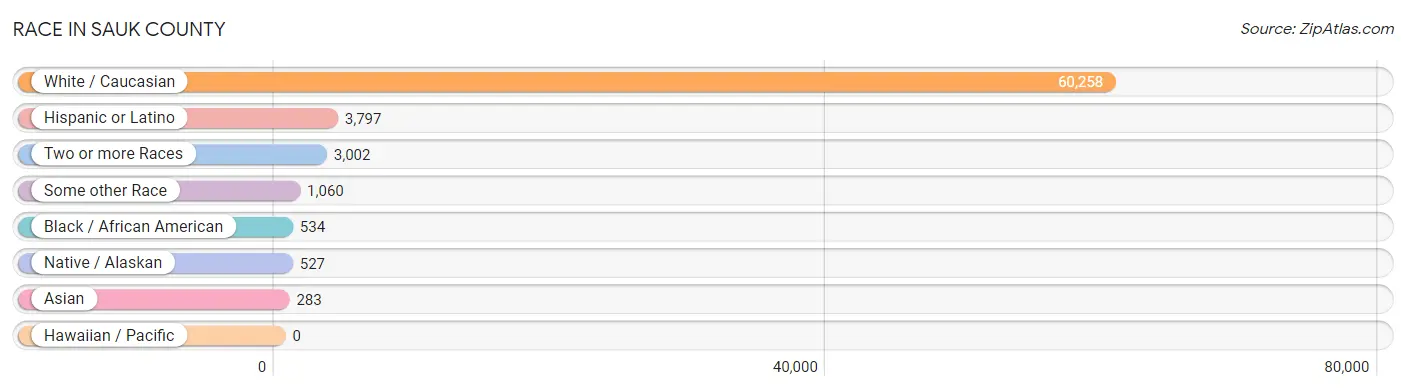
Race in Sauk County
The most populous races in Sauk County are White / Caucasian (60,258 | 91.8%), Hispanic or Latino (3,797 | 5.8%), and Two or more Races (3,002 | 4.6%).
| Race | # Population | % Population |
| Asian | 283 | 0.4% |
| Black / African American | 534 | 0.8% |
| Hawaiian / Pacific | 0 | 0.0% |
| Hispanic or Latino | 3,797 | 5.8% |
| Native / Alaskan | 527 | 0.8% |
| White / Caucasian | 60,258 | 91.8% |
| Two or more Races | 3,002 | 4.6% |
| Some other Race | 1,060 | 1.6% |
| Total | 65,664 | 100.0% |
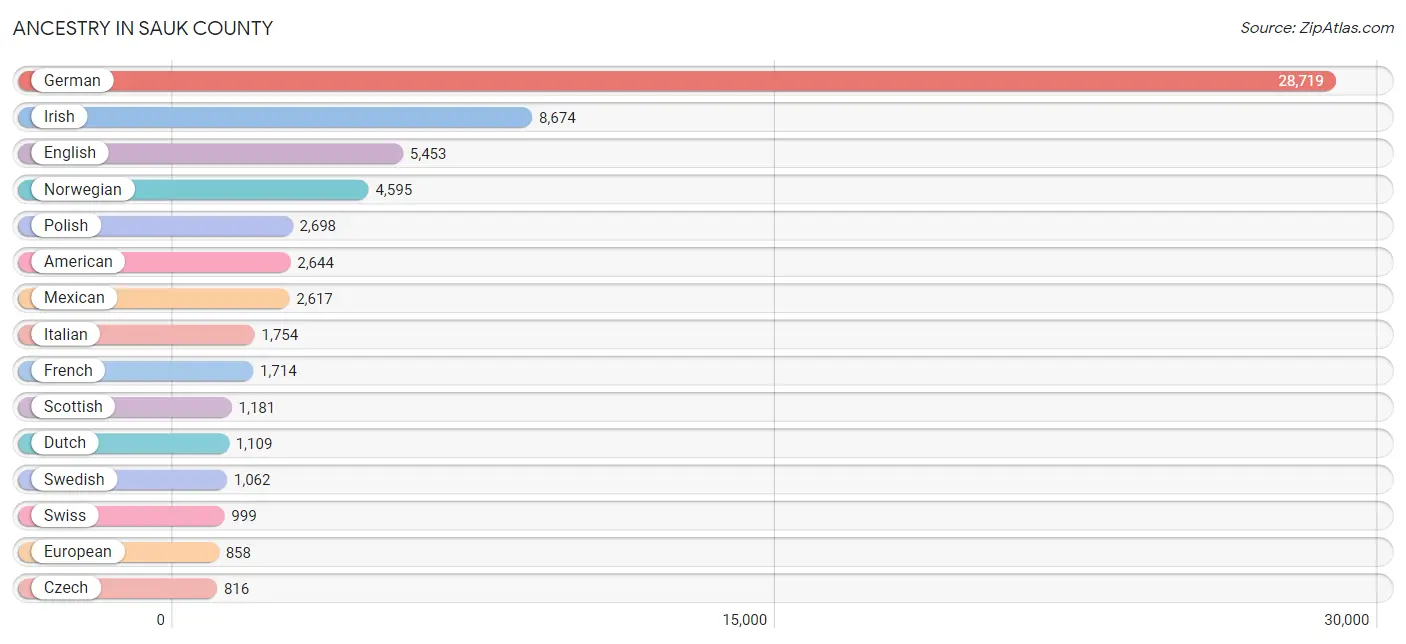
Ancestry in Sauk County
The most populous ancestries reported in Sauk County are German (28,719 | 43.7%), Irish (8,674 | 13.2%), English (5,453 | 8.3%), Norwegian (4,595 | 7.0%), and Polish (2,698 | 4.1%), together accounting for 76.4% of all Sauk County residents.
| Ancestry | # Population | % Population |
| African | 11 | 0.0% |
| Alaska Native | 7 | 0.0% |
| American | 2,644 | 4.0% |
| Apache | 9 | 0.0% |
| Arab | 9 | 0.0% |
| Arapaho | 5 | 0.0% |
| Argentinean | 14 | 0.0% |
| Armenian | 9 | 0.0% |
| Australian | 2 | 0.0% |
| Austrian | 162 | 0.3% |
| Bangladeshi | 6 | 0.0% |
| Belgian | 379 | 0.6% |
| Bhutanese | 192 | 0.3% |
| Blackfeet | 15 | 0.0% |
| British | 302 | 0.5% |
| Bulgarian | 160 | 0.2% |
| Burmese | 81 | 0.1% |
| Cajun | 7 | 0.0% |
| Cambodian | 5 | 0.0% |
| Canadian | 70 | 0.1% |
| Central American | 314 | 0.5% |
| Cherokee | 36 | 0.1% |
| Cheyenne | 8 | 0.0% |
| Chippewa | 115 | 0.2% |
| Colombian | 62 | 0.1% |
| Costa Rican | 33 | 0.1% |
| Creek | 2 | 0.0% |
| Croatian | 60 | 0.1% |
| Cuban | 30 | 0.1% |
| Czech | 816 | 1.2% |
| Czechoslovakian | 180 | 0.3% |
| Danish | 580 | 0.9% |
| Dutch | 1,109 | 1.7% |
| Eastern European | 200 | 0.3% |
| Ecuadorian | 40 | 0.1% |
| English | 5,453 | 8.3% |
| Estonian | 6 | 0.0% |
| Ethiopian | 2 | 0.0% |
| European | 858 | 1.3% |
| Finnish | 219 | 0.3% |
| French | 1,714 | 2.6% |
| French Canadian | 568 | 0.9% |
| German | 28,719 | 43.7% |
| German Russian | 41 | 0.1% |
| Greek | 181 | 0.3% |
| Guatemalan | 26 | 0.0% |
| Haitian | 36 | 0.1% |
| Honduran | 64 | 0.1% |
| Hungarian | 95 | 0.1% |
| Icelander | 4 | 0.0% |
| Indian (Asian) | 168 | 0.3% |
| Iranian | 9 | 0.0% |
| Irish | 8,674 | 13.2% |
| Iroquois | 11 | 0.0% |
| Italian | 1,754 | 2.7% |
| Jamaican | 54 | 0.1% |
| Korean | 70 | 0.1% |
| Latvian | 6 | 0.0% |
| Lebanese | 5 | 0.0% |
| Lithuanian | 98 | 0.2% |
| Luxembourger | 121 | 0.2% |
| Malaysian | 6 | 0.0% |
| Menominee | 7 | 0.0% |
| Mexican | 2,617 | 4.0% |
| Mexican American Indian | 1 | 0.0% |
| Native Hawaiian | 11 | 0.0% |
| Navajo | 13 | 0.0% |
| Nicaraguan | 183 | 0.3% |
| Northern European | 77 | 0.1% |
| Norwegian | 4,595 | 7.0% |
| Palestinian | 4 | 0.0% |
| Pennsylvania German | 509 | 0.8% |
| Peruvian | 89 | 0.1% |
| Pima | 18 | 0.0% |
| Polish | 2,698 | 4.1% |
| Portuguese | 11 | 0.0% |
| Potawatomi | 3 | 0.0% |
| Puerto Rican | 338 | 0.5% |
| Romanian | 124 | 0.2% |
| Russian | 246 | 0.4% |
| Salvadoran | 8 | 0.0% |
| Scandinavian | 157 | 0.2% |
| Scotch-Irish | 305 | 0.5% |
| Scottish | 1,181 | 1.8% |
| Serbian | 133 | 0.2% |
| Shoshone | 5 | 0.0% |
| Sioux | 19 | 0.0% |
| Slavic | 19 | 0.0% |
| Slovak | 137 | 0.2% |
| Slovene | 91 | 0.1% |
| South African | 2 | 0.0% |
| South American | 205 | 0.3% |
| South American Indian | 5 | 0.0% |
| Spaniard | 81 | 0.1% |
| Spanish | 43 | 0.1% |
| Sri Lankan | 20 | 0.0% |
| Subsaharan African | 19 | 0.0% |
| Swedish | 1,062 | 1.6% |
| Swiss | 999 | 1.5% |
| Thai | 46 | 0.1% |
| Turkish | 5 | 0.0% |
| U.S. Virgin Islander | 68 | 0.1% |
| Ugandan | 2 | 0.0% |
| Ukrainian | 234 | 0.4% |
| Welsh | 417 | 0.6% |
| Yugoslavian | 90 | 0.1% | View All 106 Rows |
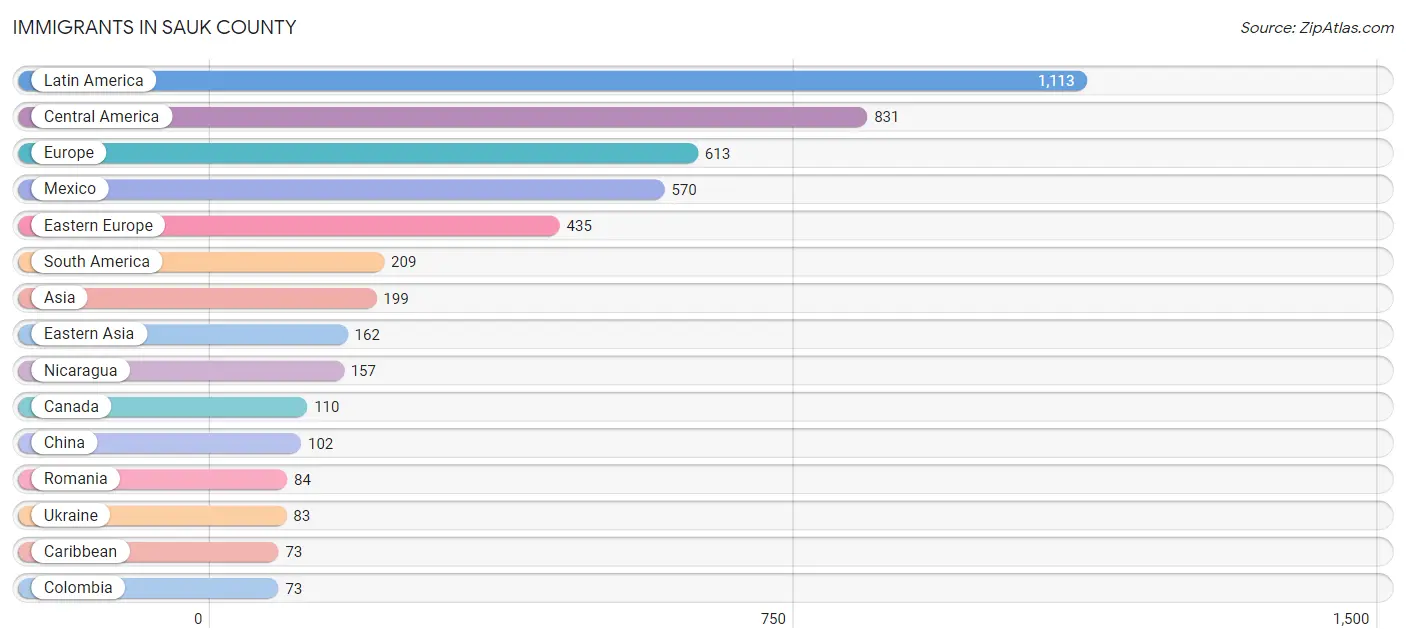
Immigrants in Sauk County
The most numerous immigrant groups reported in Sauk County came from Latin America (1,113 | 1.7%), Central America (831 | 1.3%), Europe (613 | 0.9%), Mexico (570 | 0.9%), and Eastern Europe (435 | 0.7%), together accounting for 5.4% of all Sauk County residents.
| Immigration Origin | # Population | % Population |
| Africa | 15 | 0.0% |
| Argentina | 5 | 0.0% |
| Asia | 199 | 0.3% |
| Belarus | 18 | 0.0% |
| Bulgaria | 13 | 0.0% |
| Canada | 110 | 0.2% |
| Caribbean | 73 | 0.1% |
| Central America | 831 | 1.3% |
| China | 102 | 0.2% |
| Colombia | 73 | 0.1% |
| Costa Rica | 33 | 0.1% |
| Czechoslovakia | 61 | 0.1% |
| Eastern Africa | 2 | 0.0% |
| Eastern Asia | 162 | 0.3% |
| Eastern Europe | 435 | 0.7% |
| Ecuador | 60 | 0.1% |
| El Salvador | 4 | 0.0% |
| England | 54 | 0.1% |
| Europe | 613 | 0.9% |
| Germany | 47 | 0.1% |
| Greece | 9 | 0.0% |
| Guatemala | 24 | 0.0% |
| Haiti | 36 | 0.1% |
| Honduras | 43 | 0.1% |
| Hungary | 9 | 0.0% |
| Indonesia | 5 | 0.0% |
| Israel | 2 | 0.0% |
| Italy | 8 | 0.0% |
| Jamaica | 37 | 0.1% |
| Japan | 44 | 0.1% |
| Kazakhstan | 2 | 0.0% |
| Korea | 11 | 0.0% |
| Laos | 3 | 0.0% |
| Latin America | 1,113 | 1.7% |
| Mexico | 570 | 0.9% |
| Netherlands | 4 | 0.0% |
| Nicaragua | 157 | 0.2% |
| Northern Europe | 62 | 0.1% |
| Oceania | 1 | 0.0% |
| Peru | 68 | 0.1% |
| Philippines | 10 | 0.0% |
| Poland | 61 | 0.1% |
| Romania | 84 | 0.1% |
| Russia | 47 | 0.1% |
| Serbia | 32 | 0.1% |
| South Africa | 4 | 0.0% |
| South America | 209 | 0.3% |
| South Central Asia | 2 | 0.0% |
| South Eastern Asia | 31 | 0.1% |
| Southern Europe | 65 | 0.1% |
| Spain | 48 | 0.1% |
| Sweden | 1 | 0.0% |
| Uganda | 2 | 0.0% |
| Ukraine | 83 | 0.1% |
| Venezuela | 3 | 0.0% |
| Vietnam | 13 | 0.0% |
| Western Asia | 2 | 0.0% |
| Western Europe | 51 | 0.1% | View All 58 Rows |
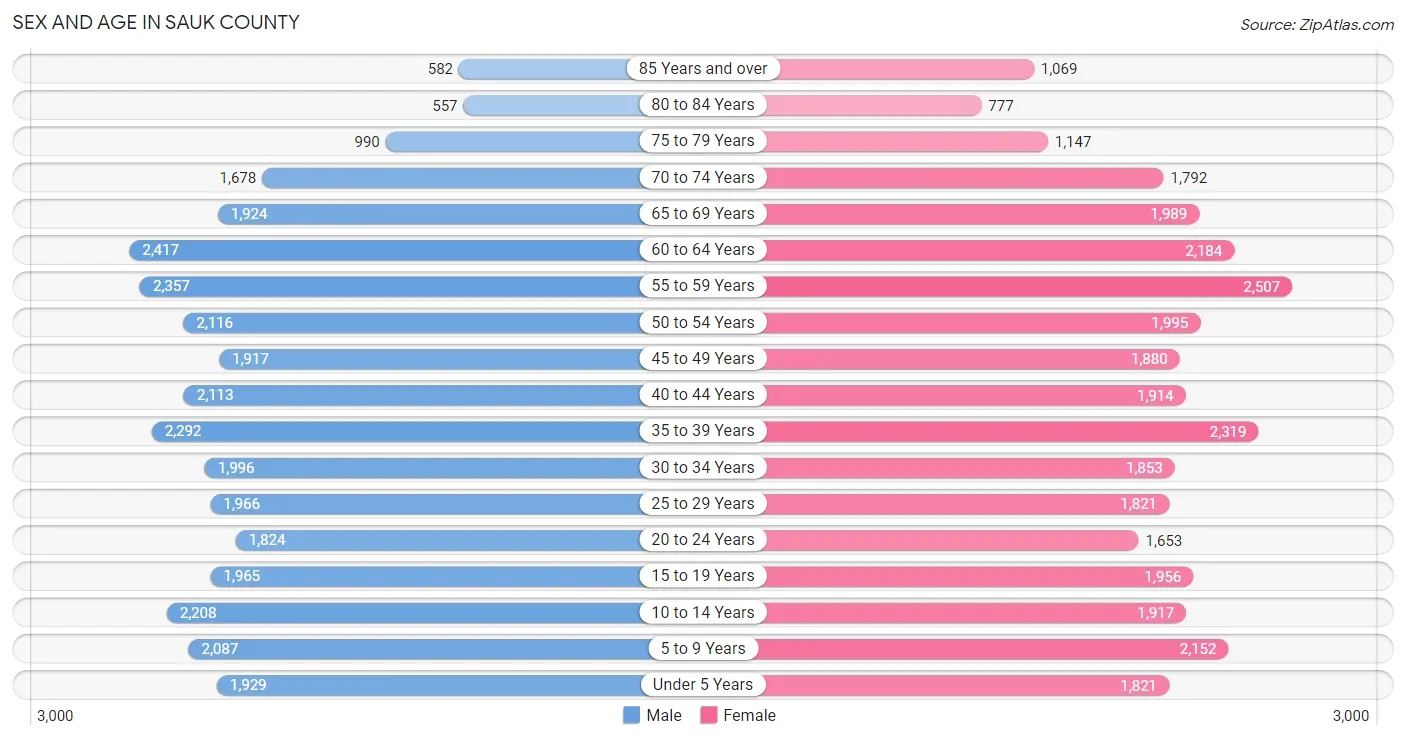
Sex and Age in Sauk County
Sex and Age in Sauk County
The most populous age groups in Sauk County are 60 to 64 Years (2,417 | 7.3%) for men and 55 to 59 Years (2,507 | 7.7%) for women.
| Age Bracket | Male | Female |
| Under 5 Years | 1,929 (5.9%) | 1,821 (5.6%) |
| 5 to 9 Years | 2,087 (6.3%) | 2,152 (6.6%) |
| 10 to 14 Years | 2,208 (6.7%) | 1,917 (5.9%) |
| 15 to 19 Years | 1,965 (6.0%) | 1,956 (6.0%) |
| 20 to 24 Years | 1,824 (5.5%) | 1,653 (5.1%) |
| 25 to 29 Years | 1,966 (6.0%) | 1,821 (5.6%) |
| 30 to 34 Years | 1,996 (6.1%) | 1,853 (5.7%) |
| 35 to 39 Years | 2,292 (7.0%) | 2,319 (7.1%) |
| 40 to 44 Years | 2,113 (6.4%) | 1,914 (5.8%) |
| 45 to 49 Years | 1,917 (5.8%) | 1,880 (5.7%) |
| 50 to 54 Years | 2,116 (6.4%) | 1,995 (6.1%) |
| 55 to 59 Years | 2,357 (7.2%) | 2,507 (7.7%) |
| 60 to 64 Years | 2,417 (7.3%) | 2,184 (6.7%) |
| 65 to 69 Years | 1,924 (5.8%) | 1,989 (6.1%) |
| 70 to 74 Years | 1,678 (5.1%) | 1,792 (5.5%) |
| 75 to 79 Years | 990 (3.0%) | 1,147 (3.5%) |
| 80 to 84 Years | 557 (1.7%) | 777 (2.4%) |
| 85 Years and over | 582 (1.8%) | 1,069 (3.3%) |
| Total | 32,918 (100.0%) | 32,746 (100.0%) |
Families and Households in Sauk County
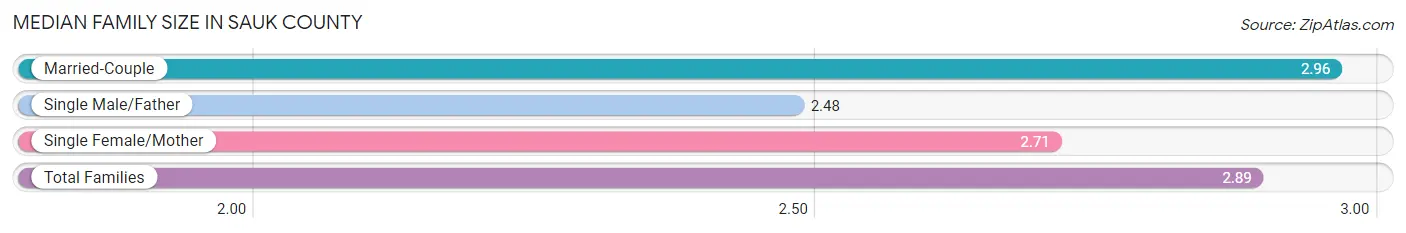
Median Family Size in Sauk County
The median family size in Sauk County is 2.89 persons per family, with married-couple families (14,060 | 78.2%) accounting for the largest median family size of 2.96 persons per family. On the other hand, single male/father families (1,399 | 7.8%) represent the smallest median family size with 2.48 persons per family.
| Family Type | # Families | Family Size |
| Married-Couple | 14,060 (78.2%) | 2.96 |
| Single Male/Father | 1,399 (7.8%) | 2.48 |
| Single Female/Mother | 2,510 (14.0%) | 2.71 |
| Total Families | 17,969 (100.0%) | 2.89 |
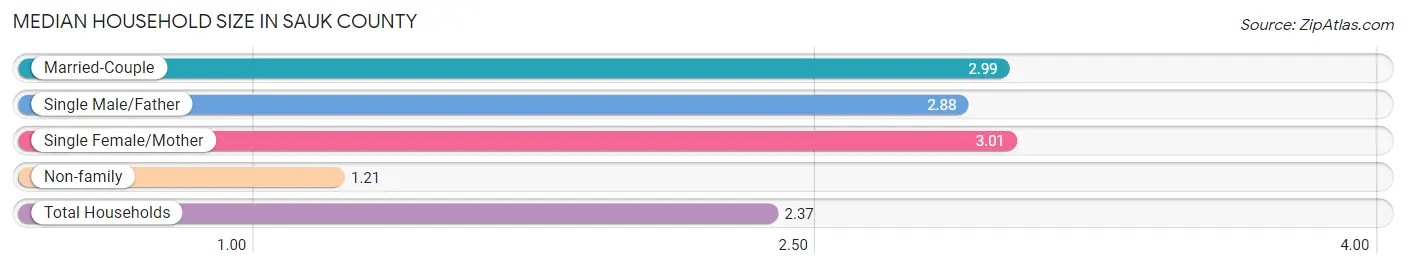
Median Household Size in Sauk County
The median household size in Sauk County is 2.37 persons per household, with single female/mother households (2,510 | 9.2%) accounting for the largest median household size of 3.01 persons per household. non-family households (9,344 | 34.2%) represent the smallest median household size with 1.21 persons per household.
| Household Type | # Households | Household Size |
| Married-Couple | 14,060 (51.5%) | 2.99 |
| Single Male/Father | 1,399 (5.1%) | 2.88 |
| Single Female/Mother | 2,510 (9.2%) | 3.01 |
| Non-family | 9,344 (34.2%) | 1.21 |
| Total Households | 27,313 (100.0%) | 2.37 |
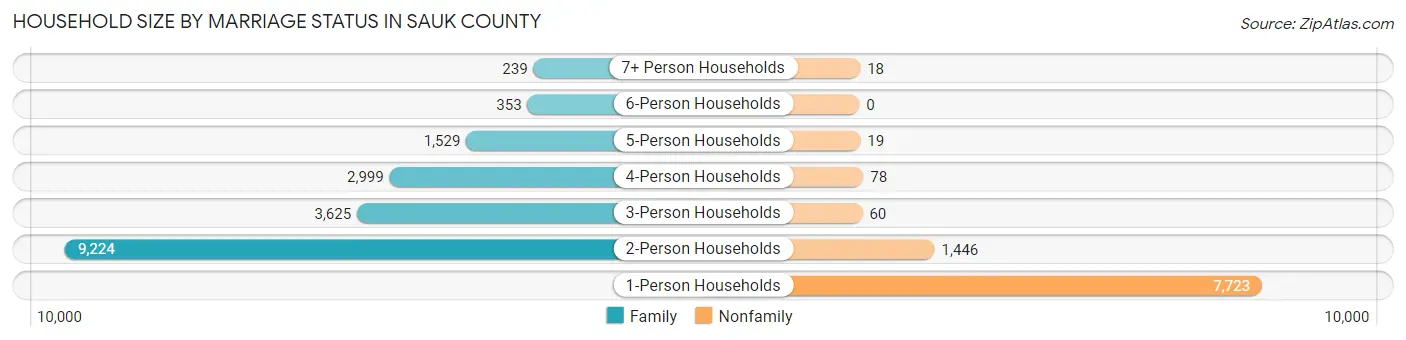
Household Size by Marriage Status in Sauk County
Out of a total of 27,313 households in Sauk County, 17,969 (65.8%) are family households, while 9,344 (34.2%) are nonfamily households. The most numerous type of family households are 2-person households, comprising 9,224, and the most common type of nonfamily households are 1-person households, comprising 7,723.
| Household Size | Family Households | Nonfamily Households |
| 1-Person Households | - | 7,723 (28.3%) |
| 2-Person Households | 9,224 (33.8%) | 1,446 (5.3%) |
| 3-Person Households | 3,625 (13.3%) | 60 (0.2%) |
| 4-Person Households | 2,999 (11.0%) | 78 (0.3%) |
| 5-Person Households | 1,529 (5.6%) | 19 (0.1%) |
| 6-Person Households | 353 (1.3%) | 0 (0.0%) |
| 7+ Person Households | 239 (0.9%) | 18 (0.1%) |
| Total | 17,969 (65.8%) | 9,344 (34.2%) |
Female Fertility in Sauk County
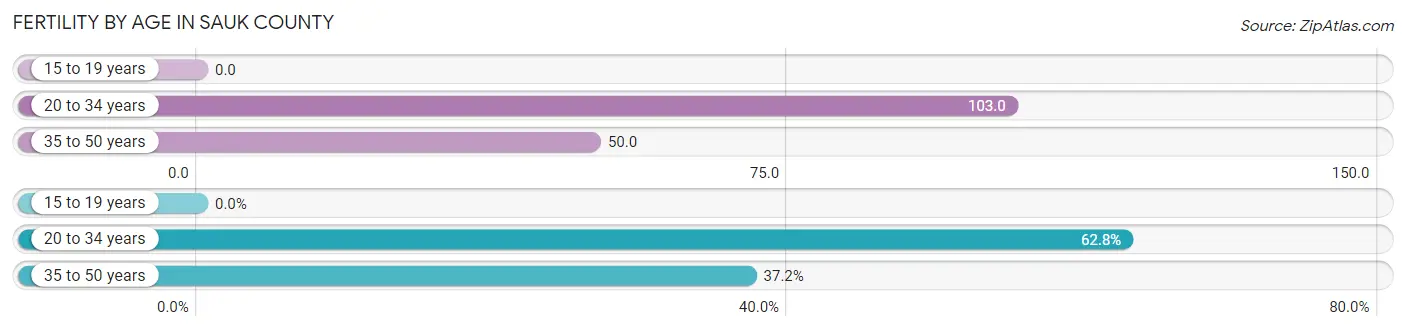
Fertility by Age in Sauk County
Average fertility rate in Sauk County is 63.0 births per 1,000 women. Women in the age bracket of 20 to 34 years have the highest fertility rate with 103.0 births per 1,000 women. Women in the age bracket of 20 to 34 years acount for 62.8% of all women with births.
| Age Bracket | Women with Births | Births / 1,000 Women |
| 15 to 19 years | 0 (0.0%) | 0.0 |
| 20 to 34 years | 548 (62.8%) | 103.0 |
| 35 to 50 years | 325 (37.2%) | 50.0 |
| Total | 873 (100.0%) | 63.0 |
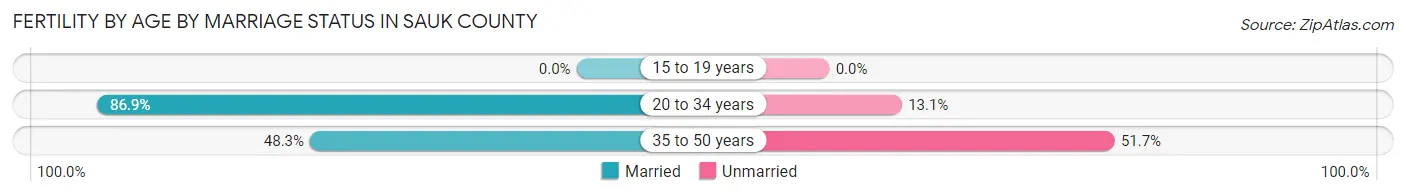
Fertility by Age by Marriage Status in Sauk County
72.5% of women with births (873) in Sauk County are married. The highest percentage of unmarried women with births falls into 35 to 50 years age bracket with 51.7% of them unmarried at the time of birth, while the lowest percentage of unmarried women with births belong to 20 to 34 years age bracket with 13.1% of them unmarried.
| Age Bracket | Married | Unmarried |
| 15 to 19 years | 0 (0.0%) | 0 (0.0%) |
| 20 to 34 years | 476 (86.9%) | 72 (13.1%) |
| 35 to 50 years | 157 (48.3%) | 168 (51.7%) |
| Total | 633 (72.5%) | 240 (27.5%) |
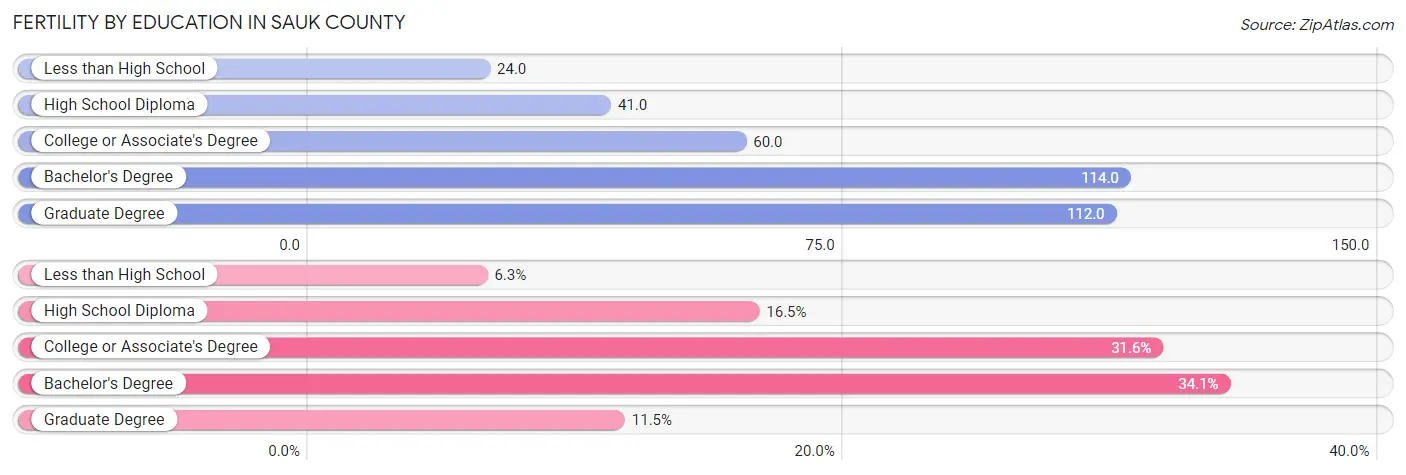
Fertility by Education in Sauk County
Average fertility rate in Sauk County is 63.0 births per 1,000 women. Women with the education attainment of bachelor's degree have the highest fertility rate of 114.0 births per 1,000 women, while women with the education attainment of less than high school have the lowest fertility at 24.0 births per 1,000 women. Women with the education attainment of bachelor's degree represent 34.1% of all women with births.
| Educational Attainment | Women with Births | Births / 1,000 Women |
| Less than High School | 55 (6.3%) | 24.0 |
| High School Diploma | 144 (16.5%) | 41.0 |
| College or Associate's Degree | 276 (31.6%) | 60.0 |
| Bachelor's Degree | 298 (34.1%) | 114.0 |
| Graduate Degree | 100 (11.5%) | 112.0 |
| Total | 873 (100.0%) | 63.0 |
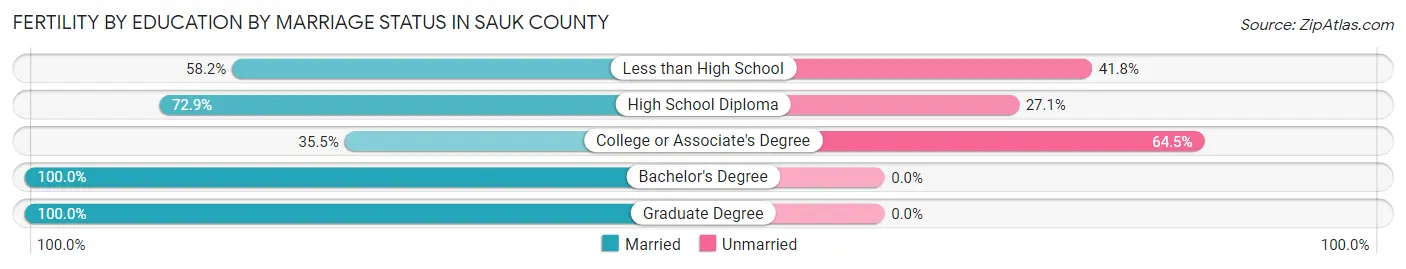
Fertility by Education by Marriage Status in Sauk County
27.5% of women with births in Sauk County are unmarried. Women with the educational attainment of bachelor's degree are most likely to be married with 100.0% of them married at childbirth, while women with the educational attainment of college or associate's degree are least likely to be married with 64.5% of them unmarried at childbirth.
| Educational Attainment | Married | Unmarried |
| Less than High School | 32 (58.2%) | 23 (41.8%) |
| High School Diploma | 105 (72.9%) | 39 (27.1%) |
| College or Associate's Degree | 98 (35.5%) | 178 (64.5%) |
| Bachelor's Degree | 298 (100.0%) | 0 (0.0%) |
| Graduate Degree | 100 (100.0%) | 0 (0.0%) |
| Total | 633 (72.5%) | 240 (27.5%) |
Income in Sauk County
Income Overview in Sauk County
Per Capita Income in Sauk County is $37,431, while median incomes of families and households are $91,153 and $72,930 respectively.
| Characteristic | Number | Measure |
| Per Capita Income | 65,664 | $37,431 |
| Median Family Income | 17,969 | $91,153 |
| Mean Family Income | 17,969 | $104,979 |
| Median Household Income | 27,313 | $72,930 |
| Mean Household Income | 27,313 | $88,938 |
| Income Deficit | 17,969 | $11,125 |
| Wage / Income Gap (%) | 65,664 | 24.94% |
| Wage / Income Gap ($) | 65,664 | 75.06¢ per $1 |
| Gini / Inequality Index | 65,664 | 0.41 |
Earnings by Sex in Sauk County
Average Earnings in Sauk County are $41,327, $47,479 for men and $35,636 for women, a difference of 24.9%.
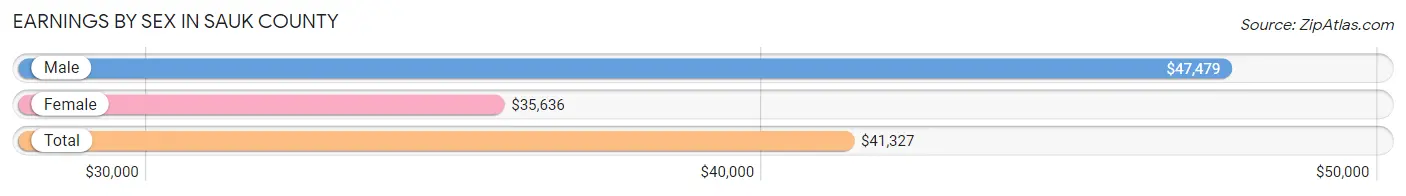
| Sex | Number | Average Earnings |
| Male | 19,985 (53.3%) | $47,479 |
| Female | 17,541 (46.7%) | $35,636 |
| Total | 37,526 (100.0%) | $41,327 |
Earnings by Sex by Income Bracket in Sauk County
The most common earnings brackets in Sauk County are $100,000+ for men (2,473 | 12.4%) and $55,000 to $64,999 for women (1,422 | 8.1%).

| Income | Male | Female |
| $2,499 or less | 786 (3.9%) | 751 (4.3%) |
| $2,500 to $4,999 | 717 (3.6%) | 785 (4.5%) |
| $5,000 to $7,499 | 433 (2.2%) | 863 (4.9%) |
| $7,500 to $9,999 | 593 (3.0%) | 513 (2.9%) |
| $10,000 to $12,499 | 480 (2.4%) | 553 (3.2%) |
| $12,500 to $14,999 | 448 (2.2%) | 562 (3.2%) |
| $15,000 to $17,499 | 399 (2.0%) | 454 (2.6%) |
| $17,500 to $19,999 | 255 (1.3%) | 528 (3.0%) |
| $20,000 to $22,499 | 596 (3.0%) | 401 (2.3%) |
| $22,500 to $24,999 | 525 (2.6%) | 642 (3.7%) |
| $25,000 to $29,999 | 884 (4.4%) | 1,279 (7.3%) |
| $30,000 to $34,999 | 1,043 (5.2%) | 1,274 (7.3%) |
| $35,000 to $39,999 | 1,003 (5.0%) | 1,164 (6.6%) |
| $40,000 to $44,999 | 1,172 (5.9%) | 1,313 (7.5%) |
| $45,000 to $49,999 | 1,114 (5.6%) | 1,066 (6.1%) |
| $50,000 to $54,999 | 1,191 (6.0%) | 830 (4.7%) |
| $55,000 to $64,999 | 2,130 (10.7%) | 1,422 (8.1%) |
| $65,000 to $74,999 | 1,586 (7.9%) | 860 (4.9%) |
| $75,000 to $99,999 | 2,157 (10.8%) | 1,298 (7.4%) |
| $100,000+ | 2,473 (12.4%) | 983 (5.6%) |
| Total | 19,985 (100.0%) | 17,541 (100.0%) |
Earnings by Sex by Educational Attainment in Sauk County
Average earnings in Sauk County are $53,165 for men and $40,367 for women, a difference of 24.1%. Men with an educational attainment of graduate degree enjoy the highest average annual earnings of $80,750, while those with less than high school education earn the least with $40,766. Women with an educational attainment of graduate degree earn the most with the average annual earnings of $61,621, while those with high school diploma education have the smallest earnings of $29,625.
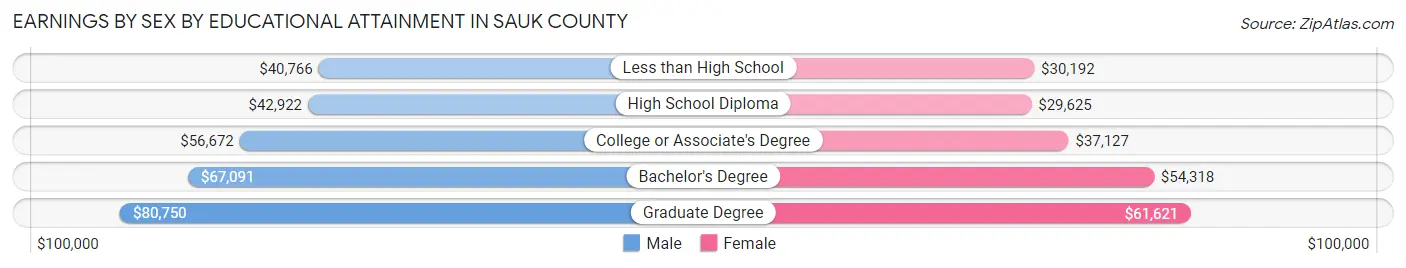
| Educational Attainment | Male Income | Female Income |
| Less than High School | $40,766 | $30,192 |
| High School Diploma | $42,922 | $29,625 |
| College or Associate's Degree | $56,672 | $37,127 |
| Bachelor's Degree | $67,091 | $54,318 |
| Graduate Degree | $80,750 | $61,621 |
| Total | $53,165 | $40,367 |
Family Income in Sauk County
Family Income Brackets in Sauk County
According to the Sauk County family income data, there are 4,528 families falling into the $100,000 to $149,999 income range, which is the most common income bracket and makes up 25.2% of all families. Conversely, the $10,000 to $14,999 income bracket is the least frequent group with only 180 families (1.0%) belonging to this category.
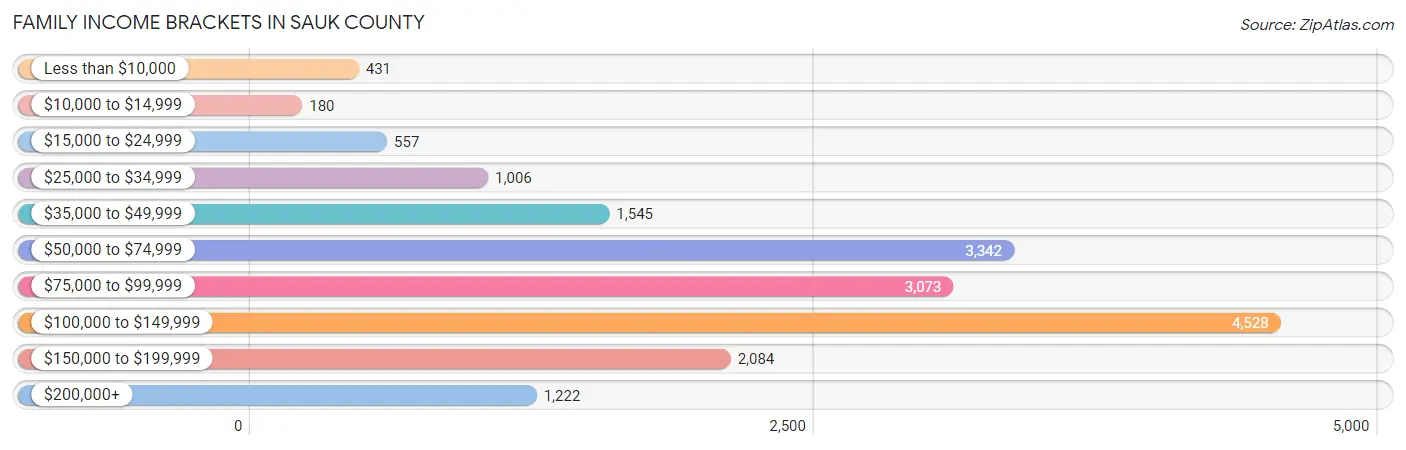
| Income Bracket | # Families | % Families |
| Less than $10,000 | 431 | 2.4% |
| $10,000 to $14,999 | 180 | 1.0% |
| $15,000 to $24,999 | 557 | 3.1% |
| $25,000 to $34,999 | 1,006 | 5.6% |
| $35,000 to $49,999 | 1,545 | 8.6% |
| $50,000 to $74,999 | 3,342 | 18.6% |
| $75,000 to $99,999 | 3,073 | 17.1% |
| $100,000 to $149,999 | 4,528 | 25.2% |
| $150,000 to $199,999 | 2,084 | 11.6% |
| $200,000+ | 1,222 | 6.8% |
Family Income by Famaliy Size in Sauk County
7+ person families (229 | 1.3%) account for the highest median family income in Sauk County with $123,828 per family, while 2-person families (9,976 | 55.5%) have the highest median income of $38,658 per family member.
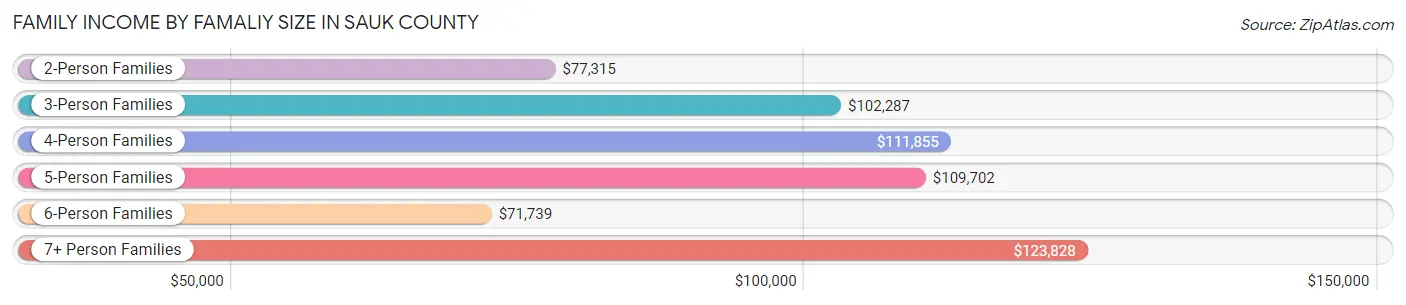
| Income Bracket | # Families | Median Income |
| 2-Person Families | 9,976 (55.5%) | $77,315 |
| 3-Person Families | 3,288 (18.3%) | $102,287 |
| 4-Person Families | 2,889 (16.1%) | $111,855 |
| 5-Person Families | 1,263 (7.0%) | $109,702 |
| 6-Person Families | 324 (1.8%) | $71,739 |
| 7+ Person Families | 229 (1.3%) | $123,828 |
| Total | 17,969 (100.0%) | $91,153 |
Family Income by Number of Earners in Sauk County
The median family income in Sauk County is $91,153, with families comprising 3+ earners (2,109) having the highest median family income of $129,214, while families with no earners (2,596) have the lowest median family income of $54,590, accounting for 11.7% and 14.4% of families, respectively.
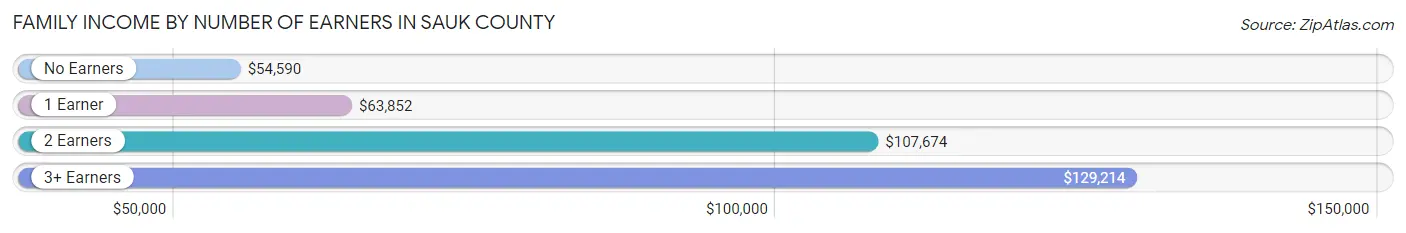
| Number of Earners | # Families | Median Income |
| No Earners | 2,596 (14.4%) | $54,590 |
| 1 Earner | 4,832 (26.9%) | $63,852 |
| 2 Earners | 8,432 (46.9%) | $107,674 |
| 3+ Earners | 2,109 (11.7%) | $129,214 |
| Total | 17,969 (100.0%) | $91,153 |
Household Income in Sauk County
Household Income Brackets in Sauk County
With 5,435 households falling in the category, the $100,000 to $149,999 income range is the most frequent in Sauk County, accounting for 19.9% of all households. In contrast, only 737 households (2.7%) fall into the $10,000 to $14,999 income bracket, making it the least populous group.

| Income Bracket | # Households | % Households |
| Less than $10,000 | 983 | 3.6% |
| $10,000 to $14,999 | 737 | 2.7% |
| $15,000 to $24,999 | 1,994 | 7.3% |
| $25,000 to $34,999 | 2,076 | 7.6% |
| $35,000 to $49,999 | 3,196 | 11.7% |
| $50,000 to $74,999 | 5,080 | 18.6% |
| $75,000 to $99,999 | 4,124 | 15.1% |
| $100,000 to $149,999 | 5,435 | 19.9% |
| $150,000 to $199,999 | 2,322 | 8.5% |
| $200,000+ | 1,366 | 5.0% |
Household Income by Householder Age in Sauk County
The median household income in Sauk County is $72,930, with the highest median household income of $89,926 found in the 45 to 64 years age bracket for the primary householder. A total of 9,852 households (36.1%) fall into this category. Meanwhile, the 15 to 24 years age bracket for the primary householder has the lowest median household income of $36,250, with 1,101 households (4.0%) in this group.
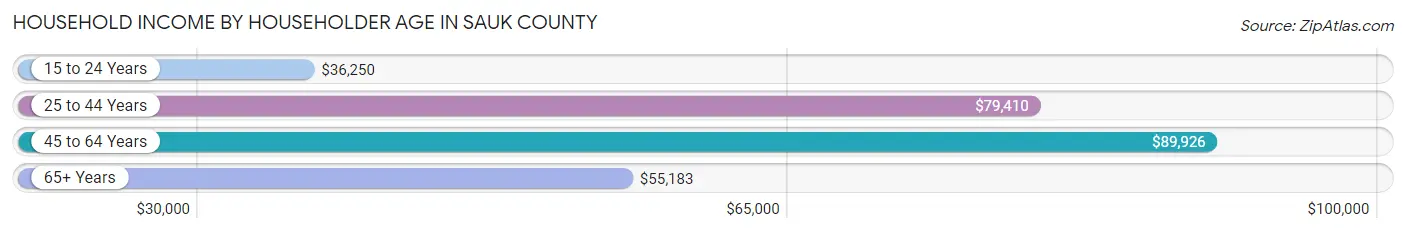
| Income Bracket | # Households | Median Income |
| 15 to 24 Years | 1,101 (4.0%) | $36,250 |
| 25 to 44 Years | 8,327 (30.5%) | $79,410 |
| 45 to 64 Years | 9,852 (36.1%) | $89,926 |
| 65+ Years | 8,033 (29.4%) | $55,183 |
| Total | 27,313 (100.0%) | $72,930 |
Poverty in Sauk County
Income Below Poverty by Sex and Age in Sauk County
With 7.5% poverty level for males and 9.8% for females among the residents of Sauk County, 6 to 11 year old males and 18 to 24 year old females are the most vulnerable to poverty, with 314 males (14.4%) and 443 females (19.6%) in their respective age groups living below the poverty level.
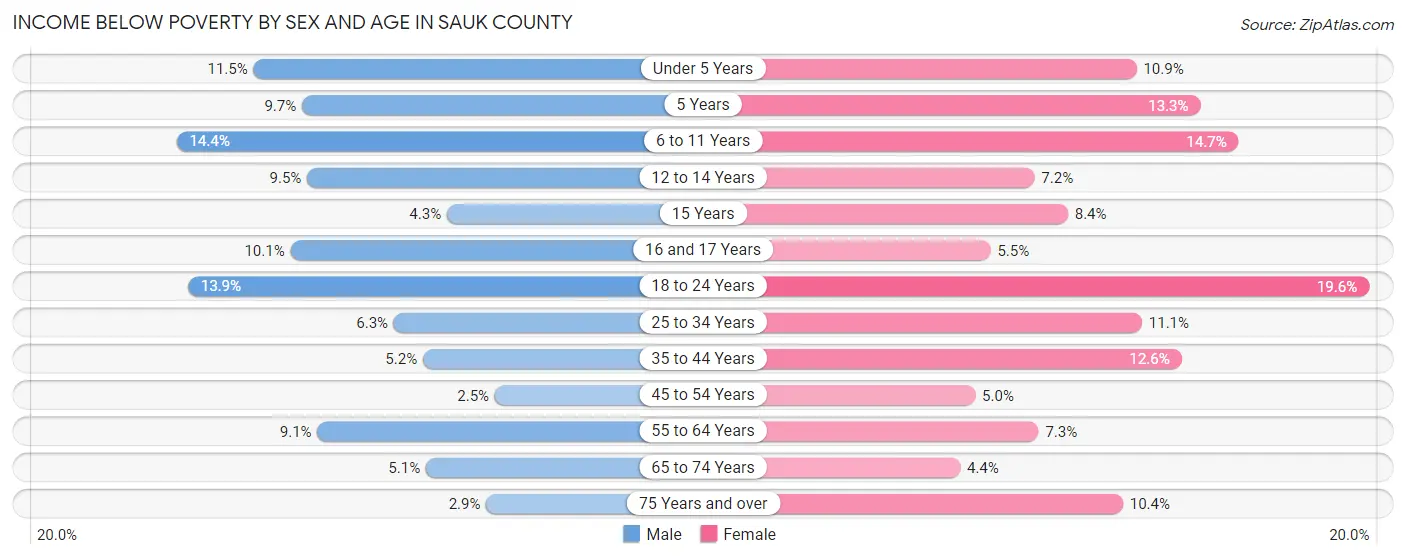
| Age Bracket | Male | Female |
| Under 5 Years | 217 (11.5%) | 189 (10.9%) |
| 5 Years | 55 (9.7%) | 47 (13.3%) |
| 6 to 11 Years | 314 (14.4%) | 373 (14.7%) |
| 12 to 14 Years | 137 (9.5%) | 79 (7.1%) |
| 15 Years | 16 (4.3%) | 47 (8.4%) |
| 16 and 17 Years | 93 (10.1%) | 43 (5.5%) |
| 18 to 24 Years | 341 (13.9%) | 443 (19.6%) |
| 25 to 34 Years | 247 (6.3%) | 409 (11.1%) |
| 35 to 44 Years | 227 (5.2%) | 533 (12.6%) |
| 45 to 54 Years | 101 (2.5%) | 192 (5.0%) |
| 55 to 64 Years | 435 (9.1%) | 341 (7.3%) |
| 65 to 74 Years | 183 (5.1%) | 165 (4.4%) |
| 75 Years and over | 58 (2.9%) | 288 (10.4%) |
| Total | 2,424 (7.5%) | 3,149 (9.8%) |
Income Above Poverty by Sex and Age in Sauk County
According to the poverty statistics in Sauk County, males aged 45 to 54 years and females aged 65 to 74 years are the age groups that are most secure financially, with 97.5% of males and 95.6% of females in these age groups living above the poverty line.
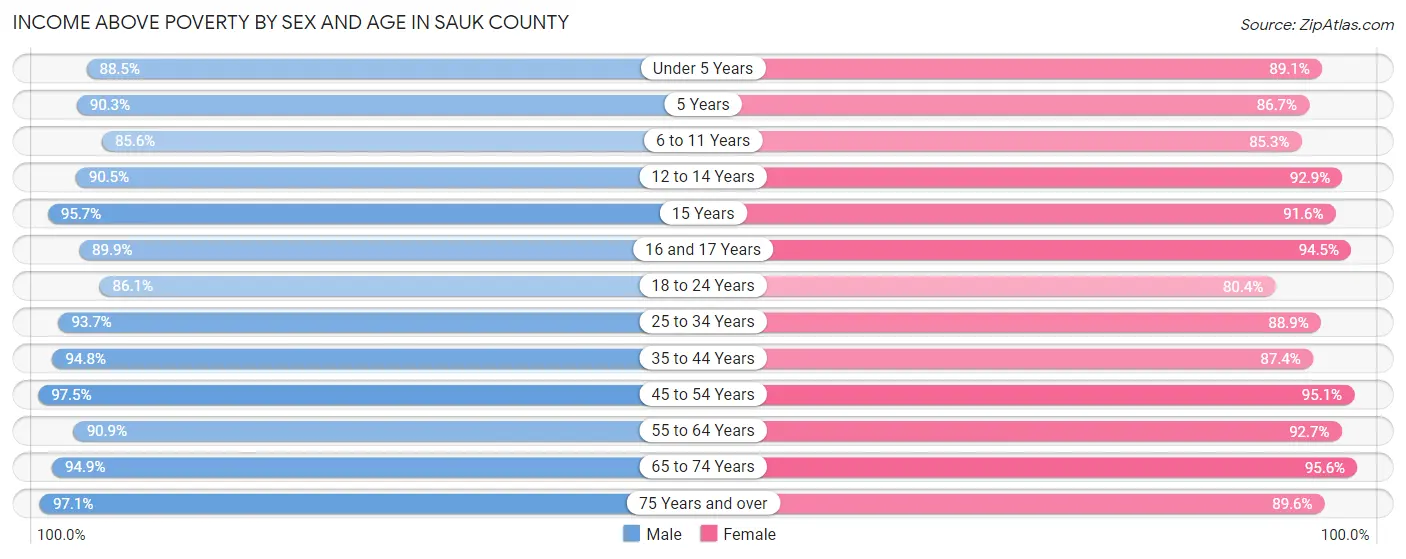
| Age Bracket | Male | Female |
| Under 5 Years | 1,670 (88.5%) | 1,538 (89.1%) |
| 5 Years | 512 (90.3%) | 306 (86.7%) |
| 6 to 11 Years | 1,872 (85.6%) | 2,160 (85.3%) |
| 12 to 14 Years | 1,303 (90.5%) | 1,026 (92.8%) |
| 15 Years | 354 (95.7%) | 513 (91.6%) |
| 16 and 17 Years | 825 (89.9%) | 736 (94.5%) |
| 18 to 24 Years | 2,106 (86.1%) | 1,821 (80.4%) |
| 25 to 34 Years | 3,677 (93.7%) | 3,261 (88.9%) |
| 35 to 44 Years | 4,129 (94.8%) | 3,695 (87.4%) |
| 45 to 54 Years | 3,882 (97.5%) | 3,683 (95.1%) |
| 55 to 64 Years | 4,329 (90.9%) | 4,331 (92.7%) |
| 65 to 74 Years | 3,403 (94.9%) | 3,594 (95.6%) |
| 75 Years and over | 1,968 (97.1%) | 2,474 (89.6%) |
| Total | 30,030 (92.5%) | 29,138 (90.2%) |
Income Below Poverty Among Married-Couple Families in Sauk County
The poverty statistics for married-couple families in Sauk County show that 3.0% or 427 of the total 14,060 families live below the poverty line. Families with 5 or more children have the highest poverty rate of 11.1%, comprising of 17 families. On the other hand, families with 1 or 2 children have the lowest poverty rate of 2.5%, which includes 99 families.
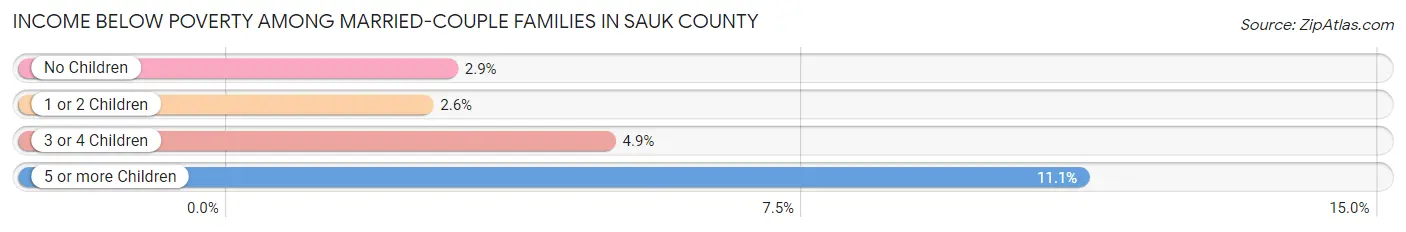
| Children | Above Poverty | Below Poverty |
| No Children | 8,632 (97.1%) | 255 (2.9%) |
| 1 or 2 Children | 3,786 (97.5%) | 99 (2.5%) |
| 3 or 4 Children | 1,079 (95.1%) | 56 (4.9%) |
| 5 or more Children | 136 (88.9%) | 17 (11.1%) |
| Total | 13,633 (97.0%) | 427 (3.0%) |
Income Below Poverty Among Single-Parent Households in Sauk County
According to the poverty data in Sauk County, 5.8% or 81 single-father households and 21.5% or 539 single-mother households are living below the poverty line. Among single-father households, those with 5 or more children have the highest poverty rate, with 2 households (66.7%) experiencing poverty. Likewise, among single-mother households, those with 5 or more children have the highest poverty rate, with 15 households (83.3%) falling below the poverty line.

| Children | Single Father | Single Mother |
| No Children | 22 (3.4%) | 37 (3.7%) |
| 1 or 2 Children | 48 (7.5%) | 322 (27.0%) |
| 3 or 4 Children | 9 (8.0%) | 165 (56.3%) |
| 5 or more Children | 2 (66.7%) | 15 (83.3%) |
| Total | 81 (5.8%) | 539 (21.5%) |
Income Below Poverty Among Married-Couple vs Single-Parent Households in Sauk County
The poverty data for Sauk County shows that 427 of the married-couple family households (3.0%) and 620 of the single-parent households (15.9%) are living below the poverty level. Within the married-couple family households, those with 5 or more children have the highest poverty rate, with 17 households (11.1%) falling below the poverty line. Among the single-parent households, those with 5 or more children have the highest poverty rate, with 17 household (80.9%) living below poverty.
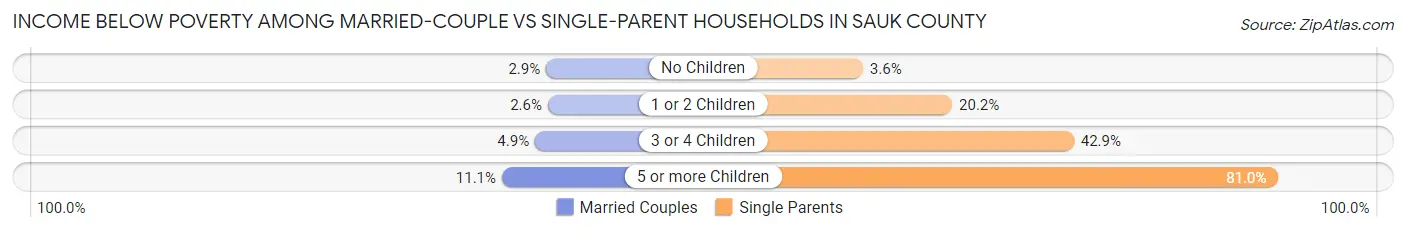
| Children | Married-Couple Families | Single-Parent Households |
| No Children | 255 (2.9%) | 59 (3.6%) |
| 1 or 2 Children | 99 (2.5%) | 370 (20.2%) |
| 3 or 4 Children | 56 (4.9%) | 174 (42.9%) |
| 5 or more Children | 17 (11.1%) | 17 (80.9%) |
| Total | 427 (3.0%) | 620 (15.9%) |
Employment Characteristics in Sauk County
Employment by Class of Employer in Sauk County
Among the 33,750 employed individuals in Sauk County, private company employees (23,947 | 71.0%), local government employees (2,903 | 8.6%), and not-for-profit organizations (2,392 | 7.1%) make up the most common classes of employment.
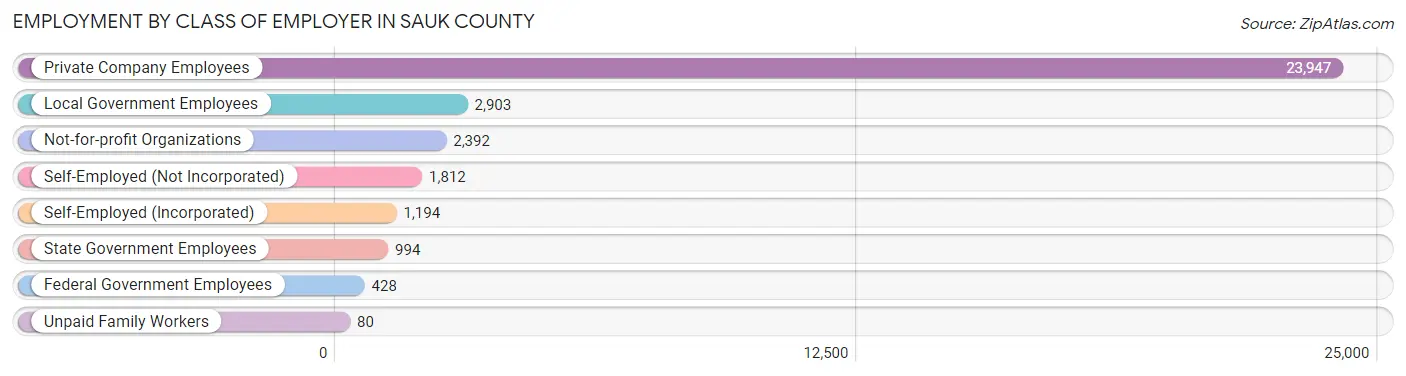
| Employer Class | # Employees | % Employees |
| Private Company Employees | 23,947 | 71.0% |
| Self-Employed (Incorporated) | 1,194 | 3.5% |
| Self-Employed (Not Incorporated) | 1,812 | 5.4% |
| Not-for-profit Organizations | 2,392 | 7.1% |
| Local Government Employees | 2,903 | 8.6% |
| State Government Employees | 994 | 2.9% |
| Federal Government Employees | 428 | 1.3% |
| Unpaid Family Workers | 80 | 0.2% |
| Total | 33,750 | 100.0% |
Employment Status by Age in Sauk County
According to the labor force statistics for Sauk County, out of the total population over 16 years of age (52,620), 67.0% or 35,255 individuals are in the labor force, with 2.8% or 987 of them unemployed. The age group with the highest labor force participation rate is 25 to 29 years, with 93.3% or 3,533 individuals in the labor force. Within the labor force, the 20 to 24 years age range has the highest percentage of unemployed individuals, with 6.2% or 172 of them being unemployed.
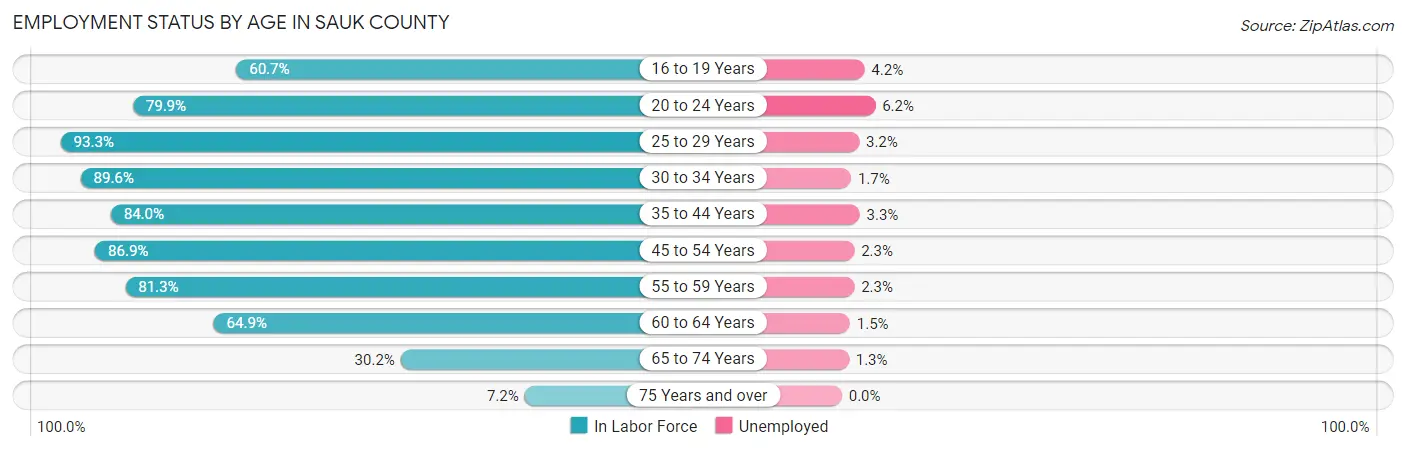
| Age Bracket | In Labor Force | Unemployed |
| 16 to 19 Years | 1,816 (60.7%) | 76 (4.2%) |
| 20 to 24 Years | 2,778 (79.9%) | 172 (6.2%) |
| 25 to 29 Years | 3,533 (93.3%) | 113 (3.2%) |
| 30 to 34 Years | 3,449 (89.6%) | 59 (1.7%) |
| 35 to 44 Years | 7,256 (84.0%) | 239 (3.3%) |
| 45 to 54 Years | 6,872 (86.9%) | 158 (2.3%) |
| 55 to 59 Years | 3,954 (81.3%) | 91 (2.3%) |
| 60 to 64 Years | 2,986 (64.9%) | 45 (1.5%) |
| 65 to 74 Years | 2,230 (30.2%) | 29 (1.3%) |
| 75 Years and over | 369 (7.2%) | 0 (0.0%) |
| Total | 35,255 (67.0%) | 987 (2.8%) |
Employment Status by Educational Attainment in Sauk County
According to labor force statistics for Sauk County, 83.4% of individuals (28,062) out of the total population between 25 and 64 years of age (33,647) are in the labor force, with 2.5% or 702 of them being unemployed. The group with the highest labor force participation rate are those with the educational attainment of bachelor's degree or higher, with 91.1% or 8,024 individuals in the labor force. Within the labor force, individuals with less than high school education have the highest percentage of unemployment, with 6.9% or 119 of them being unemployed.
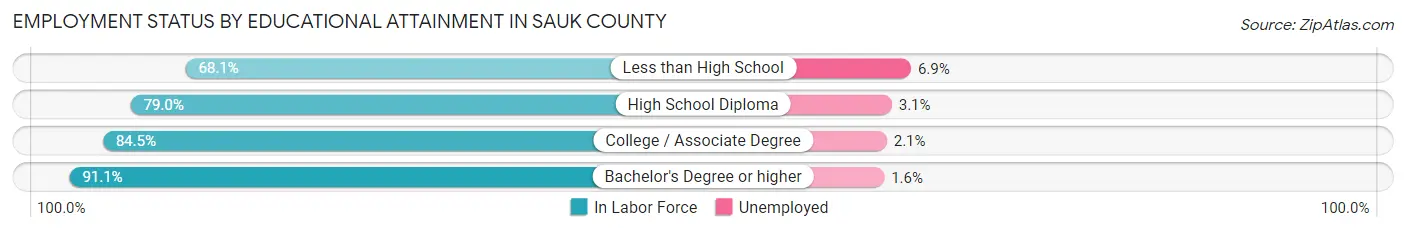
| Educational Attainment | In Labor Force | Unemployed |
| Less than High School | 1,720 (68.1%) | 174 (6.9%) |
| High School Diploma | 7,979 (79.0%) | 313 (3.1%) |
| College / Associate Degree | 10,320 (84.5%) | 256 (2.1%) |
| Bachelor's Degree or higher | 8,024 (91.1%) | 141 (1.6%) |
| Total | 28,062 (83.4%) | 841 (2.5%) |
Employment Occupations by Sex in Sauk County
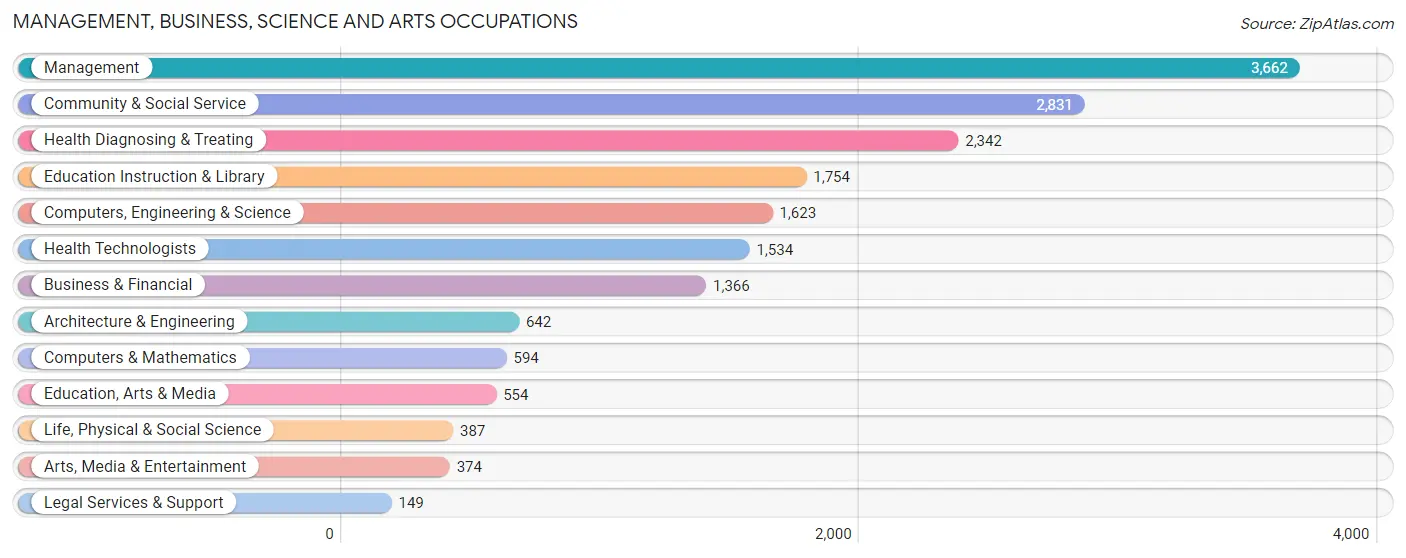
Management, Business, Science and Arts Occupations
The most common Management, Business, Science and Arts occupations in Sauk County are Management (3,662 | 10.7%), Community & Social Service (2,831 | 8.3%), Health Diagnosing & Treating (2,342 | 6.8%), Education Instruction & Library (1,754 | 5.1%), and Computers, Engineering & Science (1,623 | 4.7%).
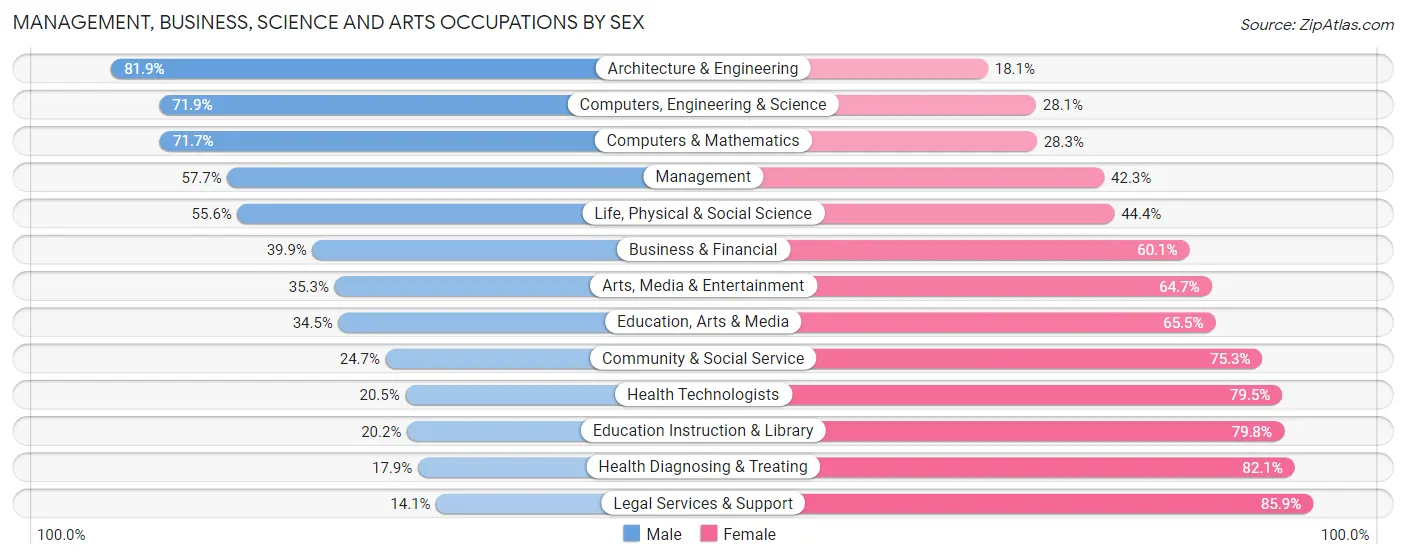
Management, Business, Science and Arts Occupations by Sex
Within the Management, Business, Science and Arts occupations in Sauk County, the most male-oriented occupations are Architecture & Engineering (81.9%), Computers, Engineering & Science (71.9%), and Computers & Mathematics (71.7%), while the most female-oriented occupations are Legal Services & Support (85.9%), Health Diagnosing & Treating (82.1%), and Education Instruction & Library (79.8%).
| Occupation | Male | Female |
| Management | 2,112 (57.7%) | 1,550 (42.3%) |
| Business & Financial | 545 (39.9%) | 821 (60.1%) |
| Computers, Engineering & Science | 1,167 (71.9%) | 456 (28.1%) |
| Computers & Mathematics | 426 (71.7%) | 168 (28.3%) |
| Architecture & Engineering | 526 (81.9%) | 116 (18.1%) |
| Life, Physical & Social Science | 215 (55.6%) | 172 (44.4%) |
| Community & Social Service | 698 (24.7%) | 2,133 (75.3%) |
| Education, Arts & Media | 191 (34.5%) | 363 (65.5%) |
| Legal Services & Support | 21 (14.1%) | 128 (85.9%) |
| Education Instruction & Library | 354 (20.2%) | 1,400 (79.8%) |
| Arts, Media & Entertainment | 132 (35.3%) | 242 (64.7%) |
| Health Diagnosing & Treating | 420 (17.9%) | 1,922 (82.1%) |
| Health Technologists | 315 (20.5%) | 1,219 (79.5%) |
| Total (Category) | 4,942 (41.8%) | 6,882 (58.2%) |
| Total (Overall) | 18,108 (52.9%) | 16,113 (47.1%) |
Services Occupations
The most common Services occupations in Sauk County are Food Preparation & Serving (2,074 | 6.1%), Cleaning & Maintenance (1,295 | 3.8%), Healthcare Support (1,245 | 3.6%), Security & Protection (959 | 2.8%), and Personal Care & Service (742 | 2.2%).

Services Occupations by Sex
Within the Services occupations in Sauk County, the most male-oriented occupations are Law Enforcement (78.0%), Cleaning & Maintenance (72.1%), and Security & Protection (63.2%), while the most female-oriented occupations are Healthcare Support (83.3%), Personal Care & Service (82.9%), and Food Preparation & Serving (53.0%).

| Occupation | Male | Female |
| Healthcare Support | 208 (16.7%) | 1,037 (83.3%) |
| Security & Protection | 606 (63.2%) | 353 (36.8%) |
| Firefighting & Prevention | 259 (50.4%) | 255 (49.6%) |
| Law Enforcement | 347 (78.0%) | 98 (22.0%) |
| Food Preparation & Serving | 974 (47.0%) | 1,100 (53.0%) |
| Cleaning & Maintenance | 934 (72.1%) | 361 (27.9%) |
| Personal Care & Service | 127 (17.1%) | 615 (82.9%) |
| Total (Category) | 2,849 (45.1%) | 3,466 (54.9%) |
| Total (Overall) | 18,108 (52.9%) | 16,113 (47.1%) |
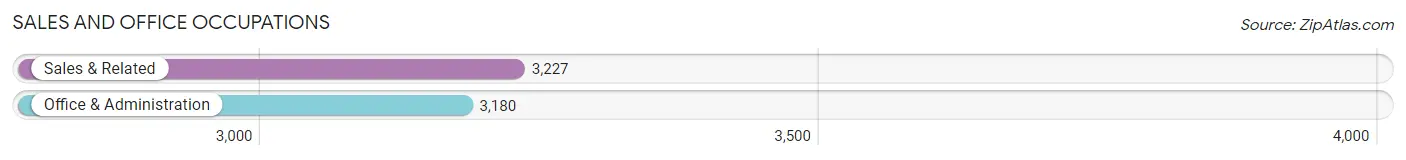
Sales and Office Occupations
The most common Sales and Office occupations in Sauk County are Sales & Related (3,227 | 9.4%), and Office & Administration (3,180 | 9.3%).
Sales and Office Occupations by Sex
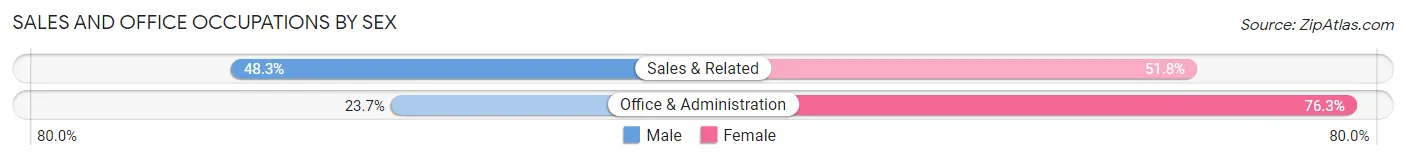
| Occupation | Male | Female |
| Sales & Related | 1,557 (48.2%) | 1,670 (51.7%) |
| Office & Administration | 753 (23.7%) | 2,427 (76.3%) |
| Total (Category) | 2,310 (36.0%) | 4,097 (63.9%) |
| Total (Overall) | 18,108 (52.9%) | 16,113 (47.1%) |
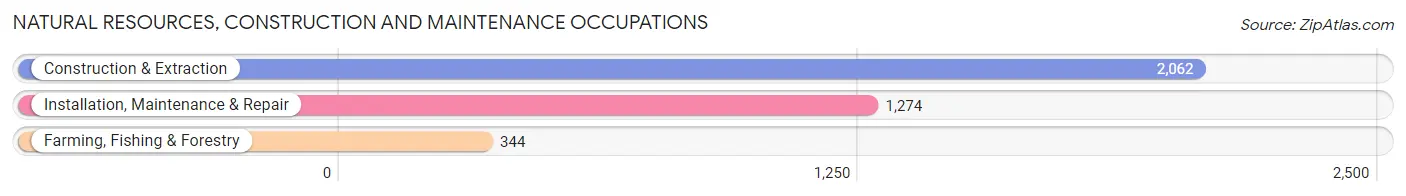
Natural Resources, Construction and Maintenance Occupations
The most common Natural Resources, Construction and Maintenance occupations in Sauk County are Construction & Extraction (2,062 | 6.0%), Installation, Maintenance & Repair (1,274 | 3.7%), and Farming, Fishing & Forestry (344 | 1.0%).
Natural Resources, Construction and Maintenance Occupations by Sex

| Occupation | Male | Female |
| Farming, Fishing & Forestry | 274 (79.6%) | 70 (20.3%) |
| Construction & Extraction | 1,997 (96.9%) | 65 (3.2%) |
| Installation, Maintenance & Repair | 1,240 (97.3%) | 34 (2.7%) |
| Total (Category) | 3,511 (95.4%) | 169 (4.6%) |
| Total (Overall) | 18,108 (52.9%) | 16,113 (47.1%) |
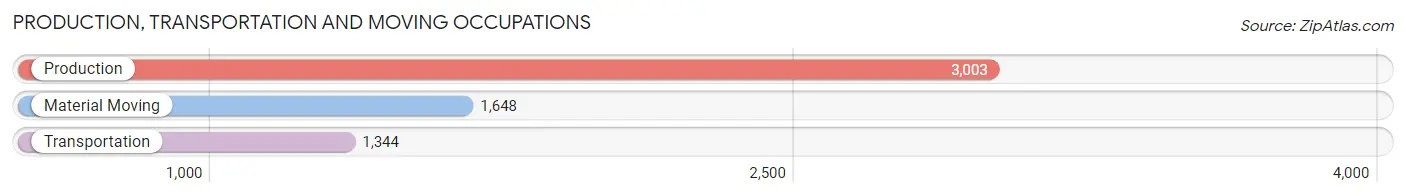
Production, Transportation and Moving Occupations
The most common Production, Transportation and Moving occupations in Sauk County are Production (3,003 | 8.8%), Material Moving (1,648 | 4.8%), and Transportation (1,344 | 3.9%).
Production, Transportation and Moving Occupations by Sex
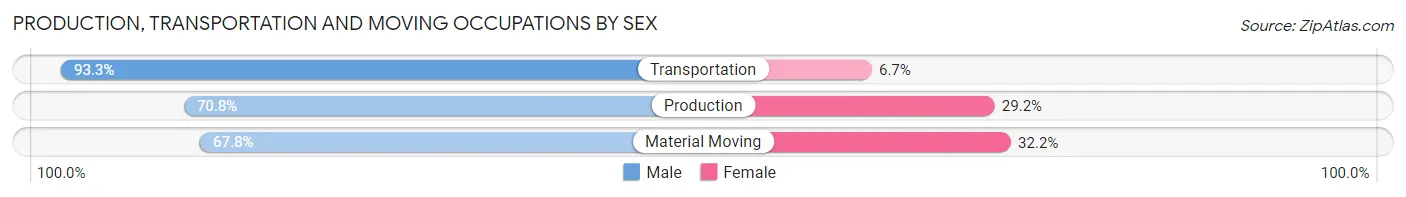
| Occupation | Male | Female |
| Production | 2,125 (70.8%) | 878 (29.2%) |
| Transportation | 1,254 (93.3%) | 90 (6.7%) |
| Material Moving | 1,117 (67.8%) | 531 (32.2%) |
| Total (Category) | 4,496 (75.0%) | 1,499 (25.0%) |
| Total (Overall) | 18,108 (52.9%) | 16,113 (47.1%) |
Employment Industries by Sex in Sauk County
Employment Industries in Sauk County
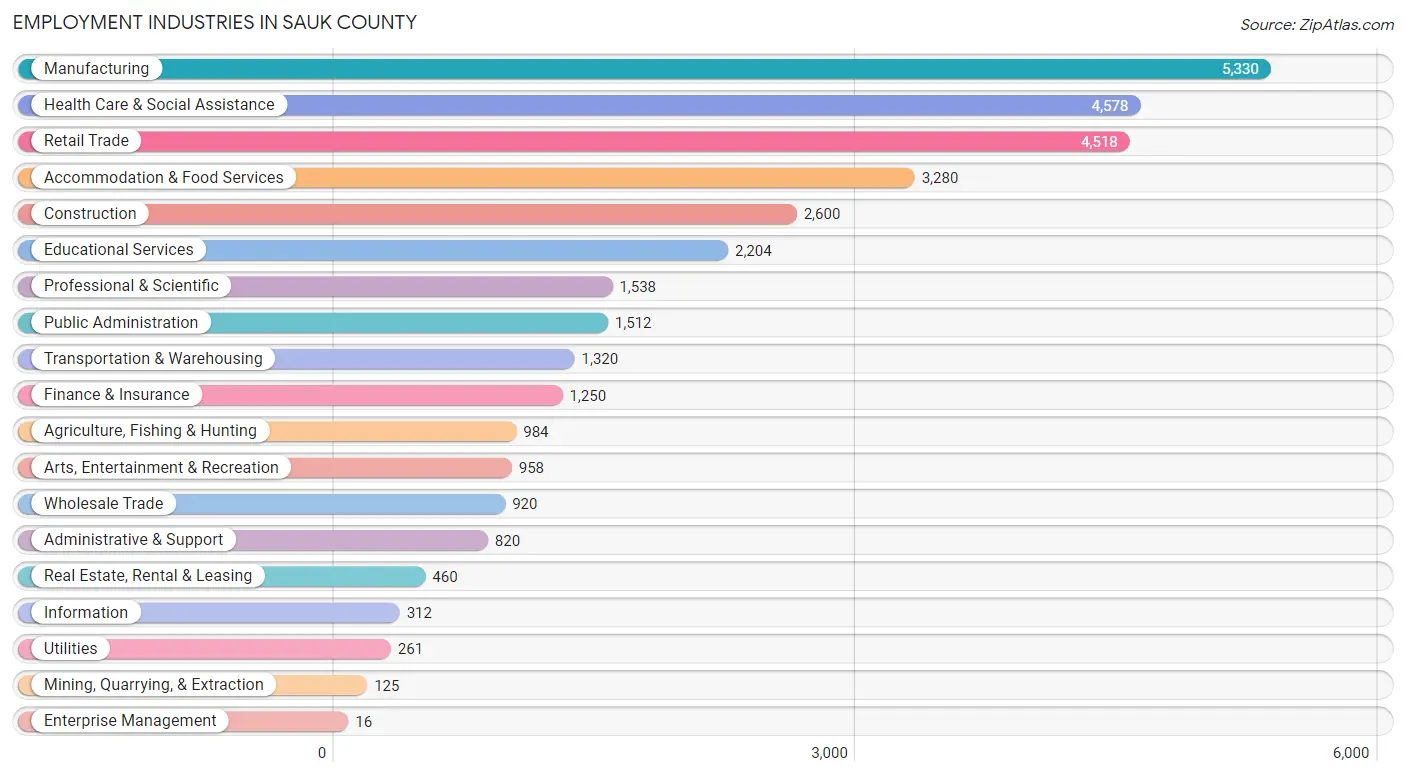
The major employment industries in Sauk County include Manufacturing (5,330 | 15.6%), Health Care & Social Assistance (4,578 | 13.4%), Retail Trade (4,518 | 13.2%), Accommodation & Food Services (3,280 | 9.6%), and Construction (2,600 | 7.6%).
Employment Industries by Sex in Sauk County
The Sauk County industries that see more men than women are Utilities (96.2%), Mining, Quarrying, & Extraction (92.0%), and Construction (91.6%), whereas the industries that tend to have a higher number of women are Health Care & Social Assistance (82.0%), Educational Services (73.6%), and Finance & Insurance (67.8%).
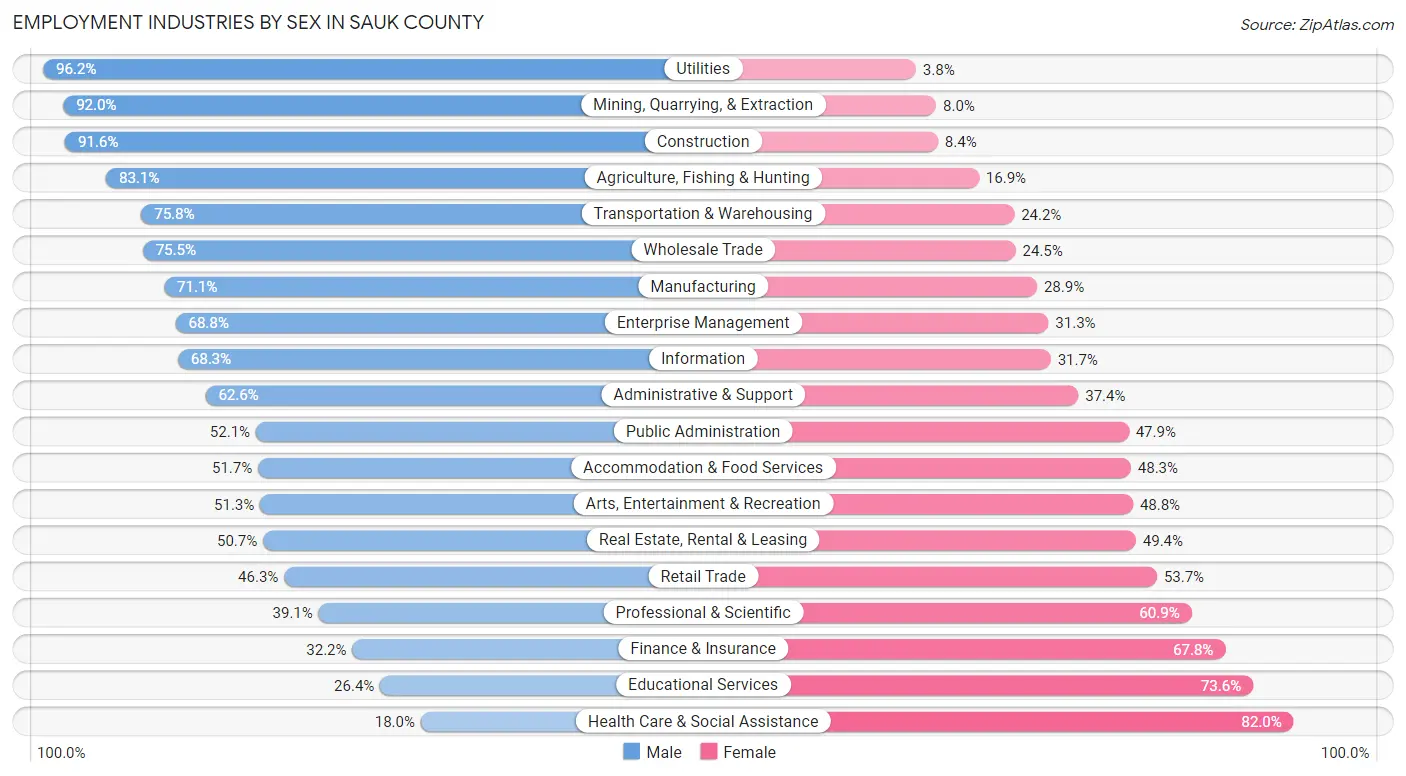
| Industry | Male | Female |
| Agriculture, Fishing & Hunting | 818 (83.1%) | 166 (16.9%) |
| Mining, Quarrying, & Extraction | 115 (92.0%) | 10 (8.0%) |
| Construction | 2,382 (91.6%) | 218 (8.4%) |
| Manufacturing | 3,790 (71.1%) | 1,540 (28.9%) |
| Wholesale Trade | 695 (75.5%) | 225 (24.5%) |
| Retail Trade | 2,091 (46.3%) | 2,427 (53.7%) |
| Transportation & Warehousing | 1,001 (75.8%) | 319 (24.2%) |
| Utilities | 251 (96.2%) | 10 (3.8%) |
| Information | 213 (68.3%) | 99 (31.7%) |
| Finance & Insurance | 402 (32.2%) | 848 (67.8%) |
| Real Estate, Rental & Leasing | 233 (50.6%) | 227 (49.3%) |
| Professional & Scientific | 602 (39.1%) | 936 (60.9%) |
| Enterprise Management | 11 (68.8%) | 5 (31.2%) |
| Administrative & Support | 513 (62.6%) | 307 (37.4%) |
| Educational Services | 582 (26.4%) | 1,622 (73.6%) |
| Health Care & Social Assistance | 824 (18.0%) | 3,754 (82.0%) |
| Arts, Entertainment & Recreation | 491 (51.2%) | 467 (48.7%) |
| Accommodation & Food Services | 1,695 (51.7%) | 1,585 (48.3%) |
| Public Administration | 788 (52.1%) | 724 (47.9%) |
| Total | 18,108 (52.9%) | 16,113 (47.1%) |
Education in Sauk County
School Enrollment in Sauk County
The most common levels of schooling among the 13,453 students in Sauk County are middle school (3,467 | 25.8%), high school (3,085 | 22.9%), and elementary school (3,042 | 22.6%).
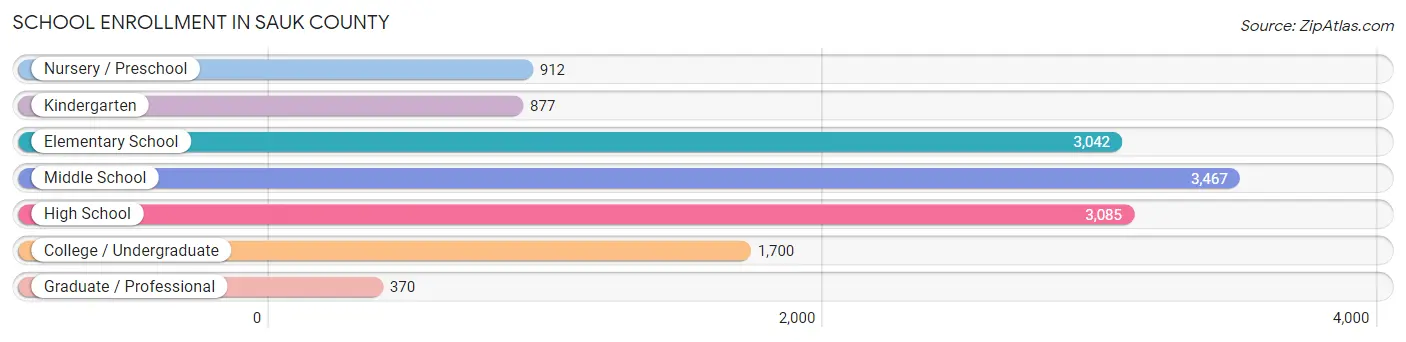
| School Level | # Students | % Students |
| Nursery / Preschool | 912 | 6.8% |
| Kindergarten | 877 | 6.5% |
| Elementary School | 3,042 | 22.6% |
| Middle School | 3,467 | 25.8% |
| High School | 3,085 | 22.9% |
| College / Undergraduate | 1,700 | 12.6% |
| Graduate / Professional | 370 | 2.8% |
| Total | 13,453 | 100.0% |
School Enrollment by Age by Funding Source in Sauk County
Out of a total of 13,453 students who are enrolled in schools in Sauk County, 2,260 (16.8%) attend a private institution, while the remaining 11,193 (83.2%) are enrolled in public schools. The age group of 3 to 4 year olds has the highest likelihood of being enrolled in private schools, with 198 (35.3% in the age bracket) enrolled. Conversely, the age group of 15 to 17 year olds has the lowest likelihood of being enrolled in a private school, with 2,294 (93.8% in the age bracket) attending a public institution.
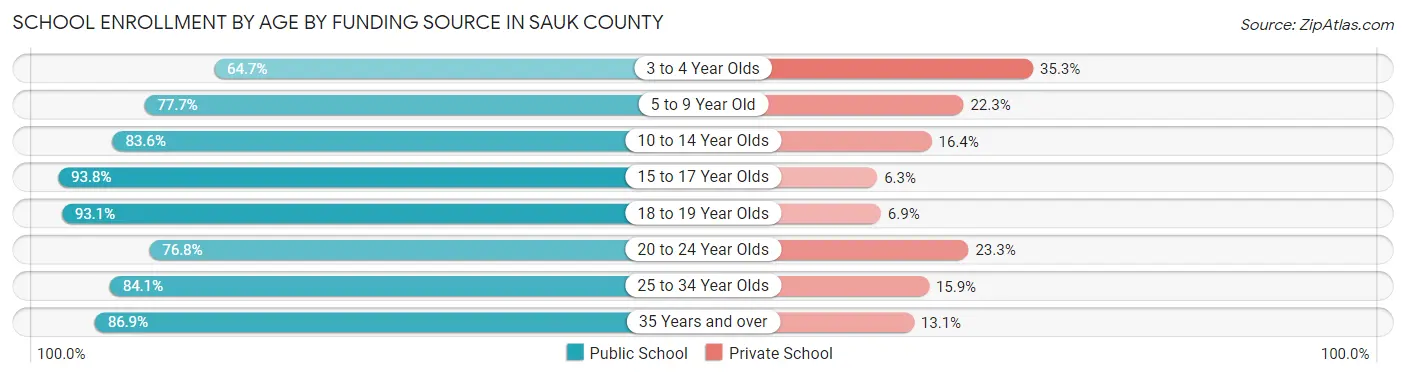
| Age Bracket | Public School | Private School |
| 3 to 4 Year Olds | 363 (64.7%) | 198 (35.3%) |
| 5 to 9 Year Old | 3,063 (77.7%) | 880 (22.3%) |
| 10 to 14 Year Olds | 3,348 (83.6%) | 656 (16.4%) |
| 15 to 17 Year Olds | 2,294 (93.8%) | 153 (6.2%) |
| 18 to 19 Year Olds | 657 (93.1%) | 49 (6.9%) |
| 20 to 24 Year Olds | 604 (76.7%) | 183 (23.3%) |
| 25 to 34 Year Olds | 408 (84.1%) | 77 (15.9%) |
| 35 Years and over | 452 (86.9%) | 68 (13.1%) |
| Total | 11,193 (83.2%) | 2,260 (16.8%) |
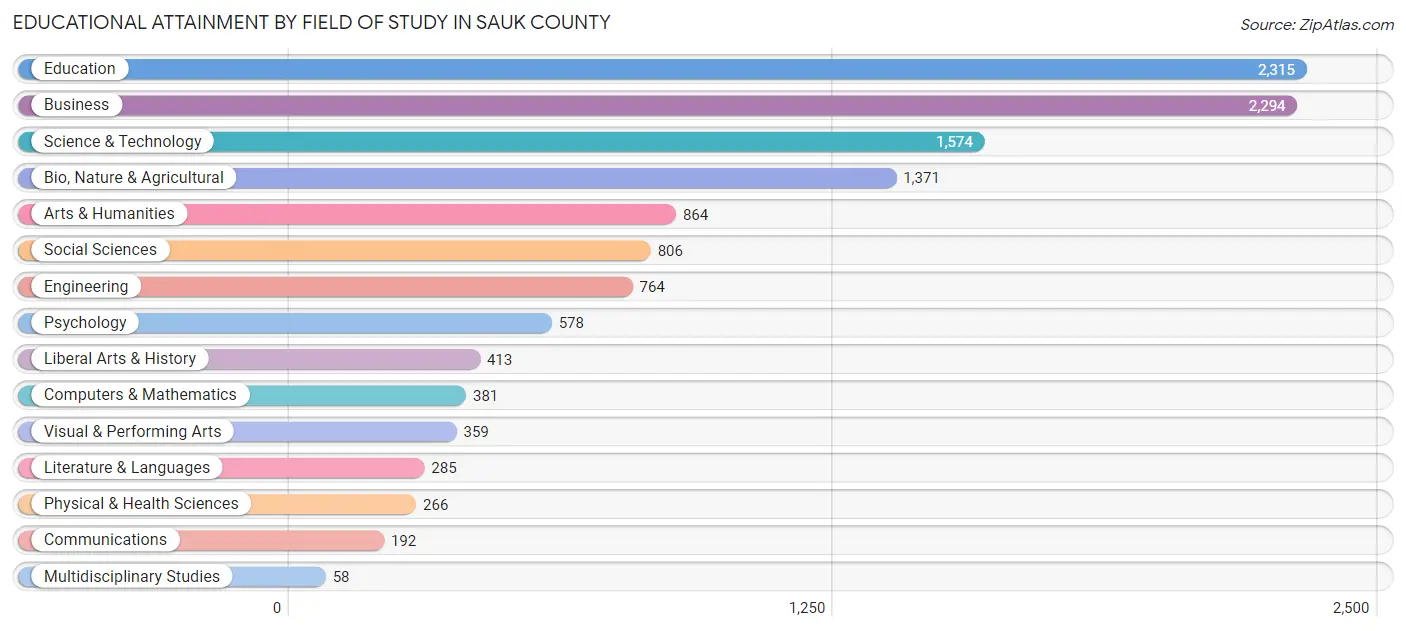
Educational Attainment by Field of Study in Sauk County
Education (2,315 | 18.5%), business (2,294 | 18.3%), science & technology (1,574 | 12.6%), bio, nature & agricultural (1,371 | 11.0%), and arts & humanities (864 | 6.9%) are the most common fields of study among 12,520 individuals in Sauk County who have obtained a bachelor's degree or higher.
| Field of Study | # Graduates | % Graduates |
| Computers & Mathematics | 381 | 3.0% |
| Bio, Nature & Agricultural | 1,371 | 11.0% |
| Physical & Health Sciences | 266 | 2.1% |
| Psychology | 578 | 4.6% |
| Social Sciences | 806 | 6.4% |
| Engineering | 764 | 6.1% |
| Multidisciplinary Studies | 58 | 0.5% |
| Science & Technology | 1,574 | 12.6% |
| Business | 2,294 | 18.3% |
| Education | 2,315 | 18.5% |
| Literature & Languages | 285 | 2.3% |
| Liberal Arts & History | 413 | 3.3% |
| Visual & Performing Arts | 359 | 2.9% |
| Communications | 192 | 1.5% |
| Arts & Humanities | 864 | 6.9% |
| Total | 12,520 | 100.0% |
Transportation & Commute in Sauk County
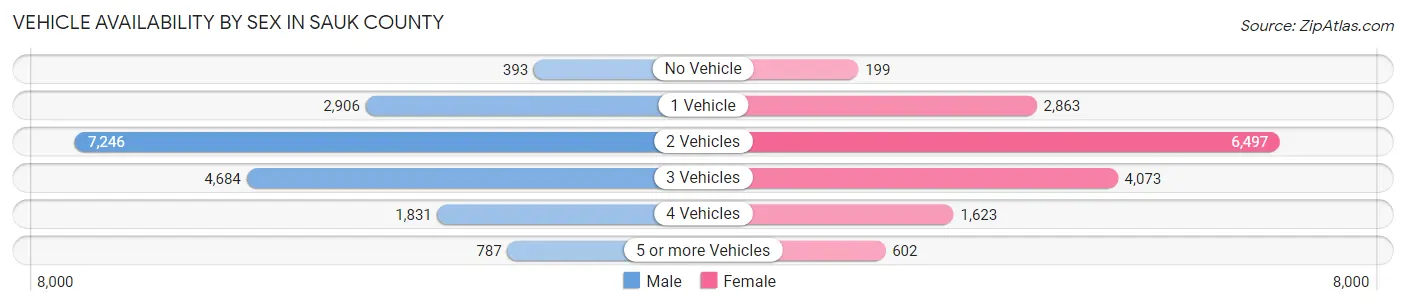
Vehicle Availability by Sex in Sauk County
The most prevalent vehicle ownership categories in Sauk County are males with 2 vehicles (7,246, accounting for 40.6%) and females with 2 vehicles (6,497, making up 45.7%).
| Vehicles Available | Male | Female |
| No Vehicle | 393 (2.2%) | 199 (1.3%) |
| 1 Vehicle | 2,906 (16.3%) | 2,863 (18.1%) |
| 2 Vehicles | 7,246 (40.6%) | 6,497 (41.0%) |
| 3 Vehicles | 4,684 (26.3%) | 4,073 (25.7%) |
| 4 Vehicles | 1,831 (10.3%) | 1,623 (10.2%) |
| 5 or more Vehicles | 787 (4.4%) | 602 (3.8%) |
| Total | 17,847 (100.0%) | 15,857 (100.0%) |
Commute Time in Sauk County
The most frequently occuring commute durations in Sauk County are 5 to 9 minutes (6,118 commuters, 19.6%), 10 to 14 minutes (4,357 commuters, 14.0%), and 15 to 19 minutes (3,979 commuters, 12.8%).

| Commute Time | # Commuters | % Commuters |
| Less than 5 Minutes | 2,260 | 7.2% |
| 5 to 9 Minutes | 6,118 | 19.6% |
| 10 to 14 Minutes | 4,357 | 14.0% |
| 15 to 19 Minutes | 3,979 | 12.8% |
| 20 to 24 Minutes | 2,971 | 9.5% |
| 25 to 29 Minutes | 2,129 | 6.8% |
| 30 to 34 Minutes | 2,484 | 8.0% |
| 35 to 39 Minutes | 1,156 | 3.7% |
| 40 to 44 Minutes | 1,176 | 3.8% |
| 45 to 59 Minutes | 2,381 | 7.6% |
| 60 to 89 Minutes | 1,539 | 4.9% |
| 90 or more Minutes | 608 | 1.9% |
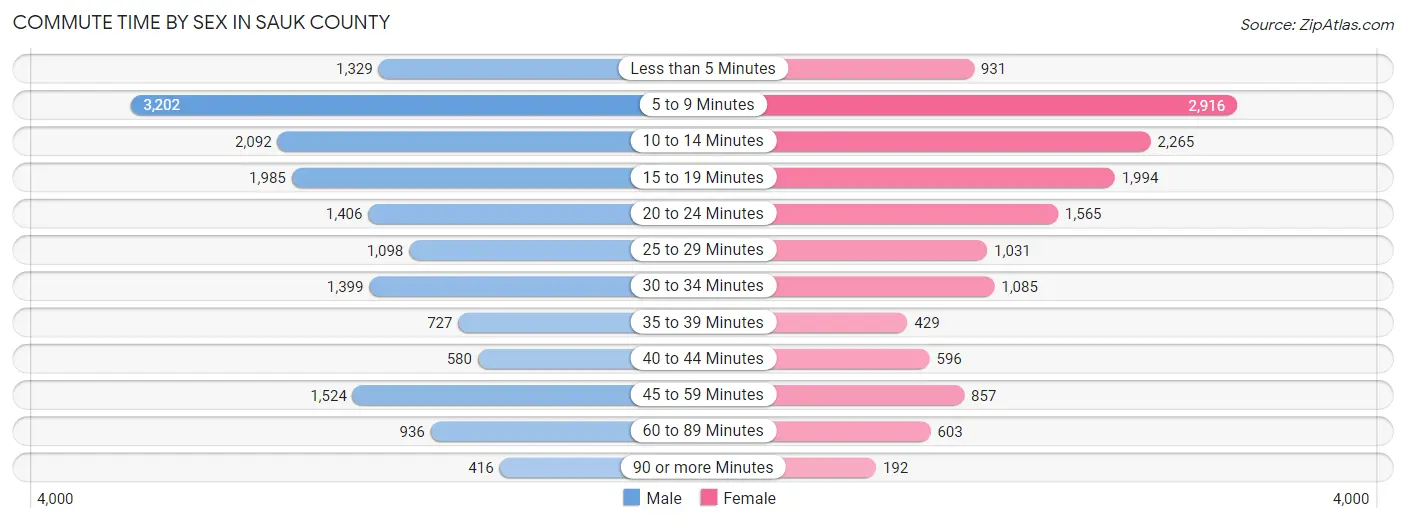
Commute Time by Sex in Sauk County
The most common commute times in Sauk County are 5 to 9 minutes (3,202 commuters, 19.2%) for males and 5 to 9 minutes (2,916 commuters, 20.2%) for females.
| Commute Time | Male | Female |
| Less than 5 Minutes | 1,329 (8.0%) | 931 (6.4%) |
| 5 to 9 Minutes | 3,202 (19.2%) | 2,916 (20.2%) |
| 10 to 14 Minutes | 2,092 (12.5%) | 2,265 (15.7%) |
| 15 to 19 Minutes | 1,985 (11.9%) | 1,994 (13.8%) |
| 20 to 24 Minutes | 1,406 (8.4%) | 1,565 (10.8%) |
| 25 to 29 Minutes | 1,098 (6.6%) | 1,031 (7.1%) |
| 30 to 34 Minutes | 1,399 (8.4%) | 1,085 (7.5%) |
| 35 to 39 Minutes | 727 (4.3%) | 429 (3.0%) |
| 40 to 44 Minutes | 580 (3.5%) | 596 (4.1%) |
| 45 to 59 Minutes | 1,524 (9.1%) | 857 (5.9%) |
| 60 to 89 Minutes | 936 (5.6%) | 603 (4.2%) |
| 90 or more Minutes | 416 (2.5%) | 192 (1.3%) |
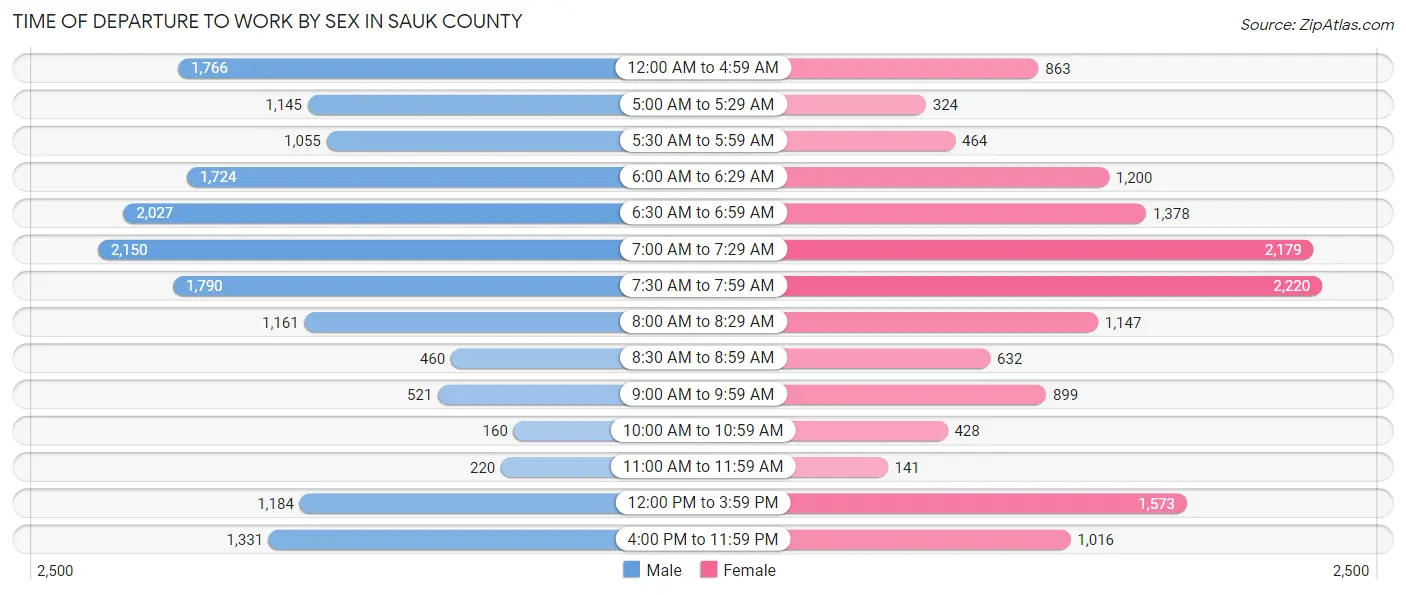
Time of Departure to Work by Sex in Sauk County
The most frequent times of departure to work in Sauk County are 7:00 AM to 7:29 AM (2,150, 12.9%) for males and 7:30 AM to 7:59 AM (2,220, 15.3%) for females.
| Time of Departure | Male | Female |
| 12:00 AM to 4:59 AM | 1,766 (10.6%) | 863 (6.0%) |
| 5:00 AM to 5:29 AM | 1,145 (6.9%) | 324 (2.2%) |
| 5:30 AM to 5:59 AM | 1,055 (6.3%) | 464 (3.2%) |
| 6:00 AM to 6:29 AM | 1,724 (10.3%) | 1,200 (8.3%) |
| 6:30 AM to 6:59 AM | 2,027 (12.1%) | 1,378 (9.5%) |
| 7:00 AM to 7:29 AM | 2,150 (12.9%) | 2,179 (15.1%) |
| 7:30 AM to 7:59 AM | 1,790 (10.7%) | 2,220 (15.3%) |
| 8:00 AM to 8:29 AM | 1,161 (7.0%) | 1,147 (7.9%) |
| 8:30 AM to 8:59 AM | 460 (2.8%) | 632 (4.4%) |
| 9:00 AM to 9:59 AM | 521 (3.1%) | 899 (6.2%) |
| 10:00 AM to 10:59 AM | 160 (1.0%) | 428 (3.0%) |
| 11:00 AM to 11:59 AM | 220 (1.3%) | 141 (1.0%) |
| 12:00 PM to 3:59 PM | 1,184 (7.1%) | 1,573 (10.9%) |
| 4:00 PM to 11:59 PM | 1,331 (8.0%) | 1,016 (7.0%) |
| Total | 16,694 (100.0%) | 14,464 (100.0%) |
Housing Occupancy in Sauk County
Occupancy by Ownership in Sauk County
Of the total 27,313 dwellings in Sauk County, owner-occupied units account for 19,987 (73.2%), while renter-occupied units make up 7,326 (26.8%).
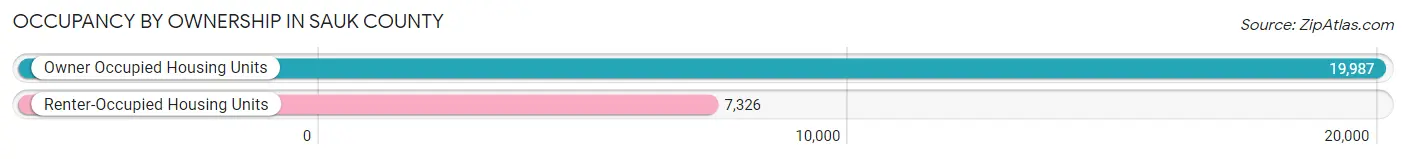
| Occupancy | # Housing Units | % Housing Units |
| Owner Occupied Housing Units | 19,987 | 73.2% |
| Renter-Occupied Housing Units | 7,326 | 26.8% |
| Total Occupied Housing Units | 27,313 | 100.0% |
Occupancy by Household Size in Sauk County
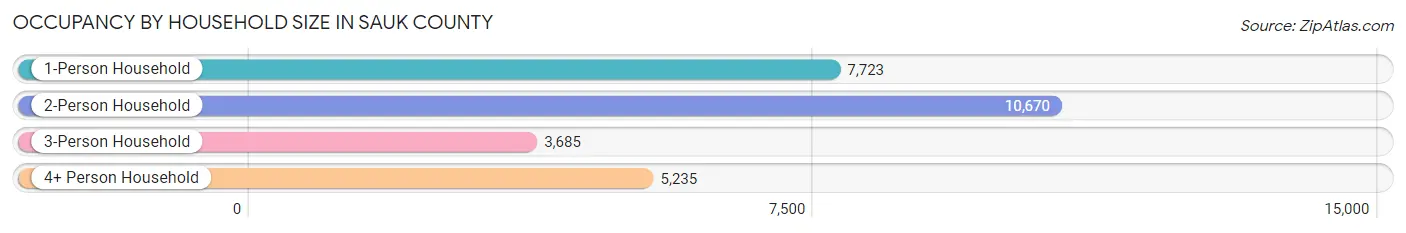
| Household Size | # Housing Units | % Housing Units |
| 1-Person Household | 7,723 | 28.3% |
| 2-Person Household | 10,670 | 39.1% |
| 3-Person Household | 3,685 | 13.5% |
| 4+ Person Household | 5,235 | 19.2% |
| Total Housing Units | 27,313 | 100.0% |
Occupancy by Ownership by Household Size in Sauk County
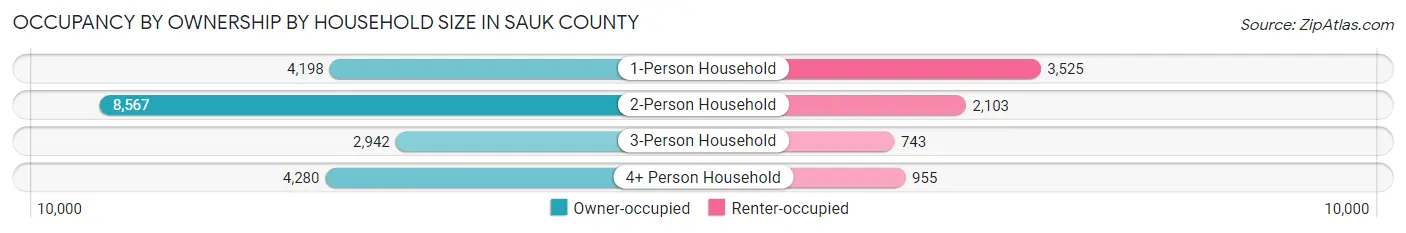
| Household Size | Owner-occupied | Renter-occupied |
| 1-Person Household | 4,198 (54.4%) | 3,525 (45.6%) |
| 2-Person Household | 8,567 (80.3%) | 2,103 (19.7%) |
| 3-Person Household | 2,942 (79.8%) | 743 (20.2%) |
| 4+ Person Household | 4,280 (81.8%) | 955 (18.2%) |
| Total Housing Units | 19,987 (73.2%) | 7,326 (26.8%) |
Occupancy by Educational Attainment in Sauk County
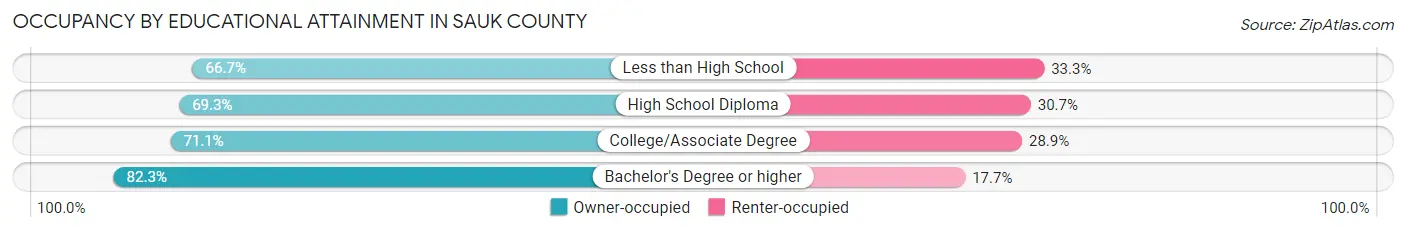
| Household Size | Owner-occupied | Renter-occupied |
| Less than High School | 1,265 (66.7%) | 632 (33.3%) |
| High School Diploma | 5,857 (69.3%) | 2,590 (30.7%) |
| College/Associate Degree | 6,986 (71.1%) | 2,843 (28.9%) |
| Bachelor's Degree or higher | 5,879 (82.3%) | 1,261 (17.7%) |
Occupancy by Age of Householder in Sauk County
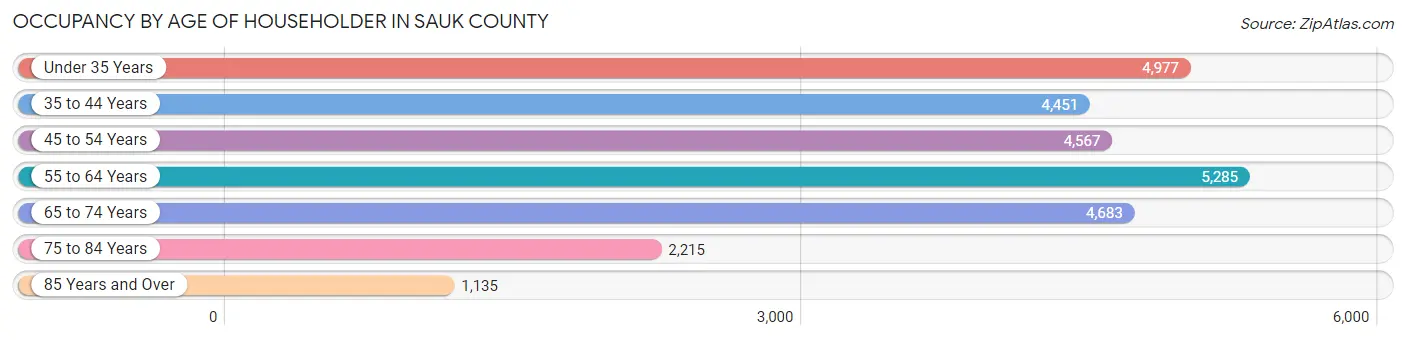
| Age Bracket | # Households | % Households |
| Under 35 Years | 4,977 | 18.2% |
| 35 to 44 Years | 4,451 | 16.3% |
| 45 to 54 Years | 4,567 | 16.7% |
| 55 to 64 Years | 5,285 | 19.4% |
| 65 to 74 Years | 4,683 | 17.2% |
| 75 to 84 Years | 2,215 | 8.1% |
| 85 Years and Over | 1,135 | 4.2% |
| Total | 27,313 | 100.0% |
Housing Finances in Sauk County
Median Income by Occupancy in Sauk County
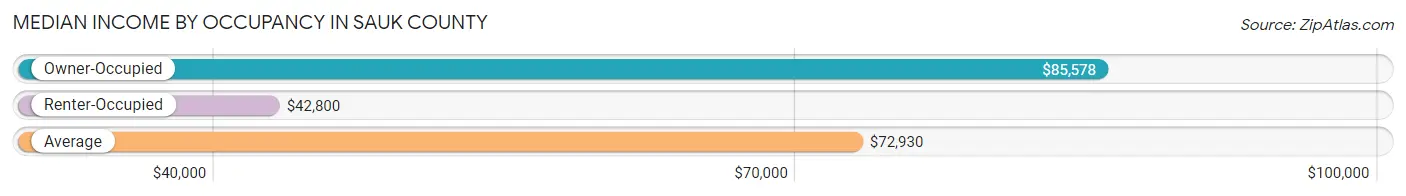
| Occupancy Type | # Households | Median Income |
| Owner-Occupied | 19,987 (73.2%) | $85,578 |
| Renter-Occupied | 7,326 (26.8%) | $42,800 |
| Average | 27,313 (100.0%) | $72,930 |
Occupancy by Householder Income Bracket in Sauk County
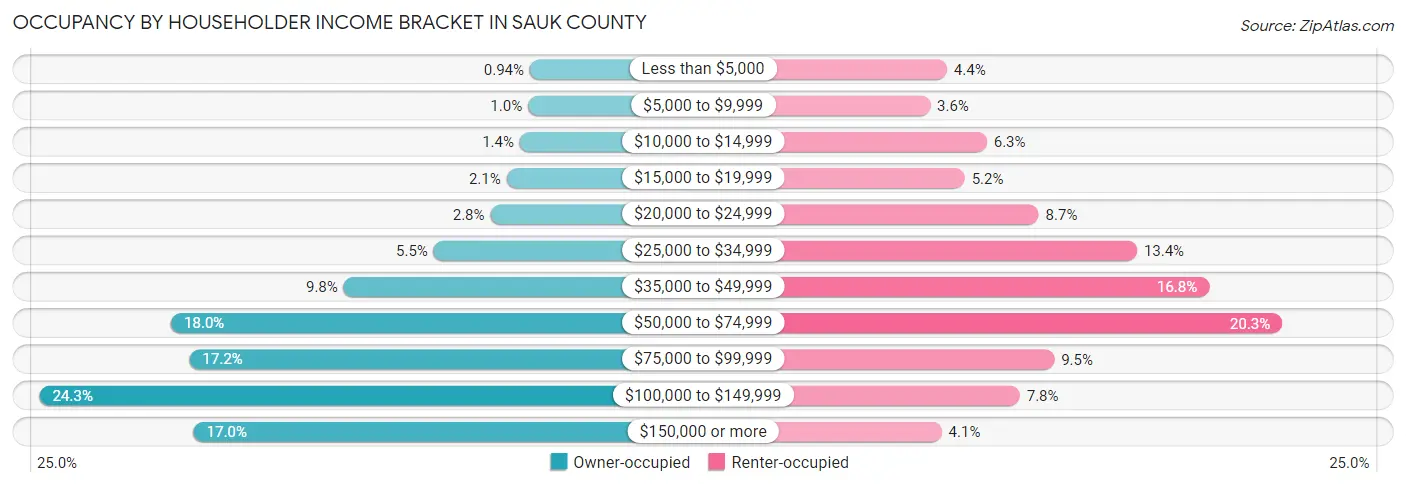
| Income Bracket | Owner-occupied | Renter-occupied |
| Less than $5,000 | 187 (0.9%) | 319 (4.3%) |
| $5,000 to $9,999 | 206 (1.0%) | 260 (3.5%) |
| $10,000 to $14,999 | 284 (1.4%) | 458 (6.2%) |
| $15,000 to $19,999 | 409 (2.1%) | 381 (5.2%) |
| $20,000 to $24,999 | 564 (2.8%) | 639 (8.7%) |
| $25,000 to $34,999 | 1,104 (5.5%) | 982 (13.4%) |
| $35,000 to $49,999 | 1,960 (9.8%) | 1,233 (16.8%) |
| $50,000 to $74,999 | 3,604 (18.0%) | 1,488 (20.3%) |
| $75,000 to $99,999 | 3,427 (17.2%) | 693 (9.5%) |
| $100,000 to $149,999 | 4,854 (24.3%) | 573 (7.8%) |
| $150,000 or more | 3,388 (17.0%) | 300 (4.1%) |
| Total | 19,987 (100.0%) | 7,326 (100.0%) |
Monthly Housing Cost Tiers in Sauk County
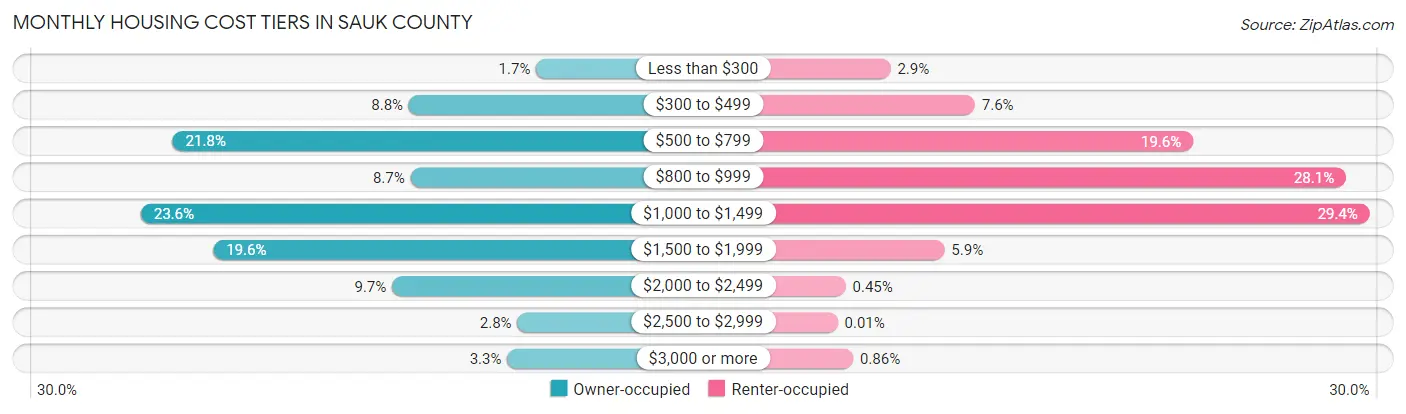
| Monthly Cost | Owner-occupied | Renter-occupied |
| Less than $300 | 348 (1.7%) | 215 (2.9%) |
| $300 to $499 | 1,753 (8.8%) | 556 (7.6%) |
| $500 to $799 | 4,363 (21.8%) | 1,439 (19.6%) |
| $800 to $999 | 1,735 (8.7%) | 2,058 (28.1%) |
| $1,000 to $1,499 | 4,712 (23.6%) | 2,154 (29.4%) |
| $1,500 to $1,999 | 3,914 (19.6%) | 433 (5.9%) |
| $2,000 to $2,499 | 1,938 (9.7%) | 33 (0.4%) |
| $2,500 to $2,999 | 556 (2.8%) | 1 (0.0%) |
| $3,000 or more | 668 (3.3%) | 63 (0.9%) |
| Total | 19,987 (100.0%) | 7,326 (100.0%) |
Physical Housing Characteristics in Sauk County
Housing Structures in Sauk County
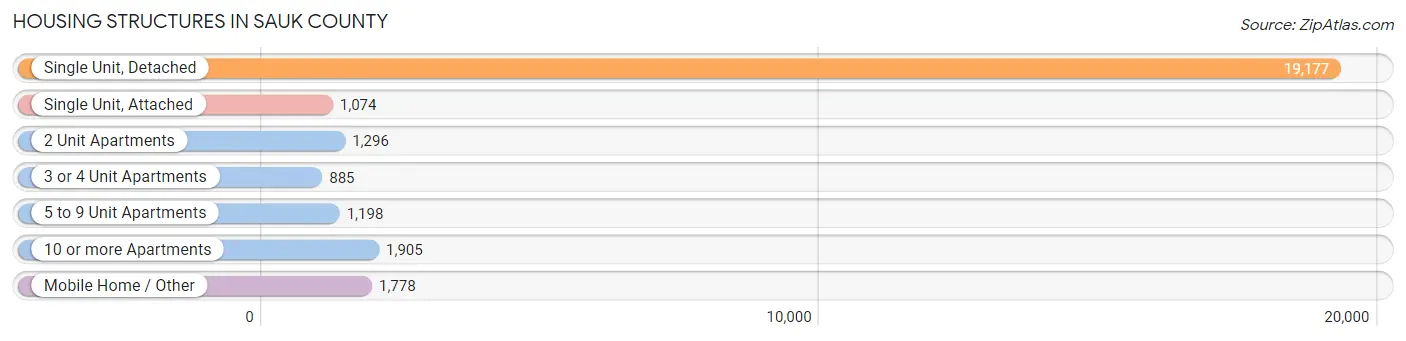
| Structure Type | # Housing Units | % Housing Units |
| Single Unit, Detached | 19,177 | 70.2% |
| Single Unit, Attached | 1,074 | 3.9% |
| 2 Unit Apartments | 1,296 | 4.7% |
| 3 or 4 Unit Apartments | 885 | 3.2% |
| 5 to 9 Unit Apartments | 1,198 | 4.4% |
| 10 or more Apartments | 1,905 | 7.0% |
| Mobile Home / Other | 1,778 | 6.5% |
| Total | 27,313 | 100.0% |
Housing Structures by Occupancy in Sauk County
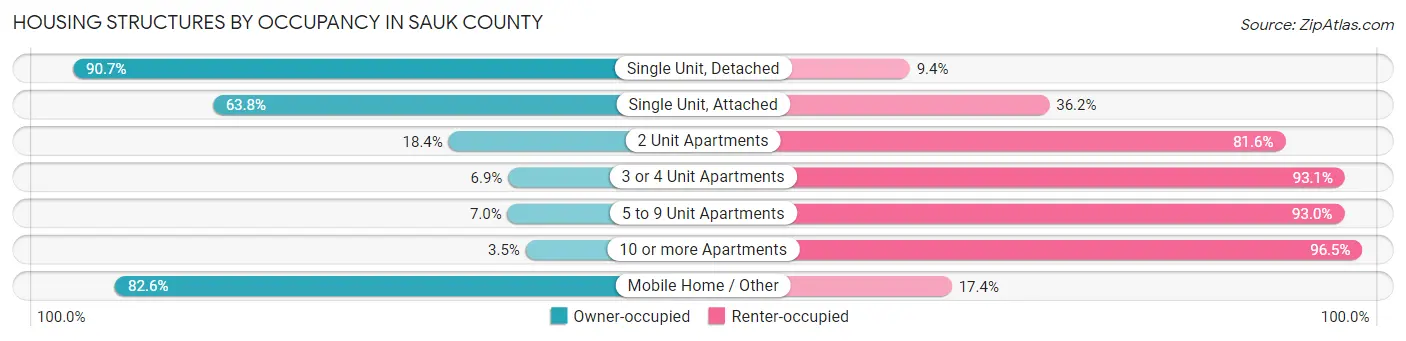
| Structure Type | Owner-occupied | Renter-occupied |
| Single Unit, Detached | 17,384 (90.6%) | 1,793 (9.3%) |
| Single Unit, Attached | 685 (63.8%) | 389 (36.2%) |
| 2 Unit Apartments | 238 (18.4%) | 1,058 (81.6%) |
| 3 or 4 Unit Apartments | 61 (6.9%) | 824 (93.1%) |
| 5 to 9 Unit Apartments | 84 (7.0%) | 1,114 (93.0%) |
| 10 or more Apartments | 67 (3.5%) | 1,838 (96.5%) |
| Mobile Home / Other | 1,468 (82.6%) | 310 (17.4%) |
| Total | 19,987 (73.2%) | 7,326 (26.8%) |
Housing Structures by Number of Rooms in Sauk County
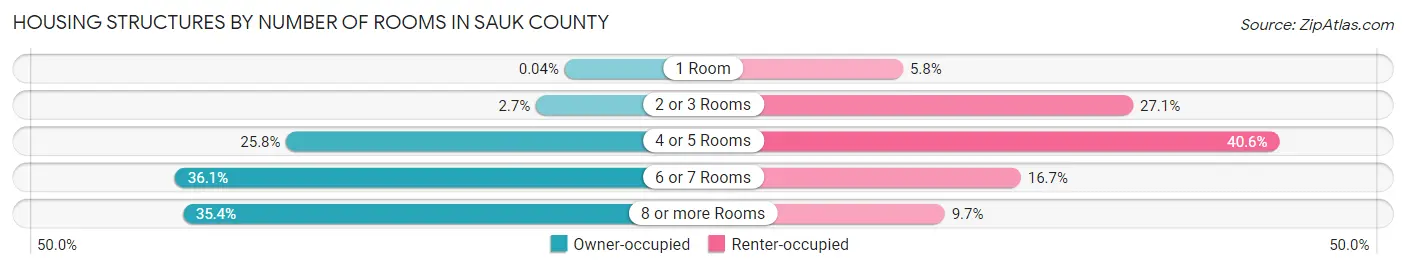
| Number of Rooms | Owner-occupied | Renter-occupied |
| 1 Room | 7 (0.0%) | 427 (5.8%) |
| 2 or 3 Rooms | 540 (2.7%) | 1,986 (27.1%) |
| 4 or 5 Rooms | 5,154 (25.8%) | 2,977 (40.6%) |
| 6 or 7 Rooms | 7,216 (36.1%) | 1,226 (16.7%) |
| 8 or more Rooms | 7,070 (35.4%) | 710 (9.7%) |
| Total | 19,987 (100.0%) | 7,326 (100.0%) |
Housing Structure by Heating Type in Sauk County
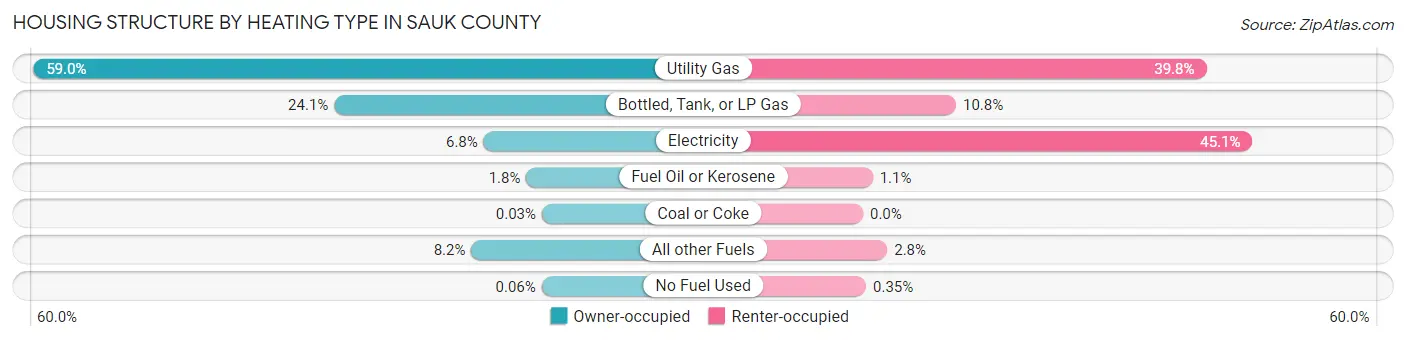
| Heating Type | Owner-occupied | Renter-occupied |
| Utility Gas | 11,792 (59.0%) | 2,915 (39.8%) |
| Bottled, Tank, or LP Gas | 4,818 (24.1%) | 790 (10.8%) |
| Electricity | 1,355 (6.8%) | 3,307 (45.1%) |
| Fuel Oil or Kerosene | 366 (1.8%) | 82 (1.1%) |
| Coal or Coke | 5 (0.0%) | 0 (0.0%) |
| All other Fuels | 1,640 (8.2%) | 206 (2.8%) |
| No Fuel Used | 11 (0.1%) | 26 (0.4%) |
| Total | 19,987 (100.0%) | 7,326 (100.0%) |
Household Vehicle Usage in Sauk County
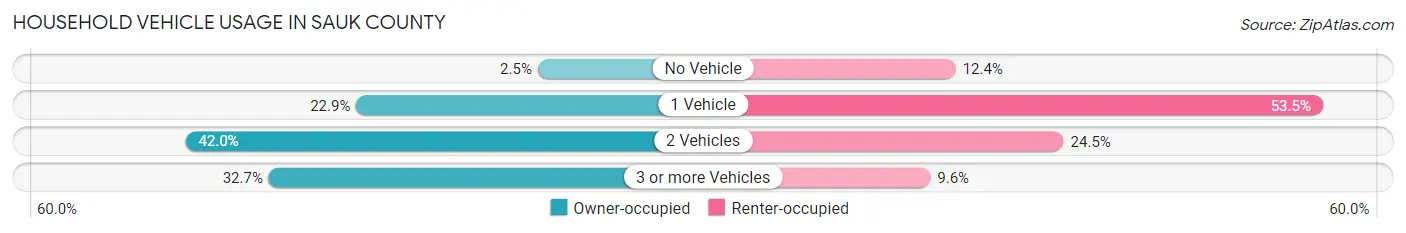
| Vehicles per Household | Owner-occupied | Renter-occupied |
| No Vehicle | 503 (2.5%) | 909 (12.4%) |
| 1 Vehicle | 4,568 (22.9%) | 3,921 (53.5%) |
| 2 Vehicles | 8,391 (42.0%) | 1,795 (24.5%) |
| 3 or more Vehicles | 6,525 (32.7%) | 701 (9.6%) |
| Total | 19,987 (100.0%) | 7,326 (100.0%) |
Real Estate & Mortgages in Sauk County
Real Estate and Mortgage Overview in Sauk County
| Characteristic | Without Mortgage | With Mortgage |
| Housing Units | 7,603 | 12,384 |
| Median Property Value | $211,300 | $237,100 |
| Median Household Income | $67,490 | $2,606 |
| Monthly Housing Costs | $615 | $612 |
| Real Estate Taxes | $3,335 | $237 |
Property Value by Mortgage Status in Sauk County
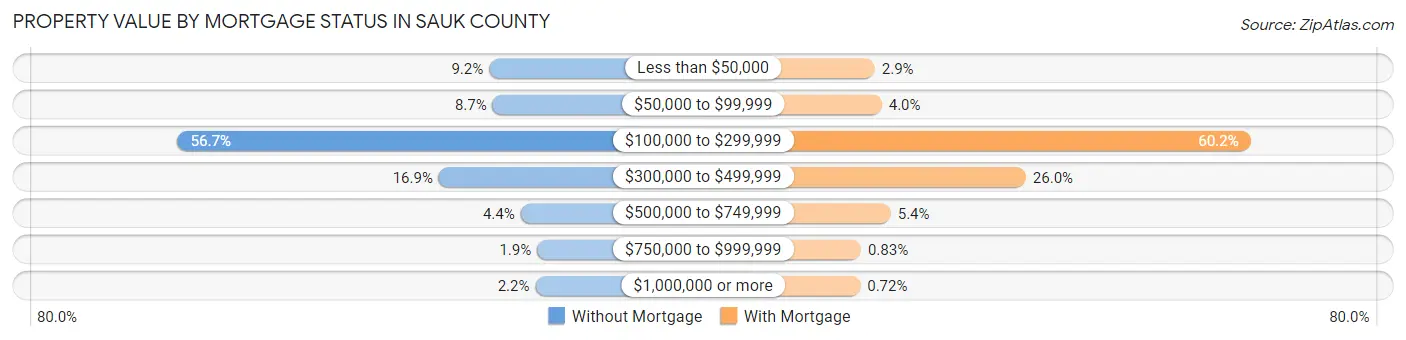
| Property Value | Without Mortgage | With Mortgage |
| Less than $50,000 | 702 (9.2%) | 364 (2.9%) |
| $50,000 to $99,999 | 661 (8.7%) | 495 (4.0%) |
| $100,000 to $299,999 | 4,309 (56.7%) | 7,453 (60.2%) |
| $300,000 to $499,999 | 1,284 (16.9%) | 3,215 (26.0%) |
| $500,000 to $749,999 | 336 (4.4%) | 665 (5.4%) |
| $750,000 to $999,999 | 145 (1.9%) | 103 (0.8%) |
| $1,000,000 or more | 166 (2.2%) | 89 (0.7%) |
| Total | 7,603 (100.0%) | 12,384 (100.0%) |
Household Income by Mortgage Status in Sauk County
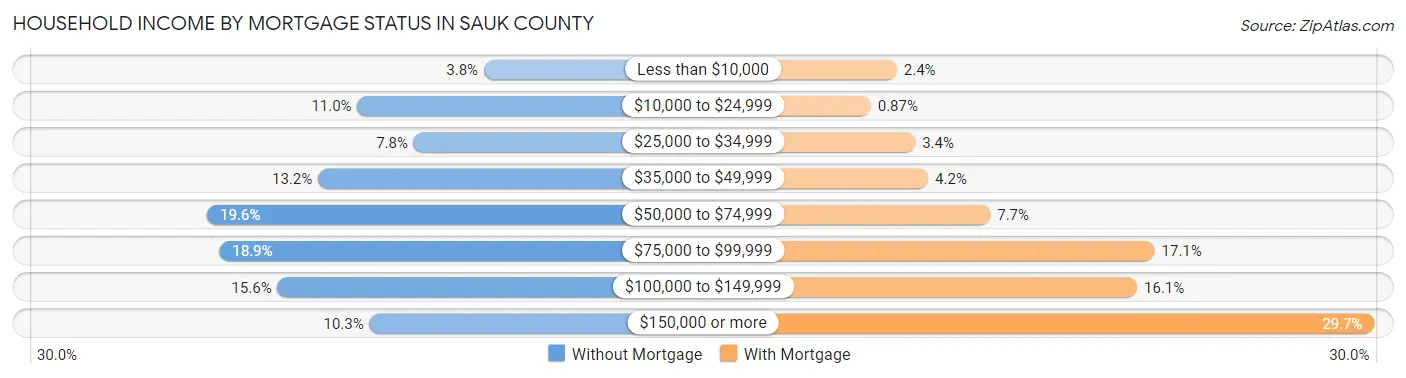
| Household Income | Without Mortgage | With Mortgage |
| Less than $10,000 | 285 (3.7%) | 292 (2.4%) |
| $10,000 to $24,999 | 835 (11.0%) | 108 (0.9%) |
| $25,000 to $34,999 | 590 (7.8%) | 422 (3.4%) |
| $35,000 to $49,999 | 1,006 (13.2%) | 514 (4.2%) |
| $50,000 to $74,999 | 1,488 (19.6%) | 954 (7.7%) |
| $75,000 to $99,999 | 1,435 (18.9%) | 2,116 (17.1%) |
| $100,000 to $149,999 | 1,182 (15.5%) | 1,992 (16.1%) |
| $150,000 or more | 782 (10.3%) | 3,672 (29.6%) |
| Total | 7,603 (100.0%) | 12,384 (100.0%) |
Property Value to Household Income Ratio in Sauk County
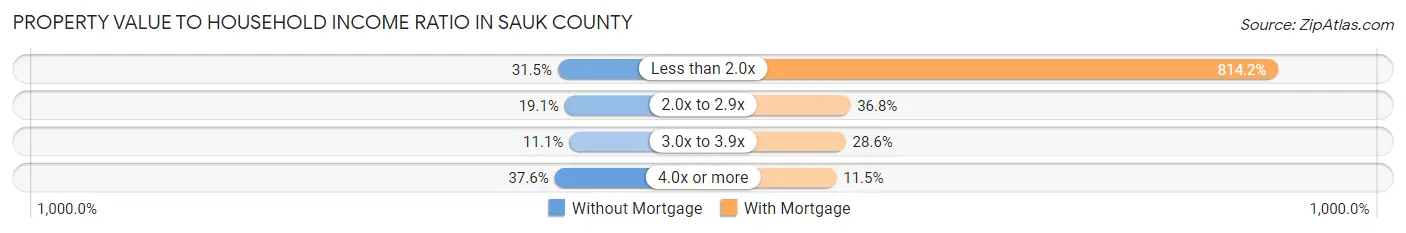
| Value-to-Income Ratio | Without Mortgage | With Mortgage |
| Less than 2.0x | 2,398 (31.5%) | 100,833 (814.2%) |
| 2.0x to 2.9x | 1,449 (19.1%) | 4,560 (36.8%) |
| 3.0x to 3.9x | 841 (11.1%) | 3,542 (28.6%) |
| 4.0x or more | 2,862 (37.6%) | 1,427 (11.5%) |
| Total | 7,603 (100.0%) | 12,384 (100.0%) |
Real Estate Taxes by Mortgage Status in Sauk County
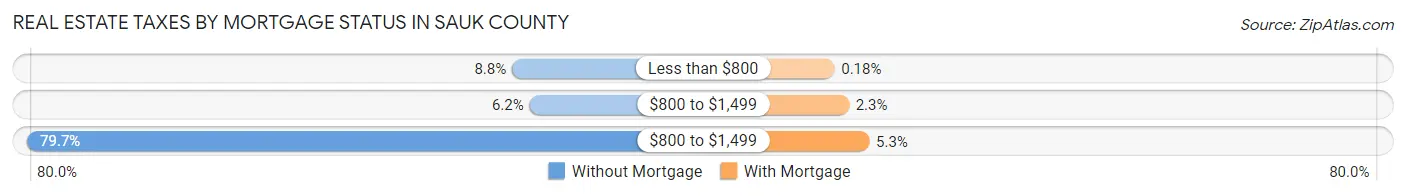
| Property Taxes | Without Mortgage | With Mortgage |
| Less than $800 | 667 (8.8%) | 22 (0.2%) |
| $800 to $1,499 | 473 (6.2%) | 283 (2.3%) |
| $800 to $1,499 | 6,056 (79.6%) | 653 (5.3%) |
| Total | 7,603 (100.0%) | 12,384 (100.0%) |
Health & Disability in Sauk County
Health Insurance Coverage by Age in Sauk County
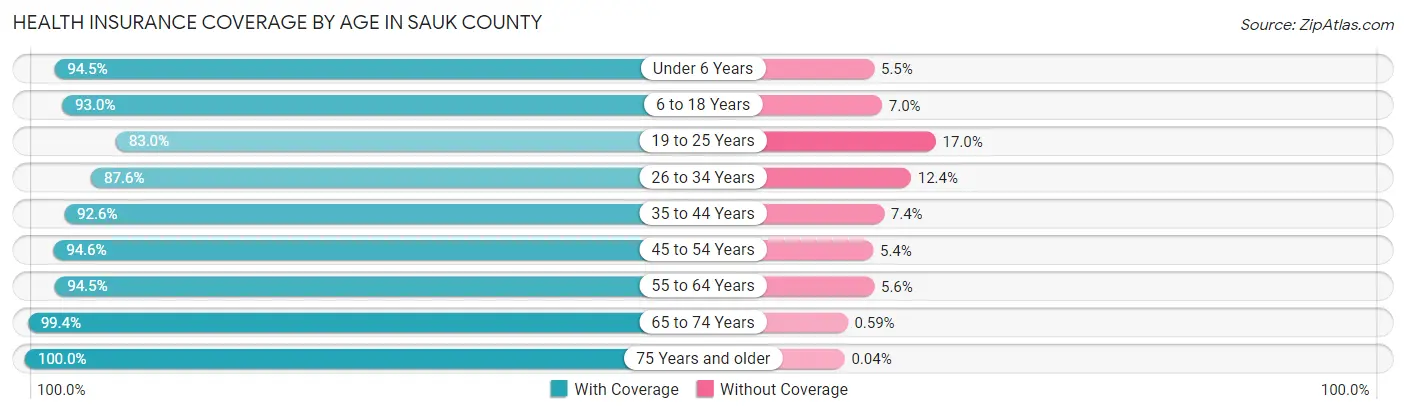
| Age Bracket | With Coverage | Without Coverage |
| Under 6 Years | 4,429 (94.5%) | 260 (5.5%) |
| 6 to 18 Years | 9,895 (93.0%) | 745 (7.0%) |
| 19 to 25 Years | 3,905 (83.0%) | 801 (17.0%) |
| 26 to 34 Years | 6,117 (87.6%) | 866 (12.4%) |
| 35 to 44 Years | 7,948 (92.6%) | 632 (7.4%) |
| 45 to 54 Years | 7,434 (94.6%) | 421 (5.4%) |
| 55 to 64 Years | 8,910 (94.5%) | 524 (5.6%) |
| 65 to 74 Years | 7,302 (99.4%) | 43 (0.6%) |
| 75 Years and older | 4,786 (100.0%) | 2 (0.0%) |
| Total | 60,726 (93.4%) | 4,294 (6.6%) |
Health Insurance Coverage by Citizenship Status in Sauk County
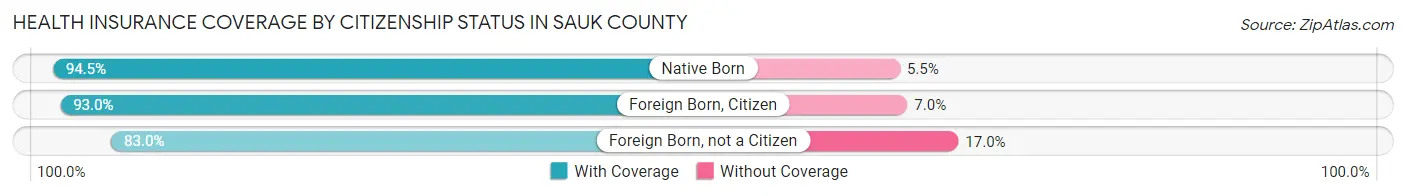
| Citizenship Status | With Coverage | Without Coverage |
| Native Born | 4,429 (94.5%) | 260 (5.5%) |
| Foreign Born, Citizen | 9,895 (93.0%) | 745 (7.0%) |
| Foreign Born, not a Citizen | 3,905 (83.0%) | 801 (17.0%) |
Health Insurance Coverage by Household Income in Sauk County
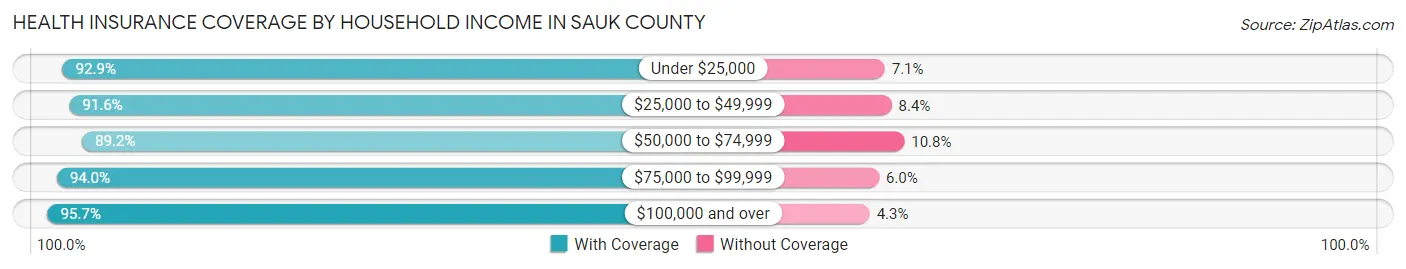
| Household Income | With Coverage | Without Coverage |
| Under $25,000 | 5,102 (92.9%) | 391 (7.1%) |
| $25,000 to $49,999 | 8,608 (91.6%) | 789 (8.4%) |
| $50,000 to $74,999 | 10,384 (89.2%) | 1,255 (10.8%) |
| $75,000 to $99,999 | 9,979 (94.0%) | 642 (6.0%) |
| $100,000 and over | 26,470 (95.7%) | 1,186 (4.3%) |
Public vs Private Health Insurance Coverage by Age in Sauk County
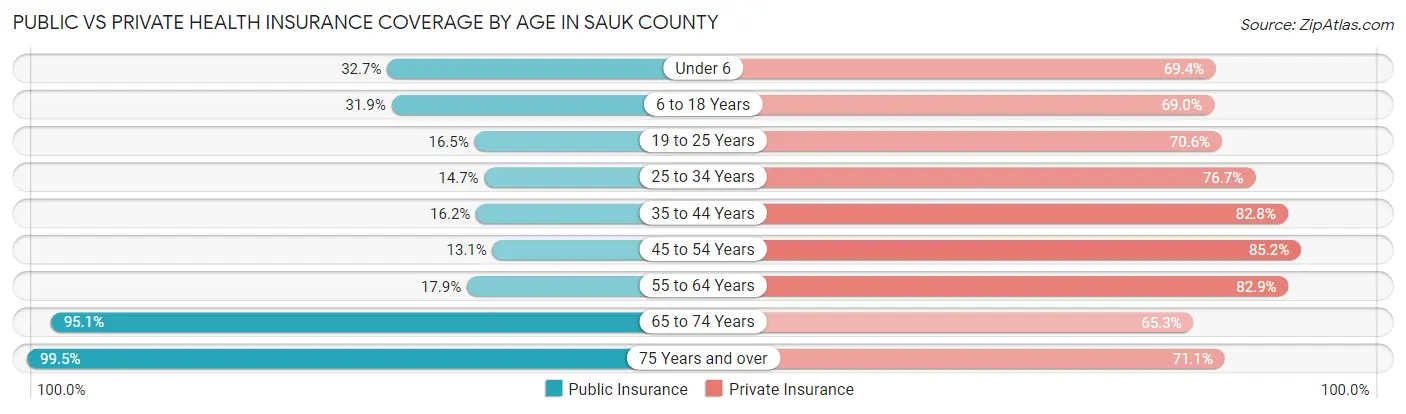
| Age Bracket | Public Insurance | Private Insurance |
| Under 6 | 1,533 (32.7%) | 3,256 (69.4%) |
| 6 to 18 Years | 3,393 (31.9%) | 7,345 (69.0%) |
| 19 to 25 Years | 776 (16.5%) | 3,320 (70.6%) |
| 25 to 34 Years | 1,023 (14.6%) | 5,355 (76.7%) |
| 35 to 44 Years | 1,388 (16.2%) | 7,102 (82.8%) |
| 45 to 54 Years | 1,031 (13.1%) | 6,695 (85.2%) |
| 55 to 64 Years | 1,687 (17.9%) | 7,820 (82.9%) |
| 65 to 74 Years | 6,988 (95.1%) | 4,795 (65.3%) |
| 75 Years and over | 4,765 (99.5%) | 3,404 (71.1%) |
| Total | 22,584 (34.7%) | 49,092 (75.5%) |
Disability Status by Sex by Age in Sauk County
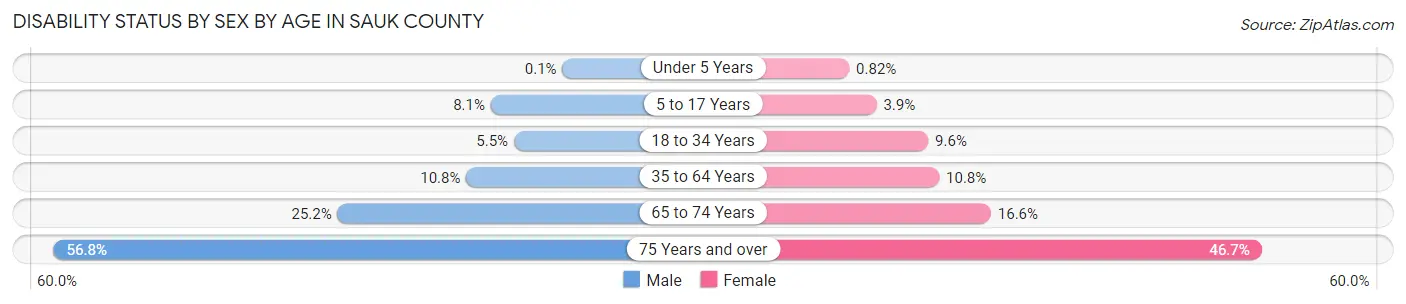
| Age Bracket | Male | Female |
| Under 5 Years | 2 (0.1%) | 15 (0.8%) |
| 5 to 17 Years | 451 (8.1%) | 209 (3.9%) |
| 18 to 34 Years | 349 (5.5%) | 570 (9.6%) |
| 35 to 64 Years | 1,416 (10.8%) | 1,385 (10.8%) |
| 65 to 74 Years | 902 (25.2%) | 624 (16.6%) |
| 75 Years and over | 1,150 (56.8%) | 1,291 (46.7%) |
Disability Class by Sex by Age in Sauk County
Disability Class: Hearing Difficulty

| Age Bracket | Male | Female |
| Under 5 Years | 2 (0.1%) | 15 (0.8%) |
| 5 to 17 Years | 43 (0.8%) | 24 (0.4%) |
| 18 to 34 Years | 31 (0.5%) | 56 (0.9%) |
| 35 to 64 Years | 526 (4.0%) | 247 (1.9%) |
| 65 to 74 Years | 505 (14.1%) | 106 (2.8%) |
| 75 Years and over | 728 (35.9%) | 361 (13.1%) |
Disability Class: Vision Difficulty
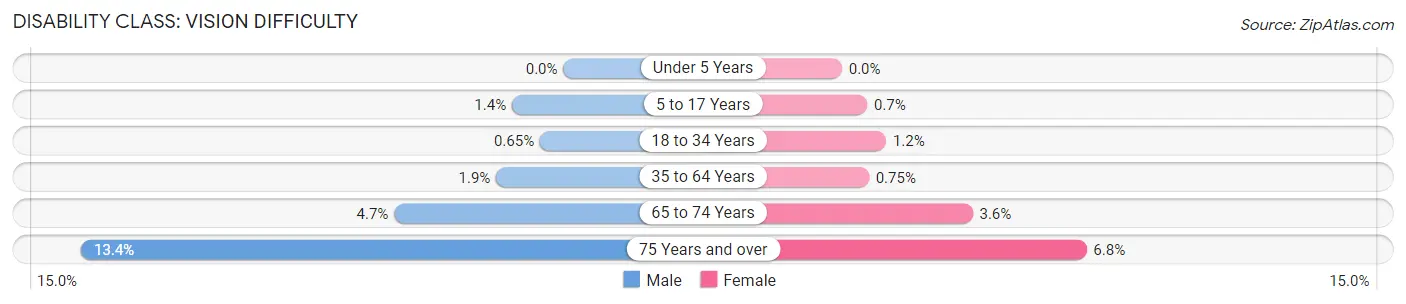
| Age Bracket | Male | Female |
| Under 5 Years | 0 (0.0%) | 0 (0.0%) |
| 5 to 17 Years | 80 (1.4%) | 38 (0.7%) |
| 18 to 34 Years | 41 (0.6%) | 73 (1.2%) |
| 35 to 64 Years | 245 (1.9%) | 96 (0.7%) |
| 65 to 74 Years | 169 (4.7%) | 137 (3.6%) |
| 75 Years and over | 272 (13.4%) | 188 (6.8%) |
Disability Class: Cognitive Difficulty
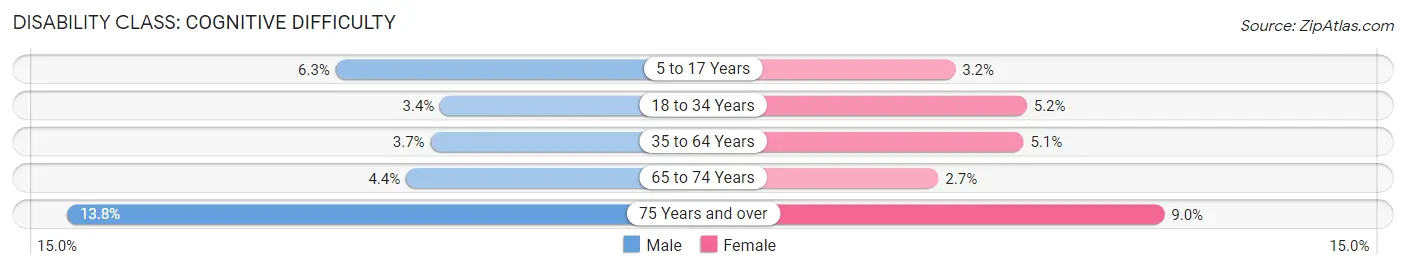
| Age Bracket | Male | Female |
| 5 to 17 Years | 354 (6.3%) | 171 (3.2%) |
| 18 to 34 Years | 218 (3.4%) | 305 (5.1%) |
| 35 to 64 Years | 484 (3.7%) | 647 (5.1%) |
| 65 to 74 Years | 157 (4.4%) | 101 (2.7%) |
| 75 Years and over | 280 (13.8%) | 248 (9.0%) |
Disability Class: Ambulatory Difficulty
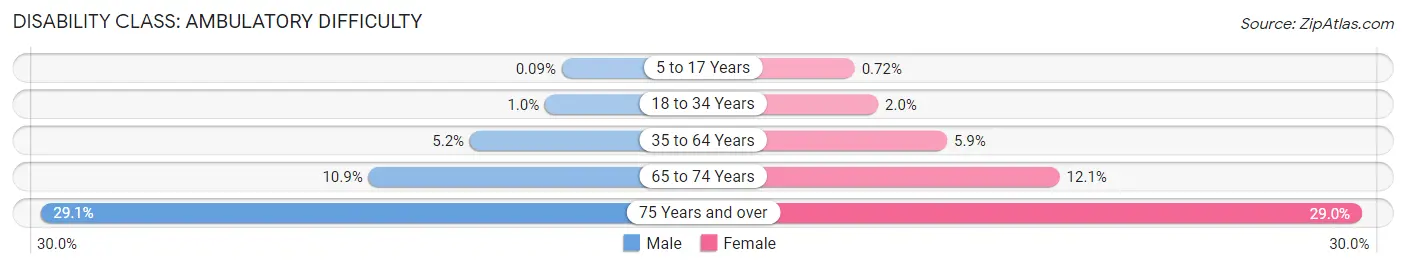
| Age Bracket | Male | Female |
| 5 to 17 Years | 5 (0.1%) | 39 (0.7%) |
| 18 to 34 Years | 65 (1.0%) | 120 (2.0%) |
| 35 to 64 Years | 681 (5.2%) | 748 (5.9%) |
| 65 to 74 Years | 389 (10.8%) | 456 (12.1%) |
| 75 Years and over | 590 (29.1%) | 800 (29.0%) |
Disability Class: Self-Care Difficulty

| Age Bracket | Male | Female |
| 5 to 17 Years | 54 (1.0%) | 41 (0.8%) |
| 18 to 34 Years | 47 (0.7%) | 104 (1.8%) |
| 35 to 64 Years | 232 (1.8%) | 249 (1.9%) |
| 65 to 74 Years | 197 (5.5%) | 73 (1.9%) |
| 75 Years and over | 292 (14.4%) | 306 (11.1%) |
Technology Access in Sauk County
Computing Device Access in Sauk County
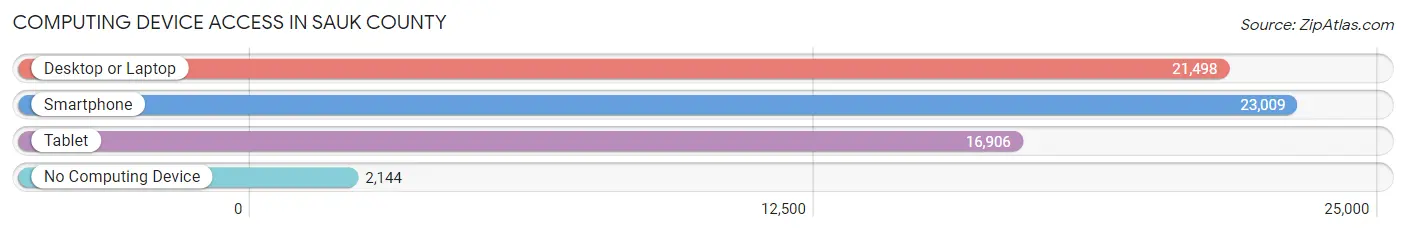
| Device Type | # Households | % Households |
| Desktop or Laptop | 21,498 | 78.7% |
| Smartphone | 23,009 | 84.2% |
| Tablet | 16,906 | 61.9% |
| No Computing Device | 2,144 | 7.9% |
| Total | 27,313 | 100.0% |
Internet Access in Sauk County
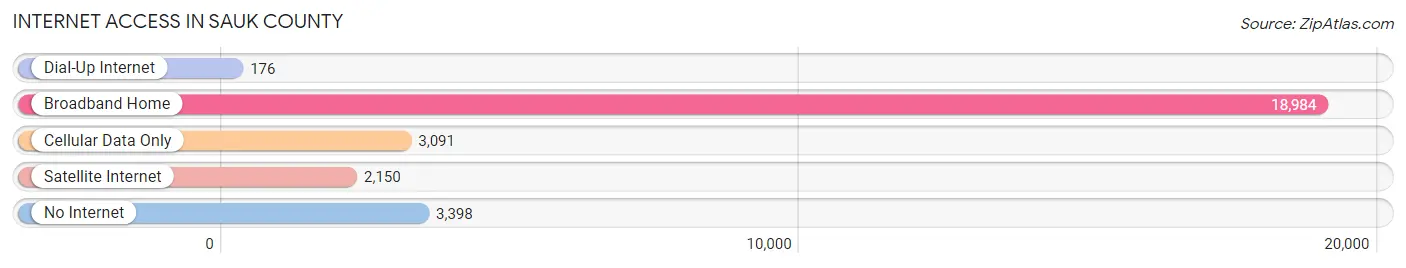
| Internet Type | # Households | % Households |
| Dial-Up Internet | 176 | 0.6% |
| Broadband Home | 18,984 | 69.5% |
| Cellular Data Only | 3,091 | 11.3% |
| Satellite Internet | 2,150 | 7.9% |
| No Internet | 3,398 | 12.4% |
| Total | 27,313 | 100.0% |
Sauk County Summary
Sauk County is located in south-central Wisconsin, and is part of the Madison Metropolitan Statistical Area. It is bordered by Columbia, Iowa, and Dane counties to the north, Iowa and Grant counties to the west, Richland County to the south, and Adams and Juneau counties to the east. The county seat is Baraboo, and the largest city is Reedsburg. As of the 2010 census, the population was 61,976.
Geography
Sauk County covers an area of 1,541 square miles, making it the second-largest county in Wisconsin. The terrain is mostly rolling hills, with the Baraboo Range located in the northern part of the county. The Baraboo River flows through the county, and the Wisconsin River forms the eastern border. The county is home to several state parks, including Devil’s Lake State Park, Mirror Lake State Park, and the Baraboo Hills State Natural Area.
History
Sauk County was established in 1840, and was named after the Sauk Native American tribe. The first settlers arrived in the area in the 1830s, and the county was organized in 1844. The county seat was originally located in the town of Prairie du Sac, but was moved to Baraboo in 1852.
The county was an important center of the lumber industry in the late 19th and early 20th centuries. The Wisconsin River was used to transport logs to sawmills in the area, and the county was home to several large lumber companies. The industry declined in the early 20th century, and the county’s economy shifted to agriculture and tourism.
Economy
Sauk County’s economy is largely based on agriculture and tourism. The county is home to several large farms, and is a major producer of dairy products, corn, soybeans, and hay. Tourism is also an important part of the economy, with the county’s many state parks and outdoor recreation areas attracting visitors from around the region.
The county is also home to several manufacturing companies, including a large paper mill in Baraboo and a plastics plant in Reedsburg. The county is also home to several retail stores, restaurants, and other businesses.
Demographics
As of the 2010 census, the population of Sauk County was 61,976. The population is predominantly white (94.3%), with small percentages of African Americans (1.3%), Native Americans (0.7%), Asians (1.2%), and other races (2.5%). The median household income is $50,945, and the median age is 41.7.
Conclusion
Sauk County is a large county in south-central Wisconsin, and is part of the Madison Metropolitan Statistical Area. The county is home to several state parks and outdoor recreation areas, and its economy is largely based on agriculture and tourism. The population is predominantly white, with a median household income of $50,945 and a median age of 41.7.
Common Questions
What is the Total Population of Sauk County?
Total Population of Sauk County is 65,664.
What is the Total Male Population of Sauk County?
Total Male Population of Sauk County is 32,918.
What is the Total Female Population of Sauk County?
Total Female Population of Sauk County is 32,746.
What is the Ratio of Males per 100 Females in Sauk County?
There are 100.53 Males per 100 Females in Sauk County.
What is the Ratio of Females per 100 Males in Sauk County?
There are 99.48 Females per 100 Males in Sauk County.
What is the Median Population Age in Sauk County?
Median Population Age in Sauk County is 41.1 Years.
What is the Average Family Size in Sauk County
Average Family Size in Sauk County is 2.9 People.
What is the Average Household Size in Sauk County
Average Household Size in Sauk County is 2.4 People.
What is Per Capita Income in Sauk County?
Per Capita income in Sauk County is $37,431.
What is the Median Family Income in Sauk County?
Median Family Income in Sauk County is $91,153.
What is the Median Household income in Sauk County?
Median Household Income in Sauk County is $72,930.
What is Income or Wage Gap in Sauk County?
Income or Wage Gap in Sauk County is 24.9%.
Women in Sauk County earn 75.1 cents for every dollar earned by a man.
What is Family Income Deficit in Sauk County?
Family Income Deficit in Sauk County is $11,125.
Families that are below poverty line in Sauk County earn $11,125 less on average than the poverty threshold level.
What is Inequality or Gini Index in Sauk County?
Inequality or Gini Index in Sauk County is 0.41.
How Large is the Labor Force in Sauk County?
There are 35,255 People in the Labor Forcein in Sauk County.
What is the Percentage of People in the Labor Force in Sauk County?
67.0% of People are in the Labor Force in Sauk County.
What is the Unemployment Rate in Sauk County?
Unemployment Rate in Sauk County is 2.8%.