Rock County, WI
Rock County Map
Rock County Overview
163,817
TOTAL POPULATION
81,542
MALE POPULATION
82,275
FEMALE POPULATION
99.11
MALES / 100 FEMALES
100.90
FEMALES / 100 MALES
40.0
MEDIAN AGE
3.0
AVG FAMILY SIZE
2.4
AVG HOUSEHOLD SIZE
$35,594
PER CAPITA INCOME
$84,424
AVG FAMILY INCOME
$70,630
AVG HOUSEHOLD INCOME
28.8%
WAGE / INCOME GAP [ % ]
71.2¢/ $1
WAGE / INCOME GAP [ $ ]
$10,998
FAMILY INCOME DEFICIT
0.40
INEQUALITY / GINI INDEX
85,875
LABOR FORCE [ PEOPLE ]
65.4%
PERCENT IN LABOR FORCE
3.9%
UNEMPLOYMENT RATE
Race in Rock County
The most populous races in Rock County are White / Caucasian (136,720 | 83.5%), Hispanic or Latino (15,520 | 9.5%), and Two or more Races (11,438 | 7.0%).
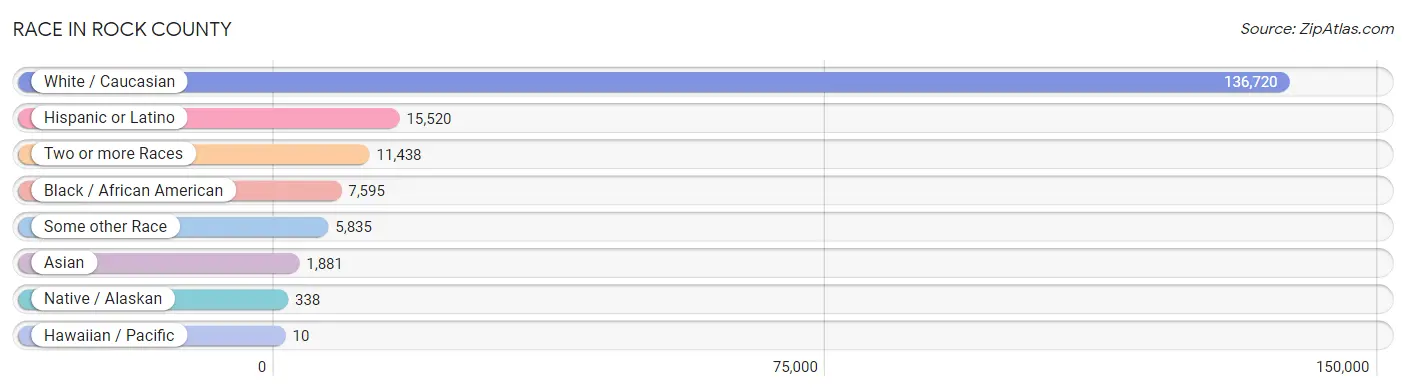
| Race | # Population | % Population |
| Asian | 1,881 | 1.1% |
| Black / African American | 7,595 | 4.6% |
| Hawaiian / Pacific | 10 | 0.0% |
| Hispanic or Latino | 15,520 | 9.5% |
| Native / Alaskan | 338 | 0.2% |
| White / Caucasian | 136,720 | 83.5% |
| Two or more Races | 11,438 | 7.0% |
| Some other Race | 5,835 | 3.6% |
| Total | 163,817 | 100.0% |
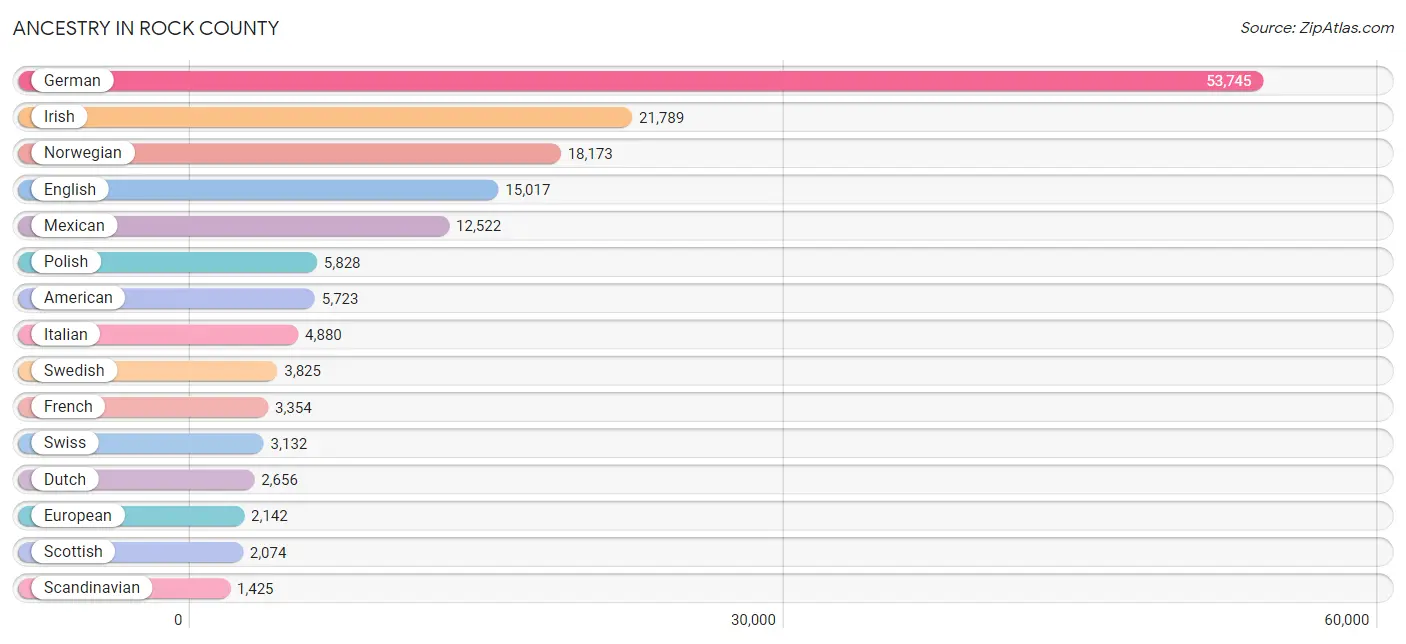
Ancestry in Rock County
The most populous ancestries reported in Rock County are German (53,745 | 32.8%), Irish (21,789 | 13.3%), Norwegian (18,173 | 11.1%), English (15,017 | 9.2%), and Mexican (12,522 | 7.6%), together accounting for 74.0% of all Rock County residents.
| Ancestry | # Population | % Population |
| African | 373 | 0.2% |
| Alaska Native | 1 | 0.0% |
| Albanian | 141 | 0.1% |
| Aleut | 13 | 0.0% |
| American | 5,723 | 3.5% |
| Apache | 12 | 0.0% |
| Arab | 168 | 0.1% |
| Argentinean | 185 | 0.1% |
| Armenian | 226 | 0.1% |
| Australian | 208 | 0.1% |
| Austrian | 369 | 0.2% |
| Bangladeshi | 271 | 0.2% |
| Belgian | 227 | 0.1% |
| Bermudan | 11 | 0.0% |
| Bhutanese | 156 | 0.1% |
| Blackfeet | 196 | 0.1% |
| Bolivian | 3 | 0.0% |
| British | 509 | 0.3% |
| Bulgarian | 17 | 0.0% |
| Burmese | 313 | 0.2% |
| Canadian | 171 | 0.1% |
| Central American | 347 | 0.2% |
| Central American Indian | 7 | 0.0% |
| Cherokee | 615 | 0.4% |
| Cheyenne | 7 | 0.0% |
| Chilean | 28 | 0.0% |
| Chippewa | 137 | 0.1% |
| Choctaw | 13 | 0.0% |
| Colombian | 194 | 0.1% |
| Costa Rican | 21 | 0.0% |
| Creek | 29 | 0.0% |
| Croatian | 230 | 0.1% |
| Crow | 2 | 0.0% |
| Cuban | 80 | 0.1% |
| Czech | 1,282 | 0.8% |
| Czechoslovakian | 288 | 0.2% |
| Danish | 1,034 | 0.6% |
| Dominican | 664 | 0.4% |
| Dutch | 2,656 | 1.6% |
| Eastern European | 154 | 0.1% |
| Egyptian | 28 | 0.0% |
| English | 15,017 | 9.2% |
| Ethiopian | 4 | 0.0% |
| European | 2,142 | 1.3% |
| Filipino | 5 | 0.0% |
| Finnish | 413 | 0.3% |
| French | 3,354 | 2.1% |
| French Canadian | 554 | 0.3% |
| German | 53,745 | 32.8% |
| Ghanaian | 60 | 0.0% |
| Greek | 304 | 0.2% |
| Guatemalan | 55 | 0.0% |
| Guyanese | 2 | 0.0% |
| Haitian | 34 | 0.0% |
| Honduran | 144 | 0.1% |
| Hungarian | 430 | 0.3% |
| Icelander | 59 | 0.0% |
| Indian (Asian) | 439 | 0.3% |
| Iranian | 47 | 0.0% |
| Irish | 21,789 | 13.3% |
| Iroquois | 51 | 0.0% |
| Italian | 4,880 | 3.0% |
| Jamaican | 62 | 0.0% |
| Japanese | 473 | 0.3% |
| Korean | 597 | 0.4% |
| Laotian | 27 | 0.0% |
| Latvian | 48 | 0.0% |
| Lebanese | 121 | 0.1% |
| Lithuanian | 355 | 0.2% |
| Luxembourger | 33 | 0.0% |
| Malaysian | 81 | 0.1% |
| Menominee | 21 | 0.0% |
| Mexican | 12,522 | 7.6% |
| Mexican American Indian | 201 | 0.1% |
| Moroccan | 11 | 0.0% |
| Native Hawaiian | 3 | 0.0% |
| Nigerian | 40 | 0.0% |
| Northern European | 166 | 0.1% |
| Norwegian | 18,173 | 11.1% |
| Okinawan | 10 | 0.0% |
| Pakistani | 147 | 0.1% |
| Panamanian | 14 | 0.0% |
| Pennsylvania German | 139 | 0.1% |
| Peruvian | 64 | 0.0% |
| Polish | 5,828 | 3.6% |
| Portuguese | 85 | 0.1% |
| Puerto Rican | 709 | 0.4% |
| Romanian | 13 | 0.0% |
| Russian | 761 | 0.5% |
| Salvadoran | 113 | 0.1% |
| Samoan | 17 | 0.0% |
| Scandinavian | 1,425 | 0.9% |
| Scotch-Irish | 827 | 0.5% |
| Scottish | 2,074 | 1.3% |
| Seminole | 2 | 0.0% |
| Serbian | 108 | 0.1% |
| Sioux | 40 | 0.0% |
| Slavic | 85 | 0.1% |
| Slovak | 265 | 0.2% |
| Slovene | 36 | 0.0% |
| South African | 55 | 0.0% |
| South American | 521 | 0.3% |
| South American Indian | 6 | 0.0% |
| Spaniard | 38 | 0.0% |
| Spanish | 70 | 0.0% |
| Sri Lankan | 171 | 0.1% |
| Subsaharan African | 514 | 0.3% |
| Swedish | 3,825 | 2.3% |
| Swiss | 3,132 | 1.9% |
| Thai | 113 | 0.1% |
| Turkish | 24 | 0.0% |
| Ukrainian | 188 | 0.1% |
| Uruguayan | 31 | 0.0% |
| Venezuelan | 16 | 0.0% |
| Welsh | 800 | 0.5% |
| Yugoslavian | 82 | 0.1% | View All 116 Rows |
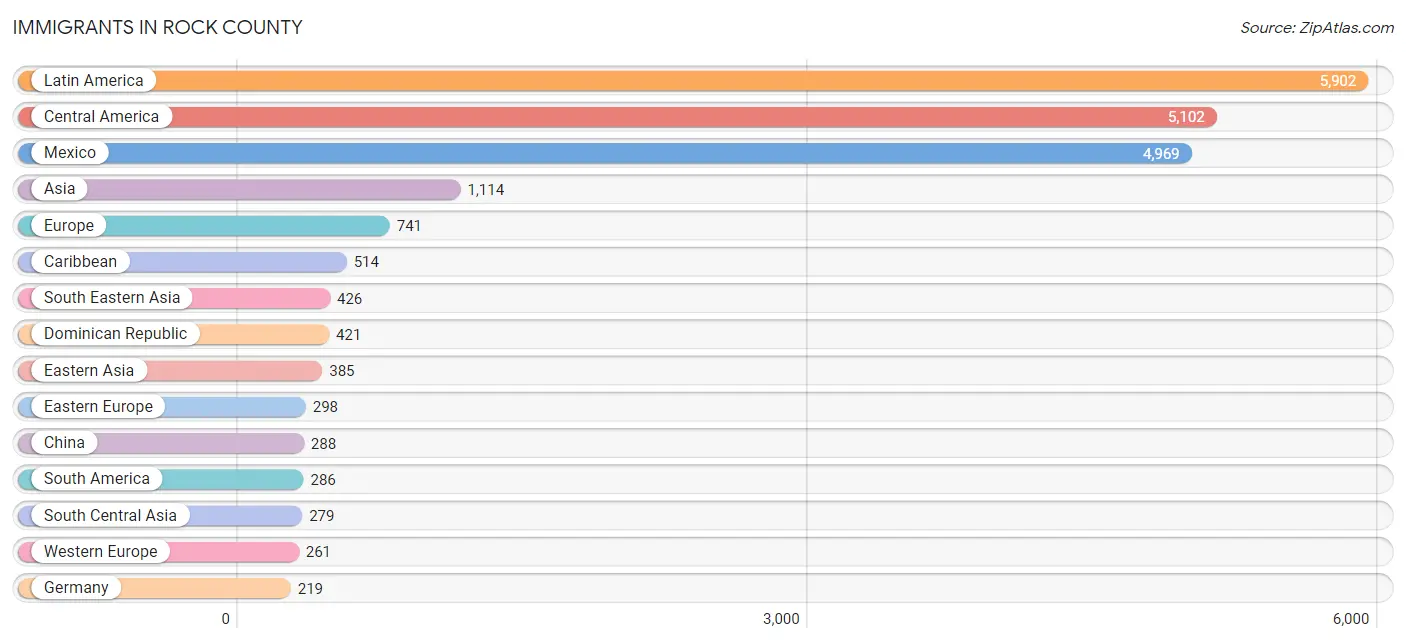
Immigrants in Rock County
The most numerous immigrant groups reported in Rock County came from Latin America (5,902 | 3.6%), Central America (5,102 | 3.1%), Mexico (4,969 | 3.0%), Asia (1,114 | 0.7%), and Europe (741 | 0.4%), together accounting for 10.9% of all Rock County residents.
| Immigration Origin | # Population | % Population |
| Africa | 170 | 0.1% |
| Albania | 12 | 0.0% |
| Argentina | 93 | 0.1% |
| Asia | 1,114 | 0.7% |
| Australia | 14 | 0.0% |
| Bolivia | 3 | 0.0% |
| Bulgaria | 8 | 0.0% |
| Cambodia | 98 | 0.1% |
| Cameroon | 57 | 0.0% |
| Canada | 136 | 0.1% |
| Caribbean | 514 | 0.3% |
| Central America | 5,102 | 3.1% |
| Chile | 28 | 0.0% |
| China | 288 | 0.2% |
| Colombia | 114 | 0.1% |
| Croatia | 16 | 0.0% |
| Cuba | 21 | 0.0% |
| Czechoslovakia | 27 | 0.0% |
| Denmark | 27 | 0.0% |
| Dominican Republic | 421 | 0.3% |
| Eastern Africa | 5 | 0.0% |
| Eastern Asia | 385 | 0.2% |
| Eastern Europe | 298 | 0.2% |
| Egypt | 15 | 0.0% |
| El Salvador | 9 | 0.0% |
| England | 38 | 0.0% |
| Ethiopia | 4 | 0.0% |
| Europe | 741 | 0.4% |
| Germany | 219 | 0.1% |
| Ghana | 35 | 0.0% |
| Guatemala | 20 | 0.0% |
| Haiti | 20 | 0.0% |
| Honduras | 104 | 0.1% |
| Hong Kong | 11 | 0.0% |
| Hungary | 55 | 0.0% |
| India | 48 | 0.0% |
| Indonesia | 14 | 0.0% |
| Iran | 34 | 0.0% |
| Ireland | 2 | 0.0% |
| Italy | 27 | 0.0% |
| Jamaica | 25 | 0.0% |
| Japan | 27 | 0.0% |
| Korea | 70 | 0.0% |
| Kuwait | 7 | 0.0% |
| Latin America | 5,902 | 3.6% |
| Mexico | 4,969 | 3.0% |
| Middle Africa | 57 | 0.0% |
| Morocco | 3 | 0.0% |
| Nepal | 2 | 0.0% |
| Netherlands | 42 | 0.0% |
| North Macedonia | 30 | 0.0% |
| Northern Africa | 18 | 0.0% |
| Northern Europe | 155 | 0.1% |
| Norway | 23 | 0.0% |
| Oceania | 14 | 0.0% |
| Pakistan | 177 | 0.1% |
| Peru | 18 | 0.0% |
| Philippines | 148 | 0.1% |
| Poland | 17 | 0.0% |
| Russia | 23 | 0.0% |
| Saudi Arabia | 17 | 0.0% |
| Scotland | 24 | 0.0% |
| South Africa | 55 | 0.0% |
| South America | 286 | 0.2% |
| South Central Asia | 279 | 0.2% |
| South Eastern Asia | 426 | 0.3% |
| Southern Europe | 27 | 0.0% |
| Sweden | 12 | 0.0% |
| Taiwan | 6 | 0.0% |
| Thailand | 89 | 0.1% |
| Trinidad and Tobago | 27 | 0.0% |
| Ukraine | 19 | 0.0% |
| Uruguay | 28 | 0.0% |
| Uzbekistan | 18 | 0.0% |
| Venezuela | 2 | 0.0% |
| Vietnam | 59 | 0.0% |
| Western Africa | 35 | 0.0% |
| Western Asia | 24 | 0.0% |
| Western Europe | 261 | 0.2% | View All 79 Rows |
Sex and Age in Rock County
Sex and Age in Rock County
The most populous age groups in Rock County are 60 to 64 Years (5,884 | 7.2%) for men and 55 to 59 Years (5,861 | 7.1%) for women.
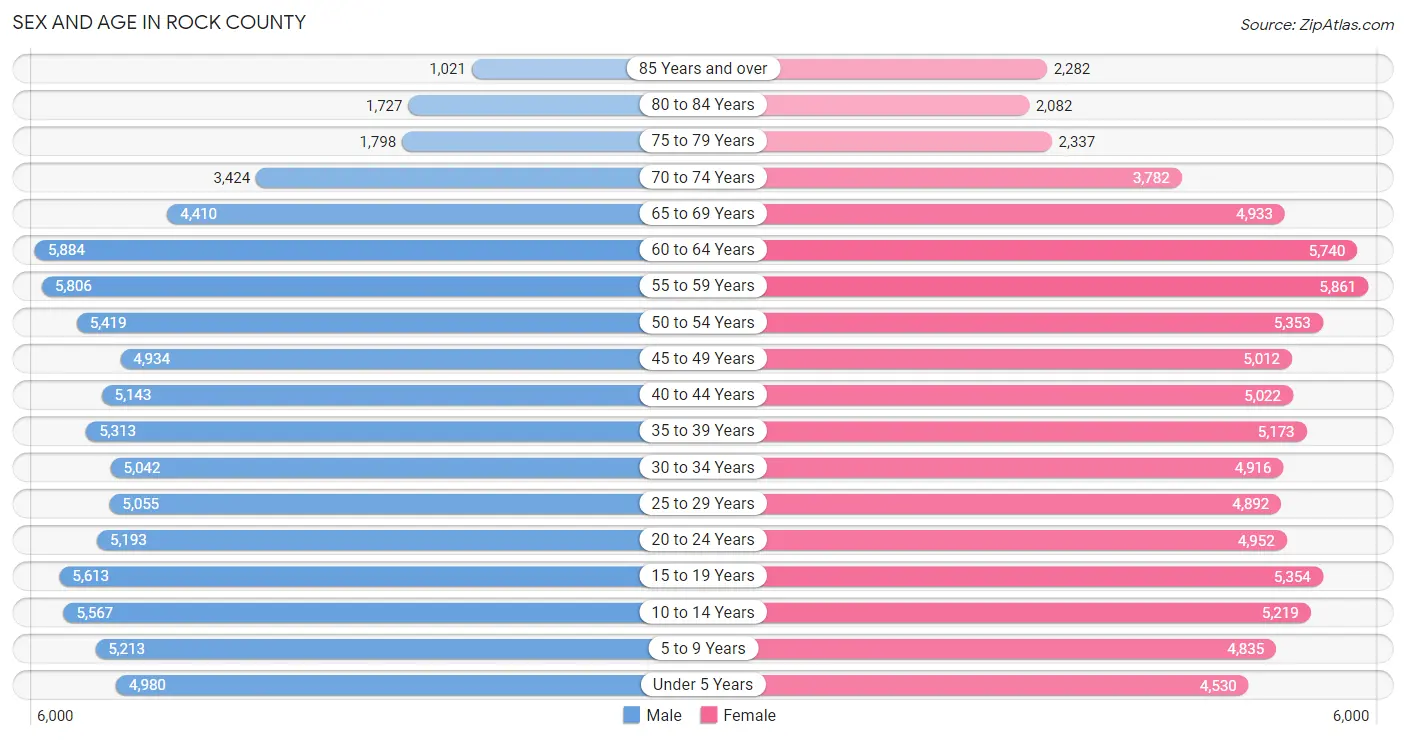
| Age Bracket | Male | Female |
| Under 5 Years | 4,980 (6.1%) | 4,530 (5.5%) |
| 5 to 9 Years | 5,213 (6.4%) | 4,835 (5.9%) |
| 10 to 14 Years | 5,567 (6.8%) | 5,219 (6.3%) |
| 15 to 19 Years | 5,613 (6.9%) | 5,354 (6.5%) |
| 20 to 24 Years | 5,193 (6.4%) | 4,952 (6.0%) |
| 25 to 29 Years | 5,055 (6.2%) | 4,892 (5.9%) |
| 30 to 34 Years | 5,042 (6.2%) | 4,916 (6.0%) |
| 35 to 39 Years | 5,313 (6.5%) | 5,173 (6.3%) |
| 40 to 44 Years | 5,143 (6.3%) | 5,022 (6.1%) |
| 45 to 49 Years | 4,934 (6.0%) | 5,012 (6.1%) |
| 50 to 54 Years | 5,419 (6.7%) | 5,353 (6.5%) |
| 55 to 59 Years | 5,806 (7.1%) | 5,861 (7.1%) |
| 60 to 64 Years | 5,884 (7.2%) | 5,740 (7.0%) |
| 65 to 69 Years | 4,410 (5.4%) | 4,933 (6.0%) |
| 70 to 74 Years | 3,424 (4.2%) | 3,782 (4.6%) |
| 75 to 79 Years | 1,798 (2.2%) | 2,337 (2.8%) |
| 80 to 84 Years | 1,727 (2.1%) | 2,082 (2.5%) |
| 85 Years and over | 1,021 (1.3%) | 2,282 (2.8%) |
| Total | 81,542 (100.0%) | 82,275 (100.0%) |
Families and Households in Rock County
Median Family Size in Rock County
The median family size in Rock County is 3.01 persons per family, with married-couple families (31,243 | 75.0%) accounting for the largest median family size of 3.06 persons per family. On the other hand, single male/father families (3,449 | 8.3%) represent the smallest median family size with 2.77 persons per family.

| Family Type | # Families | Family Size |
| Married-Couple | 31,243 (75.0%) | 3.06 |
| Single Male/Father | 3,449 (8.3%) | 2.77 |
| Single Female/Mother | 6,984 (16.8%) | 2.93 |
| Total Families | 41,676 (100.0%) | 3.01 |
Median Household Size in Rock County
The median household size in Rock County is 2.42 persons per household, with single female/mother households (6,984 | 10.5%) accounting for the largest median household size of 3.25 persons per household. non-family households (24,763 | 37.3%) represent the smallest median household size with 1.26 persons per household.
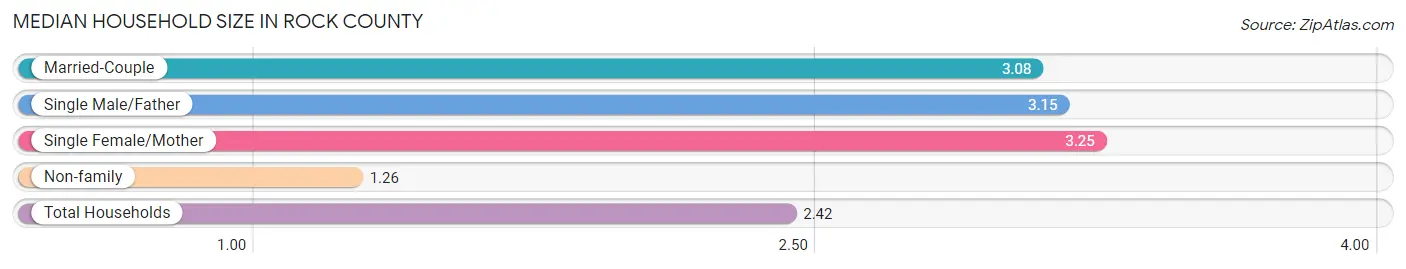
| Household Type | # Households | Household Size |
| Married-Couple | 31,243 (47.0%) | 3.08 |
| Single Male/Father | 3,449 (5.2%) | 3.15 |
| Single Female/Mother | 6,984 (10.5%) | 3.25 |
| Non-family | 24,763 (37.3%) | 1.26 |
| Total Households | 66,439 (100.0%) | 2.42 |
Household Size by Marriage Status in Rock County
Out of a total of 66,439 households in Rock County, 41,676 (62.7%) are family households, while 24,763 (37.3%) are nonfamily households. The most numerous type of family households are 2-person households, comprising 20,173, and the most common type of nonfamily households are 1-person households, comprising 19,765.
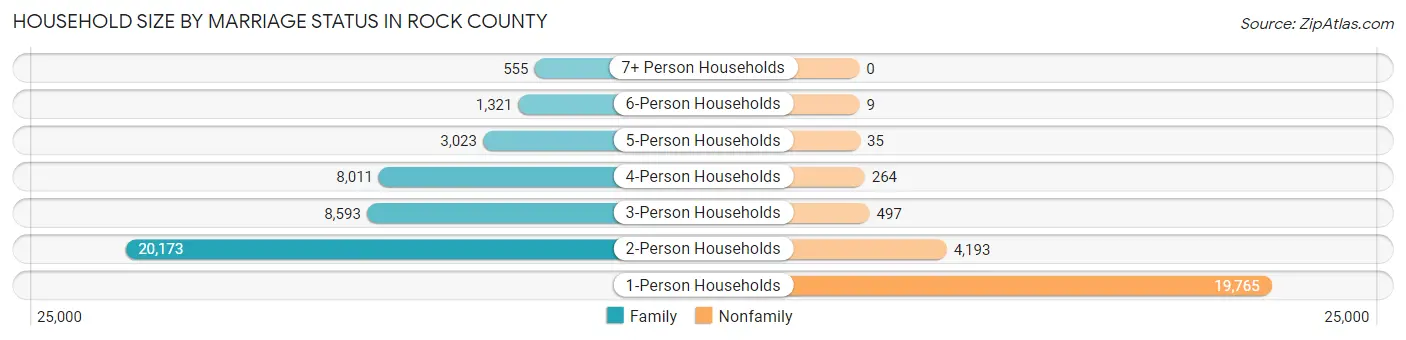
| Household Size | Family Households | Nonfamily Households |
| 1-Person Households | - | 19,765 (29.7%) |
| 2-Person Households | 20,173 (30.4%) | 4,193 (6.3%) |
| 3-Person Households | 8,593 (12.9%) | 497 (0.7%) |
| 4-Person Households | 8,011 (12.1%) | 264 (0.4%) |
| 5-Person Households | 3,023 (4.5%) | 35 (0.1%) |
| 6-Person Households | 1,321 (2.0%) | 9 (0.0%) |
| 7+ Person Households | 555 (0.8%) | 0 (0.0%) |
| Total | 41,676 (62.7%) | 24,763 (37.3%) |
Female Fertility in Rock County
Fertility by Age in Rock County
Average fertility rate in Rock County is 52.0 births per 1,000 women. Women in the age bracket of 20 to 34 years have the highest fertility rate with 105.0 births per 1,000 women. Women in the age bracket of 20 to 34 years acount for 83.0% of all women with births.
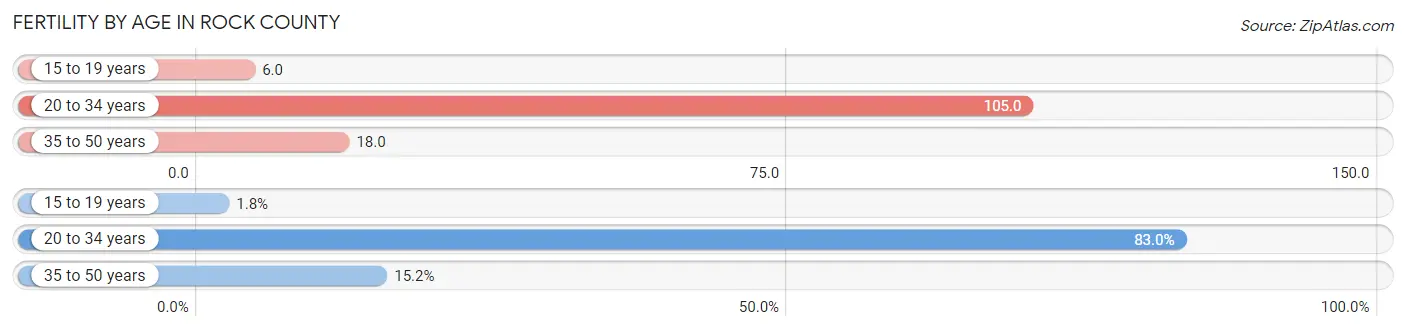
| Age Bracket | Women with Births | Births / 1,000 Women |
| 15 to 19 years | 34 (1.8%) | 6.0 |
| 20 to 34 years | 1,555 (83.0%) | 105.0 |
| 35 to 50 years | 285 (15.2%) | 18.0 |
| Total | 1,874 (100.0%) | 52.0 |
Fertility by Age by Marriage Status in Rock County
63.8% of women with births (1,874) in Rock County are married. The highest percentage of unmarried women with births falls into 15 to 19 years age bracket with 100.0% of them unmarried at the time of birth, while the lowest percentage of unmarried women with births belong to 35 to 50 years age bracket with 24.6% of them unmarried.
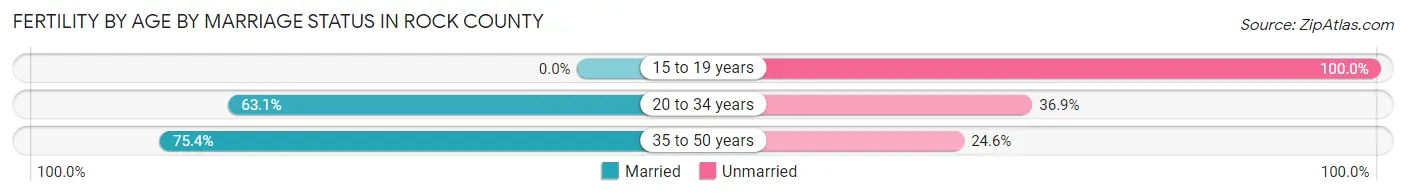
| Age Bracket | Married | Unmarried |
| 15 to 19 years | 0 (0.0%) | 34 (100.0%) |
| 20 to 34 years | 981 (63.1%) | 574 (36.9%) |
| 35 to 50 years | 215 (75.4%) | 70 (24.6%) |
| Total | 1,196 (63.8%) | 678 (36.2%) |
Fertility by Education in Rock County
Average fertility rate in Rock County is 52.0 births per 1,000 women. Women with the education attainment of bachelor's degree have the highest fertility rate of 93.0 births per 1,000 women, while women with the education attainment of less than high school have the lowest fertility at 18.0 births per 1,000 women. Women with the education attainment of college or associate's degree represent 37.2% of all women with births.
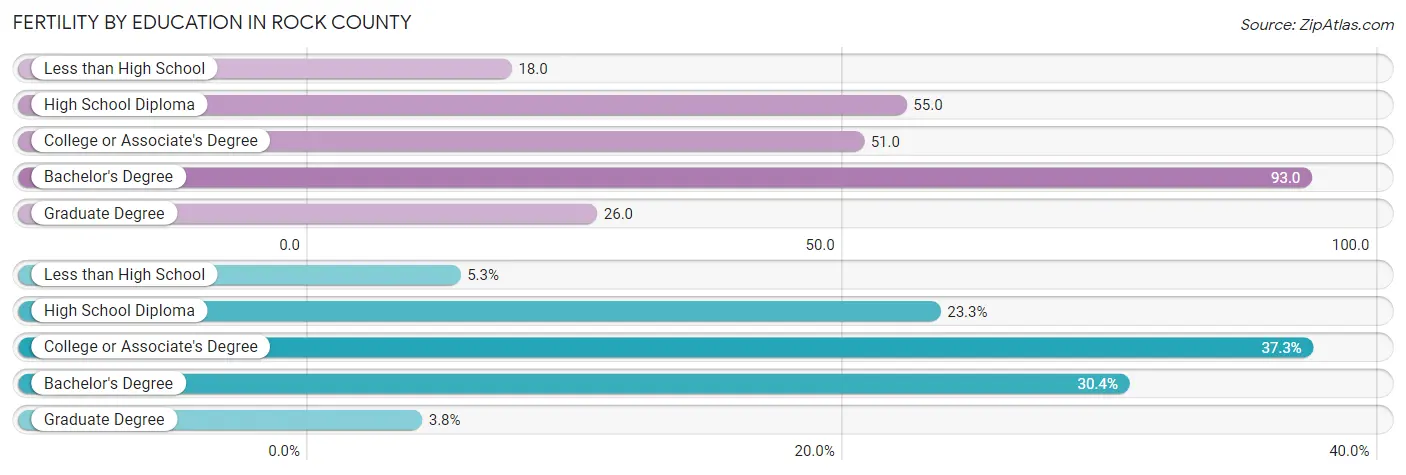
| Educational Attainment | Women with Births | Births / 1,000 Women |
| Less than High School | 99 (5.3%) | 18.0 |
| High School Diploma | 436 (23.3%) | 55.0 |
| College or Associate's Degree | 698 (37.2%) | 51.0 |
| Bachelor's Degree | 569 (30.4%) | 93.0 |
| Graduate Degree | 72 (3.8%) | 26.0 |
| Total | 1,874 (100.0%) | 52.0 |
Fertility by Education by Marriage Status in Rock County
36.2% of women with births in Rock County are unmarried. Women with the educational attainment of graduate degree are most likely to be married with 84.7% of them married at childbirth, while women with the educational attainment of high school diploma are least likely to be married with 56.2% of them unmarried at childbirth.
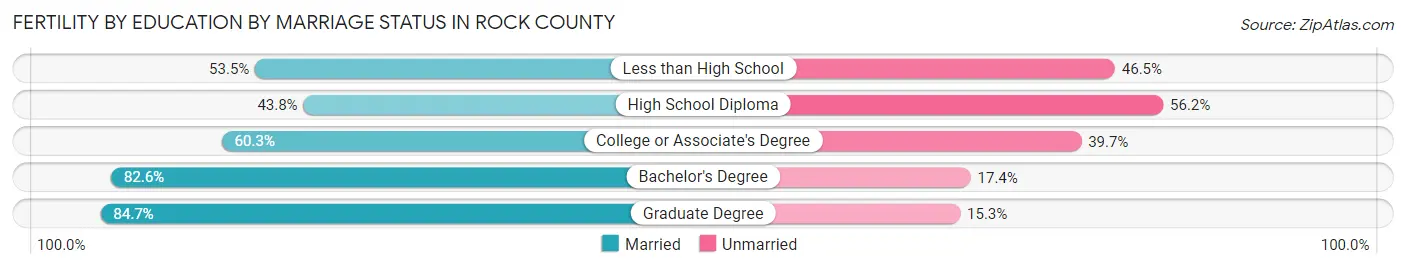
| Educational Attainment | Married | Unmarried |
| Less than High School | 53 (53.5%) | 46 (46.5%) |
| High School Diploma | 191 (43.8%) | 245 (56.2%) |
| College or Associate's Degree | 421 (60.3%) | 277 (39.7%) |
| Bachelor's Degree | 470 (82.6%) | 99 (17.4%) |
| Graduate Degree | 61 (84.7%) | 11 (15.3%) |
| Total | 1,196 (63.8%) | 678 (36.2%) |
Income in Rock County
Income Overview in Rock County
Per Capita Income in Rock County is $35,594, while median incomes of families and households are $84,424 and $70,630 respectively.
| Characteristic | Number | Measure |
| Per Capita Income | 163,817 | $35,594 |
| Median Family Income | 41,676 | $84,424 |
| Mean Family Income | 41,676 | $98,625 |
| Median Household Income | 66,439 | $70,630 |
| Mean Household Income | 66,439 | $85,333 |
| Income Deficit | 41,676 | $10,998 |
| Wage / Income Gap (%) | 163,817 | 28.83% |
| Wage / Income Gap ($) | 163,817 | 71.17¢ per $1 |
| Gini / Inequality Index | 163,817 | 0.40 |
Earnings by Sex in Rock County
Average Earnings in Rock County are $41,294, $47,745 for men and $33,980 for women, a difference of 28.8%.
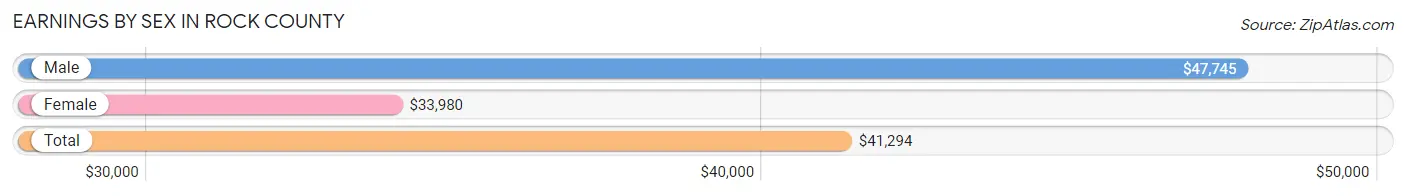
| Sex | Number | Average Earnings |
| Male | 46,754 (51.9%) | $47,745 |
| Female | 43,371 (48.1%) | $33,980 |
| Total | 90,125 (100.0%) | $41,294 |
Earnings by Sex by Income Bracket in Rock County
The most common earnings brackets in Rock County are $75,000 to $99,999 for men (5,457 | 11.7%) and $30,000 to $34,999 for women (3,386 | 7.8%).
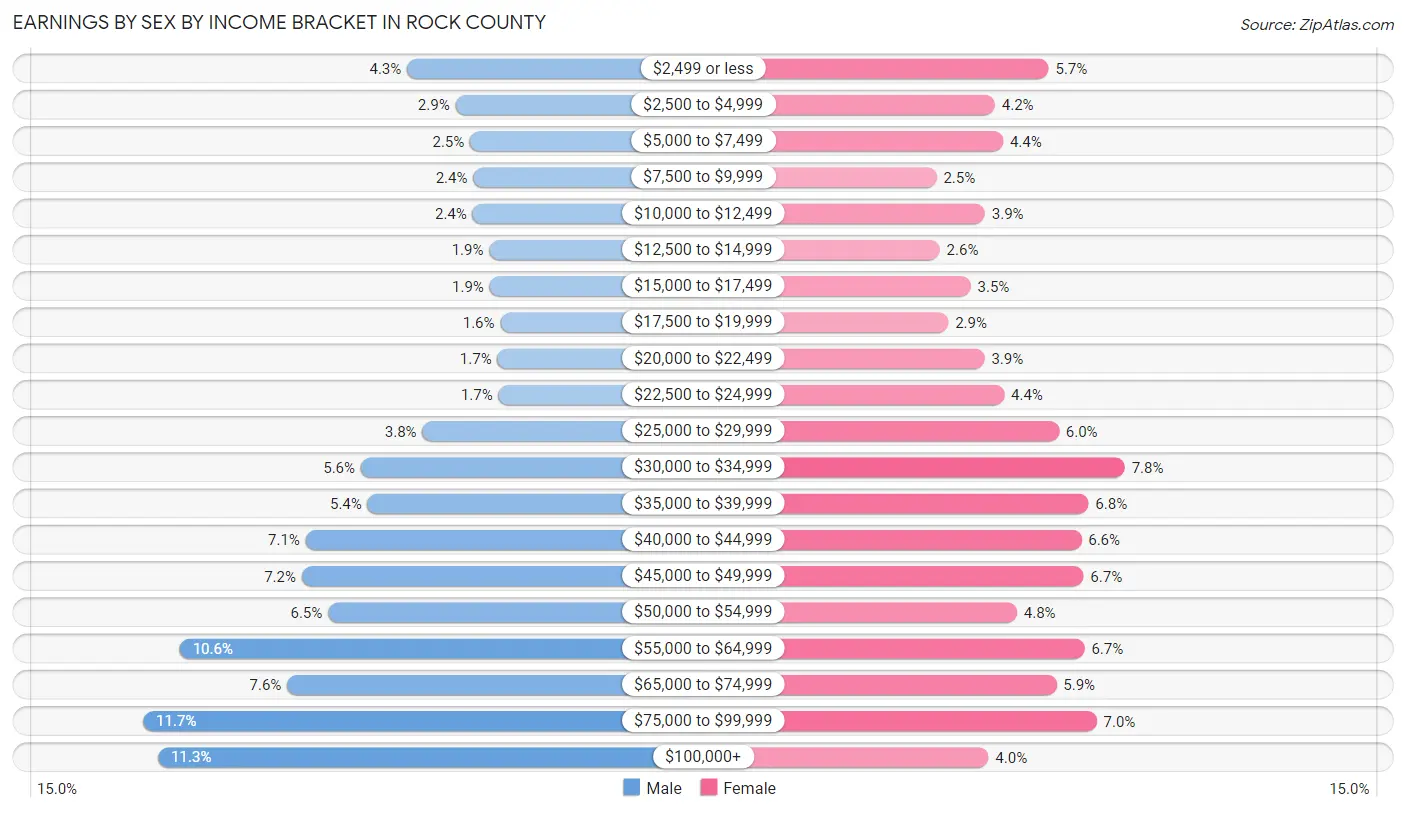
| Income | Male | Female |
| $2,499 or less | 1,987 (4.3%) | 2,458 (5.7%) |
| $2,500 to $4,999 | 1,350 (2.9%) | 1,803 (4.2%) |
| $5,000 to $7,499 | 1,159 (2.5%) | 1,906 (4.4%) |
| $7,500 to $9,999 | 1,119 (2.4%) | 1,095 (2.5%) |
| $10,000 to $12,499 | 1,126 (2.4%) | 1,684 (3.9%) |
| $12,500 to $14,999 | 906 (1.9%) | 1,133 (2.6%) |
| $15,000 to $17,499 | 903 (1.9%) | 1,510 (3.5%) |
| $17,500 to $19,999 | 762 (1.6%) | 1,236 (2.9%) |
| $20,000 to $22,499 | 798 (1.7%) | 1,680 (3.9%) |
| $22,500 to $24,999 | 784 (1.7%) | 1,916 (4.4%) |
| $25,000 to $29,999 | 1,788 (3.8%) | 2,583 (6.0%) |
| $30,000 to $34,999 | 2,596 (5.6%) | 3,386 (7.8%) |
| $35,000 to $39,999 | 2,507 (5.4%) | 2,944 (6.8%) |
| $40,000 to $44,999 | 3,318 (7.1%) | 2,857 (6.6%) |
| $45,000 to $49,999 | 3,369 (7.2%) | 2,885 (6.7%) |
| $50,000 to $54,999 | 3,024 (6.5%) | 2,072 (4.8%) |
| $55,000 to $64,999 | 4,976 (10.6%) | 2,899 (6.7%) |
| $65,000 to $74,999 | 3,564 (7.6%) | 2,553 (5.9%) |
| $75,000 to $99,999 | 5,457 (11.7%) | 3,046 (7.0%) |
| $100,000+ | 5,261 (11.3%) | 1,725 (4.0%) |
| Total | 46,754 (100.0%) | 43,371 (100.0%) |
Earnings by Sex by Educational Attainment in Rock County
Average earnings in Rock County are $53,057 for men and $38,856 for women, a difference of 26.8%. Men with an educational attainment of graduate degree enjoy the highest average annual earnings of $80,404, while those with less than high school education earn the least with $40,272. Women with an educational attainment of graduate degree earn the most with the average annual earnings of $67,933, while those with less than high school education have the smallest earnings of $23,837.
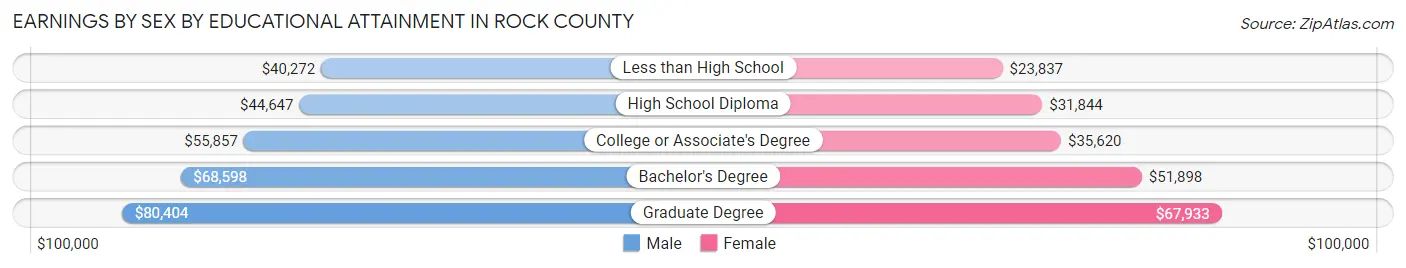
| Educational Attainment | Male Income | Female Income |
| Less than High School | $40,272 | $23,837 |
| High School Diploma | $44,647 | $31,844 |
| College or Associate's Degree | $55,857 | $35,620 |
| Bachelor's Degree | $68,598 | $51,898 |
| Graduate Degree | $80,404 | $67,933 |
| Total | $53,057 | $38,856 |
Family Income in Rock County
Family Income Brackets in Rock County
According to the Rock County family income data, there are 9,585 families falling into the $100,000 to $149,999 income range, which is the most common income bracket and makes up 23.0% of all families. Conversely, the $10,000 to $14,999 income bracket is the least frequent group with only 667 families (1.6%) belonging to this category.
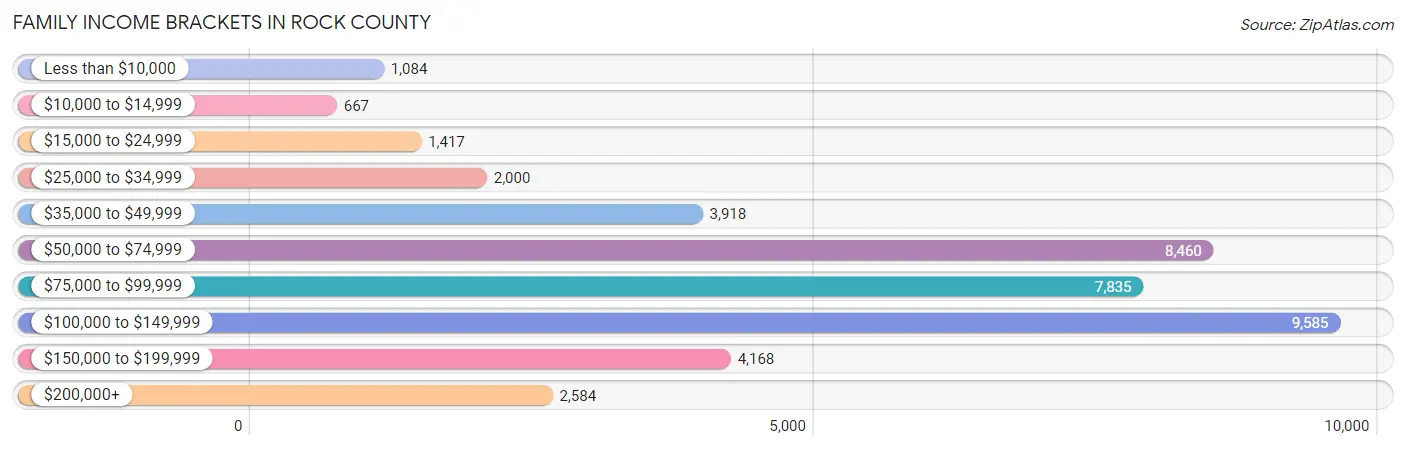
| Income Bracket | # Families | % Families |
| Less than $10,000 | 1,084 | 2.6% |
| $10,000 to $14,999 | 667 | 1.6% |
| $15,000 to $24,999 | 1,417 | 3.4% |
| $25,000 to $34,999 | 2,000 | 4.8% |
| $35,000 to $49,999 | 3,918 | 9.4% |
| $50,000 to $74,999 | 8,460 | 20.3% |
| $75,000 to $99,999 | 7,835 | 18.8% |
| $100,000 to $149,999 | 9,585 | 23.0% |
| $150,000 to $199,999 | 4,168 | 10.0% |
| $200,000+ | 2,584 | 6.2% |
Family Income by Famaliy Size in Rock County
4-person families (7,536 | 18.1%) account for the highest median family income in Rock County with $106,667 per family, while 2-person families (22,038 | 52.9%) have the highest median income of $37,674 per family member.
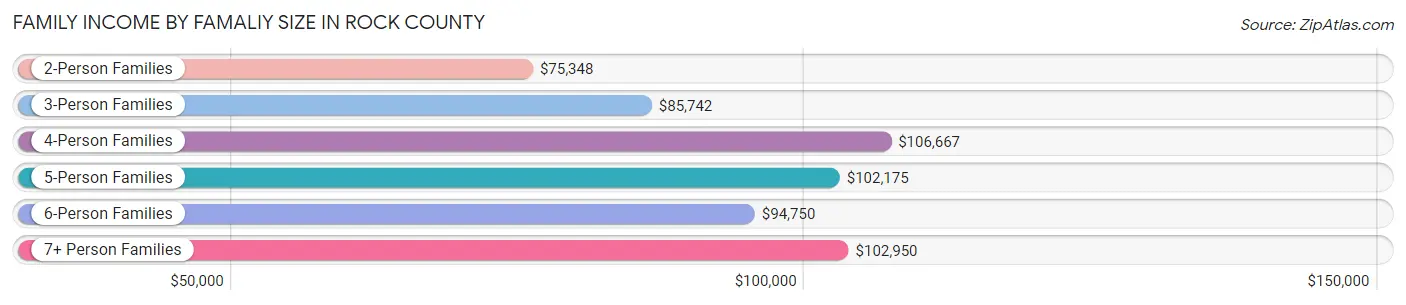
| Income Bracket | # Families | Median Income |
| 2-Person Families | 22,038 (52.9%) | $75,348 |
| 3-Person Families | 7,908 (19.0%) | $85,742 |
| 4-Person Families | 7,536 (18.1%) | $106,667 |
| 5-Person Families | 2,547 (6.1%) | $102,175 |
| 6-Person Families | 1,144 (2.7%) | $94,750 |
| 7+ Person Families | 503 (1.2%) | $102,950 |
| Total | 41,676 (100.0%) | $84,424 |
Family Income by Number of Earners in Rock County
The median family income in Rock County is $84,424, with families comprising 3+ earners (4,987) having the highest median family income of $133,963, while families with no earners (6,543) have the lowest median family income of $56,583, accounting for 12.0% and 15.7% of families, respectively.
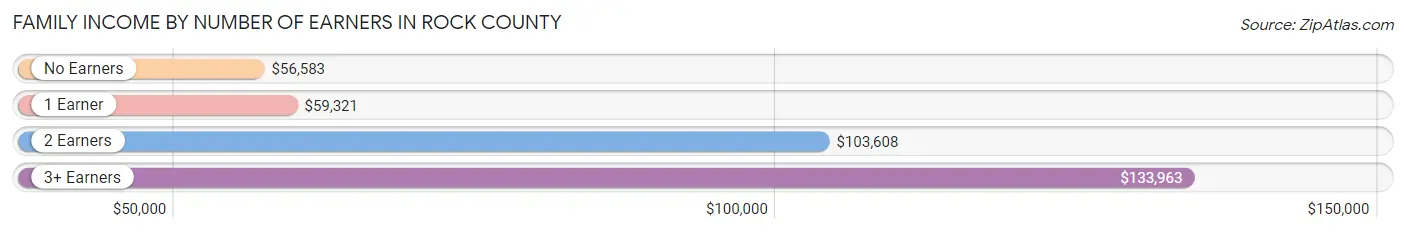
| Number of Earners | # Families | Median Income |
| No Earners | 6,543 (15.7%) | $56,583 |
| 1 Earner | 12,881 (30.9%) | $59,321 |
| 2 Earners | 17,265 (41.4%) | $103,608 |
| 3+ Earners | 4,987 (12.0%) | $133,963 |
| Total | 41,676 (100.0%) | $84,424 |
Household Income in Rock County
Household Income Brackets in Rock County
With 13,088 households falling in the category, the $50,000 to $74,999 income range is the most frequent in Rock County, accounting for 19.7% of all households. In contrast, only 2,126 households (3.2%) fall into the $10,000 to $14,999 income bracket, making it the least populous group.
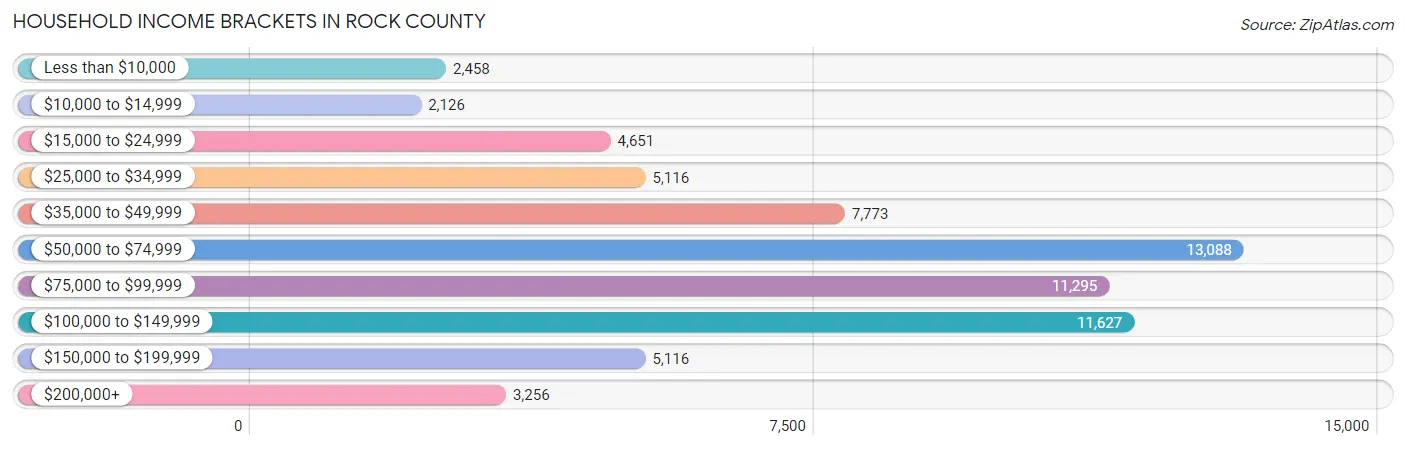
| Income Bracket | # Households | % Households |
| Less than $10,000 | 2,458 | 3.7% |
| $10,000 to $14,999 | 2,126 | 3.2% |
| $15,000 to $24,999 | 4,651 | 7.0% |
| $25,000 to $34,999 | 5,116 | 7.7% |
| $35,000 to $49,999 | 7,773 | 11.7% |
| $50,000 to $74,999 | 13,088 | 19.7% |
| $75,000 to $99,999 | 11,295 | 17.0% |
| $100,000 to $149,999 | 11,627 | 17.5% |
| $150,000 to $199,999 | 5,116 | 7.7% |
| $200,000+ | 3,256 | 4.9% |
Household Income by Householder Age in Rock County
The median household income in Rock County is $70,630, with the highest median household income of $80,662 found in the 45 to 64 years age bracket for the primary householder. A total of 25,562 households (38.5%) fall into this category. Meanwhile, the 65+ years age bracket for the primary householder has the lowest median household income of $53,106, with 18,289 households (27.5%) in this group.

| Income Bracket | # Households | Median Income |
| 15 to 24 Years | 2,394 (3.6%) | $53,590 |
| 25 to 44 Years | 20,194 (30.4%) | $78,582 |
| 45 to 64 Years | 25,562 (38.5%) | $80,662 |
| 65+ Years | 18,289 (27.5%) | $53,106 |
| Total | 66,439 (100.0%) | $70,630 |
Poverty in Rock County
Income Below Poverty by Sex and Age in Rock County
With 8.8% poverty level for males and 10.9% for females among the residents of Rock County, 16 and 17 year old males and 12 to 14 year old females are the most vulnerable to poverty, with 490 males (19.0%) and 470 females (16.4%) in their respective age groups living below the poverty level.
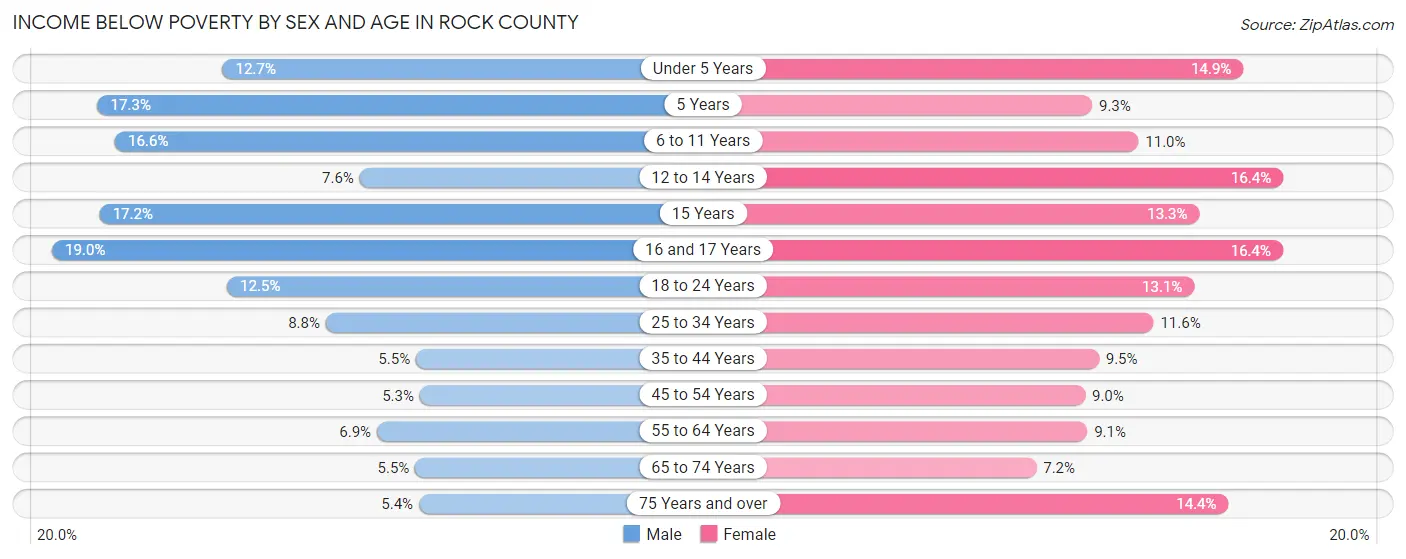
| Age Bracket | Male | Female |
| Under 5 Years | 616 (12.7%) | 658 (14.9%) |
| 5 Years | 241 (17.3%) | 63 (9.3%) |
| 6 to 11 Years | 990 (16.6%) | 688 (11.0%) |
| 12 to 14 Years | 233 (7.6%) | 470 (16.4%) |
| 15 Years | 154 (17.2%) | 168 (13.3%) |
| 16 and 17 Years | 490 (19.0%) | 337 (16.4%) |
| 18 to 24 Years | 826 (12.5%) | 836 (13.1%) |
| 25 to 34 Years | 883 (8.8%) | 1,132 (11.6%) |
| 35 to 44 Years | 569 (5.5%) | 971 (9.5%) |
| 45 to 54 Years | 551 (5.3%) | 936 (9.0%) |
| 55 to 64 Years | 808 (6.9%) | 1,052 (9.1%) |
| 65 to 74 Years | 428 (5.5%) | 628 (7.2%) |
| 75 Years and over | 236 (5.4%) | 887 (14.3%) |
| Total | 7,025 (8.8%) | 8,826 (10.9%) |
Income Above Poverty by Sex and Age in Rock County
According to the poverty statistics in Rock County, males aged 45 to 54 years and females aged 65 to 74 years are the age groups that are most secure financially, with 94.7% of males and 92.8% of females in these age groups living above the poverty line.
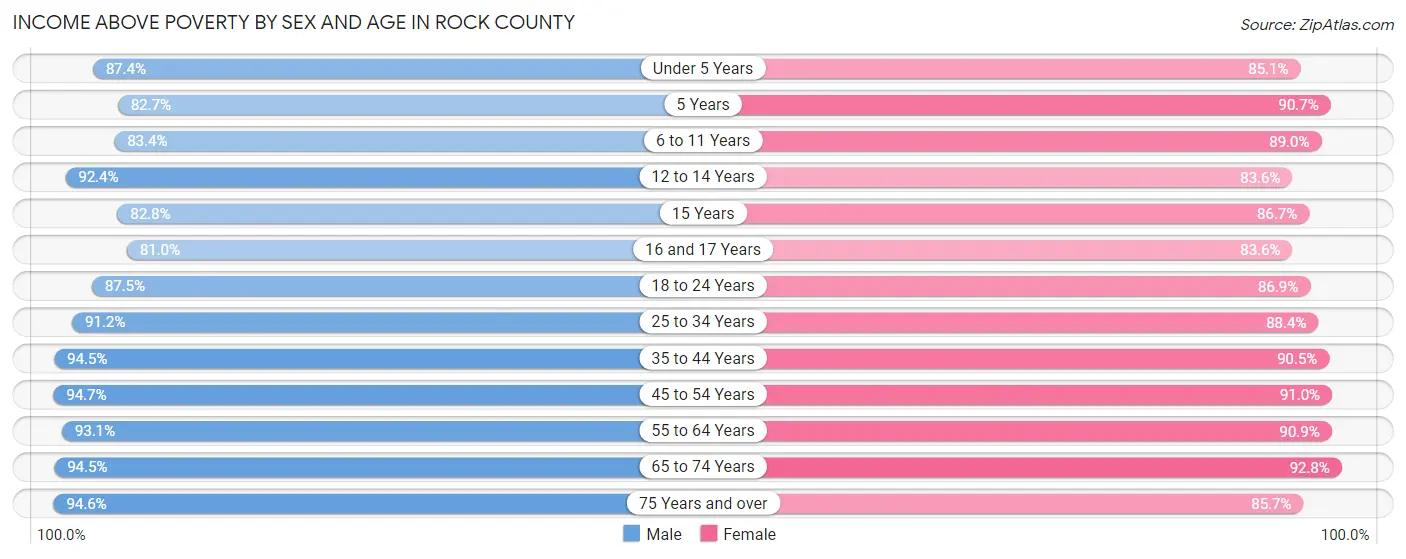
| Age Bracket | Male | Female |
| Under 5 Years | 4,253 (87.4%) | 3,758 (85.1%) |
| 5 Years | 1,153 (82.7%) | 615 (90.7%) |
| 6 to 11 Years | 4,958 (83.4%) | 5,563 (89.0%) |
| 12 to 14 Years | 2,849 (92.4%) | 2,400 (83.6%) |
| 15 Years | 741 (82.8%) | 1,098 (86.7%) |
| 16 and 17 Years | 2,092 (81.0%) | 1,722 (83.6%) |
| 18 to 24 Years | 5,793 (87.5%) | 5,555 (86.9%) |
| 25 to 34 Years | 9,123 (91.2%) | 8,648 (88.4%) |
| 35 to 44 Years | 9,831 (94.5%) | 9,202 (90.5%) |
| 45 to 54 Years | 9,788 (94.7%) | 9,429 (91.0%) |
| 55 to 64 Years | 10,862 (93.1%) | 10,492 (90.9%) |
| 65 to 74 Years | 7,354 (94.5%) | 8,070 (92.8%) |
| 75 Years and over | 4,168 (94.6%) | 5,296 (85.7%) |
| Total | 72,965 (91.2%) | 71,848 (89.1%) |
Income Below Poverty Among Married-Couple Families in Rock County
The poverty statistics for married-couple families in Rock County show that 3.1% or 958 of the total 31,243 families live below the poverty line. Families with 5 or more children have the highest poverty rate of 26.2%, comprising of 58 families. On the other hand, families with 1 or 2 children have the lowest poverty rate of 1.0%, which includes 89 families.
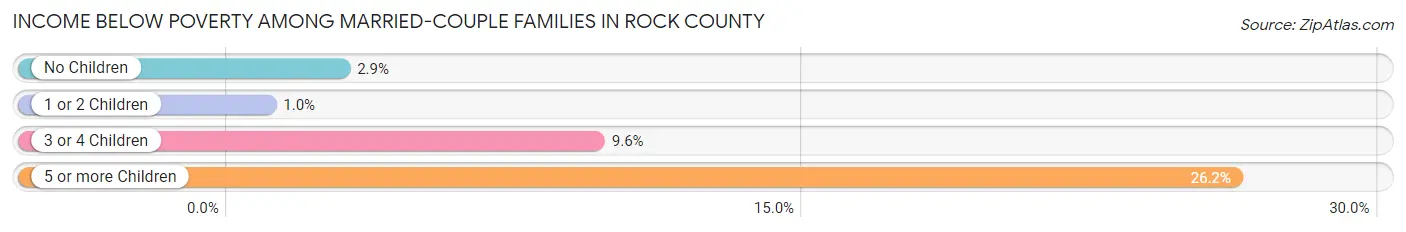
| Children | Above Poverty | Below Poverty |
| No Children | 19,052 (97.1%) | 575 (2.9%) |
| 1 or 2 Children | 8,843 (99.0%) | 89 (1.0%) |
| 3 or 4 Children | 2,227 (90.4%) | 236 (9.6%) |
| 5 or more Children | 163 (73.8%) | 58 (26.2%) |
| Total | 30,285 (96.9%) | 958 (3.1%) |
Income Below Poverty Among Single-Parent Households in Rock County
According to the poverty data in Rock County, 7.8% or 269 single-father households and 23.8% or 1,660 single-mother households are living below the poverty line. Among single-father households, those with 5 or more children have the highest poverty rate, with 23 households (100.0%) experiencing poverty. Likewise, among single-mother households, those with 3 or 4 children have the highest poverty rate, with 435 households (52.0%) falling below the poverty line.
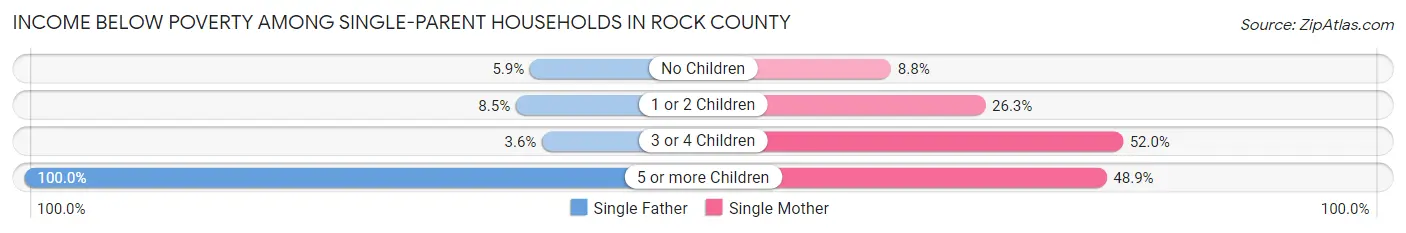
| Children | Single Father | Single Mother |
| No Children | 78 (5.9%) | 203 (8.8%) |
| 1 or 2 Children | 161 (8.5%) | 999 (26.3%) |
| 3 or 4 Children | 7 (3.6%) | 435 (52.0%) |
| 5 or more Children | 23 (100.0%) | 23 (48.9%) |
| Total | 269 (7.8%) | 1,660 (23.8%) |
Income Below Poverty Among Married-Couple vs Single-Parent Households in Rock County
The poverty data for Rock County shows that 958 of the married-couple family households (3.1%) and 1,929 of the single-parent households (18.5%) are living below the poverty level. Within the married-couple family households, those with 5 or more children have the highest poverty rate, with 58 households (26.2%) falling below the poverty line. Among the single-parent households, those with 5 or more children have the highest poverty rate, with 46 household (65.7%) living below poverty.
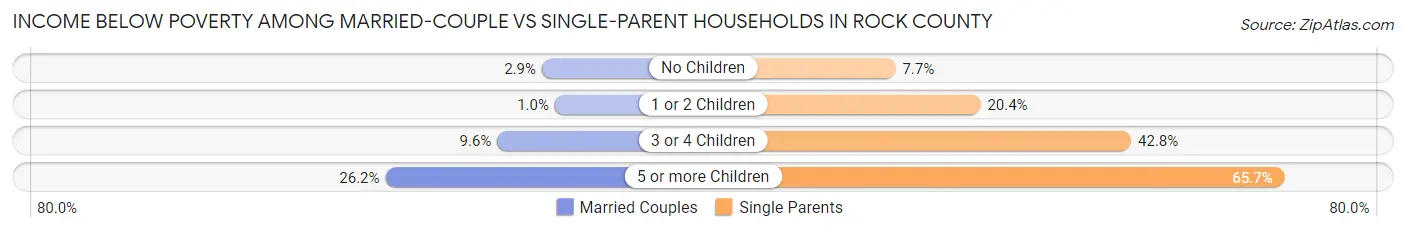
| Children | Married-Couple Families | Single-Parent Households |
| No Children | 575 (2.9%) | 281 (7.7%) |
| 1 or 2 Children | 89 (1.0%) | 1,160 (20.4%) |
| 3 or 4 Children | 236 (9.6%) | 442 (42.8%) |
| 5 or more Children | 58 (26.2%) | 46 (65.7%) |
| Total | 958 (3.1%) | 1,929 (18.5%) |
Employment Characteristics in Rock County
Employment by Class of Employer in Rock County
Among the 80,958 employed individuals in Rock County, private company employees (59,156 | 73.1%), not-for-profit organizations (6,552 | 8.1%), and local government employees (5,781 | 7.1%) make up the most common classes of employment.
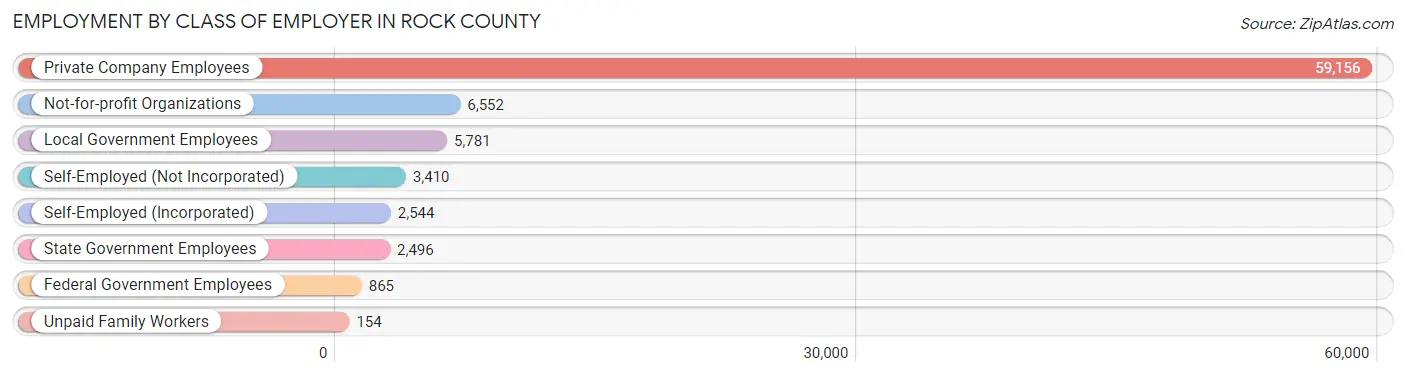
| Employer Class | # Employees | % Employees |
| Private Company Employees | 59,156 | 73.1% |
| Self-Employed (Incorporated) | 2,544 | 3.1% |
| Self-Employed (Not Incorporated) | 3,410 | 4.2% |
| Not-for-profit Organizations | 6,552 | 8.1% |
| Local Government Employees | 5,781 | 7.1% |
| State Government Employees | 2,496 | 3.1% |
| Federal Government Employees | 865 | 1.1% |
| Unpaid Family Workers | 154 | 0.2% |
| Total | 80,958 | 100.0% |
Employment Status by Age in Rock County
According to the labor force statistics for Rock County, out of the total population over 16 years of age (131,307), 65.4% or 85,875 individuals are in the labor force, with 3.9% or 3,349 of them unemployed. The age group with the highest labor force participation rate is 25 to 29 years, with 87.2% or 8,674 individuals in the labor force. Within the labor force, the 75 years and over age range has the highest percentage of unemployed individuals, with 10.4% or 57 of them being unemployed.

| Age Bracket | In Labor Force | Unemployed |
| 16 to 19 Years | 4,295 (48.8%) | 404 (9.4%) |
| 20 to 24 Years | 8,552 (84.3%) | 445 (5.2%) |
| 25 to 29 Years | 8,674 (87.2%) | 512 (5.9%) |
| 30 to 34 Years | 8,634 (86.7%) | 371 (4.3%) |
| 35 to 44 Years | 17,863 (86.5%) | 536 (3.0%) |
| 45 to 54 Years | 17,672 (85.3%) | 512 (2.9%) |
| 55 to 59 Years | 9,089 (77.9%) | 209 (2.3%) |
| 60 to 64 Years | 6,684 (57.5%) | 207 (3.1%) |
| 65 to 74 Years | 3,856 (23.3%) | 73 (1.9%) |
| 75 Years and over | 551 (4.9%) | 57 (10.4%) |
| Total | 85,875 (65.4%) | 3,349 (3.9%) |
Employment Status by Educational Attainment in Rock County
According to labor force statistics for Rock County, 81.1% of individuals (68,582) out of the total population between 25 and 64 years of age (84,565) are in the labor force, with 3.4% or 2,332 of them being unemployed. The group with the highest labor force participation rate are those with the educational attainment of bachelor's degree or higher, with 87.4% or 18,581 individuals in the labor force. Within the labor force, individuals with less than high school education have the highest percentage of unemployment, with 9.4% or 415 of them being unemployed.
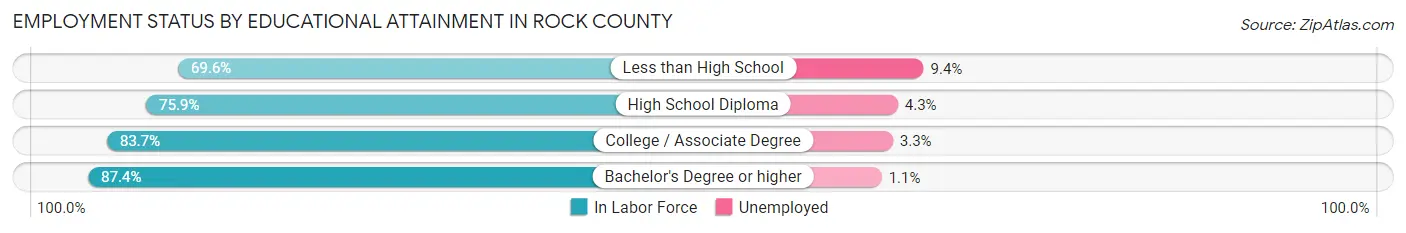
| Educational Attainment | In Labor Force | Unemployed |
| Less than High School | 4,420 (69.6%) | 597 (9.4%) |
| High School Diploma | 19,976 (75.9%) | 1,132 (4.3%) |
| College / Associate Degree | 25,642 (83.7%) | 1,011 (3.3%) |
| Bachelor's Degree or higher | 18,581 (87.4%) | 234 (1.1%) |
| Total | 68,582 (81.1%) | 2,875 (3.4%) |
Employment Occupations by Sex in Rock County
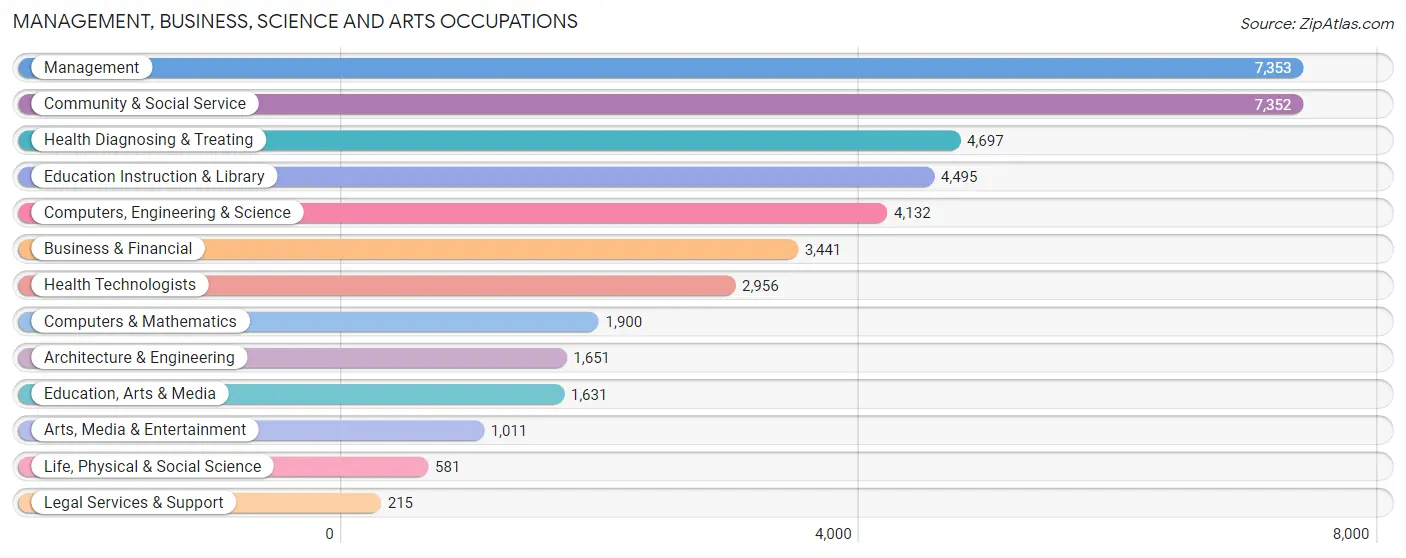
Management, Business, Science and Arts Occupations
The most common Management, Business, Science and Arts occupations in Rock County are Management (7,353 | 8.9%), Community & Social Service (7,352 | 8.9%), Health Diagnosing & Treating (4,697 | 5.7%), Education Instruction & Library (4,495 | 5.4%), and Computers, Engineering & Science (4,132 | 5.0%).
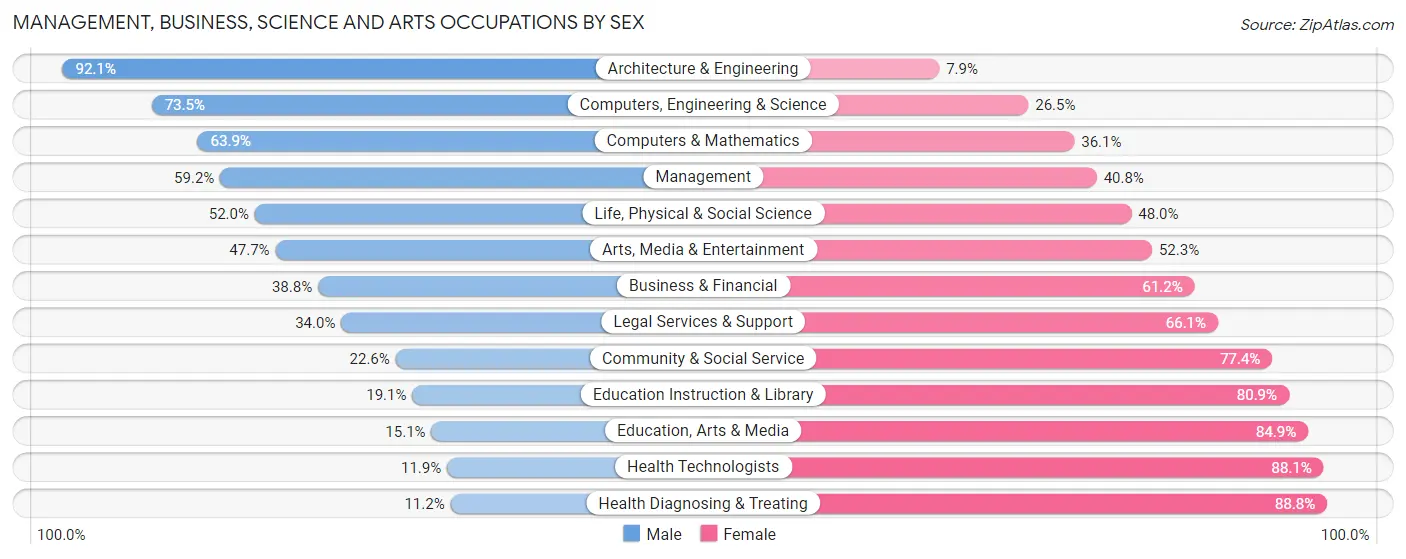
Management, Business, Science and Arts Occupations by Sex
Within the Management, Business, Science and Arts occupations in Rock County, the most male-oriented occupations are Architecture & Engineering (92.1%), Computers, Engineering & Science (73.5%), and Computers & Mathematics (63.9%), while the most female-oriented occupations are Health Diagnosing & Treating (88.8%), Health Technologists (88.1%), and Education, Arts & Media (84.9%).
| Occupation | Male | Female |
| Management | 4,354 (59.2%) | 2,999 (40.8%) |
| Business & Financial | 1,335 (38.8%) | 2,106 (61.2%) |
| Computers, Engineering & Science | 3,036 (73.5%) | 1,096 (26.5%) |
| Computers & Mathematics | 1,214 (63.9%) | 686 (36.1%) |
| Architecture & Engineering | 1,520 (92.1%) | 131 (7.9%) |
| Life, Physical & Social Science | 302 (52.0%) | 279 (48.0%) |
| Community & Social Service | 1,662 (22.6%) | 5,690 (77.4%) |
| Education, Arts & Media | 247 (15.1%) | 1,384 (84.9%) |
| Legal Services & Support | 73 (34.0%) | 142 (66.0%) |
| Education Instruction & Library | 860 (19.1%) | 3,635 (80.9%) |
| Arts, Media & Entertainment | 482 (47.7%) | 529 (52.3%) |
| Health Diagnosing & Treating | 524 (11.2%) | 4,173 (88.8%) |
| Health Technologists | 351 (11.9%) | 2,605 (88.1%) |
| Total (Category) | 10,911 (40.5%) | 16,064 (59.6%) |
| Total (Overall) | 43,100 (52.3%) | 39,353 (47.7%) |
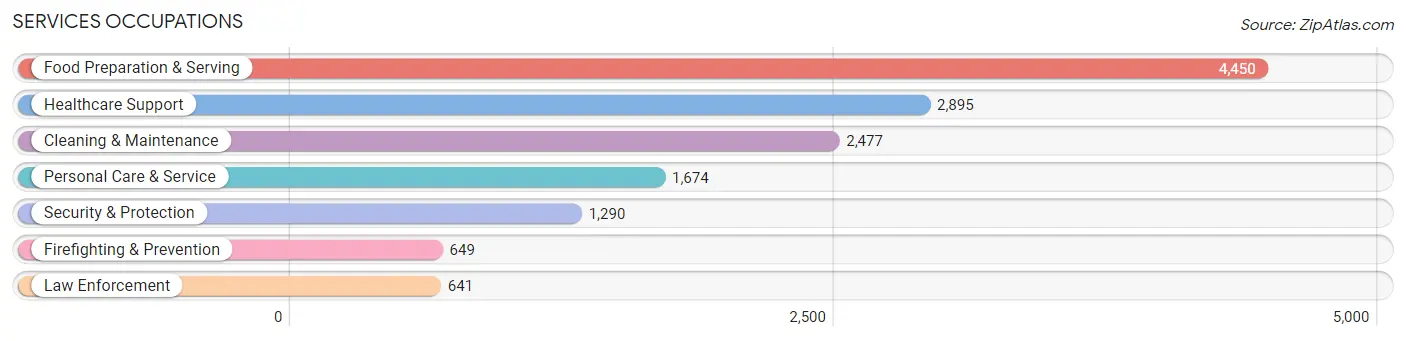
Services Occupations
The most common Services occupations in Rock County are Food Preparation & Serving (4,450 | 5.4%), Healthcare Support (2,895 | 3.5%), Cleaning & Maintenance (2,477 | 3.0%), Personal Care & Service (1,674 | 2.0%), and Security & Protection (1,290 | 1.6%).
Services Occupations by Sex
Within the Services occupations in Rock County, the most male-oriented occupations are Law Enforcement (76.6%), Security & Protection (68.8%), and Cleaning & Maintenance (62.4%), while the most female-oriented occupations are Healthcare Support (90.7%), Personal Care & Service (77.4%), and Food Preparation & Serving (61.0%).
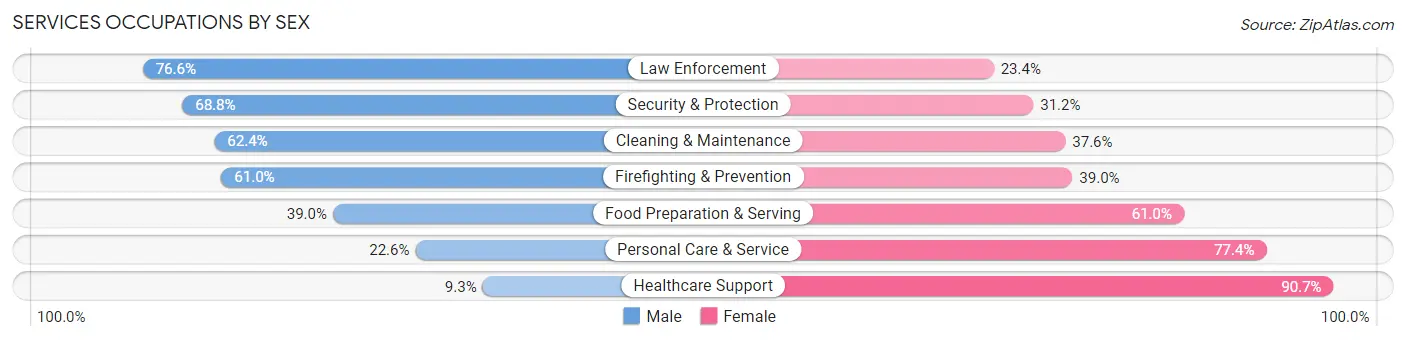
| Occupation | Male | Female |
| Healthcare Support | 270 (9.3%) | 2,625 (90.7%) |
| Security & Protection | 887 (68.8%) | 403 (31.2%) |
| Firefighting & Prevention | 396 (61.0%) | 253 (39.0%) |
| Law Enforcement | 491 (76.6%) | 150 (23.4%) |
| Food Preparation & Serving | 1,734 (39.0%) | 2,716 (61.0%) |
| Cleaning & Maintenance | 1,546 (62.4%) | 931 (37.6%) |
| Personal Care & Service | 379 (22.6%) | 1,295 (77.4%) |
| Total (Category) | 4,816 (37.7%) | 7,970 (62.3%) |
| Total (Overall) | 43,100 (52.3%) | 39,353 (47.7%) |
Sales and Office Occupations
The most common Sales and Office occupations in Rock County are Office & Administration (9,379 | 11.4%), and Sales & Related (6,554 | 8.0%).

Sales and Office Occupations by Sex
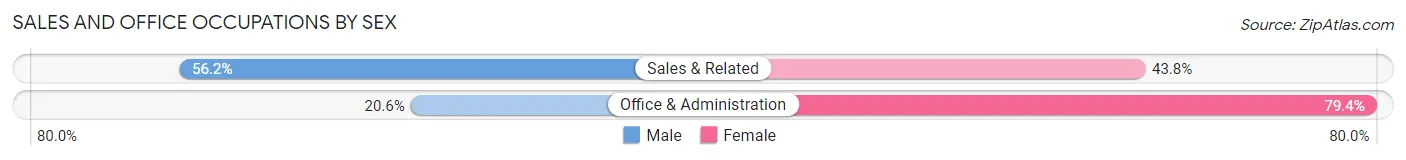
| Occupation | Male | Female |
| Sales & Related | 3,685 (56.2%) | 2,869 (43.8%) |
| Office & Administration | 1,934 (20.6%) | 7,445 (79.4%) |
| Total (Category) | 5,619 (35.3%) | 10,314 (64.7%) |
| Total (Overall) | 43,100 (52.3%) | 39,353 (47.7%) |
Natural Resources, Construction and Maintenance Occupations
The most common Natural Resources, Construction and Maintenance occupations in Rock County are Construction & Extraction (4,753 | 5.8%), Installation, Maintenance & Repair (3,660 | 4.4%), and Farming, Fishing & Forestry (296 | 0.4%).
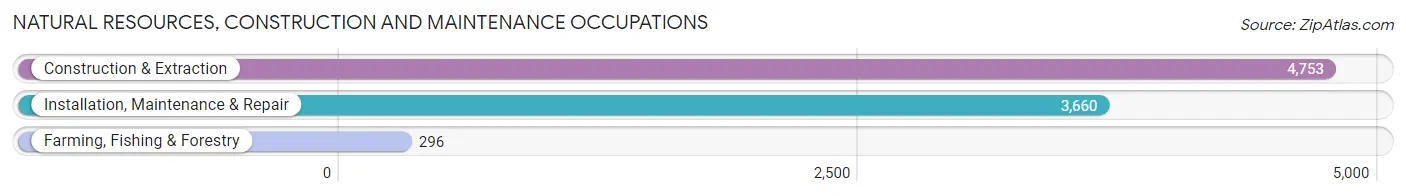
Natural Resources, Construction and Maintenance Occupations by Sex
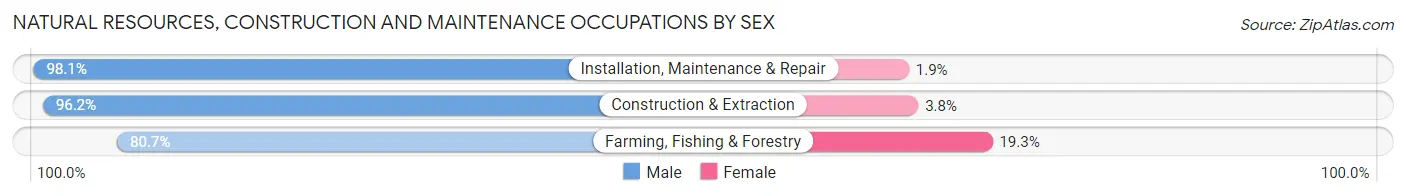
| Occupation | Male | Female |
| Farming, Fishing & Forestry | 239 (80.7%) | 57 (19.3%) |
| Construction & Extraction | 4,572 (96.2%) | 181 (3.8%) |
| Installation, Maintenance & Repair | 3,592 (98.1%) | 68 (1.9%) |
| Total (Category) | 8,403 (96.5%) | 306 (3.5%) |
| Total (Overall) | 43,100 (52.3%) | 39,353 (47.7%) |
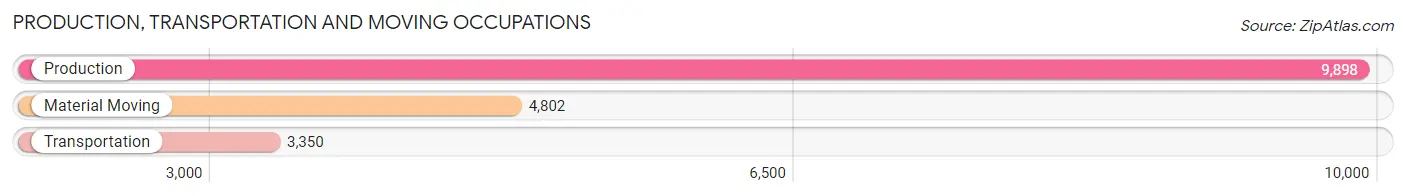
Production, Transportation and Moving Occupations
The most common Production, Transportation and Moving occupations in Rock County are Production (9,898 | 12.0%), Material Moving (4,802 | 5.8%), and Transportation (3,350 | 4.1%).
Production, Transportation and Moving Occupations by Sex
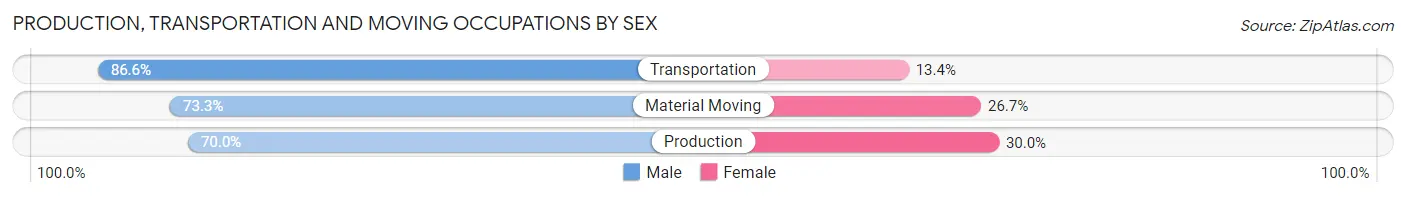
| Occupation | Male | Female |
| Production | 6,931 (70.0%) | 2,967 (30.0%) |
| Transportation | 2,900 (86.6%) | 450 (13.4%) |
| Material Moving | 3,520 (73.3%) | 1,282 (26.7%) |
| Total (Category) | 13,351 (74.0%) | 4,699 (26.0%) |
| Total (Overall) | 43,100 (52.3%) | 39,353 (47.7%) |
Employment Industries by Sex in Rock County
Employment Industries in Rock County
The major employment industries in Rock County include Manufacturing (17,359 | 21.0%), Health Care & Social Assistance (11,463 | 13.9%), Retail Trade (9,873 | 12.0%), Educational Services (6,471 | 7.9%), and Construction (5,775 | 7.0%).

Employment Industries by Sex in Rock County
The Rock County industries that see more men than women are Construction (91.8%), Utilities (84.5%), and Agriculture, Fishing & Hunting (78.9%), whereas the industries that tend to have a higher number of women are Health Care & Social Assistance (84.8%), Educational Services (74.2%), and Enterprise Management (64.6%).
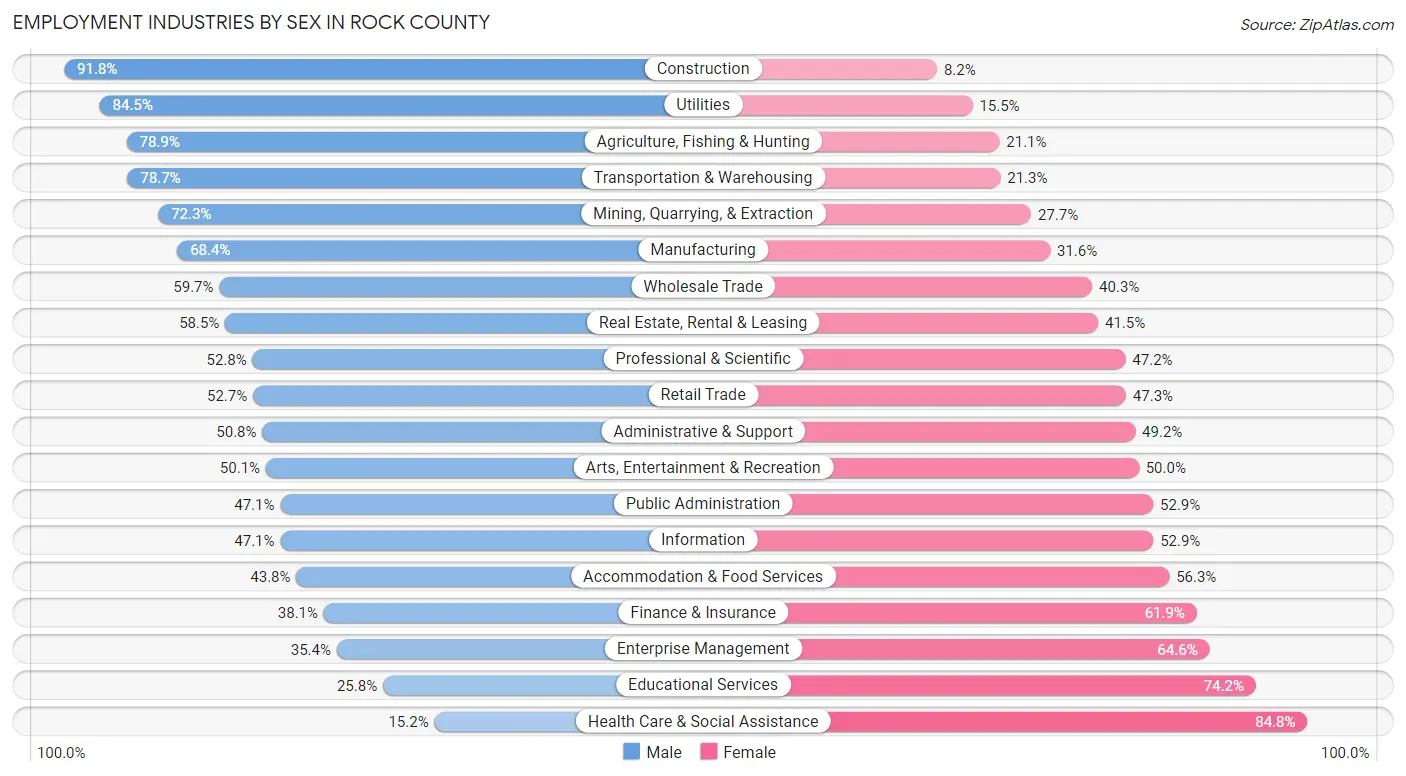
| Industry | Male | Female |
| Agriculture, Fishing & Hunting | 905 (78.9%) | 242 (21.1%) |
| Mining, Quarrying, & Extraction | 34 (72.3%) | 13 (27.7%) |
| Construction | 5,302 (91.8%) | 473 (8.2%) |
| Manufacturing | 11,875 (68.4%) | 5,484 (31.6%) |
| Wholesale Trade | 1,931 (59.7%) | 1,304 (40.3%) |
| Retail Trade | 5,204 (52.7%) | 4,669 (47.3%) |
| Transportation & Warehousing | 2,640 (78.7%) | 714 (21.3%) |
| Utilities | 745 (84.5%) | 137 (15.5%) |
| Information | 609 (47.1%) | 685 (52.9%) |
| Finance & Insurance | 859 (38.1%) | 1,398 (61.9%) |
| Real Estate, Rental & Leasing | 531 (58.5%) | 377 (41.5%) |
| Professional & Scientific | 1,492 (52.8%) | 1,333 (47.2%) |
| Enterprise Management | 69 (35.4%) | 126 (64.6%) |
| Administrative & Support | 1,261 (50.8%) | 1,222 (49.2%) |
| Educational Services | 1,671 (25.8%) | 4,800 (74.2%) |
| Health Care & Social Assistance | 1,738 (15.2%) | 9,725 (84.8%) |
| Arts, Entertainment & Recreation | 520 (50.0%) | 519 (49.9%) |
| Accommodation & Food Services | 2,429 (43.8%) | 3,123 (56.2%) |
| Public Administration | 1,274 (47.1%) | 1,432 (52.9%) |
| Total | 43,100 (52.3%) | 39,353 (47.7%) |
Education in Rock County
School Enrollment in Rock County
The most common levels of schooling among the 38,103 students in Rock County are high school (9,128 | 24.0%), middle school (8,235 | 21.6%), and elementary school (8,081 | 21.2%).
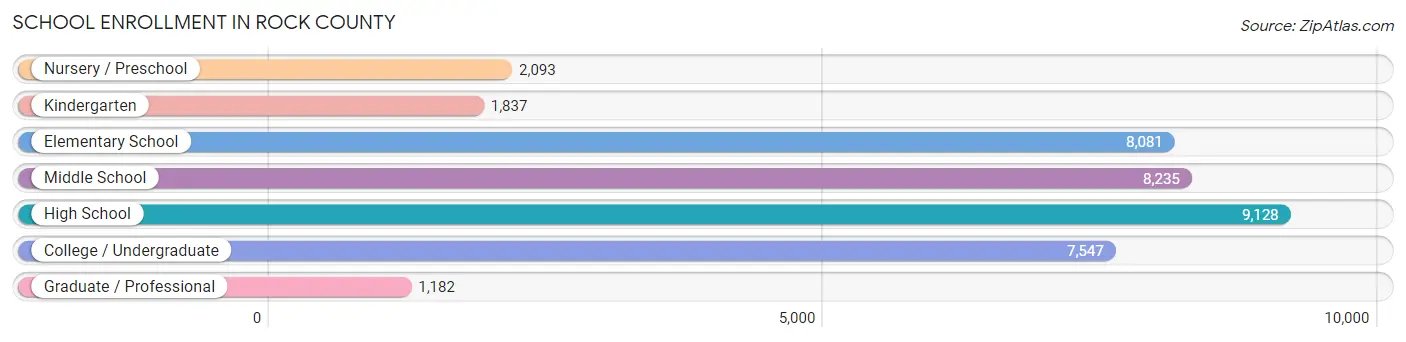
| School Level | # Students | % Students |
| Nursery / Preschool | 2,093 | 5.5% |
| Kindergarten | 1,837 | 4.8% |
| Elementary School | 8,081 | 21.2% |
| Middle School | 8,235 | 21.6% |
| High School | 9,128 | 24.0% |
| College / Undergraduate | 7,547 | 19.8% |
| Graduate / Professional | 1,182 | 3.1% |
| Total | 38,103 | 100.0% |
School Enrollment by Age by Funding Source in Rock County
Out of a total of 38,103 students who are enrolled in schools in Rock County, 4,725 (12.4%) attend a private institution, while the remaining 33,378 (87.6%) are enrolled in public schools. The age group of 20 to 24 year olds has the highest likelihood of being enrolled in private schools, with 983 (25.2% in the age bracket) enrolled. Conversely, the age group of 15 to 17 year olds has the lowest likelihood of being enrolled in a private school, with 6,224 (94.0% in the age bracket) attending a public institution.
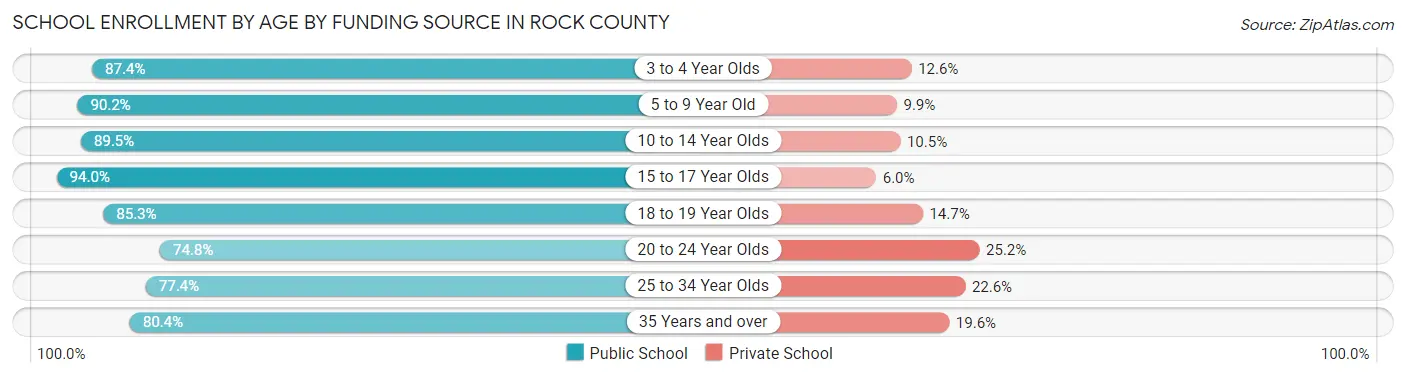
| Age Bracket | Public School | Private School |
| 3 to 4 Year Olds | 1,160 (87.4%) | 167 (12.6%) |
| 5 to 9 Year Old | 8,705 (90.1%) | 951 (9.9%) |
| 10 to 14 Year Olds | 9,331 (89.5%) | 1,094 (10.5%) |
| 15 to 17 Year Olds | 6,224 (94.0%) | 396 (6.0%) |
| 18 to 19 Year Olds | 2,429 (85.3%) | 418 (14.7%) |
| 20 to 24 Year Olds | 2,913 (74.8%) | 983 (25.2%) |
| 25 to 34 Year Olds | 1,422 (77.4%) | 415 (22.6%) |
| 35 Years and over | 1,202 (80.4%) | 293 (19.6%) |
| Total | 33,378 (87.6%) | 4,725 (12.4%) |
Educational Attainment by Field of Study in Rock County
Education (5,525 | 18.4%), business (5,094 | 17.0%), science & technology (3,380 | 11.3%), arts & humanities (2,419 | 8.1%), and bio, nature & agricultural (2,368 | 7.9%) are the most common fields of study among 29,973 individuals in Rock County who have obtained a bachelor's degree or higher.
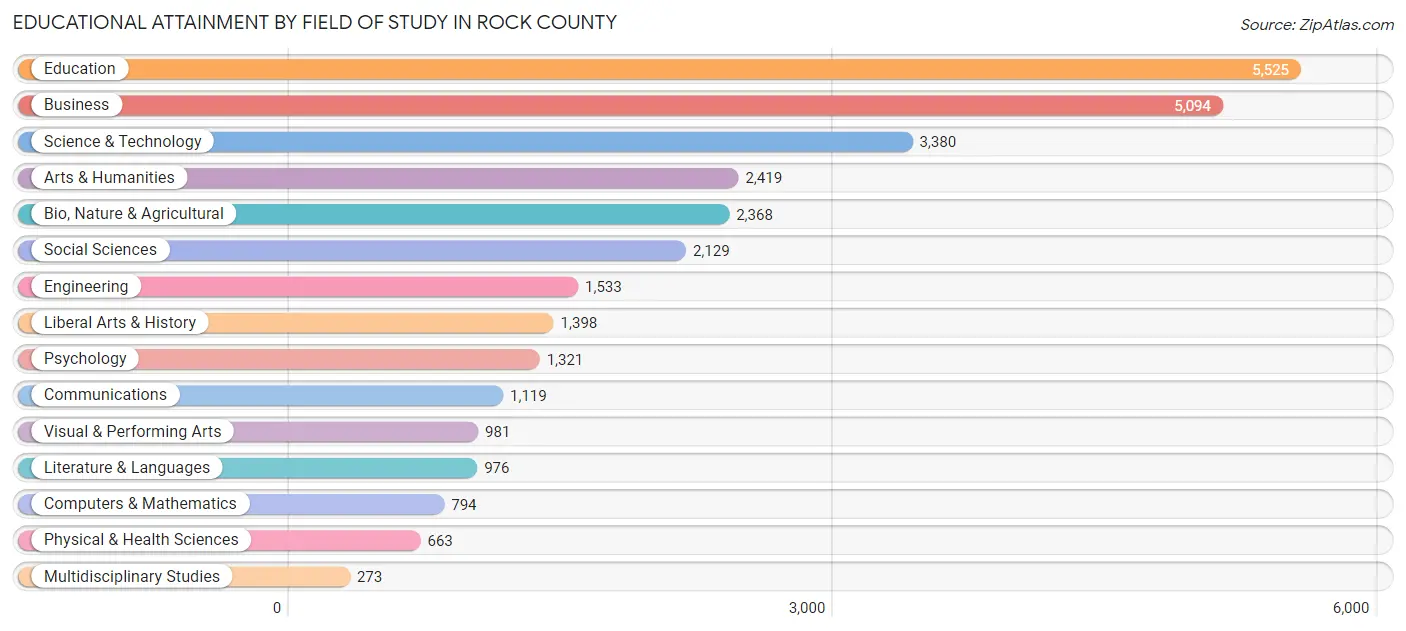
| Field of Study | # Graduates | % Graduates |
| Computers & Mathematics | 794 | 2.6% |
| Bio, Nature & Agricultural | 2,368 | 7.9% |
| Physical & Health Sciences | 663 | 2.2% |
| Psychology | 1,321 | 4.4% |
| Social Sciences | 2,129 | 7.1% |
| Engineering | 1,533 | 5.1% |
| Multidisciplinary Studies | 273 | 0.9% |
| Science & Technology | 3,380 | 11.3% |
| Business | 5,094 | 17.0% |
| Education | 5,525 | 18.4% |
| Literature & Languages | 976 | 3.3% |
| Liberal Arts & History | 1,398 | 4.7% |
| Visual & Performing Arts | 981 | 3.3% |
| Communications | 1,119 | 3.7% |
| Arts & Humanities | 2,419 | 8.1% |
| Total | 29,973 | 100.0% |
Transportation & Commute in Rock County
Vehicle Availability by Sex in Rock County
The most prevalent vehicle ownership categories in Rock County are males with 2 vehicles (18,682, accounting for 44.3%) and females with 2 vehicles (15,558, making up 48.9%).
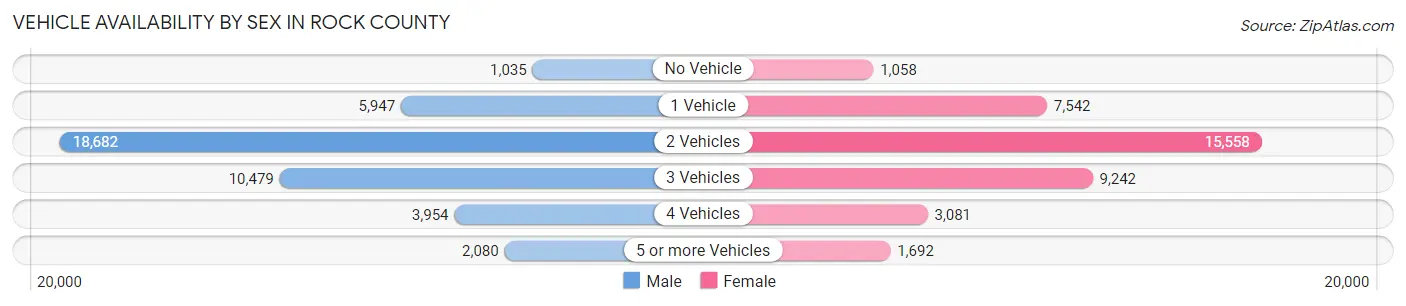
| Vehicles Available | Male | Female |
| No Vehicle | 1,035 (2.5%) | 1,058 (2.8%) |
| 1 Vehicle | 5,947 (14.1%) | 7,542 (19.8%) |
| 2 Vehicles | 18,682 (44.3%) | 15,558 (40.8%) |
| 3 Vehicles | 10,479 (24.8%) | 9,242 (24.2%) |
| 4 Vehicles | 3,954 (9.4%) | 3,081 (8.1%) |
| 5 or more Vehicles | 2,080 (4.9%) | 1,692 (4.4%) |
| Total | 42,177 (100.0%) | 38,173 (100.0%) |
Commute Time in Rock County
The most frequently occuring commute durations in Rock County are 10 to 14 minutes (13,295 commuters, 17.6%), 15 to 19 minutes (10,918 commuters, 14.5%), and 5 to 9 minutes (10,377 commuters, 13.7%).
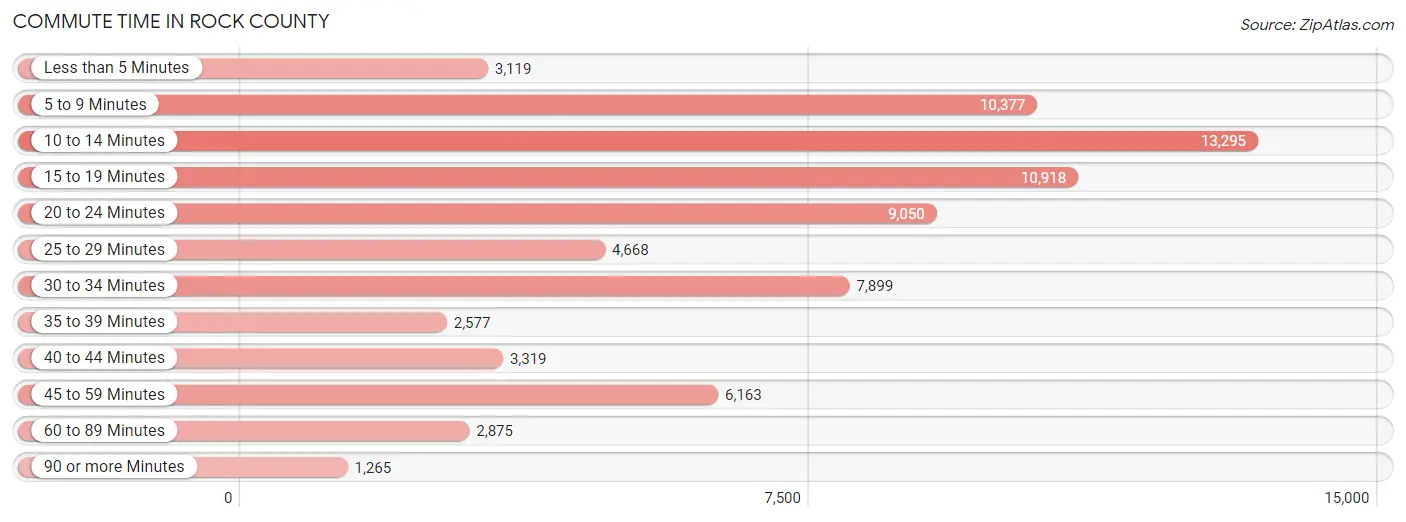
| Commute Time | # Commuters | % Commuters |
| Less than 5 Minutes | 3,119 | 4.1% |
| 5 to 9 Minutes | 10,377 | 13.7% |
| 10 to 14 Minutes | 13,295 | 17.6% |
| 15 to 19 Minutes | 10,918 | 14.5% |
| 20 to 24 Minutes | 9,050 | 12.0% |
| 25 to 29 Minutes | 4,668 | 6.2% |
| 30 to 34 Minutes | 7,899 | 10.5% |
| 35 to 39 Minutes | 2,577 | 3.4% |
| 40 to 44 Minutes | 3,319 | 4.4% |
| 45 to 59 Minutes | 6,163 | 8.2% |
| 60 to 89 Minutes | 2,875 | 3.8% |
| 90 or more Minutes | 1,265 | 1.7% |
Commute Time by Sex in Rock County
The most common commute times in Rock County are 10 to 14 minutes (6,276 commuters, 15.7%) for males and 10 to 14 minutes (7,019 commuters, 19.7%) for females.
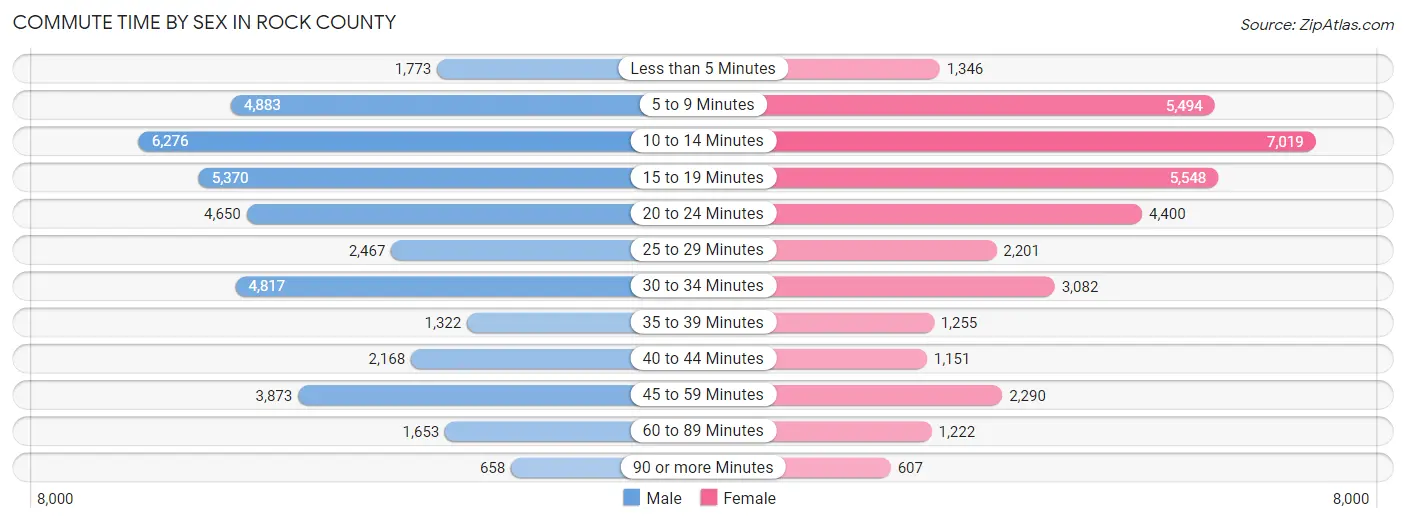
| Commute Time | Male | Female |
| Less than 5 Minutes | 1,773 (4.4%) | 1,346 (3.8%) |
| 5 to 9 Minutes | 4,883 (12.2%) | 5,494 (15.4%) |
| 10 to 14 Minutes | 6,276 (15.7%) | 7,019 (19.7%) |
| 15 to 19 Minutes | 5,370 (13.5%) | 5,548 (15.6%) |
| 20 to 24 Minutes | 4,650 (11.7%) | 4,400 (12.3%) |
| 25 to 29 Minutes | 2,467 (6.2%) | 2,201 (6.2%) |
| 30 to 34 Minutes | 4,817 (12.1%) | 3,082 (8.6%) |
| 35 to 39 Minutes | 1,322 (3.3%) | 1,255 (3.5%) |
| 40 to 44 Minutes | 2,168 (5.4%) | 1,151 (3.2%) |
| 45 to 59 Minutes | 3,873 (9.7%) | 2,290 (6.4%) |
| 60 to 89 Minutes | 1,653 (4.1%) | 1,222 (3.4%) |
| 90 or more Minutes | 658 (1.7%) | 607 (1.7%) |
Time of Departure to Work by Sex in Rock County
The most frequent times of departure to work in Rock County are 7:00 AM to 7:29 AM (4,674, 11.7%) for males and 7:30 AM to 7:59 AM (5,704, 16.0%) for females.
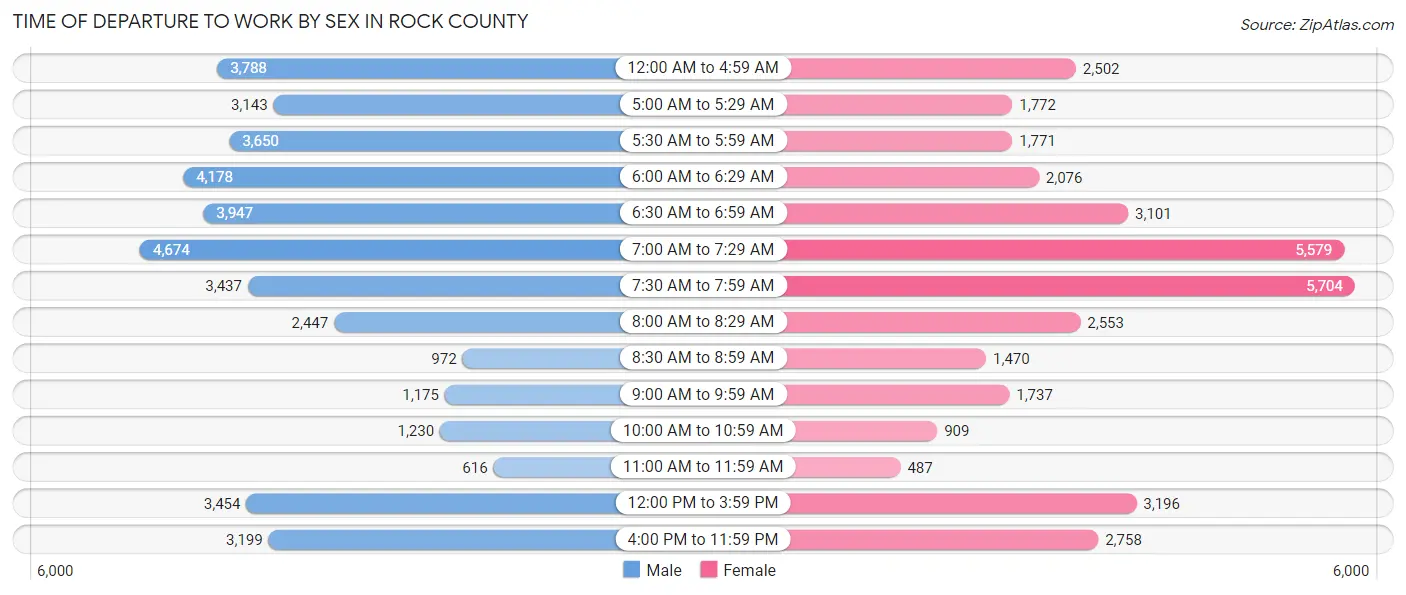
| Time of Departure | Male | Female |
| 12:00 AM to 4:59 AM | 3,788 (9.5%) | 2,502 (7.0%) |
| 5:00 AM to 5:29 AM | 3,143 (7.9%) | 1,772 (5.0%) |
| 5:30 AM to 5:59 AM | 3,650 (9.1%) | 1,771 (5.0%) |
| 6:00 AM to 6:29 AM | 4,178 (10.5%) | 2,076 (5.8%) |
| 6:30 AM to 6:59 AM | 3,947 (9.9%) | 3,101 (8.7%) |
| 7:00 AM to 7:29 AM | 4,674 (11.7%) | 5,579 (15.7%) |
| 7:30 AM to 7:59 AM | 3,437 (8.6%) | 5,704 (16.0%) |
| 8:00 AM to 8:29 AM | 2,447 (6.1%) | 2,553 (7.2%) |
| 8:30 AM to 8:59 AM | 972 (2.4%) | 1,470 (4.1%) |
| 9:00 AM to 9:59 AM | 1,175 (2.9%) | 1,737 (4.9%) |
| 10:00 AM to 10:59 AM | 1,230 (3.1%) | 909 (2.5%) |
| 11:00 AM to 11:59 AM | 616 (1.5%) | 487 (1.4%) |
| 12:00 PM to 3:59 PM | 3,454 (8.6%) | 3,196 (9.0%) |
| 4:00 PM to 11:59 PM | 3,199 (8.0%) | 2,758 (7.7%) |
| Total | 39,910 (100.0%) | 35,615 (100.0%) |
Housing Occupancy in Rock County
Occupancy by Ownership in Rock County
Of the total 66,439 dwellings in Rock County, owner-occupied units account for 46,462 (69.9%), while renter-occupied units make up 19,977 (30.1%).
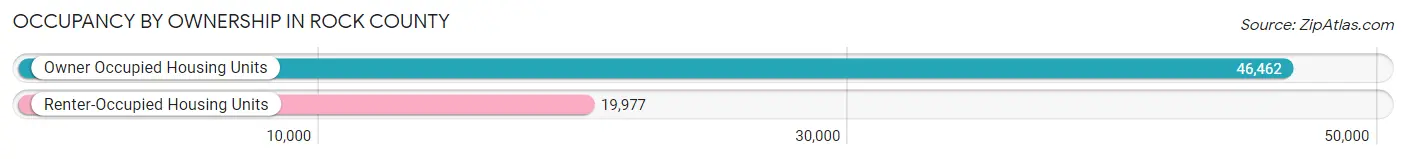
| Occupancy | # Housing Units | % Housing Units |
| Owner Occupied Housing Units | 46,462 | 69.9% |
| Renter-Occupied Housing Units | 19,977 | 30.1% |
| Total Occupied Housing Units | 66,439 | 100.0% |
Occupancy by Household Size in Rock County
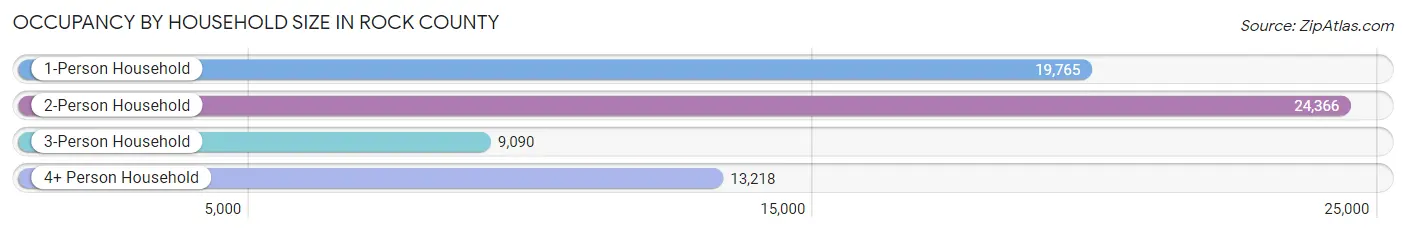
| Household Size | # Housing Units | % Housing Units |
| 1-Person Household | 19,765 | 29.7% |
| 2-Person Household | 24,366 | 36.7% |
| 3-Person Household | 9,090 | 13.7% |
| 4+ Person Household | 13,218 | 19.9% |
| Total Housing Units | 66,439 | 100.0% |
Occupancy by Ownership by Household Size in Rock County
| Household Size | Owner-occupied | Renter-occupied |
| 1-Person Household | 11,136 (56.3%) | 8,629 (43.7%) |
| 2-Person Household | 18,874 (77.5%) | 5,492 (22.5%) |
| 3-Person Household | 6,569 (72.3%) | 2,521 (27.7%) |
| 4+ Person Household | 9,883 (74.8%) | 3,335 (25.2%) |
| Total Housing Units | 46,462 (69.9%) | 19,977 (30.1%) |
Occupancy by Educational Attainment in Rock County
| Household Size | Owner-occupied | Renter-occupied |
| Less than High School | 2,123 (47.2%) | 2,371 (52.8%) |
| High School Diploma | 14,010 (66.2%) | 7,152 (33.8%) |
| College/Associate Degree | 16,126 (68.6%) | 7,374 (31.4%) |
| Bachelor's Degree or higher | 14,203 (82.2%) | 3,080 (17.8%) |
Occupancy by Age of Householder in Rock County
| Age Bracket | # Households | % Households |
| Under 35 Years | 12,007 | 18.1% |
| 35 to 44 Years | 10,581 | 15.9% |
| 45 to 54 Years | 11,726 | 17.6% |
| 55 to 64 Years | 13,836 | 20.8% |
| 65 to 74 Years | 10,519 | 15.8% |
| 75 to 84 Years | 5,458 | 8.2% |
| 85 Years and Over | 2,312 | 3.5% |
| Total | 66,439 | 100.0% |
Housing Finances in Rock County
Median Income by Occupancy in Rock County
| Occupancy Type | # Households | Median Income |
| Owner-Occupied | 46,462 (69.9%) | $83,355 |
| Renter-Occupied | 19,977 (30.1%) | $45,816 |
| Average | 66,439 (100.0%) | $70,630 |
Occupancy by Householder Income Bracket in Rock County
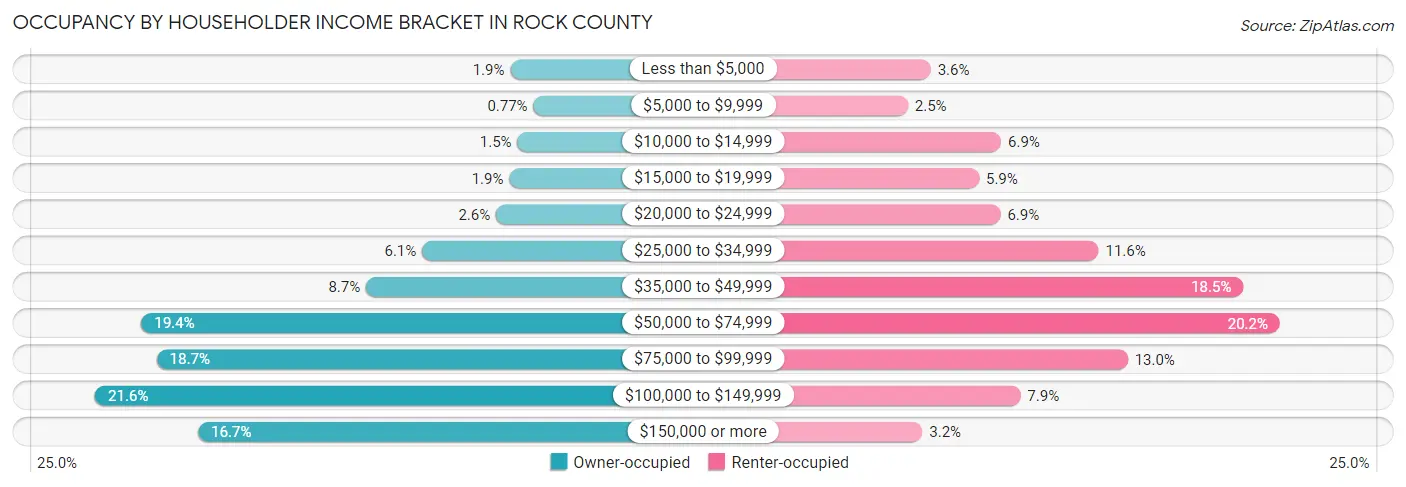
| Income Bracket | Owner-occupied | Renter-occupied |
| Less than $5,000 | 870 (1.9%) | 715 (3.6%) |
| $5,000 to $9,999 | 360 (0.8%) | 498 (2.5%) |
| $10,000 to $14,999 | 710 (1.5%) | 1,384 (6.9%) |
| $15,000 to $19,999 | 893 (1.9%) | 1,174 (5.9%) |
| $20,000 to $24,999 | 1,187 (2.5%) | 1,378 (6.9%) |
| $25,000 to $34,999 | 2,819 (6.1%) | 2,311 (11.6%) |
| $35,000 to $49,999 | 4,062 (8.7%) | 3,688 (18.5%) |
| $50,000 to $74,999 | 9,033 (19.4%) | 4,035 (20.2%) |
| $75,000 to $99,999 | 8,695 (18.7%) | 2,589 (13.0%) |
| $100,000 to $149,999 | 10,055 (21.6%) | 1,569 (7.9%) |
| $150,000 or more | 7,778 (16.7%) | 636 (3.2%) |
| Total | 46,462 (100.0%) | 19,977 (100.0%) |
Monthly Housing Cost Tiers in Rock County
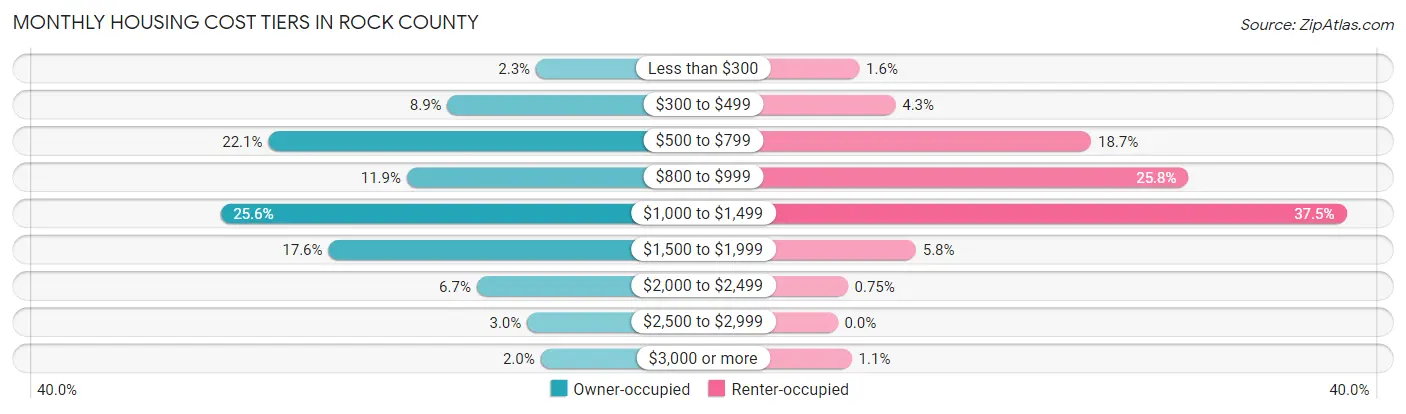
| Monthly Cost | Owner-occupied | Renter-occupied |
| Less than $300 | 1,087 (2.3%) | 320 (1.6%) |
| $300 to $499 | 4,116 (8.9%) | 852 (4.3%) |
| $500 to $799 | 10,244 (22.1%) | 3,732 (18.7%) |
| $800 to $999 | 5,506 (11.8%) | 5,163 (25.8%) |
| $1,000 to $1,499 | 11,889 (25.6%) | 7,486 (37.5%) |
| $1,500 to $1,999 | 8,193 (17.6%) | 1,152 (5.8%) |
| $2,000 to $2,499 | 3,112 (6.7%) | 150 (0.7%) |
| $2,500 to $2,999 | 1,388 (3.0%) | 0 (0.0%) |
| $3,000 or more | 927 (2.0%) | 210 (1.1%) |
| Total | 46,462 (100.0%) | 19,977 (100.0%) |
Physical Housing Characteristics in Rock County
Housing Structures in Rock County
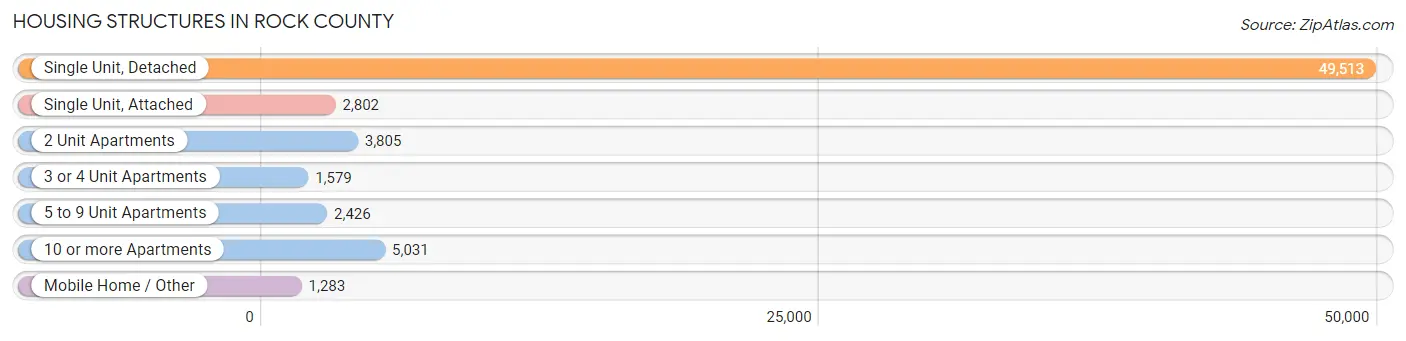
| Structure Type | # Housing Units | % Housing Units |
| Single Unit, Detached | 49,513 | 74.5% |
| Single Unit, Attached | 2,802 | 4.2% |
| 2 Unit Apartments | 3,805 | 5.7% |
| 3 or 4 Unit Apartments | 1,579 | 2.4% |
| 5 to 9 Unit Apartments | 2,426 | 3.6% |
| 10 or more Apartments | 5,031 | 7.6% |
| Mobile Home / Other | 1,283 | 1.9% |
| Total | 66,439 | 100.0% |
Housing Structures by Occupancy in Rock County
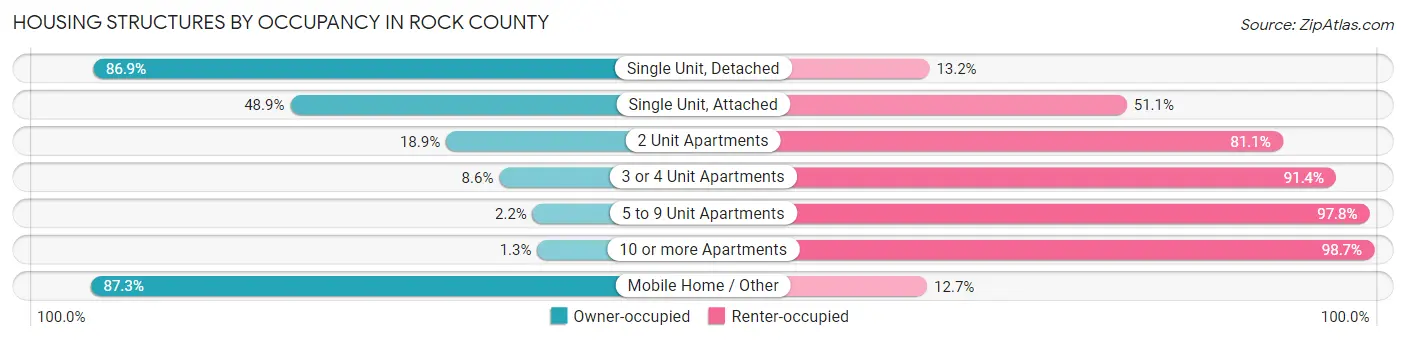
| Structure Type | Owner-occupied | Renter-occupied |
| Single Unit, Detached | 43,001 (86.9%) | 6,512 (13.2%) |
| Single Unit, Attached | 1,369 (48.9%) | 1,433 (51.1%) |
| 2 Unit Apartments | 718 (18.9%) | 3,087 (81.1%) |
| 3 or 4 Unit Apartments | 136 (8.6%) | 1,443 (91.4%) |
| 5 to 9 Unit Apartments | 53 (2.2%) | 2,373 (97.8%) |
| 10 or more Apartments | 65 (1.3%) | 4,966 (98.7%) |
| Mobile Home / Other | 1,120 (87.3%) | 163 (12.7%) |
| Total | 46,462 (69.9%) | 19,977 (30.1%) |
Housing Structures by Number of Rooms in Rock County

| Number of Rooms | Owner-occupied | Renter-occupied |
| 1 Room | 36 (0.1%) | 837 (4.2%) |
| 2 or 3 Rooms | 788 (1.7%) | 4,114 (20.6%) |
| 4 or 5 Rooms | 12,507 (26.9%) | 9,401 (47.1%) |
| 6 or 7 Rooms | 18,967 (40.8%) | 3,899 (19.5%) |
| 8 or more Rooms | 14,164 (30.5%) | 1,726 (8.6%) |
| Total | 46,462 (100.0%) | 19,977 (100.0%) |
Housing Structure by Heating Type in Rock County
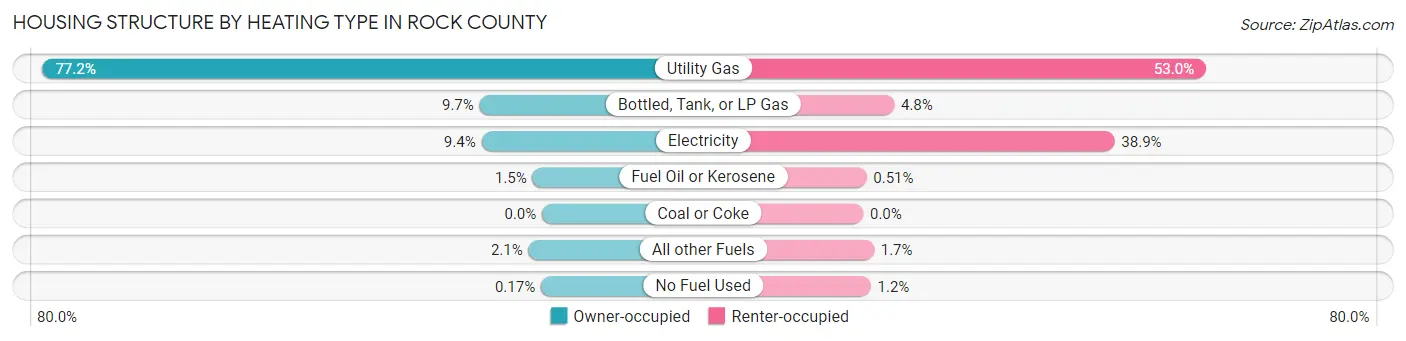
| Heating Type | Owner-occupied | Renter-occupied |
| Utility Gas | 35,883 (77.2%) | 10,590 (53.0%) |
| Bottled, Tank, or LP Gas | 4,487 (9.7%) | 956 (4.8%) |
| Electricity | 4,353 (9.4%) | 7,764 (38.9%) |
| Fuel Oil or Kerosene | 685 (1.5%) | 102 (0.5%) |
| Coal or Coke | 2 (0.0%) | 0 (0.0%) |
| All other Fuels | 974 (2.1%) | 332 (1.7%) |
| No Fuel Used | 78 (0.2%) | 233 (1.2%) |
| Total | 46,462 (100.0%) | 19,977 (100.0%) |
Household Vehicle Usage in Rock County

| Vehicles per Household | Owner-occupied | Renter-occupied |
| No Vehicle | 959 (2.1%) | 2,709 (13.6%) |
| 1 Vehicle | 10,769 (23.2%) | 9,635 (48.2%) |
| 2 Vehicles | 20,495 (44.1%) | 6,090 (30.5%) |
| 3 or more Vehicles | 14,239 (30.6%) | 1,543 (7.7%) |
| Total | 46,462 (100.0%) | 19,977 (100.0%) |
Real Estate & Mortgages in Rock County
Real Estate and Mortgage Overview in Rock County
| Characteristic | Without Mortgage | With Mortgage |
| Housing Units | 17,192 | 29,270 |
| Median Property Value | $183,800 | $197,300 |
| Median Household Income | $64,805 | $5,403 |
| Monthly Housing Costs | $594 | $912 |
| Real Estate Taxes | $3,415 | $249 |
Property Value by Mortgage Status in Rock County
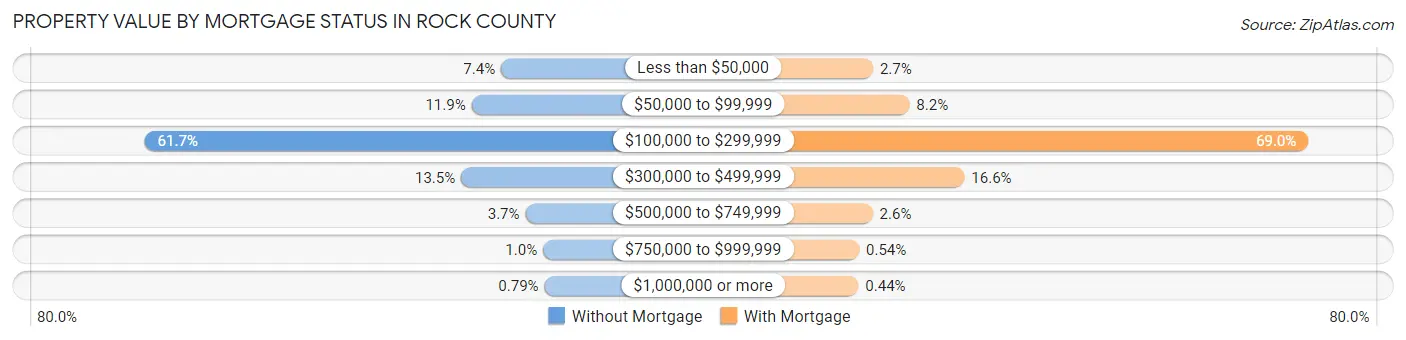
| Property Value | Without Mortgage | With Mortgage |
| Less than $50,000 | 1,274 (7.4%) | 775 (2.6%) |
| $50,000 to $99,999 | 2,046 (11.9%) | 2,403 (8.2%) |
| $100,000 to $299,999 | 10,608 (61.7%) | 20,187 (69.0%) |
| $300,000 to $499,999 | 2,319 (13.5%) | 4,855 (16.6%) |
| $500,000 to $749,999 | 635 (3.7%) | 764 (2.6%) |
| $750,000 to $999,999 | 174 (1.0%) | 158 (0.5%) |
| $1,000,000 or more | 136 (0.8%) | 128 (0.4%) |
| Total | 17,192 (100.0%) | 29,270 (100.0%) |
Household Income by Mortgage Status in Rock County
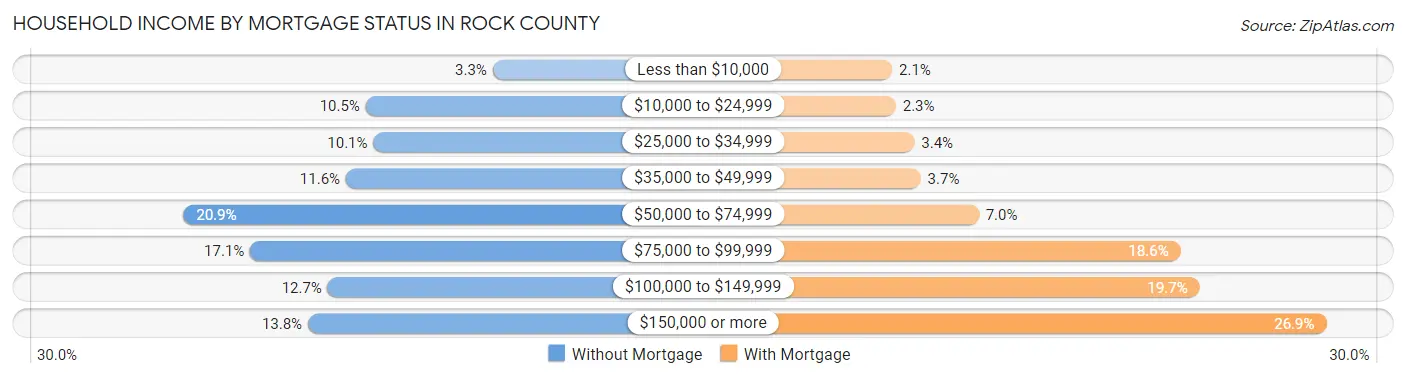
| Household Income | Without Mortgage | With Mortgage |
| Less than $10,000 | 558 (3.3%) | 611 (2.1%) |
| $10,000 to $24,999 | 1,807 (10.5%) | 672 (2.3%) |
| $25,000 to $34,999 | 1,731 (10.1%) | 983 (3.4%) |
| $35,000 to $49,999 | 2,001 (11.6%) | 1,088 (3.7%) |
| $50,000 to $74,999 | 3,599 (20.9%) | 2,061 (7.0%) |
| $75,000 to $99,999 | 2,941 (17.1%) | 5,434 (18.6%) |
| $100,000 to $149,999 | 2,180 (12.7%) | 5,754 (19.7%) |
| $150,000 or more | 2,375 (13.8%) | 7,875 (26.9%) |
| Total | 17,192 (100.0%) | 29,270 (100.0%) |
Property Value to Household Income Ratio in Rock County
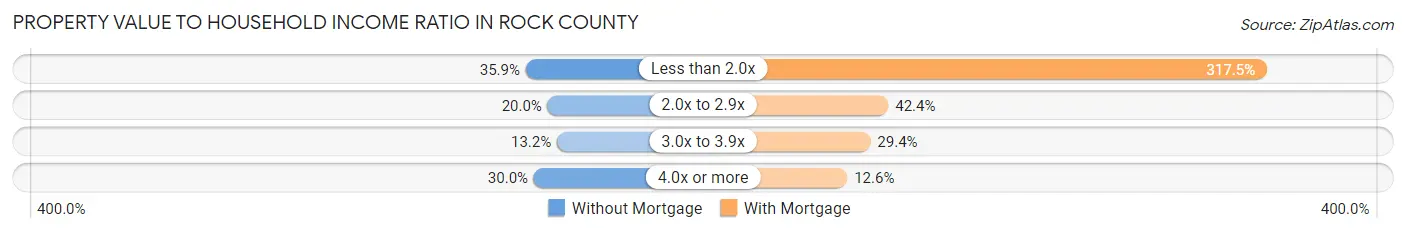
| Value-to-Income Ratio | Without Mortgage | With Mortgage |
| Less than 2.0x | 6,173 (35.9%) | 92,942 (317.5%) |
| 2.0x to 2.9x | 3,438 (20.0%) | 12,414 (42.4%) |
| 3.0x to 3.9x | 2,274 (13.2%) | 8,605 (29.4%) |
| 4.0x or more | 5,157 (30.0%) | 3,678 (12.6%) |
| Total | 17,192 (100.0%) | 29,270 (100.0%) |
Real Estate Taxes by Mortgage Status in Rock County

| Property Taxes | Without Mortgage | With Mortgage |
| Less than $800 | 551 (3.2%) | 231 (0.8%) |
| $800 to $1,499 | 1,187 (6.9%) | 359 (1.2%) |
| $800 to $1,499 | 14,711 (85.6%) | 1,414 (4.8%) |
| Total | 17,192 (100.0%) | 29,270 (100.0%) |
Health & Disability in Rock County
Health Insurance Coverage by Age in Rock County
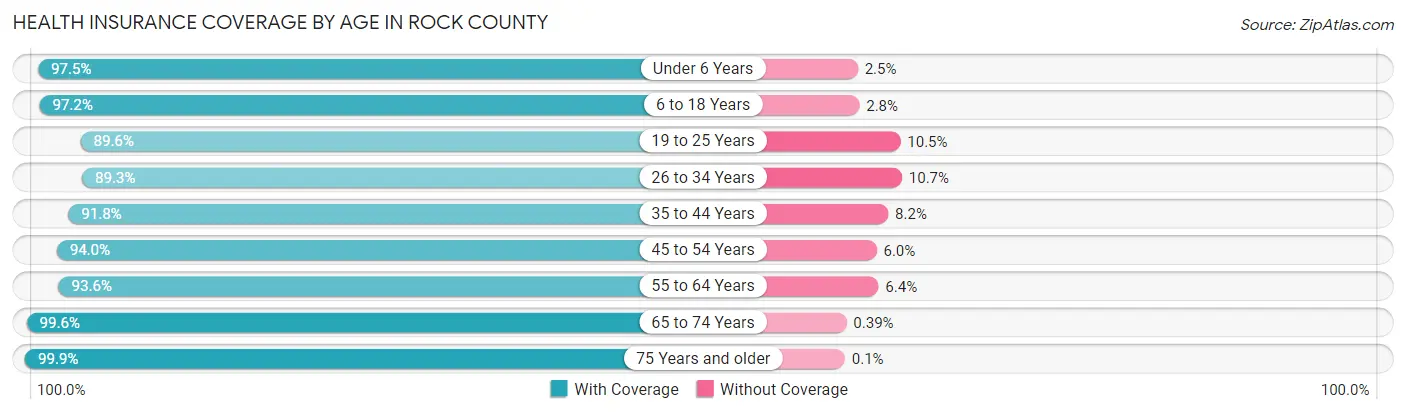
| Age Bracket | With Coverage | Without Coverage |
| Under 6 Years | 11,381 (97.5%) | 292 (2.5%) |
| 6 to 18 Years | 26,865 (97.2%) | 771 (2.8%) |
| 19 to 25 Years | 12,688 (89.5%) | 1,480 (10.4%) |
| 26 to 34 Years | 15,785 (89.3%) | 1,898 (10.7%) |
| 35 to 44 Years | 18,891 (91.8%) | 1,682 (8.2%) |
| 45 to 54 Years | 19,413 (94.0%) | 1,241 (6.0%) |
| 55 to 64 Years | 21,738 (93.6%) | 1,476 (6.4%) |
| 65 to 74 Years | 16,416 (99.6%) | 64 (0.4%) |
| 75 Years and older | 10,576 (99.9%) | 11 (0.1%) |
| Total | 153,753 (94.5%) | 8,915 (5.5%) |
Health Insurance Coverage by Citizenship Status in Rock County

| Citizenship Status | With Coverage | Without Coverage |
| Native Born | 11,381 (97.5%) | 292 (2.5%) |
| Foreign Born, Citizen | 26,865 (97.2%) | 771 (2.8%) |
| Foreign Born, not a Citizen | 12,688 (89.5%) | 1,480 (10.4%) |
Health Insurance Coverage by Household Income in Rock County
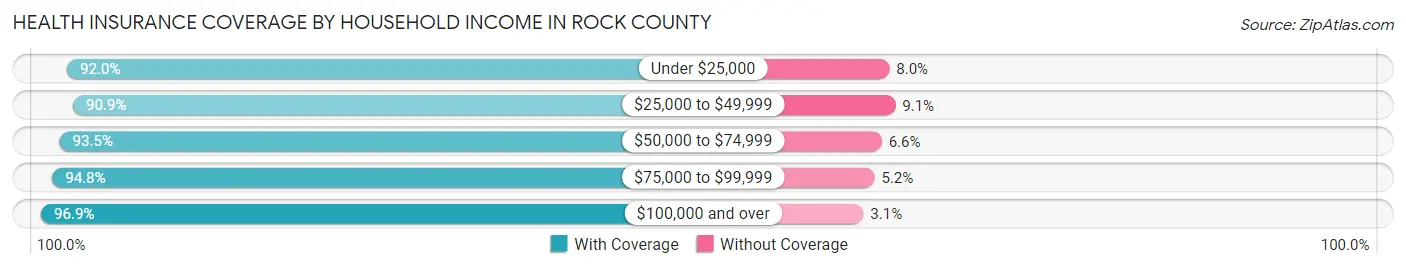
| Household Income | With Coverage | Without Coverage |
| Under $25,000 | 13,411 (92.0%) | 1,162 (8.0%) |
| $25,000 to $49,999 | 22,144 (90.9%) | 2,216 (9.1%) |
| $50,000 to $74,999 | 27,345 (93.4%) | 1,918 (6.6%) |
| $75,000 to $99,999 | 27,487 (94.8%) | 1,508 (5.2%) |
| $100,000 and over | 61,676 (96.9%) | 1,981 (3.1%) |
Public vs Private Health Insurance Coverage by Age in Rock County
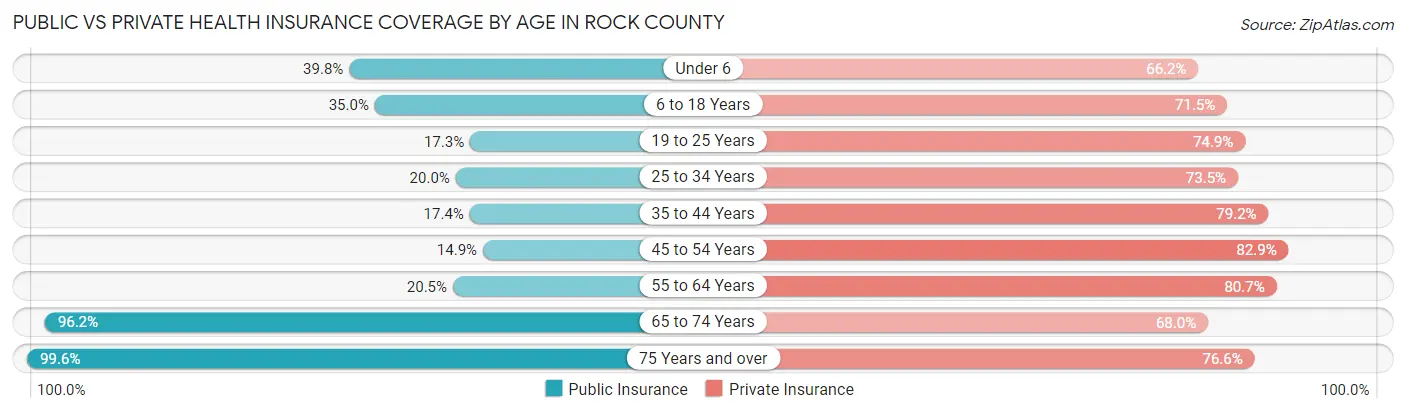
| Age Bracket | Public Insurance | Private Insurance |
| Under 6 | 4,641 (39.8%) | 7,723 (66.2%) |
| 6 to 18 Years | 9,676 (35.0%) | 19,764 (71.5%) |
| 19 to 25 Years | 2,456 (17.3%) | 10,608 (74.9%) |
| 25 to 34 Years | 3,534 (20.0%) | 13,000 (73.5%) |
| 35 to 44 Years | 3,577 (17.4%) | 16,289 (79.2%) |
| 45 to 54 Years | 3,084 (14.9%) | 17,127 (82.9%) |
| 55 to 64 Years | 4,762 (20.5%) | 18,730 (80.7%) |
| 65 to 74 Years | 15,859 (96.2%) | 11,200 (68.0%) |
| 75 Years and over | 10,539 (99.6%) | 8,110 (76.6%) |
| Total | 58,128 (35.7%) | 122,551 (75.3%) |
Disability Status by Sex by Age in Rock County
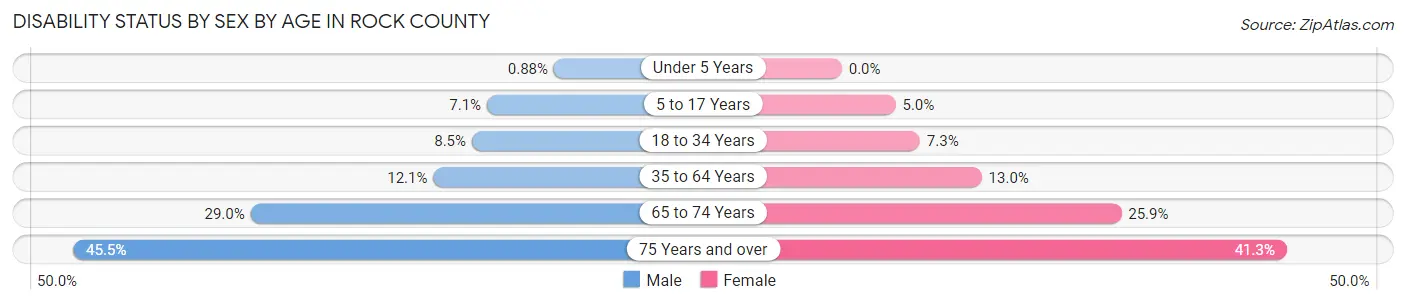
| Age Bracket | Male | Female |
| Under 5 Years | 44 (0.9%) | 0 (0.0%) |
| 5 to 17 Years | 1,010 (7.1%) | 668 (5.0%) |
| 18 to 34 Years | 1,468 (8.5%) | 1,213 (7.2%) |
| 35 to 64 Years | 3,906 (12.1%) | 4,163 (13.0%) |
| 65 to 74 Years | 2,259 (29.0%) | 2,256 (25.9%) |
| 75 Years and over | 2,004 (45.5%) | 2,553 (41.3%) |
Disability Class by Sex by Age in Rock County
Disability Class: Hearing Difficulty
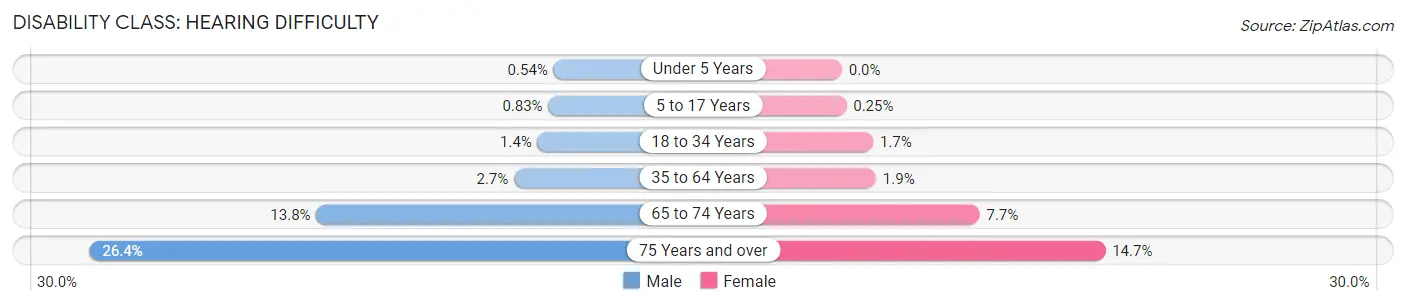
| Age Bracket | Male | Female |
| Under 5 Years | 27 (0.5%) | 0 (0.0%) |
| 5 to 17 Years | 119 (0.8%) | 34 (0.3%) |
| 18 to 34 Years | 248 (1.4%) | 292 (1.7%) |
| 35 to 64 Years | 886 (2.7%) | 609 (1.9%) |
| 65 to 74 Years | 1,070 (13.8%) | 667 (7.7%) |
| 75 Years and over | 1,162 (26.4%) | 907 (14.7%) |
Disability Class: Vision Difficulty
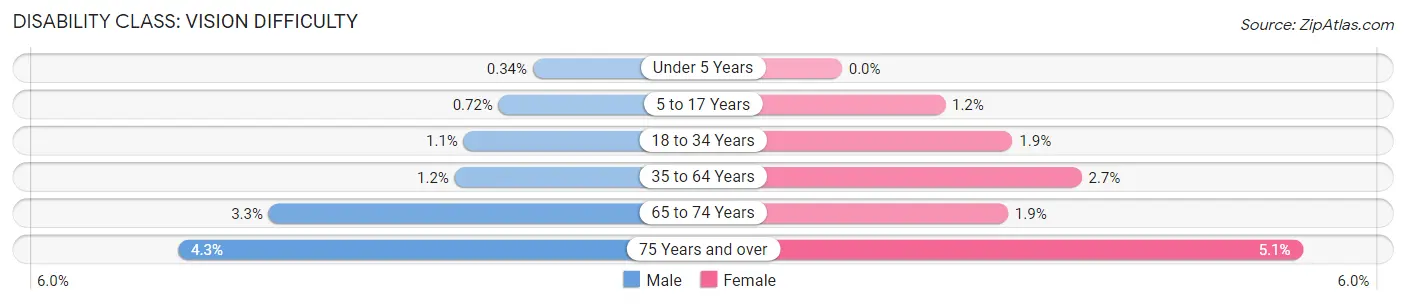
| Age Bracket | Male | Female |
| Under 5 Years | 17 (0.3%) | 0 (0.0%) |
| 5 to 17 Years | 103 (0.7%) | 154 (1.1%) |
| 18 to 34 Years | 192 (1.1%) | 318 (1.9%) |
| 35 to 64 Years | 393 (1.2%) | 856 (2.7%) |
| 65 to 74 Years | 255 (3.3%) | 161 (1.8%) |
| 75 Years and over | 189 (4.3%) | 317 (5.1%) |
Disability Class: Cognitive Difficulty
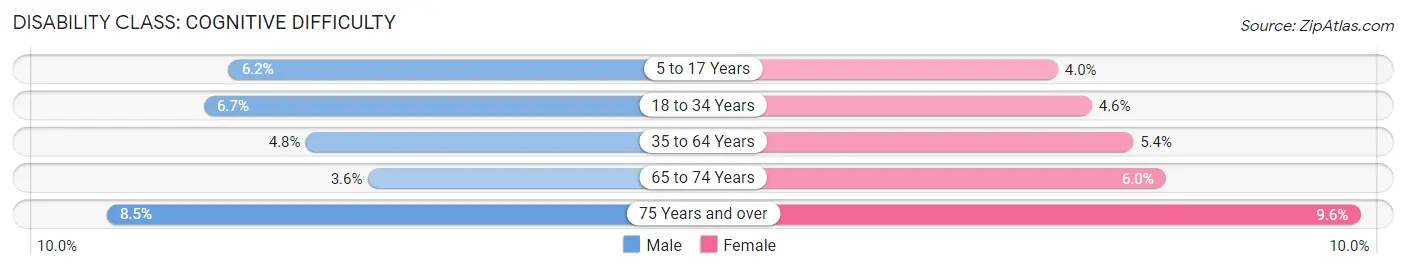
| Age Bracket | Male | Female |
| 5 to 17 Years | 885 (6.2%) | 537 (4.0%) |
| 18 to 34 Years | 1,153 (6.7%) | 776 (4.6%) |
| 35 to 64 Years | 1,543 (4.8%) | 1,737 (5.4%) |
| 65 to 74 Years | 282 (3.6%) | 523 (6.0%) |
| 75 Years and over | 373 (8.5%) | 595 (9.6%) |
Disability Class: Ambulatory Difficulty
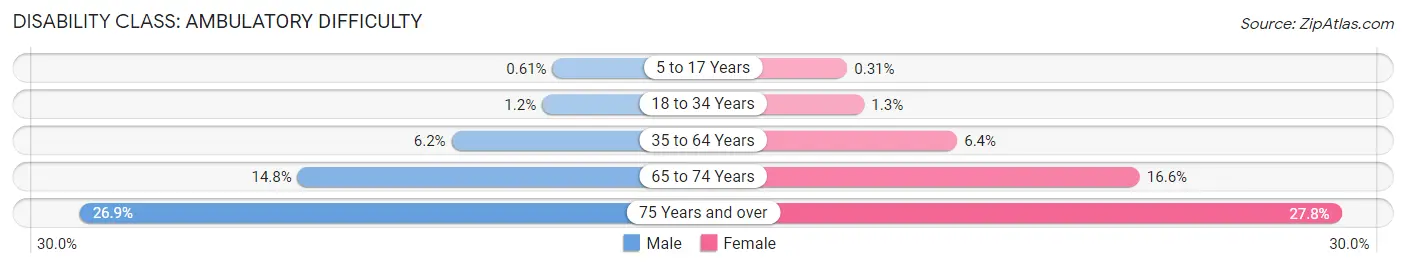
| Age Bracket | Male | Female |
| 5 to 17 Years | 87 (0.6%) | 41 (0.3%) |
| 18 to 34 Years | 205 (1.2%) | 211 (1.3%) |
| 35 to 64 Years | 2,017 (6.2%) | 2,062 (6.4%) |
| 65 to 74 Years | 1,152 (14.8%) | 1,444 (16.6%) |
| 75 Years and over | 1,186 (26.9%) | 1,720 (27.8%) |
Disability Class: Self-Care Difficulty
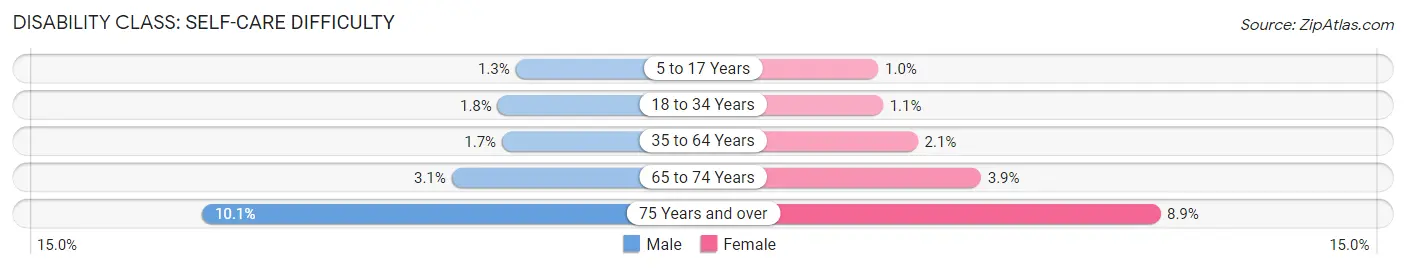
| Age Bracket | Male | Female |
| 5 to 17 Years | 189 (1.3%) | 135 (1.0%) |
| 18 to 34 Years | 316 (1.8%) | 190 (1.1%) |
| 35 to 64 Years | 553 (1.7%) | 676 (2.1%) |
| 65 to 74 Years | 242 (3.1%) | 337 (3.9%) |
| 75 Years and over | 443 (10.1%) | 548 (8.9%) |
Technology Access in Rock County
Computing Device Access in Rock County
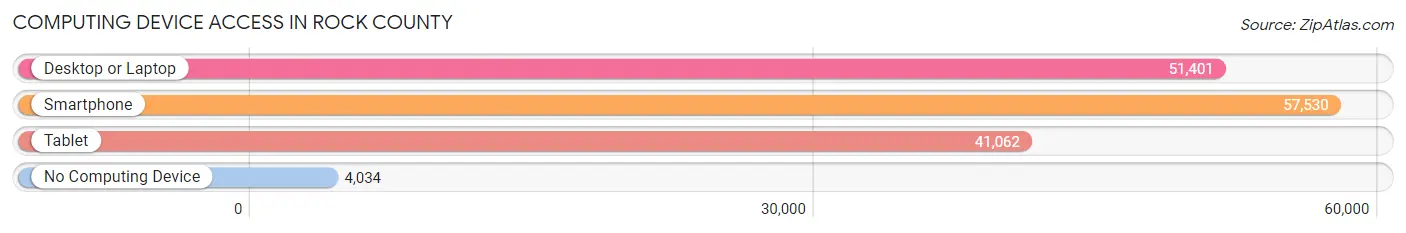
| Device Type | # Households | % Households |
| Desktop or Laptop | 51,401 | 77.4% |
| Smartphone | 57,530 | 86.6% |
| Tablet | 41,062 | 61.8% |
| No Computing Device | 4,034 | 6.1% |
| Total | 66,439 | 100.0% |
Internet Access in Rock County
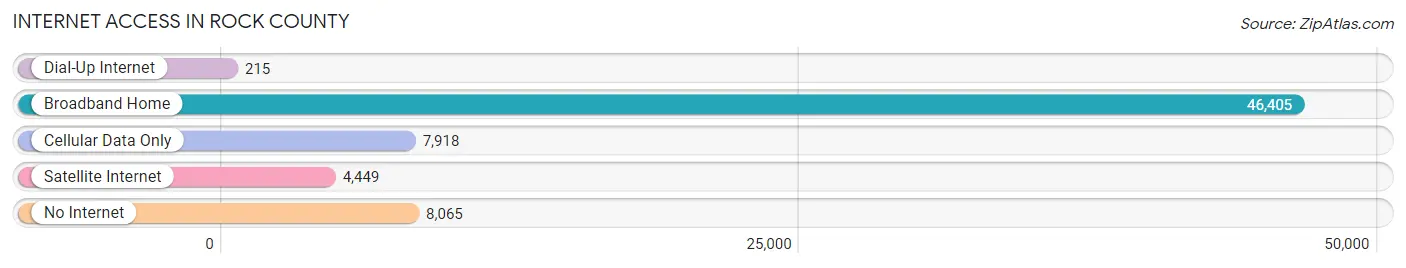
| Internet Type | # Households | % Households |
| Dial-Up Internet | 215 | 0.3% |
| Broadband Home | 46,405 | 69.9% |
| Cellular Data Only | 7,918 | 11.9% |
| Satellite Internet | 4,449 | 6.7% |
| No Internet | 8,065 | 12.1% |
| Total | 66,439 | 100.0% |
Rock County Summary
Rock County, Wisconsin is located in the south-central part of the state and is bordered by Green County to the north, Dane County to the east, Walworth County to the south, and Jefferson County to the west. The county seat is Janesville, and the county is part of the Madison Metropolitan Statistical Area. As of the 2010 census, the population of Rock County was 160,331, making it the third most populous county in Wisconsin.
Geography
Rock County is located in the south-central part of Wisconsin and covers an area of 745 square miles. The county is mostly flat, with some rolling hills in the northern and western parts. The highest point in the county is located in the town of Avon, at an elevation of 1,092 feet. The county is drained by the Rock River, which flows through the county from north to south. Other major waterways in the county include the Crawfish River, Turtle Creek, and the Sugar River.
The county is mostly rural, with the majority of the population living in the cities of Janesville and Beloit. Other smaller towns in the county include Clinton, Edgerton, Evansville, Footville, Milton, Orfordville, and Stoughton.
Economy
Rock County has a diverse economy, with a mix of manufacturing, agriculture, and service industries. The county is home to several major employers, including the General Motors plant in Janesville, the Beloit Corporation, and the Regal Beloit Corporation. Other major employers in the county include the University of Wisconsin-Whitewater, Mercyhealth, and the Rock County Sheriff's Office.
Agriculture is also an important part of the county's economy. The county is home to several large farms, including the Rock County Dairy Farm, the Rock County Beef Farm, and the Rock County Pork Farm.
Demographics
As of the 2010 census, the population of Rock County was 160,331, making it the third most populous county in Wisconsin. The population was spread out, with 79.3% of the population over the age of 18 and 20.7% under the age of 18. The median age was 38.7 years.
The racial makeup of the county was 87.2% White, 8.2% African American, 0.7% Native American, 1.3% Asian, 0.2% Pacific Islander, 1.2% from other races, and 1.4% from two or more races. Hispanic or Latino of any race were 3.7% of the population.
The median household income in Rock County was $51,945, and the median family income was $63,945. The per capita income was $25,945. About 8.2% of the population was below the poverty line.
Common Questions
What is the Total Population of Rock County?
Total Population of Rock County is 163,817.
What is the Total Male Population of Rock County?
Total Male Population of Rock County is 81,542.
What is the Total Female Population of Rock County?
Total Female Population of Rock County is 82,275.
What is the Ratio of Males per 100 Females in Rock County?
There are 99.11 Males per 100 Females in Rock County.
What is the Ratio of Females per 100 Males in Rock County?
There are 100.90 Females per 100 Males in Rock County.
What is the Median Population Age in Rock County?
Median Population Age in Rock County is 40.0 Years.
What is the Average Family Size in Rock County
Average Family Size in Rock County is 3.0 People.
What is the Average Household Size in Rock County
Average Household Size in Rock County is 2.4 People.
What is Per Capita Income in Rock County?
Per Capita income in Rock County is $35,594.
What is the Median Family Income in Rock County?
Median Family Income in Rock County is $84,424.
What is the Median Household income in Rock County?
Median Household Income in Rock County is $70,630.
What is Income or Wage Gap in Rock County?
Income or Wage Gap in Rock County is 28.8%.
Women in Rock County earn 71.2 cents for every dollar earned by a man.
What is Family Income Deficit in Rock County?
Family Income Deficit in Rock County is $10,998.
Families that are below poverty line in Rock County earn $10,998 less on average than the poverty threshold level.
What is Inequality or Gini Index in Rock County?
Inequality or Gini Index in Rock County is 0.40.
How Large is the Labor Force in Rock County?
There are 85,875 People in the Labor Forcein in Rock County.
What is the Percentage of People in the Labor Force in Rock County?
65.4% of People are in the Labor Force in Rock County.
What is the Unemployment Rate in Rock County?
Unemployment Rate in Rock County is 3.9%.