Racine County, WI
Racine County Map
Racine County Overview
197,068
TOTAL POPULATION
97,957
MALE POPULATION
99,111
FEMALE POPULATION
98.84
MALES / 100 FEMALES
101.18
FEMALES / 100 MALES
40.2
MEDIAN AGE
3.0
AVG FAMILY SIZE
2.4
AVG HOUSEHOLD SIZE
$38,288
PER CAPITA INCOME
$90,539
AVG FAMILY INCOME
$72,658
AVG HOUSEHOLD INCOME
29.0%
WAGE / INCOME GAP [ % ]
71.0¢/ $1
WAGE / INCOME GAP [ $ ]
$11,671
FAMILY INCOME DEFICIT
0.43
INEQUALITY / GINI INDEX
100,785
LABOR FORCE [ PEOPLE ]
64.0%
PERCENT IN LABOR FORCE
4.4%
UNEMPLOYMENT RATE
Racine County Area Codes
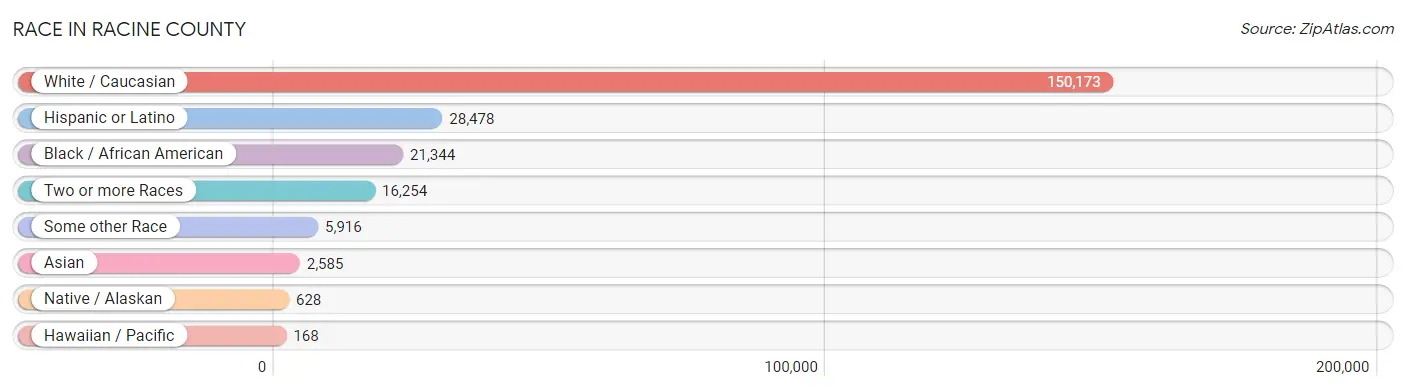
Race in Racine County
The most populous races in Racine County are White / Caucasian (150,173 | 76.2%), Hispanic or Latino (28,478 | 14.4%), and Black / African American (21,344 | 10.8%).
| Race | # Population | % Population |
| Asian | 2,585 | 1.3% |
| Black / African American | 21,344 | 10.8% |
| Hawaiian / Pacific | 168 | 0.1% |
| Hispanic or Latino | 28,478 | 14.4% |
| Native / Alaskan | 628 | 0.3% |
| White / Caucasian | 150,173 | 76.2% |
| Two or more Races | 16,254 | 8.3% |
| Some other Race | 5,916 | 3.0% |
| Total | 197,068 | 100.0% |
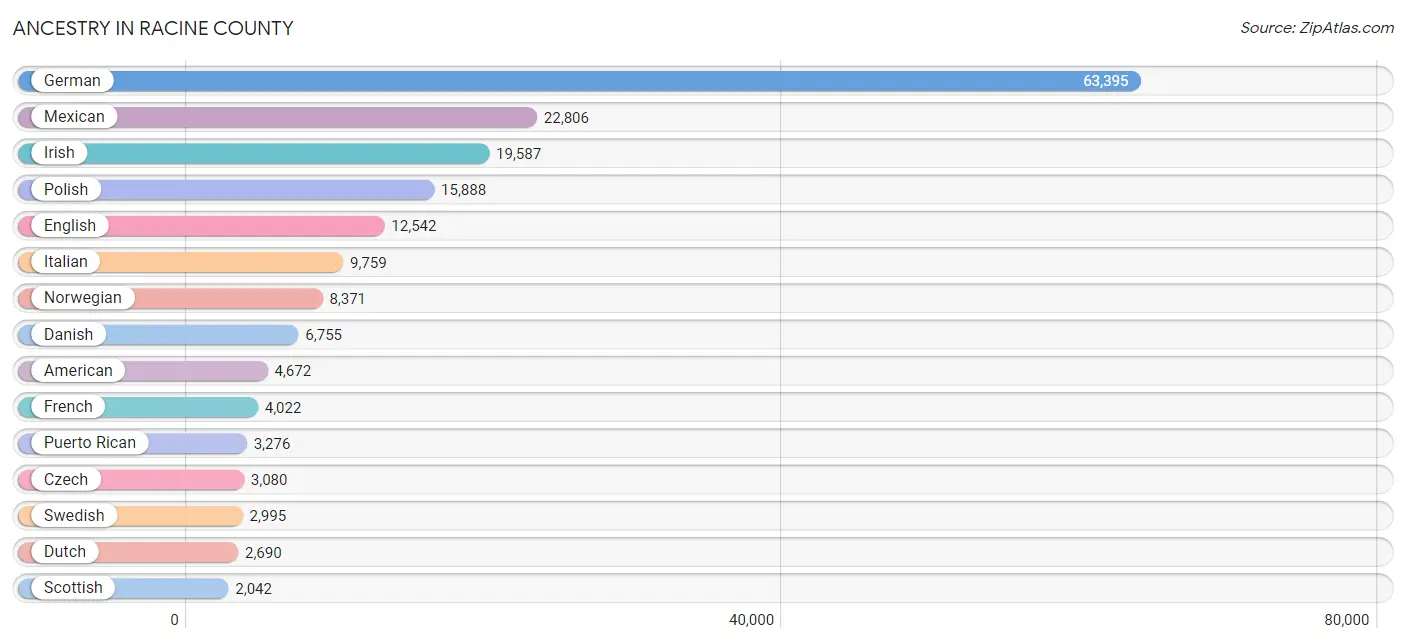
Ancestry in Racine County
The most populous ancestries reported in Racine County are German (63,395 | 32.2%), Mexican (22,806 | 11.6%), Irish (19,587 | 9.9%), Polish (15,888 | 8.1%), and English (12,542 | 6.4%), together accounting for 68.1% of all Racine County residents.
| Ancestry | # Population | % Population |
| African | 696 | 0.4% |
| Albanian | 204 | 0.1% |
| Alsatian | 16 | 0.0% |
| American | 4,672 | 2.4% |
| Apache | 47 | 0.0% |
| Arab | 724 | 0.4% |
| Argentinean | 345 | 0.2% |
| Armenian | 622 | 0.3% |
| Assyrian / Chaldean / Syriac | 12 | 0.0% |
| Australian | 173 | 0.1% |
| Austrian | 805 | 0.4% |
| Bangladeshi | 263 | 0.1% |
| Barbadian | 3 | 0.0% |
| Belgian | 485 | 0.3% |
| Bhutanese | 91 | 0.1% |
| Blackfeet | 91 | 0.1% |
| Bolivian | 3 | 0.0% |
| Brazilian | 94 | 0.1% |
| British | 555 | 0.3% |
| Bulgarian | 33 | 0.0% |
| Burmese | 331 | 0.2% |
| Canadian | 290 | 0.2% |
| Carpatho Rusyn | 7 | 0.0% |
| Celtic | 21 | 0.0% |
| Central American | 405 | 0.2% |
| Central American Indian | 83 | 0.0% |
| Cherokee | 301 | 0.2% |
| Chilean | 14 | 0.0% |
| Chippewa | 421 | 0.2% |
| Choctaw | 36 | 0.0% |
| Colombian | 56 | 0.0% |
| Croatian | 845 | 0.4% |
| Cuban | 309 | 0.2% |
| Czech | 3,080 | 1.6% |
| Czechoslovakian | 423 | 0.2% |
| Danish | 6,755 | 3.4% |
| Dominican | 73 | 0.0% |
| Dutch | 2,690 | 1.4% |
| Eastern European | 261 | 0.1% |
| Ecuadorian | 6 | 0.0% |
| Egyptian | 98 | 0.1% |
| English | 12,542 | 6.4% |
| Ethiopian | 67 | 0.0% |
| European | 2,022 | 1.0% |
| Filipino | 32 | 0.0% |
| Finnish | 795 | 0.4% |
| French | 4,022 | 2.0% |
| French American Indian | 84 | 0.0% |
| French Canadian | 1,342 | 0.7% |
| German | 63,395 | 32.2% |
| German Russian | 13 | 0.0% |
| Greek | 564 | 0.3% |
| Guamanian / Chamorro | 125 | 0.1% |
| Guatemalan | 247 | 0.1% |
| Haitian | 26 | 0.0% |
| Honduran | 42 | 0.0% |
| Hungarian | 1,279 | 0.6% |
| Icelander | 11 | 0.0% |
| Indian (Asian) | 499 | 0.3% |
| Inupiat | 56 | 0.0% |
| Iranian | 32 | 0.0% |
| Irish | 19,587 | 9.9% |
| Iroquois | 24 | 0.0% |
| Italian | 9,759 | 5.0% |
| Jamaican | 116 | 0.1% |
| Japanese | 18 | 0.0% |
| Korean | 732 | 0.4% |
| Laotian | 133 | 0.1% |
| Latvian | 34 | 0.0% |
| Lebanese | 266 | 0.1% |
| Lithuanian | 674 | 0.3% |
| Luxembourger | 68 | 0.0% |
| Macedonian | 38 | 0.0% |
| Malaysian | 202 | 0.1% |
| Menominee | 28 | 0.0% |
| Mexican | 22,806 | 11.6% |
| Mexican American Indian | 269 | 0.1% |
| Native Hawaiian | 111 | 0.1% |
| Navajo | 34 | 0.0% |
| Nicaraguan | 16 | 0.0% |
| Nigerian | 30 | 0.0% |
| Northern European | 198 | 0.1% |
| Norwegian | 8,371 | 4.3% |
| Okinawan | 15 | 0.0% |
| Ottawa | 4 | 0.0% |
| Pakistani | 75 | 0.0% |
| Palestinian | 25 | 0.0% |
| Panamanian | 24 | 0.0% |
| Paraguayan | 14 | 0.0% |
| Pennsylvania German | 21 | 0.0% |
| Peruvian | 382 | 0.2% |
| Polish | 15,888 | 8.1% |
| Portuguese | 177 | 0.1% |
| Potawatomi | 4 | 0.0% |
| Puerto Rican | 3,276 | 1.7% |
| Romanian | 102 | 0.1% |
| Russian | 1,059 | 0.5% |
| Salvadoran | 76 | 0.0% |
| Samoan | 7 | 0.0% |
| Scandinavian | 1,100 | 0.6% |
| Scotch-Irish | 614 | 0.3% |
| Scottish | 2,042 | 1.0% |
| Serbian | 634 | 0.3% |
| Sioux | 126 | 0.1% |
| Slavic | 54 | 0.0% |
| Slovak | 451 | 0.2% |
| Slovene | 297 | 0.2% |
| South African | 15 | 0.0% |
| South American | 820 | 0.4% |
| South American Indian | 2 | 0.0% |
| Spaniard | 118 | 0.1% |
| Spanish | 151 | 0.1% |
| Sri Lankan | 64 | 0.0% |
| Subsaharan African | 918 | 0.5% |
| Swedish | 2,995 | 1.5% |
| Swiss | 709 | 0.4% |
| Syrian | 19 | 0.0% |
| Thai | 796 | 0.4% |
| Trinidadian and Tobagonian | 1 | 0.0% |
| Turkish | 3 | 0.0% |
| Ukrainian | 347 | 0.2% |
| Welsh | 902 | 0.5% |
| West Indian | 43 | 0.0% |
| Yugoslavian | 132 | 0.1% |
| Yup'ik | 38 | 0.0% | View All 125 Rows |
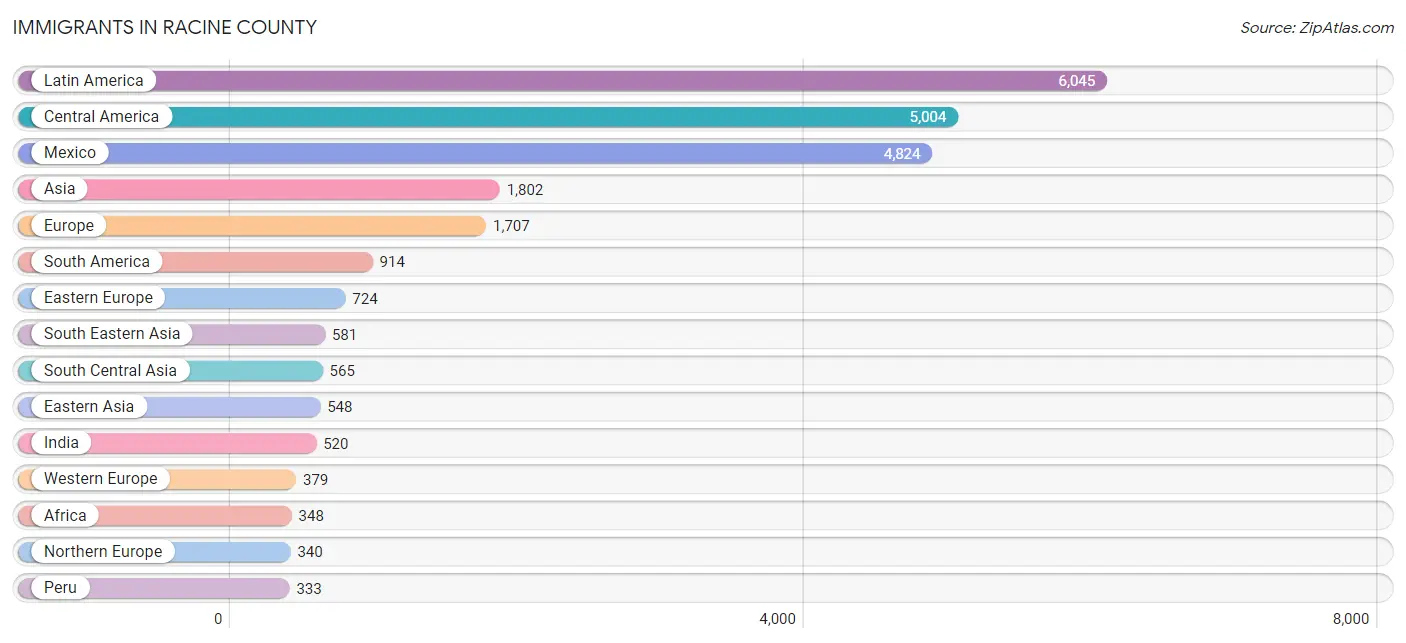
Immigrants in Racine County
The most numerous immigrant groups reported in Racine County came from Latin America (6,045 | 3.1%), Central America (5,004 | 2.5%), Mexico (4,824 | 2.5%), Asia (1,802 | 0.9%), and Europe (1,707 | 0.9%), together accounting for 9.8% of all Racine County residents.
| Immigration Origin | # Population | % Population |
| Africa | 348 | 0.2% |
| Argentina | 299 | 0.2% |
| Armenia | 16 | 0.0% |
| Asia | 1,802 | 0.9% |
| Australia | 176 | 0.1% |
| Austria | 48 | 0.0% |
| Belarus | 1 | 0.0% |
| Belgium | 18 | 0.0% |
| Belize | 7 | 0.0% |
| Bolivia | 3 | 0.0% |
| Bosnia and Herzegovina | 3 | 0.0% |
| Brazil | 74 | 0.0% |
| Canada | 313 | 0.2% |
| Caribbean | 127 | 0.1% |
| Central America | 5,004 | 2.5% |
| Chile | 20 | 0.0% |
| China | 302 | 0.2% |
| Colombia | 48 | 0.0% |
| Croatia | 3 | 0.0% |
| Cuba | 21 | 0.0% |
| Czechoslovakia | 89 | 0.1% |
| Eastern Africa | 160 | 0.1% |
| Eastern Asia | 548 | 0.3% |
| Eastern Europe | 724 | 0.4% |
| Ecuador | 6 | 0.0% |
| Egypt | 31 | 0.0% |
| El Salvador | 20 | 0.0% |
| England | 29 | 0.0% |
| Ethiopia | 91 | 0.1% |
| Europe | 1,707 | 0.9% |
| France | 41 | 0.0% |
| Germany | 216 | 0.1% |
| Greece | 37 | 0.0% |
| Guatemala | 117 | 0.1% |
| Haiti | 26 | 0.0% |
| Honduras | 36 | 0.0% |
| Hong Kong | 14 | 0.0% |
| Hungary | 34 | 0.0% |
| India | 520 | 0.3% |
| Indonesia | 37 | 0.0% |
| Iran | 41 | 0.0% |
| Iraq | 13 | 0.0% |
| Ireland | 147 | 0.1% |
| Italy | 105 | 0.1% |
| Jamaica | 39 | 0.0% |
| Japan | 30 | 0.0% |
| Jordan | 28 | 0.0% |
| Kenya | 3 | 0.0% |
| Korea | 216 | 0.1% |
| Laos | 160 | 0.1% |
| Latin America | 6,045 | 3.1% |
| Latvia | 15 | 0.0% |
| Lebanon | 10 | 0.0% |
| Lithuania | 21 | 0.0% |
| Mexico | 4,824 | 2.5% |
| Netherlands | 52 | 0.0% |
| Nigeria | 15 | 0.0% |
| North Macedonia | 40 | 0.0% |
| Northern Africa | 31 | 0.0% |
| Northern Europe | 340 | 0.2% |
| Norway | 7 | 0.0% |
| Oceania | 181 | 0.1% |
| Pakistan | 4 | 0.0% |
| Peru | 333 | 0.2% |
| Philippines | 300 | 0.2% |
| Poland | 174 | 0.1% |
| Portugal | 27 | 0.0% |
| Romania | 39 | 0.0% |
| Russia | 16 | 0.0% |
| Scotland | 13 | 0.0% |
| Serbia | 232 | 0.1% |
| Singapore | 22 | 0.0% |
| South Africa | 45 | 0.0% |
| South America | 914 | 0.5% |
| South Central Asia | 565 | 0.3% |
| South Eastern Asia | 581 | 0.3% |
| Southern Europe | 264 | 0.1% |
| Spain | 95 | 0.1% |
| Syria | 9 | 0.0% |
| Taiwan | 37 | 0.0% |
| Thailand | 51 | 0.0% |
| Trinidad and Tobago | 26 | 0.0% |
| Uganda | 66 | 0.0% |
| Ukraine | 12 | 0.0% |
| Venezuela | 130 | 0.1% |
| Vietnam | 11 | 0.0% |
| Western Africa | 15 | 0.0% |
| Western Asia | 76 | 0.0% |
| Western Europe | 379 | 0.2% | View All 89 Rows |
Sex and Age in Racine County
Sex and Age in Racine County
The most populous age groups in Racine County are 55 to 59 Years (7,240 | 7.4%) for men and 60 to 64 Years (7,212 | 7.3%) for women.
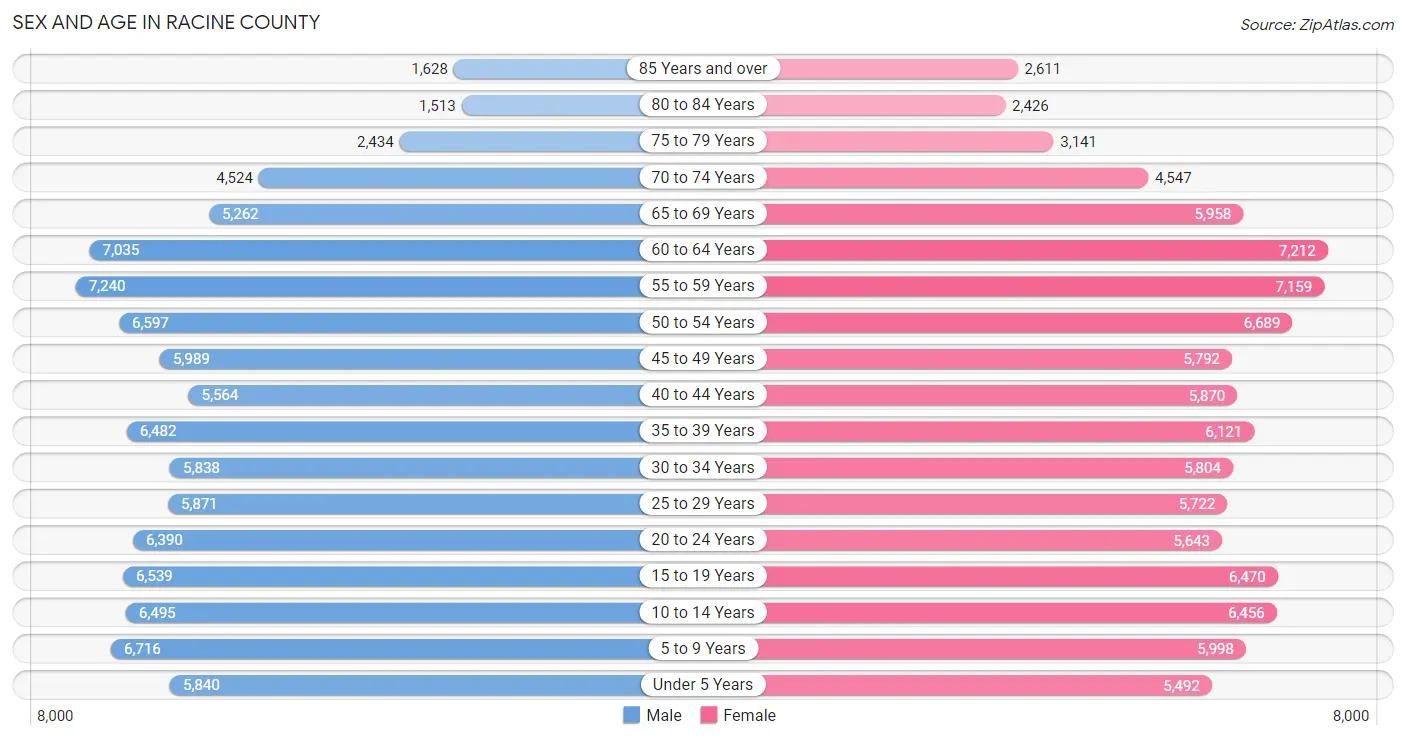
| Age Bracket | Male | Female |
| Under 5 Years | 5,840 (6.0%) | 5,492 (5.5%) |
| 5 to 9 Years | 6,716 (6.9%) | 5,998 (6.0%) |
| 10 to 14 Years | 6,495 (6.6%) | 6,456 (6.5%) |
| 15 to 19 Years | 6,539 (6.7%) | 6,470 (6.5%) |
| 20 to 24 Years | 6,390 (6.5%) | 5,643 (5.7%) |
| 25 to 29 Years | 5,871 (6.0%) | 5,722 (5.8%) |
| 30 to 34 Years | 5,838 (6.0%) | 5,804 (5.9%) |
| 35 to 39 Years | 6,482 (6.6%) | 6,121 (6.2%) |
| 40 to 44 Years | 5,564 (5.7%) | 5,870 (5.9%) |
| 45 to 49 Years | 5,989 (6.1%) | 5,792 (5.8%) |
| 50 to 54 Years | 6,597 (6.7%) | 6,689 (6.8%) |
| 55 to 59 Years | 7,240 (7.4%) | 7,159 (7.2%) |
| 60 to 64 Years | 7,035 (7.2%) | 7,212 (7.3%) |
| 65 to 69 Years | 5,262 (5.4%) | 5,958 (6.0%) |
| 70 to 74 Years | 4,524 (4.6%) | 4,547 (4.6%) |
| 75 to 79 Years | 2,434 (2.5%) | 3,141 (3.2%) |
| 80 to 84 Years | 1,513 (1.5%) | 2,426 (2.5%) |
| 85 Years and over | 1,628 (1.7%) | 2,611 (2.6%) |
| Total | 97,957 (100.0%) | 99,111 (100.0%) |
Families and Households in Racine County
Median Family Size in Racine County
The median family size in Racine County is 2.99 persons per family, with married-couple families (36,772 | 72.2%) accounting for the largest median family size of 3.02 persons per family. On the other hand, single male/father families (4,558 | 8.9%) represent the smallest median family size with 2.75 persons per family.
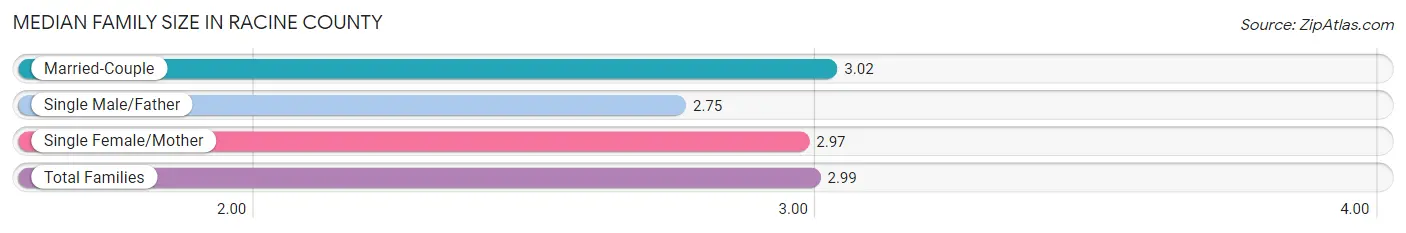
| Family Type | # Families | Family Size |
| Married-Couple | 36,772 (72.2%) | 3.02 |
| Single Male/Father | 4,558 (8.9%) | 2.75 |
| Single Female/Mother | 9,583 (18.8%) | 2.97 |
| Total Families | 50,913 (100.0%) | 2.99 |
Median Household Size in Racine County
The median household size in Racine County is 2.43 persons per household, with single female/mother households (9,583 | 12.1%) accounting for the largest median household size of 3.24 persons per household. non-family households (28,187 | 35.6%) represent the smallest median household size with 1.24 persons per household.
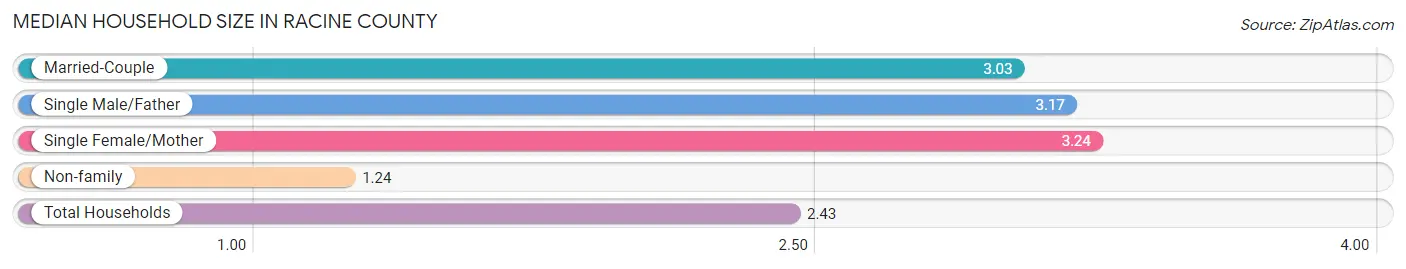
| Household Type | # Households | Household Size |
| Married-Couple | 36,772 (46.5%) | 3.03 |
| Single Male/Father | 4,558 (5.8%) | 3.17 |
| Single Female/Mother | 9,583 (12.1%) | 3.24 |
| Non-family | 28,187 (35.6%) | 1.24 |
| Total Households | 79,100 (100.0%) | 2.43 |
Household Size by Marriage Status in Racine County
Out of a total of 79,100 households in Racine County, 50,913 (64.4%) are family households, while 28,187 (35.6%) are nonfamily households. The most numerous type of family households are 2-person households, comprising 23,200, and the most common type of nonfamily households are 1-person households, comprising 22,957.
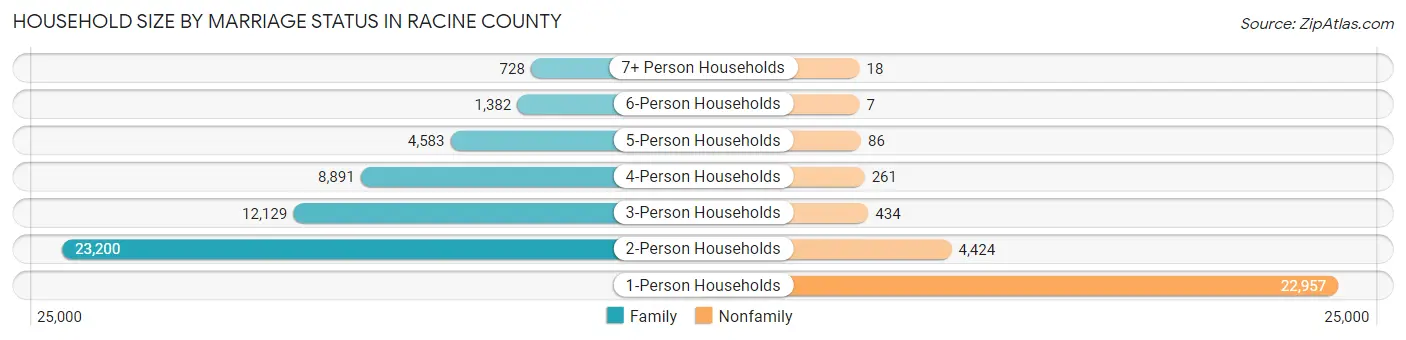
| Household Size | Family Households | Nonfamily Households |
| 1-Person Households | - | 22,957 (29.0%) |
| 2-Person Households | 23,200 (29.3%) | 4,424 (5.6%) |
| 3-Person Households | 12,129 (15.3%) | 434 (0.5%) |
| 4-Person Households | 8,891 (11.2%) | 261 (0.3%) |
| 5-Person Households | 4,583 (5.8%) | 86 (0.1%) |
| 6-Person Households | 1,382 (1.8%) | 7 (0.0%) |
| 7+ Person Households | 728 (0.9%) | 18 (0.0%) |
| Total | 50,913 (64.4%) | 28,187 (35.6%) |
Female Fertility in Racine County
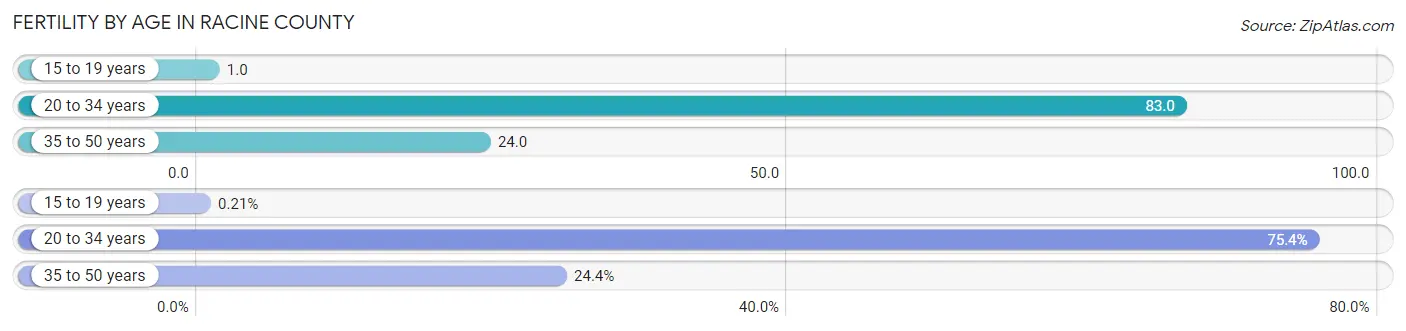
Fertility by Age in Racine County
Average fertility rate in Racine County is 44.0 births per 1,000 women. Women in the age bracket of 20 to 34 years have the highest fertility rate with 83.0 births per 1,000 women. Women in the age bracket of 20 to 34 years acount for 75.4% of all women with births.
| Age Bracket | Women with Births | Births / 1,000 Women |
| 15 to 19 years | 4 (0.2%) | 1.0 |
| 20 to 34 years | 1,430 (75.4%) | 83.0 |
| 35 to 50 years | 462 (24.4%) | 24.0 |
| Total | 1,896 (100.0%) | 44.0 |
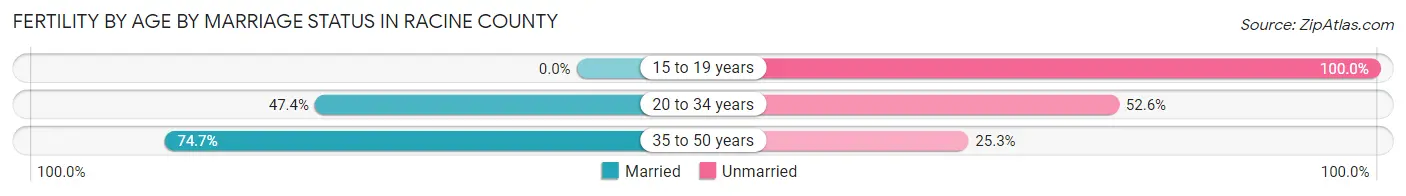
Fertility by Age by Marriage Status in Racine County
54.0% of women with births (1,896) in Racine County are married. The highest percentage of unmarried women with births falls into 15 to 19 years age bracket with 100.0% of them unmarried at the time of birth, while the lowest percentage of unmarried women with births belong to 35 to 50 years age bracket with 25.3% of them unmarried.
| Age Bracket | Married | Unmarried |
| 15 to 19 years | 0 (0.0%) | 4 (100.0%) |
| 20 to 34 years | 678 (47.4%) | 752 (52.6%) |
| 35 to 50 years | 345 (74.7%) | 117 (25.3%) |
| Total | 1,024 (54.0%) | 872 (46.0%) |
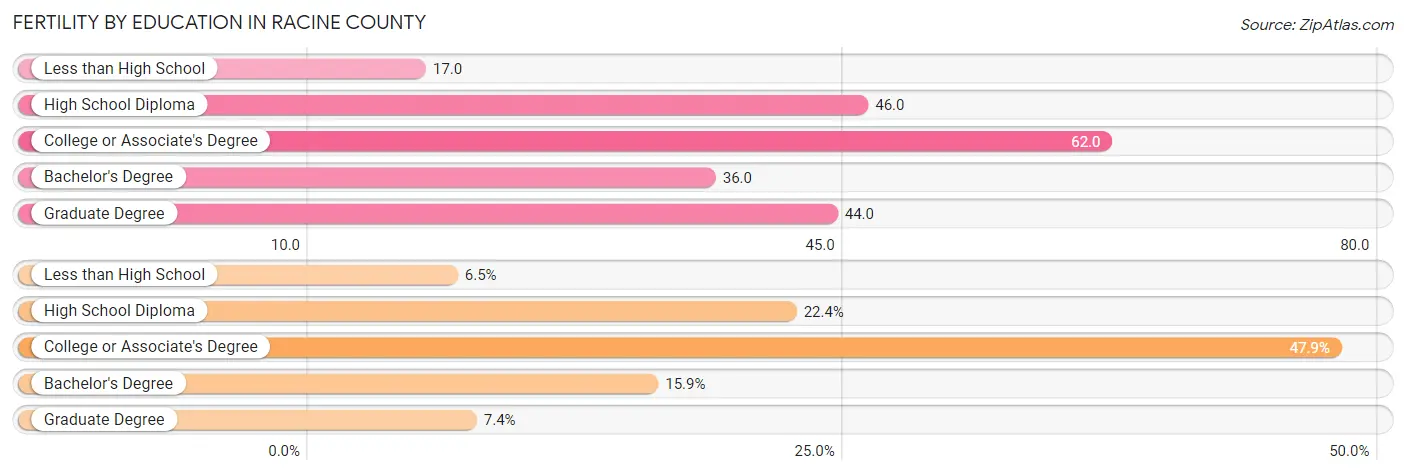
Fertility by Education in Racine County
Average fertility rate in Racine County is 44.0 births per 1,000 women. Women with the education attainment of college or associate's degree have the highest fertility rate of 62.0 births per 1,000 women, while women with the education attainment of less than high school have the lowest fertility at 17.0 births per 1,000 women. Women with the education attainment of college or associate's degree represent 47.9% of all women with births.
| Educational Attainment | Women with Births | Births / 1,000 Women |
| Less than High School | 123 (6.5%) | 17.0 |
| High School Diploma | 424 (22.4%) | 46.0 |
| College or Associate's Degree | 908 (47.9%) | 62.0 |
| Bachelor's Degree | 301 (15.9%) | 36.0 |
| Graduate Degree | 140 (7.4%) | 44.0 |
| Total | 1,896 (100.0%) | 44.0 |
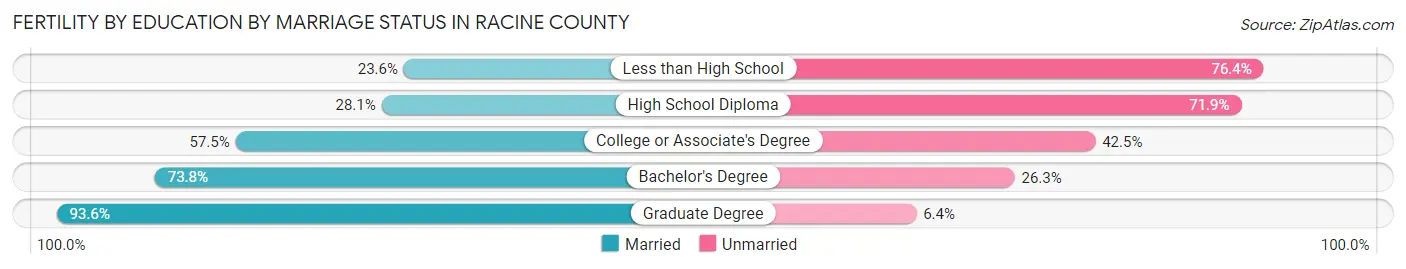
Fertility by Education by Marriage Status in Racine County
46.0% of women with births in Racine County are unmarried. Women with the educational attainment of graduate degree are most likely to be married with 93.6% of them married at childbirth, while women with the educational attainment of less than high school are least likely to be married with 76.4% of them unmarried at childbirth.
| Educational Attainment | Married | Unmarried |
| Less than High School | 29 (23.6%) | 94 (76.4%) |
| High School Diploma | 119 (28.1%) | 305 (71.9%) |
| College or Associate's Degree | 522 (57.5%) | 386 (42.5%) |
| Bachelor's Degree | 222 (73.8%) | 79 (26.3%) |
| Graduate Degree | 131 (93.6%) | 9 (6.4%) |
| Total | 1,024 (54.0%) | 872 (46.0%) |
Income in Racine County
Income Overview in Racine County
Per Capita Income in Racine County is $38,288, while median incomes of families and households are $90,539 and $72,658 respectively.
| Characteristic | Number | Measure |
| Per Capita Income | 197,068 | $38,288 |
| Median Family Income | 50,913 | $90,539 |
| Mean Family Income | 50,913 | $111,757 |
| Median Household Income | 79,100 | $72,658 |
| Mean Household Income | 79,100 | $94,057 |
| Income Deficit | 50,913 | $11,671 |
| Wage / Income Gap (%) | 197,068 | 28.98% |
| Wage / Income Gap ($) | 197,068 | 71.02¢ per $1 |
| Gini / Inequality Index | 197,068 | 0.43 |
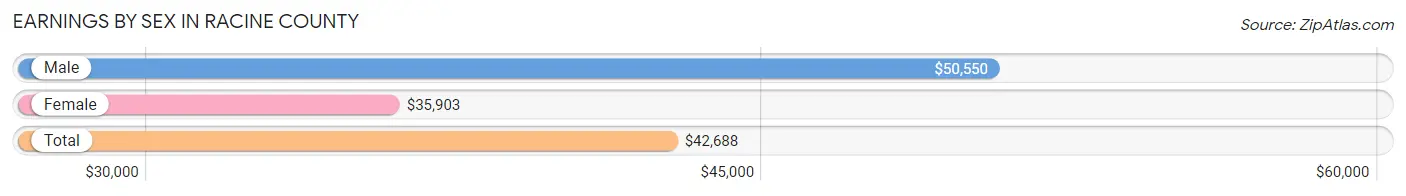
Earnings by Sex in Racine County
Average Earnings in Racine County are $42,688, $50,550 for men and $35,903 for women, a difference of 29.0%.
| Sex | Number | Average Earnings |
| Male | 55,163 (52.7%) | $50,550 |
| Female | 49,580 (47.3%) | $35,903 |
| Total | 104,743 (100.0%) | $42,688 |
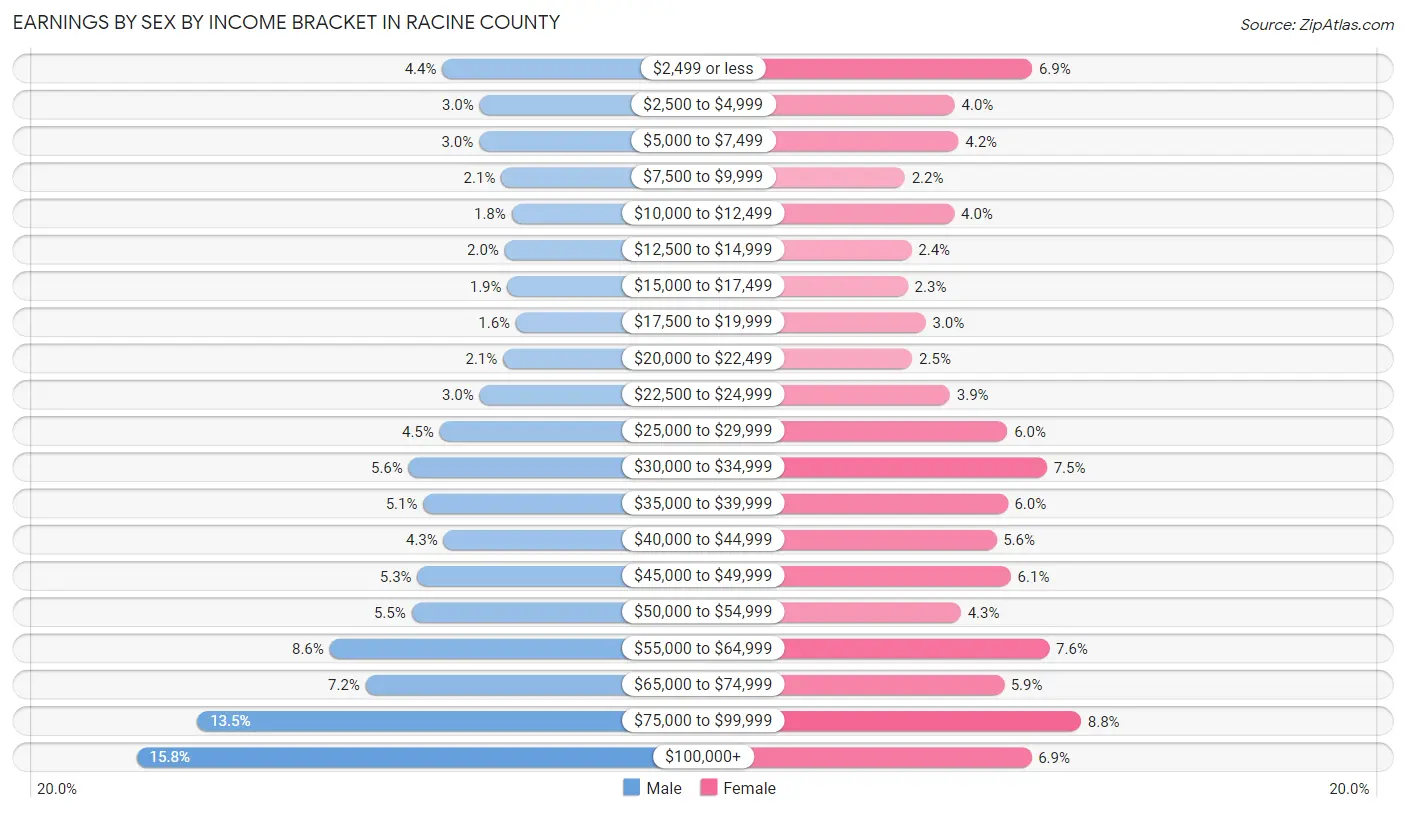
Earnings by Sex by Income Bracket in Racine County
The most common earnings brackets in Racine County are $100,000+ for men (8,715 | 15.8%) and $75,000 to $99,999 for women (4,350 | 8.8%).
| Income | Male | Female |
| $2,499 or less | 2,401 (4.3%) | 3,440 (6.9%) |
| $2,500 to $4,999 | 1,627 (2.9%) | 2,003 (4.0%) |
| $5,000 to $7,499 | 1,636 (3.0%) | 2,073 (4.2%) |
| $7,500 to $9,999 | 1,179 (2.1%) | 1,075 (2.2%) |
| $10,000 to $12,499 | 966 (1.8%) | 1,995 (4.0%) |
| $12,500 to $14,999 | 1,109 (2.0%) | 1,202 (2.4%) |
| $15,000 to $17,499 | 1,052 (1.9%) | 1,132 (2.3%) |
| $17,500 to $19,999 | 878 (1.6%) | 1,465 (2.9%) |
| $20,000 to $22,499 | 1,141 (2.1%) | 1,215 (2.5%) |
| $22,500 to $24,999 | 1,628 (2.9%) | 1,915 (3.9%) |
| $25,000 to $29,999 | 2,453 (4.4%) | 2,981 (6.0%) |
| $30,000 to $34,999 | 3,093 (5.6%) | 3,712 (7.5%) |
| $35,000 to $39,999 | 2,790 (5.1%) | 2,986 (6.0%) |
| $40,000 to $44,999 | 2,374 (4.3%) | 2,776 (5.6%) |
| $45,000 to $49,999 | 2,914 (5.3%) | 3,046 (6.1%) |
| $50,000 to $54,999 | 3,034 (5.5%) | 2,115 (4.3%) |
| $55,000 to $64,999 | 4,729 (8.6%) | 3,756 (7.6%) |
| $65,000 to $74,999 | 3,981 (7.2%) | 2,916 (5.9%) |
| $75,000 to $99,999 | 7,463 (13.5%) | 4,350 (8.8%) |
| $100,000+ | 8,715 (15.8%) | 3,427 (6.9%) |
| Total | 55,163 (100.0%) | 49,580 (100.0%) |
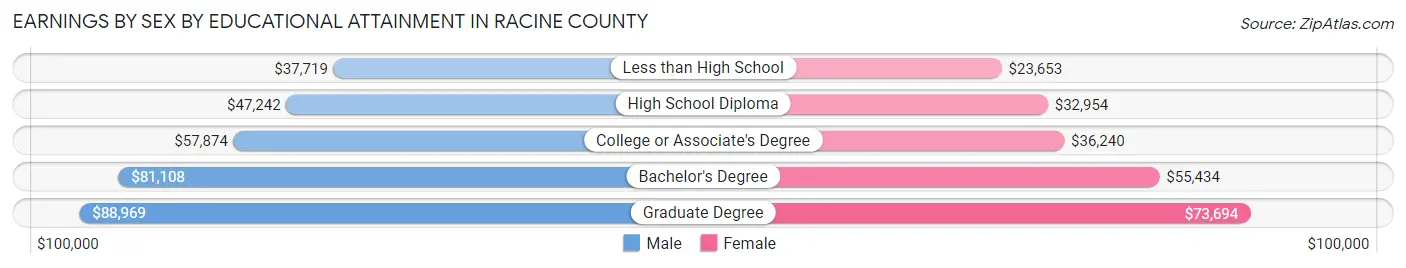
Earnings by Sex by Educational Attainment in Racine County
Average earnings in Racine County are $57,042 for men and $41,095 for women, a difference of 28.0%. Men with an educational attainment of graduate degree enjoy the highest average annual earnings of $88,969, while those with less than high school education earn the least with $37,719. Women with an educational attainment of graduate degree earn the most with the average annual earnings of $73,694, while those with less than high school education have the smallest earnings of $23,653.
| Educational Attainment | Male Income | Female Income |
| Less than High School | $37,719 | $23,653 |
| High School Diploma | $47,242 | $32,954 |
| College or Associate's Degree | $57,874 | $36,240 |
| Bachelor's Degree | $81,108 | $55,434 |
| Graduate Degree | $88,969 | $73,694 |
| Total | $57,042 | $41,095 |
Family Income in Racine County
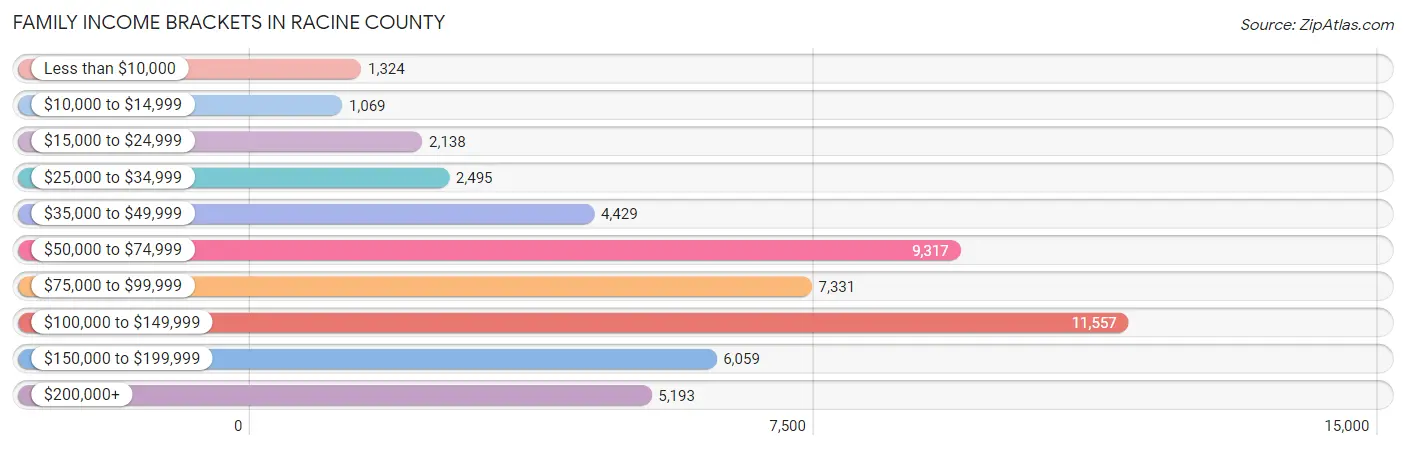
Family Income Brackets in Racine County
According to the Racine County family income data, there are 11,557 families falling into the $100,000 to $149,999 income range, which is the most common income bracket and makes up 22.7% of all families. Conversely, the $10,000 to $14,999 income bracket is the least frequent group with only 1,069 families (2.1%) belonging to this category.
| Income Bracket | # Families | % Families |
| Less than $10,000 | 1,324 | 2.6% |
| $10,000 to $14,999 | 1,069 | 2.1% |
| $15,000 to $24,999 | 2,138 | 4.2% |
| $25,000 to $34,999 | 2,495 | 4.9% |
| $35,000 to $49,999 | 4,429 | 8.7% |
| $50,000 to $74,999 | 9,317 | 18.3% |
| $75,000 to $99,999 | 7,331 | 14.4% |
| $100,000 to $149,999 | 11,557 | 22.7% |
| $150,000 to $199,999 | 6,059 | 11.9% |
| $200,000+ | 5,193 | 10.2% |
Family Income by Famaliy Size in Racine County
4-person families (8,393 | 16.5%) account for the highest median family income in Racine County with $115,018 per family, while 2-person families (25,525 | 50.1%) have the highest median income of $40,791 per family member.
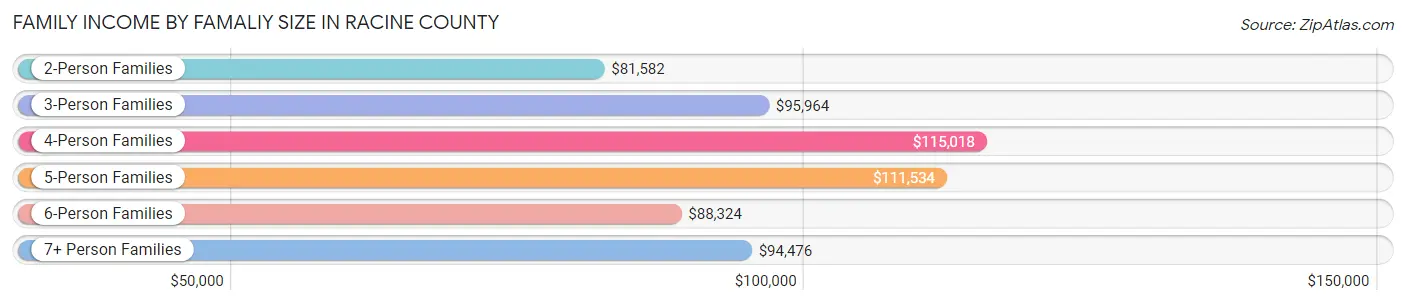
| Income Bracket | # Families | Median Income |
| 2-Person Families | 25,525 (50.1%) | $81,582 |
| 3-Person Families | 11,085 (21.8%) | $95,964 |
| 4-Person Families | 8,393 (16.5%) | $115,018 |
| 5-Person Families | 4,099 (8.1%) | $111,534 |
| 6-Person Families | 1,273 (2.5%) | $88,324 |
| 7+ Person Families | 538 (1.1%) | $94,476 |
| Total | 50,913 (100.0%) | $90,539 |
Family Income by Number of Earners in Racine County
The median family income in Racine County is $90,539, with families comprising 3+ earners (6,458) having the highest median family income of $143,671, while families with no earners (7,670) have the lowest median family income of $59,778, accounting for 12.7% and 15.1% of families, respectively.

| Number of Earners | # Families | Median Income |
| No Earners | 7,670 (15.1%) | $59,778 |
| 1 Earner | 17,311 (34.0%) | $60,858 |
| 2 Earners | 19,474 (38.3%) | $118,482 |
| 3+ Earners | 6,458 (12.7%) | $143,671 |
| Total | 50,913 (100.0%) | $90,539 |
Household Income in Racine County
Household Income Brackets in Racine County
With 14,950 households falling in the category, the $50,000 to $74,999 income range is the most frequent in Racine County, accounting for 18.9% of all households. In contrast, only 2,848 households (3.6%) fall into the $10,000 to $14,999 income bracket, making it the least populous group.
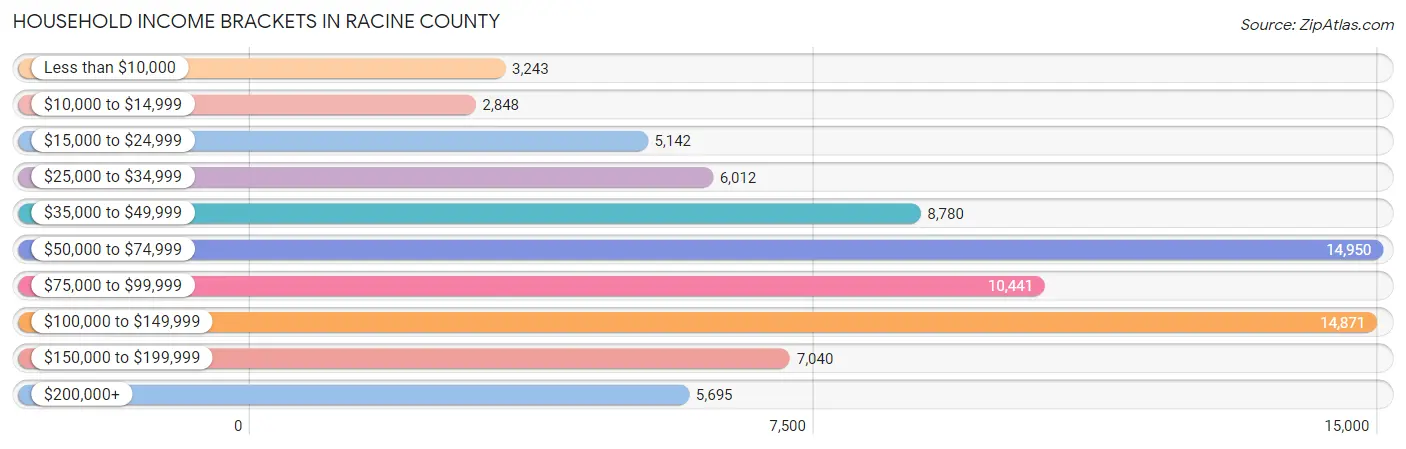
| Income Bracket | # Households | % Households |
| Less than $10,000 | 3,243 | 4.1% |
| $10,000 to $14,999 | 2,848 | 3.6% |
| $15,000 to $24,999 | 5,142 | 6.5% |
| $25,000 to $34,999 | 6,012 | 7.6% |
| $35,000 to $49,999 | 8,780 | 11.1% |
| $50,000 to $74,999 | 14,950 | 18.9% |
| $75,000 to $99,999 | 10,441 | 13.2% |
| $100,000 to $149,999 | 14,871 | 18.8% |
| $150,000 to $199,999 | 7,040 | 8.9% |
| $200,000+ | 5,695 | 7.2% |
Household Income by Householder Age in Racine County
The median household income in Racine County is $72,658, with the highest median household income of $94,748 found in the 45 to 64 years age bracket for the primary householder. A total of 30,347 households (38.4%) fall into this category. Meanwhile, the 65+ years age bracket for the primary householder has the lowest median household income of $54,259, with 22,009 households (27.8%) in this group.
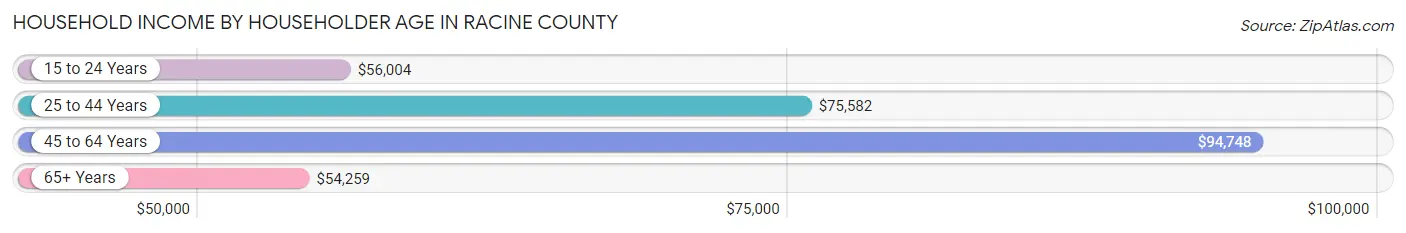
| Income Bracket | # Households | Median Income |
| 15 to 24 Years | 2,665 (3.4%) | $56,004 |
| 25 to 44 Years | 24,079 (30.4%) | $75,582 |
| 45 to 64 Years | 30,347 (38.4%) | $94,748 |
| 65+ Years | 22,009 (27.8%) | $54,259 |
| Total | 79,100 (100.0%) | $72,658 |
Poverty in Racine County
Income Below Poverty by Sex and Age in Racine County
With 9.5% poverty level for males and 13.1% for females among the residents of Racine County, under 5 year old males and 25 to 34 year old females are the most vulnerable to poverty, with 1,138 males (20.0%) and 2,450 females (21.6%) in their respective age groups living below the poverty level.
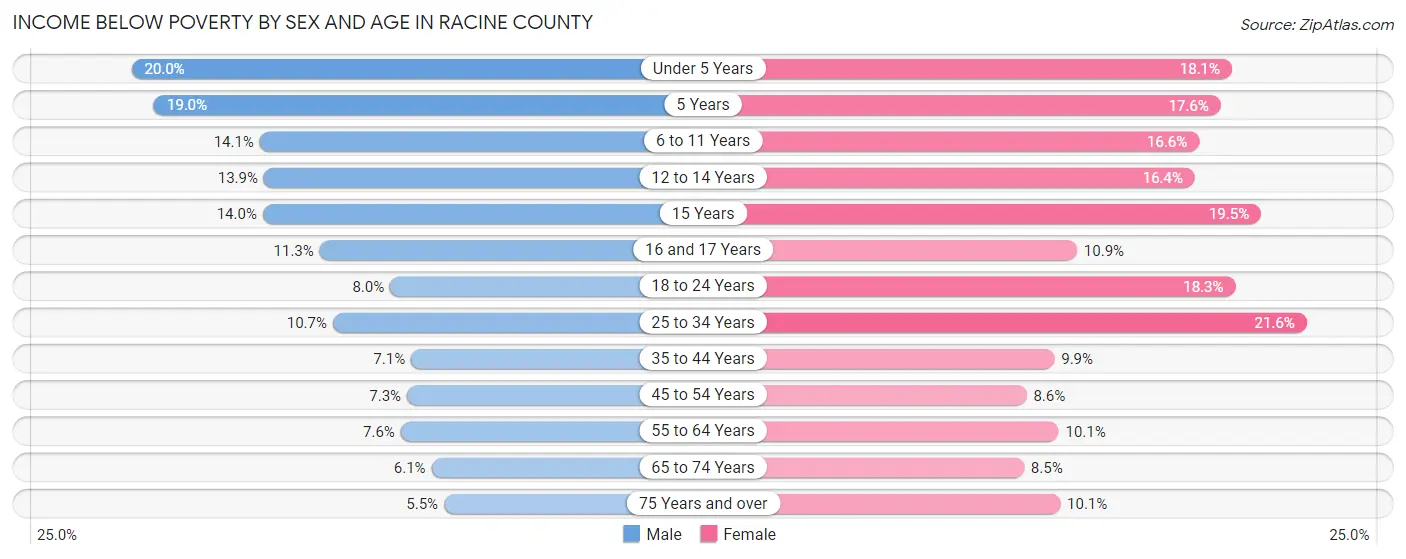
| Age Bracket | Male | Female |
| Under 5 Years | 1,138 (20.0%) | 962 (18.1%) |
| 5 Years | 183 (19.0%) | 257 (17.6%) |
| 6 to 11 Years | 1,113 (14.1%) | 1,156 (16.6%) |
| 12 to 14 Years | 568 (13.9%) | 626 (16.4%) |
| 15 Years | 149 (14.0%) | 292 (19.5%) |
| 16 and 17 Years | 328 (11.3%) | 299 (10.9%) |
| 18 to 24 Years | 676 (8.0%) | 1,420 (18.3%) |
| 25 to 34 Years | 1,186 (10.7%) | 2,450 (21.6%) |
| 35 to 44 Years | 805 (7.1%) | 1,160 (9.9%) |
| 45 to 54 Years | 888 (7.3%) | 1,067 (8.6%) |
| 55 to 64 Years | 1,059 (7.5%) | 1,438 (10.1%) |
| 65 to 74 Years | 582 (6.1%) | 880 (8.5%) |
| 75 Years and over | 287 (5.5%) | 774 (10.1%) |
| Total | 8,962 (9.5%) | 12,781 (13.1%) |
Income Above Poverty by Sex and Age in Racine County
According to the poverty statistics in Racine County, males aged 75 years and over and females aged 65 to 74 years are the age groups that are most secure financially, with 94.5% of males and 91.5% of females in these age groups living above the poverty line.
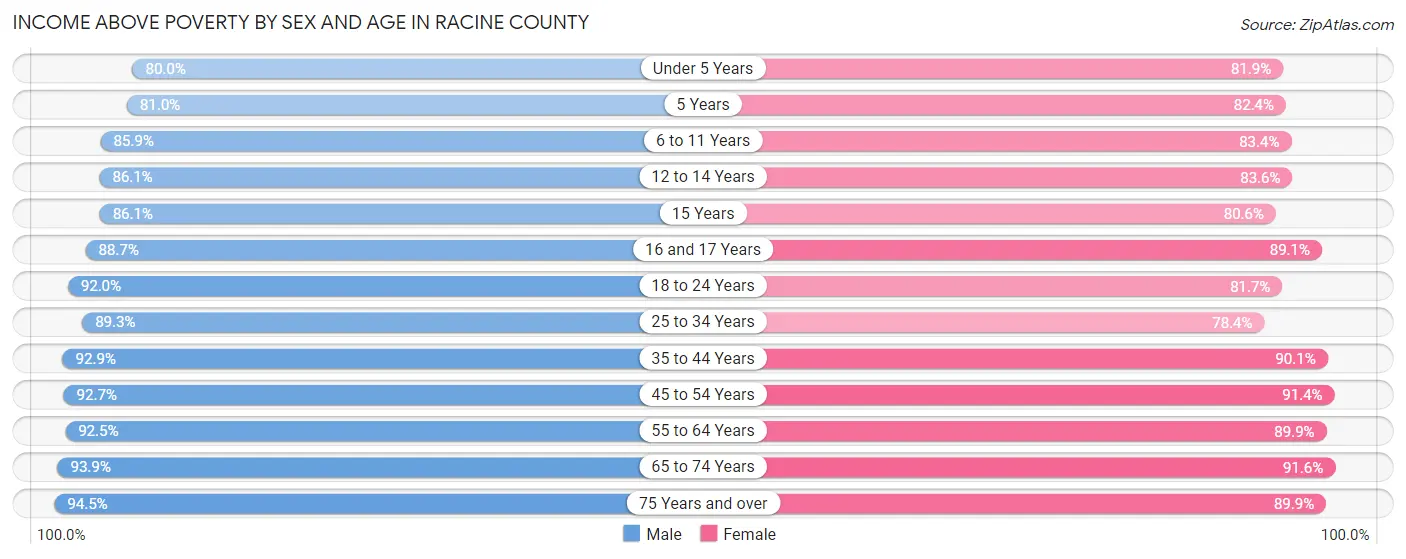
| Age Bracket | Male | Female |
| Under 5 Years | 4,542 (80.0%) | 4,352 (81.9%) |
| 5 Years | 780 (81.0%) | 1,205 (82.4%) |
| 6 to 11 Years | 6,788 (85.9%) | 5,817 (83.4%) |
| 12 to 14 Years | 3,518 (86.1%) | 3,195 (83.6%) |
| 15 Years | 919 (86.1%) | 1,209 (80.5%) |
| 16 and 17 Years | 2,572 (88.7%) | 2,441 (89.1%) |
| 18 to 24 Years | 7,737 (92.0%) | 6,356 (81.7%) |
| 25 to 34 Years | 9,902 (89.3%) | 8,906 (78.4%) |
| 35 to 44 Years | 10,575 (92.9%) | 10,606 (90.1%) |
| 45 to 54 Years | 11,344 (92.7%) | 11,383 (91.4%) |
| 55 to 64 Years | 12,967 (92.4%) | 12,858 (89.9%) |
| 65 to 74 Years | 8,928 (93.9%) | 9,529 (91.5%) |
| 75 Years and over | 4,898 (94.5%) | 6,864 (89.9%) |
| Total | 85,470 (90.5%) | 84,721 (86.9%) |
Income Below Poverty Among Married-Couple Families in Racine County
The poverty statistics for married-couple families in Racine County show that 2.3% or 842 of the total 36,772 families live below the poverty line. Families with 5 or more children have the highest poverty rate of 20.7%, comprising of 35 families. On the other hand, families with no children have the lowest poverty rate of 1.8%, which includes 436 families.
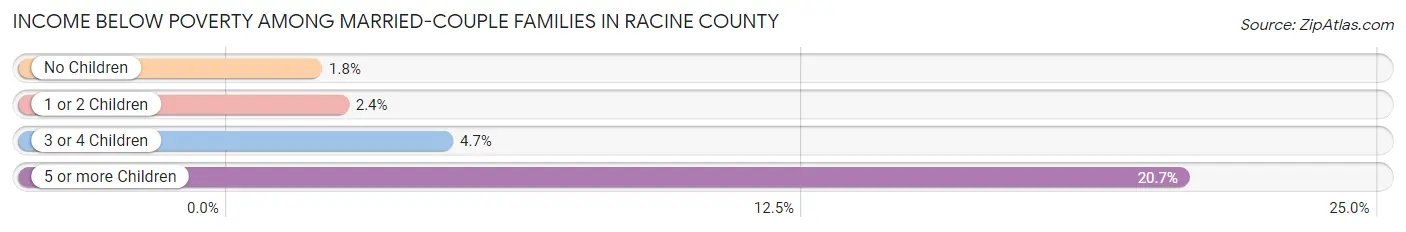
| Children | Above Poverty | Below Poverty |
| No Children | 23,344 (98.2%) | 436 (1.8%) |
| 1 or 2 Children | 9,843 (97.6%) | 243 (2.4%) |
| 3 or 4 Children | 2,609 (95.3%) | 128 (4.7%) |
| 5 or more Children | 134 (79.3%) | 35 (20.7%) |
| Total | 35,930 (97.7%) | 842 (2.3%) |
Income Below Poverty Among Single-Parent Households in Racine County
According to the poverty data in Racine County, 13.1% or 598 single-father households and 26.1% or 2,502 single-mother households are living below the poverty line. Among single-father households, those with 5 or more children have the highest poverty rate, with 32 households (100.0%) experiencing poverty. Likewise, among single-mother households, those with 5 or more children have the highest poverty rate, with 121 households (62.4%) falling below the poverty line.
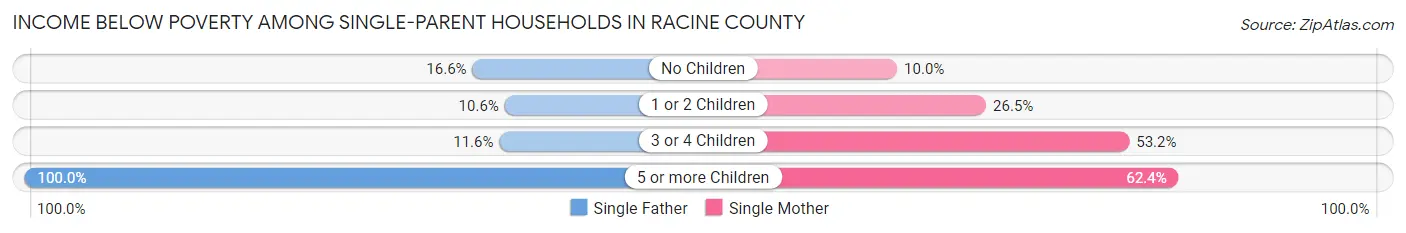
| Children | Single Father | Single Mother |
| No Children | 226 (16.6%) | 292 (10.0%) |
| 1 or 2 Children | 281 (10.6%) | 1,341 (26.5%) |
| 3 or 4 Children | 59 (11.6%) | 748 (53.2%) |
| 5 or more Children | 32 (100.0%) | 121 (62.4%) |
| Total | 598 (13.1%) | 2,502 (26.1%) |
Income Below Poverty Among Married-Couple vs Single-Parent Households in Racine County
The poverty data for Racine County shows that 842 of the married-couple family households (2.3%) and 3,100 of the single-parent households (21.9%) are living below the poverty level. Within the married-couple family households, those with 5 or more children have the highest poverty rate, with 35 households (20.7%) falling below the poverty line. Among the single-parent households, those with 5 or more children have the highest poverty rate, with 153 household (67.7%) living below poverty.
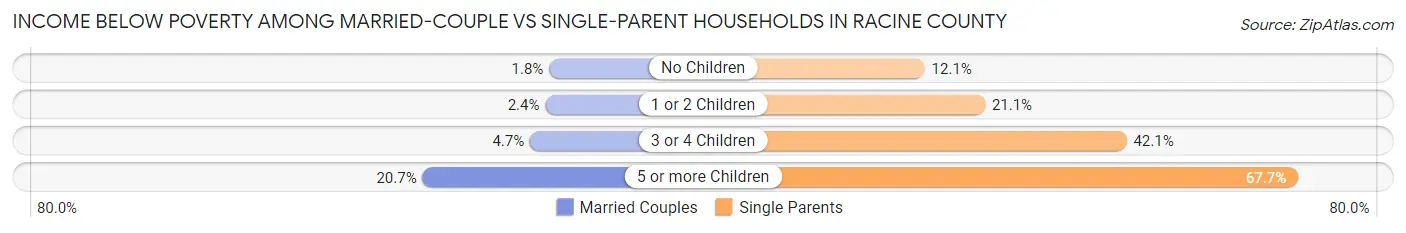
| Children | Married-Couple Families | Single-Parent Households |
| No Children | 436 (1.8%) | 518 (12.1%) |
| 1 or 2 Children | 243 (2.4%) | 1,622 (21.0%) |
| 3 or 4 Children | 128 (4.7%) | 807 (42.1%) |
| 5 or more Children | 35 (20.7%) | 153 (67.7%) |
| Total | 842 (2.3%) | 3,100 (21.9%) |
Employment Characteristics in Racine County
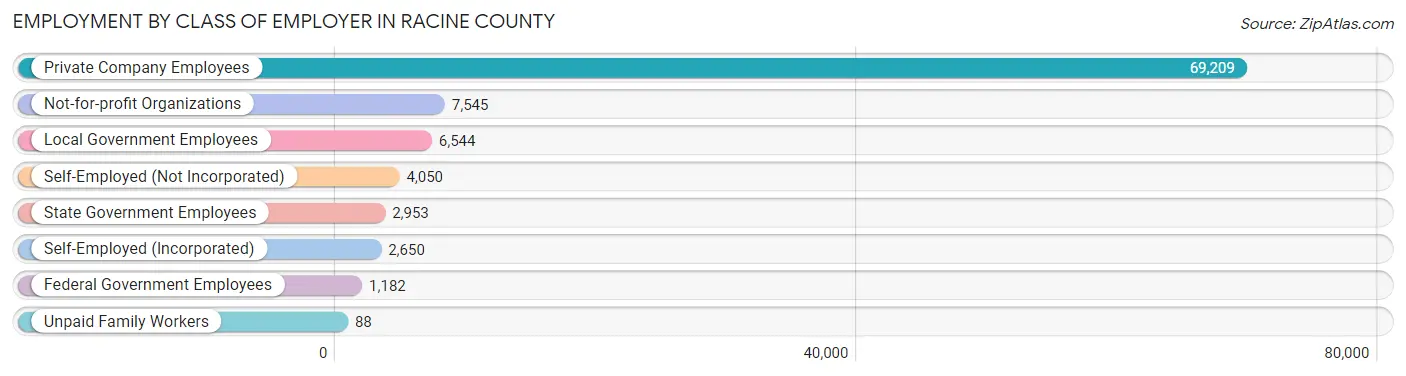
Employment by Class of Employer in Racine County
Among the 94,221 employed individuals in Racine County, private company employees (69,209 | 73.5%), not-for-profit organizations (7,545 | 8.0%), and local government employees (6,544 | 7.0%) make up the most common classes of employment.
| Employer Class | # Employees | % Employees |
| Private Company Employees | 69,209 | 73.5% |
| Self-Employed (Incorporated) | 2,650 | 2.8% |
| Self-Employed (Not Incorporated) | 4,050 | 4.3% |
| Not-for-profit Organizations | 7,545 | 8.0% |
| Local Government Employees | 6,544 | 7.0% |
| State Government Employees | 2,953 | 3.1% |
| Federal Government Employees | 1,182 | 1.3% |
| Unpaid Family Workers | 88 | 0.1% |
| Total | 94,221 | 100.0% |
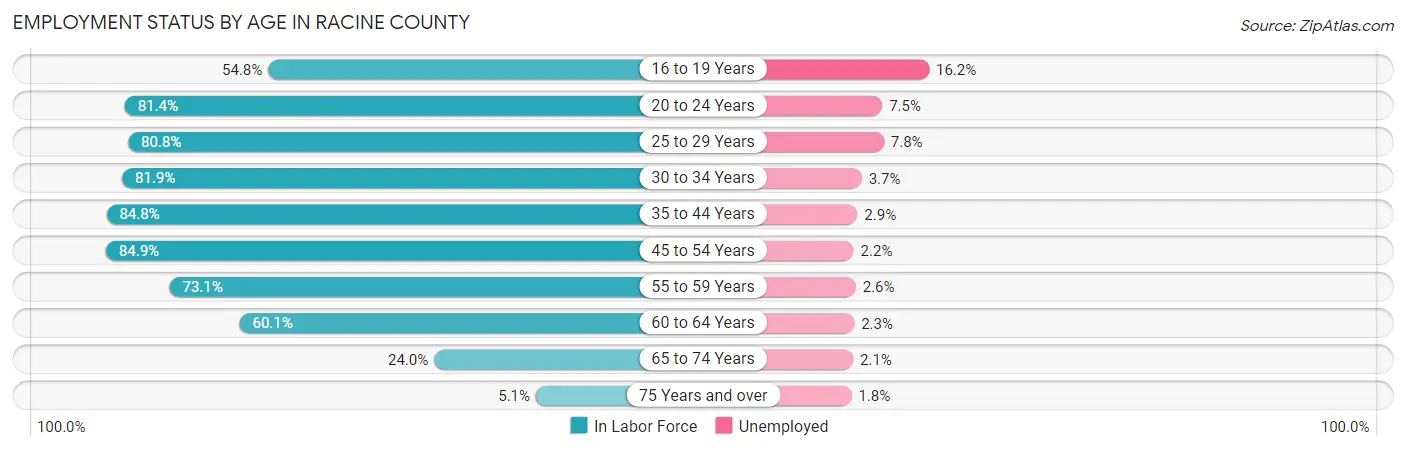
Employment Status by Age in Racine County
According to the labor force statistics for Racine County, out of the total population over 16 years of age (157,477), 64.0% or 100,785 individuals are in the labor force, with 4.4% or 4,435 of them unemployed. The age group with the highest labor force participation rate is 45 to 54 years, with 84.9% or 21,282 individuals in the labor force. Within the labor force, the 16 to 19 years age range has the highest percentage of unemployed individuals, with 16.2% or 925 of them being unemployed.
| Age Bracket | In Labor Force | Unemployed |
| 16 to 19 Years | 5,707 (54.8%) | 925 (16.2%) |
| 20 to 24 Years | 9,795 (81.4%) | 735 (7.5%) |
| 25 to 29 Years | 9,367 (80.8%) | 731 (7.8%) |
| 30 to 34 Years | 9,535 (81.9%) | 353 (3.7%) |
| 35 to 44 Years | 20,383 (84.8%) | 591 (2.9%) |
| 45 to 54 Years | 21,282 (84.9%) | 468 (2.2%) |
| 55 to 59 Years | 10,526 (73.1%) | 274 (2.6%) |
| 60 to 64 Years | 8,562 (60.1%) | 197 (2.3%) |
| 65 to 74 Years | 4,870 (24.0%) | 102 (2.1%) |
| 75 Years and over | 701 (5.1%) | 13 (1.8%) |
| Total | 100,785 (64.0%) | 4,435 (4.4%) |
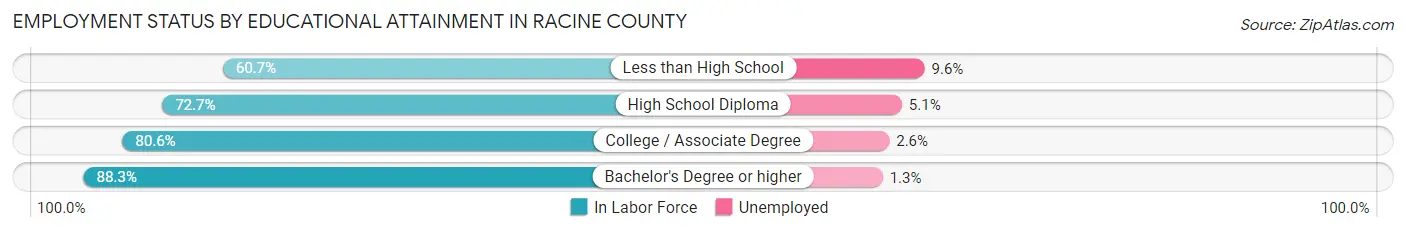
Employment Status by Educational Attainment in Racine County
According to labor force statistics for Racine County, 78.9% of individuals (79,677) out of the total population between 25 and 64 years of age (100,985) are in the labor force, with 3.3% or 2,629 of them being unemployed. The group with the highest labor force participation rate are those with the educational attainment of bachelor's degree or higher, with 88.3% or 24,784 individuals in the labor force. Within the labor force, individuals with less than high school education have the highest percentage of unemployment, with 9.6% or 507 of them being unemployed.
| Educational Attainment | In Labor Force | Unemployed |
| Less than High School | 5,285 (60.7%) | 836 (9.6%) |
| High School Diploma | 20,129 (72.7%) | 1,412 (5.1%) |
| College / Associate Degree | 29,437 (80.6%) | 950 (2.6%) |
| Bachelor's Degree or higher | 24,784 (88.3%) | 365 (1.3%) |
| Total | 79,677 (78.9%) | 3,333 (3.3%) |
Employment Occupations by Sex in Racine County
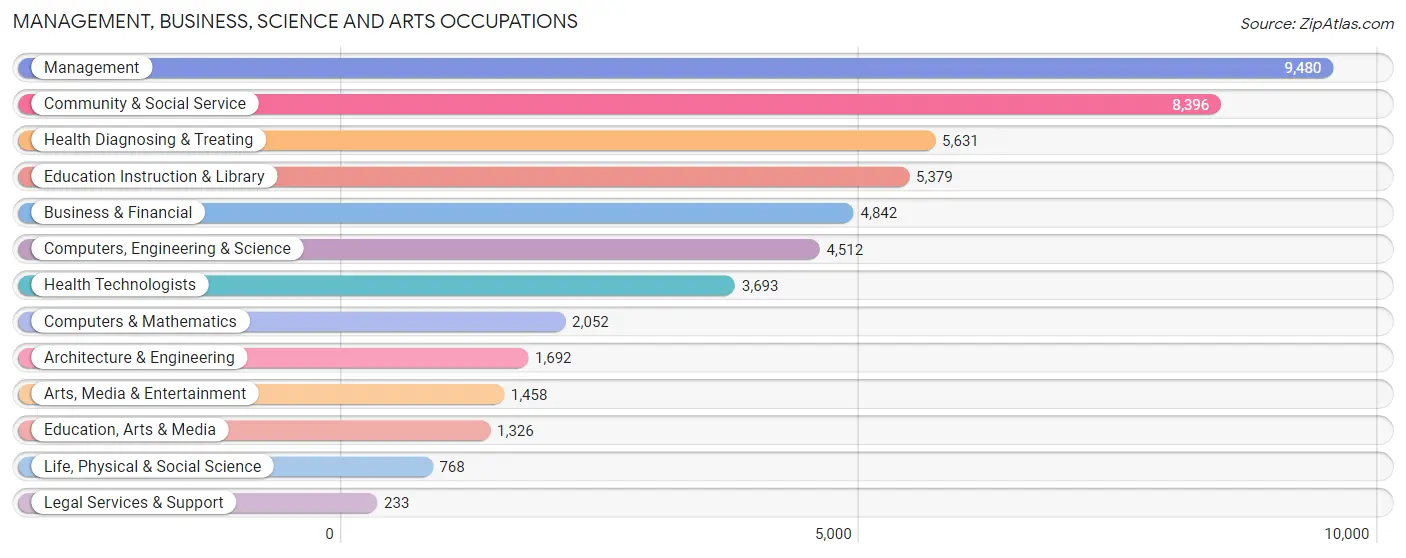
Management, Business, Science and Arts Occupations
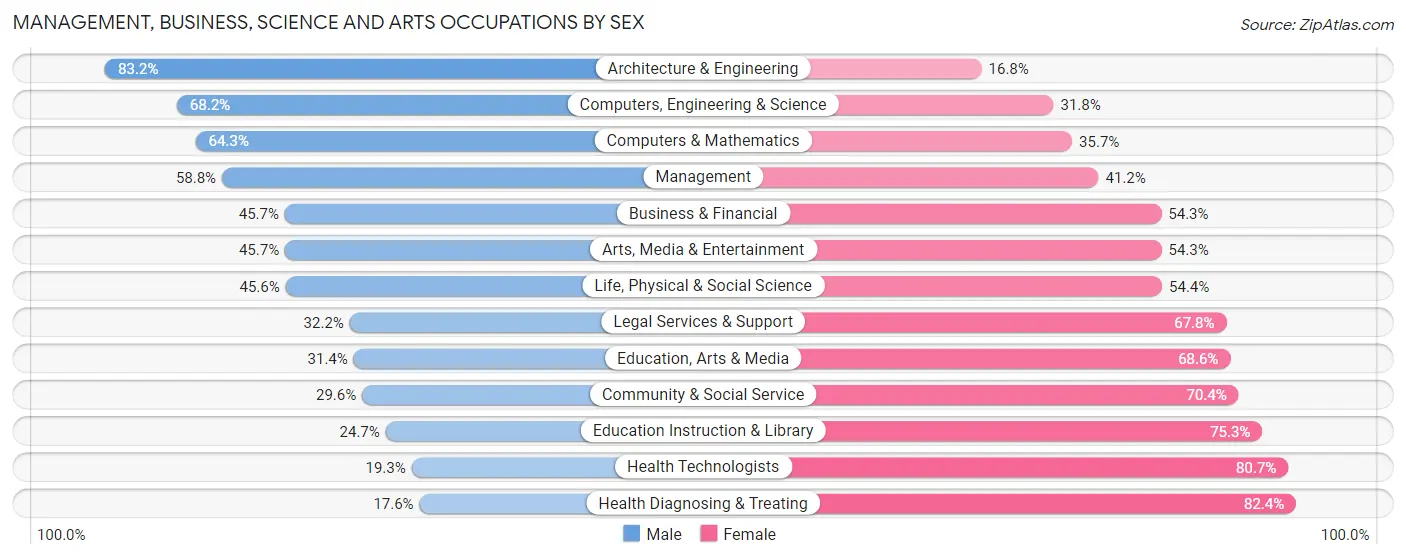
The most common Management, Business, Science and Arts occupations in Racine County are Management (9,480 | 9.9%), Community & Social Service (8,396 | 8.7%), Health Diagnosing & Treating (5,631 | 5.9%), Education Instruction & Library (5,379 | 5.6%), and Business & Financial (4,842 | 5.0%).
Management, Business, Science and Arts Occupations by Sex
Within the Management, Business, Science and Arts occupations in Racine County, the most male-oriented occupations are Architecture & Engineering (83.2%), Computers, Engineering & Science (68.2%), and Computers & Mathematics (64.3%), while the most female-oriented occupations are Health Diagnosing & Treating (82.4%), Health Technologists (80.7%), and Education Instruction & Library (75.3%).
| Occupation | Male | Female |
| Management | 5,577 (58.8%) | 3,903 (41.2%) |
| Business & Financial | 2,214 (45.7%) | 2,628 (54.3%) |
| Computers, Engineering & Science | 3,078 (68.2%) | 1,434 (31.8%) |
| Computers & Mathematics | 1,320 (64.3%) | 732 (35.7%) |
| Architecture & Engineering | 1,408 (83.2%) | 284 (16.8%) |
| Life, Physical & Social Science | 350 (45.6%) | 418 (54.4%) |
| Community & Social Service | 2,485 (29.6%) | 5,911 (70.4%) |
| Education, Arts & Media | 416 (31.4%) | 910 (68.6%) |
| Legal Services & Support | 75 (32.2%) | 158 (67.8%) |
| Education Instruction & Library | 1,328 (24.7%) | 4,051 (75.3%) |
| Arts, Media & Entertainment | 666 (45.7%) | 792 (54.3%) |
| Health Diagnosing & Treating | 993 (17.6%) | 4,638 (82.4%) |
| Health Technologists | 712 (19.3%) | 2,981 (80.7%) |
| Total (Category) | 14,347 (43.7%) | 18,514 (56.3%) |
| Total (Overall) | 50,242 (52.2%) | 46,005 (47.8%) |
Services Occupations
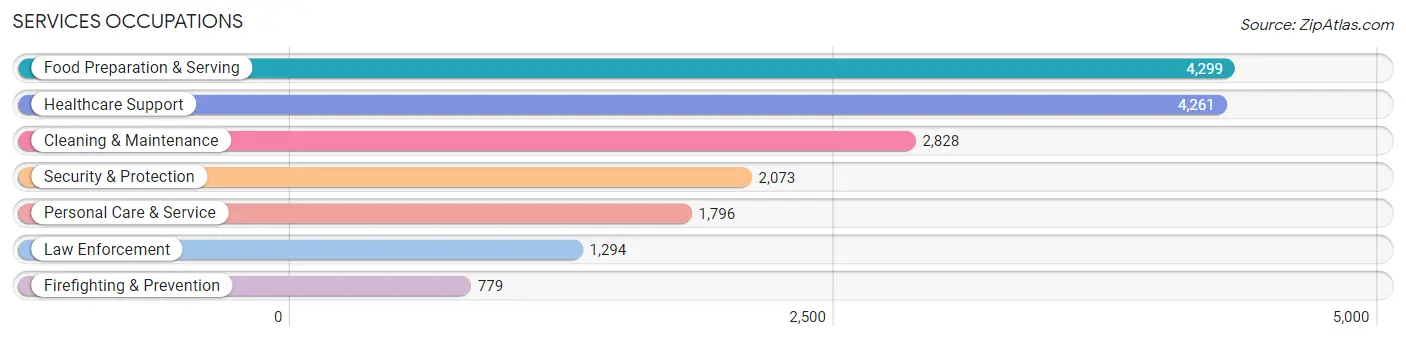
The most common Services occupations in Racine County are Food Preparation & Serving (4,299 | 4.5%), Healthcare Support (4,261 | 4.4%), Cleaning & Maintenance (2,828 | 2.9%), Security & Protection (2,073 | 2.1%), and Personal Care & Service (1,796 | 1.9%).
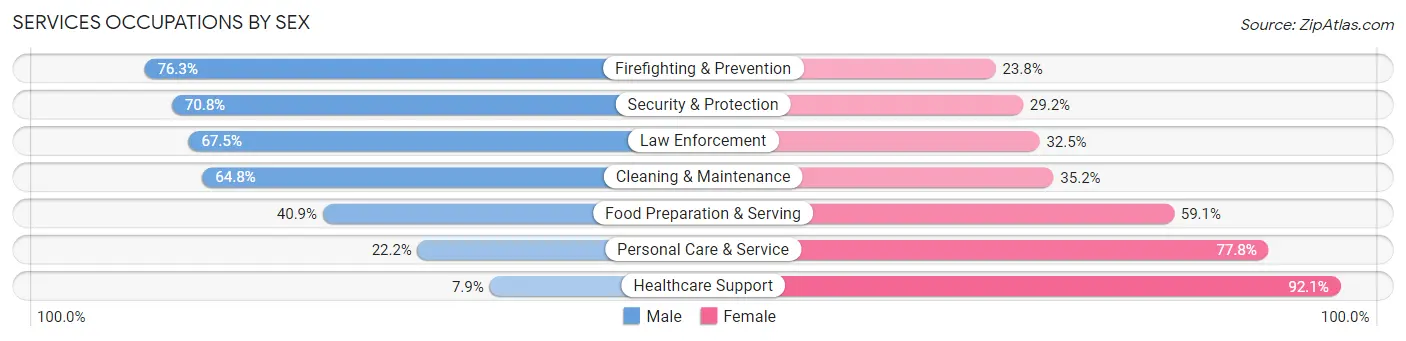
Services Occupations by Sex
Within the Services occupations in Racine County, the most male-oriented occupations are Firefighting & Prevention (76.2%), Security & Protection (70.8%), and Law Enforcement (67.5%), while the most female-oriented occupations are Healthcare Support (92.1%), Personal Care & Service (77.8%), and Food Preparation & Serving (59.1%).
| Occupation | Male | Female |
| Healthcare Support | 338 (7.9%) | 3,923 (92.1%) |
| Security & Protection | 1,468 (70.8%) | 605 (29.2%) |
| Firefighting & Prevention | 594 (76.2%) | 185 (23.7%) |
| Law Enforcement | 874 (67.5%) | 420 (32.5%) |
| Food Preparation & Serving | 1,760 (40.9%) | 2,539 (59.1%) |
| Cleaning & Maintenance | 1,832 (64.8%) | 996 (35.2%) |
| Personal Care & Service | 398 (22.2%) | 1,398 (77.8%) |
| Total (Category) | 5,796 (38.0%) | 9,461 (62.0%) |
| Total (Overall) | 50,242 (52.2%) | 46,005 (47.8%) |
Sales and Office Occupations
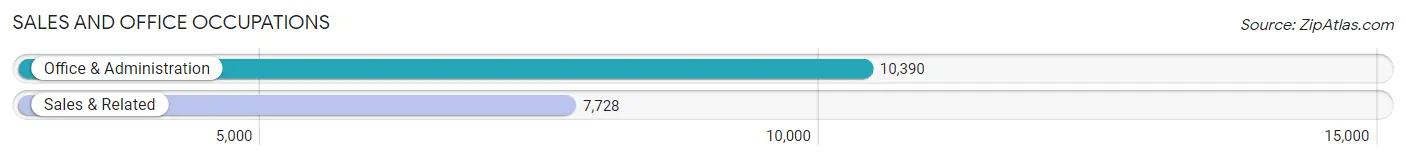
The most common Sales and Office occupations in Racine County are Office & Administration (10,390 | 10.8%), and Sales & Related (7,728 | 8.0%).
Sales and Office Occupations by Sex
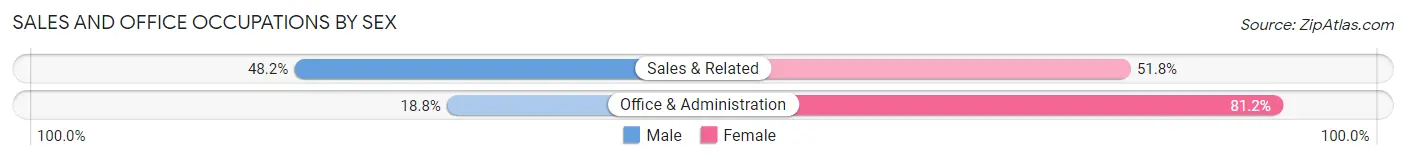
| Occupation | Male | Female |
| Sales & Related | 3,724 (48.2%) | 4,004 (51.8%) |
| Office & Administration | 1,957 (18.8%) | 8,433 (81.2%) |
| Total (Category) | 5,681 (31.4%) | 12,437 (68.6%) |
| Total (Overall) | 50,242 (52.2%) | 46,005 (47.8%) |
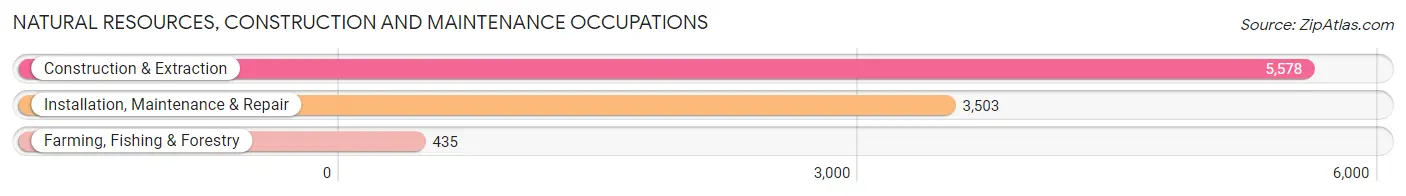
Natural Resources, Construction and Maintenance Occupations
The most common Natural Resources, Construction and Maintenance occupations in Racine County are Construction & Extraction (5,578 | 5.8%), Installation, Maintenance & Repair (3,503 | 3.6%), and Farming, Fishing & Forestry (435 | 0.4%).
Natural Resources, Construction and Maintenance Occupations by Sex
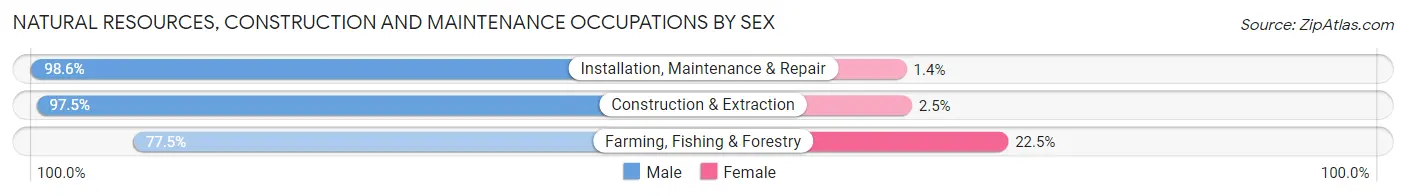
| Occupation | Male | Female |
| Farming, Fishing & Forestry | 337 (77.5%) | 98 (22.5%) |
| Construction & Extraction | 5,439 (97.5%) | 139 (2.5%) |
| Installation, Maintenance & Repair | 3,454 (98.6%) | 49 (1.4%) |
| Total (Category) | 9,230 (97.0%) | 286 (3.0%) |
| Total (Overall) | 50,242 (52.2%) | 46,005 (47.8%) |
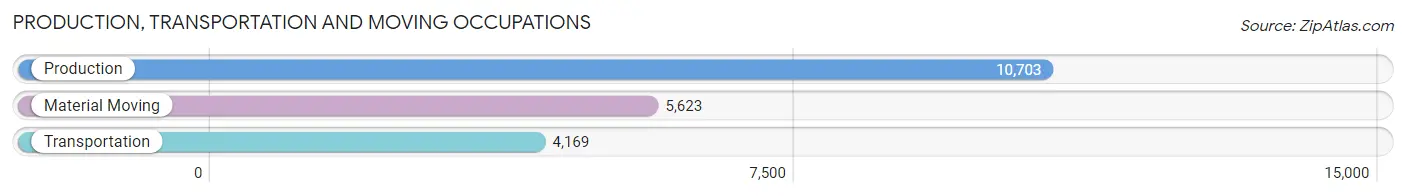
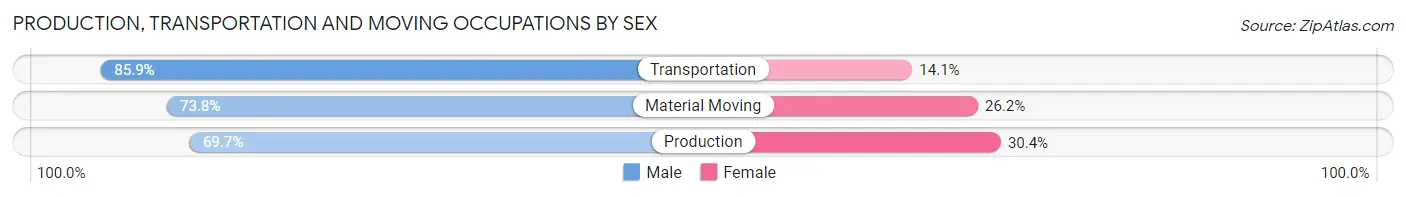
Production, Transportation and Moving Occupations
The most common Production, Transportation and Moving occupations in Racine County are Production (10,703 | 11.1%), Material Moving (5,623 | 5.8%), and Transportation (4,169 | 4.3%).
Production, Transportation and Moving Occupations by Sex
| Occupation | Male | Female |
| Production | 7,455 (69.7%) | 3,248 (30.3%) |
| Transportation | 3,581 (85.9%) | 588 (14.1%) |
| Material Moving | 4,152 (73.8%) | 1,471 (26.2%) |
| Total (Category) | 15,188 (74.1%) | 5,307 (25.9%) |
| Total (Overall) | 50,242 (52.2%) | 46,005 (47.8%) |
Employment Industries by Sex in Racine County
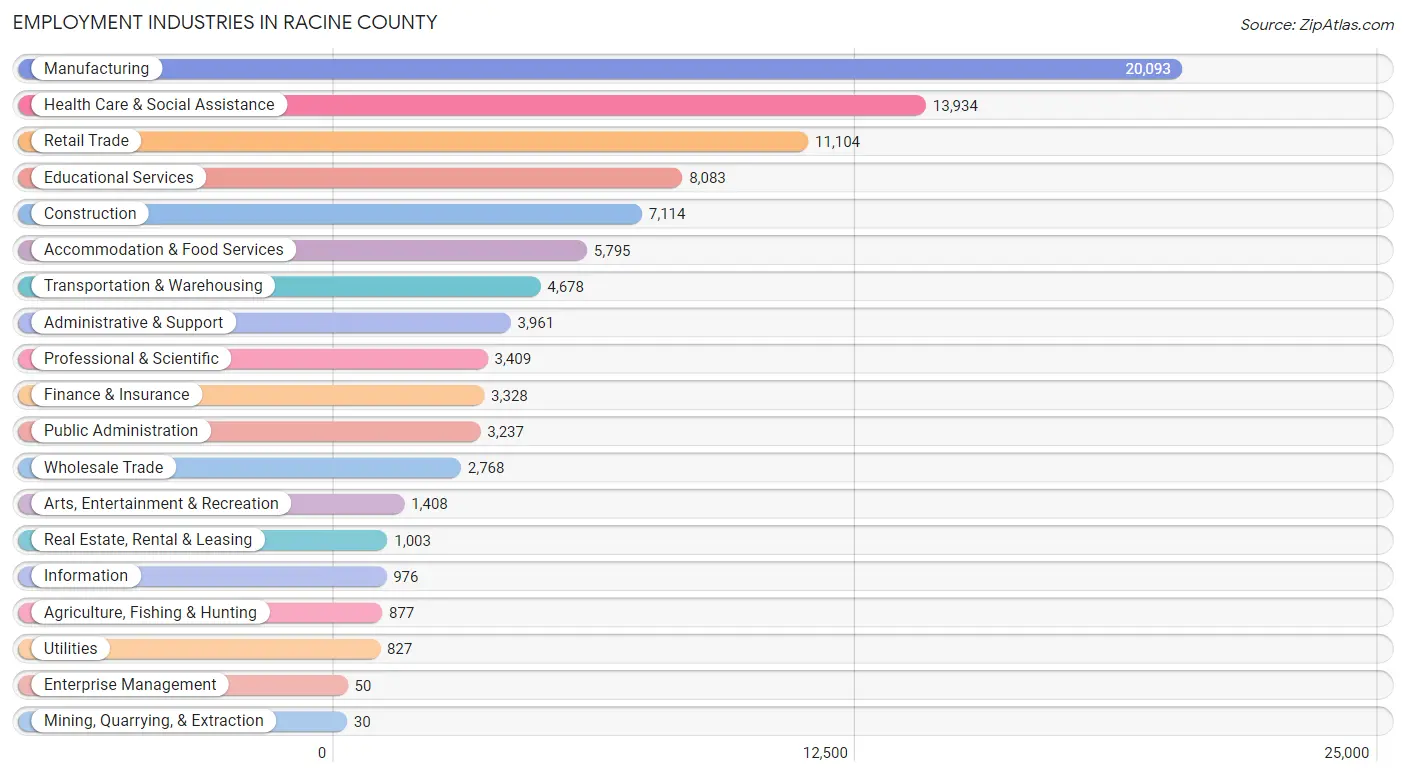
Employment Industries in Racine County
The major employment industries in Racine County include Manufacturing (20,093 | 20.9%), Health Care & Social Assistance (13,934 | 14.5%), Retail Trade (11,104 | 11.5%), Educational Services (8,083 | 8.4%), and Construction (7,114 | 7.4%).
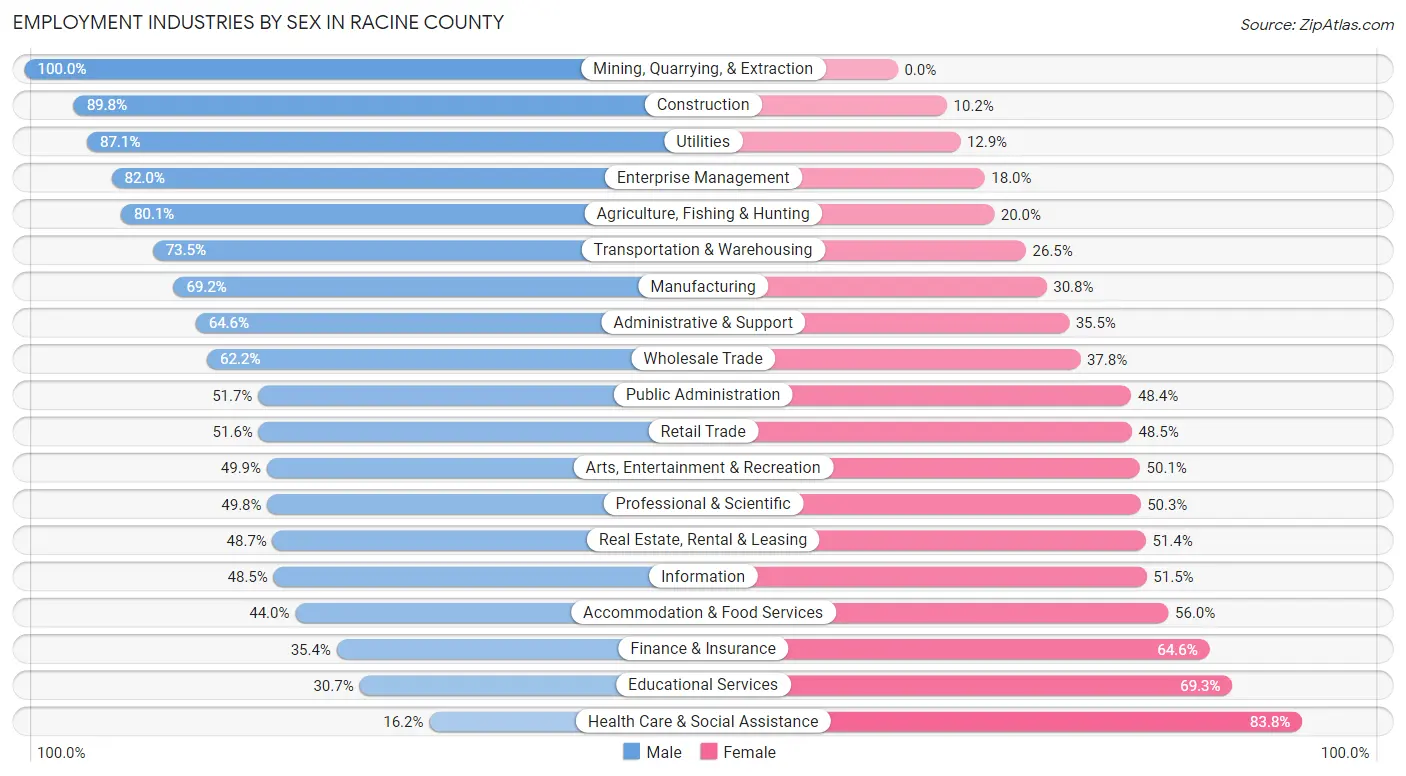
Employment Industries by Sex in Racine County
The Racine County industries that see more men than women are Mining, Quarrying, & Extraction (100.0%), Construction (89.8%), and Utilities (87.1%), whereas the industries that tend to have a higher number of women are Health Care & Social Assistance (83.8%), Educational Services (69.3%), and Finance & Insurance (64.6%).
| Industry | Male | Female |
| Agriculture, Fishing & Hunting | 702 (80.0%) | 175 (20.0%) |
| Mining, Quarrying, & Extraction | 30 (100.0%) | 0 (0.0%) |
| Construction | 6,390 (89.8%) | 724 (10.2%) |
| Manufacturing | 13,900 (69.2%) | 6,193 (30.8%) |
| Wholesale Trade | 1,722 (62.2%) | 1,046 (37.8%) |
| Retail Trade | 5,724 (51.5%) | 5,380 (48.4%) |
| Transportation & Warehousing | 3,437 (73.5%) | 1,241 (26.5%) |
| Utilities | 720 (87.1%) | 107 (12.9%) |
| Information | 473 (48.5%) | 503 (51.5%) |
| Finance & Insurance | 1,178 (35.4%) | 2,150 (64.6%) |
| Real Estate, Rental & Leasing | 488 (48.6%) | 515 (51.3%) |
| Professional & Scientific | 1,696 (49.7%) | 1,713 (50.2%) |
| Enterprise Management | 41 (82.0%) | 9 (18.0%) |
| Administrative & Support | 2,557 (64.5%) | 1,404 (35.4%) |
| Educational Services | 2,480 (30.7%) | 5,603 (69.3%) |
| Health Care & Social Assistance | 2,262 (16.2%) | 11,672 (83.8%) |
| Arts, Entertainment & Recreation | 702 (49.9%) | 706 (50.1%) |
| Accommodation & Food Services | 2,548 (44.0%) | 3,247 (56.0%) |
| Public Administration | 1,672 (51.6%) | 1,565 (48.3%) |
| Total | 50,242 (52.2%) | 46,005 (47.8%) |
Education in Racine County
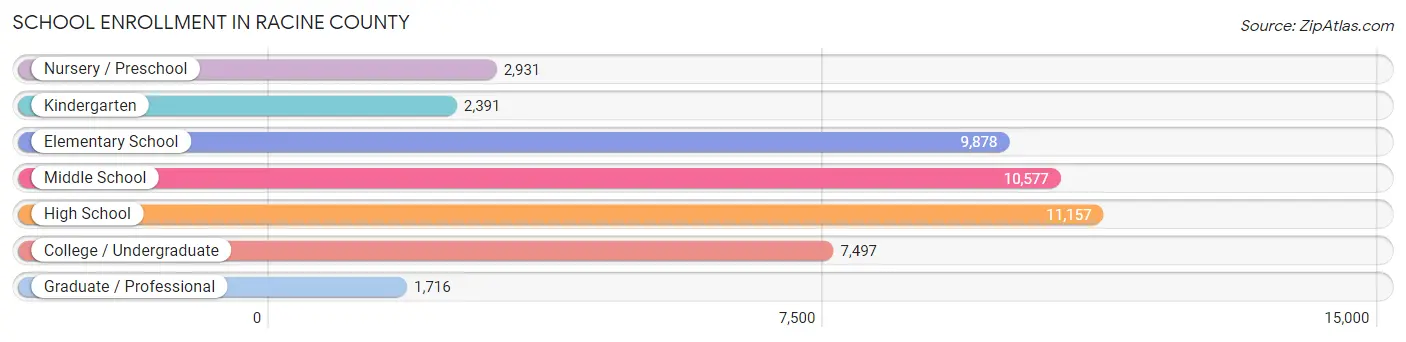
School Enrollment in Racine County
The most common levels of schooling among the 46,147 students in Racine County are high school (11,157 | 24.2%), middle school (10,577 | 22.9%), and elementary school (9,878 | 21.4%).
| School Level | # Students | % Students |
| Nursery / Preschool | 2,931 | 6.4% |
| Kindergarten | 2,391 | 5.2% |
| Elementary School | 9,878 | 21.4% |
| Middle School | 10,577 | 22.9% |
| High School | 11,157 | 24.2% |
| College / Undergraduate | 7,497 | 16.3% |
| Graduate / Professional | 1,716 | 3.7% |
| Total | 46,147 | 100.0% |
School Enrollment by Age by Funding Source in Racine County
Out of a total of 46,147 students who are enrolled in schools in Racine County, 9,460 (20.5%) attend a private institution, while the remaining 36,687 (79.5%) are enrolled in public schools. The age group of 3 to 4 year olds has the highest likelihood of being enrolled in private schools, with 904 (41.7% in the age bracket) enrolled. Conversely, the age group of 15 to 17 year olds has the lowest likelihood of being enrolled in a private school, with 7,084 (88.3% in the age bracket) attending a public institution.
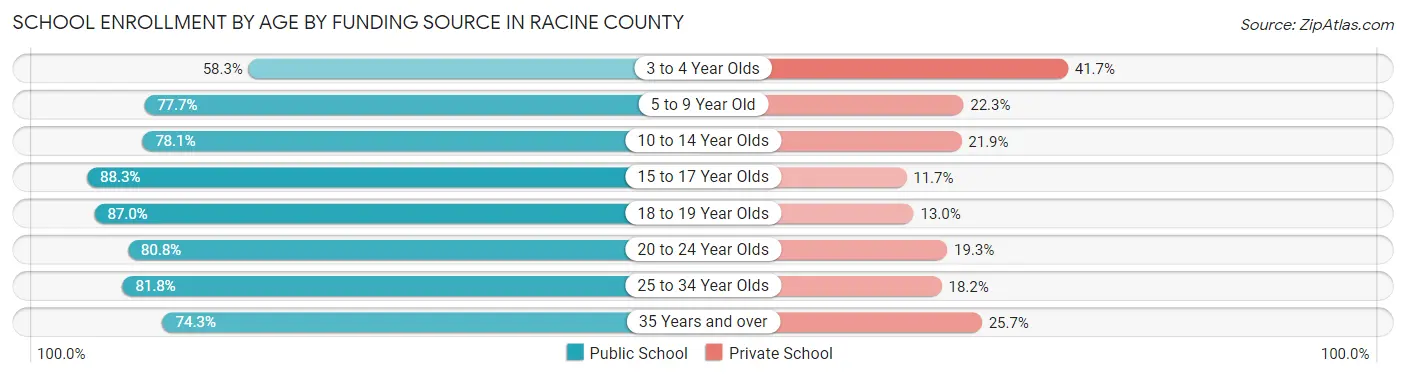
| Age Bracket | Public School | Private School |
| 3 to 4 Year Olds | 1,262 (58.3%) | 904 (41.7%) |
| 5 to 9 Year Old | 9,450 (77.7%) | 2,709 (22.3%) |
| 10 to 14 Year Olds | 9,926 (78.1%) | 2,786 (21.9%) |
| 15 to 17 Year Olds | 7,084 (88.3%) | 935 (11.7%) |
| 18 to 19 Year Olds | 2,231 (87.0%) | 334 (13.0%) |
| 20 to 24 Year Olds | 3,033 (80.7%) | 723 (19.3%) |
| 25 to 34 Year Olds | 1,722 (81.8%) | 384 (18.2%) |
| 35 Years and over | 1,979 (74.3%) | 685 (25.7%) |
| Total | 36,687 (79.5%) | 9,460 (20.5%) |
Educational Attainment by Field of Study in Racine County
Business (8,973 | 21.6%), education (6,138 | 14.8%), science & technology (4,257 | 10.3%), arts & humanities (2,995 | 7.2%), and social sciences (2,493 | 6.0%) are the most common fields of study among 41,473 individuals in Racine County who have obtained a bachelor's degree or higher.
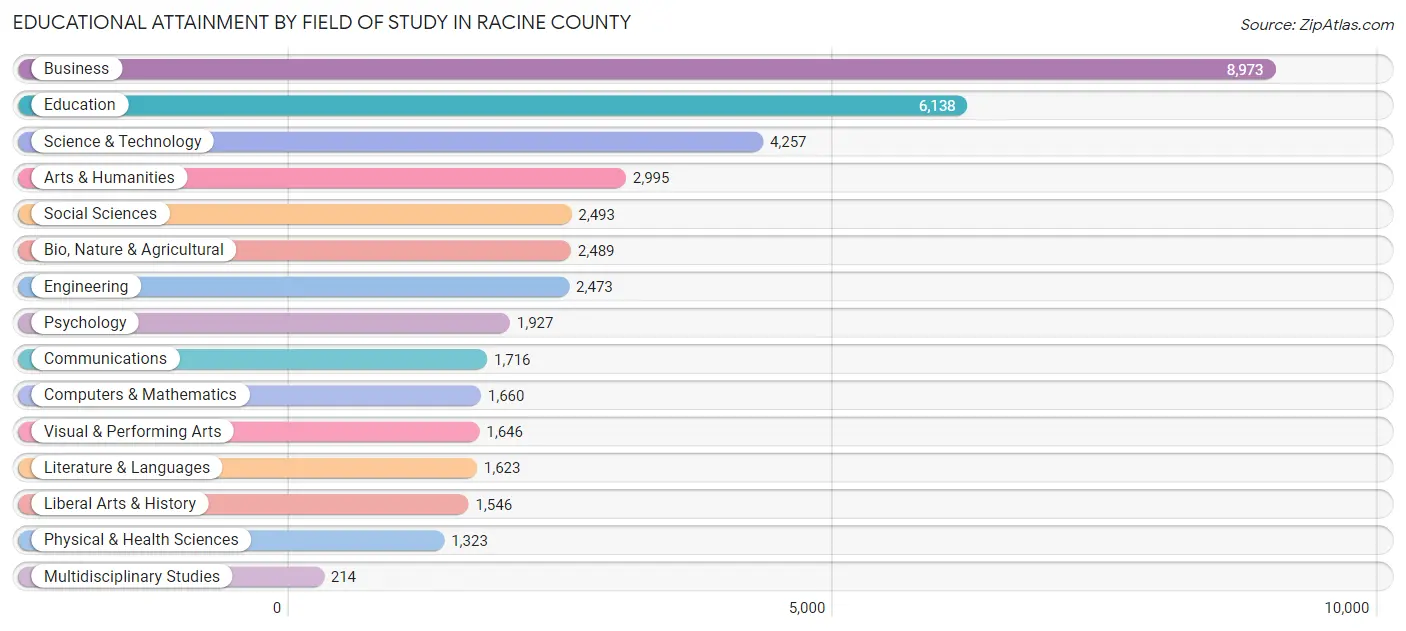
| Field of Study | # Graduates | % Graduates |
| Computers & Mathematics | 1,660 | 4.0% |
| Bio, Nature & Agricultural | 2,489 | 6.0% |
| Physical & Health Sciences | 1,323 | 3.2% |
| Psychology | 1,927 | 4.6% |
| Social Sciences | 2,493 | 6.0% |
| Engineering | 2,473 | 6.0% |
| Multidisciplinary Studies | 214 | 0.5% |
| Science & Technology | 4,257 | 10.3% |
| Business | 8,973 | 21.6% |
| Education | 6,138 | 14.8% |
| Literature & Languages | 1,623 | 3.9% |
| Liberal Arts & History | 1,546 | 3.7% |
| Visual & Performing Arts | 1,646 | 4.0% |
| Communications | 1,716 | 4.1% |
| Arts & Humanities | 2,995 | 7.2% |
| Total | 41,473 | 100.0% |
Transportation & Commute in Racine County
Vehicle Availability by Sex in Racine County
The most prevalent vehicle ownership categories in Racine County are males with 2 vehicles (21,686, accounting for 44.4%) and females with 2 vehicles (19,249, making up 47.9%).
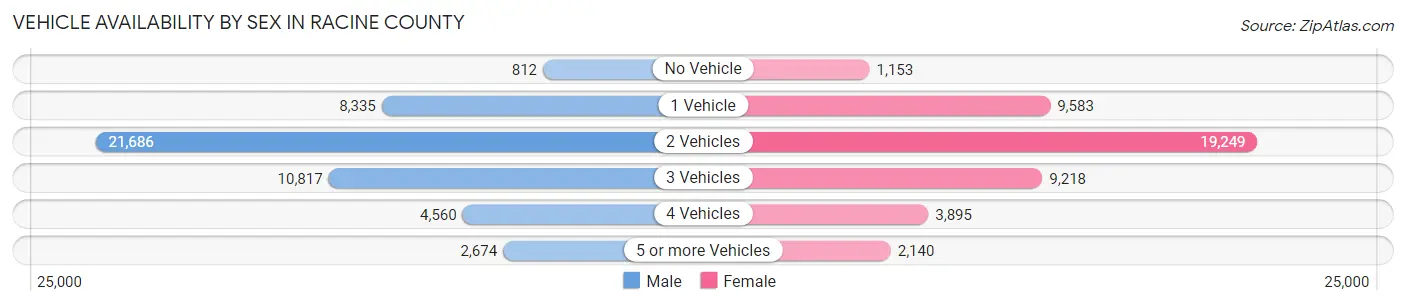
| Vehicles Available | Male | Female |
| No Vehicle | 812 (1.7%) | 1,153 (2.5%) |
| 1 Vehicle | 8,335 (17.1%) | 9,583 (21.2%) |
| 2 Vehicles | 21,686 (44.4%) | 19,249 (42.5%) |
| 3 Vehicles | 10,817 (22.1%) | 9,218 (20.4%) |
| 4 Vehicles | 4,560 (9.3%) | 3,895 (8.6%) |
| 5 or more Vehicles | 2,674 (5.5%) | 2,140 (4.7%) |
| Total | 48,884 (100.0%) | 45,238 (100.0%) |
Commute Time in Racine County
The most frequently occuring commute durations in Racine County are 10 to 14 minutes (13,323 commuters, 15.3%), 15 to 19 minutes (12,856 commuters, 14.8%), and 5 to 9 minutes (11,946 commuters, 13.8%).
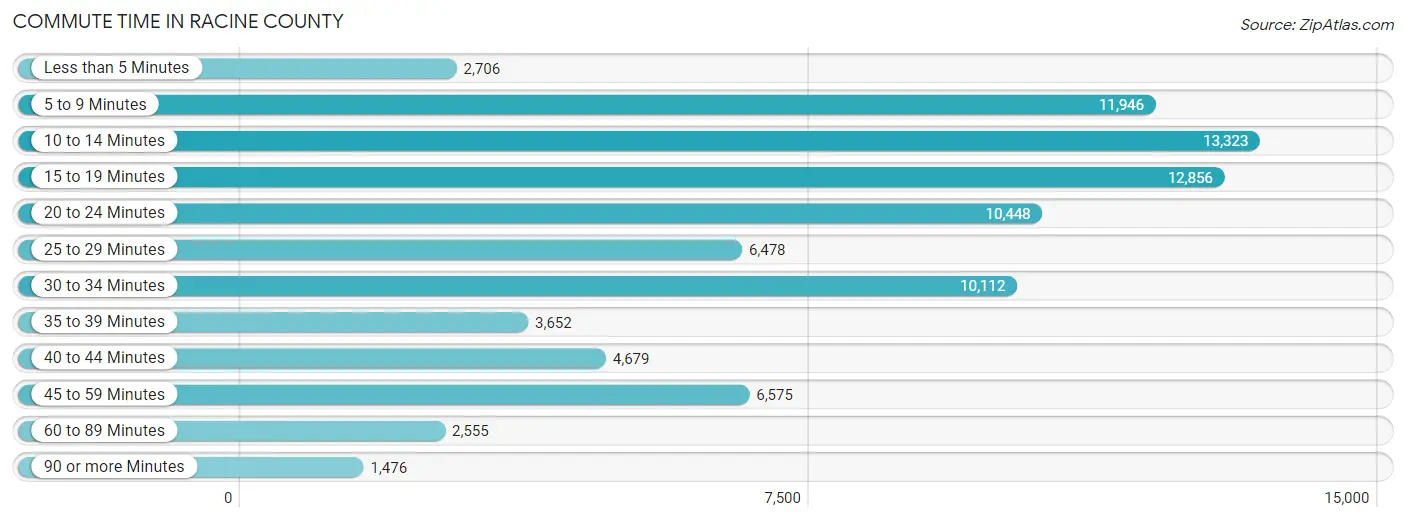
| Commute Time | # Commuters | % Commuters |
| Less than 5 Minutes | 2,706 | 3.1% |
| 5 to 9 Minutes | 11,946 | 13.8% |
| 10 to 14 Minutes | 13,323 | 15.3% |
| 15 to 19 Minutes | 12,856 | 14.8% |
| 20 to 24 Minutes | 10,448 | 12.0% |
| 25 to 29 Minutes | 6,478 | 7.5% |
| 30 to 34 Minutes | 10,112 | 11.7% |
| 35 to 39 Minutes | 3,652 | 4.2% |
| 40 to 44 Minutes | 4,679 | 5.4% |
| 45 to 59 Minutes | 6,575 | 7.6% |
| 60 to 89 Minutes | 2,555 | 2.9% |
| 90 or more Minutes | 1,476 | 1.7% |
Commute Time by Sex in Racine County
The most common commute times in Racine County are 15 to 19 minutes (6,724 commuters, 14.9%) for males and 10 to 14 minutes (7,380 commuters, 17.7%) for females.
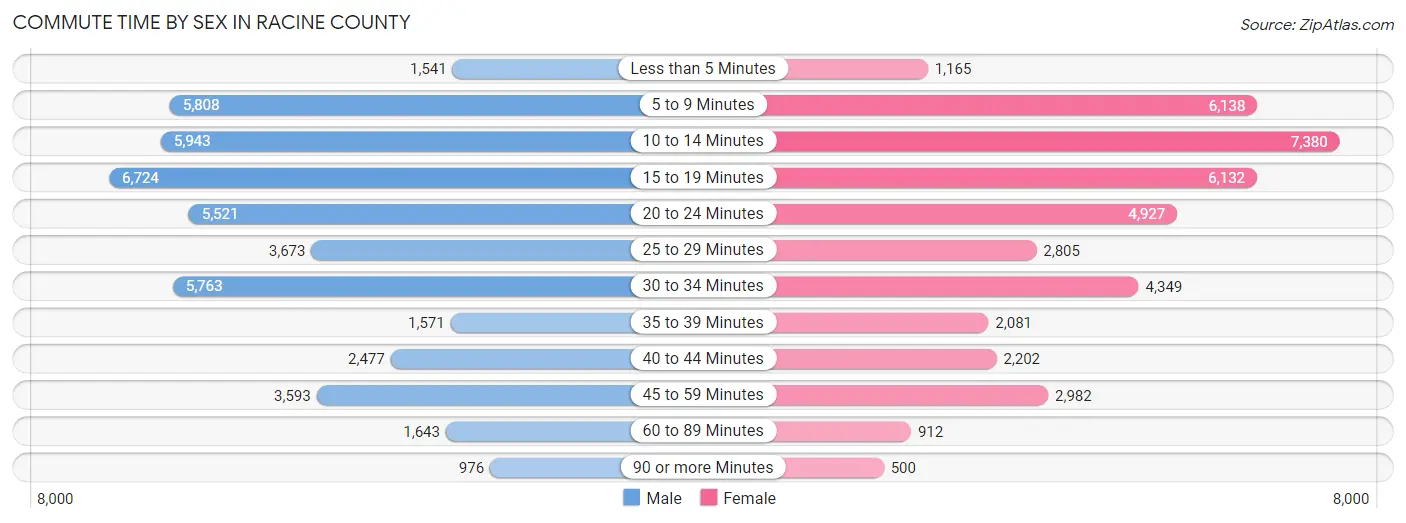
| Commute Time | Male | Female |
| Less than 5 Minutes | 1,541 (3.4%) | 1,165 (2.8%) |
| 5 to 9 Minutes | 5,808 (12.8%) | 6,138 (14.8%) |
| 10 to 14 Minutes | 5,943 (13.1%) | 7,380 (17.7%) |
| 15 to 19 Minutes | 6,724 (14.9%) | 6,132 (14.7%) |
| 20 to 24 Minutes | 5,521 (12.2%) | 4,927 (11.8%) |
| 25 to 29 Minutes | 3,673 (8.1%) | 2,805 (6.8%) |
| 30 to 34 Minutes | 5,763 (12.7%) | 4,349 (10.5%) |
| 35 to 39 Minutes | 1,571 (3.5%) | 2,081 (5.0%) |
| 40 to 44 Minutes | 2,477 (5.5%) | 2,202 (5.3%) |
| 45 to 59 Minutes | 3,593 (7.9%) | 2,982 (7.2%) |
| 60 to 89 Minutes | 1,643 (3.6%) | 912 (2.2%) |
| 90 or more Minutes | 976 (2.2%) | 500 (1.2%) |
Time of Departure to Work by Sex in Racine County
The most frequent times of departure to work in Racine County are 7:00 AM to 7:29 AM (6,713, 14.8%) for males and 7:00 AM to 7:29 AM (6,183, 14.9%) for females.
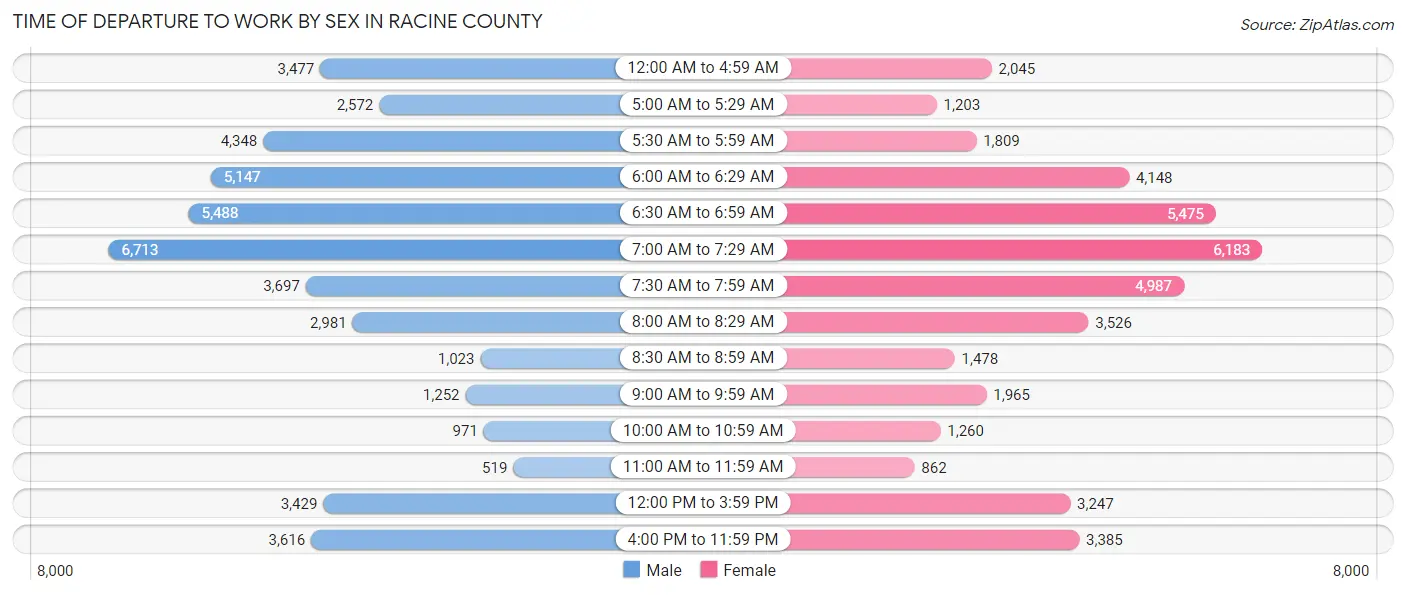
| Time of Departure | Male | Female |
| 12:00 AM to 4:59 AM | 3,477 (7.7%) | 2,045 (4.9%) |
| 5:00 AM to 5:29 AM | 2,572 (5.7%) | 1,203 (2.9%) |
| 5:30 AM to 5:59 AM | 4,348 (9.6%) | 1,809 (4.3%) |
| 6:00 AM to 6:29 AM | 5,147 (11.4%) | 4,148 (10.0%) |
| 6:30 AM to 6:59 AM | 5,488 (12.1%) | 5,475 (13.2%) |
| 7:00 AM to 7:29 AM | 6,713 (14.8%) | 6,183 (14.9%) |
| 7:30 AM to 7:59 AM | 3,697 (8.2%) | 4,987 (12.0%) |
| 8:00 AM to 8:29 AM | 2,981 (6.6%) | 3,526 (8.5%) |
| 8:30 AM to 8:59 AM | 1,023 (2.3%) | 1,478 (3.6%) |
| 9:00 AM to 9:59 AM | 1,252 (2.8%) | 1,965 (4.7%) |
| 10:00 AM to 10:59 AM | 971 (2.1%) | 1,260 (3.0%) |
| 11:00 AM to 11:59 AM | 519 (1.1%) | 862 (2.1%) |
| 12:00 PM to 3:59 PM | 3,429 (7.6%) | 3,247 (7.8%) |
| 4:00 PM to 11:59 PM | 3,616 (8.0%) | 3,385 (8.1%) |
| Total | 45,233 (100.0%) | 41,573 (100.0%) |
Housing Occupancy in Racine County
Occupancy by Ownership in Racine County
Of the total 79,100 dwellings in Racine County, owner-occupied units account for 55,341 (70.0%), while renter-occupied units make up 23,759 (30.0%).
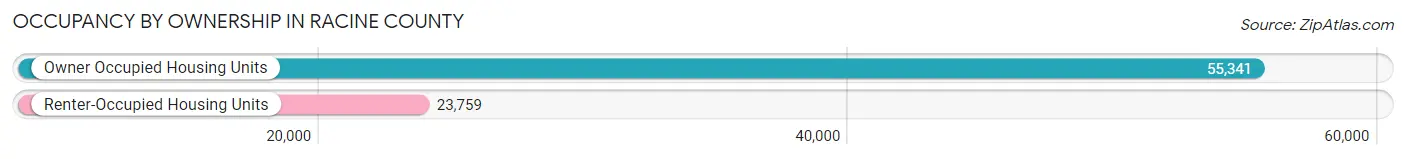
| Occupancy | # Housing Units | % Housing Units |
| Owner Occupied Housing Units | 55,341 | 70.0% |
| Renter-Occupied Housing Units | 23,759 | 30.0% |
| Total Occupied Housing Units | 79,100 | 100.0% |
Occupancy by Household Size in Racine County
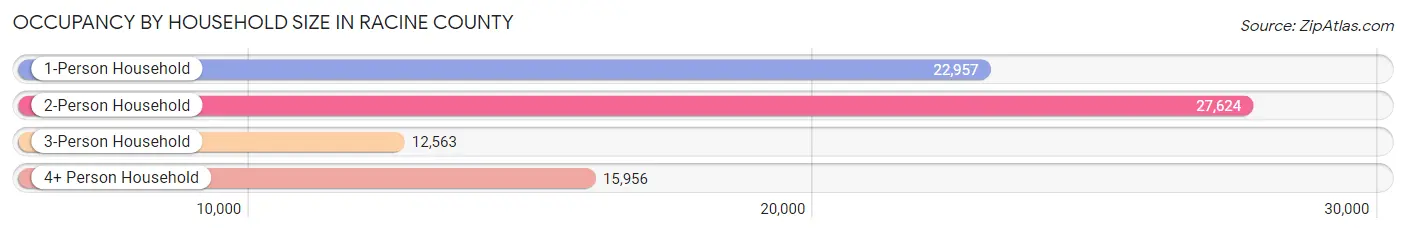
| Household Size | # Housing Units | % Housing Units |
| 1-Person Household | 22,957 | 29.0% |
| 2-Person Household | 27,624 | 34.9% |
| 3-Person Household | 12,563 | 15.9% |
| 4+ Person Household | 15,956 | 20.2% |
| Total Housing Units | 79,100 | 100.0% |
Occupancy by Ownership by Household Size in Racine County
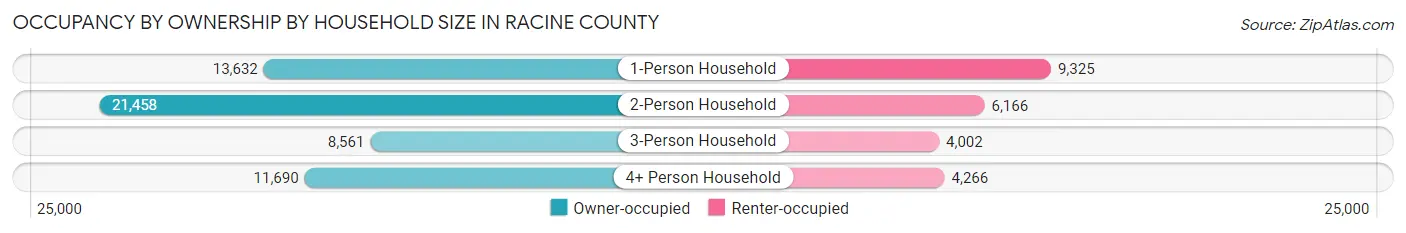
| Household Size | Owner-occupied | Renter-occupied |
| 1-Person Household | 13,632 (59.4%) | 9,325 (40.6%) |
| 2-Person Household | 21,458 (77.7%) | 6,166 (22.3%) |
| 3-Person Household | 8,561 (68.1%) | 4,002 (31.9%) |
| 4+ Person Household | 11,690 (73.3%) | 4,266 (26.7%) |
| Total Housing Units | 55,341 (70.0%) | 23,759 (30.0%) |
Occupancy by Educational Attainment in Racine County
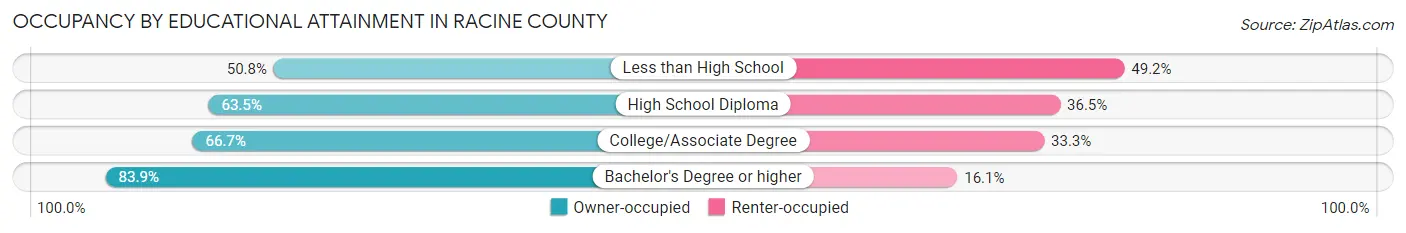
| Household Size | Owner-occupied | Renter-occupied |
| Less than High School | 3,035 (50.8%) | 2,941 (49.2%) |
| High School Diploma | 13,132 (63.5%) | 7,538 (36.5%) |
| College/Associate Degree | 18,771 (66.7%) | 9,371 (33.3%) |
| Bachelor's Degree or higher | 20,403 (83.9%) | 3,909 (16.1%) |
Occupancy by Age of Householder in Racine County
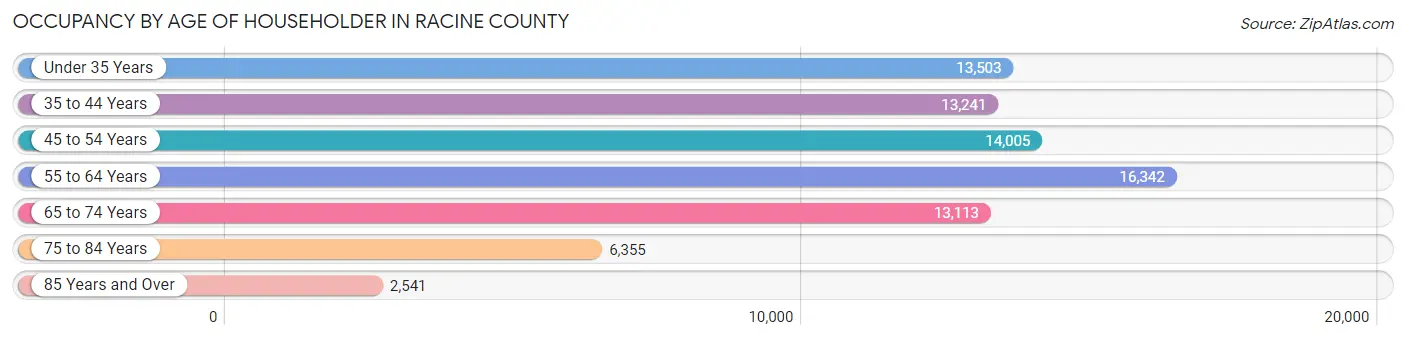
| Age Bracket | # Households | % Households |
| Under 35 Years | 13,503 | 17.1% |
| 35 to 44 Years | 13,241 | 16.7% |
| 45 to 54 Years | 14,005 | 17.7% |
| 55 to 64 Years | 16,342 | 20.7% |
| 65 to 74 Years | 13,113 | 16.6% |
| 75 to 84 Years | 6,355 | 8.0% |
| 85 Years and Over | 2,541 | 3.2% |
| Total | 79,100 | 100.0% |
Housing Finances in Racine County
Median Income by Occupancy in Racine County
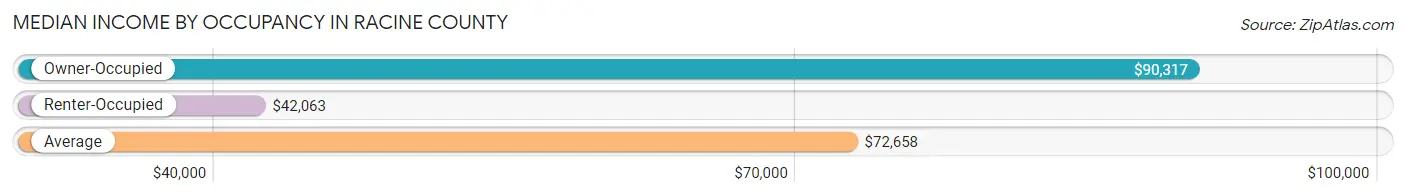
| Occupancy Type | # Households | Median Income |
| Owner-Occupied | 55,341 (70.0%) | $90,317 |
| Renter-Occupied | 23,759 (30.0%) | $42,063 |
| Average | 79,100 (100.0%) | $72,658 |
Occupancy by Householder Income Bracket in Racine County
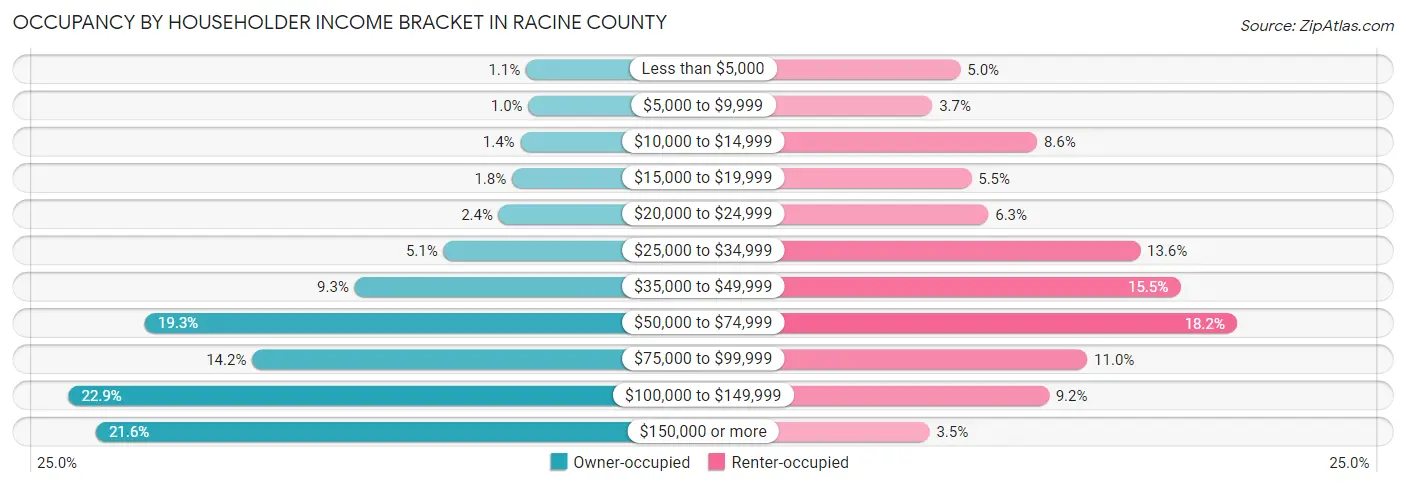
| Income Bracket | Owner-occupied | Renter-occupied |
| Less than $5,000 | 622 (1.1%) | 1,185 (5.0%) |
| $5,000 to $9,999 | 558 (1.0%) | 867 (3.6%) |
| $10,000 to $14,999 | 769 (1.4%) | 2,052 (8.6%) |
| $15,000 to $19,999 | 992 (1.8%) | 1,310 (5.5%) |
| $20,000 to $24,999 | 1,339 (2.4%) | 1,502 (6.3%) |
| $25,000 to $34,999 | 2,795 (5.1%) | 3,219 (13.6%) |
| $35,000 to $49,999 | 5,138 (9.3%) | 3,670 (15.4%) |
| $50,000 to $74,999 | 10,662 (19.3%) | 4,312 (18.1%) |
| $75,000 to $99,999 | 7,835 (14.2%) | 2,620 (11.0%) |
| $100,000 to $149,999 | 12,680 (22.9%) | 2,185 (9.2%) |
| $150,000 or more | 11,951 (21.6%) | 837 (3.5%) |
| Total | 55,341 (100.0%) | 23,759 (100.0%) |
Monthly Housing Cost Tiers in Racine County
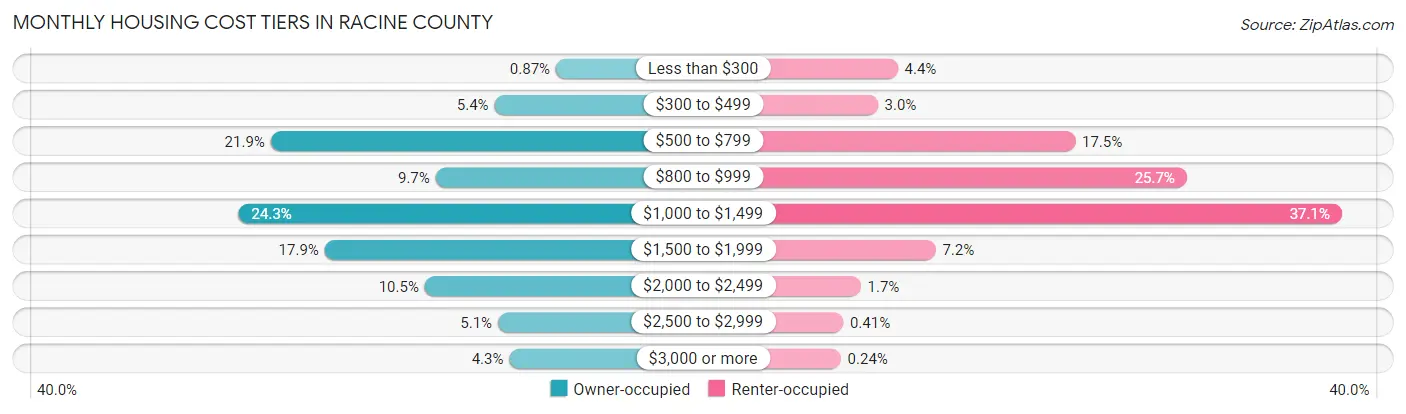
| Monthly Cost | Owner-occupied | Renter-occupied |
| Less than $300 | 482 (0.9%) | 1,052 (4.4%) |
| $300 to $499 | 2,990 (5.4%) | 704 (3.0%) |
| $500 to $799 | 12,107 (21.9%) | 4,157 (17.5%) |
| $800 to $999 | 5,386 (9.7%) | 6,111 (25.7%) |
| $1,000 to $1,499 | 13,420 (24.2%) | 8,823 (37.1%) |
| $1,500 to $1,999 | 9,906 (17.9%) | 1,716 (7.2%) |
| $2,000 to $2,499 | 5,828 (10.5%) | 406 (1.7%) |
| $2,500 to $2,999 | 2,842 (5.1%) | 98 (0.4%) |
| $3,000 or more | 2,380 (4.3%) | 56 (0.2%) |
| Total | 55,341 (100.0%) | 23,759 (100.0%) |
Physical Housing Characteristics in Racine County
Housing Structures in Racine County
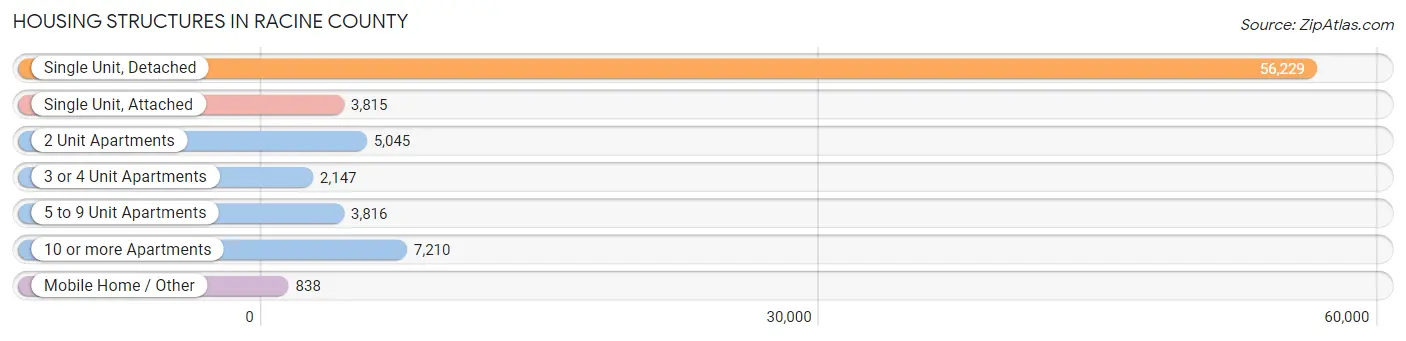
| Structure Type | # Housing Units | % Housing Units |
| Single Unit, Detached | 56,229 | 71.1% |
| Single Unit, Attached | 3,815 | 4.8% |
| 2 Unit Apartments | 5,045 | 6.4% |
| 3 or 4 Unit Apartments | 2,147 | 2.7% |
| 5 to 9 Unit Apartments | 3,816 | 4.8% |
| 10 or more Apartments | 7,210 | 9.1% |
| Mobile Home / Other | 838 | 1.1% |
| Total | 79,100 | 100.0% |
Housing Structures by Occupancy in Racine County
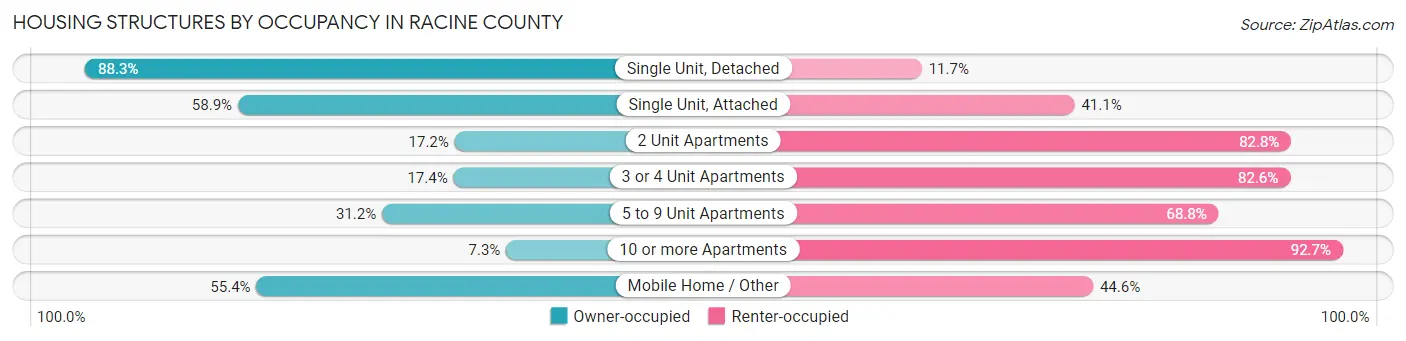
| Structure Type | Owner-occupied | Renter-occupied |
| Single Unit, Detached | 49,672 (88.3%) | 6,557 (11.7%) |
| Single Unit, Attached | 2,248 (58.9%) | 1,567 (41.1%) |
| 2 Unit Apartments | 868 (17.2%) | 4,177 (82.8%) |
| 3 or 4 Unit Apartments | 374 (17.4%) | 1,773 (82.6%) |
| 5 to 9 Unit Apartments | 1,190 (31.2%) | 2,626 (68.8%) |
| 10 or more Apartments | 525 (7.3%) | 6,685 (92.7%) |
| Mobile Home / Other | 464 (55.4%) | 374 (44.6%) |
| Total | 55,341 (70.0%) | 23,759 (30.0%) |
Housing Structures by Number of Rooms in Racine County
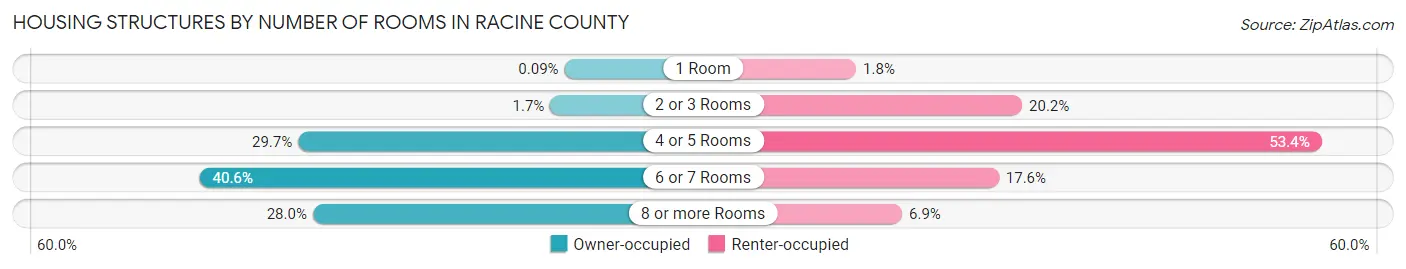
| Number of Rooms | Owner-occupied | Renter-occupied |
| 1 Room | 48 (0.1%) | 427 (1.8%) |
| 2 or 3 Rooms | 926 (1.7%) | 4,805 (20.2%) |
| 4 or 5 Rooms | 16,409 (29.6%) | 12,696 (53.4%) |
| 6 or 7 Rooms | 22,451 (40.6%) | 4,191 (17.6%) |
| 8 or more Rooms | 15,507 (28.0%) | 1,640 (6.9%) |
| Total | 55,341 (100.0%) | 23,759 (100.0%) |
Housing Structure by Heating Type in Racine County
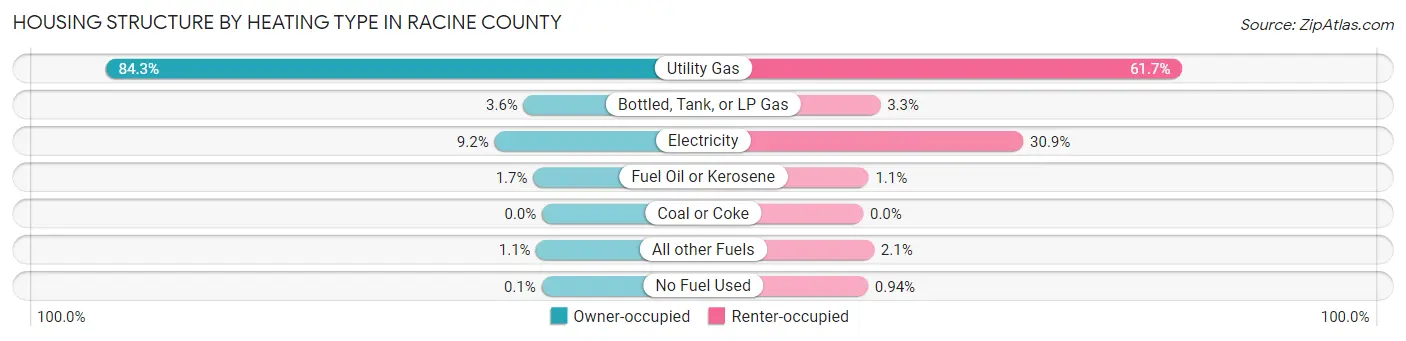
| Heating Type | Owner-occupied | Renter-occupied |
| Utility Gas | 46,675 (84.3%) | 14,651 (61.7%) |
| Bottled, Tank, or LP Gas | 1,970 (3.6%) | 787 (3.3%) |
| Electricity | 5,092 (9.2%) | 7,349 (30.9%) |
| Fuel Oil or Kerosene | 942 (1.7%) | 249 (1.1%) |
| Coal or Coke | 0 (0.0%) | 0 (0.0%) |
| All other Fuels | 607 (1.1%) | 499 (2.1%) |
| No Fuel Used | 55 (0.1%) | 224 (0.9%) |
| Total | 55,341 (100.0%) | 23,759 (100.0%) |
Household Vehicle Usage in Racine County
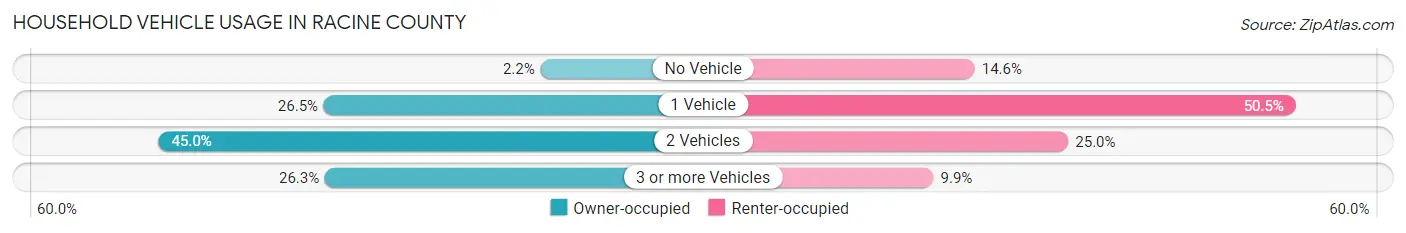
| Vehicles per Household | Owner-occupied | Renter-occupied |
| No Vehicle | 1,215 (2.2%) | 3,457 (14.5%) |
| 1 Vehicle | 14,647 (26.5%) | 11,996 (50.5%) |
| 2 Vehicles | 24,901 (45.0%) | 5,946 (25.0%) |
| 3 or more Vehicles | 14,578 (26.3%) | 2,360 (9.9%) |
| Total | 55,341 (100.0%) | 23,759 (100.0%) |
Real Estate & Mortgages in Racine County
Real Estate and Mortgage Overview in Racine County
| Characteristic | Without Mortgage | With Mortgage |
| Housing Units | 18,997 | 36,344 |
| Median Property Value | $208,900 | $236,500 |
| Median Household Income | $67,901 | $9,111 |
| Monthly Housing Costs | $659 | $2,351 |
| Real Estate Taxes | $3,832 | $242 |
Property Value by Mortgage Status in Racine County
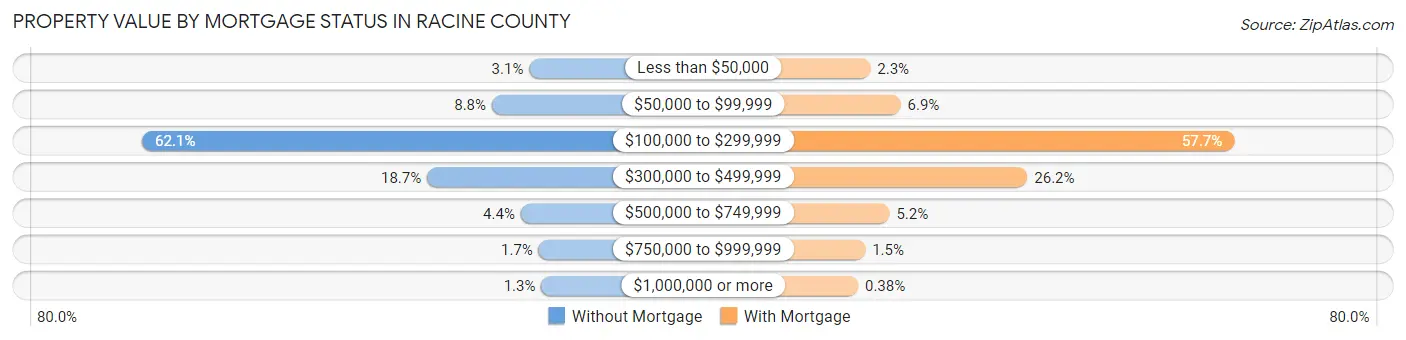
| Property Value | Without Mortgage | With Mortgage |
| Less than $50,000 | 589 (3.1%) | 818 (2.2%) |
| $50,000 to $99,999 | 1,672 (8.8%) | 2,496 (6.9%) |
| $100,000 to $299,999 | 11,798 (62.1%) | 20,962 (57.7%) |
| $300,000 to $499,999 | 3,546 (18.7%) | 9,516 (26.2%) |
| $500,000 to $749,999 | 836 (4.4%) | 1,880 (5.2%) |
| $750,000 to $999,999 | 315 (1.7%) | 533 (1.5%) |
| $1,000,000 or more | 241 (1.3%) | 139 (0.4%) |
| Total | 18,997 (100.0%) | 36,344 (100.0%) |
Household Income by Mortgage Status in Racine County
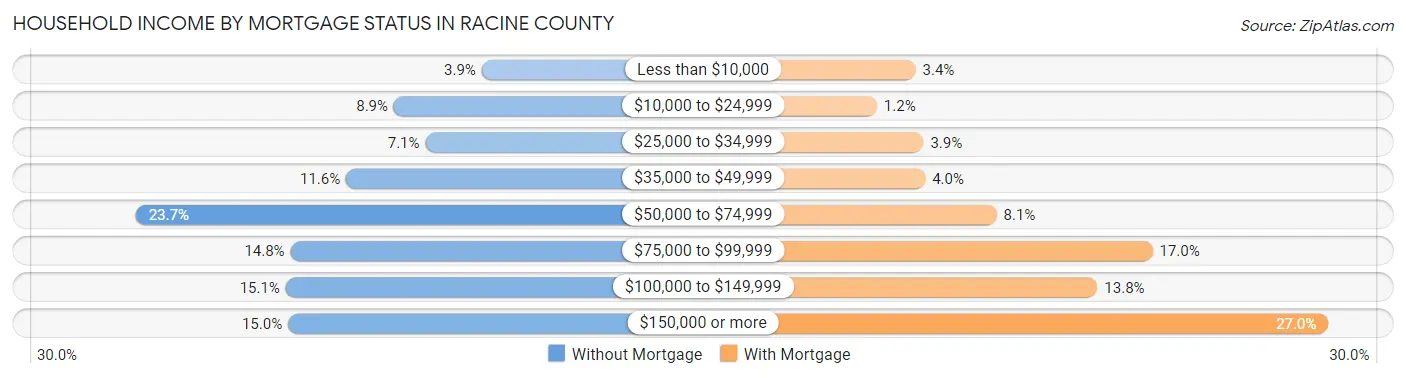
| Household Income | Without Mortgage | With Mortgage |
| Less than $10,000 | 737 (3.9%) | 1,248 (3.4%) |
| $10,000 to $24,999 | 1,690 (8.9%) | 443 (1.2%) |
| $25,000 to $34,999 | 1,348 (7.1%) | 1,410 (3.9%) |
| $35,000 to $49,999 | 2,210 (11.6%) | 1,447 (4.0%) |
| $50,000 to $74,999 | 4,493 (23.6%) | 2,928 (8.1%) |
| $75,000 to $99,999 | 2,814 (14.8%) | 6,169 (17.0%) |
| $100,000 to $149,999 | 2,865 (15.1%) | 5,021 (13.8%) |
| $150,000 or more | 2,840 (14.9%) | 9,815 (27.0%) |
| Total | 18,997 (100.0%) | 36,344 (100.0%) |
Property Value to Household Income Ratio in Racine County
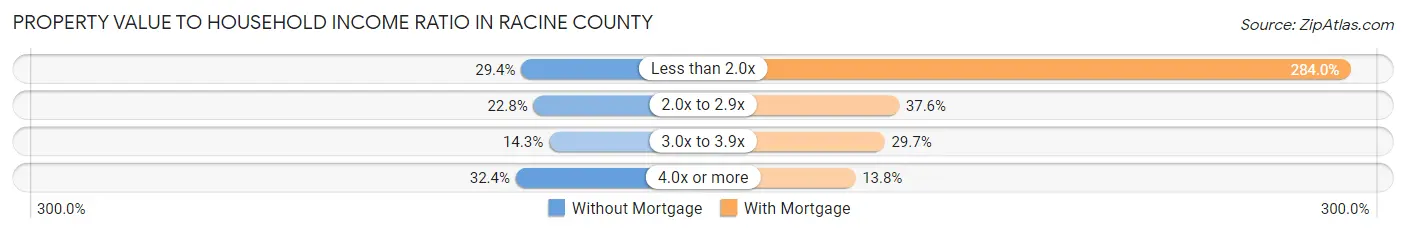
| Value-to-Income Ratio | Without Mortgage | With Mortgage |
| Less than 2.0x | 5,582 (29.4%) | 103,208 (284.0%) |
| 2.0x to 2.9x | 4,321 (22.8%) | 13,649 (37.6%) |
| 3.0x to 3.9x | 2,717 (14.3%) | 10,806 (29.7%) |
| 4.0x or more | 6,150 (32.4%) | 5,002 (13.8%) |
| Total | 18,997 (100.0%) | 36,344 (100.0%) |
Real Estate Taxes by Mortgage Status in Racine County
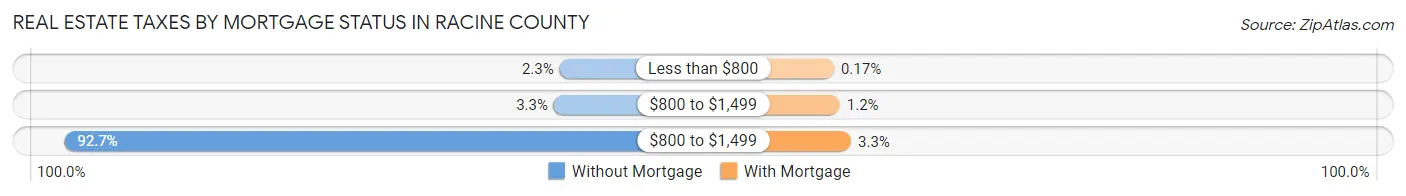
| Property Taxes | Without Mortgage | With Mortgage |
| Less than $800 | 436 (2.3%) | 61 (0.2%) |
| $800 to $1,499 | 634 (3.3%) | 452 (1.2%) |
| $800 to $1,499 | 17,614 (92.7%) | 1,198 (3.3%) |
| Total | 18,997 (100.0%) | 36,344 (100.0%) |
Health & Disability in Racine County
Health Insurance Coverage by Age in Racine County
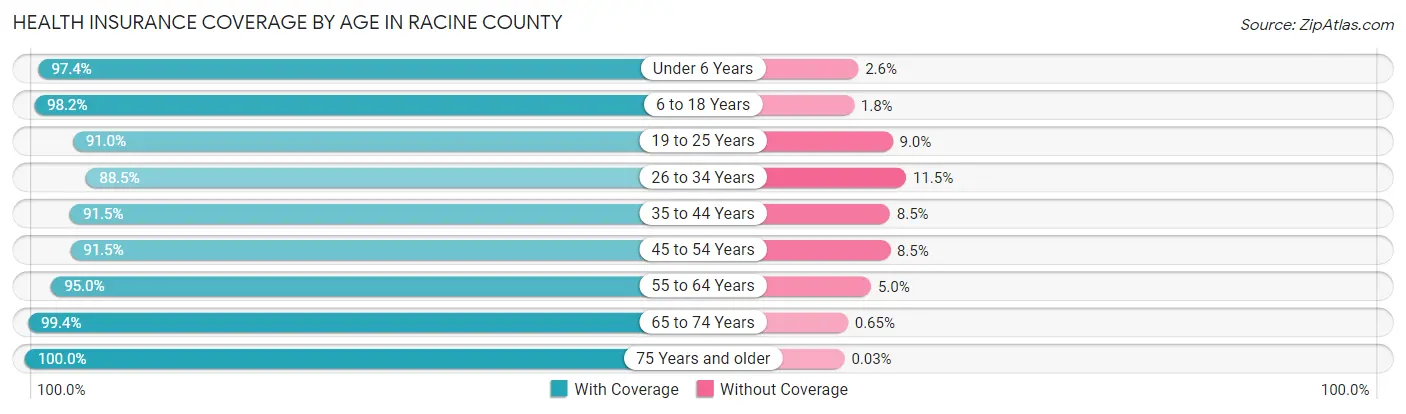
| Age Bracket | With Coverage | Without Coverage |
| Under 6 Years | 13,413 (97.4%) | 356 (2.6%) |
| 6 to 18 Years | 33,620 (98.2%) | 609 (1.8%) |
| 19 to 25 Years | 13,871 (91.0%) | 1,371 (9.0%) |
| 26 to 34 Years | 18,154 (88.5%) | 2,362 (11.5%) |
| 35 to 44 Years | 21,141 (91.5%) | 1,962 (8.5%) |
| 45 to 54 Years | 22,578 (91.5%) | 2,104 (8.5%) |
| 55 to 64 Years | 26,915 (95.0%) | 1,407 (5.0%) |
| 65 to 74 Years | 19,790 (99.4%) | 129 (0.6%) |
| 75 Years and older | 12,819 (100.0%) | 4 (0.0%) |
| Total | 182,301 (94.7%) | 10,304 (5.3%) |
Health Insurance Coverage by Citizenship Status in Racine County
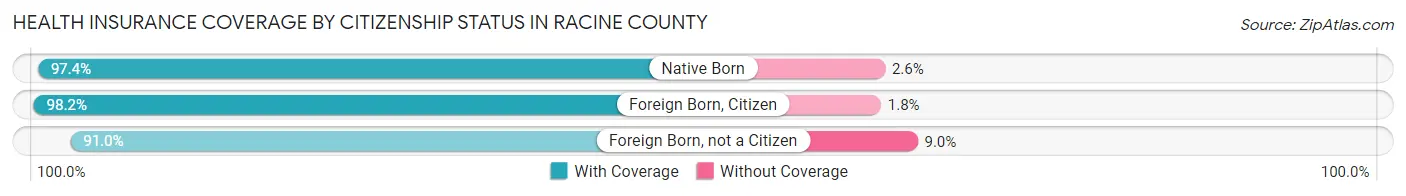
| Citizenship Status | With Coverage | Without Coverage |
| Native Born | 13,413 (97.4%) | 356 (2.6%) |
| Foreign Born, Citizen | 33,620 (98.2%) | 609 (1.8%) |
| Foreign Born, not a Citizen | 13,871 (91.0%) | 1,371 (9.0%) |
Health Insurance Coverage by Household Income in Racine County
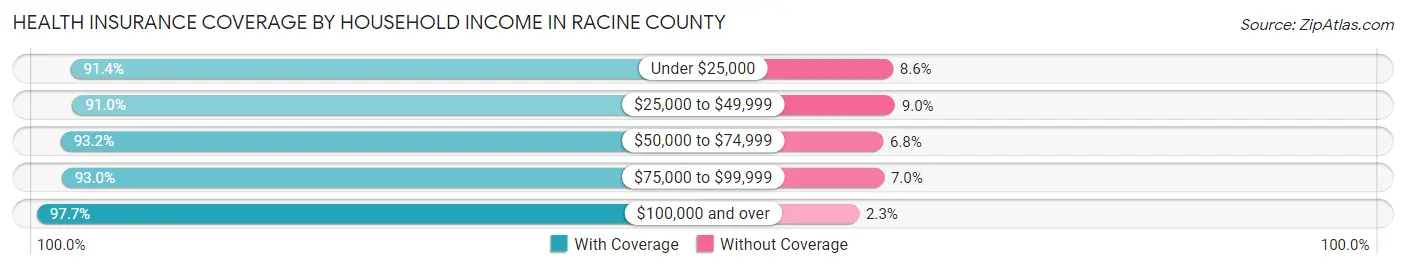
| Household Income | With Coverage | Without Coverage |
| Under $25,000 | 17,994 (91.4%) | 1,699 (8.6%) |
| $25,000 to $49,999 | 25,375 (91.0%) | 2,511 (9.0%) |
| $50,000 to $74,999 | 31,510 (93.2%) | 2,293 (6.8%) |
| $75,000 to $99,999 | 24,674 (93.0%) | 1,847 (7.0%) |
| $100,000 and over | 81,965 (97.7%) | 1,935 (2.3%) |
Public vs Private Health Insurance Coverage by Age in Racine County
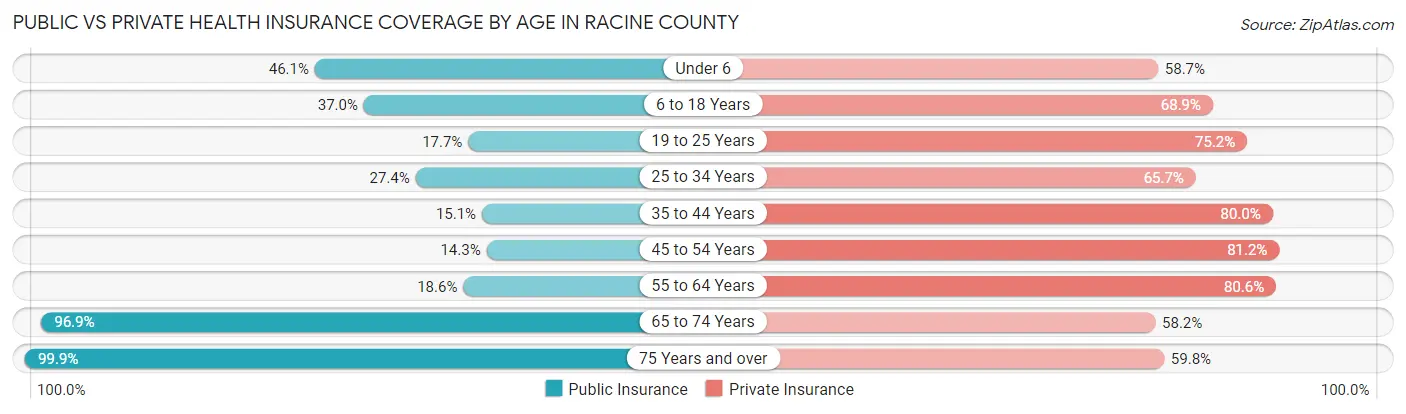
| Age Bracket | Public Insurance | Private Insurance |
| Under 6 | 6,353 (46.1%) | 8,078 (58.7%) |
| 6 to 18 Years | 12,680 (37.0%) | 23,572 (68.9%) |
| 19 to 25 Years | 2,691 (17.7%) | 11,467 (75.2%) |
| 25 to 34 Years | 5,628 (27.4%) | 13,474 (65.7%) |
| 35 to 44 Years | 3,490 (15.1%) | 18,476 (80.0%) |
| 45 to 54 Years | 3,521 (14.3%) | 20,037 (81.2%) |
| 55 to 64 Years | 5,262 (18.6%) | 22,827 (80.6%) |
| 65 to 74 Years | 19,299 (96.9%) | 11,585 (58.2%) |
| 75 Years and over | 12,813 (99.9%) | 7,667 (59.8%) |
| Total | 71,737 (37.2%) | 137,183 (71.2%) |
Disability Status by Sex by Age in Racine County
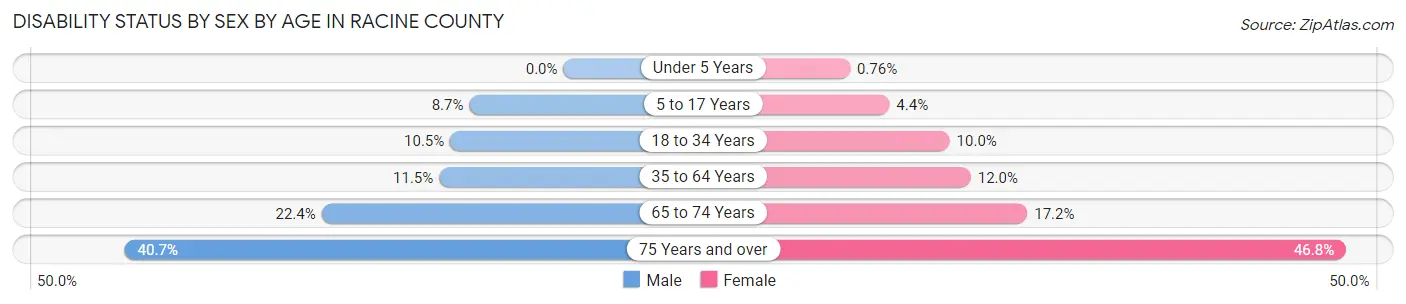
| Age Bracket | Male | Female |
| Under 5 Years | 0 (0.0%) | 42 (0.8%) |
| 5 to 17 Years | 1,498 (8.7%) | 738 (4.4%) |
| 18 to 34 Years | 2,048 (10.5%) | 1,912 (10.0%) |
| 35 to 64 Years | 4,334 (11.5%) | 4,608 (12.0%) |
| 65 to 74 Years | 2,134 (22.4%) | 1,792 (17.2%) |
| 75 Years and over | 2,111 (40.7%) | 3,574 (46.8%) |
Disability Class by Sex by Age in Racine County
Disability Class: Hearing Difficulty
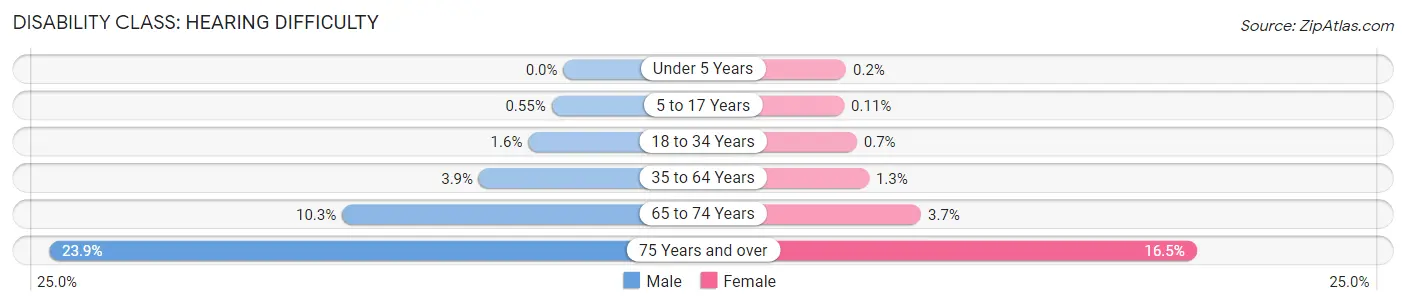
| Age Bracket | Male | Female |
| Under 5 Years | 0 (0.0%) | 11 (0.2%) |
| 5 to 17 Years | 95 (0.5%) | 18 (0.1%) |
| 18 to 34 Years | 318 (1.6%) | 134 (0.7%) |
| 35 to 64 Years | 1,474 (3.9%) | 487 (1.3%) |
| 65 to 74 Years | 977 (10.3%) | 383 (3.7%) |
| 75 Years and over | 1,237 (23.9%) | 1,257 (16.5%) |
Disability Class: Vision Difficulty
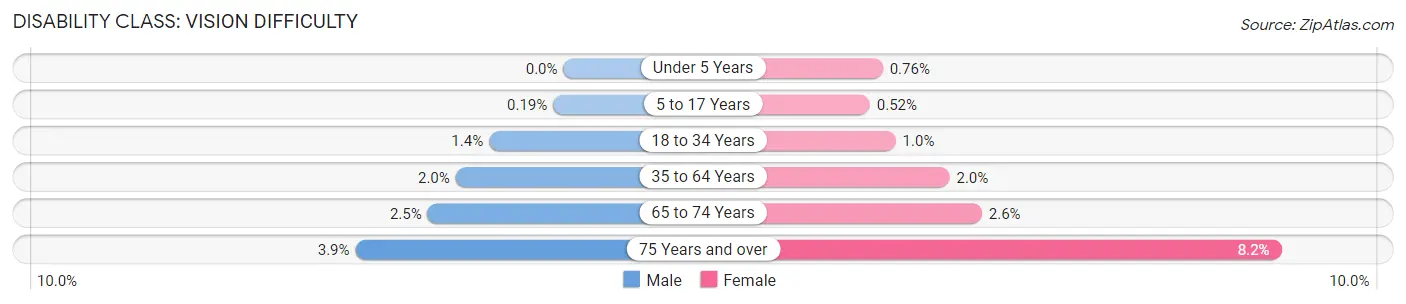
| Age Bracket | Male | Female |
| Under 5 Years | 0 (0.0%) | 42 (0.8%) |
| 5 to 17 Years | 32 (0.2%) | 86 (0.5%) |
| 18 to 34 Years | 269 (1.4%) | 191 (1.0%) |
| 35 to 64 Years | 753 (2.0%) | 770 (2.0%) |
| 65 to 74 Years | 240 (2.5%) | 271 (2.6%) |
| 75 Years and over | 200 (3.9%) | 623 (8.2%) |
Disability Class: Cognitive Difficulty
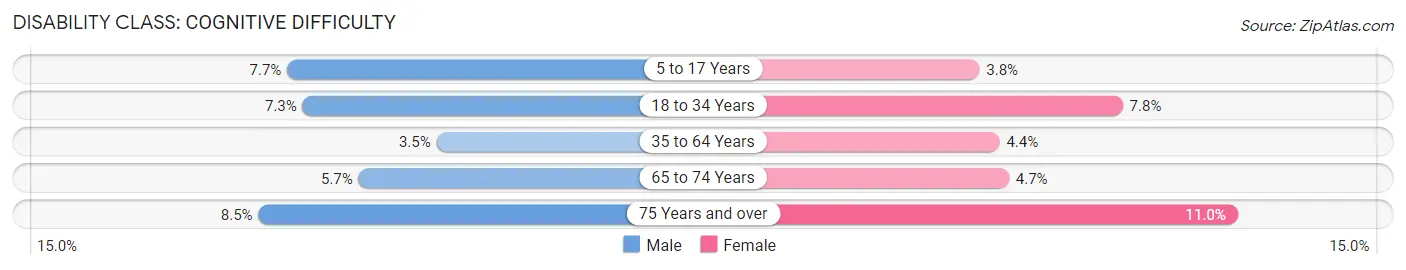
| Age Bracket | Male | Female |
| 5 to 17 Years | 1,320 (7.7%) | 638 (3.8%) |
| 18 to 34 Years | 1,415 (7.3%) | 1,493 (7.8%) |
| 35 to 64 Years | 1,327 (3.5%) | 1,689 (4.4%) |
| 65 to 74 Years | 542 (5.7%) | 484 (4.6%) |
| 75 Years and over | 440 (8.5%) | 842 (11.0%) |
Disability Class: Ambulatory Difficulty
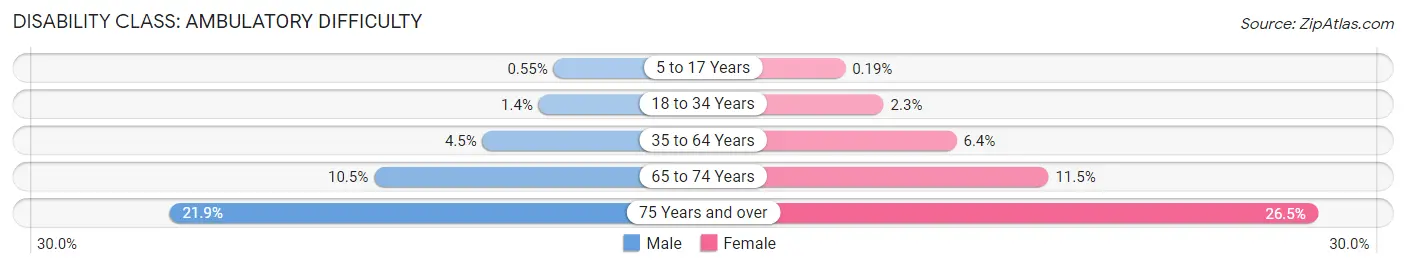
| Age Bracket | Male | Female |
| 5 to 17 Years | 94 (0.5%) | 31 (0.2%) |
| 18 to 34 Years | 267 (1.4%) | 445 (2.3%) |
| 35 to 64 Years | 1,693 (4.5%) | 2,462 (6.4%) |
| 65 to 74 Years | 1,002 (10.5%) | 1,198 (11.5%) |
| 75 Years and over | 1,137 (21.9%) | 2,023 (26.5%) |
Disability Class: Self-Care Difficulty
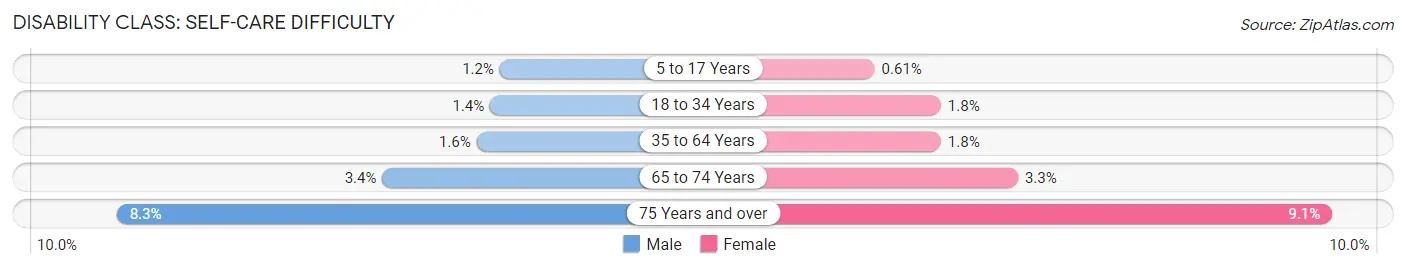
| Age Bracket | Male | Female |
| 5 to 17 Years | 203 (1.2%) | 101 (0.6%) |
| 18 to 34 Years | 265 (1.4%) | 352 (1.8%) |
| 35 to 64 Years | 604 (1.6%) | 707 (1.8%) |
| 65 to 74 Years | 320 (3.4%) | 340 (3.3%) |
| 75 Years and over | 430 (8.3%) | 695 (9.1%) |
Technology Access in Racine County
Computing Device Access in Racine County
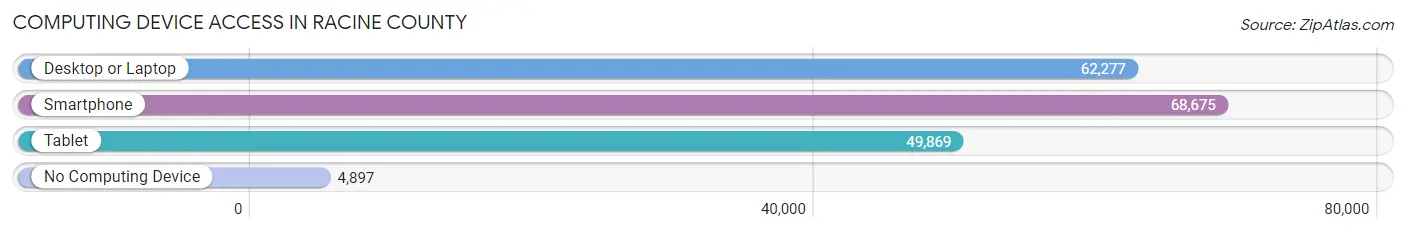
| Device Type | # Households | % Households |
| Desktop or Laptop | 62,277 | 78.7% |
| Smartphone | 68,675 | 86.8% |
| Tablet | 49,869 | 63.0% |
| No Computing Device | 4,897 | 6.2% |
| Total | 79,100 | 100.0% |
Internet Access in Racine County
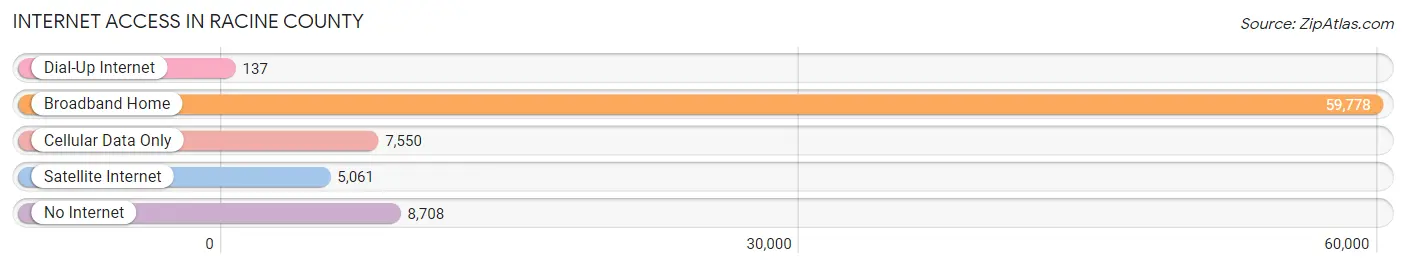
| Internet Type | # Households | % Households |
| Dial-Up Internet | 137 | 0.2% |
| Broadband Home | 59,778 | 75.6% |
| Cellular Data Only | 7,550 | 9.5% |
| Satellite Internet | 5,061 | 6.4% |
| No Internet | 8,708 | 11.0% |
| Total | 79,100 | 100.0% |
Racine County Summary
Racine County is located in southeastern Wisconsin, along the shores of Lake Michigan. It is bordered by Kenosha County to the south, Walworth County to the west, and Milwaukee County to the north. The county seat is Racine, which is also the largest city in the county. Racine County has a population of 195,408, making it the fifth most populous county in Wisconsin.
Racine County was established in 1836, and was named after the city of Racine, which was named after the French word for “root”. The county was originally part of Milwaukee County, but was split off in 1836. The county was originally home to the Potawatomi and Menominee Native American tribes, and was later settled by French and British immigrants.
Geographically, Racine County is located in the southeastern corner of Wisconsin, along the shores of Lake Michigan. The county is mostly flat, with some rolling hills in the northern and western parts of the county. The Fox River runs through the county, and there are several small lakes and ponds scattered throughout the county. The county is home to several state parks, including the Racine Zoo, North Beach Park, and the Racine County Fairgrounds.
The economy of Racine County is largely based on manufacturing and agriculture. The county is home to several large manufacturing companies, including SC Johnson, J.I. Case, and S.C. Johnson & Son. The county is also home to several agricultural businesses, including dairy farms, vegetable farms, and fruit orchards. The county is also home to several large retail stores, including Walmart, Target, and Kohl’s.
Racine County has a diverse population, with a mix of races and ethnicities. The largest racial group in the county is white, making up 78.3% of the population. African Americans make up 11.2% of the population, while Hispanics make up 6.2%. Asians make up 3.2% of the population, and Native Americans make up 0.7%. The median household income in the county is $51,945, and the median home value is $153,400.
Racine County is a great place to live, work, and play. The county has a rich history, a diverse population, and a strong economy. The county is home to several large businesses, and is a great place to raise a family. With its close proximity to Milwaukee and Chicago, Racine County is a great place to call home.
Common Questions
What is the Total Population of Racine County?
Total Population of Racine County is 197,068.
What is the Total Male Population of Racine County?
Total Male Population of Racine County is 97,957.
What is the Total Female Population of Racine County?
Total Female Population of Racine County is 99,111.
What is the Ratio of Males per 100 Females in Racine County?
There are 98.84 Males per 100 Females in Racine County.
What is the Ratio of Females per 100 Males in Racine County?
There are 101.18 Females per 100 Males in Racine County.
What is the Median Population Age in Racine County?
Median Population Age in Racine County is 40.2 Years.
What is the Average Family Size in Racine County
Average Family Size in Racine County is 3.0 People.
What is the Average Household Size in Racine County
Average Household Size in Racine County is 2.4 People.
What is Per Capita Income in Racine County?
Per Capita income in Racine County is $38,288.
What is the Median Family Income in Racine County?
Median Family Income in Racine County is $90,539.
What is the Median Household income in Racine County?
Median Household Income in Racine County is $72,658.
What is Income or Wage Gap in Racine County?
Income or Wage Gap in Racine County is 29.0%.
Women in Racine County earn 71.0 cents for every dollar earned by a man.
What is Family Income Deficit in Racine County?
Family Income Deficit in Racine County is $11,671.
Families that are below poverty line in Racine County earn $11,671 less on average than the poverty threshold level.
What is Inequality or Gini Index in Racine County?
Inequality or Gini Index in Racine County is 0.43.
How Large is the Labor Force in Racine County?
There are 100,785 People in the Labor Forcein in Racine County.
What is the Percentage of People in the Labor Force in Racine County?
64.0% of People are in the Labor Force in Racine County.
What is the Unemployment Rate in Racine County?
Unemployment Rate in Racine County is 4.4%.