Price County, WI
Price County Map
Price County Overview
14,066
TOTAL POPULATION
7,248
MALE POPULATION
6,818
FEMALE POPULATION
106.31
MALES / 100 FEMALES
94.07
FEMALES / 100 MALES
52.1
MEDIAN AGE
2.7
AVG FAMILY SIZE
2.1
AVG HOUSEHOLD SIZE
$33,468
PER CAPITA INCOME
$71,617
AVG FAMILY INCOME
$55,822
AVG HOUSEHOLD INCOME
33.2%
WAGE / INCOME GAP [ % ]
66.8¢/ $1
WAGE / INCOME GAP [ $ ]
$10,626
FAMILY INCOME DEFICIT
0.42
INEQUALITY / GINI INDEX
6,339
LABOR FORCE [ PEOPLE ]
53.4%
PERCENT IN LABOR FORCE
2.7%
UNEMPLOYMENT RATE
Price County Area Codes
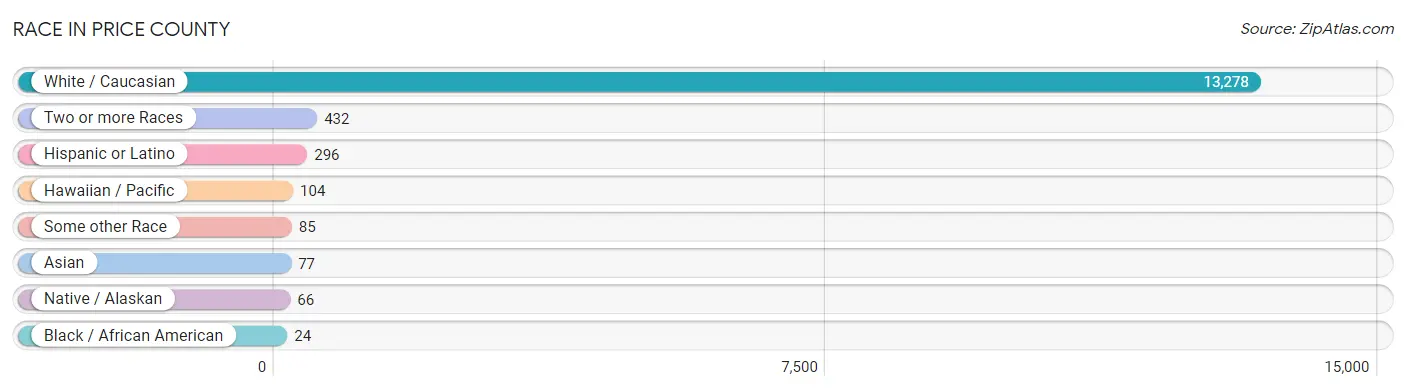
Race in Price County
The most populous races in Price County are White / Caucasian (13,278 | 94.4%), Two or more Races (432 | 3.1%), and Hispanic or Latino (296 | 2.1%).
| Race | # Population | % Population |
| Asian | 77 | 0.5% |
| Black / African American | 24 | 0.2% |
| Hawaiian / Pacific | 104 | 0.7% |
| Hispanic or Latino | 296 | 2.1% |
| Native / Alaskan | 66 | 0.5% |
| White / Caucasian | 13,278 | 94.4% |
| Two or more Races | 432 | 3.1% |
| Some other Race | 85 | 0.6% |
| Total | 14,066 | 100.0% |
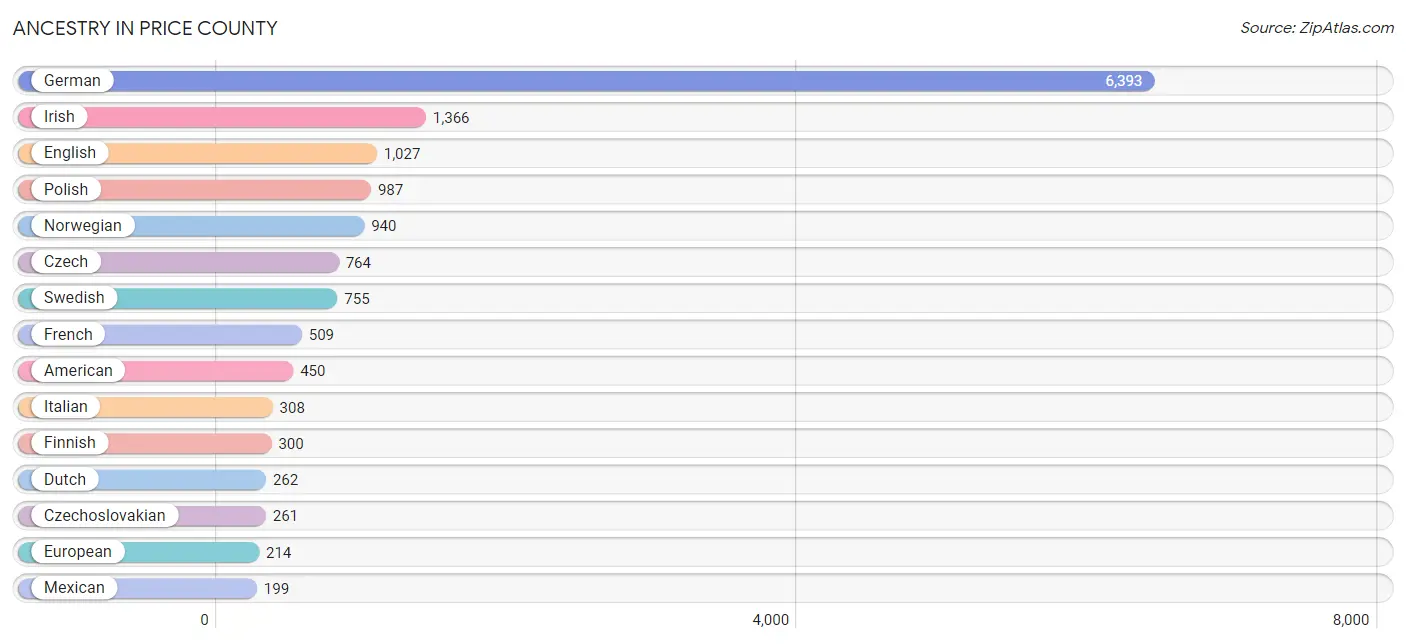
Ancestry in Price County
The most populous ancestries reported in Price County are German (6,393 | 45.5%), Irish (1,366 | 9.7%), English (1,027 | 7.3%), Polish (987 | 7.0%), and Norwegian (940 | 6.7%), together accounting for 76.2% of all Price County residents.
| Ancestry | # Population | % Population |
| African | 2 | 0.0% |
| American | 450 | 3.2% |
| Arab | 6 | 0.0% |
| Armenian | 6 | 0.0% |
| Austrian | 97 | 0.7% |
| Bangladeshi | 10 | 0.1% |
| Belgian | 34 | 0.2% |
| Bhutanese | 16 | 0.1% |
| Blackfeet | 2 | 0.0% |
| Brazilian | 2 | 0.0% |
| British | 41 | 0.3% |
| Bulgarian | 8 | 0.1% |
| Burmese | 13 | 0.1% |
| Cambodian | 15 | 0.1% |
| Canadian | 5 | 0.0% |
| Celtic | 5 | 0.0% |
| Cherokee | 21 | 0.2% |
| Chippewa | 94 | 0.7% |
| Creek | 7 | 0.1% |
| Croatian | 36 | 0.3% |
| Cuban | 8 | 0.1% |
| Czech | 764 | 5.4% |
| Czechoslovakian | 261 | 1.9% |
| Danish | 99 | 0.7% |
| Dutch | 262 | 1.9% |
| Eastern European | 27 | 0.2% |
| English | 1,027 | 7.3% |
| Ethiopian | 6 | 0.0% |
| European | 214 | 1.5% |
| Finnish | 300 | 2.1% |
| French | 509 | 3.6% |
| French American Indian | 1 | 0.0% |
| French Canadian | 130 | 0.9% |
| German | 6,393 | 45.5% |
| Greek | 47 | 0.3% |
| Guamanian / Chamorro | 5 | 0.0% |
| Hungarian | 53 | 0.4% |
| Indian (Asian) | 14 | 0.1% |
| Irish | 1,366 | 9.7% |
| Iroquois | 4 | 0.0% |
| Italian | 308 | 2.2% |
| Japanese | 9 | 0.1% |
| Korean | 33 | 0.2% |
| Latvian | 5 | 0.0% |
| Lebanese | 1 | 0.0% |
| Lithuanian | 52 | 0.4% |
| Luxembourger | 5 | 0.0% |
| Menominee | 7 | 0.1% |
| Mexican | 199 | 1.4% |
| New Zealander | 2 | 0.0% |
| Northern European | 27 | 0.2% |
| Norwegian | 940 | 6.7% |
| Pakistani | 3 | 0.0% |
| Pennsylvania German | 7 | 0.1% |
| Polish | 987 | 7.0% |
| Portuguese | 1 | 0.0% |
| Puerto Rican | 80 | 0.6% |
| Romanian | 1 | 0.0% |
| Russian | 102 | 0.7% |
| Samoan | 46 | 0.3% |
| Scandinavian | 118 | 0.8% |
| Scotch-Irish | 66 | 0.5% |
| Scottish | 97 | 0.7% |
| Serbian | 13 | 0.1% |
| Sioux | 2 | 0.0% |
| Slavic | 4 | 0.0% |
| Slovak | 184 | 1.3% |
| Slovene | 31 | 0.2% |
| Spaniard | 3 | 0.0% |
| Subsaharan African | 8 | 0.1% |
| Swedish | 755 | 5.4% |
| Swiss | 51 | 0.4% |
| Thai | 8 | 0.1% |
| Ukrainian | 24 | 0.2% |
| Welsh | 75 | 0.5% |
| Yaqui | 4 | 0.0% | View All 76 Rows |
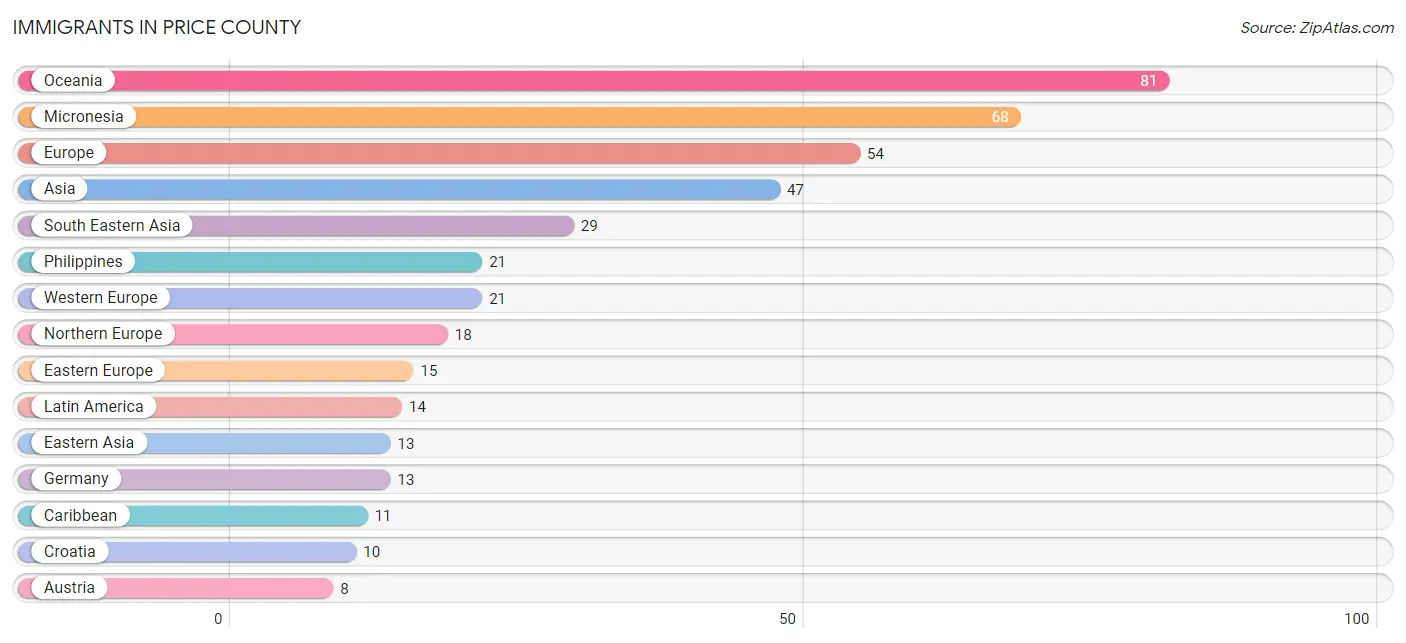
Immigrants in Price County
The most numerous immigrant groups reported in Price County came from Oceania (81 | 0.6%), Micronesia (68 | 0.5%), Europe (54 | 0.4%), Asia (47 | 0.3%), and South Eastern Asia (29 | 0.2%), together accounting for 2.0% of all Price County residents.
| Immigration Origin | # Population | % Population |
| Africa | 6 | 0.0% |
| Asia | 47 | 0.3% |
| Austria | 8 | 0.1% |
| Brazil | 2 | 0.0% |
| Canada | 5 | 0.0% |
| Caribbean | 11 | 0.1% |
| Central America | 1 | 0.0% |
| China | 7 | 0.1% |
| Croatia | 10 | 0.1% |
| Cuba | 2 | 0.0% |
| Eastern Africa | 6 | 0.0% |
| Eastern Asia | 13 | 0.1% |
| Eastern Europe | 15 | 0.1% |
| England | 2 | 0.0% |
| Ethiopia | 6 | 0.0% |
| Europe | 54 | 0.4% |
| Germany | 13 | 0.1% |
| India | 5 | 0.0% |
| Ireland | 3 | 0.0% |
| Japan | 1 | 0.0% |
| Korea | 2 | 0.0% |
| Latin America | 14 | 0.1% |
| Mexico | 1 | 0.0% |
| Micronesia | 68 | 0.5% |
| Northern Europe | 18 | 0.1% |
| Oceania | 81 | 0.6% |
| Philippines | 21 | 0.2% |
| Poland | 4 | 0.0% |
| Russia | 1 | 0.0% |
| Scotland | 5 | 0.0% |
| South America | 2 | 0.0% |
| South Central Asia | 5 | 0.0% |
| South Eastern Asia | 29 | 0.2% |
| Taiwan | 5 | 0.0% |
| Thailand | 2 | 0.0% |
| Western Europe | 21 | 0.2% | View All 36 Rows |
Sex and Age in Price County
Sex and Age in Price County
The most populous age groups in Price County are 60 to 64 Years (807 | 11.1%) for men and 60 to 64 Years (662 | 9.7%) for women.
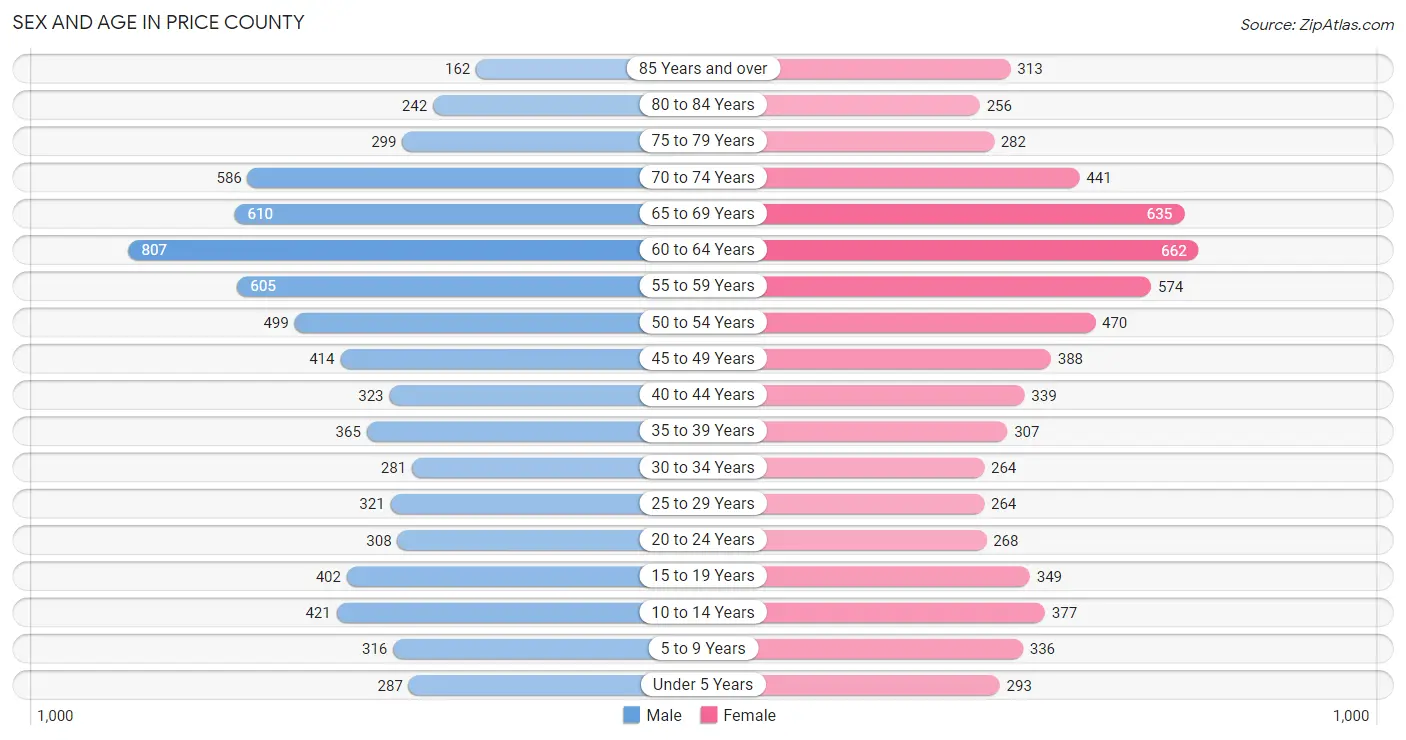
| Age Bracket | Male | Female |
| Under 5 Years | 287 (4.0%) | 293 (4.3%) |
| 5 to 9 Years | 316 (4.4%) | 336 (4.9%) |
| 10 to 14 Years | 421 (5.8%) | 377 (5.5%) |
| 15 to 19 Years | 402 (5.6%) | 349 (5.1%) |
| 20 to 24 Years | 308 (4.3%) | 268 (3.9%) |
| 25 to 29 Years | 321 (4.4%) | 264 (3.9%) |
| 30 to 34 Years | 281 (3.9%) | 264 (3.9%) |
| 35 to 39 Years | 365 (5.0%) | 307 (4.5%) |
| 40 to 44 Years | 323 (4.5%) | 339 (5.0%) |
| 45 to 49 Years | 414 (5.7%) | 388 (5.7%) |
| 50 to 54 Years | 499 (6.9%) | 470 (6.9%) |
| 55 to 59 Years | 605 (8.4%) | 574 (8.4%) |
| 60 to 64 Years | 807 (11.1%) | 662 (9.7%) |
| 65 to 69 Years | 610 (8.4%) | 635 (9.3%) |
| 70 to 74 Years | 586 (8.1%) | 441 (6.5%) |
| 75 to 79 Years | 299 (4.1%) | 282 (4.1%) |
| 80 to 84 Years | 242 (3.3%) | 256 (3.7%) |
| 85 Years and over | 162 (2.2%) | 313 (4.6%) |
| Total | 7,248 (100.0%) | 6,818 (100.0%) |
Families and Households in Price County
Median Family Size in Price County
The median family size in Price County is 2.71 persons per family, with single female/mother families (461 | 12.0%) accounting for the largest median family size of 2.97 persons per family. On the other hand, single male/father families (206 | 5.3%) represent the smallest median family size with 2.61 persons per family.
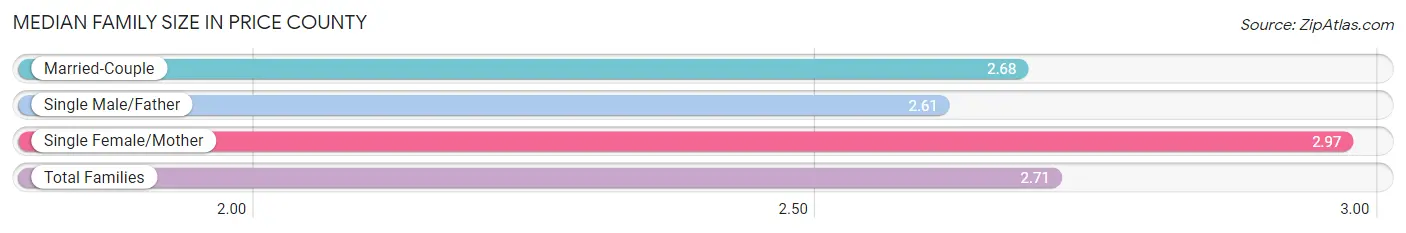
| Family Type | # Families | Family Size |
| Married-Couple | 3,181 (82.7%) | 2.68 |
| Single Male/Father | 206 (5.3%) | 2.61 |
| Single Female/Mother | 461 (12.0%) | 2.97 |
| Total Families | 3,848 (100.0%) | 2.71 |
Median Household Size in Price County
The median household size in Price County is 2.09 persons per household, with single female/mother households (461 | 7.0%) accounting for the largest median household size of 3.34 persons per household. non-family households (2,782 | 42.0%) represent the smallest median household size with 1.14 persons per household.
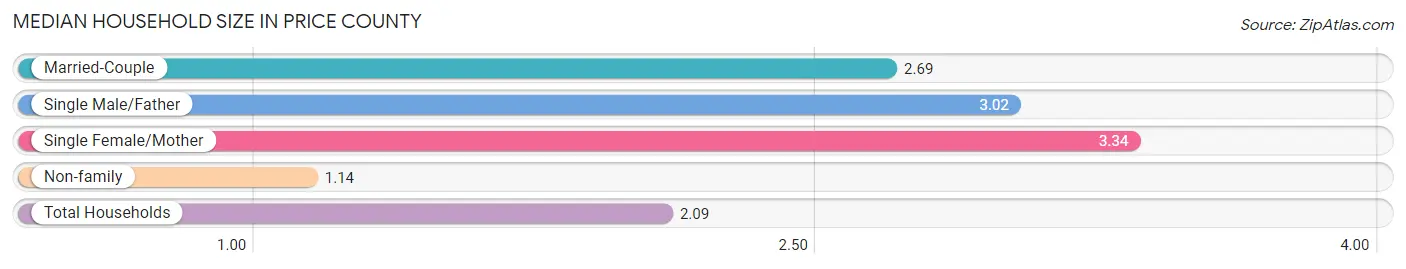
| Household Type | # Households | Household Size |
| Married-Couple | 3,181 (48.0%) | 2.69 |
| Single Male/Father | 206 (3.1%) | 3.02 |
| Single Female/Mother | 461 (7.0%) | 3.34 |
| Non-family | 2,782 (42.0%) | 1.14 |
| Total Households | 6,630 (100.0%) | 2.09 |
Household Size by Marriage Status in Price County
Out of a total of 6,630 households in Price County, 3,848 (58.0%) are family households, while 2,782 (42.0%) are nonfamily households. The most numerous type of family households are 2-person households, comprising 2,402, and the most common type of nonfamily households are 1-person households, comprising 2,421.
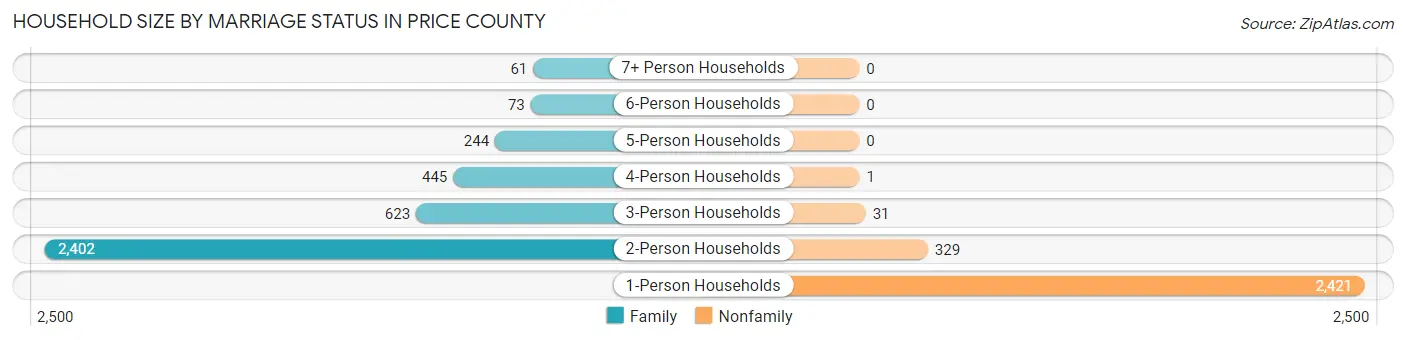
| Household Size | Family Households | Nonfamily Households |
| 1-Person Households | - | 2,421 (36.5%) |
| 2-Person Households | 2,402 (36.2%) | 329 (5.0%) |
| 3-Person Households | 623 (9.4%) | 31 (0.5%) |
| 4-Person Households | 445 (6.7%) | 1 (0.0%) |
| 5-Person Households | 244 (3.7%) | 0 (0.0%) |
| 6-Person Households | 73 (1.1%) | 0 (0.0%) |
| 7+ Person Households | 61 (0.9%) | 0 (0.0%) |
| Total | 3,848 (58.0%) | 2,782 (42.0%) |
Female Fertility in Price County
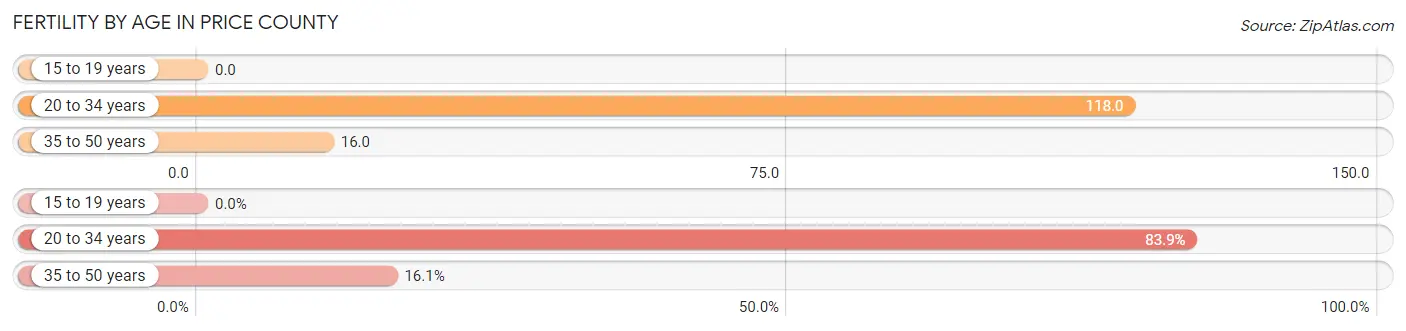
Fertility by Age in Price County
Average fertility rate in Price County is 49.0 births per 1,000 women. Women in the age bracket of 20 to 34 years have the highest fertility rate with 118.0 births per 1,000 women. Women in the age bracket of 20 to 34 years acount for 83.9% of all women with births.
| Age Bracket | Women with Births | Births / 1,000 Women |
| 15 to 19 years | 0 (0.0%) | 0.0 |
| 20 to 34 years | 94 (83.9%) | 118.0 |
| 35 to 50 years | 18 (16.1%) | 16.0 |
| Total | 112 (100.0%) | 49.0 |
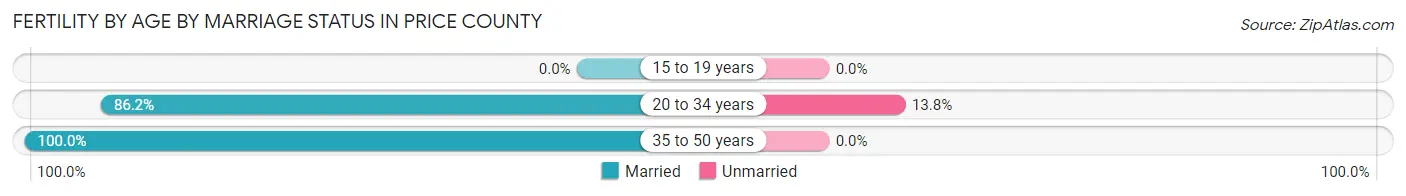
Fertility by Age by Marriage Status in Price County
88.4% of women with births (112) in Price County are married. The highest percentage of unmarried women with births falls into 20 to 34 years age bracket with 13.8% of them unmarried at the time of birth, while the lowest percentage of unmarried women with births belong to 35 to 50 years age bracket with 0.0% of them unmarried.
| Age Bracket | Married | Unmarried |
| 15 to 19 years | 0 (0.0%) | 0 (0.0%) |
| 20 to 34 years | 81 (86.2%) | 13 (13.8%) |
| 35 to 50 years | 18 (100.0%) | 0 (0.0%) |
| Total | 99 (88.4%) | 13 (11.6%) |
Fertility by Education in Price County

| Educational Attainment | Women with Births | Births / 1,000 Women |
| Less than High School | 5 (4.5%) | 16.0 |
| High School Diploma | 30 (26.8%) | 50.0 |
| College or Associate's Degree | 63 (56.2%) | 63.0 |
| Bachelor's Degree | 14 (12.5%) | 53.0 |
| Graduate Degree | 0 (0.0%) | 0.0 |
| Total | 112 (100.0%) | 49.0 |
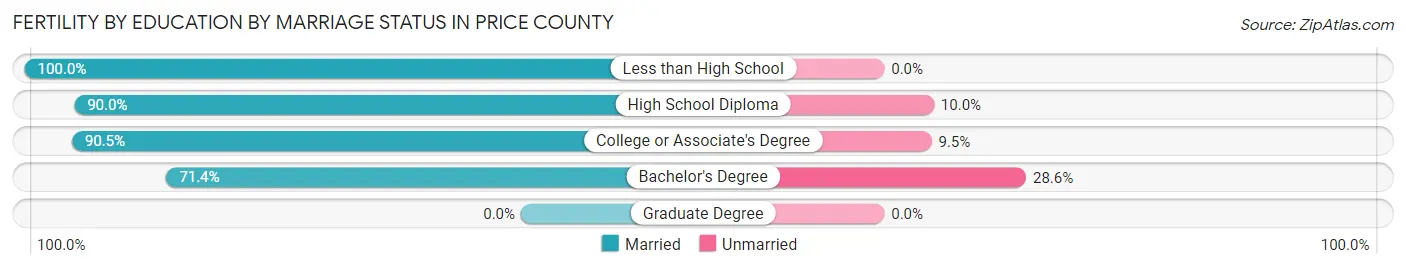
Fertility by Education by Marriage Status in Price County
11.6% of women with births in Price County are unmarried. Women with the educational attainment of less than high school are most likely to be married with 100.0% of them married at childbirth, while women with the educational attainment of bachelor's degree are least likely to be married with 28.6% of them unmarried at childbirth.
| Educational Attainment | Married | Unmarried |
| Less than High School | 5 (100.0%) | 0 (0.0%) |
| High School Diploma | 27 (90.0%) | 3 (10.0%) |
| College or Associate's Degree | 57 (90.5%) | 6 (9.5%) |
| Bachelor's Degree | 10 (71.4%) | 4 (28.6%) |
| Graduate Degree | 0 (0.0%) | 0 (0.0%) |
| Total | 99 (88.4%) | 13 (11.6%) |
Income in Price County
Income Overview in Price County
Per Capita Income in Price County is $33,468, while median incomes of families and households are $71,617 and $55,822 respectively.
| Characteristic | Number | Measure |
| Per Capita Income | 14,066 | $33,468 |
| Median Family Income | 3,848 | $71,617 |
| Mean Family Income | 3,848 | $87,369 |
| Median Household Income | 6,630 | $55,822 |
| Mean Household Income | 6,630 | $70,010 |
| Income Deficit | 3,848 | $10,626 |
| Wage / Income Gap (%) | 14,066 | 33.19% |
| Wage / Income Gap ($) | 14,066 | 66.81¢ per $1 |
| Gini / Inequality Index | 14,066 | 0.42 |
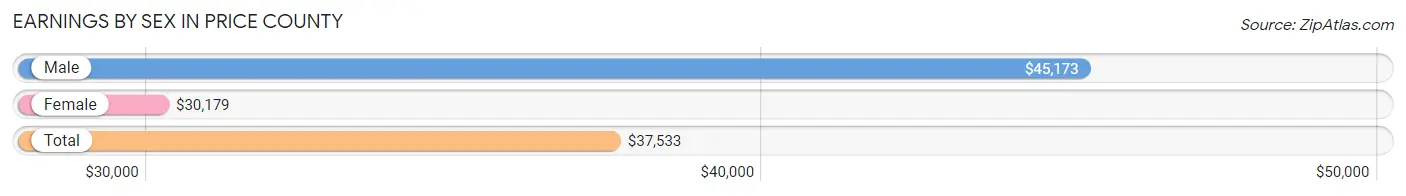
Earnings by Sex in Price County
Average Earnings in Price County are $37,533, $45,173 for men and $30,179 for women, a difference of 33.2%.
| Sex | Number | Average Earnings |
| Male | 3,748 (54.9%) | $45,173 |
| Female | 3,074 (45.1%) | $30,179 |
| Total | 6,822 (100.0%) | $37,533 |
Earnings by Sex by Income Bracket in Price County
The most common earnings brackets in Price County are $55,000 to $64,999 for men (379 | 10.1%) and $25,000 to $29,999 for women (261 | 8.5%).
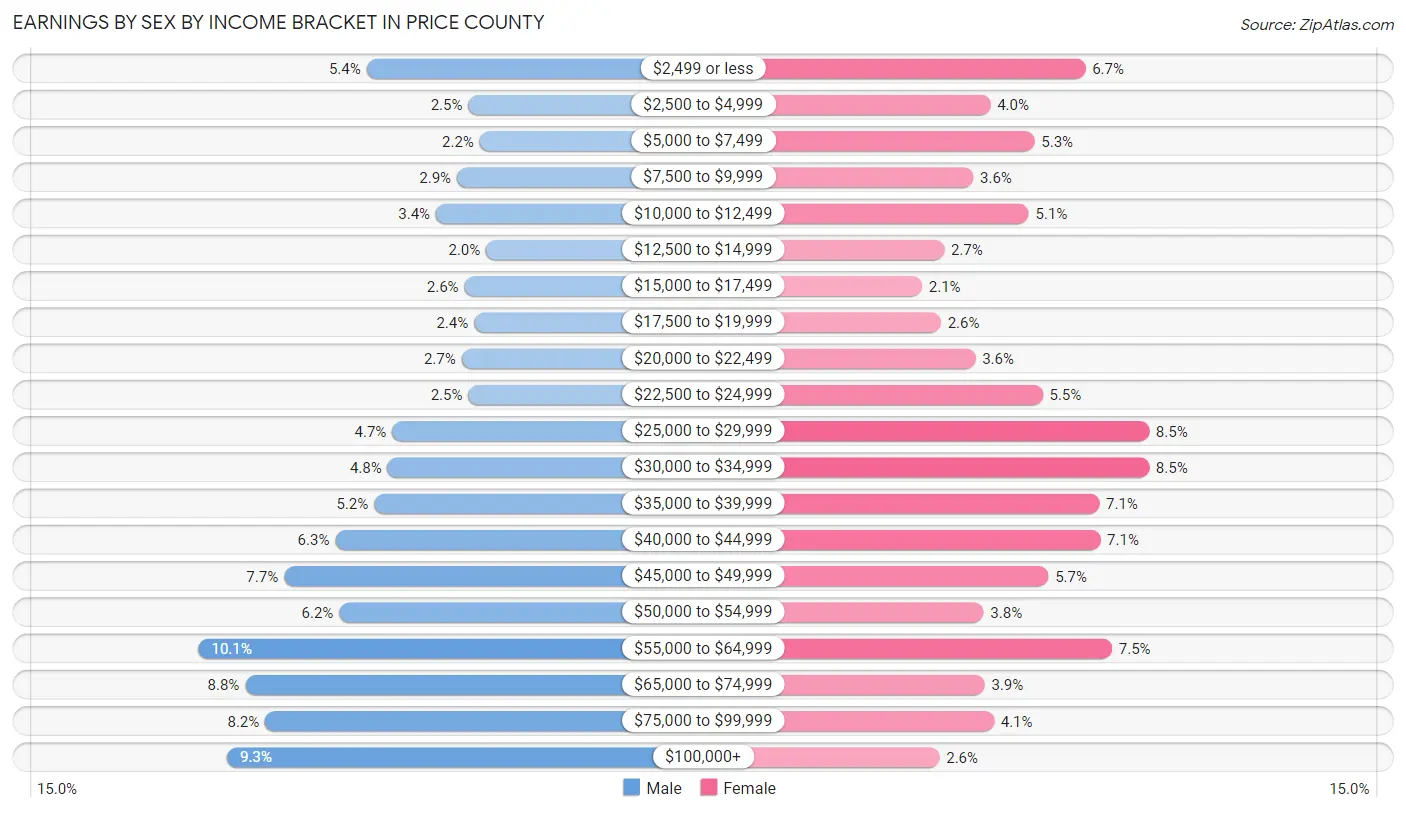
| Income | Male | Female |
| $2,499 or less | 202 (5.4%) | 206 (6.7%) |
| $2,500 to $4,999 | 95 (2.5%) | 124 (4.0%) |
| $5,000 to $7,499 | 83 (2.2%) | 162 (5.3%) |
| $7,500 to $9,999 | 107 (2.9%) | 109 (3.5%) |
| $10,000 to $12,499 | 129 (3.4%) | 157 (5.1%) |
| $12,500 to $14,999 | 76 (2.0%) | 84 (2.7%) |
| $15,000 to $17,499 | 99 (2.6%) | 65 (2.1%) |
| $17,500 to $19,999 | 89 (2.4%) | 81 (2.6%) |
| $20,000 to $22,499 | 102 (2.7%) | 111 (3.6%) |
| $22,500 to $24,999 | 95 (2.5%) | 169 (5.5%) |
| $25,000 to $29,999 | 175 (4.7%) | 261 (8.5%) |
| $30,000 to $34,999 | 180 (4.8%) | 261 (8.5%) |
| $35,000 to $39,999 | 194 (5.2%) | 218 (7.1%) |
| $40,000 to $44,999 | 235 (6.3%) | 219 (7.1%) |
| $45,000 to $49,999 | 289 (7.7%) | 174 (5.7%) |
| $50,000 to $54,999 | 231 (6.2%) | 118 (3.8%) |
| $55,000 to $64,999 | 379 (10.1%) | 229 (7.4%) |
| $65,000 to $74,999 | 330 (8.8%) | 119 (3.9%) |
| $75,000 to $99,999 | 309 (8.2%) | 127 (4.1%) |
| $100,000+ | 349 (9.3%) | 80 (2.6%) |
| Total | 3,748 (100.0%) | 3,074 (100.0%) |
Earnings by Sex by Educational Attainment in Price County
Average earnings in Price County are $48,343 for men and $33,073 for women, a difference of 31.6%. Men with an educational attainment of graduate degree enjoy the highest average annual earnings of $73,750, while those with less than high school education earn the least with $31,985. Women with an educational attainment of graduate degree earn the most with the average annual earnings of $60,417, while those with high school diploma education have the smallest earnings of $27,682.
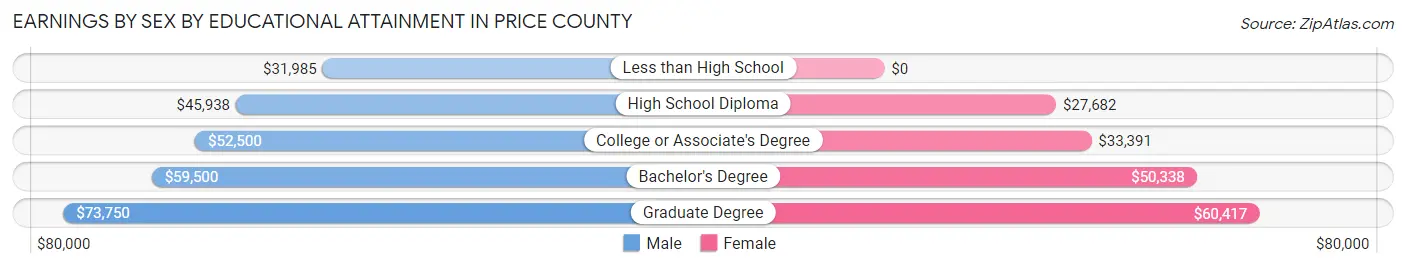
| Educational Attainment | Male Income | Female Income |
| Less than High School | $31,985 | $0 |
| High School Diploma | $45,938 | $27,682 |
| College or Associate's Degree | $52,500 | $33,391 |
| Bachelor's Degree | $59,500 | $50,338 |
| Graduate Degree | $73,750 | $60,417 |
| Total | $48,343 | $33,073 |
Family Income in Price County
Family Income Brackets in Price County
According to the Price County family income data, there are 889 families falling into the $50,000 to $74,999 income range, which is the most common income bracket and makes up 23.1% of all families. Conversely, the $10,000 to $14,999 income bracket is the least frequent group with only 73 families (1.9%) belonging to this category.
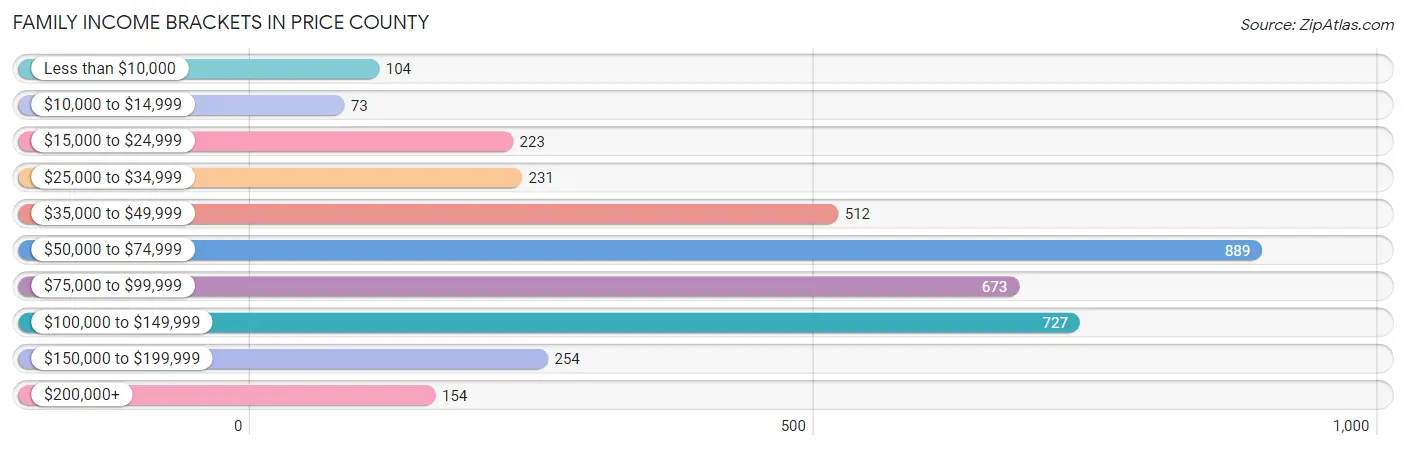
| Income Bracket | # Families | % Families |
| Less than $10,000 | 104 | 2.7% |
| $10,000 to $14,999 | 73 | 1.9% |
| $15,000 to $24,999 | 223 | 5.8% |
| $25,000 to $34,999 | 231 | 6.0% |
| $35,000 to $49,999 | 512 | 13.3% |
| $50,000 to $74,999 | 889 | 23.1% |
| $75,000 to $99,999 | 673 | 17.5% |
| $100,000 to $149,999 | 727 | 18.9% |
| $150,000 to $199,999 | 254 | 6.6% |
| $200,000+ | 154 | 4.0% |
Family Income by Famaliy Size in Price County
5-person families (204 | 5.3%) account for the highest median family income in Price County with $99,868 per family, while 2-person families (2,498 | 64.9%) have the highest median income of $34,457 per family member.
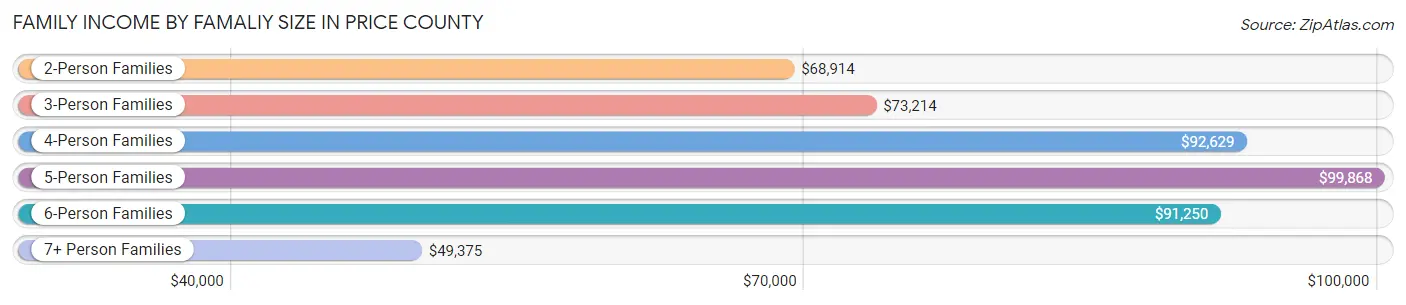
| Income Bracket | # Families | Median Income |
| 2-Person Families | 2,498 (64.9%) | $68,914 |
| 3-Person Families | 634 (16.5%) | $73,214 |
| 4-Person Families | 391 (10.2%) | $92,629 |
| 5-Person Families | 204 (5.3%) | $99,868 |
| 6-Person Families | 61 (1.6%) | $91,250 |
| 7+ Person Families | 60 (1.6%) | $49,375 |
| Total | 3,848 (100.0%) | $71,617 |
Family Income by Number of Earners in Price County
The median family income in Price County is $71,617, with families comprising 3+ earners (305) having the highest median family income of $119,875, while families with no earners (968) have the lowest median family income of $49,714, accounting for 7.9% and 25.2% of families, respectively.
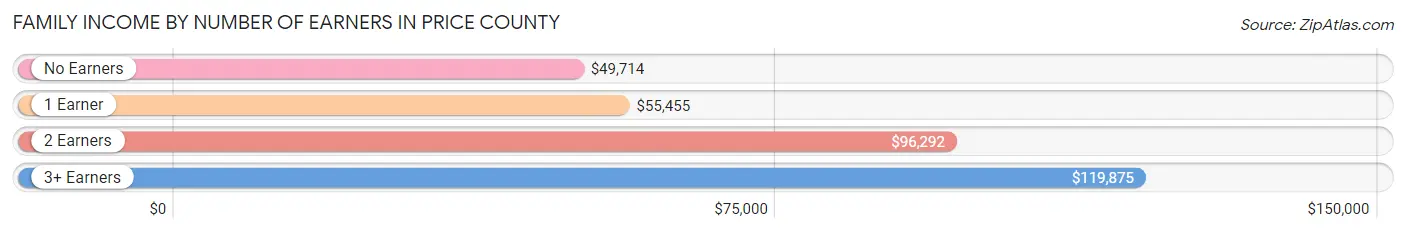
| Number of Earners | # Families | Median Income |
| No Earners | 968 (25.2%) | $49,714 |
| 1 Earner | 1,156 (30.0%) | $55,455 |
| 2 Earners | 1,419 (36.9%) | $96,292 |
| 3+ Earners | 305 (7.9%) | $119,875 |
| Total | 3,848 (100.0%) | $71,617 |
Household Income in Price County
Household Income Brackets in Price County
With 1,465 households falling in the category, the $50,000 to $74,999 income range is the most frequent in Price County, accounting for 22.1% of all households. In contrast, only 179 households (2.7%) fall into the $200,000+ income bracket, making it the least populous group.
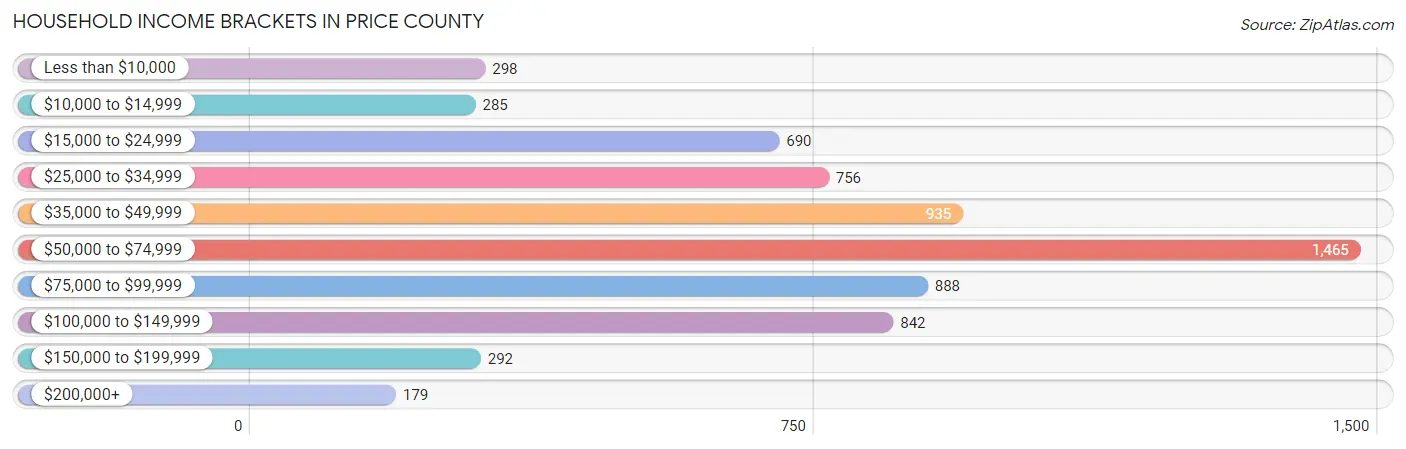
| Income Bracket | # Households | % Households |
| Less than $10,000 | 298 | 4.5% |
| $10,000 to $14,999 | 285 | 4.3% |
| $15,000 to $24,999 | 690 | 10.4% |
| $25,000 to $34,999 | 756 | 11.4% |
| $35,000 to $49,999 | 935 | 14.1% |
| $50,000 to $74,999 | 1,465 | 22.1% |
| $75,000 to $99,999 | 888 | 13.4% |
| $100,000 to $149,999 | 842 | 12.7% |
| $150,000 to $199,999 | 292 | 4.4% |
| $200,000+ | 179 | 2.7% |
Household Income by Householder Age in Price County
The median household income in Price County is $55,822, with the highest median household income of $66,382 found in the 25 to 44 years age bracket for the primary householder. A total of 1,304 households (19.7%) fall into this category. Meanwhile, the 65+ years age bracket for the primary householder has the lowest median household income of $41,010, with 2,553 households (38.5%) in this group.
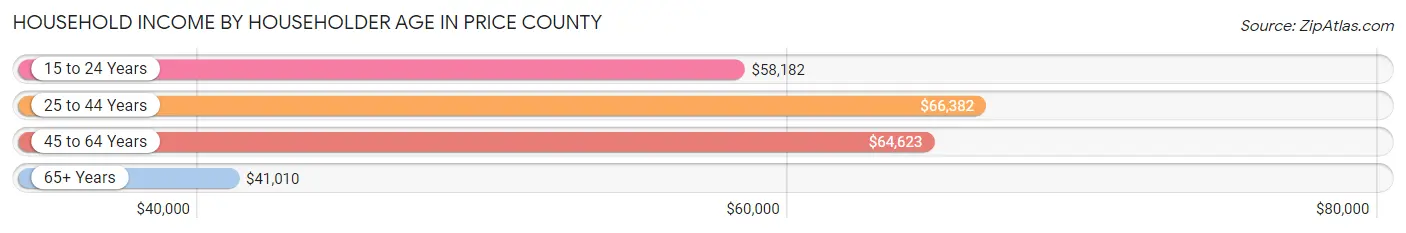
| Income Bracket | # Households | Median Income |
| 15 to 24 Years | 130 (2.0%) | $58,182 |
| 25 to 44 Years | 1,304 (19.7%) | $66,382 |
| 45 to 64 Years | 2,643 (39.9%) | $64,623 |
| 65+ Years | 2,553 (38.5%) | $41,010 |
| Total | 6,630 (100.0%) | $55,822 |
Poverty in Price County
Income Below Poverty by Sex and Age in Price County
With 11.6% poverty level for males and 15.7% for females among the residents of Price County, 5 year old males and 18 to 24 year old females are the most vulnerable to poverty, with 49 males (58.3%) and 170 females (44.6%) in their respective age groups living below the poverty level.
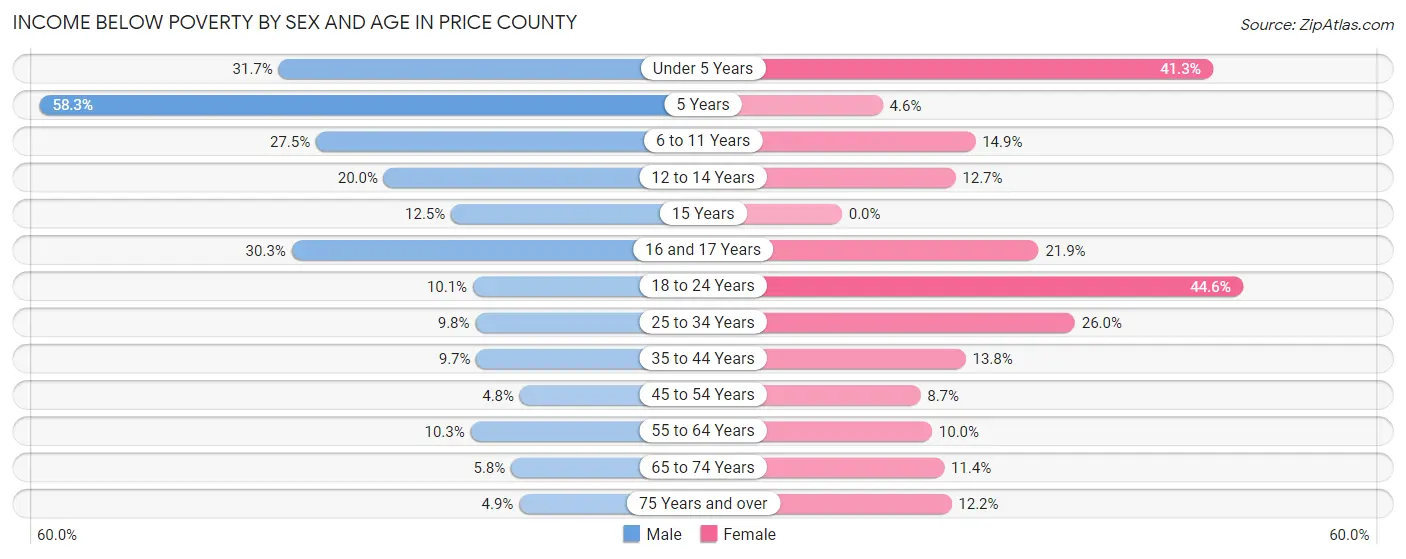
| Age Bracket | Male | Female |
| Under 5 Years | 91 (31.7%) | 116 (41.3%) |
| 5 Years | 49 (58.3%) | 2 (4.5%) |
| 6 to 11 Years | 114 (27.5%) | 59 (14.9%) |
| 12 to 14 Years | 47 (20.0%) | 31 (12.7%) |
| 15 Years | 9 (12.5%) | 0 (0.0%) |
| 16 and 17 Years | 59 (30.3%) | 30 (21.9%) |
| 18 to 24 Years | 44 (10.1%) | 170 (44.6%) |
| 25 to 34 Years | 59 (9.8%) | 137 (26.0%) |
| 35 to 44 Years | 66 (9.7%) | 89 (13.8%) |
| 45 to 54 Years | 44 (4.8%) | 75 (8.7%) |
| 55 to 64 Years | 144 (10.3%) | 124 (10.0%) |
| 65 to 74 Years | 69 (5.8%) | 122 (11.4%) |
| 75 Years and over | 32 (4.9%) | 98 (12.2%) |
| Total | 827 (11.6%) | 1,053 (15.7%) |
Income Above Poverty by Sex and Age in Price County
According to the poverty statistics in Price County, males aged 45 to 54 years and females aged 15 years are the age groups that are most secure financially, with 95.2% of males and 100.0% of females in these age groups living above the poverty line.
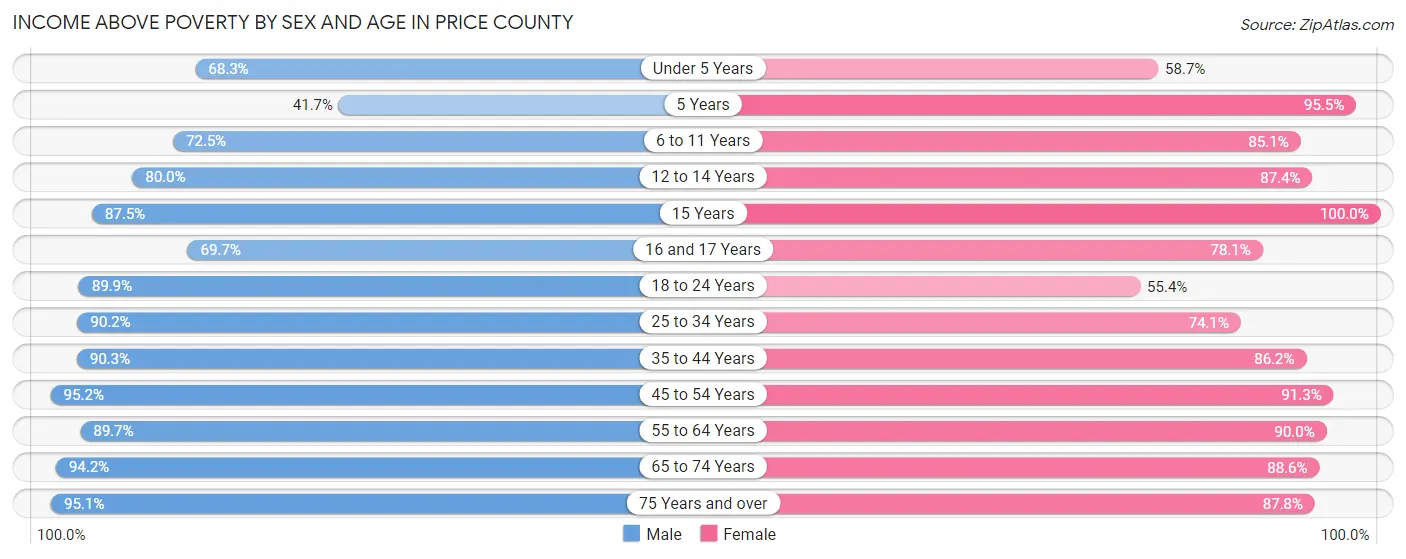
| Age Bracket | Male | Female |
| Under 5 Years | 196 (68.3%) | 165 (58.7%) |
| 5 Years | 35 (41.7%) | 42 (95.5%) |
| 6 to 11 Years | 300 (72.5%) | 338 (85.1%) |
| 12 to 14 Years | 188 (80.0%) | 214 (87.4%) |
| 15 Years | 63 (87.5%) | 94 (100.0%) |
| 16 and 17 Years | 136 (69.7%) | 107 (78.1%) |
| 18 to 24 Years | 393 (89.9%) | 211 (55.4%) |
| 25 to 34 Years | 543 (90.2%) | 391 (74.1%) |
| 35 to 44 Years | 615 (90.3%) | 557 (86.2%) |
| 45 to 54 Years | 865 (95.2%) | 783 (91.3%) |
| 55 to 64 Years | 1,248 (89.7%) | 1,112 (90.0%) |
| 65 to 74 Years | 1,116 (94.2%) | 950 (88.6%) |
| 75 Years and over | 619 (95.1%) | 705 (87.8%) |
| Total | 6,317 (88.4%) | 5,669 (84.3%) |
Income Below Poverty Among Married-Couple Families in Price County
The poverty statistics for married-couple families in Price County show that 5.0% or 160 of the total 3,181 families live below the poverty line. Families with 5 or more children have the highest poverty rate of 38.5%, comprising of 20 families. On the other hand, families with no children have the lowest poverty rate of 3.2%, which includes 76 families.
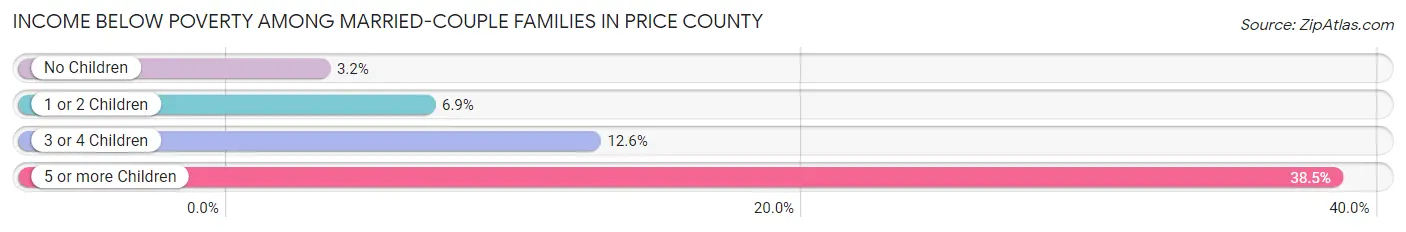
| Children | Above Poverty | Below Poverty |
| No Children | 2,300 (96.8%) | 76 (3.2%) |
| 1 or 2 Children | 502 (93.1%) | 37 (6.9%) |
| 3 or 4 Children | 187 (87.4%) | 27 (12.6%) |
| 5 or more Children | 32 (61.5%) | 20 (38.5%) |
| Total | 3,021 (95.0%) | 160 (5.0%) |
Income Below Poverty Among Single-Parent Households in Price County
According to the poverty data in Price County, 6.8% or 14 single-father households and 34.7% or 160 single-mother households are living below the poverty line. Among single-father households, those with 3 or 4 children have the highest poverty rate, with 6 households (25.0%) experiencing poverty. Likewise, among single-mother households, those with 1 or 2 children have the highest poverty rate, with 143 households (49.1%) falling below the poverty line.
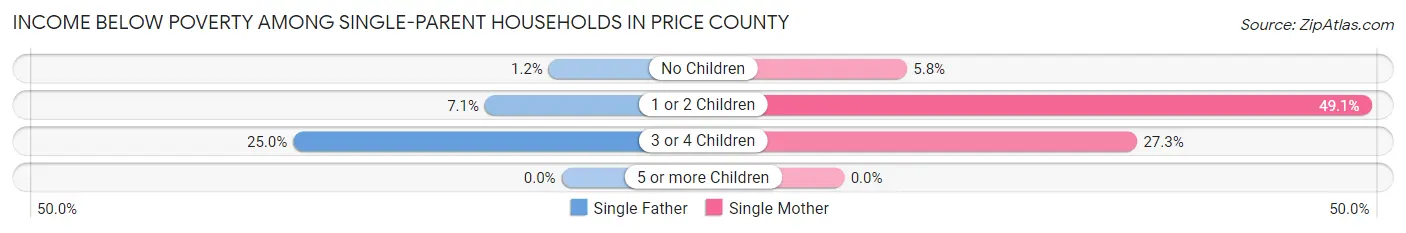
| Children | Single Father | Single Mother |
| No Children | 1 (1.2%) | 8 (5.8%) |
| 1 or 2 Children | 7 (7.1%) | 143 (49.1%) |
| 3 or 4 Children | 6 (25.0%) | 9 (27.3%) |
| 5 or more Children | 0 (0.0%) | 0 (0.0%) |
| Total | 14 (6.8%) | 160 (34.7%) |
Income Below Poverty Among Married-Couple vs Single-Parent Households in Price County
The poverty data for Price County shows that 160 of the married-couple family households (5.0%) and 174 of the single-parent households (26.1%) are living below the poverty level. Within the married-couple family households, those with 5 or more children have the highest poverty rate, with 20 households (38.5%) falling below the poverty line. Among the single-parent households, those with 1 or 2 children have the highest poverty rate, with 150 household (38.6%) living below poverty.
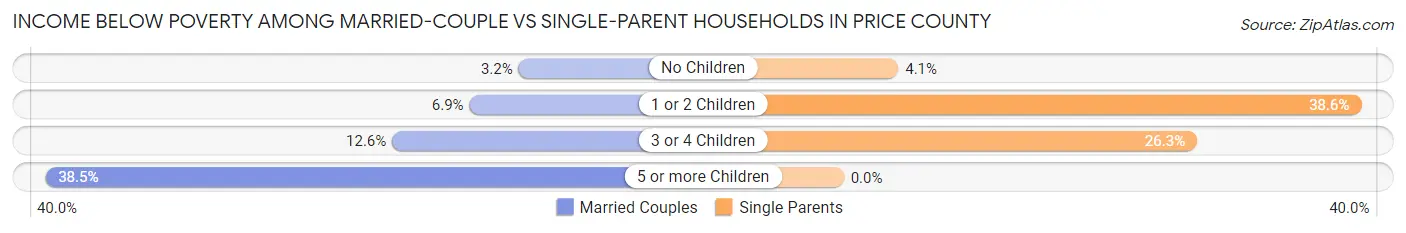
| Children | Married-Couple Families | Single-Parent Households |
| No Children | 76 (3.2%) | 9 (4.1%) |
| 1 or 2 Children | 37 (6.9%) | 150 (38.6%) |
| 3 or 4 Children | 27 (12.6%) | 15 (26.3%) |
| 5 or more Children | 20 (38.5%) | 0 (0.0%) |
| Total | 160 (5.0%) | 174 (26.1%) |
Employment Characteristics in Price County
Employment by Class of Employer in Price County
Among the 6,013 employed individuals in Price County, private company employees (4,116 | 68.4%), local government employees (529 | 8.8%), and self-employed (not incorporated) (519 | 8.6%) make up the most common classes of employment.
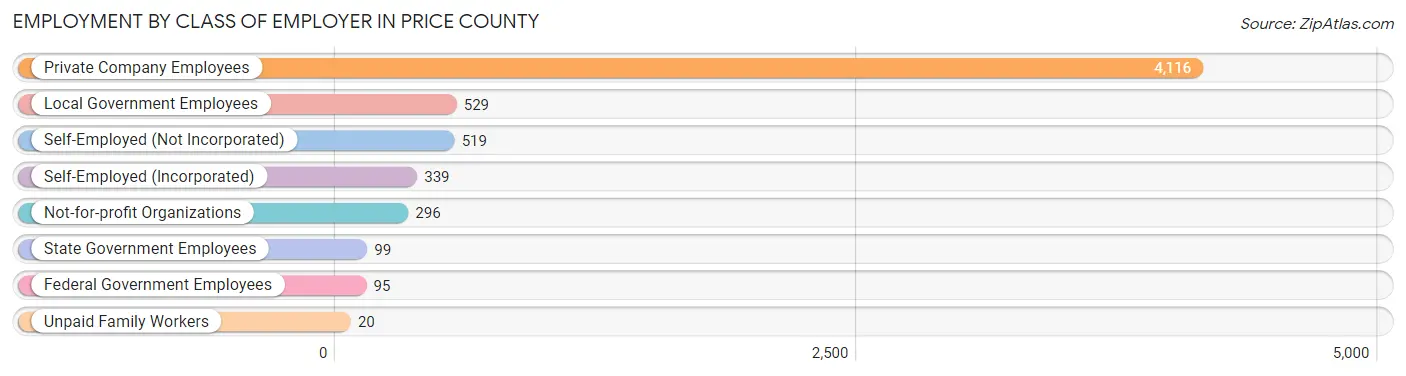
| Employer Class | # Employees | % Employees |
| Private Company Employees | 4,116 | 68.4% |
| Self-Employed (Incorporated) | 339 | 5.6% |
| Self-Employed (Not Incorporated) | 519 | 8.6% |
| Not-for-profit Organizations | 296 | 4.9% |
| Local Government Employees | 529 | 8.8% |
| State Government Employees | 99 | 1.7% |
| Federal Government Employees | 95 | 1.6% |
| Unpaid Family Workers | 20 | 0.3% |
| Total | 6,013 | 100.0% |
Employment Status by Age in Price County
According to the labor force statistics for Price County, out of the total population over 16 years of age (11,870), 53.4% or 6,339 individuals are in the labor force, with 2.7% or 171 of them unemployed. The age group with the highest labor force participation rate is 25 to 29 years, with 86.3% or 505 individuals in the labor force. Within the labor force, the 16 to 19 years age range has the highest percentage of unemployed individuals, with 5.5% or 17 of them being unemployed.
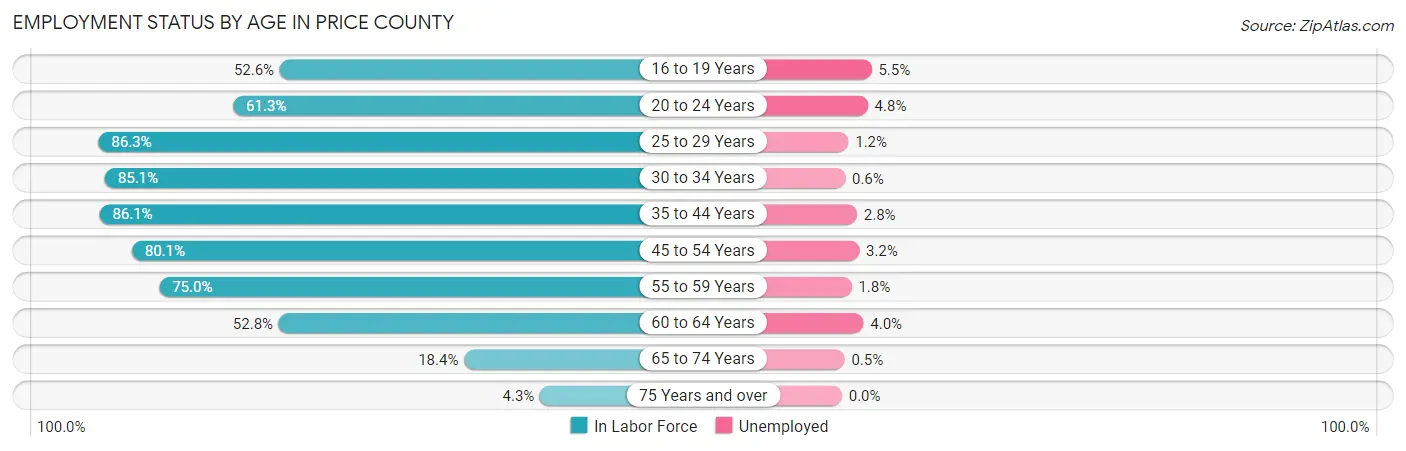
| Age Bracket | In Labor Force | Unemployed |
| 16 to 19 Years | 308 (52.6%) | 17 (5.5%) |
| 20 to 24 Years | 353 (61.3%) | 17 (4.8%) |
| 25 to 29 Years | 505 (86.3%) | 6 (1.2%) |
| 30 to 34 Years | 464 (85.1%) | 3 (0.6%) |
| 35 to 44 Years | 1,149 (86.1%) | 32 (2.8%) |
| 45 to 54 Years | 1,419 (80.1%) | 45 (3.2%) |
| 55 to 59 Years | 884 (75.0%) | 16 (1.8%) |
| 60 to 64 Years | 776 (52.8%) | 31 (4.0%) |
| 65 to 74 Years | 418 (18.4%) | 2 (0.5%) |
| 75 Years and over | 67 (4.3%) | 0 (0.0%) |
| Total | 6,339 (53.4%) | 171 (2.7%) |
Employment Status by Educational Attainment in Price County
According to labor force statistics for Price County, 75.5% of individuals (5,197) out of the total population between 25 and 64 years of age (6,883) are in the labor force, with 2.6% or 135 of them being unemployed. The group with the highest labor force participation rate are those with the educational attainment of bachelor's degree or higher, with 80.5% or 968 individuals in the labor force. Within the labor force, individuals with less than high school education have the highest percentage of unemployment, with 8.3% or 17 of them being unemployed.
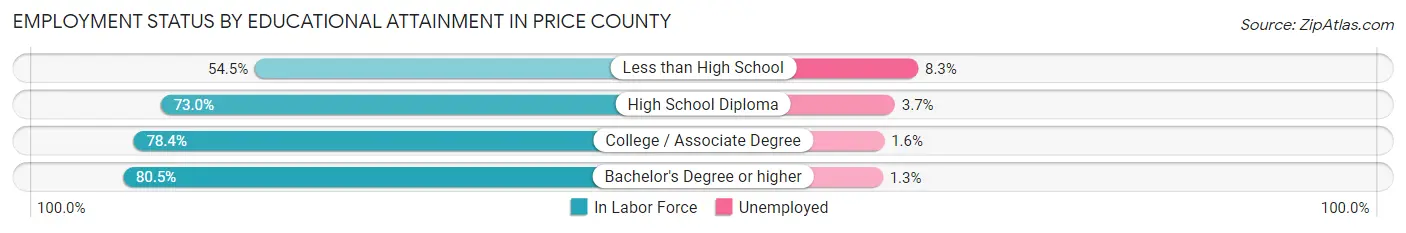
| Educational Attainment | In Labor Force | Unemployed |
| Less than High School | 205 (54.5%) | 31 (8.3%) |
| High School Diploma | 1,852 (73.0%) | 94 (3.7%) |
| College / Associate Degree | 2,169 (78.4%) | 44 (1.6%) |
| Bachelor's Degree or higher | 968 (80.5%) | 16 (1.3%) |
| Total | 5,197 (75.5%) | 179 (2.6%) |
Employment Occupations by Sex in Price County
Management, Business, Science and Arts Occupations
The most common Management, Business, Science and Arts occupations in Price County are Management (618 | 10.0%), Community & Social Service (434 | 7.0%), Health Diagnosing & Treating (258 | 4.2%), Education Instruction & Library (235 | 3.8%), and Business & Financial (234 | 3.8%).
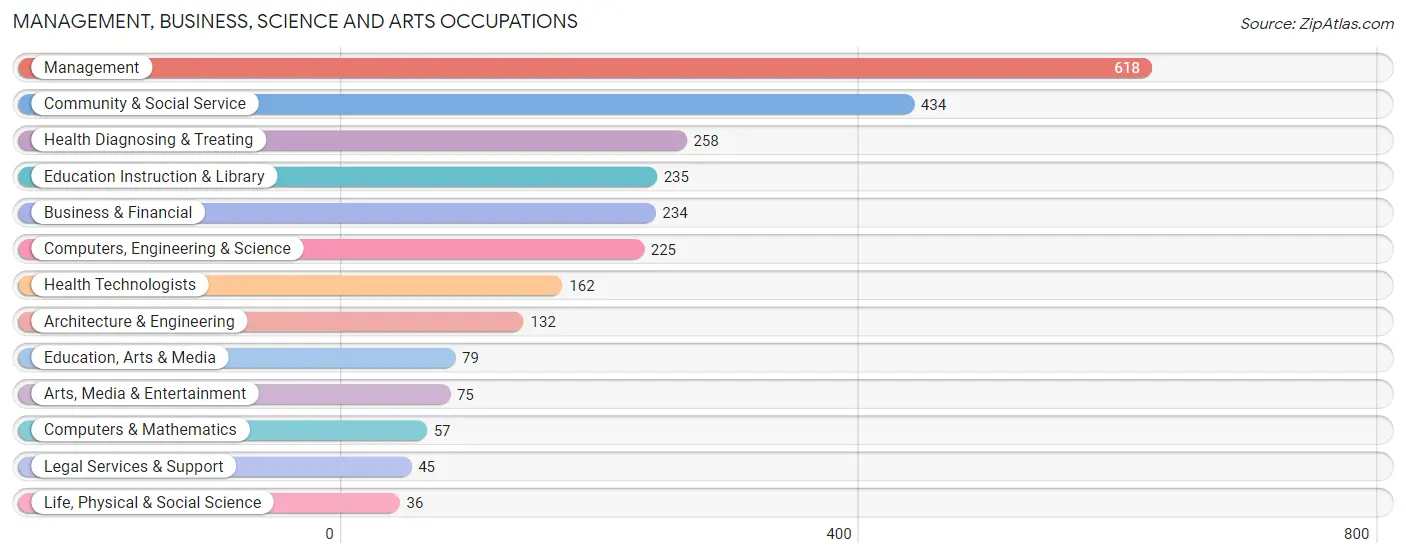
Management, Business, Science and Arts Occupations by Sex
Within the Management, Business, Science and Arts occupations in Price County, the most male-oriented occupations are Architecture & Engineering (81.8%), Computers, Engineering & Science (69.8%), and Life, Physical & Social Science (69.4%), while the most female-oriented occupations are Health Diagnosing & Treating (86.4%), Health Technologists (85.2%), and Education Instruction & Library (77.4%).
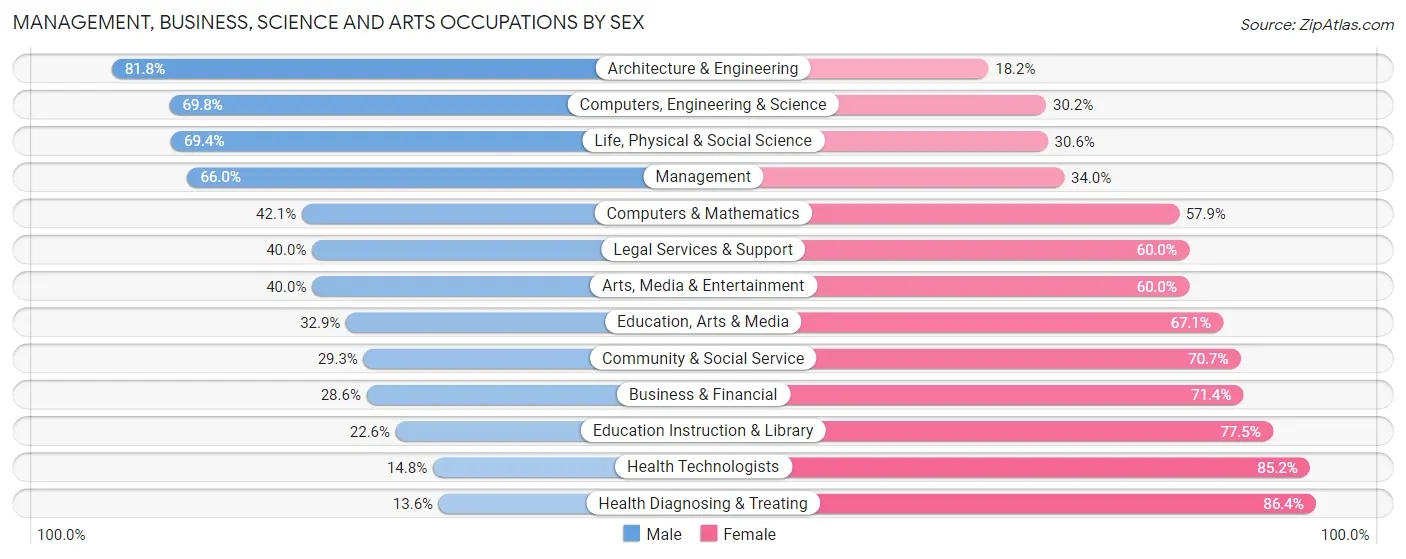
| Occupation | Male | Female |
| Management | 408 (66.0%) | 210 (34.0%) |
| Business & Financial | 67 (28.6%) | 167 (71.4%) |
| Computers, Engineering & Science | 157 (69.8%) | 68 (30.2%) |
| Computers & Mathematics | 24 (42.1%) | 33 (57.9%) |
| Architecture & Engineering | 108 (81.8%) | 24 (18.2%) |
| Life, Physical & Social Science | 25 (69.4%) | 11 (30.6%) |
| Community & Social Service | 127 (29.3%) | 307 (70.7%) |
| Education, Arts & Media | 26 (32.9%) | 53 (67.1%) |
| Legal Services & Support | 18 (40.0%) | 27 (60.0%) |
| Education Instruction & Library | 53 (22.6%) | 182 (77.4%) |
| Arts, Media & Entertainment | 30 (40.0%) | 45 (60.0%) |
| Health Diagnosing & Treating | 35 (13.6%) | 223 (86.4%) |
| Health Technologists | 24 (14.8%) | 138 (85.2%) |
| Total (Category) | 794 (44.9%) | 975 (55.1%) |
| Total (Overall) | 3,372 (54.6%) | 2,800 (45.4%) |
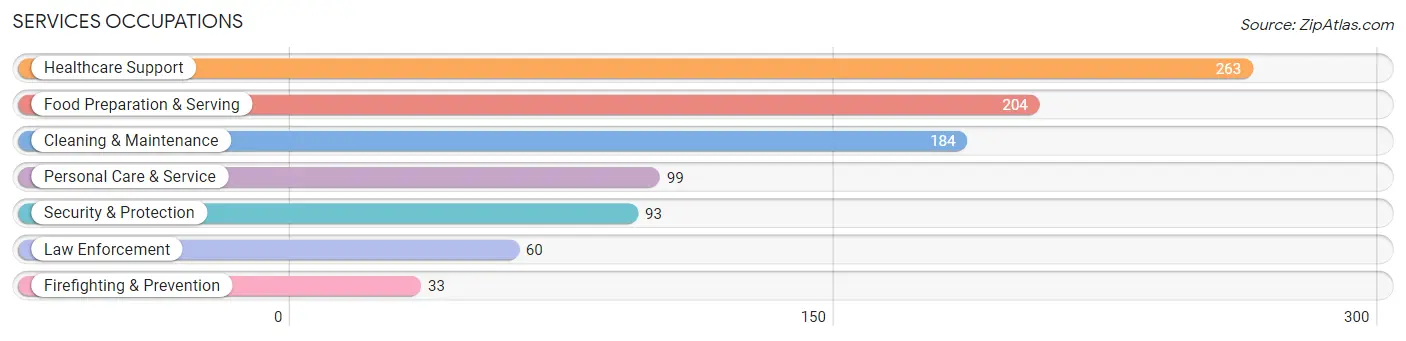
Services Occupations
The most common Services occupations in Price County are Healthcare Support (263 | 4.3%), Food Preparation & Serving (204 | 3.3%), Cleaning & Maintenance (184 | 3.0%), Personal Care & Service (99 | 1.6%), and Security & Protection (93 | 1.5%).
Services Occupations by Sex
Within the Services occupations in Price County, the most male-oriented occupations are Law Enforcement (86.7%), Security & Protection (85.0%), and Firefighting & Prevention (81.8%), while the most female-oriented occupations are Personal Care & Service (89.9%), Healthcare Support (78.7%), and Food Preparation & Serving (74.5%).
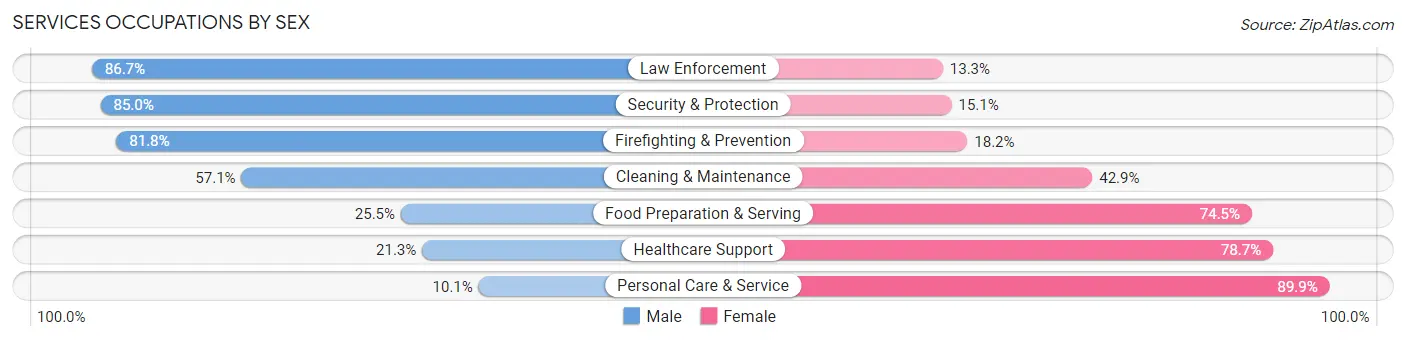
| Occupation | Male | Female |
| Healthcare Support | 56 (21.3%) | 207 (78.7%) |
| Security & Protection | 79 (85.0%) | 14 (15.0%) |
| Firefighting & Prevention | 27 (81.8%) | 6 (18.2%) |
| Law Enforcement | 52 (86.7%) | 8 (13.3%) |
| Food Preparation & Serving | 52 (25.5%) | 152 (74.5%) |
| Cleaning & Maintenance | 105 (57.1%) | 79 (42.9%) |
| Personal Care & Service | 10 (10.1%) | 89 (89.9%) |
| Total (Category) | 302 (35.8%) | 541 (64.2%) |
| Total (Overall) | 3,372 (54.6%) | 2,800 (45.4%) |
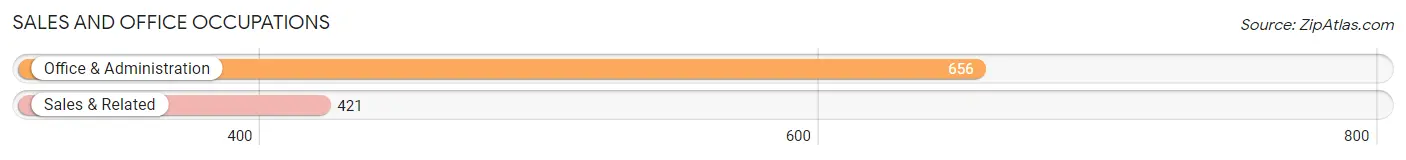
Sales and Office Occupations
The most common Sales and Office occupations in Price County are Office & Administration (656 | 10.6%), and Sales & Related (421 | 6.8%).
Sales and Office Occupations by Sex
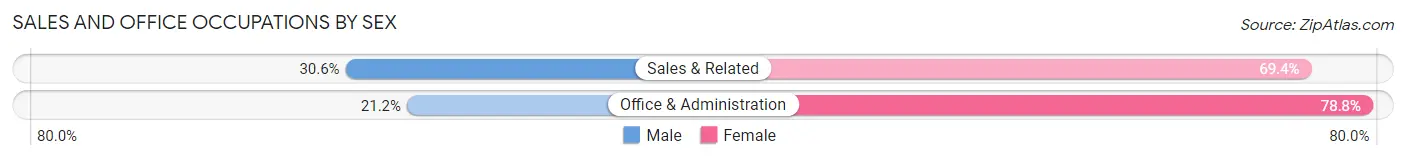
| Occupation | Male | Female |
| Sales & Related | 129 (30.6%) | 292 (69.4%) |
| Office & Administration | 139 (21.2%) | 517 (78.8%) |
| Total (Category) | 268 (24.9%) | 809 (75.1%) |
| Total (Overall) | 3,372 (54.6%) | 2,800 (45.4%) |
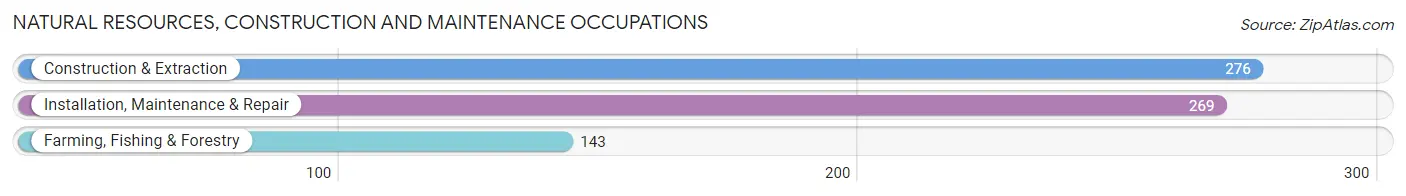
Natural Resources, Construction and Maintenance Occupations
The most common Natural Resources, Construction and Maintenance occupations in Price County are Construction & Extraction (276 | 4.5%), Installation, Maintenance & Repair (269 | 4.4%), and Farming, Fishing & Forestry (143 | 2.3%).
Natural Resources, Construction and Maintenance Occupations by Sex
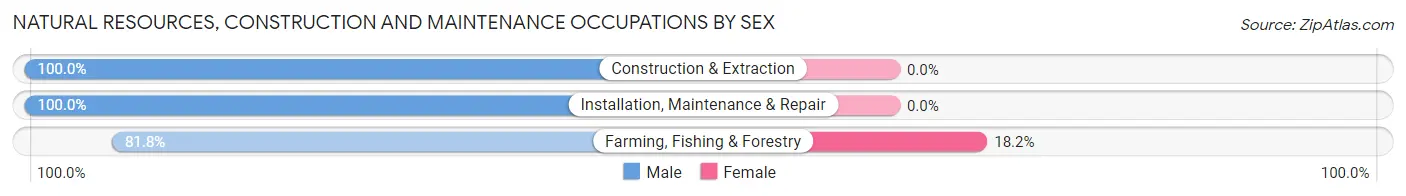
| Occupation | Male | Female |
| Farming, Fishing & Forestry | 117 (81.8%) | 26 (18.2%) |
| Construction & Extraction | 276 (100.0%) | 0 (0.0%) |
| Installation, Maintenance & Repair | 269 (100.0%) | 0 (0.0%) |
| Total (Category) | 662 (96.2%) | 26 (3.8%) |
| Total (Overall) | 3,372 (54.6%) | 2,800 (45.4%) |
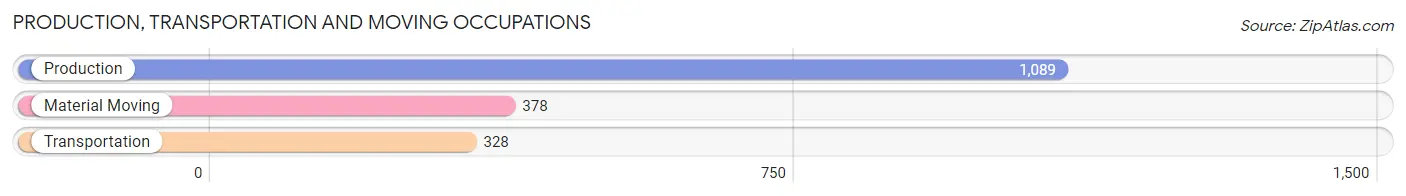
Production, Transportation and Moving Occupations
The most common Production, Transportation and Moving occupations in Price County are Production (1,089 | 17.6%), Material Moving (378 | 6.1%), and Transportation (328 | 5.3%).
Production, Transportation and Moving Occupations by Sex
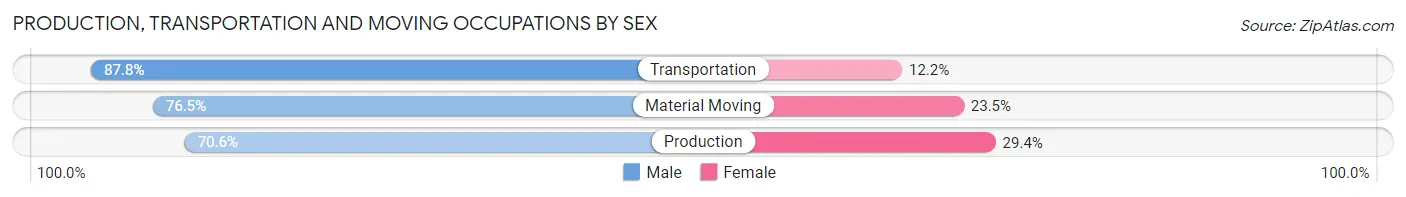
| Occupation | Male | Female |
| Production | 769 (70.6%) | 320 (29.4%) |
| Transportation | 288 (87.8%) | 40 (12.2%) |
| Material Moving | 289 (76.5%) | 89 (23.5%) |
| Total (Category) | 1,346 (75.0%) | 449 (25.0%) |
| Total (Overall) | 3,372 (54.6%) | 2,800 (45.4%) |
Employment Industries by Sex in Price County
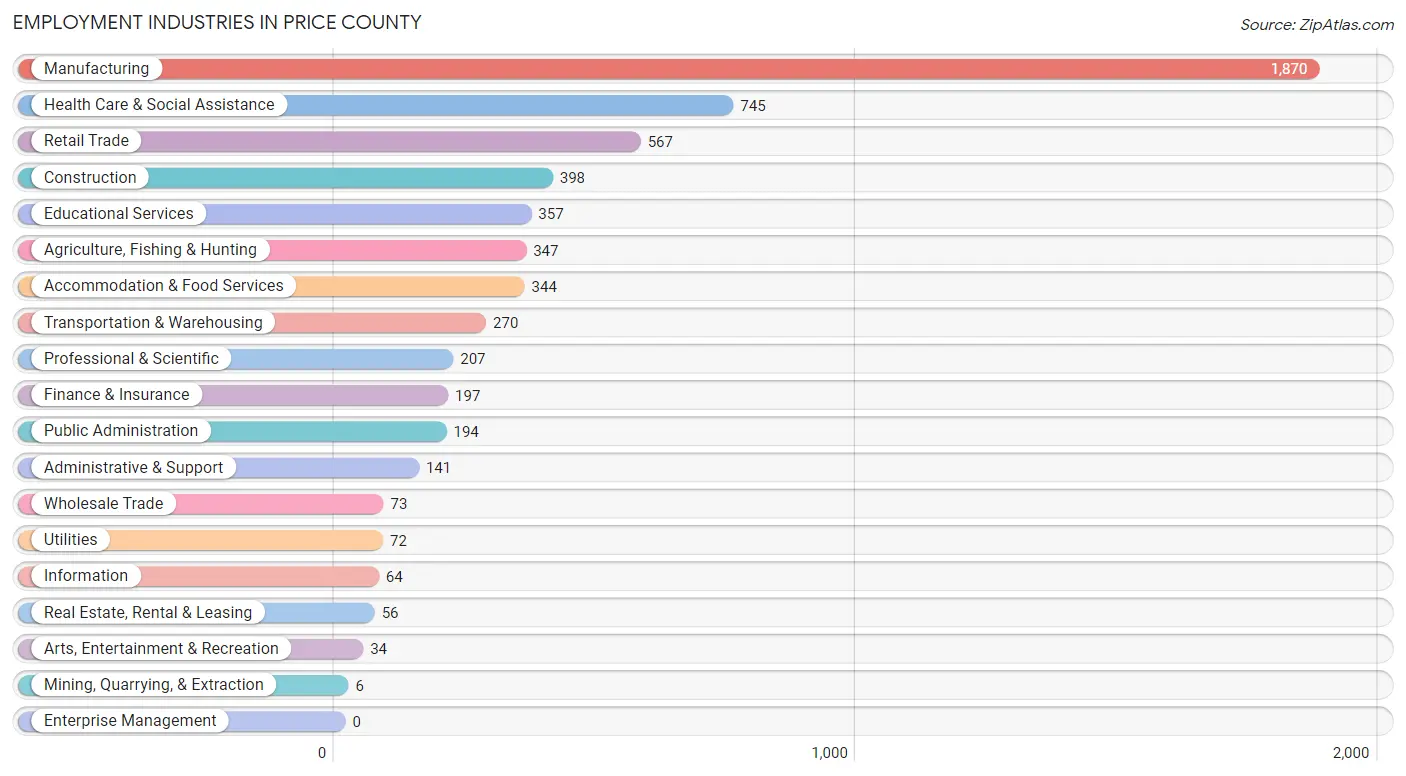
Employment Industries in Price County
The major employment industries in Price County include Manufacturing (1,870 | 30.3%), Health Care & Social Assistance (745 | 12.1%), Retail Trade (567 | 9.2%), Construction (398 | 6.5%), and Educational Services (357 | 5.8%).
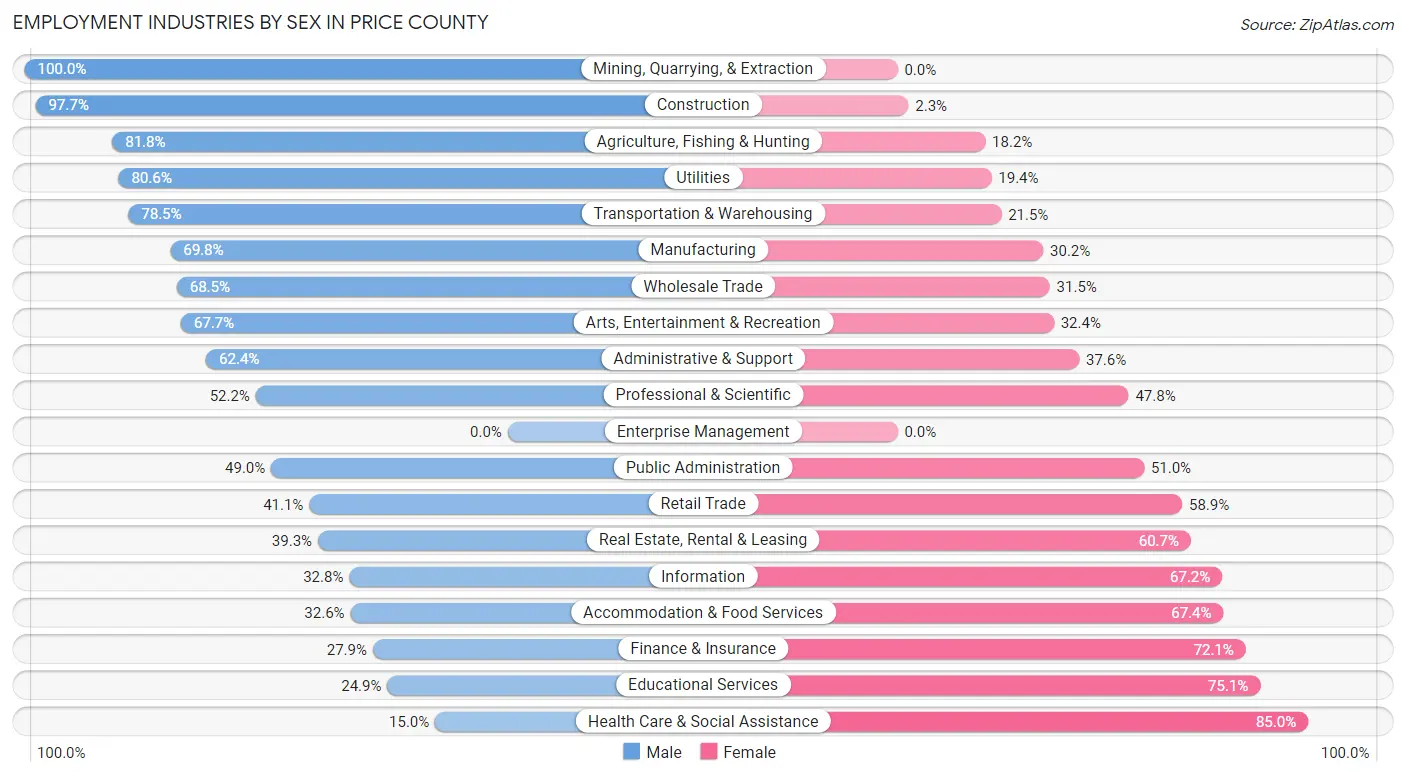
Employment Industries by Sex in Price County
The Price County industries that see more men than women are Mining, Quarrying, & Extraction (100.0%), Construction (97.7%), and Agriculture, Fishing & Hunting (81.8%), whereas the industries that tend to have a higher number of women are Health Care & Social Assistance (85.0%), Educational Services (75.1%), and Finance & Insurance (72.1%).
| Industry | Male | Female |
| Agriculture, Fishing & Hunting | 284 (81.8%) | 63 (18.2%) |
| Mining, Quarrying, & Extraction | 6 (100.0%) | 0 (0.0%) |
| Construction | 389 (97.7%) | 9 (2.3%) |
| Manufacturing | 1,306 (69.8%) | 564 (30.2%) |
| Wholesale Trade | 50 (68.5%) | 23 (31.5%) |
| Retail Trade | 233 (41.1%) | 334 (58.9%) |
| Transportation & Warehousing | 212 (78.5%) | 58 (21.5%) |
| Utilities | 58 (80.6%) | 14 (19.4%) |
| Information | 21 (32.8%) | 43 (67.2%) |
| Finance & Insurance | 55 (27.9%) | 142 (72.1%) |
| Real Estate, Rental & Leasing | 22 (39.3%) | 34 (60.7%) |
| Professional & Scientific | 108 (52.2%) | 99 (47.8%) |
| Enterprise Management | 0 (0.0%) | 0 (0.0%) |
| Administrative & Support | 88 (62.4%) | 53 (37.6%) |
| Educational Services | 89 (24.9%) | 268 (75.1%) |
| Health Care & Social Assistance | 112 (15.0%) | 633 (85.0%) |
| Arts, Entertainment & Recreation | 23 (67.6%) | 11 (32.4%) |
| Accommodation & Food Services | 112 (32.6%) | 232 (67.4%) |
| Public Administration | 95 (49.0%) | 99 (51.0%) |
| Total | 3,372 (54.6%) | 2,800 (45.4%) |
Education in Price County
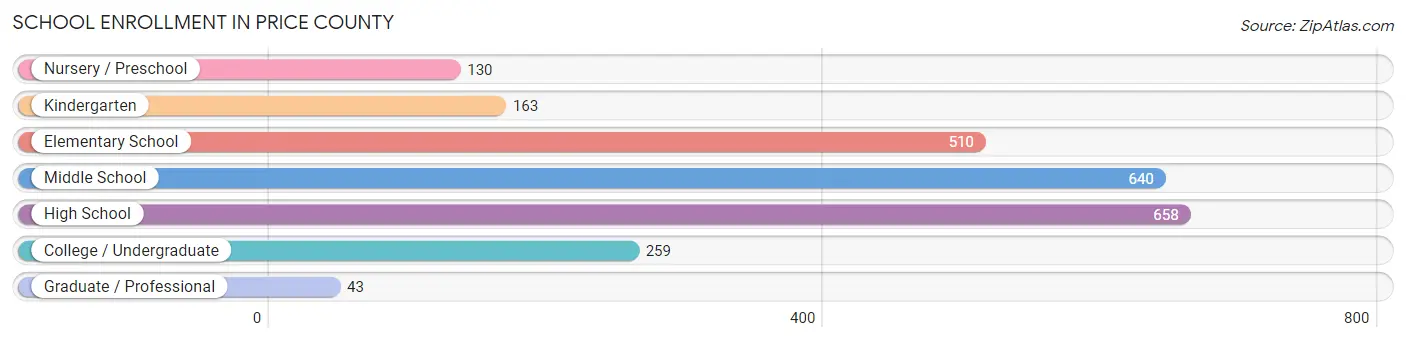
School Enrollment in Price County
The most common levels of schooling among the 2,403 students in Price County are high school (658 | 27.4%), middle school (640 | 26.6%), and elementary school (510 | 21.2%).
| School Level | # Students | % Students |
| Nursery / Preschool | 130 | 5.4% |
| Kindergarten | 163 | 6.8% |
| Elementary School | 510 | 21.2% |
| Middle School | 640 | 26.6% |
| High School | 658 | 27.4% |
| College / Undergraduate | 259 | 10.8% |
| Graduate / Professional | 43 | 1.8% |
| Total | 2,403 | 100.0% |
School Enrollment by Age by Funding Source in Price County
Out of a total of 2,403 students who are enrolled in schools in Price County, 339 (14.1%) attend a private institution, while the remaining 2,064 (85.9%) are enrolled in public schools. The age group of 18 to 19 year olds has the highest likelihood of being enrolled in private schools, with 51 (31.5% in the age bracket) enrolled. Conversely, the age group of 25 to 34 year olds has the lowest likelihood of being enrolled in a private school, with 43 (97.7% in the age bracket) attending a public institution.
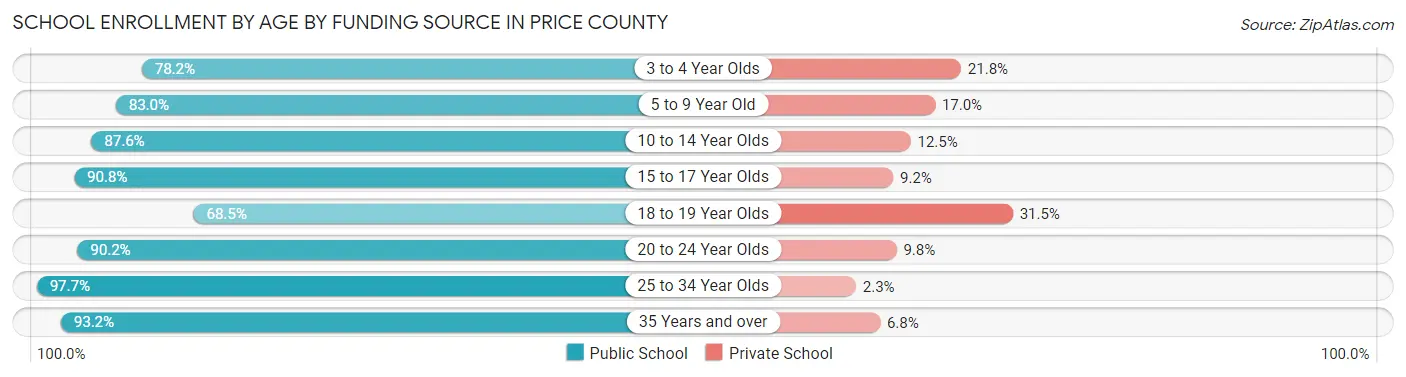
| Age Bracket | Public School | Private School |
| 3 to 4 Year Olds | 68 (78.2%) | 19 (21.8%) |
| 5 to 9 Year Old | 532 (83.0%) | 109 (17.0%) |
| 10 to 14 Year Olds | 696 (87.5%) | 99 (12.4%) |
| 15 to 17 Year Olds | 434 (90.8%) | 44 (9.2%) |
| 18 to 19 Year Olds | 111 (68.5%) | 51 (31.5%) |
| 20 to 24 Year Olds | 110 (90.2%) | 12 (9.8%) |
| 25 to 34 Year Olds | 43 (97.7%) | 1 (2.3%) |
| 35 Years and over | 69 (93.2%) | 5 (6.8%) |
| Total | 2,064 (85.9%) | 339 (14.1%) |
Educational Attainment by Field of Study in Price County
Education (385 | 21.1%), business (312 | 17.1%), science & technology (215 | 11.8%), engineering (185 | 10.2%), and bio, nature & agricultural (169 | 9.3%) are the most common fields of study among 1,820 individuals in Price County who have obtained a bachelor's degree or higher.
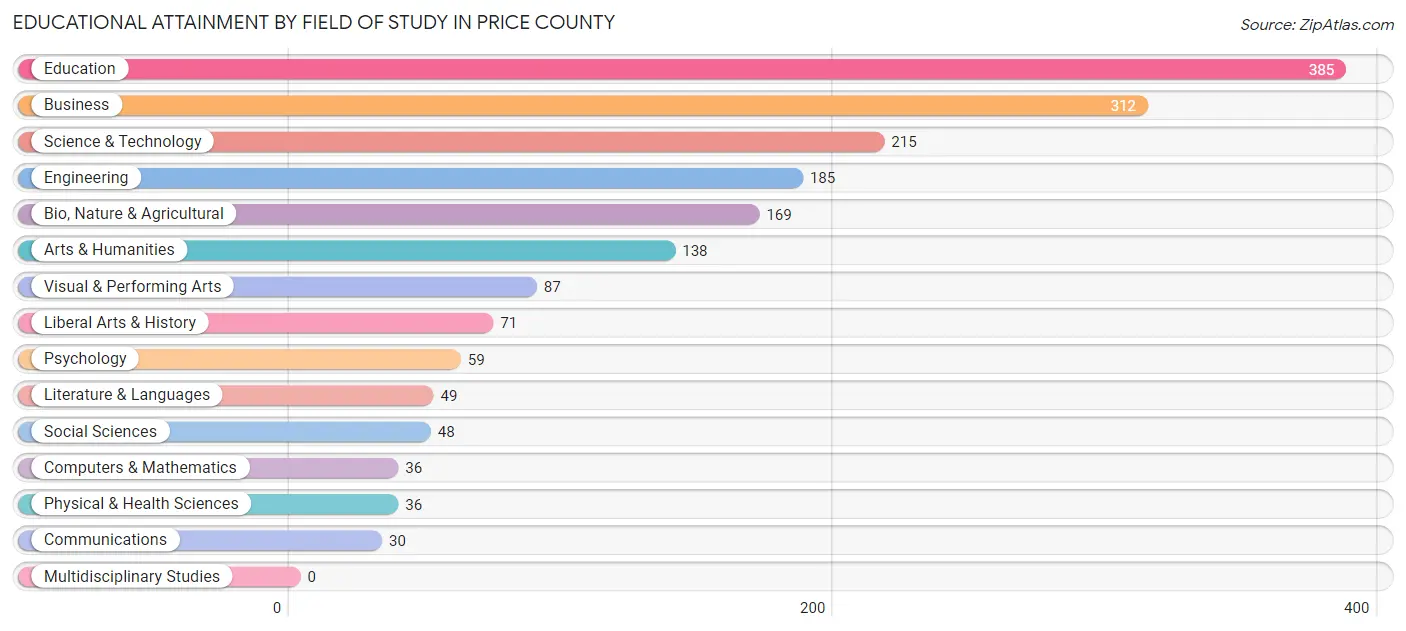
| Field of Study | # Graduates | % Graduates |
| Computers & Mathematics | 36 | 2.0% |
| Bio, Nature & Agricultural | 169 | 9.3% |
| Physical & Health Sciences | 36 | 2.0% |
| Psychology | 59 | 3.2% |
| Social Sciences | 48 | 2.6% |
| Engineering | 185 | 10.2% |
| Multidisciplinary Studies | 0 | 0.0% |
| Science & Technology | 215 | 11.8% |
| Business | 312 | 17.1% |
| Education | 385 | 21.1% |
| Literature & Languages | 49 | 2.7% |
| Liberal Arts & History | 71 | 3.9% |
| Visual & Performing Arts | 87 | 4.8% |
| Communications | 30 | 1.7% |
| Arts & Humanities | 138 | 7.6% |
| Total | 1,820 | 100.0% |
Transportation & Commute in Price County
Vehicle Availability by Sex in Price County
The most prevalent vehicle ownership categories in Price County are males with 2 vehicles (1,476, accounting for 45.3%) and females with 2 vehicles (1,135, making up 53.6%).

| Vehicles Available | Male | Female |
| No Vehicle | 71 (2.2%) | 51 (1.8%) |
| 1 Vehicle | 458 (14.1%) | 538 (19.6%) |
| 2 Vehicles | 1,476 (45.3%) | 1,135 (41.3%) |
| 3 Vehicles | 756 (23.2%) | 608 (22.1%) |
| 4 Vehicles | 286 (8.8%) | 259 (9.4%) |
| 5 or more Vehicles | 210 (6.5%) | 160 (5.8%) |
| Total | 3,257 (100.0%) | 2,751 (100.0%) |
Commute Time in Price County
The most frequently occuring commute durations in Price County are 5 to 9 minutes (1,064 commuters, 18.9%), 10 to 14 minutes (890 commuters, 15.8%), and 15 to 19 minutes (775 commuters, 13.8%).
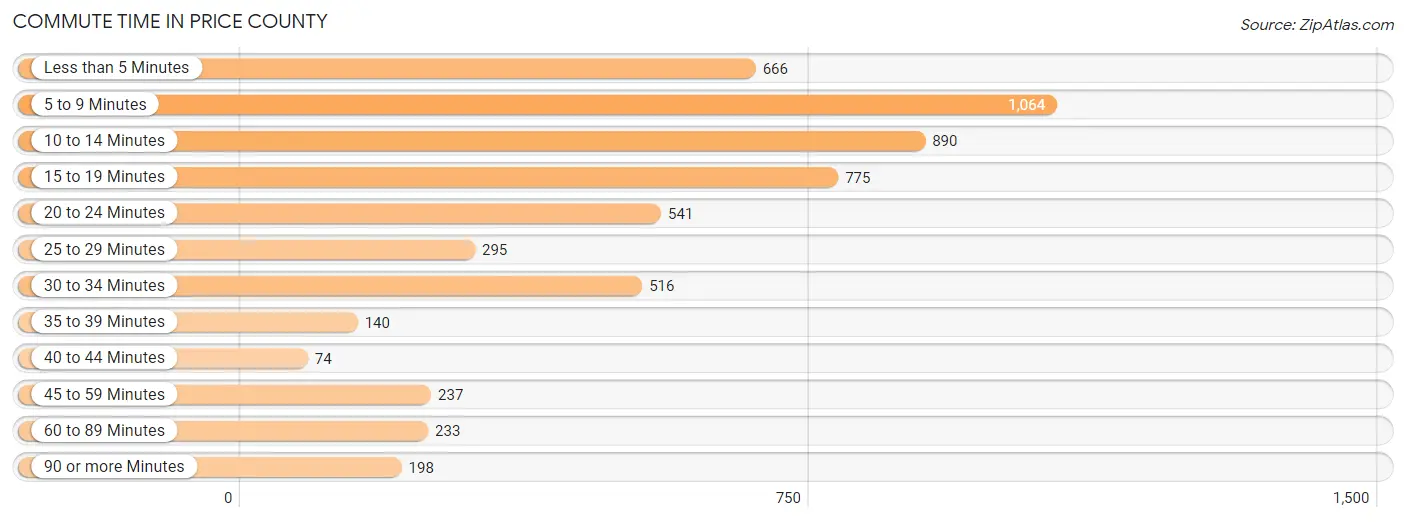
| Commute Time | # Commuters | % Commuters |
| Less than 5 Minutes | 666 | 11.8% |
| 5 to 9 Minutes | 1,064 | 18.9% |
| 10 to 14 Minutes | 890 | 15.8% |
| 15 to 19 Minutes | 775 | 13.8% |
| 20 to 24 Minutes | 541 | 9.6% |
| 25 to 29 Minutes | 295 | 5.2% |
| 30 to 34 Minutes | 516 | 9.2% |
| 35 to 39 Minutes | 140 | 2.5% |
| 40 to 44 Minutes | 74 | 1.3% |
| 45 to 59 Minutes | 237 | 4.2% |
| 60 to 89 Minutes | 233 | 4.1% |
| 90 or more Minutes | 198 | 3.5% |
Commute Time by Sex in Price County
The most common commute times in Price County are 5 to 9 minutes (543 commuters, 17.6%) for males and 5 to 9 minutes (521 commuters, 20.5%) for females.
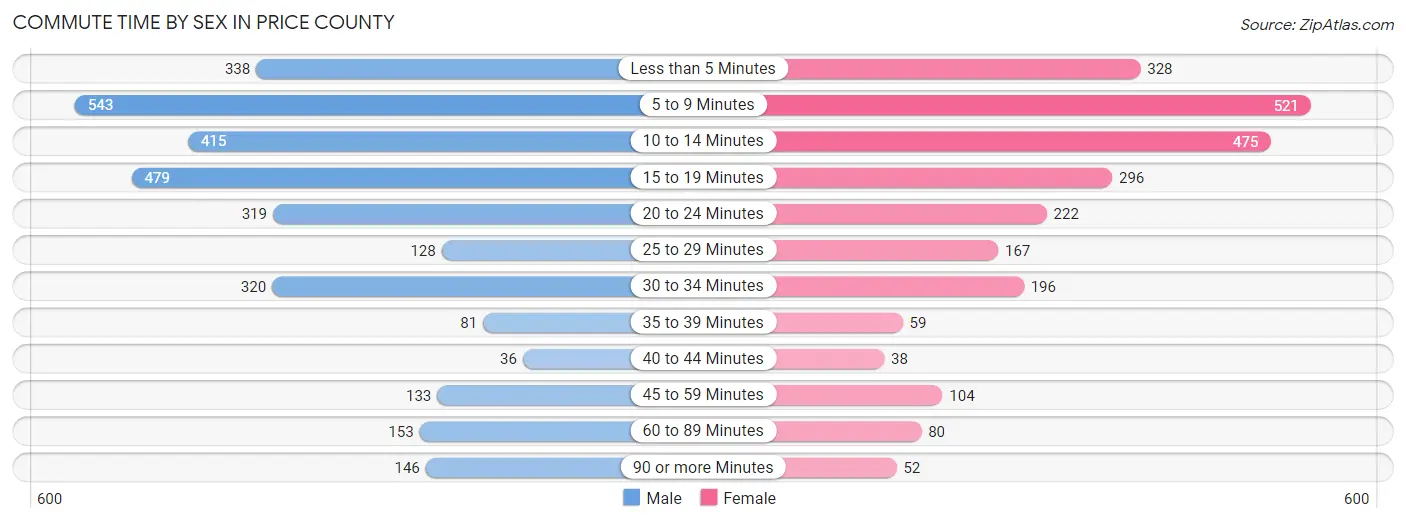
| Commute Time | Male | Female |
| Less than 5 Minutes | 338 (10.9%) | 328 (12.9%) |
| 5 to 9 Minutes | 543 (17.6%) | 521 (20.5%) |
| 10 to 14 Minutes | 415 (13.4%) | 475 (18.7%) |
| 15 to 19 Minutes | 479 (15.5%) | 296 (11.7%) |
| 20 to 24 Minutes | 319 (10.3%) | 222 (8.7%) |
| 25 to 29 Minutes | 128 (4.1%) | 167 (6.6%) |
| 30 to 34 Minutes | 320 (10.3%) | 196 (7.7%) |
| 35 to 39 Minutes | 81 (2.6%) | 59 (2.3%) |
| 40 to 44 Minutes | 36 (1.2%) | 38 (1.5%) |
| 45 to 59 Minutes | 133 (4.3%) | 104 (4.1%) |
| 60 to 89 Minutes | 153 (5.0%) | 80 (3.2%) |
| 90 or more Minutes | 146 (4.7%) | 52 (2.1%) |
Time of Departure to Work by Sex in Price County
The most frequent times of departure to work in Price County are 12:00 AM to 4:59 AM (628, 20.3%) for males and 7:30 AM to 7:59 AM (402, 15.8%) for females.
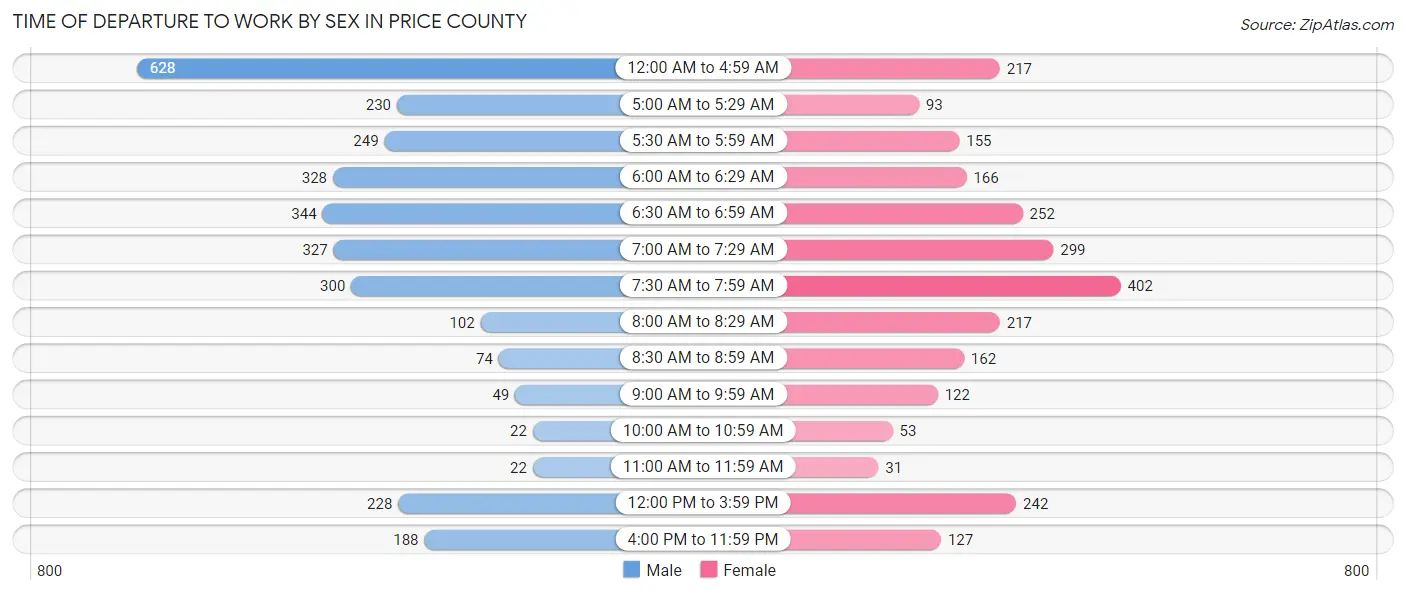
| Time of Departure | Male | Female |
| 12:00 AM to 4:59 AM | 628 (20.3%) | 217 (8.6%) |
| 5:00 AM to 5:29 AM | 230 (7.4%) | 93 (3.7%) |
| 5:30 AM to 5:59 AM | 249 (8.1%) | 155 (6.1%) |
| 6:00 AM to 6:29 AM | 328 (10.6%) | 166 (6.5%) |
| 6:30 AM to 6:59 AM | 344 (11.1%) | 252 (9.9%) |
| 7:00 AM to 7:29 AM | 327 (10.6%) | 299 (11.8%) |
| 7:30 AM to 7:59 AM | 300 (9.7%) | 402 (15.8%) |
| 8:00 AM to 8:29 AM | 102 (3.3%) | 217 (8.6%) |
| 8:30 AM to 8:59 AM | 74 (2.4%) | 162 (6.4%) |
| 9:00 AM to 9:59 AM | 49 (1.6%) | 122 (4.8%) |
| 10:00 AM to 10:59 AM | 22 (0.7%) | 53 (2.1%) |
| 11:00 AM to 11:59 AM | 22 (0.7%) | 31 (1.2%) |
| 12:00 PM to 3:59 PM | 228 (7.4%) | 242 (9.5%) |
| 4:00 PM to 11:59 PM | 188 (6.1%) | 127 (5.0%) |
| Total | 3,091 (100.0%) | 2,538 (100.0%) |
Housing Occupancy in Price County
Occupancy by Ownership in Price County
Of the total 6,630 dwellings in Price County, owner-occupied units account for 5,272 (79.5%), while renter-occupied units make up 1,358 (20.5%).
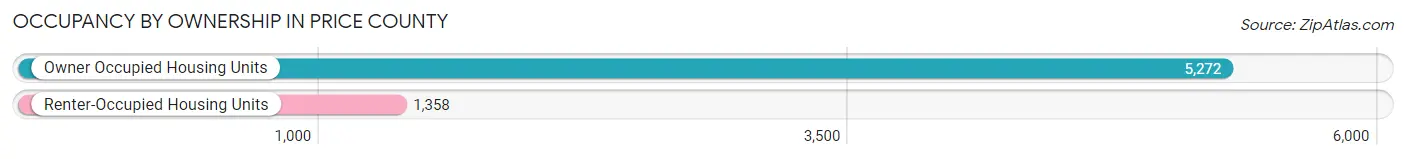
| Occupancy | # Housing Units | % Housing Units |
| Owner Occupied Housing Units | 5,272 | 79.5% |
| Renter-Occupied Housing Units | 1,358 | 20.5% |
| Total Occupied Housing Units | 6,630 | 100.0% |
Occupancy by Household Size in Price County
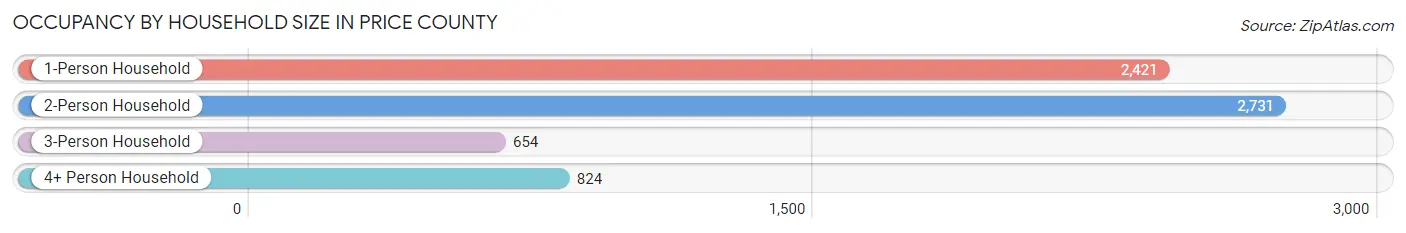
| Household Size | # Housing Units | % Housing Units |
| 1-Person Household | 2,421 | 36.5% |
| 2-Person Household | 2,731 | 41.2% |
| 3-Person Household | 654 | 9.9% |
| 4+ Person Household | 824 | 12.4% |
| Total Housing Units | 6,630 | 100.0% |
Occupancy by Ownership by Household Size in Price County
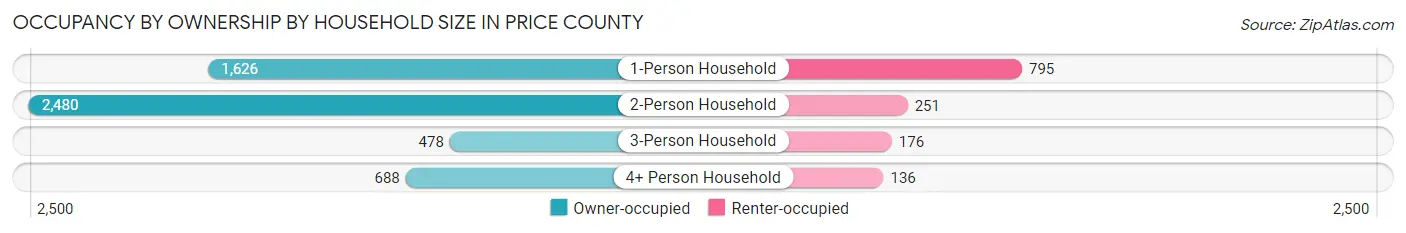
| Household Size | Owner-occupied | Renter-occupied |
| 1-Person Household | 1,626 (67.2%) | 795 (32.8%) |
| 2-Person Household | 2,480 (90.8%) | 251 (9.2%) |
| 3-Person Household | 478 (73.1%) | 176 (26.9%) |
| 4+ Person Household | 688 (83.5%) | 136 (16.5%) |
| Total Housing Units | 5,272 (79.5%) | 1,358 (20.5%) |
Occupancy by Educational Attainment in Price County
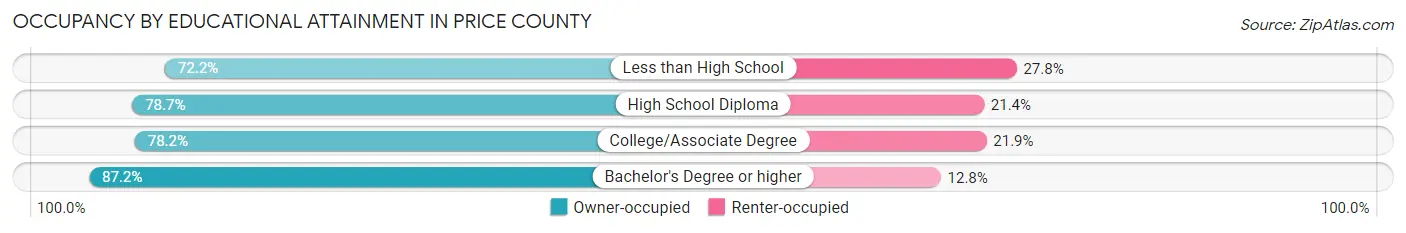
| Household Size | Owner-occupied | Renter-occupied |
| Less than High School | 301 (72.2%) | 116 (27.8%) |
| High School Diploma | 2,092 (78.6%) | 568 (21.3%) |
| College/Associate Degree | 1,896 (78.1%) | 530 (21.8%) |
| Bachelor's Degree or higher | 983 (87.2%) | 144 (12.8%) |
Occupancy by Age of Householder in Price County
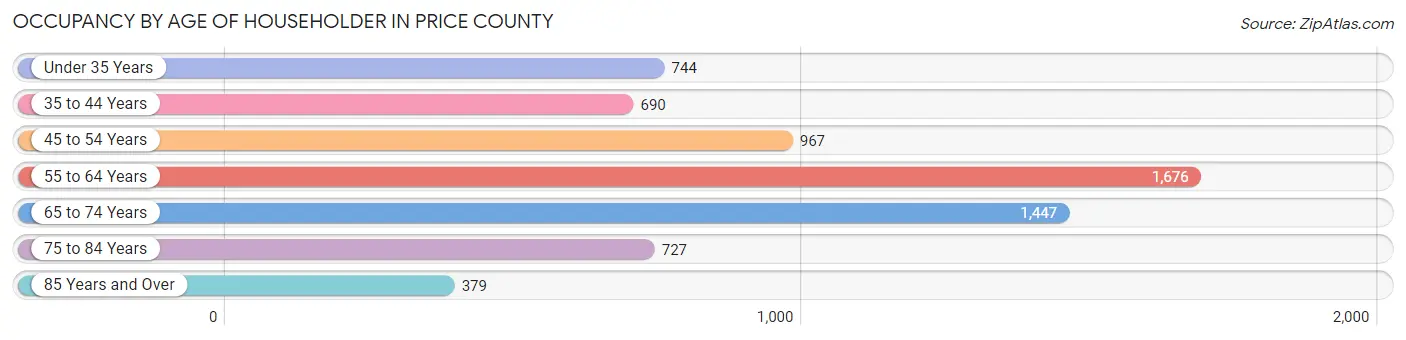
| Age Bracket | # Households | % Households |
| Under 35 Years | 744 | 11.2% |
| 35 to 44 Years | 690 | 10.4% |
| 45 to 54 Years | 967 | 14.6% |
| 55 to 64 Years | 1,676 | 25.3% |
| 65 to 74 Years | 1,447 | 21.8% |
| 75 to 84 Years | 727 | 11.0% |
| 85 Years and Over | 379 | 5.7% |
| Total | 6,630 | 100.0% |
Housing Finances in Price County
Median Income by Occupancy in Price County
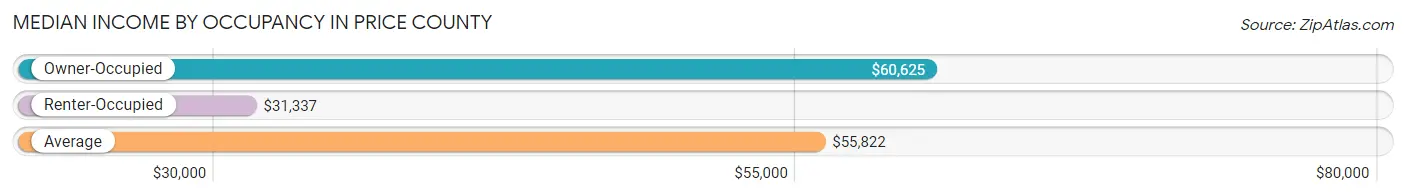
| Occupancy Type | # Households | Median Income |
| Owner-Occupied | 5,272 (79.5%) | $60,625 |
| Renter-Occupied | 1,358 (20.5%) | $31,337 |
| Average | 6,630 (100.0%) | $55,822 |
Occupancy by Householder Income Bracket in Price County

| Income Bracket | Owner-occupied | Renter-occupied |
| Less than $5,000 | 105 (2.0%) | 75 (5.5%) |
| $5,000 to $9,999 | 71 (1.3%) | 49 (3.6%) |
| $10,000 to $14,999 | 147 (2.8%) | 138 (10.2%) |
| $15,000 to $19,999 | 165 (3.1%) | 78 (5.7%) |
| $20,000 to $24,999 | 266 (5.1%) | 182 (13.4%) |
| $25,000 to $34,999 | 535 (10.2%) | 219 (16.1%) |
| $35,000 to $49,999 | 708 (13.4%) | 224 (16.5%) |
| $50,000 to $74,999 | 1,258 (23.9%) | 210 (15.5%) |
| $75,000 to $99,999 | 768 (14.6%) | 123 (9.1%) |
| $100,000 to $149,999 | 806 (15.3%) | 33 (2.4%) |
| $150,000 or more | 443 (8.4%) | 27 (2.0%) |
| Total | 5,272 (100.0%) | 1,358 (100.0%) |
Monthly Housing Cost Tiers in Price County
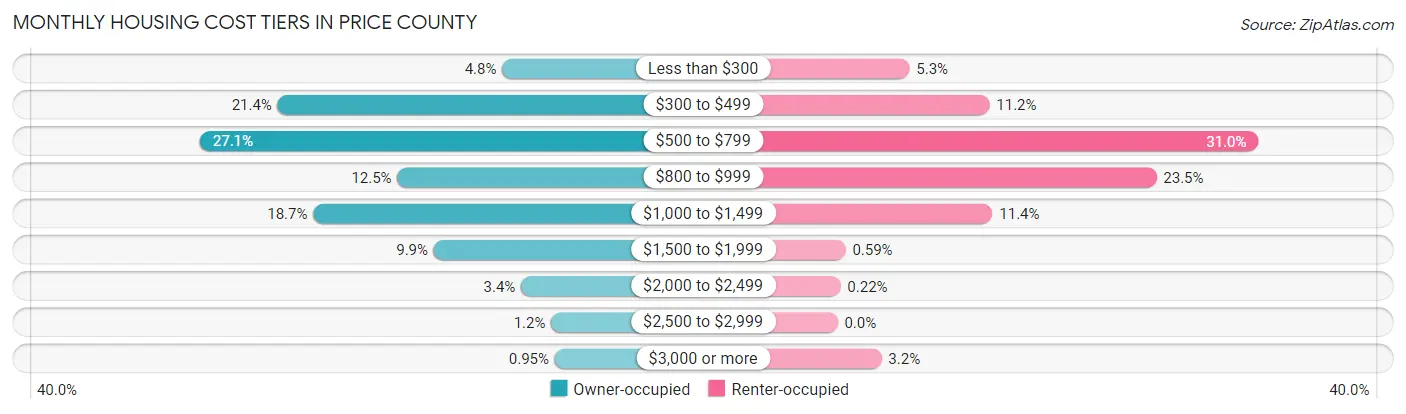
| Monthly Cost | Owner-occupied | Renter-occupied |
| Less than $300 | 254 (4.8%) | 72 (5.3%) |
| $300 to $499 | 1,126 (21.4%) | 152 (11.2%) |
| $500 to $799 | 1,428 (27.1%) | 421 (31.0%) |
| $800 to $999 | 661 (12.5%) | 319 (23.5%) |
| $1,000 to $1,499 | 988 (18.7%) | 155 (11.4%) |
| $1,500 to $1,999 | 520 (9.9%) | 8 (0.6%) |
| $2,000 to $2,499 | 181 (3.4%) | 3 (0.2%) |
| $2,500 to $2,999 | 64 (1.2%) | 0 (0.0%) |
| $3,000 or more | 50 (0.9%) | 44 (3.2%) |
| Total | 5,272 (100.0%) | 1,358 (100.0%) |
Physical Housing Characteristics in Price County
Housing Structures in Price County
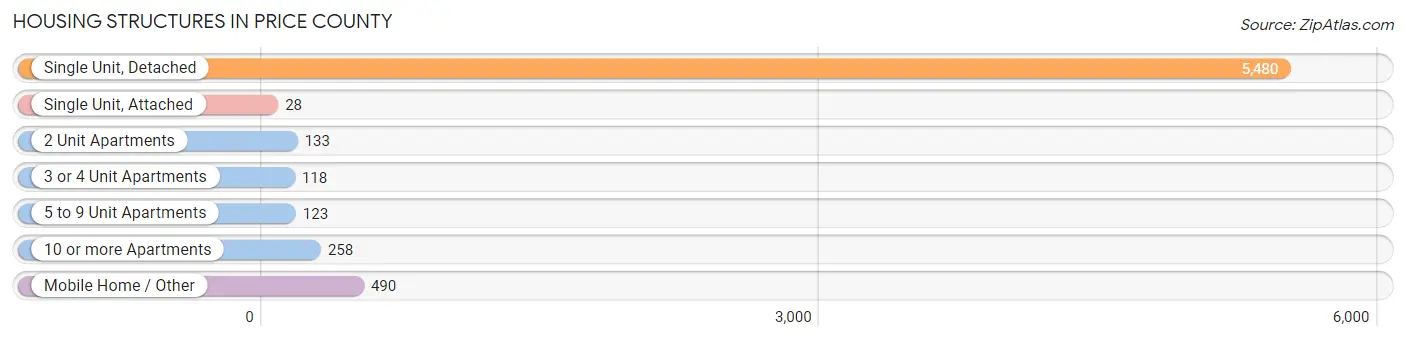
| Structure Type | # Housing Units | % Housing Units |
| Single Unit, Detached | 5,480 | 82.7% |
| Single Unit, Attached | 28 | 0.4% |
| 2 Unit Apartments | 133 | 2.0% |
| 3 or 4 Unit Apartments | 118 | 1.8% |
| 5 to 9 Unit Apartments | 123 | 1.9% |
| 10 or more Apartments | 258 | 3.9% |
| Mobile Home / Other | 490 | 7.4% |
| Total | 6,630 | 100.0% |
Housing Structures by Occupancy in Price County
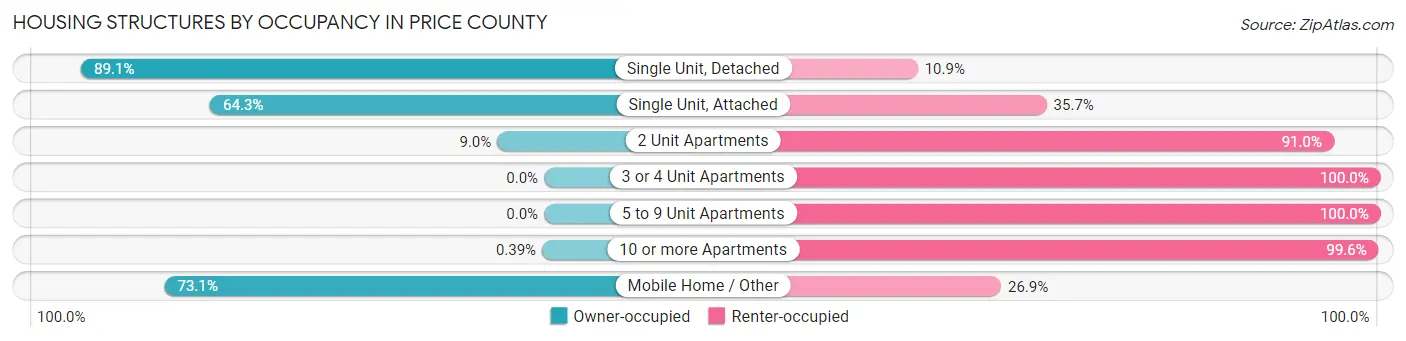
| Structure Type | Owner-occupied | Renter-occupied |
| Single Unit, Detached | 4,883 (89.1%) | 597 (10.9%) |
| Single Unit, Attached | 18 (64.3%) | 10 (35.7%) |
| 2 Unit Apartments | 12 (9.0%) | 121 (91.0%) |
| 3 or 4 Unit Apartments | 0 (0.0%) | 118 (100.0%) |
| 5 to 9 Unit Apartments | 0 (0.0%) | 123 (100.0%) |
| 10 or more Apartments | 1 (0.4%) | 257 (99.6%) |
| Mobile Home / Other | 358 (73.1%) | 132 (26.9%) |
| Total | 5,272 (79.5%) | 1,358 (20.5%) |
Housing Structures by Number of Rooms in Price County
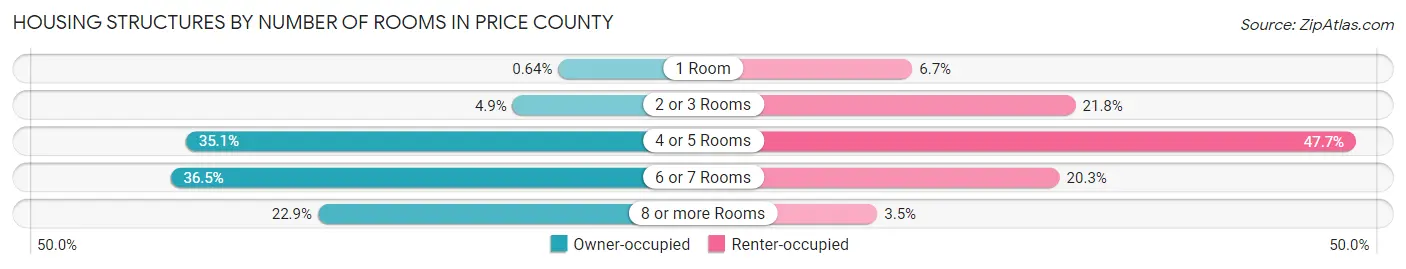
| Number of Rooms | Owner-occupied | Renter-occupied |
| 1 Room | 34 (0.6%) | 91 (6.7%) |
| 2 or 3 Rooms | 257 (4.9%) | 296 (21.8%) |
| 4 or 5 Rooms | 1,850 (35.1%) | 648 (47.7%) |
| 6 or 7 Rooms | 1,925 (36.5%) | 276 (20.3%) |
| 8 or more Rooms | 1,206 (22.9%) | 47 (3.5%) |
| Total | 5,272 (100.0%) | 1,358 (100.0%) |
Housing Structure by Heating Type in Price County
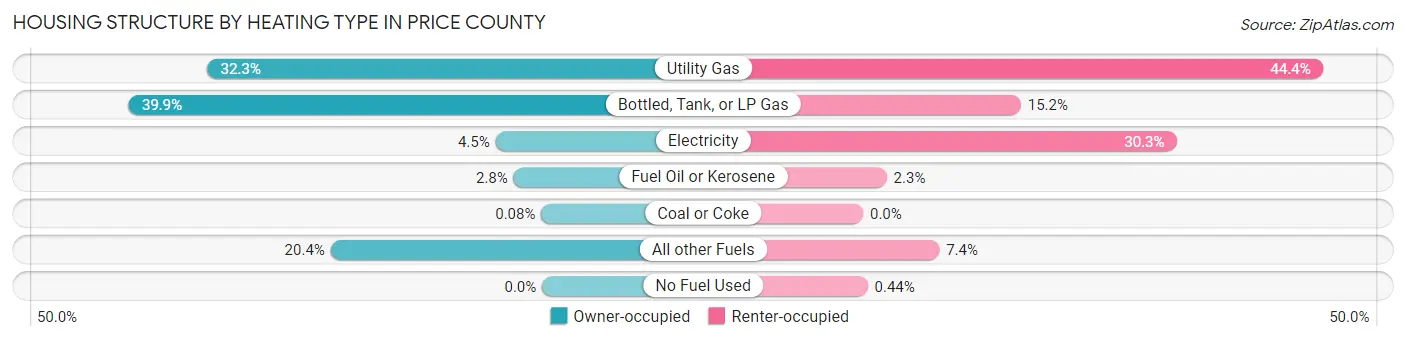
| Heating Type | Owner-occupied | Renter-occupied |
| Utility Gas | 1,704 (32.3%) | 603 (44.4%) |
| Bottled, Tank, or LP Gas | 2,105 (39.9%) | 207 (15.2%) |
| Electricity | 237 (4.5%) | 411 (30.3%) |
| Fuel Oil or Kerosene | 145 (2.8%) | 31 (2.3%) |
| Coal or Coke | 4 (0.1%) | 0 (0.0%) |
| All other Fuels | 1,077 (20.4%) | 100 (7.4%) |
| No Fuel Used | 0 (0.0%) | 6 (0.4%) |
| Total | 5,272 (100.0%) | 1,358 (100.0%) |
Household Vehicle Usage in Price County
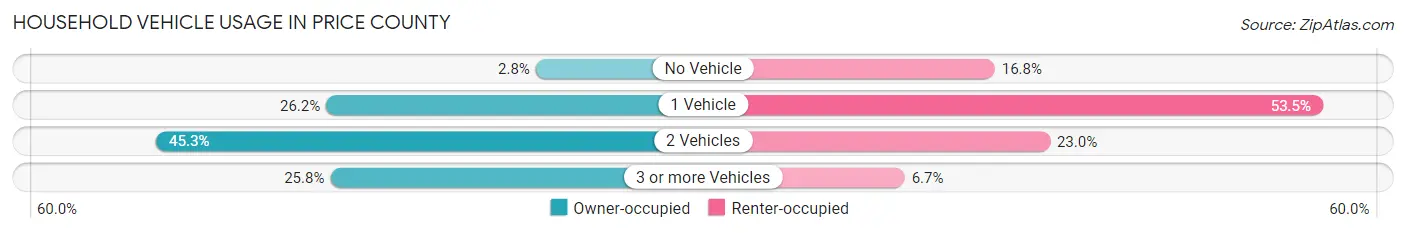
| Vehicles per Household | Owner-occupied | Renter-occupied |
| No Vehicle | 145 (2.8%) | 228 (16.8%) |
| 1 Vehicle | 1,383 (26.2%) | 727 (53.5%) |
| 2 Vehicles | 2,386 (45.3%) | 312 (23.0%) |
| 3 or more Vehicles | 1,358 (25.8%) | 91 (6.7%) |
| Total | 5,272 (100.0%) | 1,358 (100.0%) |
Real Estate & Mortgages in Price County
Real Estate and Mortgage Overview in Price County
| Characteristic | Without Mortgage | With Mortgage |
| Housing Units | 2,775 | 2,497 |
| Median Property Value | $117,400 | $154,600 |
| Median Household Income | $53,070 | $260 |
| Monthly Housing Costs | $509 | $49 |
| Real Estate Taxes | $1,925 | $73 |
Property Value by Mortgage Status in Price County
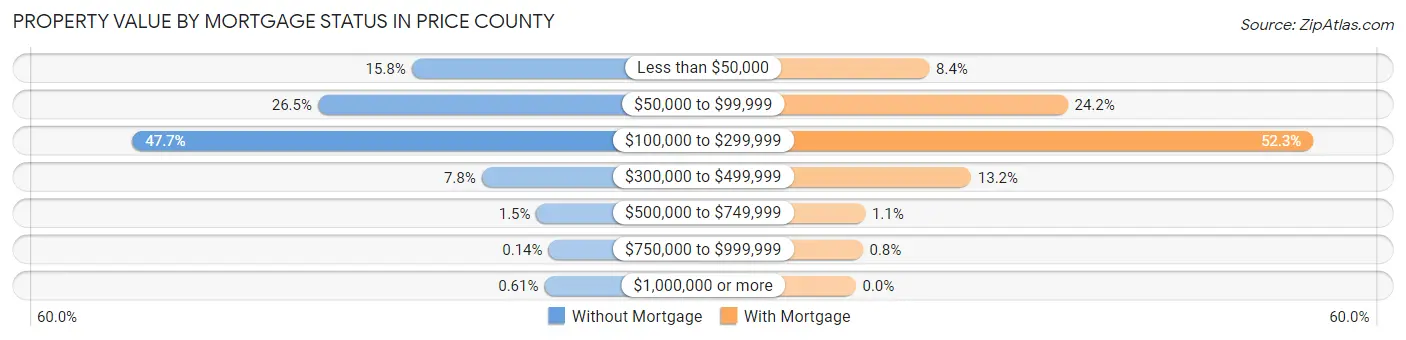
| Property Value | Without Mortgage | With Mortgage |
| Less than $50,000 | 438 (15.8%) | 210 (8.4%) |
| $50,000 to $99,999 | 735 (26.5%) | 605 (24.2%) |
| $100,000 to $299,999 | 1,323 (47.7%) | 1,306 (52.3%) |
| $300,000 to $499,999 | 216 (7.8%) | 329 (13.2%) |
| $500,000 to $749,999 | 42 (1.5%) | 27 (1.1%) |
| $750,000 to $999,999 | 4 (0.1%) | 20 (0.8%) |
| $1,000,000 or more | 17 (0.6%) | 0 (0.0%) |
| Total | 2,775 (100.0%) | 2,497 (100.0%) |
Household Income by Mortgage Status in Price County
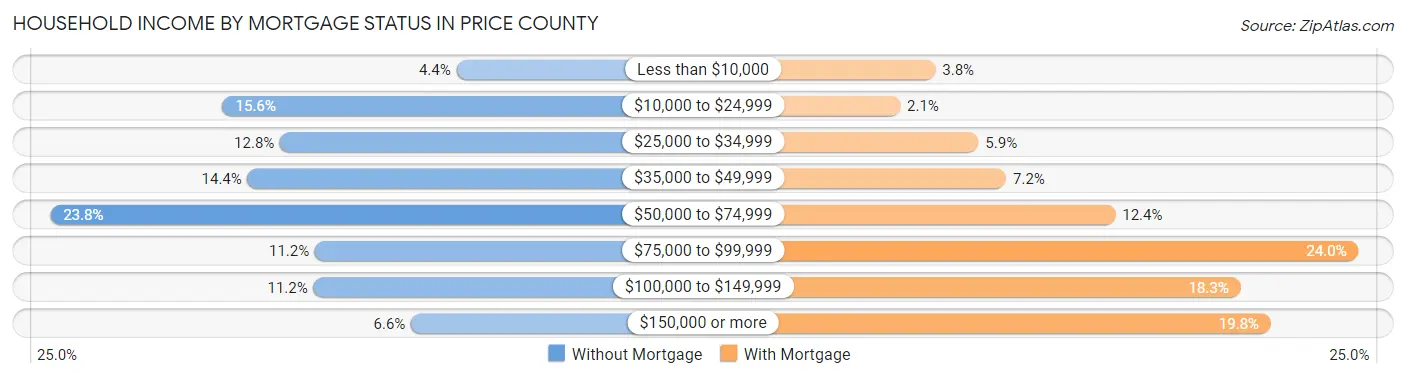
| Household Income | Without Mortgage | With Mortgage |
| Less than $10,000 | 123 (4.4%) | 95 (3.8%) |
| $10,000 to $24,999 | 432 (15.6%) | 53 (2.1%) |
| $25,000 to $34,999 | 356 (12.8%) | 146 (5.9%) |
| $35,000 to $49,999 | 399 (14.4%) | 179 (7.2%) |
| $50,000 to $74,999 | 660 (23.8%) | 309 (12.4%) |
| $75,000 to $99,999 | 310 (11.2%) | 598 (23.9%) |
| $100,000 to $149,999 | 312 (11.2%) | 458 (18.3%) |
| $150,000 or more | 183 (6.6%) | 494 (19.8%) |
| Total | 2,775 (100.0%) | 2,497 (100.0%) |
Property Value to Household Income Ratio in Price County
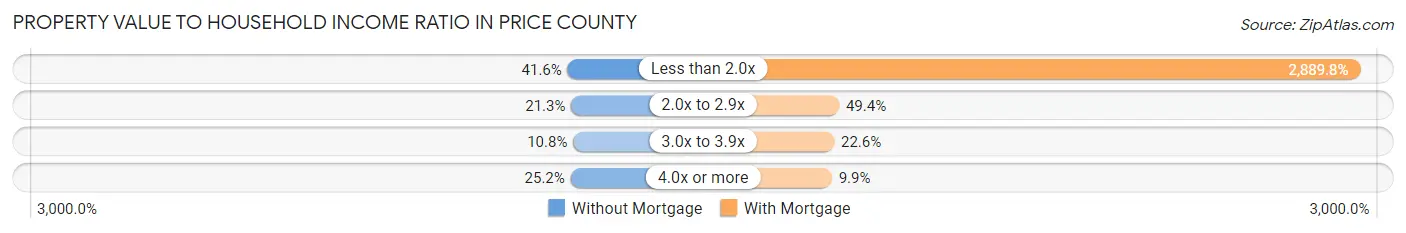
| Value-to-Income Ratio | Without Mortgage | With Mortgage |
| Less than 2.0x | 1,153 (41.5%) | 72,159 (2,889.8%) |
| 2.0x to 2.9x | 592 (21.3%) | 1,234 (49.4%) |
| 3.0x to 3.9x | 299 (10.8%) | 563 (22.6%) |
| 4.0x or more | 700 (25.2%) | 246 (9.9%) |
| Total | 2,775 (100.0%) | 2,497 (100.0%) |
Real Estate Taxes by Mortgage Status in Price County
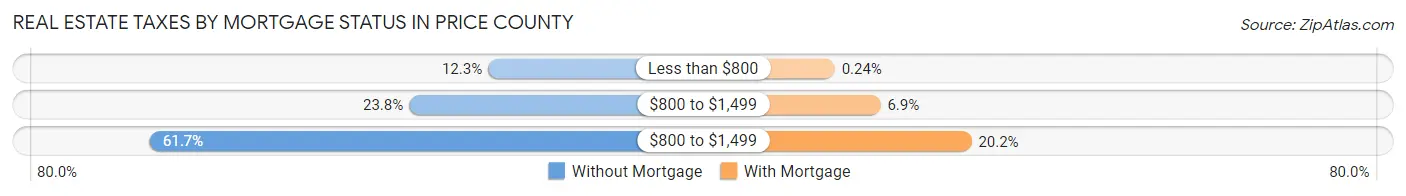
| Property Taxes | Without Mortgage | With Mortgage |
| Less than $800 | 341 (12.3%) | 6 (0.2%) |
| $800 to $1,499 | 661 (23.8%) | 173 (6.9%) |
| $800 to $1,499 | 1,712 (61.7%) | 505 (20.2%) |
| Total | 2,775 (100.0%) | 2,497 (100.0%) |
Health & Disability in Price County
Health Insurance Coverage by Age in Price County
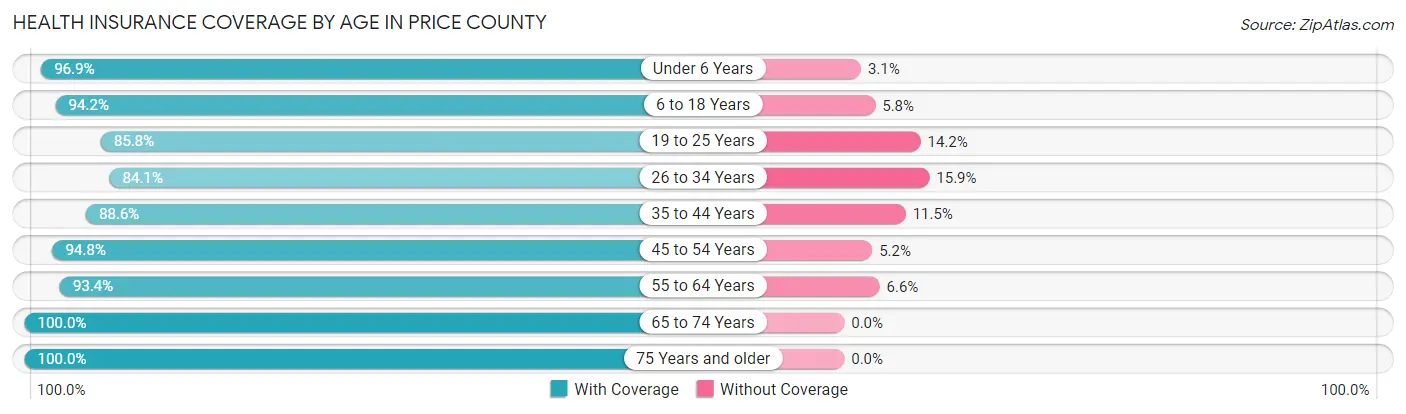
| Age Bracket | With Coverage | Without Coverage |
| Under 6 Years | 686 (96.9%) | 22 (3.1%) |
| 6 to 18 Years | 1,843 (94.2%) | 113 (5.8%) |
| 19 to 25 Years | 705 (85.8%) | 117 (14.2%) |
| 26 to 34 Years | 833 (84.1%) | 157 (15.9%) |
| 35 to 44 Years | 1,175 (88.5%) | 152 (11.5%) |
| 45 to 54 Years | 1,675 (94.8%) | 92 (5.2%) |
| 55 to 64 Years | 2,455 (93.4%) | 173 (6.6%) |
| 65 to 74 Years | 2,257 (100.0%) | 0 (0.0%) |
| 75 Years and older | 1,454 (100.0%) | 0 (0.0%) |
| Total | 13,083 (94.1%) | 826 (5.9%) |
Health Insurance Coverage by Citizenship Status in Price County

| Citizenship Status | With Coverage | Without Coverage |
| Native Born | 686 (96.9%) | 22 (3.1%) |
| Foreign Born, Citizen | 1,843 (94.2%) | 113 (5.8%) |
| Foreign Born, not a Citizen | 705 (85.8%) | 117 (14.2%) |
Health Insurance Coverage by Household Income in Price County
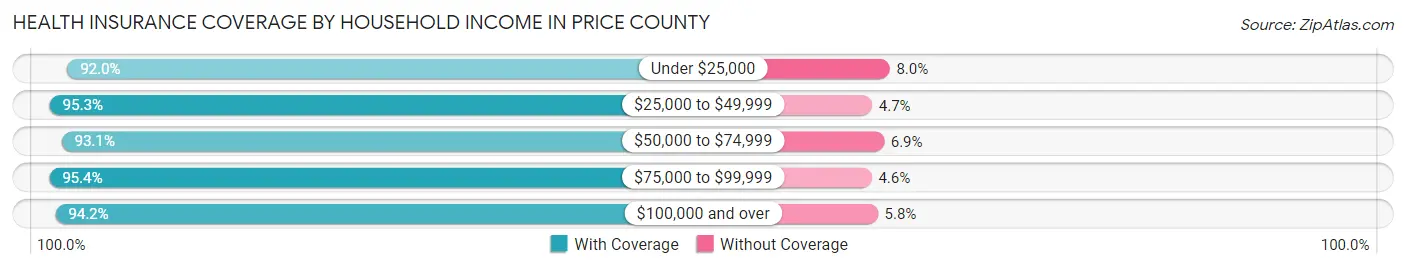
| Household Income | With Coverage | Without Coverage |
| Under $25,000 | 1,807 (92.0%) | 157 (8.0%) |
| $25,000 to $49,999 | 2,919 (95.3%) | 144 (4.7%) |
| $50,000 to $74,999 | 2,714 (93.1%) | 202 (6.9%) |
| $75,000 to $99,999 | 2,169 (95.4%) | 105 (4.6%) |
| $100,000 and over | 3,446 (94.2%) | 211 (5.8%) |
Public vs Private Health Insurance Coverage by Age in Price County
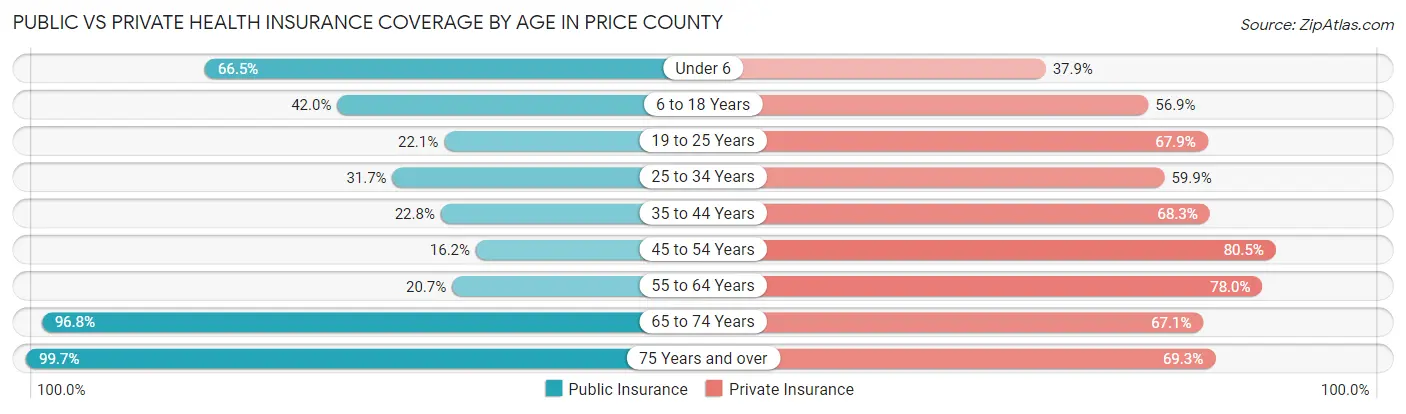
| Age Bracket | Public Insurance | Private Insurance |
| Under 6 | 471 (66.5%) | 268 (37.9%) |
| 6 to 18 Years | 821 (42.0%) | 1,113 (56.9%) |
| 19 to 25 Years | 182 (22.1%) | 558 (67.9%) |
| 25 to 34 Years | 314 (31.7%) | 593 (59.9%) |
| 35 to 44 Years | 302 (22.8%) | 906 (68.3%) |
| 45 to 54 Years | 287 (16.2%) | 1,423 (80.5%) |
| 55 to 64 Years | 543 (20.7%) | 2,051 (78.0%) |
| 65 to 74 Years | 2,185 (96.8%) | 1,514 (67.1%) |
| 75 Years and over | 1,450 (99.7%) | 1,007 (69.3%) |
| Total | 6,555 (47.1%) | 9,433 (67.8%) |
Disability Status by Sex by Age in Price County
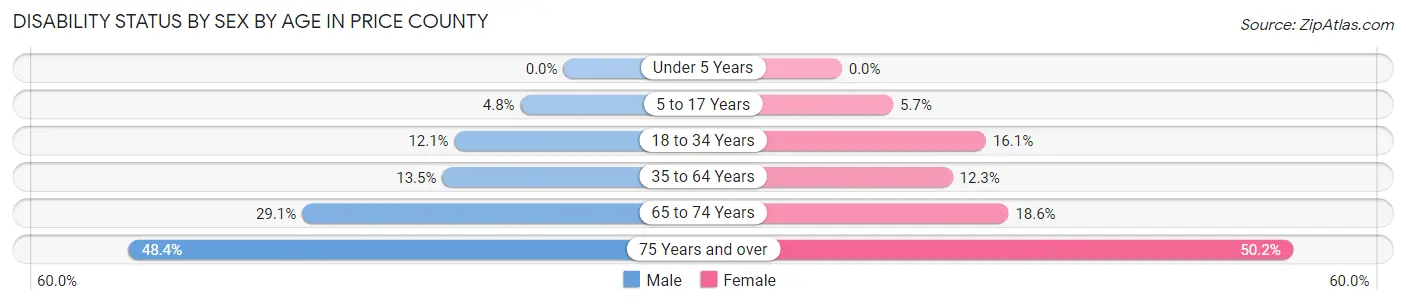
| Age Bracket | Male | Female |
| Under 5 Years | 0 (0.0%) | 0 (0.0%) |
| 5 to 17 Years | 48 (4.8%) | 54 (5.7%) |
| 18 to 34 Years | 126 (12.1%) | 146 (16.1%) |
| 35 to 64 Years | 402 (13.5%) | 338 (12.3%) |
| 65 to 74 Years | 345 (29.1%) | 199 (18.6%) |
| 75 Years and over | 315 (48.4%) | 403 (50.2%) |
Disability Class by Sex by Age in Price County
Disability Class: Hearing Difficulty
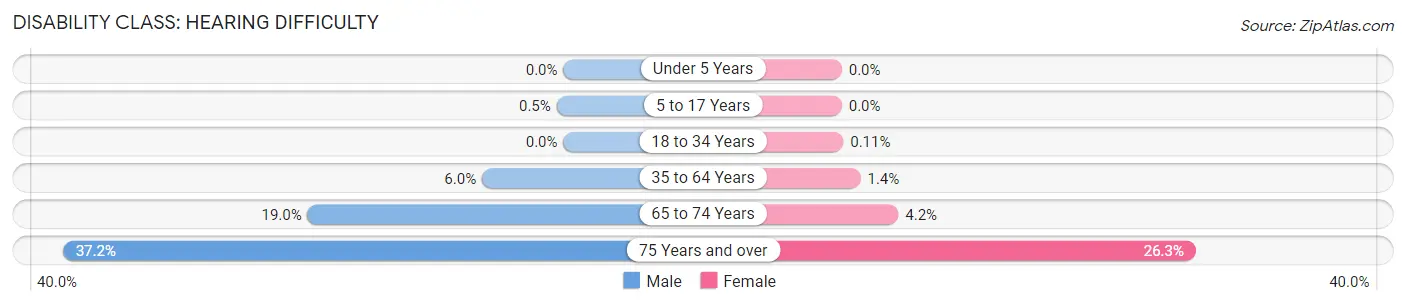
| Age Bracket | Male | Female |
| Under 5 Years | 0 (0.0%) | 0 (0.0%) |
| 5 to 17 Years | 5 (0.5%) | 0 (0.0%) |
| 18 to 34 Years | 0 (0.0%) | 1 (0.1%) |
| 35 to 64 Years | 180 (6.0%) | 38 (1.4%) |
| 65 to 74 Years | 225 (19.0%) | 45 (4.2%) |
| 75 Years and over | 242 (37.2%) | 211 (26.3%) |
Disability Class: Vision Difficulty
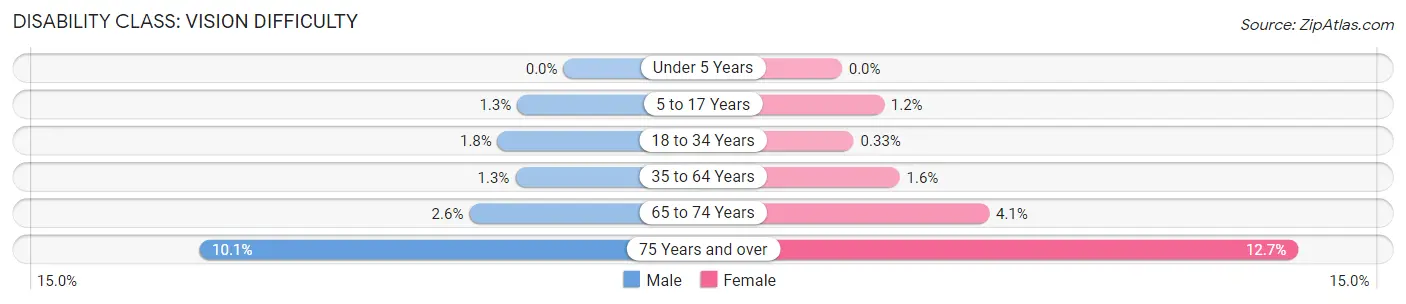
| Age Bracket | Male | Female |
| Under 5 Years | 0 (0.0%) | 0 (0.0%) |
| 5 to 17 Years | 13 (1.3%) | 11 (1.2%) |
| 18 to 34 Years | 19 (1.8%) | 3 (0.3%) |
| 35 to 64 Years | 40 (1.3%) | 44 (1.6%) |
| 65 to 74 Years | 31 (2.6%) | 44 (4.1%) |
| 75 Years and over | 66 (10.1%) | 102 (12.7%) |
Disability Class: Cognitive Difficulty
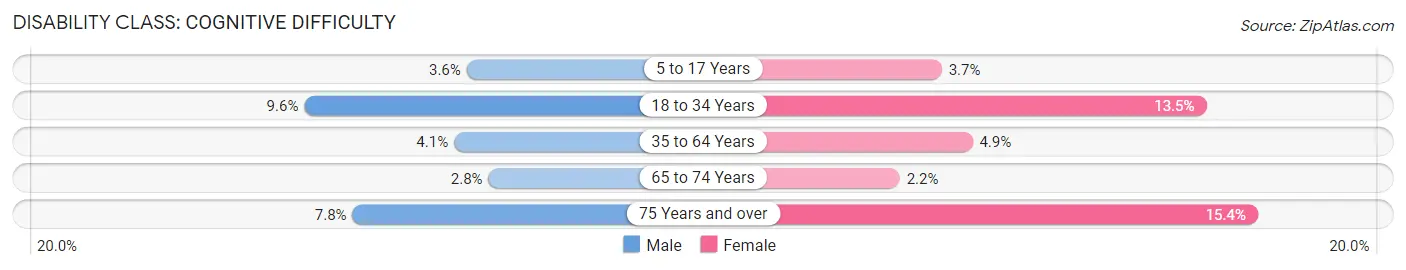
| Age Bracket | Male | Female |
| 5 to 17 Years | 36 (3.6%) | 35 (3.7%) |
| 18 to 34 Years | 100 (9.6%) | 123 (13.5%) |
| 35 to 64 Years | 121 (4.1%) | 133 (4.9%) |
| 65 to 74 Years | 33 (2.8%) | 23 (2.1%) |
| 75 Years and over | 51 (7.8%) | 124 (15.4%) |
Disability Class: Ambulatory Difficulty

| Age Bracket | Male | Female |
| 5 to 17 Years | 1 (0.1%) | 2 (0.2%) |
| 18 to 34 Years | 30 (2.9%) | 97 (10.7%) |
| 35 to 64 Years | 192 (6.4%) | 217 (7.9%) |
| 65 to 74 Years | 128 (10.8%) | 142 (13.3%) |
| 75 Years and over | 108 (16.6%) | 243 (30.3%) |
Disability Class: Self-Care Difficulty
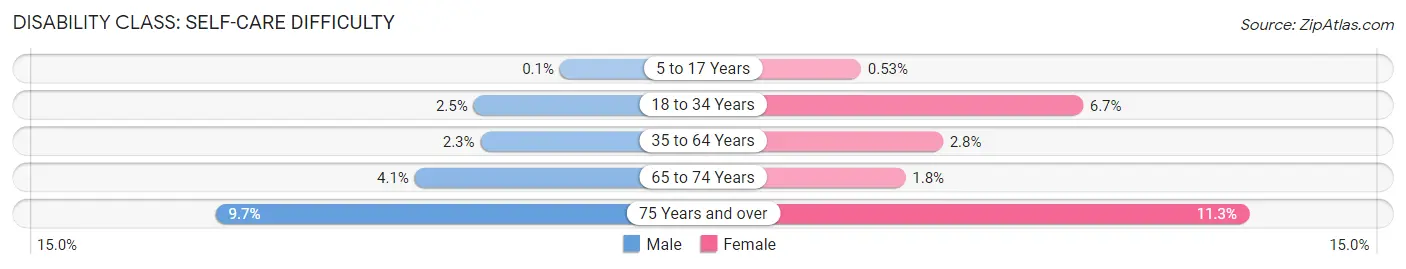
| Age Bracket | Male | Female |
| 5 to 17 Years | 1 (0.1%) | 5 (0.5%) |
| 18 to 34 Years | 26 (2.5%) | 61 (6.7%) |
| 35 to 64 Years | 69 (2.3%) | 77 (2.8%) |
| 65 to 74 Years | 49 (4.1%) | 19 (1.8%) |
| 75 Years and over | 63 (9.7%) | 91 (11.3%) |
Technology Access in Price County
Computing Device Access in Price County
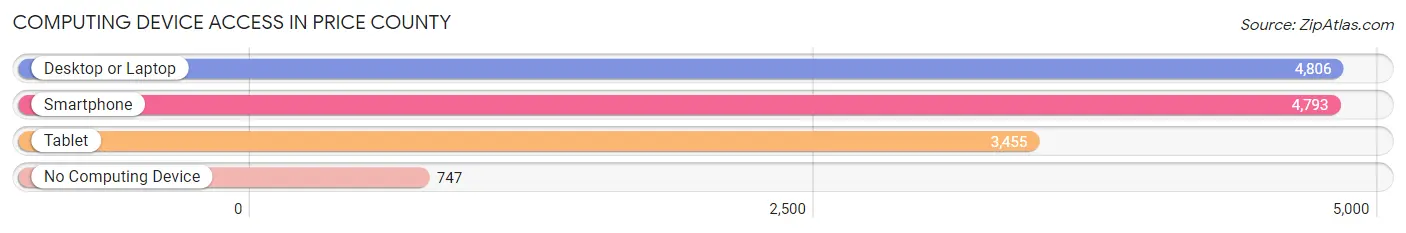
| Device Type | # Households | % Households |
| Desktop or Laptop | 4,806 | 72.5% |
| Smartphone | 4,793 | 72.3% |
| Tablet | 3,455 | 52.1% |
| No Computing Device | 747 | 11.3% |
| Total | 6,630 | 100.0% |
Internet Access in Price County
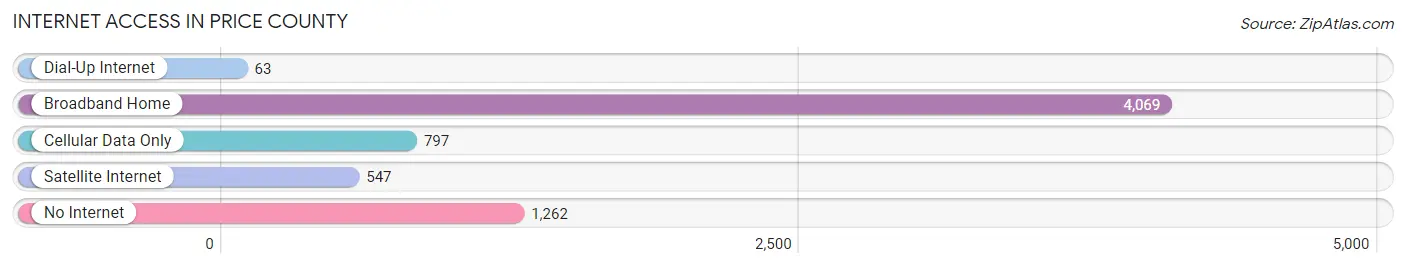
| Internet Type | # Households | % Households |
| Dial-Up Internet | 63 | 0.9% |
| Broadband Home | 4,069 | 61.4% |
| Cellular Data Only | 797 | 12.0% |
| Satellite Internet | 547 | 8.3% |
| No Internet | 1,262 | 19.0% |
| Total | 6,630 | 100.0% |
Price County Summary
Introduction
Price County is located in the north-central region of Wisconsin, and is part of the Chippewa Valley region. It is bordered by Taylor County to the north, Rusk County to the east, Sawyer County to the south, and Barron and Washburn counties to the west. The county seat is Phillips, and the largest city is Park Falls. Price County has a total area of 1,072 square miles, and a population of 13,841 as of the 2010 census.
History
Price County was established in 1879, and was named after Wisconsin Governor William R. Price. The county was originally part of Chippewa County, and was created from parts of Rusk and Sawyer counties. The first settlers arrived in the area in the late 1840s, and the county was officially organized in 1879.
The first county seat was located in Phillips, and the first courthouse was built in 1881. The county seat was moved to Park Falls in 1883, and the current courthouse was built in 1895.
Geography
Price County is located in the north-central region of Wisconsin, and is part of the Chippewa Valley region. It is bordered by Taylor County to the north, Rusk County to the east, Sawyer County to the south, and Barron and Washburn counties to the west. The county has a total area of 1,072 square miles, and is mostly covered by forests. The Flambeau River flows through the county, and there are several lakes, including Lake of the Pines, Lake Thompson, and Lake Metonga.
Economy
The economy of Price County is largely based on forestry and tourism. The county is home to several paper mills, including the Park Falls Mill, which is the largest employer in the county. The county is also home to several logging and lumber companies, as well as several small businesses.
Tourism is also an important part of the economy, as the county is home to several state parks, including the Flambeau River State Forest, the Chequamegon-Nicolet National Forest, and the Copper Falls State Park. The county is also home to several resorts and campgrounds, as well as several hunting and fishing areas.
Demographics
As of the 2010 census, there were 13,841 people, 5,845 households, and 3,845 families living in Price County. The population density was 13 people per square mile. The racial makeup of the county was 97.3% White, 0.3% African American, 0.7% Native American, 0.3% Asian, 0.1% Pacific Islander, 0.4% from other races, and 0.9% from two or more races. Hispanic or Latino of any race were 1.3% of the population.
The median income for a household in Price County was $37,917, and the median income for a family was $45,938. The per capita income for the county was $19,945. About 11.2% of families and 14.7% of the population were below the poverty line, including 19.2% of those under age 18 and 11.2% of those age 65 or over.
Conclusion
Price County is located in the north-central region of Wisconsin, and is part of the Chippewa Valley region. It has a total area of 1,072 square miles, and a population of 13,841 as of the 2010 census. The economy of Price County is largely based on forestry and tourism, and the county is home to several paper mills, logging and lumber companies, and several state parks. The median income for a household in Price County was $37,917, and the median income for a family was $45,938.
Common Questions
What is the Total Population of Price County?
Total Population of Price County is 14,066.
What is the Total Male Population of Price County?
Total Male Population of Price County is 7,248.
What is the Total Female Population of Price County?
Total Female Population of Price County is 6,818.
What is the Ratio of Males per 100 Females in Price County?
There are 106.31 Males per 100 Females in Price County.
What is the Ratio of Females per 100 Males in Price County?
There are 94.07 Females per 100 Males in Price County.
What is the Median Population Age in Price County?
Median Population Age in Price County is 52.1 Years.
What is the Average Family Size in Price County
Average Family Size in Price County is 2.7 People.
What is the Average Household Size in Price County
Average Household Size in Price County is 2.1 People.
What is Per Capita Income in Price County?
Per Capita income in Price County is $33,468.
What is the Median Family Income in Price County?
Median Family Income in Price County is $71,617.
What is the Median Household income in Price County?
Median Household Income in Price County is $55,822.
What is Income or Wage Gap in Price County?
Income or Wage Gap in Price County is 33.2%.
Women in Price County earn 66.8 cents for every dollar earned by a man.
What is Family Income Deficit in Price County?
Family Income Deficit in Price County is $10,626.
Families that are below poverty line in Price County earn $10,626 less on average than the poverty threshold level.
What is Inequality or Gini Index in Price County?
Inequality or Gini Index in Price County is 0.42.
How Large is the Labor Force in Price County?
There are 6,339 People in the Labor Forcein in Price County.
What is the Percentage of People in the Labor Force in Price County?
53.4% of People are in the Labor Force in Price County.
What is the Unemployment Rate in Price County?
Unemployment Rate in Price County is 2.7%.