Polk County, WI
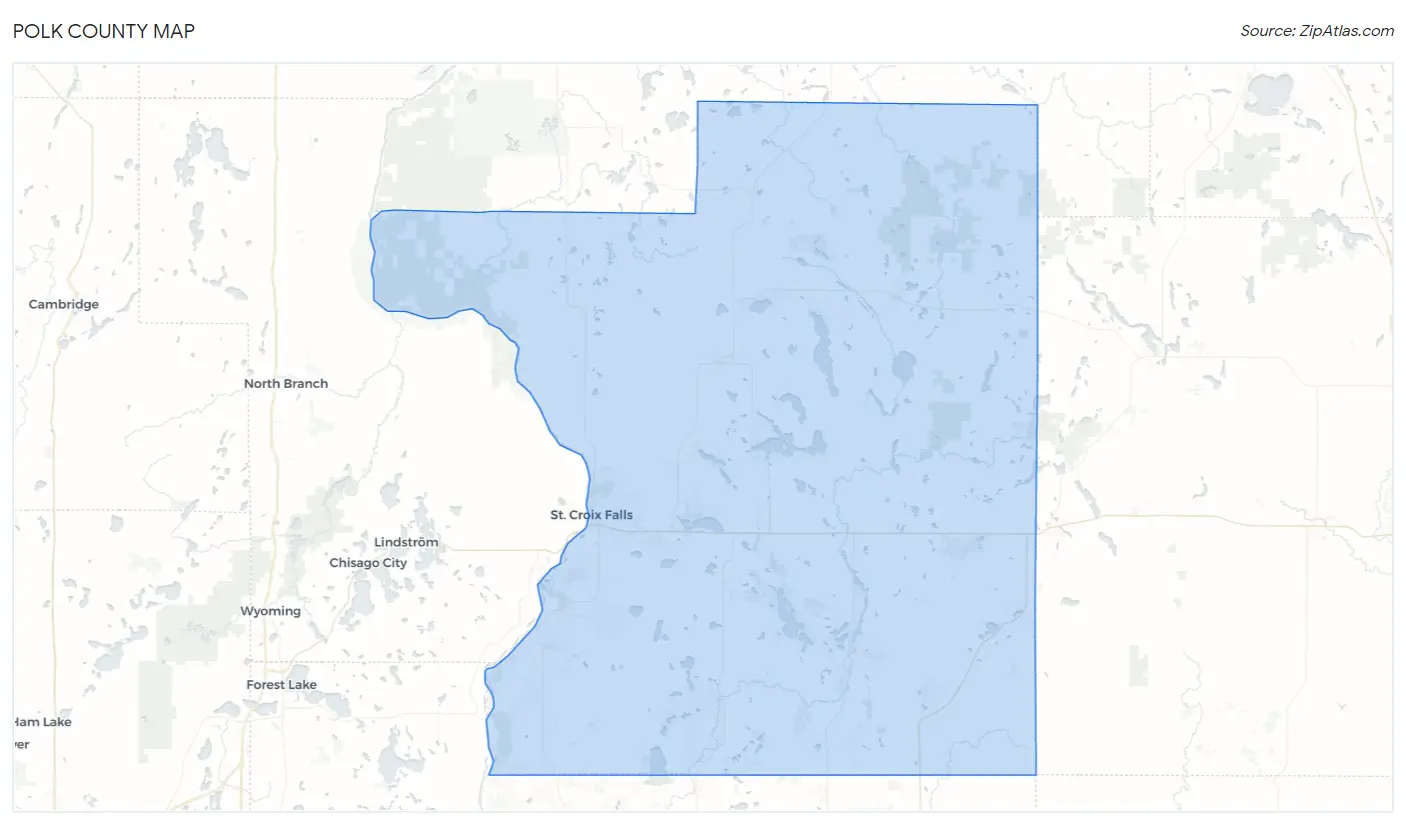
Polk County Map
Polk County Overview
45,128
TOTAL POPULATION
23,028
MALE POPULATION
22,100
FEMALE POPULATION
104.20
MALES / 100 FEMALES
95.97
FEMALES / 100 MALES
46.5
MEDIAN AGE
2.9
AVG FAMILY SIZE
2.4
AVG HOUSEHOLD SIZE
$37,674
PER CAPITA INCOME
$86,676
AVG FAMILY INCOME
$74,142
AVG HOUSEHOLD INCOME
30.9%
WAGE / INCOME GAP [ % ]
69.1¢/ $1
WAGE / INCOME GAP [ $ ]
$8,893
FAMILY INCOME DEFICIT
0.40
INEQUALITY / GINI INDEX
23,260
LABOR FORCE [ PEOPLE ]
62.5%
PERCENT IN LABOR FORCE
4.2%
UNEMPLOYMENT RATE
Polk County Area Codes
Race in Polk County
The most populous races in Polk County are White / Caucasian (42,875 | 95.0%), Two or more Races (1,381 | 3.1%), and Hispanic or Latino (888 | 2.0%).
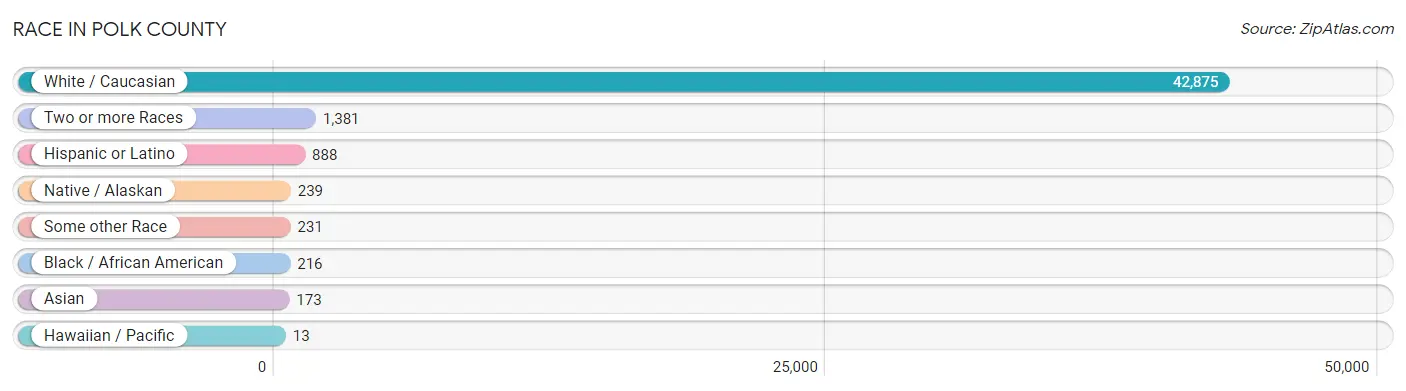
| Race | # Population | % Population |
| Asian | 173 | 0.4% |
| Black / African American | 216 | 0.5% |
| Hawaiian / Pacific | 13 | 0.0% |
| Hispanic or Latino | 888 | 2.0% |
| Native / Alaskan | 239 | 0.5% |
| White / Caucasian | 42,875 | 95.0% |
| Two or more Races | 1,381 | 3.1% |
| Some other Race | 231 | 0.5% |
| Total | 45,128 | 100.0% |
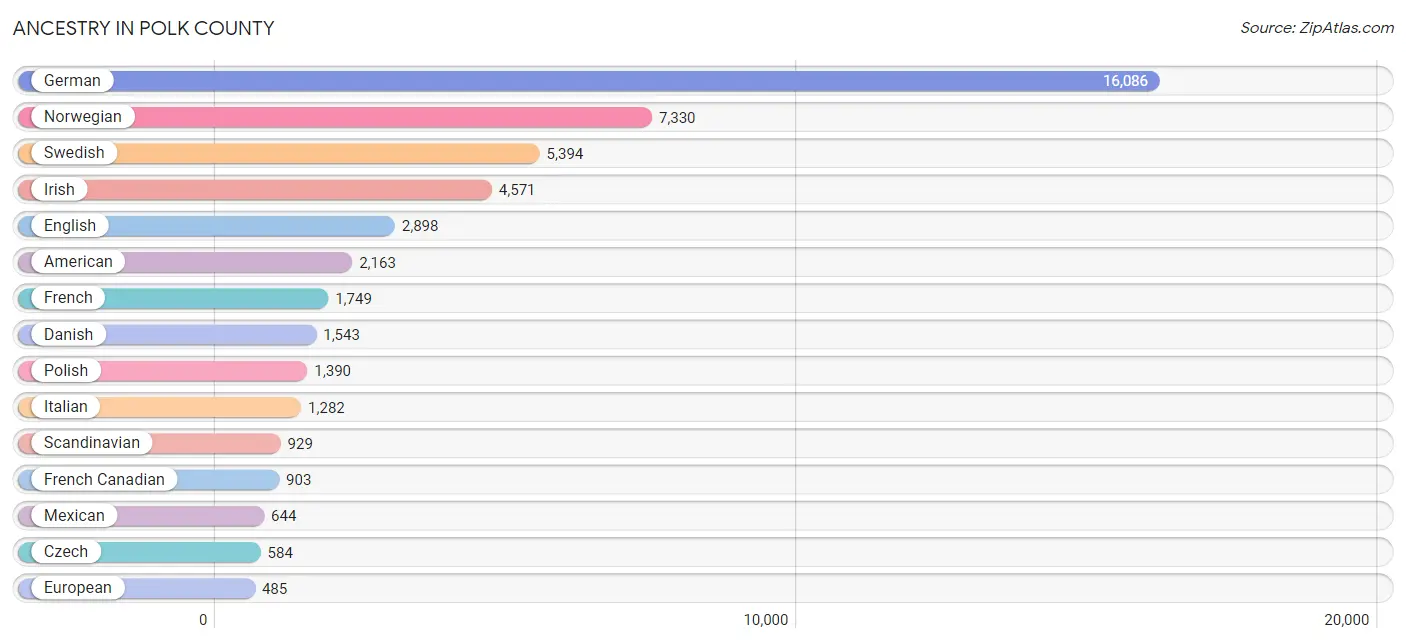
Ancestry in Polk County
The most populous ancestries reported in Polk County are German (16,086 | 35.6%), Norwegian (7,330 | 16.2%), Swedish (5,394 | 11.9%), Irish (4,571 | 10.1%), and English (2,898 | 6.4%), together accounting for 80.4% of all Polk County residents.
| Ancestry | # Population | % Population |
| African | 7 | 0.0% |
| Albanian | 2 | 0.0% |
| American | 2,163 | 4.8% |
| Arab | 44 | 0.1% |
| Armenian | 3 | 0.0% |
| Australian | 8 | 0.0% |
| Austrian | 127 | 0.3% |
| Bangladeshi | 45 | 0.1% |
| Belgian | 131 | 0.3% |
| Bhutanese | 48 | 0.1% |
| Blackfeet | 27 | 0.1% |
| British | 118 | 0.3% |
| Bulgarian | 3 | 0.0% |
| Burmese | 76 | 0.2% |
| Canadian | 67 | 0.2% |
| Celtic | 24 | 0.1% |
| Central American | 20 | 0.0% |
| Cherokee | 53 | 0.1% |
| Chinese | 2 | 0.0% |
| Chippewa | 313 | 0.7% |
| Choctaw | 16 | 0.0% |
| Colombian | 38 | 0.1% |
| Croatian | 42 | 0.1% |
| Cuban | 38 | 0.1% |
| Czech | 584 | 1.3% |
| Czechoslovakian | 87 | 0.2% |
| Danish | 1,543 | 3.4% |
| Dutch | 479 | 1.1% |
| Eastern European | 70 | 0.2% |
| Egyptian | 4 | 0.0% |
| English | 2,898 | 6.4% |
| European | 485 | 1.1% |
| Fijian | 4 | 0.0% |
| Finnish | 412 | 0.9% |
| French | 1,749 | 3.9% |
| French American Indian | 12 | 0.0% |
| French Canadian | 903 | 2.0% |
| German | 16,086 | 35.6% |
| Greek | 77 | 0.2% |
| Hungarian | 189 | 0.4% |
| Icelander | 55 | 0.1% |
| Indian (Asian) | 26 | 0.1% |
| Irish | 4,571 | 10.1% |
| Iroquois | 12 | 0.0% |
| Israeli | 11 | 0.0% |
| Italian | 1,282 | 2.8% |
| Jamaican | 20 | 0.0% |
| Japanese | 10 | 0.0% |
| Kiowa | 1 | 0.0% |
| Korean | 85 | 0.2% |
| Latvian | 14 | 0.0% |
| Lebanese | 32 | 0.1% |
| Lithuanian | 16 | 0.0% |
| Luxembourger | 5 | 0.0% |
| Maltese | 15 | 0.0% |
| Menominee | 6 | 0.0% |
| Mexican | 644 | 1.4% |
| Moroccan | 3 | 0.0% |
| Native Hawaiian | 20 | 0.0% |
| Nicaraguan | 6 | 0.0% |
| Nigerian | 6 | 0.0% |
| Northern European | 68 | 0.2% |
| Norwegian | 7,330 | 16.2% |
| Okinawan | 1 | 0.0% |
| Pakistani | 10 | 0.0% |
| Panamanian | 1 | 0.0% |
| Pennsylvania German | 32 | 0.1% |
| Peruvian | 3 | 0.0% |
| Polish | 1,390 | 3.1% |
| Portuguese | 18 | 0.0% |
| Potawatomi | 4 | 0.0% |
| Puerto Rican | 78 | 0.2% |
| Romanian | 32 | 0.1% |
| Russian | 217 | 0.5% |
| Salvadoran | 13 | 0.0% |
| Scandinavian | 929 | 2.1% |
| Scotch-Irish | 143 | 0.3% |
| Scottish | 461 | 1.0% |
| Seminole | 4 | 0.0% |
| Serbian | 3 | 0.0% |
| Sioux | 85 | 0.2% |
| Slavic | 41 | 0.1% |
| Slovak | 46 | 0.1% |
| Slovene | 34 | 0.1% |
| South American | 41 | 0.1% |
| Spaniard | 8 | 0.0% |
| Spanish | 45 | 0.1% |
| Sri Lankan | 10 | 0.0% |
| Subsaharan African | 13 | 0.0% |
| Swedish | 5,394 | 11.9% |
| Swiss | 195 | 0.4% |
| Syrian | 9 | 0.0% |
| Thai | 49 | 0.1% |
| U.S. Virgin Islander | 3 | 0.0% |
| Ukrainian | 84 | 0.2% |
| Welsh | 142 | 0.3% |
| West Indian | 3 | 0.0% |
| Yugoslavian | 50 | 0.1% | View All 98 Rows |
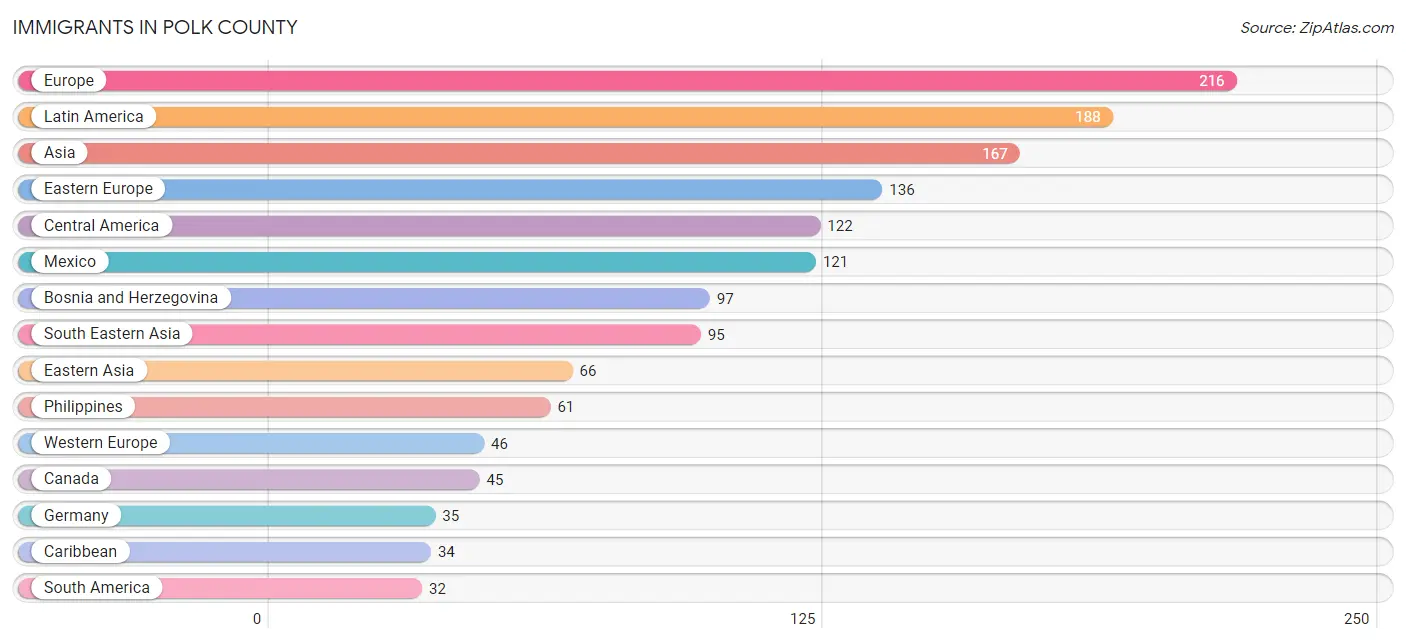
Immigrants in Polk County
The most numerous immigrant groups reported in Polk County came from Europe (216 | 0.5%), Latin America (188 | 0.4%), Asia (167 | 0.4%), Eastern Europe (136 | 0.3%), and Central America (122 | 0.3%), together accounting for 1.8% of all Polk County residents.
| Immigration Origin | # Population | % Population |
| Africa | 5 | 0.0% |
| Albania | 2 | 0.0% |
| Asia | 167 | 0.4% |
| Australia | 6 | 0.0% |
| Austria | 2 | 0.0% |
| Bosnia and Herzegovina | 97 | 0.2% |
| Bulgaria | 3 | 0.0% |
| Canada | 45 | 0.1% |
| Caribbean | 34 | 0.1% |
| Central America | 122 | 0.3% |
| China | 16 | 0.0% |
| Colombia | 29 | 0.1% |
| Cuba | 24 | 0.1% |
| Denmark | 3 | 0.0% |
| Eastern Asia | 66 | 0.2% |
| Eastern Europe | 136 | 0.3% |
| Egypt | 4 | 0.0% |
| England | 5 | 0.0% |
| Europe | 216 | 0.5% |
| France | 2 | 0.0% |
| Germany | 35 | 0.1% |
| Hong Kong | 5 | 0.0% |
| Hungary | 1 | 0.0% |
| India | 6 | 0.0% |
| Jamaica | 10 | 0.0% |
| Japan | 26 | 0.1% |
| Korea | 24 | 0.1% |
| Latin America | 188 | 0.4% |
| Latvia | 5 | 0.0% |
| Malaysia | 4 | 0.0% |
| Mexico | 121 | 0.3% |
| Morocco | 1 | 0.0% |
| Netherlands | 7 | 0.0% |
| Northern Africa | 5 | 0.0% |
| Northern Europe | 27 | 0.1% |
| Norway | 3 | 0.0% |
| Oceania | 10 | 0.0% |
| Panama | 1 | 0.0% |
| Peru | 3 | 0.0% |
| Philippines | 61 | 0.1% |
| Poland | 6 | 0.0% |
| Romania | 3 | 0.0% |
| Russia | 19 | 0.0% |
| South America | 32 | 0.1% |
| South Central Asia | 6 | 0.0% |
| South Eastern Asia | 95 | 0.2% |
| Southern Europe | 7 | 0.0% |
| Spain | 7 | 0.0% |
| Thailand | 20 | 0.0% |
| Vietnam | 10 | 0.0% |
| Western Europe | 46 | 0.1% | View All 51 Rows |
Sex and Age in Polk County
Sex and Age in Polk County
The most populous age groups in Polk County are 60 to 64 Years (2,022 | 8.8%) for men and 55 to 59 Years (1,988 | 9.0%) for women.

| Age Bracket | Male | Female |
| Under 5 Years | 1,073 (4.7%) | 1,016 (4.6%) |
| 5 to 9 Years | 1,236 (5.4%) | 1,200 (5.4%) |
| 10 to 14 Years | 1,507 (6.5%) | 1,330 (6.0%) |
| 15 to 19 Years | 1,410 (6.1%) | 1,223 (5.5%) |
| 20 to 24 Years | 1,118 (4.9%) | 1,027 (4.6%) |
| 25 to 29 Years | 1,156 (5.0%) | 1,050 (4.8%) |
| 30 to 34 Years | 1,158 (5.0%) | 1,172 (5.3%) |
| 35 to 39 Years | 1,518 (6.6%) | 1,372 (6.2%) |
| 40 to 44 Years | 1,206 (5.2%) | 1,147 (5.2%) |
| 45 to 49 Years | 1,358 (5.9%) | 1,306 (5.9%) |
| 50 to 54 Years | 1,633 (7.1%) | 1,531 (6.9%) |
| 55 to 59 Years | 1,872 (8.1%) | 1,988 (9.0%) |
| 60 to 64 Years | 2,022 (8.8%) | 1,791 (8.1%) |
| 65 to 69 Years | 1,601 (7.0%) | 1,671 (7.6%) |
| 70 to 74 Years | 1,400 (6.1%) | 1,170 (5.3%) |
| 75 to 79 Years | 851 (3.7%) | 944 (4.3%) |
| 80 to 84 Years | 600 (2.6%) | 536 (2.4%) |
| 85 Years and over | 309 (1.3%) | 626 (2.8%) |
| Total | 23,028 (100.0%) | 22,100 (100.0%) |
Families and Households in Polk County
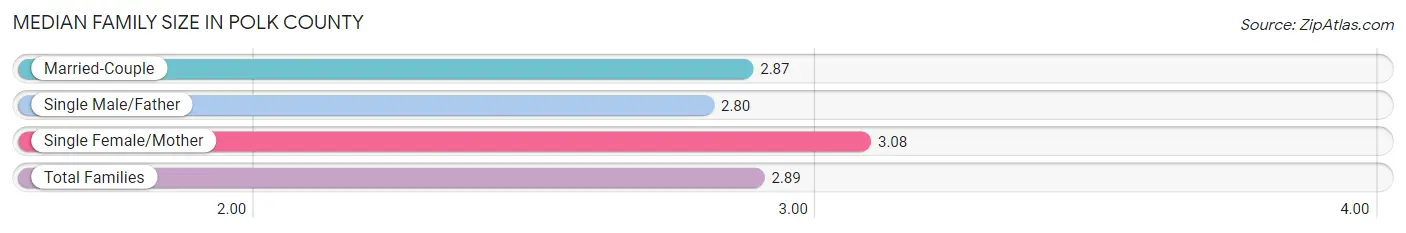
Median Family Size in Polk County
The median family size in Polk County is 2.89 persons per family, with single female/mother families (1,360 | 10.9%) accounting for the largest median family size of 3.08 persons per family. On the other hand, single male/father families (890 | 7.1%) represent the smallest median family size with 2.80 persons per family.
| Family Type | # Families | Family Size |
| Married-Couple | 10,277 (82.0%) | 2.87 |
| Single Male/Father | 890 (7.1%) | 2.80 |
| Single Female/Mother | 1,360 (10.9%) | 3.08 |
| Total Families | 12,527 (100.0%) | 2.89 |
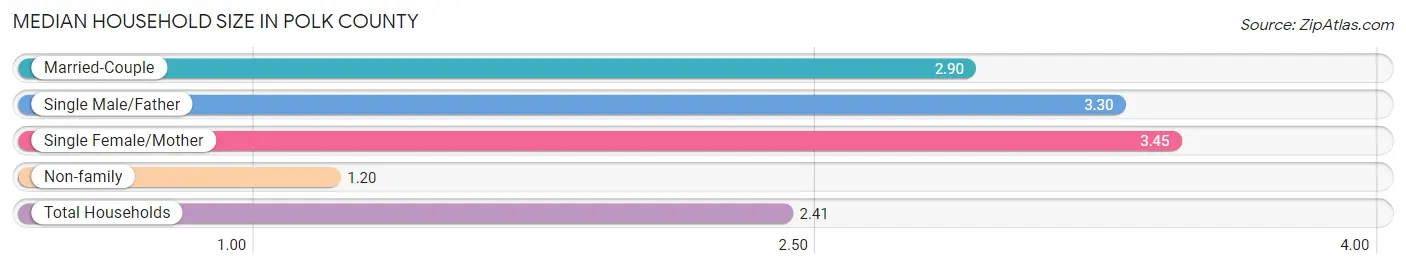
Median Household Size in Polk County
The median household size in Polk County is 2.41 persons per household, with single female/mother households (1,360 | 7.3%) accounting for the largest median household size of 3.45 persons per household. non-family households (6,007 | 32.4%) represent the smallest median household size with 1.20 persons per household.
| Household Type | # Households | Household Size |
| Married-Couple | 10,277 (55.4%) | 2.90 |
| Single Male/Father | 890 (4.8%) | 3.30 |
| Single Female/Mother | 1,360 (7.3%) | 3.45 |
| Non-family | 6,007 (32.4%) | 1.20 |
| Total Households | 18,534 (100.0%) | 2.41 |
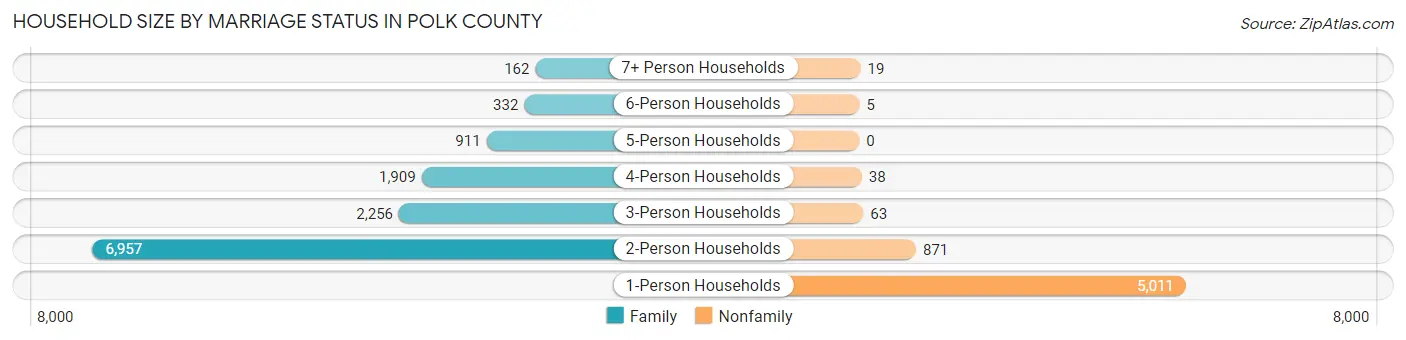
Household Size by Marriage Status in Polk County
Out of a total of 18,534 households in Polk County, 12,527 (67.6%) are family households, while 6,007 (32.4%) are nonfamily households. The most numerous type of family households are 2-person households, comprising 6,957, and the most common type of nonfamily households are 1-person households, comprising 5,011.
| Household Size | Family Households | Nonfamily Households |
| 1-Person Households | - | 5,011 (27.0%) |
| 2-Person Households | 6,957 (37.5%) | 871 (4.7%) |
| 3-Person Households | 2,256 (12.2%) | 63 (0.3%) |
| 4-Person Households | 1,909 (10.3%) | 38 (0.2%) |
| 5-Person Households | 911 (4.9%) | 0 (0.0%) |
| 6-Person Households | 332 (1.8%) | 5 (0.0%) |
| 7+ Person Households | 162 (0.9%) | 19 (0.1%) |
| Total | 12,527 (67.6%) | 6,007 (32.4%) |
Female Fertility in Polk County
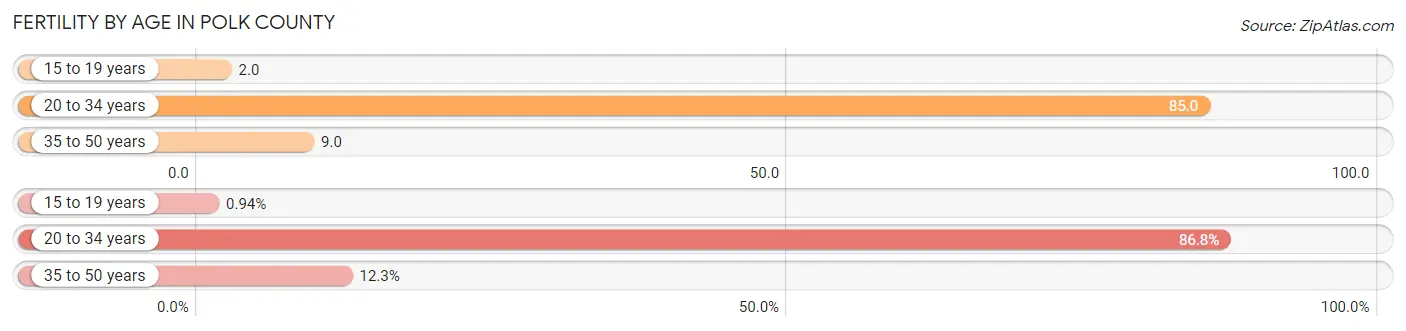
Fertility by Age in Polk County
Average fertility rate in Polk County is 37.0 births per 1,000 women. Women in the age bracket of 20 to 34 years have the highest fertility rate with 85.0 births per 1,000 women. Women in the age bracket of 20 to 34 years acount for 86.8% of all women with births.
| Age Bracket | Women with Births | Births / 1,000 Women |
| 15 to 19 years | 3 (0.9%) | 2.0 |
| 20 to 34 years | 276 (86.8%) | 85.0 |
| 35 to 50 years | 39 (12.3%) | 9.0 |
| Total | 318 (100.0%) | 37.0 |
Fertility by Age by Marriage Status in Polk County
82.1% of women with births (318) in Polk County are married. The highest percentage of unmarried women with births falls into 15 to 19 years age bracket with 100.0% of them unmarried at the time of birth, while the lowest percentage of unmarried women with births belong to 35 to 50 years age bracket with 0.0% of them unmarried.
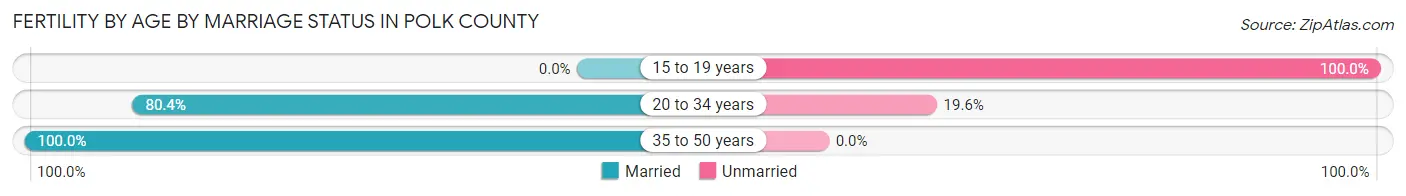
| Age Bracket | Married | Unmarried |
| 15 to 19 years | 0 (0.0%) | 3 (100.0%) |
| 20 to 34 years | 222 (80.4%) | 54 (19.6%) |
| 35 to 50 years | 39 (100.0%) | 0 (0.0%) |
| Total | 261 (82.1%) | 57 (17.9%) |
Fertility by Education in Polk County
Average fertility rate in Polk County is 37.0 births per 1,000 women. Women with the education attainment of graduate degree have the highest fertility rate of 63.0 births per 1,000 women, while women with the education attainment of less than high school have the lowest fertility at 14.0 births per 1,000 women. Women with the education attainment of college or associate's degree represent 54.7% of all women with births.
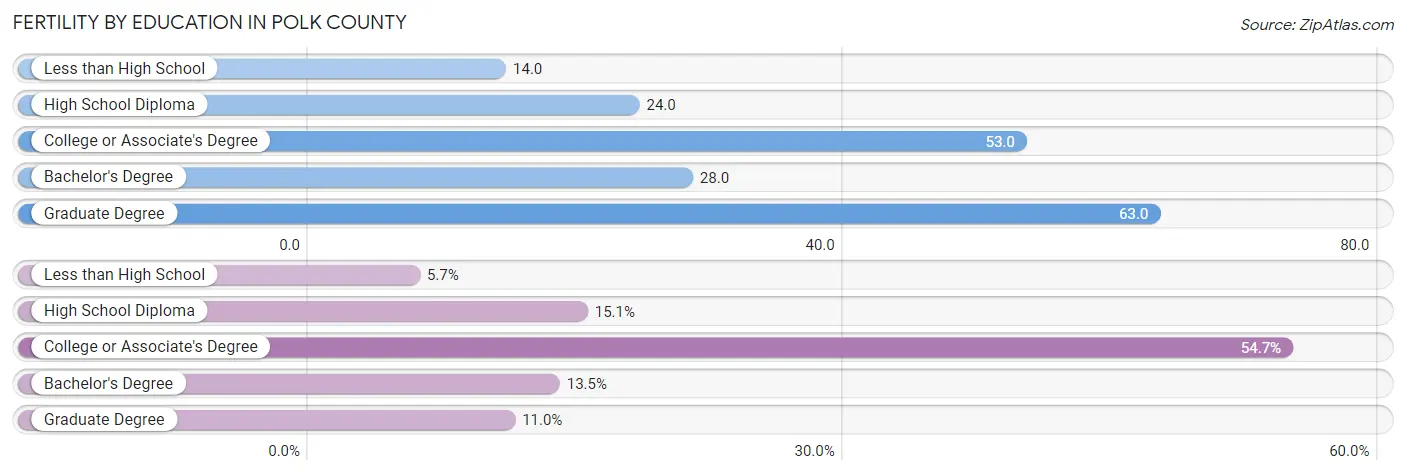
| Educational Attainment | Women with Births | Births / 1,000 Women |
| Less than High School | 18 (5.7%) | 14.0 |
| High School Diploma | 48 (15.1%) | 24.0 |
| College or Associate's Degree | 174 (54.7%) | 53.0 |
| Bachelor's Degree | 43 (13.5%) | 28.0 |
| Graduate Degree | 35 (11.0%) | 63.0 |
| Total | 318 (100.0%) | 37.0 |
Fertility by Education by Marriage Status in Polk County
17.9% of women with births in Polk County are unmarried. Women with the educational attainment of bachelor's degree are most likely to be married with 100.0% of them married at childbirth, while women with the educational attainment of less than high school are least likely to be married with 27.8% of them unmarried at childbirth.
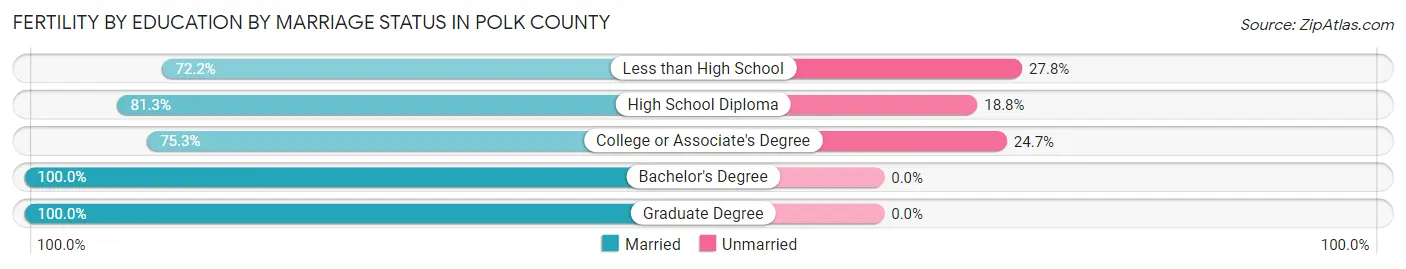
| Educational Attainment | Married | Unmarried |
| Less than High School | 13 (72.2%) | 5 (27.8%) |
| High School Diploma | 39 (81.2%) | 9 (18.8%) |
| College or Associate's Degree | 131 (75.3%) | 43 (24.7%) |
| Bachelor's Degree | 43 (100.0%) | 0 (0.0%) |
| Graduate Degree | 35 (100.0%) | 0 (0.0%) |
| Total | 261 (82.1%) | 57 (17.9%) |
Income in Polk County
Income Overview in Polk County
Per Capita Income in Polk County is $37,674, while median incomes of families and households are $86,676 and $74,142 respectively.
| Characteristic | Number | Measure |
| Per Capita Income | 45,128 | $37,674 |
| Median Family Income | 12,527 | $86,676 |
| Mean Family Income | 12,527 | $101,814 |
| Median Household Income | 18,534 | $74,142 |
| Mean Household Income | 18,534 | $89,208 |
| Income Deficit | 12,527 | $8,893 |
| Wage / Income Gap (%) | 45,128 | 30.88% |
| Wage / Income Gap ($) | 45,128 | 69.12¢ per $1 |
| Gini / Inequality Index | 45,128 | 0.40 |
Earnings by Sex in Polk County
Average Earnings in Polk County are $42,100, $50,442 for men and $34,867 for women, a difference of 30.9%.
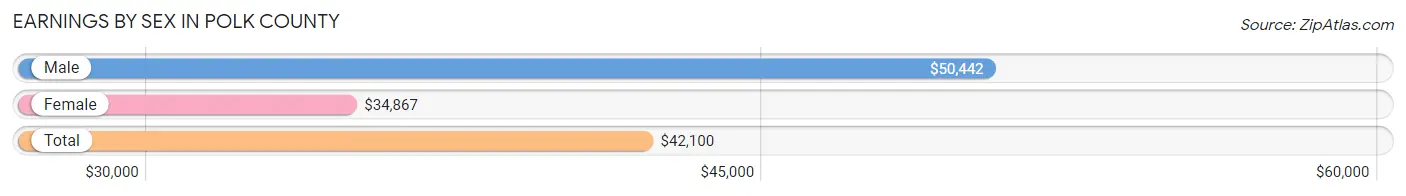
| Sex | Number | Average Earnings |
| Male | 13,018 (53.0%) | $50,442 |
| Female | 11,533 (47.0%) | $34,867 |
| Total | 24,551 (100.0%) | $42,100 |
Earnings by Sex by Income Bracket in Polk County
The most common earnings brackets in Polk County are $75,000 to $99,999 for men (1,639 | 12.6%) and $55,000 to $64,999 for women (933 | 8.1%).
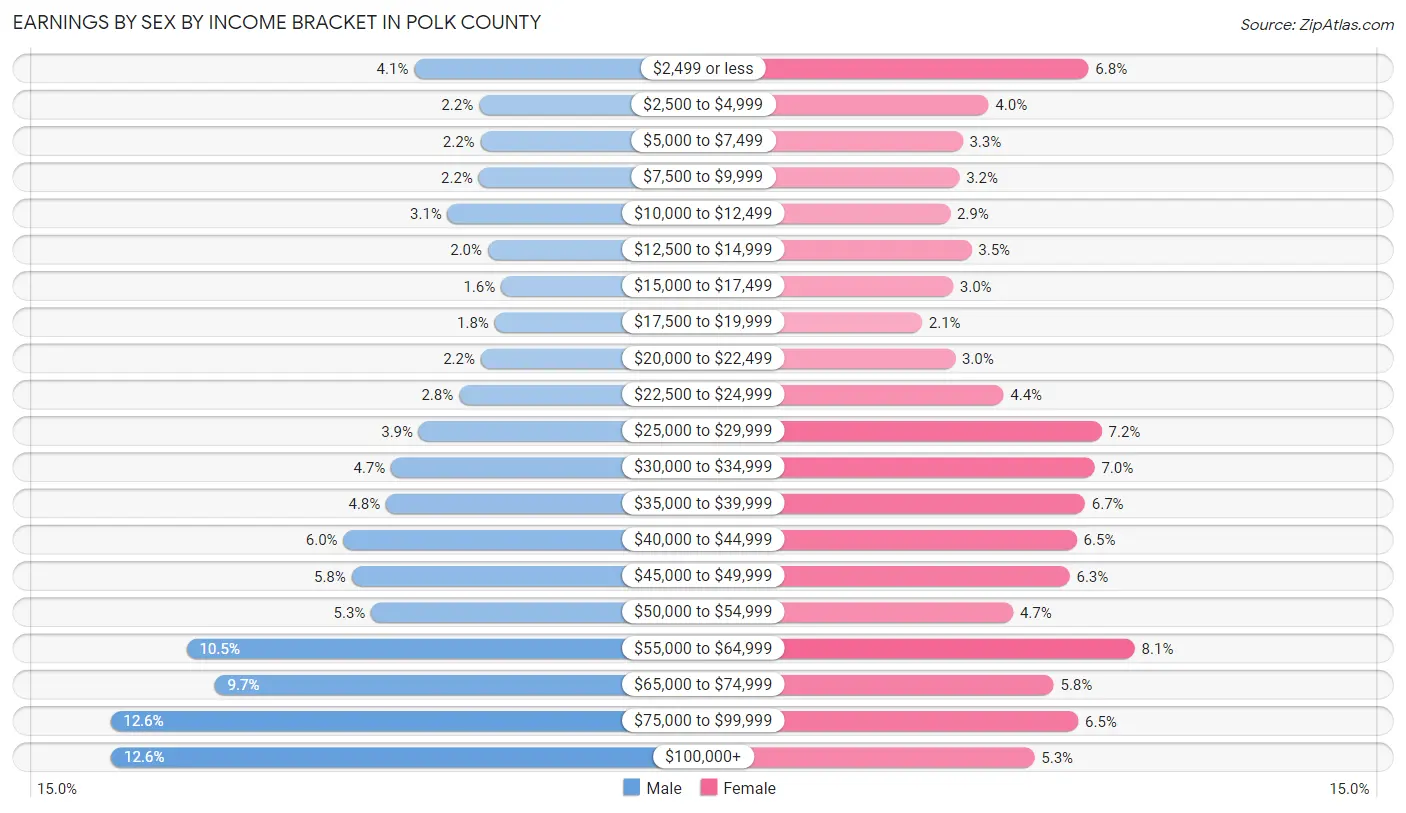
| Income | Male | Female |
| $2,499 or less | 527 (4.1%) | 783 (6.8%) |
| $2,500 to $4,999 | 290 (2.2%) | 459 (4.0%) |
| $5,000 to $7,499 | 285 (2.2%) | 375 (3.3%) |
| $7,500 to $9,999 | 292 (2.2%) | 365 (3.2%) |
| $10,000 to $12,499 | 405 (3.1%) | 334 (2.9%) |
| $12,500 to $14,999 | 258 (2.0%) | 404 (3.5%) |
| $15,000 to $17,499 | 209 (1.6%) | 344 (3.0%) |
| $17,500 to $19,999 | 233 (1.8%) | 243 (2.1%) |
| $20,000 to $22,499 | 284 (2.2%) | 351 (3.0%) |
| $22,500 to $24,999 | 363 (2.8%) | 507 (4.4%) |
| $25,000 to $29,999 | 510 (3.9%) | 826 (7.2%) |
| $30,000 to $34,999 | 612 (4.7%) | 803 (7.0%) |
| $35,000 to $39,999 | 630 (4.8%) | 772 (6.7%) |
| $40,000 to $44,999 | 786 (6.0%) | 745 (6.5%) |
| $45,000 to $49,999 | 756 (5.8%) | 722 (6.3%) |
| $50,000 to $54,999 | 685 (5.3%) | 539 (4.7%) |
| $55,000 to $64,999 | 1,360 (10.4%) | 933 (8.1%) |
| $65,000 to $74,999 | 1,257 (9.7%) | 670 (5.8%) |
| $75,000 to $99,999 | 1,639 (12.6%) | 750 (6.5%) |
| $100,000+ | 1,637 (12.6%) | 608 (5.3%) |
| Total | 13,018 (100.0%) | 11,533 (100.0%) |
Earnings by Sex by Educational Attainment in Polk County
Average earnings in Polk County are $55,812 for men and $39,008 for women, a difference of 30.1%. Men with an educational attainment of graduate degree enjoy the highest average annual earnings of $73,819, while those with less than high school education earn the least with $33,036. Women with an educational attainment of graduate degree earn the most with the average annual earnings of $61,076, while those with high school diploma education have the smallest earnings of $30,509.
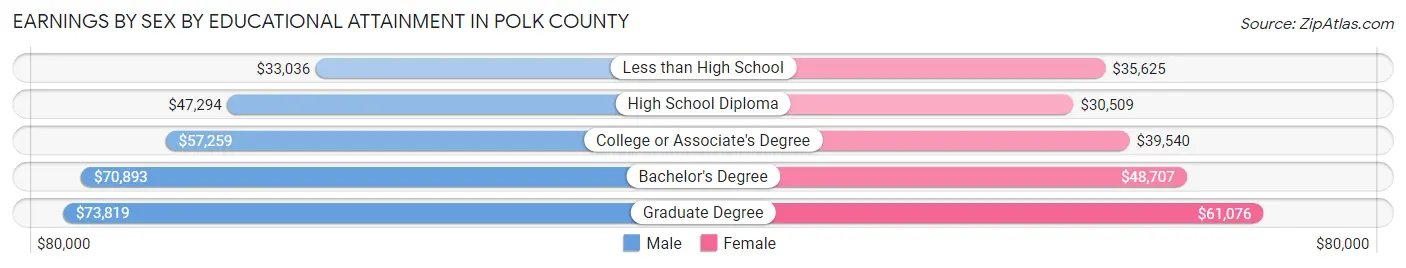
| Educational Attainment | Male Income | Female Income |
| Less than High School | $33,036 | $35,625 |
| High School Diploma | $47,294 | $30,509 |
| College or Associate's Degree | $57,259 | $39,540 |
| Bachelor's Degree | $70,893 | $48,707 |
| Graduate Degree | $73,819 | $61,076 |
| Total | $55,812 | $39,008 |
Family Income in Polk County
Family Income Brackets in Polk County
According to the Polk County family income data, there are 2,869 families falling into the $100,000 to $149,999 income range, which is the most common income bracket and makes up 22.9% of all families. Conversely, the $10,000 to $14,999 income bracket is the least frequent group with only 163 families (1.3%) belonging to this category.
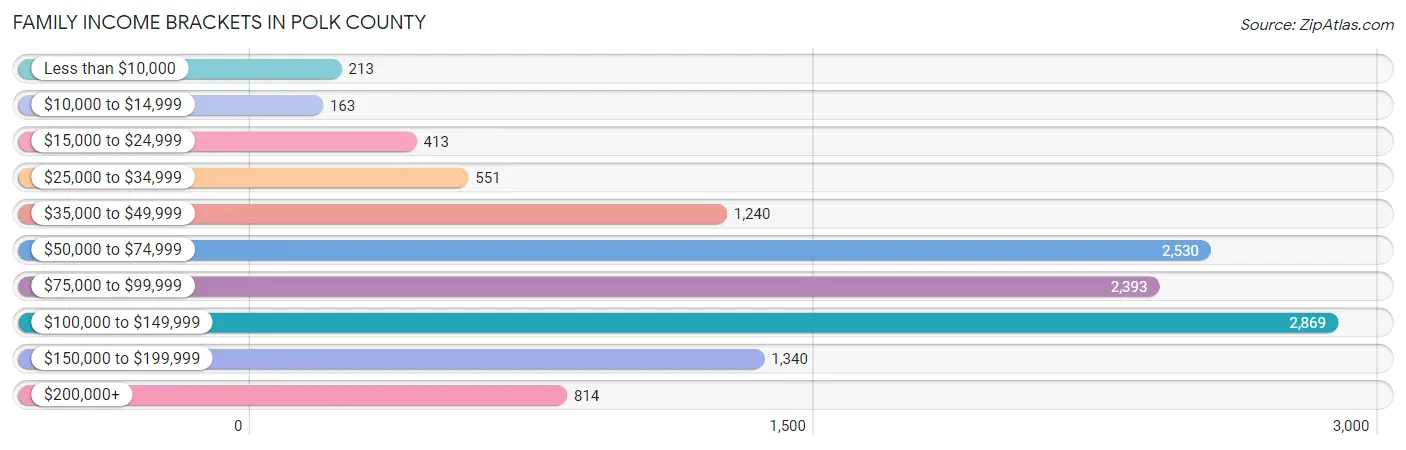
| Income Bracket | # Families | % Families |
| Less than $10,000 | 213 | 1.7% |
| $10,000 to $14,999 | 163 | 1.3% |
| $15,000 to $24,999 | 413 | 3.3% |
| $25,000 to $34,999 | 551 | 4.4% |
| $35,000 to $49,999 | 1,240 | 9.9% |
| $50,000 to $74,999 | 2,530 | 20.2% |
| $75,000 to $99,999 | 2,393 | 19.1% |
| $100,000 to $149,999 | 2,869 | 22.9% |
| $150,000 to $199,999 | 1,340 | 10.7% |
| $200,000+ | 814 | 6.5% |
Family Income by Famaliy Size in Polk County
7+ person families (135 | 1.1%) account for the highest median family income in Polk County with $117,723 per family, while 2-person families (7,358 | 58.7%) have the highest median income of $39,237 per family member.
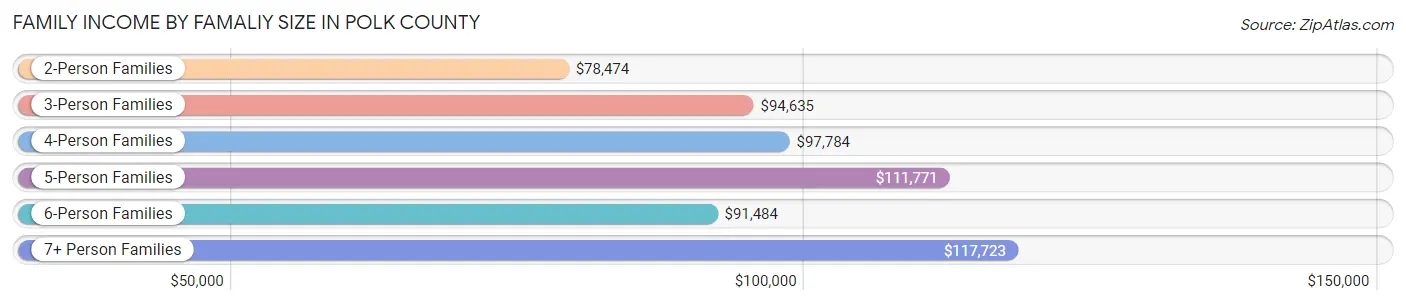
| Income Bracket | # Families | Median Income |
| 2-Person Families | 7,358 (58.7%) | $78,474 |
| 3-Person Families | 2,227 (17.8%) | $94,635 |
| 4-Person Families | 1,693 (13.5%) | $97,784 |
| 5-Person Families | 791 (6.3%) | $111,771 |
| 6-Person Families | 323 (2.6%) | $91,484 |
| 7+ Person Families | 135 (1.1%) | $117,723 |
| Total | 12,527 (100.0%) | $86,676 |
Family Income by Number of Earners in Polk County
The median family income in Polk County is $86,676, with families comprising 3+ earners (1,376) having the highest median family income of $140,521, while families with no earners (2,430) have the lowest median family income of $59,500, accounting for 11.0% and 19.4% of families, respectively.
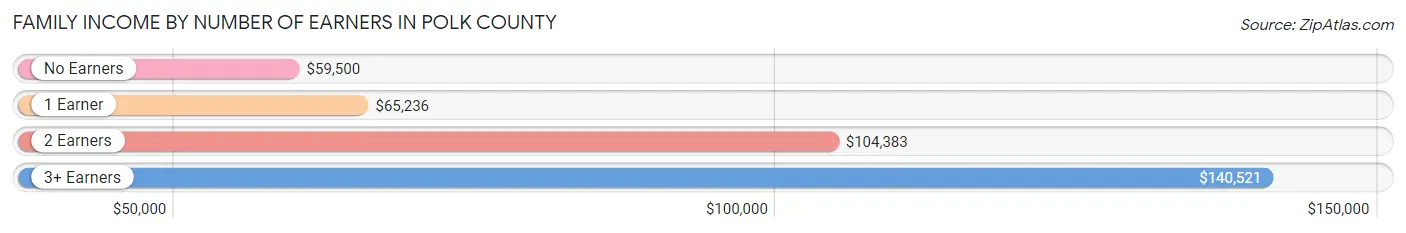
| Number of Earners | # Families | Median Income |
| No Earners | 2,430 (19.4%) | $59,500 |
| 1 Earner | 3,336 (26.6%) | $65,236 |
| 2 Earners | 5,385 (43.0%) | $104,383 |
| 3+ Earners | 1,376 (11.0%) | $140,521 |
| Total | 12,527 (100.0%) | $86,676 |
Household Income in Polk County
Household Income Brackets in Polk County
With 3,521 households falling in the category, the $100,000 to $149,999 income range is the most frequent in Polk County, accounting for 19.0% of all households. In contrast, only 630 households (3.4%) fall into the $10,000 to $14,999 income bracket, making it the least populous group.
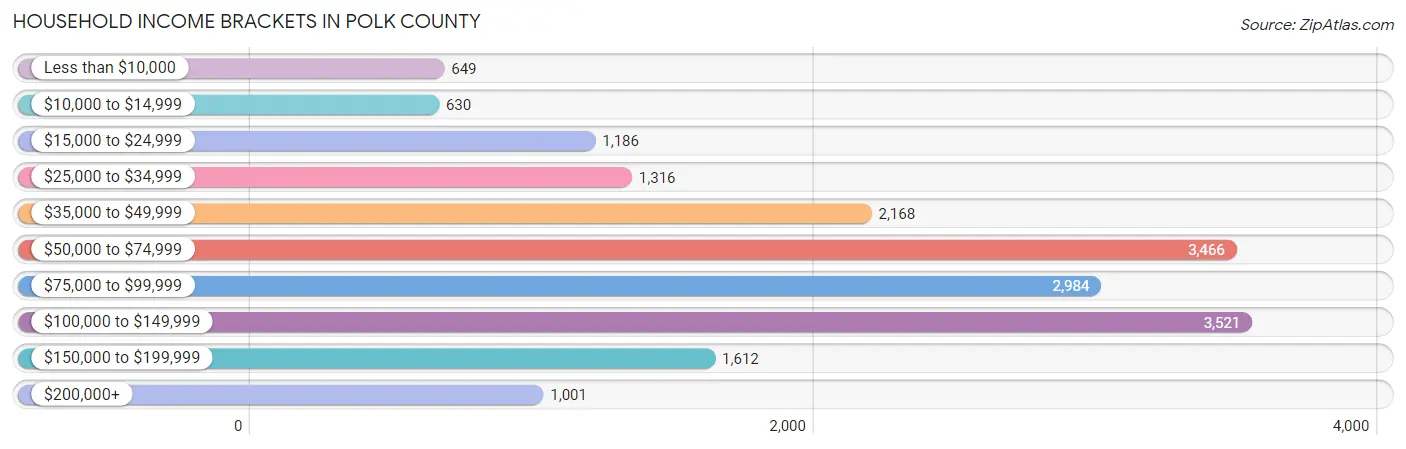
| Income Bracket | # Households | % Households |
| Less than $10,000 | 649 | 3.5% |
| $10,000 to $14,999 | 630 | 3.4% |
| $15,000 to $24,999 | 1,186 | 6.4% |
| $25,000 to $34,999 | 1,316 | 7.1% |
| $35,000 to $49,999 | 2,168 | 11.7% |
| $50,000 to $74,999 | 3,466 | 18.7% |
| $75,000 to $99,999 | 2,984 | 16.1% |
| $100,000 to $149,999 | 3,521 | 19.0% |
| $150,000 to $199,999 | 1,612 | 8.7% |
| $200,000+ | 1,001 | 5.4% |
Household Income by Householder Age in Polk County
The median household income in Polk County is $74,142, with the highest median household income of $87,727 found in the 25 to 44 years age bracket for the primary householder. A total of 4,752 households (25.6%) fall into this category. Meanwhile, the 65+ years age bracket for the primary householder has the lowest median household income of $53,476, with 5,853 households (31.6%) in this group.
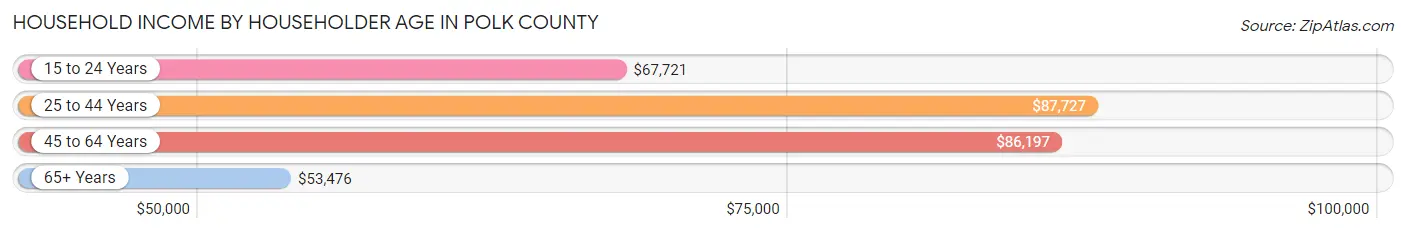
| Income Bracket | # Households | Median Income |
| 15 to 24 Years | 397 (2.1%) | $67,721 |
| 25 to 44 Years | 4,752 (25.6%) | $87,727 |
| 45 to 64 Years | 7,532 (40.6%) | $86,197 |
| 65+ Years | 5,853 (31.6%) | $53,476 |
| Total | 18,534 (100.0%) | $74,142 |
Poverty in Polk County
Income Below Poverty by Sex and Age in Polk County
With 7.3% poverty level for males and 9.4% for females among the residents of Polk County, 15 year old males and 6 to 11 year old females are the most vulnerable to poverty, with 46 males (19.3%) and 203 females (13.9%) in their respective age groups living below the poverty level.
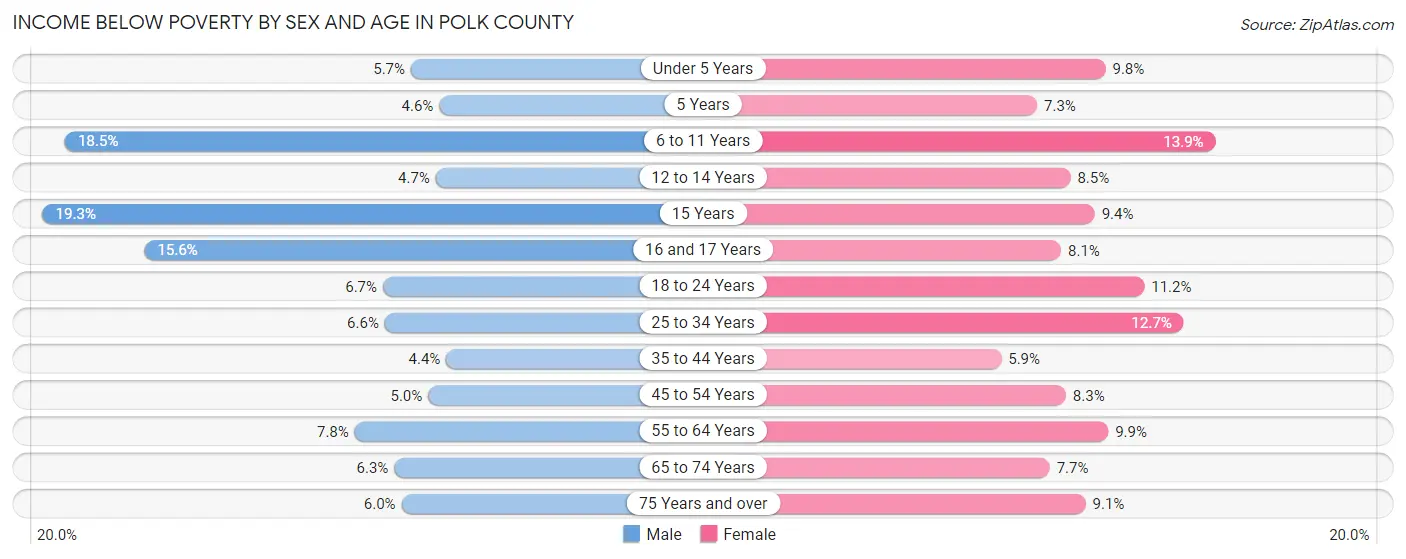
| Age Bracket | Male | Female |
| Under 5 Years | 60 (5.7%) | 98 (9.8%) |
| 5 Years | 10 (4.6%) | 19 (7.2%) |
| 6 to 11 Years | 288 (18.5%) | 203 (13.9%) |
| 12 to 14 Years | 43 (4.7%) | 62 (8.5%) |
| 15 Years | 46 (19.3%) | 29 (9.4%) |
| 16 and 17 Years | 107 (15.5%) | 43 (8.1%) |
| 18 to 24 Years | 106 (6.7%) | 158 (11.2%) |
| 25 to 34 Years | 152 (6.6%) | 282 (12.7%) |
| 35 to 44 Years | 118 (4.3%) | 149 (5.9%) |
| 45 to 54 Years | 150 (5.0%) | 236 (8.3%) |
| 55 to 64 Years | 299 (7.7%) | 373 (9.9%) |
| 65 to 74 Years | 186 (6.3%) | 218 (7.7%) |
| 75 Years and over | 103 (6.0%) | 171 (9.0%) |
| Total | 1,668 (7.3%) | 2,041 (9.4%) |
Income Above Poverty by Sex and Age in Polk County
According to the poverty statistics in Polk County, males aged 35 to 44 years and females aged 35 to 44 years are the age groups that are most secure financially, with 95.7% of males and 94.1% of females in these age groups living above the poverty line.
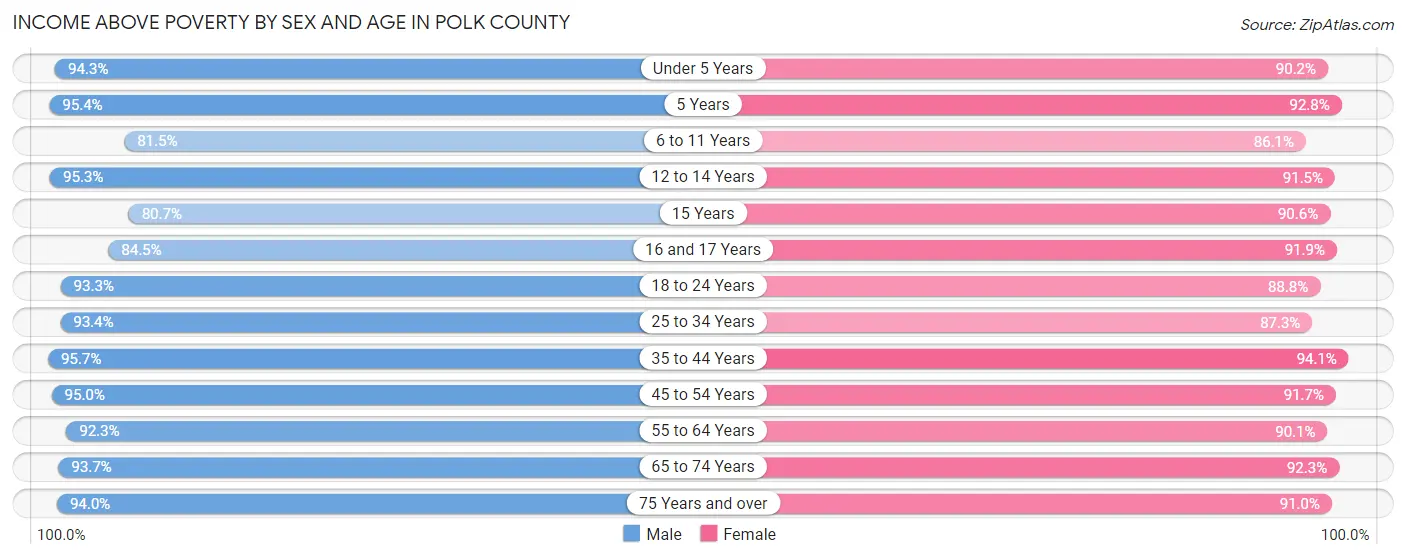
| Age Bracket | Male | Female |
| Under 5 Years | 1,000 (94.3%) | 903 (90.2%) |
| 5 Years | 207 (95.4%) | 243 (92.7%) |
| 6 to 11 Years | 1,269 (81.5%) | 1,261 (86.1%) |
| 12 to 14 Years | 865 (95.3%) | 668 (91.5%) |
| 15 Years | 192 (80.7%) | 280 (90.6%) |
| 16 and 17 Years | 581 (84.5%) | 485 (91.9%) |
| 18 to 24 Years | 1,476 (93.3%) | 1,249 (88.8%) |
| 25 to 34 Years | 2,140 (93.4%) | 1,940 (87.3%) |
| 35 to 44 Years | 2,595 (95.7%) | 2,370 (94.1%) |
| 45 to 54 Years | 2,836 (95.0%) | 2,601 (91.7%) |
| 55 to 64 Years | 3,558 (92.2%) | 3,400 (90.1%) |
| 65 to 74 Years | 2,774 (93.7%) | 2,607 (92.3%) |
| 75 Years and over | 1,612 (94.0%) | 1,719 (90.9%) |
| Total | 21,105 (92.7%) | 19,726 (90.6%) |
Income Below Poverty Among Married-Couple Families in Polk County
The poverty statistics for married-couple families in Polk County show that 2.5% or 257 of the total 10,277 families live below the poverty line. Families with 5 or more children have the highest poverty rate of 12.1%, comprising of 8 families. On the other hand, families with 1 or 2 children have the lowest poverty rate of 1.0%, which includes 23 families.
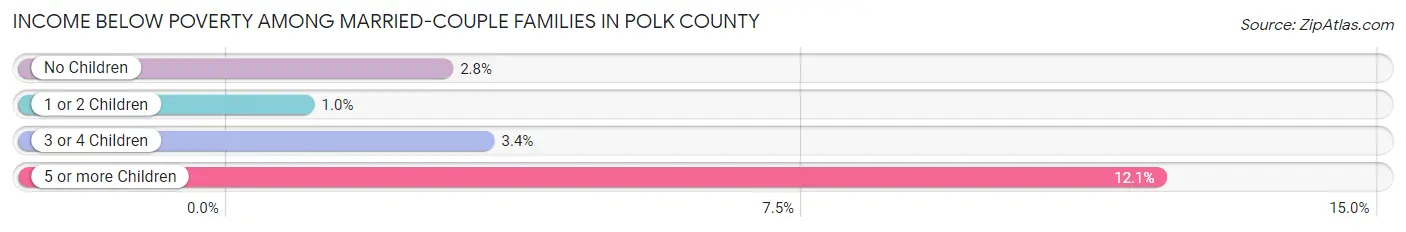
| Children | Above Poverty | Below Poverty |
| No Children | 6,987 (97.2%) | 202 (2.8%) |
| 1 or 2 Children | 2,283 (99.0%) | 23 (1.0%) |
| 3 or 4 Children | 692 (96.7%) | 24 (3.4%) |
| 5 or more Children | 58 (87.9%) | 8 (12.1%) |
| Total | 10,020 (97.5%) | 257 (2.5%) |
Income Below Poverty Among Single-Parent Households in Polk County
According to the poverty data in Polk County, 11.6% or 103 single-father households and 24.4% or 332 single-mother households are living below the poverty line. Among single-father households, those with 3 or 4 children have the highest poverty rate, with 33 households (30.6%) experiencing poverty. Likewise, among single-mother households, those with 3 or 4 children have the highest poverty rate, with 110 households (51.9%) falling below the poverty line.
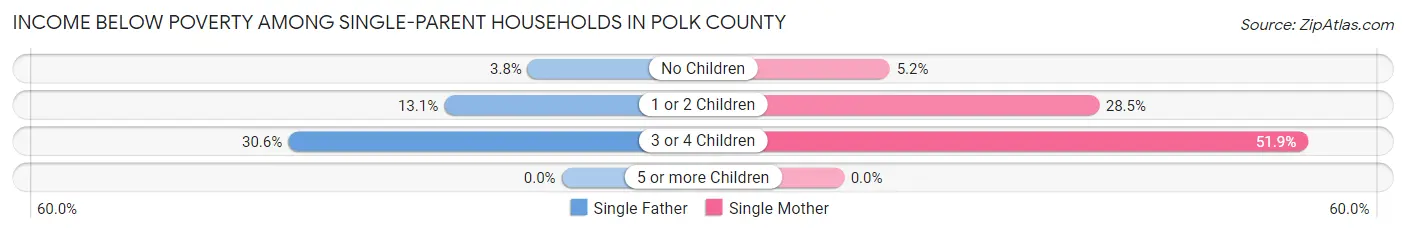
| Children | Single Father | Single Mother |
| No Children | 13 (3.8%) | 23 (5.1%) |
| 1 or 2 Children | 57 (13.1%) | 199 (28.5%) |
| 3 or 4 Children | 33 (30.6%) | 110 (51.9%) |
| 5 or more Children | 0 (0.0%) | 0 (0.0%) |
| Total | 103 (11.6%) | 332 (24.4%) |
Income Below Poverty Among Married-Couple vs Single-Parent Households in Polk County
The poverty data for Polk County shows that 257 of the married-couple family households (2.5%) and 435 of the single-parent households (19.3%) are living below the poverty level. Within the married-couple family households, those with 5 or more children have the highest poverty rate, with 8 households (12.1%) falling below the poverty line. Among the single-parent households, those with 3 or 4 children have the highest poverty rate, with 143 household (44.7%) living below poverty.
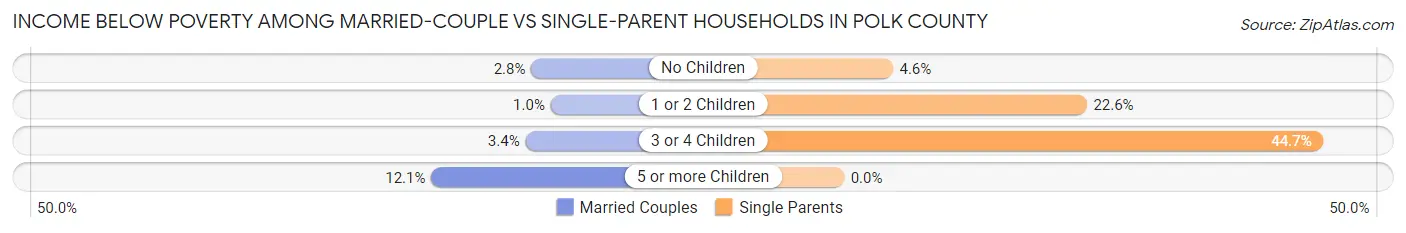
| Children | Married-Couple Families | Single-Parent Households |
| No Children | 202 (2.8%) | 36 (4.5%) |
| 1 or 2 Children | 23 (1.0%) | 256 (22.6%) |
| 3 or 4 Children | 24 (3.4%) | 143 (44.7%) |
| 5 or more Children | 8 (12.1%) | 0 (0.0%) |
| Total | 257 (2.5%) | 435 (19.3%) |
Employment Characteristics in Polk County
Employment by Class of Employer in Polk County
Among the 21,893 employed individuals in Polk County, private company employees (15,212 | 69.5%), self-employed (not incorporated) (1,709 | 7.8%), and local government employees (1,650 | 7.5%) make up the most common classes of employment.
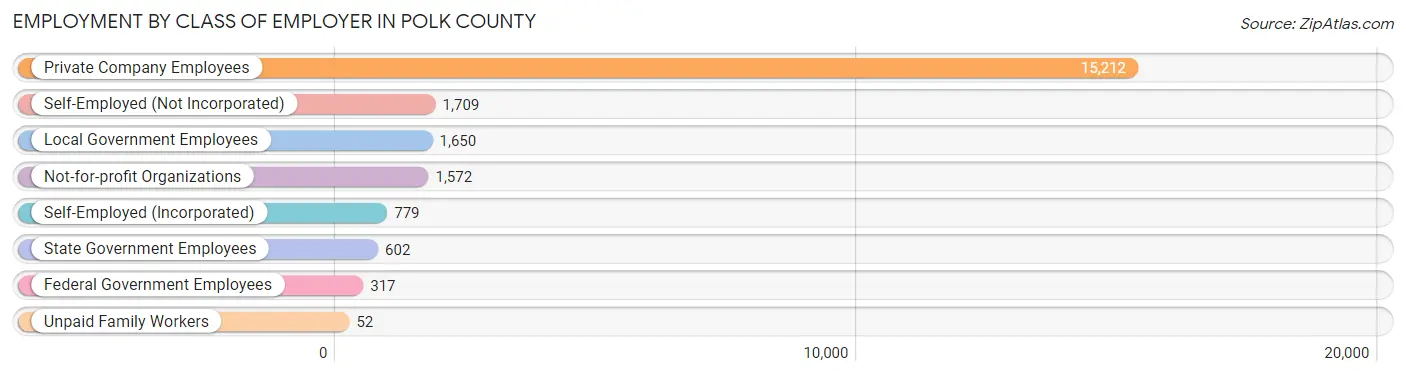
| Employer Class | # Employees | % Employees |
| Private Company Employees | 15,212 | 69.5% |
| Self-Employed (Incorporated) | 779 | 3.6% |
| Self-Employed (Not Incorporated) | 1,709 | 7.8% |
| Not-for-profit Organizations | 1,572 | 7.2% |
| Local Government Employees | 1,650 | 7.5% |
| State Government Employees | 602 | 2.8% |
| Federal Government Employees | 317 | 1.5% |
| Unpaid Family Workers | 52 | 0.2% |
| Total | 21,893 | 100.0% |
Employment Status by Age in Polk County
According to the labor force statistics for Polk County, out of the total population over 16 years of age (37,216), 62.5% or 23,260 individuals are in the labor force, with 4.2% or 977 of them unemployed. The age group with the highest labor force participation rate is 25 to 29 years, with 88.8% or 1,959 individuals in the labor force. Within the labor force, the 16 to 19 years age range has the highest percentage of unemployed individuals, with 12.9% or 162 of them being unemployed.
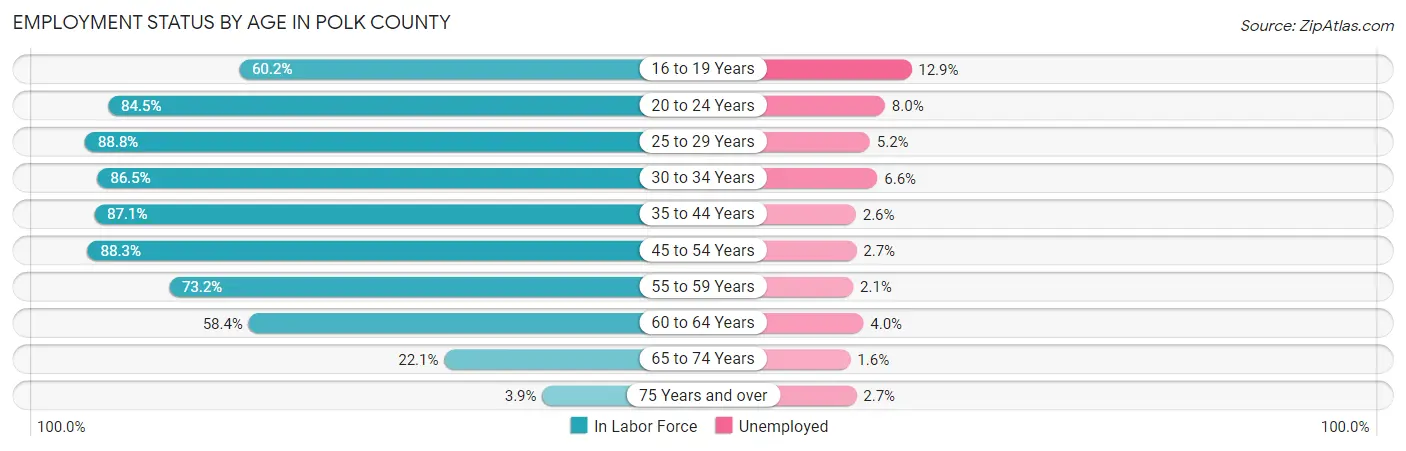
| Age Bracket | In Labor Force | Unemployed |
| 16 to 19 Years | 1,254 (60.2%) | 162 (12.9%) |
| 20 to 24 Years | 1,813 (84.5%) | 145 (8.0%) |
| 25 to 29 Years | 1,959 (88.8%) | 102 (5.2%) |
| 30 to 34 Years | 2,015 (86.5%) | 133 (6.6%) |
| 35 to 44 Years | 4,567 (87.1%) | 119 (2.6%) |
| 45 to 54 Years | 5,146 (88.3%) | 139 (2.7%) |
| 55 to 59 Years | 2,826 (73.2%) | 59 (2.1%) |
| 60 to 64 Years | 2,227 (58.4%) | 89 (4.0%) |
| 65 to 74 Years | 1,291 (22.1%) | 21 (1.6%) |
| 75 Years and over | 151 (3.9%) | 4 (2.7%) |
| Total | 23,260 (62.5%) | 977 (4.2%) |
Employment Status by Educational Attainment in Polk County
According to labor force statistics for Polk County, 80.5% of individuals (18,740) out of the total population between 25 and 64 years of age (23,280) are in the labor force, with 3.4% or 637 of them being unemployed. The group with the highest labor force participation rate are those with the educational attainment of college / associate degree, with 85.7% or 7,526 individuals in the labor force. Within the labor force, individuals with less than high school education have the highest percentage of unemployment, with 12.1% or 106 of them being unemployed.
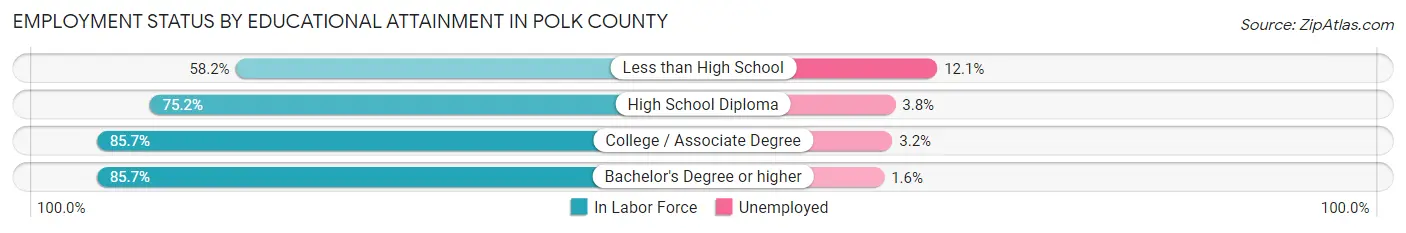
| Educational Attainment | In Labor Force | Unemployed |
| Less than High School | 875 (58.2%) | 182 (12.1%) |
| High School Diploma | 5,695 (75.2%) | 288 (3.8%) |
| College / Associate Degree | 7,526 (85.7%) | 281 (3.2%) |
| Bachelor's Degree or higher | 4,647 (85.7%) | 87 (1.6%) |
| Total | 18,740 (80.5%) | 792 (3.4%) |
Employment Occupations by Sex in Polk County
Management, Business, Science and Arts Occupations
The most common Management, Business, Science and Arts occupations in Polk County are Management (2,415 | 10.8%), Community & Social Service (1,949 | 8.7%), Education Instruction & Library (1,153 | 5.2%), Health Diagnosing & Treating (1,096 | 4.9%), and Business & Financial (835 | 3.7%).

Management, Business, Science and Arts Occupations by Sex
Within the Management, Business, Science and Arts occupations in Polk County, the most male-oriented occupations are Architecture & Engineering (88.9%), Computers, Engineering & Science (74.5%), and Computers & Mathematics (68.2%), while the most female-oriented occupations are Health Diagnosing & Treating (83.9%), Health Technologists (82.6%), and Education Instruction & Library (71.7%).
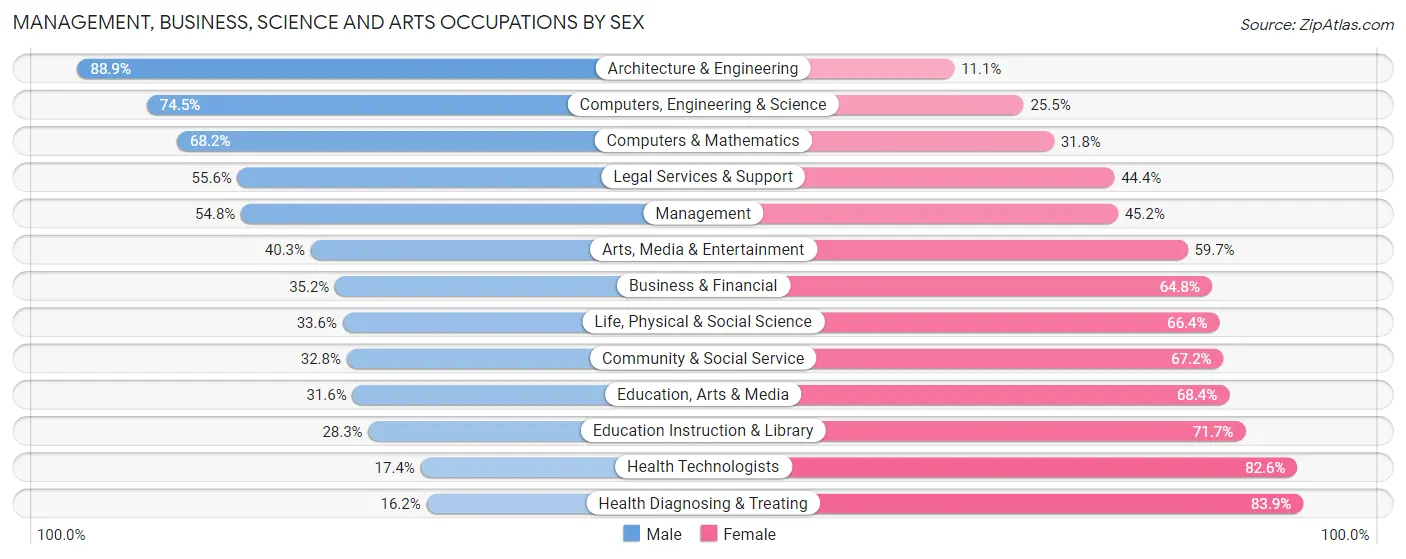
| Occupation | Male | Female |
| Management | 1,324 (54.8%) | 1,091 (45.2%) |
| Business & Financial | 294 (35.2%) | 541 (64.8%) |
| Computers, Engineering & Science | 604 (74.5%) | 207 (25.5%) |
| Computers & Mathematics | 180 (68.2%) | 84 (31.8%) |
| Architecture & Engineering | 386 (88.9%) | 48 (11.1%) |
| Life, Physical & Social Science | 38 (33.6%) | 75 (66.4%) |
| Community & Social Service | 639 (32.8%) | 1,310 (67.2%) |
| Education, Arts & Media | 128 (31.6%) | 277 (68.4%) |
| Legal Services & Support | 100 (55.6%) | 80 (44.4%) |
| Education Instruction & Library | 326 (28.3%) | 827 (71.7%) |
| Arts, Media & Entertainment | 85 (40.3%) | 126 (59.7%) |
| Health Diagnosing & Treating | 177 (16.2%) | 919 (83.9%) |
| Health Technologists | 117 (17.4%) | 556 (82.6%) |
| Total (Category) | 3,038 (42.7%) | 4,068 (57.3%) |
| Total (Overall) | 11,957 (53.7%) | 10,320 (46.3%) |
Services Occupations
The most common Services occupations in Polk County are Food Preparation & Serving (963 | 4.3%), Healthcare Support (879 | 4.0%), Cleaning & Maintenance (524 | 2.4%), Personal Care & Service (493 | 2.2%), and Security & Protection (258 | 1.2%).
Services Occupations by Sex
Within the Services occupations in Polk County, the most male-oriented occupations are Law Enforcement (78.7%), Security & Protection (70.5%), and Cleaning & Maintenance (64.1%), while the most female-oriented occupations are Healthcare Support (91.1%), Personal Care & Service (74.7%), and Food Preparation & Serving (67.0%).
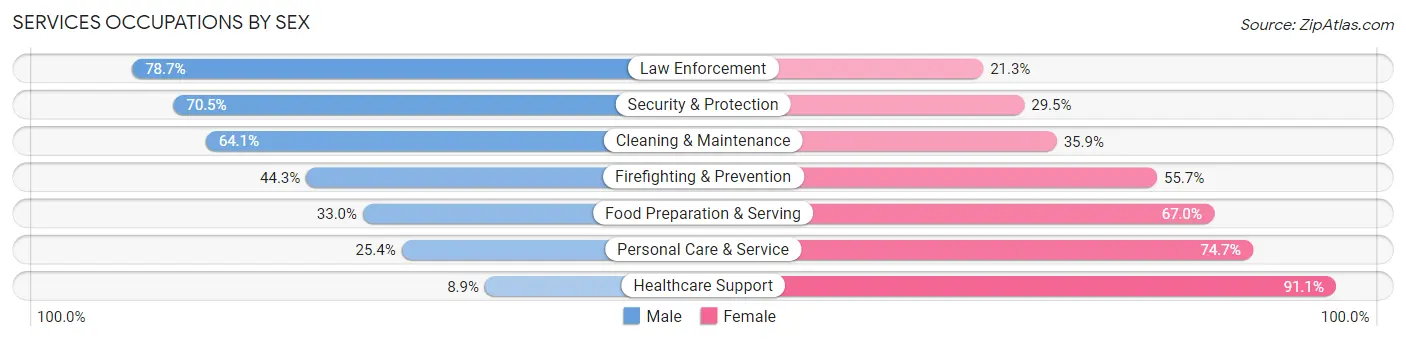
| Occupation | Male | Female |
| Healthcare Support | 78 (8.9%) | 801 (91.1%) |
| Security & Protection | 182 (70.5%) | 76 (29.5%) |
| Firefighting & Prevention | 27 (44.3%) | 34 (55.7%) |
| Law Enforcement | 155 (78.7%) | 42 (21.3%) |
| Food Preparation & Serving | 318 (33.0%) | 645 (67.0%) |
| Cleaning & Maintenance | 336 (64.1%) | 188 (35.9%) |
| Personal Care & Service | 125 (25.4%) | 368 (74.7%) |
| Total (Category) | 1,039 (33.3%) | 2,078 (66.7%) |
| Total (Overall) | 11,957 (53.7%) | 10,320 (46.3%) |
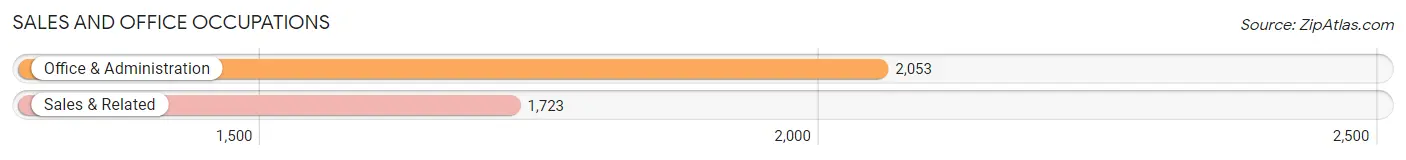
Sales and Office Occupations
The most common Sales and Office occupations in Polk County are Office & Administration (2,053 | 9.2%), and Sales & Related (1,723 | 7.7%).
Sales and Office Occupations by Sex
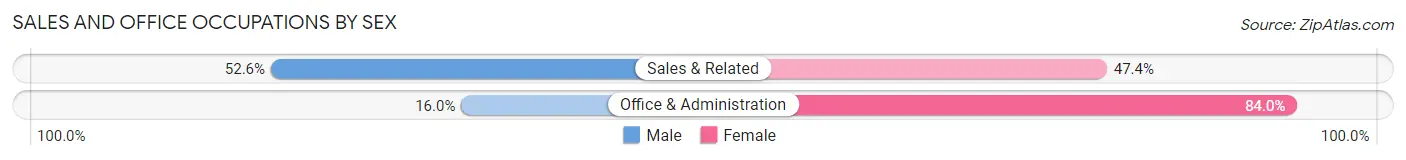
| Occupation | Male | Female |
| Sales & Related | 907 (52.6%) | 816 (47.4%) |
| Office & Administration | 329 (16.0%) | 1,724 (84.0%) |
| Total (Category) | 1,236 (32.7%) | 2,540 (67.3%) |
| Total (Overall) | 11,957 (53.7%) | 10,320 (46.3%) |
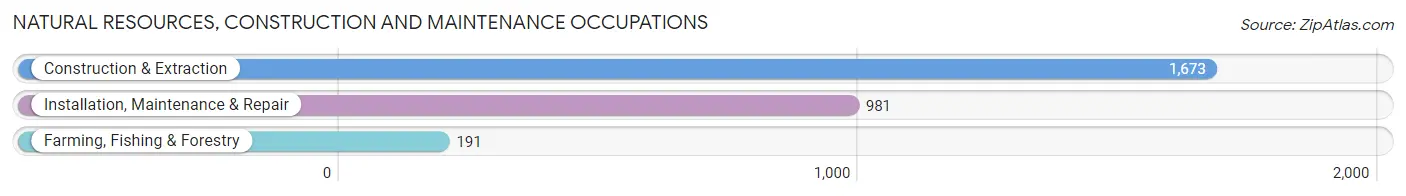
Natural Resources, Construction and Maintenance Occupations
The most common Natural Resources, Construction and Maintenance occupations in Polk County are Construction & Extraction (1,673 | 7.5%), Installation, Maintenance & Repair (981 | 4.4%), and Farming, Fishing & Forestry (191 | 0.9%).
Natural Resources, Construction and Maintenance Occupations by Sex
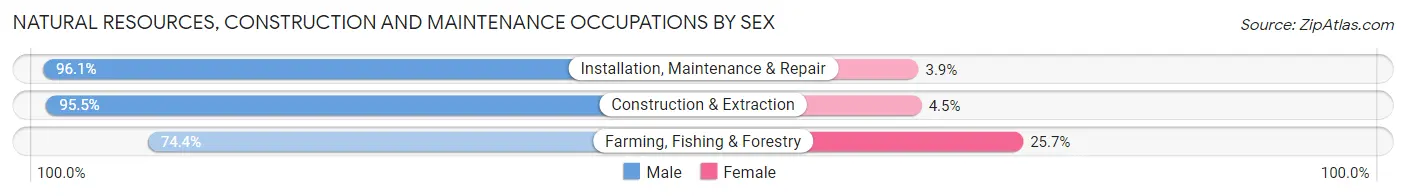
| Occupation | Male | Female |
| Farming, Fishing & Forestry | 142 (74.4%) | 49 (25.7%) |
| Construction & Extraction | 1,597 (95.5%) | 76 (4.5%) |
| Installation, Maintenance & Repair | 943 (96.1%) | 38 (3.9%) |
| Total (Category) | 2,682 (94.3%) | 163 (5.7%) |
| Total (Overall) | 11,957 (53.7%) | 10,320 (46.3%) |
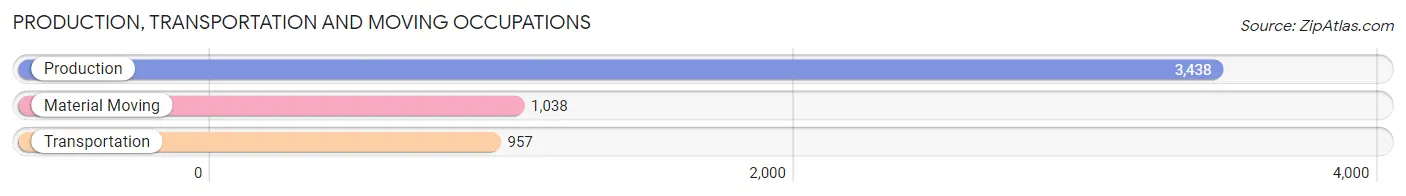
Production, Transportation and Moving Occupations
The most common Production, Transportation and Moving occupations in Polk County are Production (3,438 | 15.4%), Material Moving (1,038 | 4.7%), and Transportation (957 | 4.3%).
Production, Transportation and Moving Occupations by Sex
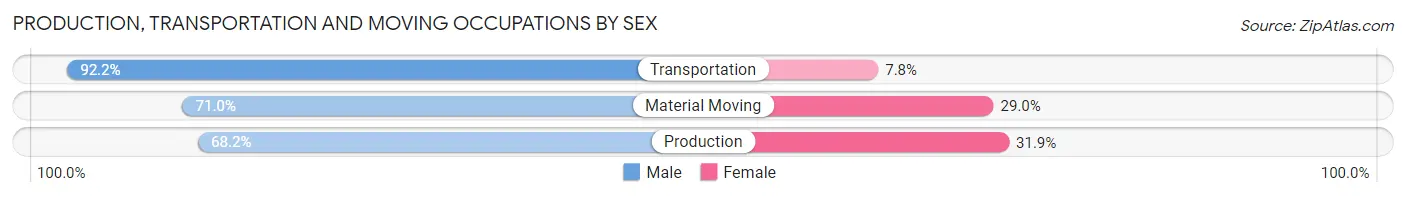
| Occupation | Male | Female |
| Production | 2,343 (68.1%) | 1,095 (31.9%) |
| Transportation | 882 (92.2%) | 75 (7.8%) |
| Material Moving | 737 (71.0%) | 301 (29.0%) |
| Total (Category) | 3,962 (72.9%) | 1,471 (27.1%) |
| Total (Overall) | 11,957 (53.7%) | 10,320 (46.3%) |
Employment Industries by Sex in Polk County
Employment Industries in Polk County
The major employment industries in Polk County include Manufacturing (5,540 | 24.9%), Health Care & Social Assistance (3,208 | 14.4%), Retail Trade (2,249 | 10.1%), Construction (2,143 | 9.6%), and Educational Services (1,517 | 6.8%).
Employment Industries by Sex in Polk County
The Polk County industries that see more men than women are Enterprise Management (100.0%), Mining, Quarrying, & Extraction (92.6%), and Construction (91.0%), whereas the industries that tend to have a higher number of women are Health Care & Social Assistance (85.5%), Finance & Insurance (72.1%), and Educational Services (70.7%).
| Industry | Male | Female |
| Agriculture, Fishing & Hunting | 491 (82.7%) | 103 (17.3%) |
| Mining, Quarrying, & Extraction | 63 (92.6%) | 5 (7.3%) |
| Construction | 1,951 (91.0%) | 192 (9.0%) |
| Manufacturing | 3,772 (68.1%) | 1,768 (31.9%) |
| Wholesale Trade | 371 (72.5%) | 141 (27.5%) |
| Retail Trade | 1,066 (47.4%) | 1,183 (52.6%) |
| Transportation & Warehousing | 624 (80.1%) | 155 (19.9%) |
| Utilities | 118 (89.4%) | 14 (10.6%) |
| Information | 118 (52.7%) | 106 (47.3%) |
| Finance & Insurance | 197 (27.9%) | 510 (72.1%) |
| Real Estate, Rental & Leasing | 123 (45.9%) | 145 (54.1%) |
| Professional & Scientific | 336 (46.4%) | 388 (53.6%) |
| Enterprise Management | 22 (100.0%) | 0 (0.0%) |
| Administrative & Support | 259 (66.4%) | 131 (33.6%) |
| Educational Services | 444 (29.3%) | 1,073 (70.7%) |
| Health Care & Social Assistance | 464 (14.5%) | 2,744 (85.5%) |
| Arts, Entertainment & Recreation | 237 (54.5%) | 198 (45.5%) |
| Accommodation & Food Services | 375 (38.0%) | 612 (62.0%) |
| Public Administration | 392 (48.0%) | 425 (52.0%) |
| Total | 11,957 (53.7%) | 10,320 (46.3%) |
Education in Polk County
School Enrollment in Polk County
The most common levels of schooling among the 8,902 students in Polk County are high school (2,449 | 27.5%), middle school (2,101 | 23.6%), and elementary school (1,934 | 21.7%).
| School Level | # Students | % Students |
| Nursery / Preschool | 537 | 6.0% |
| Kindergarten | 517 | 5.8% |
| Elementary School | 1,934 | 21.7% |
| Middle School | 2,101 | 23.6% |
| High School | 2,449 | 27.5% |
| College / Undergraduate | 1,066 | 12.0% |
| Graduate / Professional | 298 | 3.4% |
| Total | 8,902 | 100.0% |
School Enrollment by Age by Funding Source in Polk County
Out of a total of 8,902 students who are enrolled in schools in Polk County, 1,042 (11.7%) attend a private institution, while the remaining 7,860 (88.3%) are enrolled in public schools. The age group of 35 years and over has the highest likelihood of being enrolled in private schools, with 88 (22.3% in the age bracket) enrolled. Conversely, the age group of 5 to 9 year old has the lowest likelihood of being enrolled in a private school, with 2,106 (91.8% in the age bracket) attending a public institution.
| Age Bracket | Public School | Private School |
| 3 to 4 Year Olds | 294 (83.5%) | 58 (16.5%) |
| 5 to 9 Year Old | 2,106 (91.8%) | 188 (8.2%) |
| 10 to 14 Year Olds | 2,461 (87.7%) | 344 (12.3%) |
| 15 to 17 Year Olds | 1,567 (91.5%) | 146 (8.5%) |
| 18 to 19 Year Olds | 452 (86.1%) | 73 (13.9%) |
| 20 to 24 Year Olds | 403 (79.2%) | 106 (20.8%) |
| 25 to 34 Year Olds | 270 (87.1%) | 40 (12.9%) |
| 35 Years and over | 306 (77.7%) | 88 (22.3%) |
| Total | 7,860 (88.3%) | 1,042 (11.7%) |
Educational Attainment by Field of Study in Polk County
Education (1,536 | 18.9%), business (1,362 | 16.7%), science & technology (952 | 11.7%), bio, nature & agricultural (912 | 11.2%), and arts & humanities (703 | 8.6%) are the most common fields of study among 8,148 individuals in Polk County who have obtained a bachelor's degree or higher.
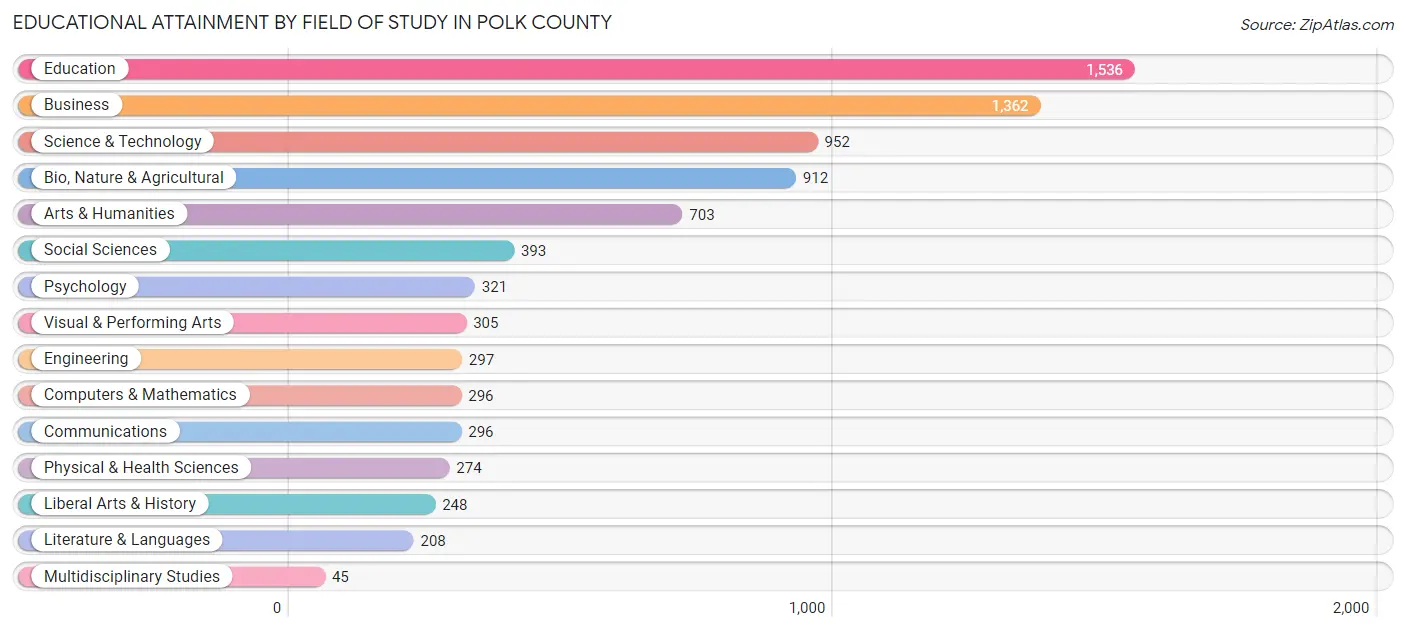
| Field of Study | # Graduates | % Graduates |
| Computers & Mathematics | 296 | 3.6% |
| Bio, Nature & Agricultural | 912 | 11.2% |
| Physical & Health Sciences | 274 | 3.4% |
| Psychology | 321 | 3.9% |
| Social Sciences | 393 | 4.8% |
| Engineering | 297 | 3.6% |
| Multidisciplinary Studies | 45 | 0.5% |
| Science & Technology | 952 | 11.7% |
| Business | 1,362 | 16.7% |
| Education | 1,536 | 18.9% |
| Literature & Languages | 208 | 2.5% |
| Liberal Arts & History | 248 | 3.0% |
| Visual & Performing Arts | 305 | 3.7% |
| Communications | 296 | 3.6% |
| Arts & Humanities | 703 | 8.6% |
| Total | 8,148 | 100.0% |
Transportation & Commute in Polk County
Vehicle Availability by Sex in Polk County
The most prevalent vehicle ownership categories in Polk County are males with 2 vehicles (4,576, accounting for 38.9%) and females with 2 vehicles (3,516, making up 45.2%).
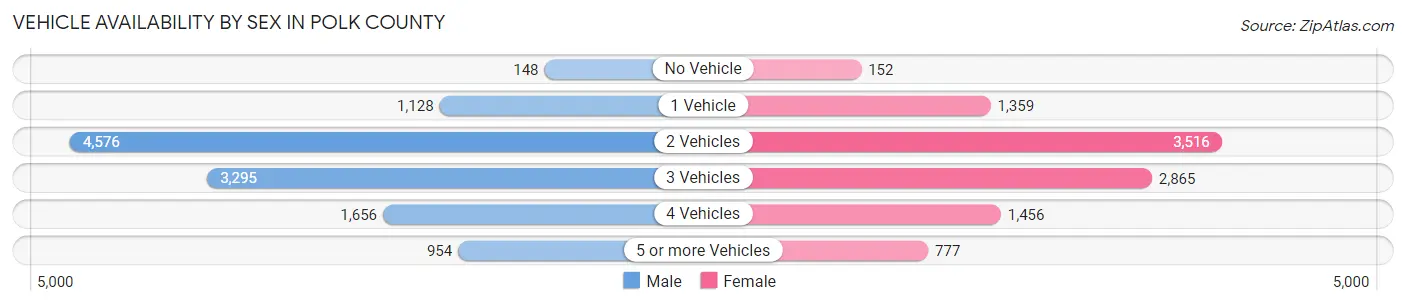
| Vehicles Available | Male | Female |
| No Vehicle | 148 (1.3%) | 152 (1.5%) |
| 1 Vehicle | 1,128 (9.6%) | 1,359 (13.4%) |
| 2 Vehicles | 4,576 (38.9%) | 3,516 (34.7%) |
| 3 Vehicles | 3,295 (28.0%) | 2,865 (28.3%) |
| 4 Vehicles | 1,656 (14.1%) | 1,456 (14.4%) |
| 5 or more Vehicles | 954 (8.1%) | 777 (7.7%) |
| Total | 11,757 (100.0%) | 10,125 (100.0%) |
Commute Time in Polk County
The most frequently occuring commute durations in Polk County are 5 to 9 minutes (2,772 commuters, 13.9%), 15 to 19 minutes (2,240 commuters, 11.2%), and 30 to 34 minutes (2,223 commuters, 11.1%).
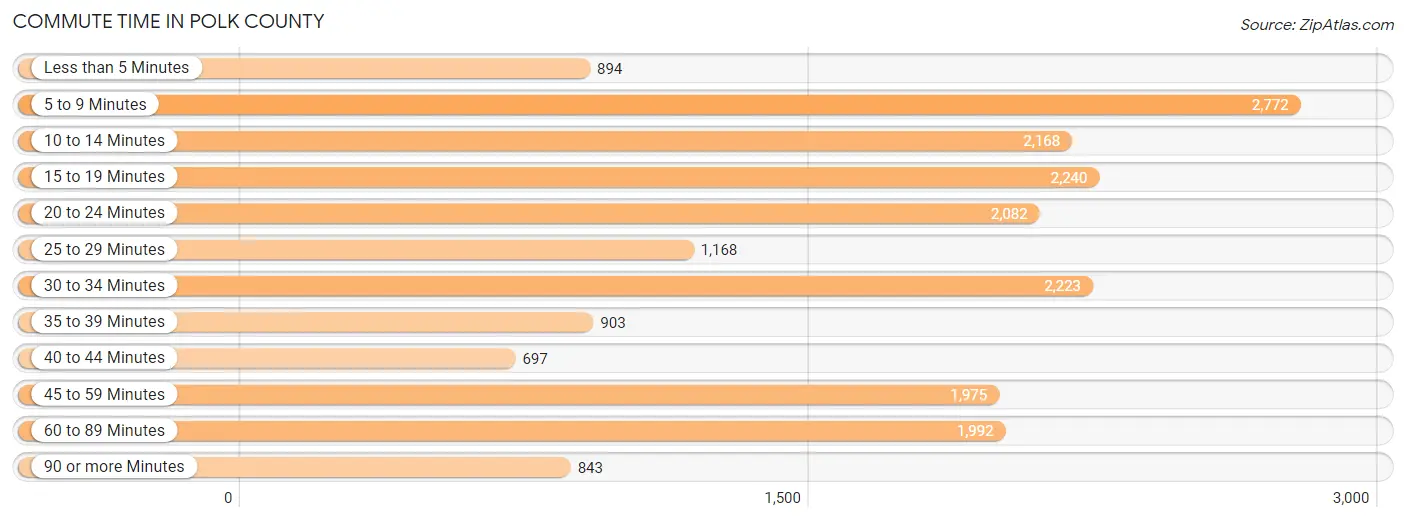
| Commute Time | # Commuters | % Commuters |
| Less than 5 Minutes | 894 | 4.5% |
| 5 to 9 Minutes | 2,772 | 13.9% |
| 10 to 14 Minutes | 2,168 | 10.9% |
| 15 to 19 Minutes | 2,240 | 11.2% |
| 20 to 24 Minutes | 2,082 | 10.4% |
| 25 to 29 Minutes | 1,168 | 5.9% |
| 30 to 34 Minutes | 2,223 | 11.1% |
| 35 to 39 Minutes | 903 | 4.5% |
| 40 to 44 Minutes | 697 | 3.5% |
| 45 to 59 Minutes | 1,975 | 9.9% |
| 60 to 89 Minutes | 1,992 | 10.0% |
| 90 or more Minutes | 843 | 4.2% |
Commute Time by Sex in Polk County
The most common commute times in Polk County are 5 to 9 minutes (1,393 commuters, 12.8%) for males and 5 to 9 minutes (1,379 commuters, 15.1%) for females.
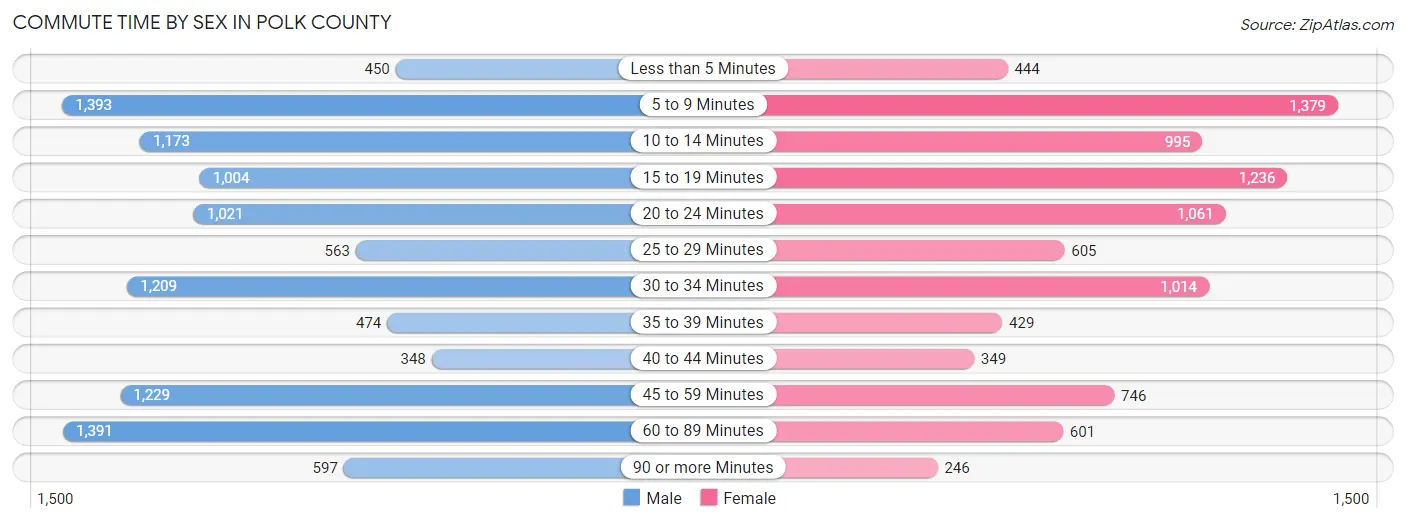
| Commute Time | Male | Female |
| Less than 5 Minutes | 450 (4.2%) | 444 (4.9%) |
| 5 to 9 Minutes | 1,393 (12.8%) | 1,379 (15.1%) |
| 10 to 14 Minutes | 1,173 (10.8%) | 995 (10.9%) |
| 15 to 19 Minutes | 1,004 (9.2%) | 1,236 (13.6%) |
| 20 to 24 Minutes | 1,021 (9.4%) | 1,061 (11.7%) |
| 25 to 29 Minutes | 563 (5.2%) | 605 (6.6%) |
| 30 to 34 Minutes | 1,209 (11.1%) | 1,014 (11.1%) |
| 35 to 39 Minutes | 474 (4.4%) | 429 (4.7%) |
| 40 to 44 Minutes | 348 (3.2%) | 349 (3.8%) |
| 45 to 59 Minutes | 1,229 (11.3%) | 746 (8.2%) |
| 60 to 89 Minutes | 1,391 (12.8%) | 601 (6.6%) |
| 90 or more Minutes | 597 (5.5%) | 246 (2.7%) |
Time of Departure to Work by Sex in Polk County
The most frequent times of departure to work in Polk County are 12:00 AM to 4:59 AM (1,327, 12.2%) for males and 7:00 AM to 7:29 AM (1,439, 15.8%) for females.
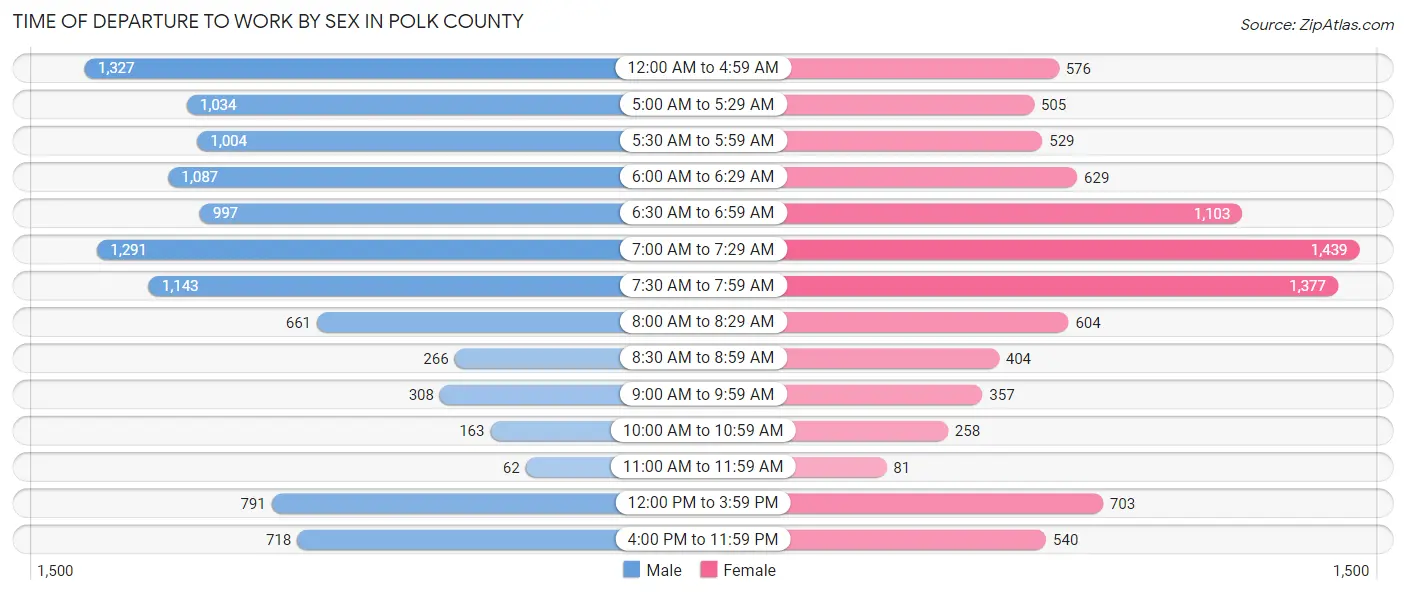
| Time of Departure | Male | Female |
| 12:00 AM to 4:59 AM | 1,327 (12.2%) | 576 (6.3%) |
| 5:00 AM to 5:29 AM | 1,034 (9.5%) | 505 (5.6%) |
| 5:30 AM to 5:59 AM | 1,004 (9.2%) | 529 (5.8%) |
| 6:00 AM to 6:29 AM | 1,087 (10.0%) | 629 (6.9%) |
| 6:30 AM to 6:59 AM | 997 (9.2%) | 1,103 (12.1%) |
| 7:00 AM to 7:29 AM | 1,291 (11.9%) | 1,439 (15.8%) |
| 7:30 AM to 7:59 AM | 1,143 (10.5%) | 1,377 (15.1%) |
| 8:00 AM to 8:29 AM | 661 (6.1%) | 604 (6.6%) |
| 8:30 AM to 8:59 AM | 266 (2.5%) | 404 (4.4%) |
| 9:00 AM to 9:59 AM | 308 (2.8%) | 357 (3.9%) |
| 10:00 AM to 10:59 AM | 163 (1.5%) | 258 (2.8%) |
| 11:00 AM to 11:59 AM | 62 (0.6%) | 81 (0.9%) |
| 12:00 PM to 3:59 PM | 791 (7.3%) | 703 (7.7%) |
| 4:00 PM to 11:59 PM | 718 (6.6%) | 540 (5.9%) |
| Total | 10,852 (100.0%) | 9,105 (100.0%) |
Housing Occupancy in Polk County
Occupancy by Ownership in Polk County
Of the total 18,534 dwellings in Polk County, owner-occupied units account for 14,932 (80.6%), while renter-occupied units make up 3,602 (19.4%).
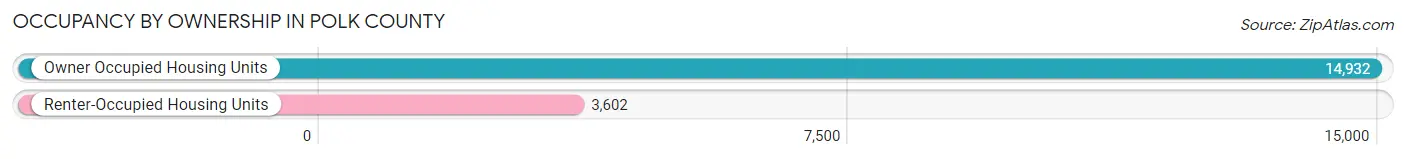
| Occupancy | # Housing Units | % Housing Units |
| Owner Occupied Housing Units | 14,932 | 80.6% |
| Renter-Occupied Housing Units | 3,602 | 19.4% |
| Total Occupied Housing Units | 18,534 | 100.0% |
Occupancy by Household Size in Polk County
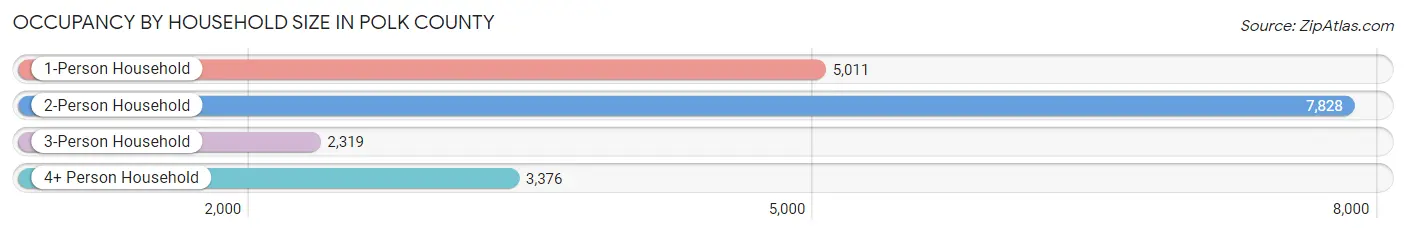
| Household Size | # Housing Units | % Housing Units |
| 1-Person Household | 5,011 | 27.0% |
| 2-Person Household | 7,828 | 42.2% |
| 3-Person Household | 2,319 | 12.5% |
| 4+ Person Household | 3,376 | 18.2% |
| Total Housing Units | 18,534 | 100.0% |
Occupancy by Ownership by Household Size in Polk County

| Household Size | Owner-occupied | Renter-occupied |
| 1-Person Household | 3,292 (65.7%) | 1,719 (34.3%) |
| 2-Person Household | 6,817 (87.1%) | 1,011 (12.9%) |
| 3-Person Household | 1,982 (85.5%) | 337 (14.5%) |
| 4+ Person Household | 2,841 (84.2%) | 535 (15.9%) |
| Total Housing Units | 14,932 (80.6%) | 3,602 (19.4%) |
Occupancy by Educational Attainment in Polk County

| Household Size | Owner-occupied | Renter-occupied |
| Less than High School | 650 (61.3%) | 410 (38.7%) |
| High School Diploma | 4,742 (77.0%) | 1,415 (23.0%) |
| College/Associate Degree | 5,329 (79.9%) | 1,342 (20.1%) |
| Bachelor's Degree or higher | 4,211 (90.6%) | 435 (9.4%) |
Occupancy by Age of Householder in Polk County
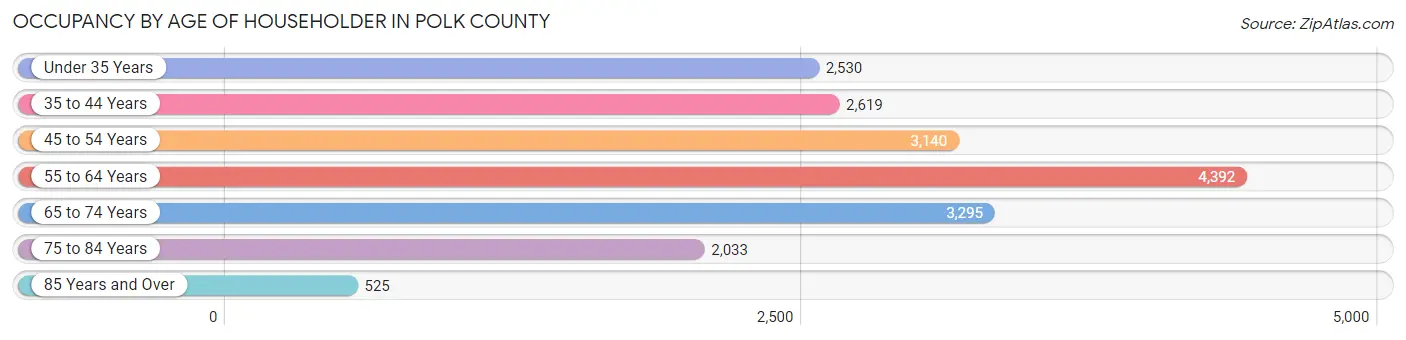
| Age Bracket | # Households | % Households |
| Under 35 Years | 2,530 | 13.7% |
| 35 to 44 Years | 2,619 | 14.1% |
| 45 to 54 Years | 3,140 | 16.9% |
| 55 to 64 Years | 4,392 | 23.7% |
| 65 to 74 Years | 3,295 | 17.8% |
| 75 to 84 Years | 2,033 | 11.0% |
| 85 Years and Over | 525 | 2.8% |
| Total | 18,534 | 100.0% |
Housing Finances in Polk County
Median Income by Occupancy in Polk County
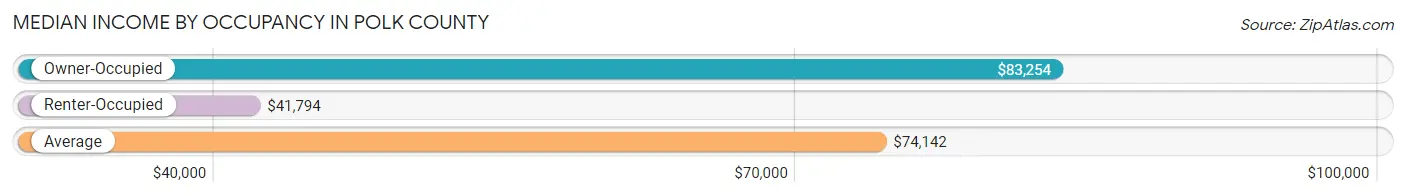
| Occupancy Type | # Households | Median Income |
| Owner-Occupied | 14,932 (80.6%) | $83,254 |
| Renter-Occupied | 3,602 (19.4%) | $41,794 |
| Average | 18,534 (100.0%) | $74,142 |
Occupancy by Householder Income Bracket in Polk County
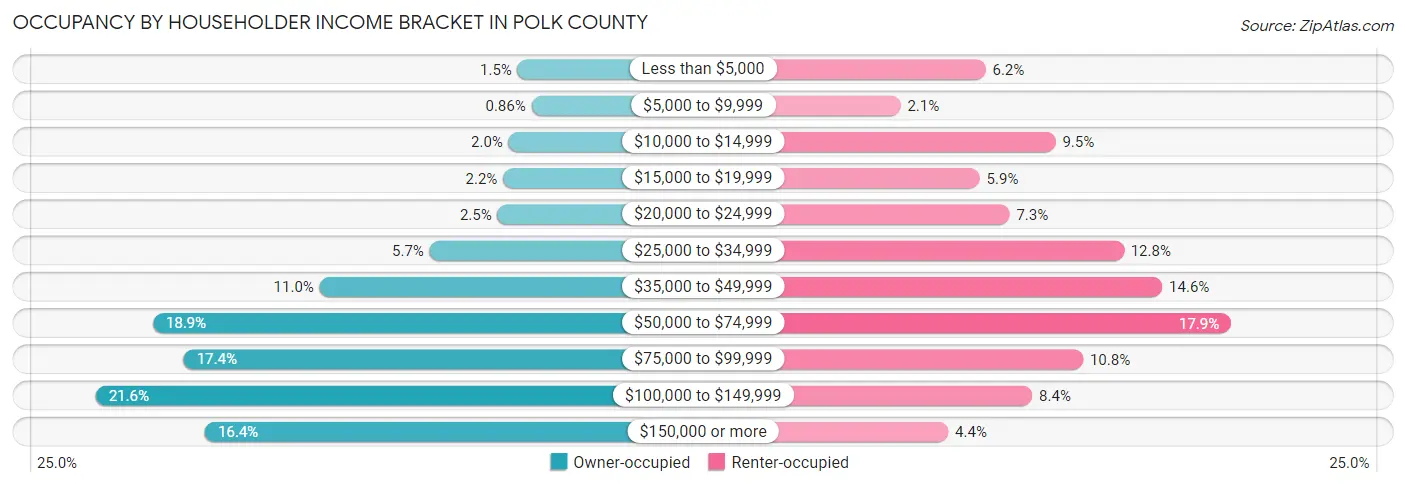
| Income Bracket | Owner-occupied | Renter-occupied |
| Less than $5,000 | 227 (1.5%) | 223 (6.2%) |
| $5,000 to $9,999 | 128 (0.9%) | 77 (2.1%) |
| $10,000 to $14,999 | 291 (1.9%) | 343 (9.5%) |
| $15,000 to $19,999 | 330 (2.2%) | 213 (5.9%) |
| $20,000 to $24,999 | 370 (2.5%) | 264 (7.3%) |
| $25,000 to $34,999 | 852 (5.7%) | 460 (12.8%) |
| $35,000 to $49,999 | 1,635 (11.0%) | 526 (14.6%) |
| $50,000 to $74,999 | 2,821 (18.9%) | 644 (17.9%) |
| $75,000 to $99,999 | 2,601 (17.4%) | 390 (10.8%) |
| $100,000 to $149,999 | 3,227 (21.6%) | 303 (8.4%) |
| $150,000 or more | 2,450 (16.4%) | 159 (4.4%) |
| Total | 14,932 (100.0%) | 3,602 (100.0%) |
Monthly Housing Cost Tiers in Polk County
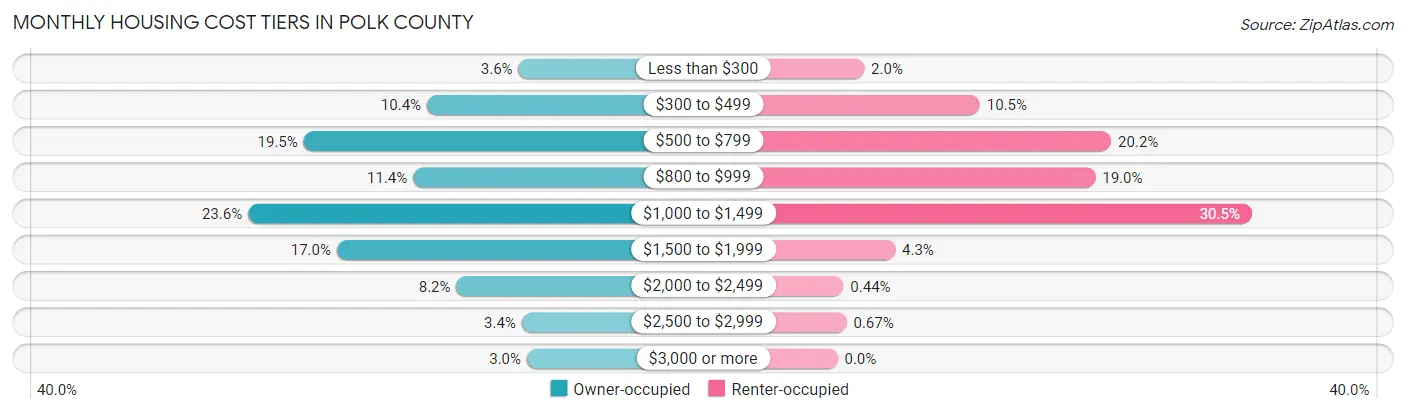
| Monthly Cost | Owner-occupied | Renter-occupied |
| Less than $300 | 542 (3.6%) | 71 (2.0%) |
| $300 to $499 | 1,548 (10.4%) | 378 (10.5%) |
| $500 to $799 | 2,904 (19.5%) | 726 (20.2%) |
| $800 to $999 | 1,701 (11.4%) | 684 (19.0%) |
| $1,000 to $1,499 | 3,517 (23.5%) | 1,099 (30.5%) |
| $1,500 to $1,999 | 2,540 (17.0%) | 153 (4.3%) |
| $2,000 to $2,499 | 1,224 (8.2%) | 16 (0.4%) |
| $2,500 to $2,999 | 506 (3.4%) | 24 (0.7%) |
| $3,000 or more | 450 (3.0%) | 0 (0.0%) |
| Total | 14,932 (100.0%) | 3,602 (100.0%) |
Physical Housing Characteristics in Polk County
Housing Structures in Polk County
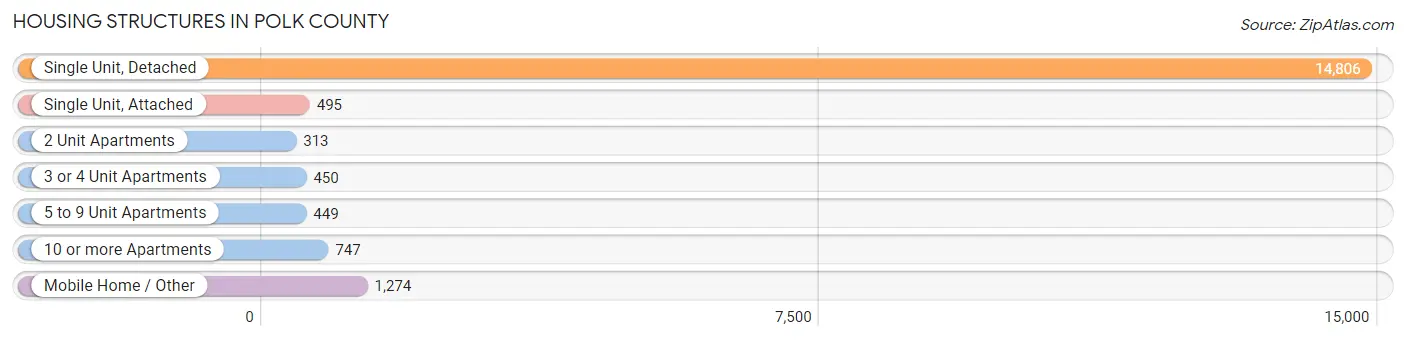
| Structure Type | # Housing Units | % Housing Units |
| Single Unit, Detached | 14,806 | 79.9% |
| Single Unit, Attached | 495 | 2.7% |
| 2 Unit Apartments | 313 | 1.7% |
| 3 or 4 Unit Apartments | 450 | 2.4% |
| 5 to 9 Unit Apartments | 449 | 2.4% |
| 10 or more Apartments | 747 | 4.0% |
| Mobile Home / Other | 1,274 | 6.9% |
| Total | 18,534 | 100.0% |
Housing Structures by Occupancy in Polk County
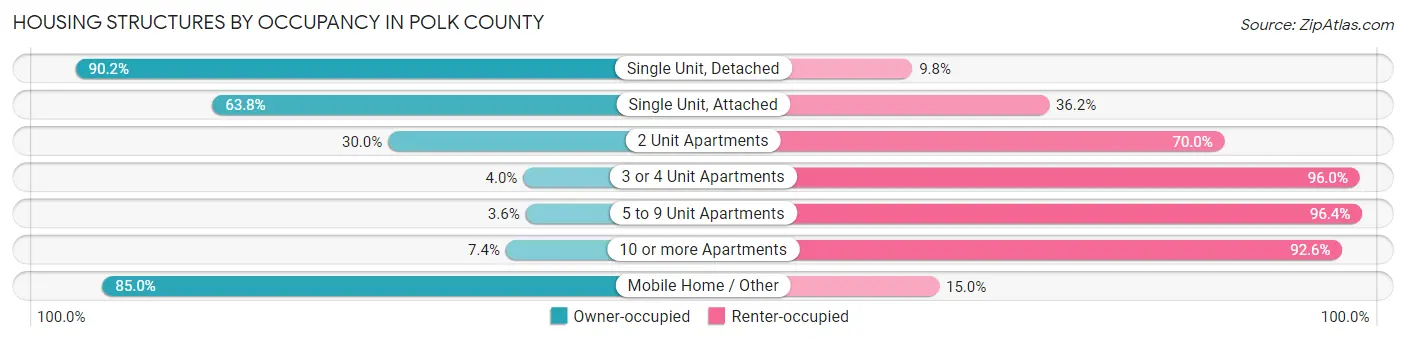
| Structure Type | Owner-occupied | Renter-occupied |
| Single Unit, Detached | 13,350 (90.2%) | 1,456 (9.8%) |
| Single Unit, Attached | 316 (63.8%) | 179 (36.2%) |
| 2 Unit Apartments | 94 (30.0%) | 219 (70.0%) |
| 3 or 4 Unit Apartments | 18 (4.0%) | 432 (96.0%) |
| 5 to 9 Unit Apartments | 16 (3.6%) | 433 (96.4%) |
| 10 or more Apartments | 55 (7.4%) | 692 (92.6%) |
| Mobile Home / Other | 1,083 (85.0%) | 191 (15.0%) |
| Total | 14,932 (80.6%) | 3,602 (19.4%) |
Housing Structures by Number of Rooms in Polk County
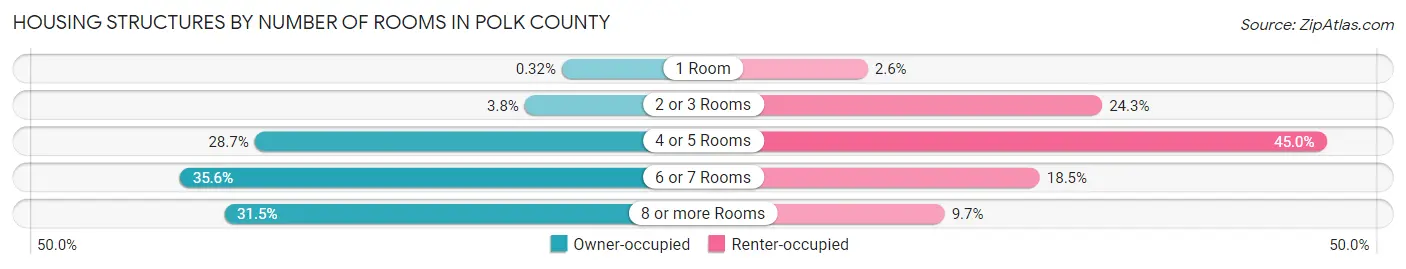
| Number of Rooms | Owner-occupied | Renter-occupied |
| 1 Room | 48 (0.3%) | 93 (2.6%) |
| 2 or 3 Rooms | 560 (3.7%) | 874 (24.3%) |
| 4 or 5 Rooms | 4,292 (28.7%) | 1,620 (45.0%) |
| 6 or 7 Rooms | 5,322 (35.6%) | 666 (18.5%) |
| 8 or more Rooms | 4,710 (31.5%) | 349 (9.7%) |
| Total | 14,932 (100.0%) | 3,602 (100.0%) |
Housing Structure by Heating Type in Polk County
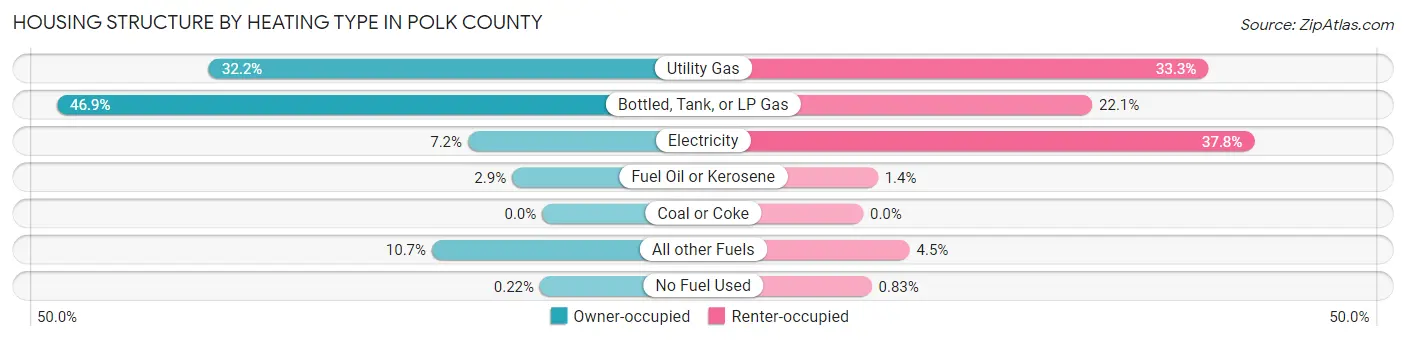
| Heating Type | Owner-occupied | Renter-occupied |
| Utility Gas | 4,806 (32.2%) | 1,201 (33.3%) |
| Bottled, Tank, or LP Gas | 6,997 (46.9%) | 797 (22.1%) |
| Electricity | 1,071 (7.2%) | 1,361 (37.8%) |
| Fuel Oil or Kerosene | 434 (2.9%) | 51 (1.4%) |
| Coal or Coke | 0 (0.0%) | 0 (0.0%) |
| All other Fuels | 1,591 (10.6%) | 162 (4.5%) |
| No Fuel Used | 33 (0.2%) | 30 (0.8%) |
| Total | 14,932 (100.0%) | 3,602 (100.0%) |
Household Vehicle Usage in Polk County
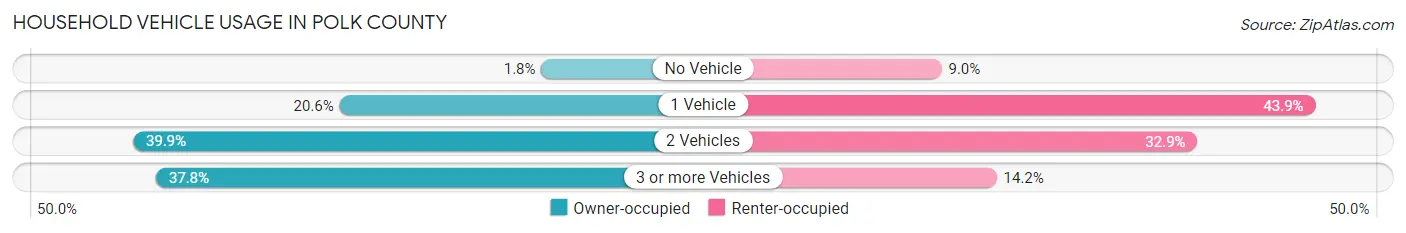
| Vehicles per Household | Owner-occupied | Renter-occupied |
| No Vehicle | 263 (1.8%) | 325 (9.0%) |
| 1 Vehicle | 3,076 (20.6%) | 1,582 (43.9%) |
| 2 Vehicles | 5,956 (39.9%) | 1,185 (32.9%) |
| 3 or more Vehicles | 5,637 (37.8%) | 510 (14.2%) |
| Total | 14,932 (100.0%) | 3,602 (100.0%) |
Real Estate & Mortgages in Polk County
Real Estate and Mortgage Overview in Polk County
| Characteristic | Without Mortgage | With Mortgage |
| Housing Units | 5,868 | 9,064 |
| Median Property Value | $205,700 | $231,800 |
| Median Household Income | $62,958 | $1,825 |
| Monthly Housing Costs | $597 | $435 |
| Real Estate Taxes | $2,855 | $43 |
Property Value by Mortgage Status in Polk County
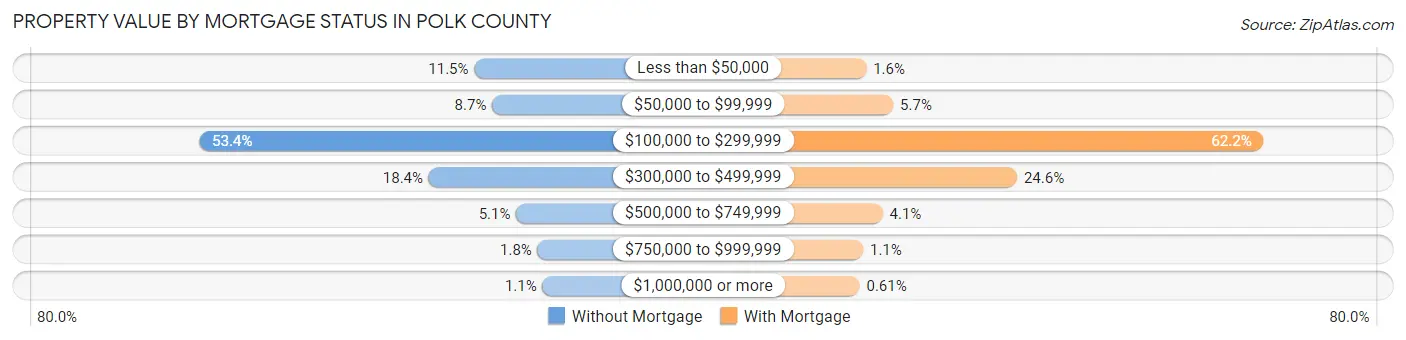
| Property Value | Without Mortgage | With Mortgage |
| Less than $50,000 | 673 (11.5%) | 148 (1.6%) |
| $50,000 to $99,999 | 513 (8.7%) | 519 (5.7%) |
| $100,000 to $299,999 | 3,134 (53.4%) | 5,636 (62.2%) |
| $300,000 to $499,999 | 1,080 (18.4%) | 2,230 (24.6%) |
| $500,000 to $749,999 | 298 (5.1%) | 373 (4.1%) |
| $750,000 to $999,999 | 107 (1.8%) | 103 (1.1%) |
| $1,000,000 or more | 63 (1.1%) | 55 (0.6%) |
| Total | 5,868 (100.0%) | 9,064 (100.0%) |
Household Income by Mortgage Status in Polk County
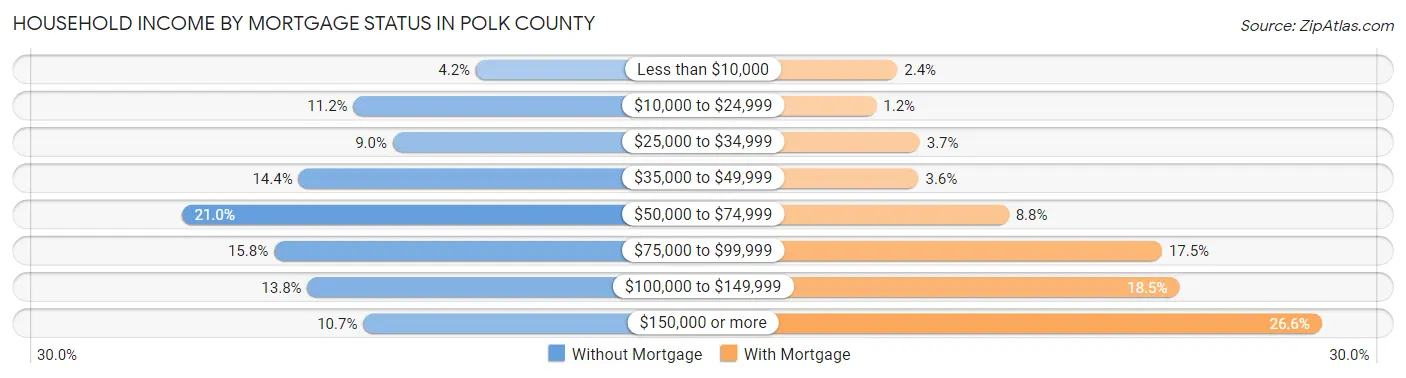
| Household Income | Without Mortgage | With Mortgage |
| Less than $10,000 | 247 (4.2%) | 217 (2.4%) |
| $10,000 to $24,999 | 658 (11.2%) | 108 (1.2%) |
| $25,000 to $34,999 | 526 (9.0%) | 333 (3.7%) |
| $35,000 to $49,999 | 842 (14.3%) | 326 (3.6%) |
| $50,000 to $74,999 | 1,234 (21.0%) | 793 (8.7%) |
| $75,000 to $99,999 | 924 (15.8%) | 1,587 (17.5%) |
| $100,000 to $149,999 | 812 (13.8%) | 1,677 (18.5%) |
| $150,000 or more | 625 (10.6%) | 2,415 (26.6%) |
| Total | 5,868 (100.0%) | 9,064 (100.0%) |
Property Value to Household Income Ratio in Polk County
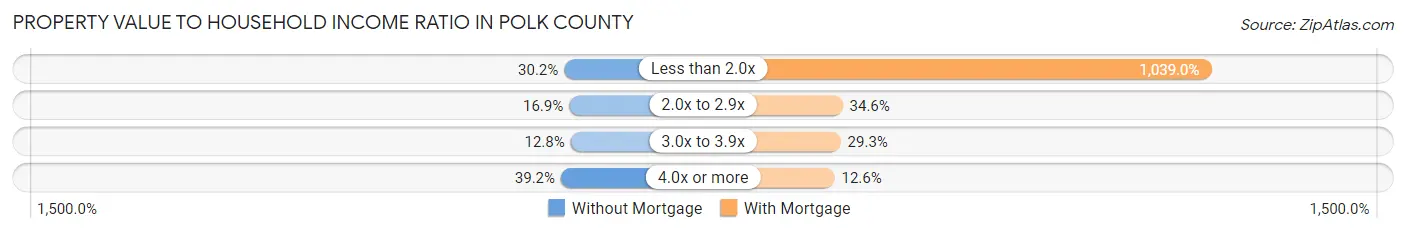
| Value-to-Income Ratio | Without Mortgage | With Mortgage |
| Less than 2.0x | 1,774 (30.2%) | 94,175 (1,039.0%) |
| 2.0x to 2.9x | 990 (16.9%) | 3,137 (34.6%) |
| 3.0x to 3.9x | 749 (12.8%) | 2,653 (29.3%) |
| 4.0x or more | 2,301 (39.2%) | 1,139 (12.6%) |
| Total | 5,868 (100.0%) | 9,064 (100.0%) |
Real Estate Taxes by Mortgage Status in Polk County
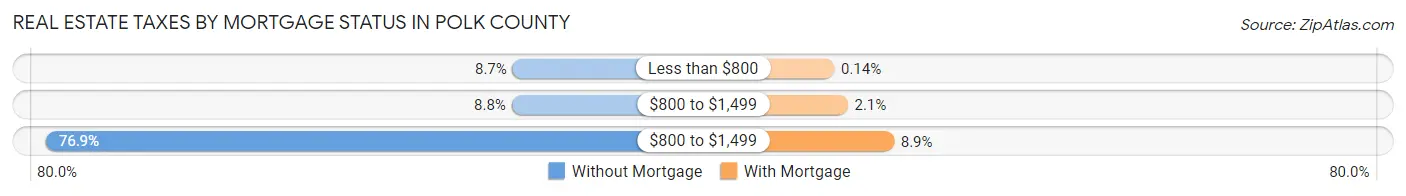
| Property Taxes | Without Mortgage | With Mortgage |
| Less than $800 | 510 (8.7%) | 13 (0.1%) |
| $800 to $1,499 | 518 (8.8%) | 192 (2.1%) |
| $800 to $1,499 | 4,512 (76.9%) | 804 (8.9%) |
| Total | 5,868 (100.0%) | 9,064 (100.0%) |
Health & Disability in Polk County
Health Insurance Coverage by Age in Polk County
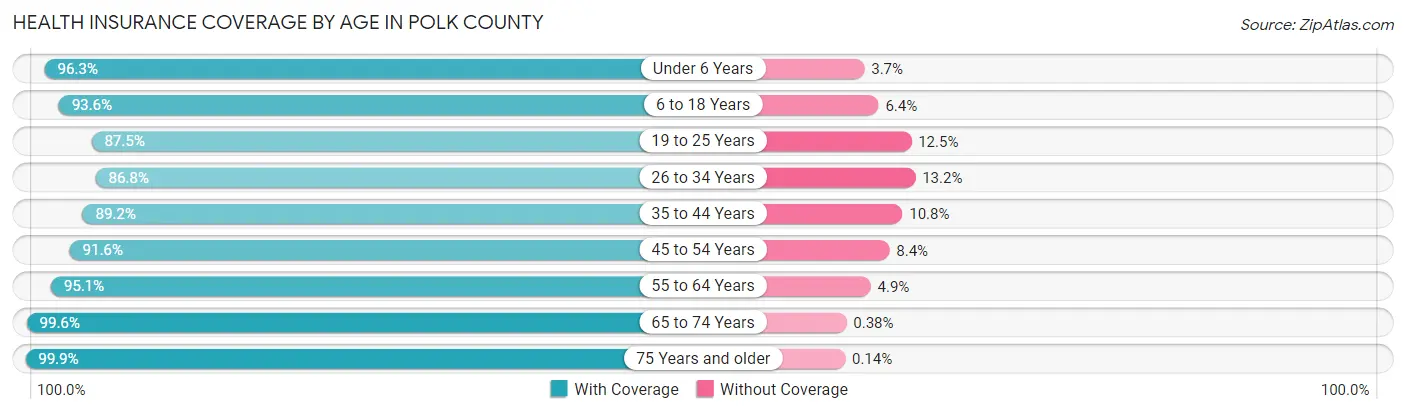
| Age Bracket | With Coverage | Without Coverage |
| Under 6 Years | 2,479 (96.3%) | 96 (3.7%) |
| 6 to 18 Years | 6,609 (93.6%) | 450 (6.4%) |
| 19 to 25 Years | 2,510 (87.5%) | 358 (12.5%) |
| 26 to 34 Years | 3,573 (86.8%) | 545 (13.2%) |
| 35 to 44 Years | 4,666 (89.2%) | 566 (10.8%) |
| 45 to 54 Years | 5,334 (91.6%) | 489 (8.4%) |
| 55 to 64 Years | 7,256 (95.1%) | 374 (4.9%) |
| 65 to 74 Years | 5,763 (99.6%) | 22 (0.4%) |
| 75 Years and older | 3,600 (99.9%) | 5 (0.1%) |
| Total | 41,790 (93.5%) | 2,905 (6.5%) |
Health Insurance Coverage by Citizenship Status in Polk County
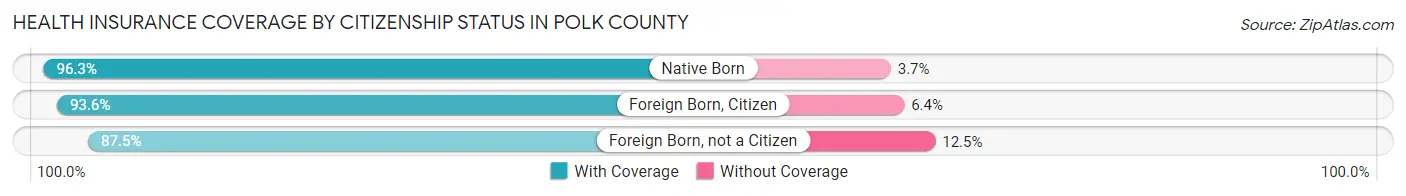
| Citizenship Status | With Coverage | Without Coverage |
| Native Born | 2,479 (96.3%) | 96 (3.7%) |
| Foreign Born, Citizen | 6,609 (93.6%) | 450 (6.4%) |
| Foreign Born, not a Citizen | 2,510 (87.5%) | 358 (12.5%) |
Health Insurance Coverage by Household Income in Polk County
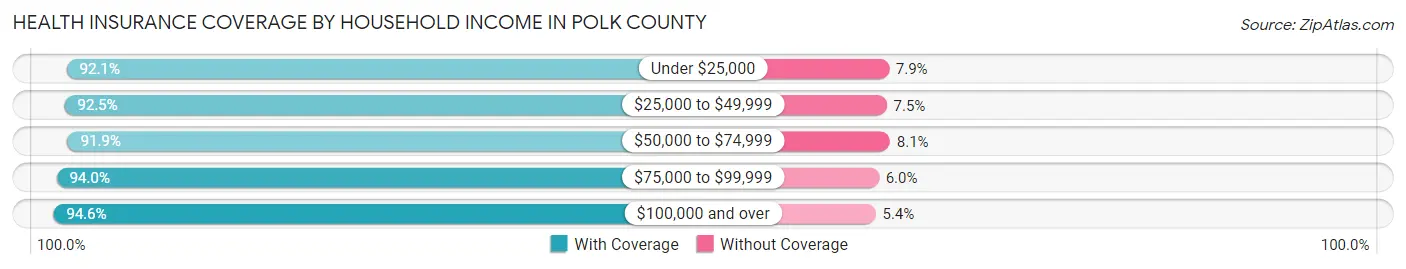
| Household Income | With Coverage | Without Coverage |
| Under $25,000 | 3,436 (92.1%) | 294 (7.9%) |
| $25,000 to $49,999 | 5,668 (92.5%) | 457 (7.5%) |
| $50,000 to $74,999 | 7,734 (91.9%) | 678 (8.1%) |
| $75,000 to $99,999 | 7,406 (94.0%) | 471 (6.0%) |
| $100,000 and over | 17,455 (94.6%) | 995 (5.4%) |
Public vs Private Health Insurance Coverage by Age in Polk County
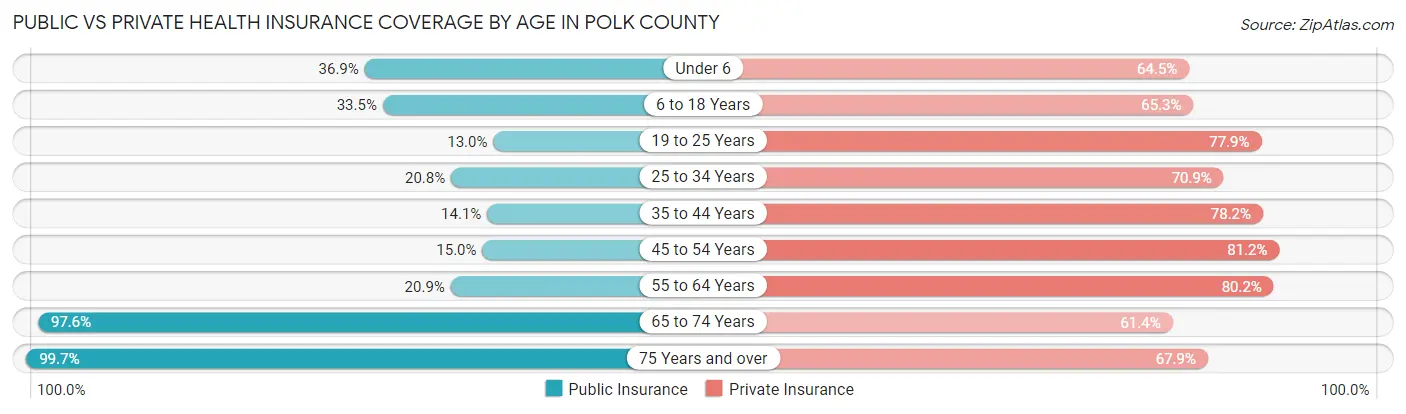
| Age Bracket | Public Insurance | Private Insurance |
| Under 6 | 950 (36.9%) | 1,660 (64.5%) |
| 6 to 18 Years | 2,367 (33.5%) | 4,606 (65.2%) |
| 19 to 25 Years | 373 (13.0%) | 2,233 (77.9%) |
| 25 to 34 Years | 858 (20.8%) | 2,919 (70.9%) |
| 35 to 44 Years | 740 (14.1%) | 4,089 (78.1%) |
| 45 to 54 Years | 875 (15.0%) | 4,728 (81.2%) |
| 55 to 64 Years | 1,596 (20.9%) | 6,116 (80.2%) |
| 65 to 74 Years | 5,643 (97.6%) | 3,550 (61.4%) |
| 75 Years and over | 3,594 (99.7%) | 2,449 (67.9%) |
| Total | 16,996 (38.0%) | 32,350 (72.4%) |
Disability Status by Sex by Age in Polk County
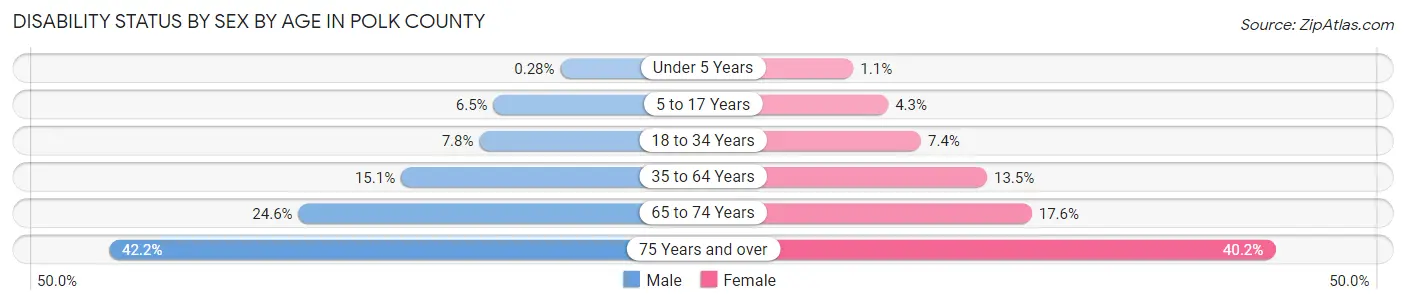
| Age Bracket | Male | Female |
| Under 5 Years | 3 (0.3%) | 11 (1.1%) |
| 5 to 17 Years | 238 (6.5%) | 145 (4.3%) |
| 18 to 34 Years | 302 (7.8%) | 267 (7.4%) |
| 35 to 64 Years | 1,440 (15.1%) | 1,231 (13.5%) |
| 65 to 74 Years | 728 (24.6%) | 498 (17.6%) |
| 75 Years and over | 723 (42.2%) | 760 (40.2%) |
Disability Class by Sex by Age in Polk County
Disability Class: Hearing Difficulty
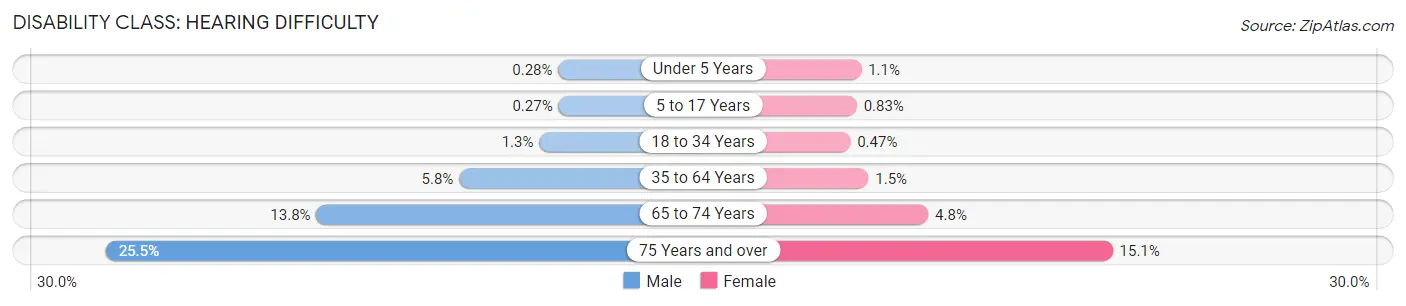
| Age Bracket | Male | Female |
| Under 5 Years | 3 (0.3%) | 11 (1.1%) |
| 5 to 17 Years | 10 (0.3%) | 28 (0.8%) |
| 18 to 34 Years | 52 (1.3%) | 17 (0.5%) |
| 35 to 64 Years | 554 (5.8%) | 135 (1.5%) |
| 65 to 74 Years | 407 (13.8%) | 136 (4.8%) |
| 75 Years and over | 437 (25.5%) | 285 (15.1%) |
Disability Class: Vision Difficulty

| Age Bracket | Male | Female |
| Under 5 Years | 0 (0.0%) | 0 (0.0%) |
| 5 to 17 Years | 16 (0.4%) | 29 (0.9%) |
| 18 to 34 Years | 57 (1.5%) | 34 (0.9%) |
| 35 to 64 Years | 168 (1.8%) | 192 (2.1%) |
| 65 to 74 Years | 85 (2.9%) | 64 (2.3%) |
| 75 Years and over | 118 (6.9%) | 104 (5.5%) |
Disability Class: Cognitive Difficulty
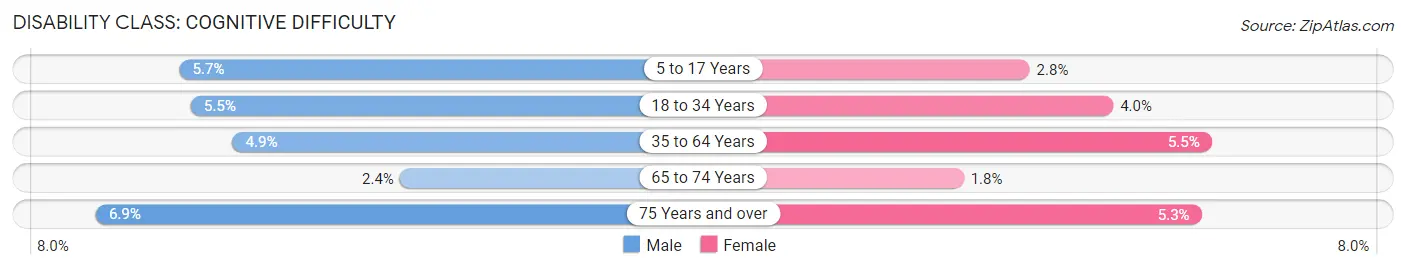
| Age Bracket | Male | Female |
| 5 to 17 Years | 209 (5.7%) | 94 (2.8%) |
| 18 to 34 Years | 214 (5.5%) | 146 (4.0%) |
| 35 to 64 Years | 469 (4.9%) | 501 (5.5%) |
| 65 to 74 Years | 72 (2.4%) | 51 (1.8%) |
| 75 Years and over | 119 (6.9%) | 101 (5.3%) |
Disability Class: Ambulatory Difficulty
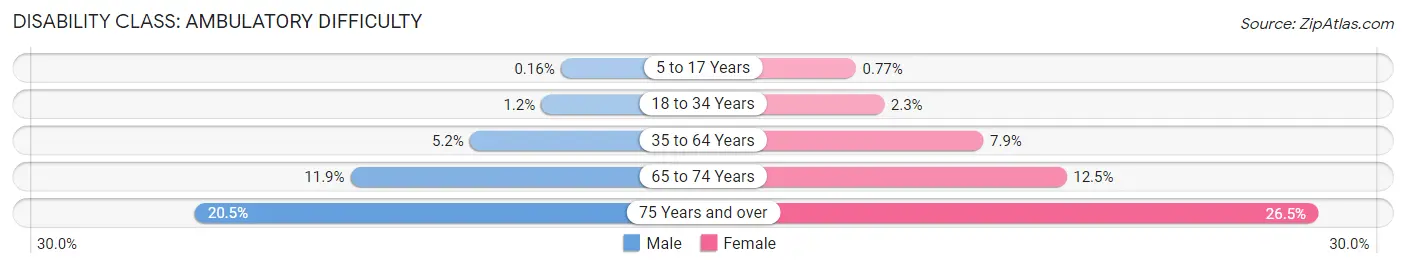
| Age Bracket | Male | Female |
| 5 to 17 Years | 6 (0.2%) | 26 (0.8%) |
| 18 to 34 Years | 48 (1.2%) | 85 (2.3%) |
| 35 to 64 Years | 499 (5.2%) | 718 (7.9%) |
| 65 to 74 Years | 351 (11.9%) | 353 (12.5%) |
| 75 Years and over | 352 (20.5%) | 501 (26.5%) |
Disability Class: Self-Care Difficulty
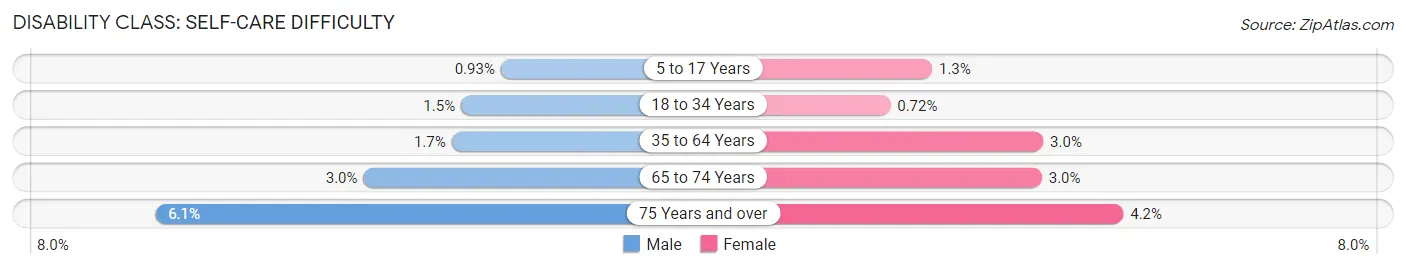
| Age Bracket | Male | Female |
| 5 to 17 Years | 34 (0.9%) | 45 (1.3%) |
| 18 to 34 Years | 59 (1.5%) | 26 (0.7%) |
| 35 to 64 Years | 159 (1.7%) | 273 (3.0%) |
| 65 to 74 Years | 88 (3.0%) | 84 (3.0%) |
| 75 Years and over | 104 (6.1%) | 79 (4.2%) |
Technology Access in Polk County
Computing Device Access in Polk County
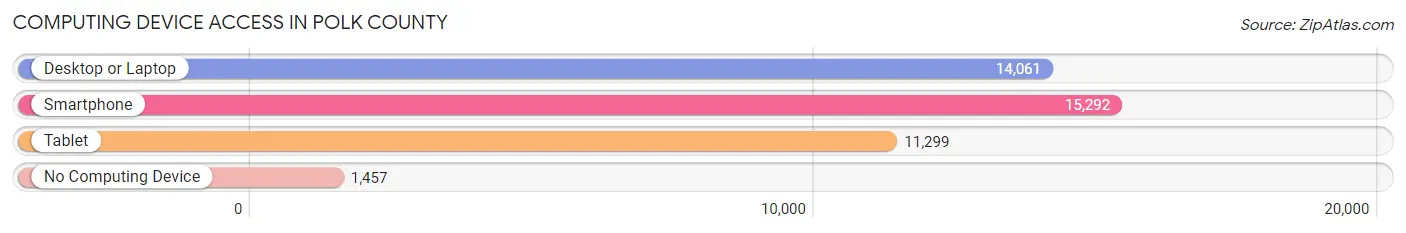
| Device Type | # Households | % Households |
| Desktop or Laptop | 14,061 | 75.9% |
| Smartphone | 15,292 | 82.5% |
| Tablet | 11,299 | 61.0% |
| No Computing Device | 1,457 | 7.9% |
| Total | 18,534 | 100.0% |
Internet Access in Polk County
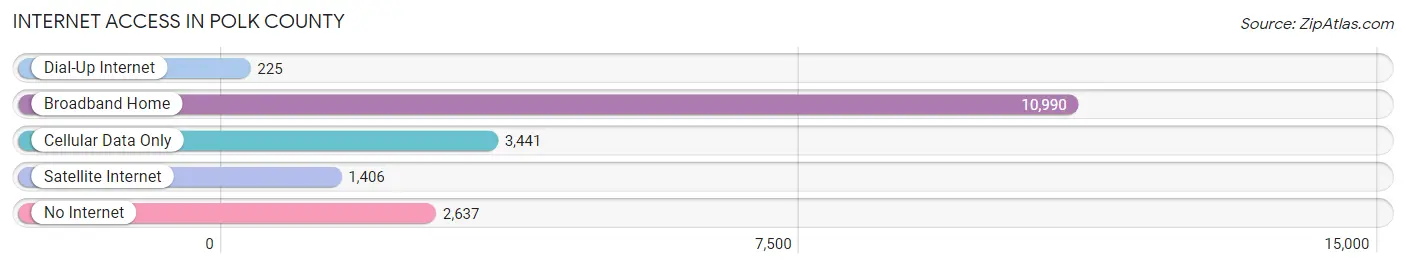
| Internet Type | # Households | % Households |
| Dial-Up Internet | 225 | 1.2% |
| Broadband Home | 10,990 | 59.3% |
| Cellular Data Only | 3,441 | 18.6% |
| Satellite Internet | 1,406 | 7.6% |
| No Internet | 2,637 | 14.2% |
| Total | 18,534 | 100.0% |
Polk County Summary
Polk County, Wisconsin is located in the northwestern part of the state and is bordered by Barron, Burnett, St. Croix, and Washburn counties. It is part of the Twin Cities metropolitan area and is home to a population of 44,205 people as of the 2010 census. The county seat is located in the city of Balsam Lake.
History
Polk County was established in 1853 and was named after James K. Polk, the 11th President of the United States. The county was originally part of St. Croix County, but was split off in 1853. The first settlers in the area were mostly of Scandinavian descent, and the county was heavily influenced by the lumber industry. The first sawmill was built in 1854, and the county quickly became a major producer of lumber. The county was also home to several small farming communities, and the population grew steadily throughout the 19th century.
Geography
Polk County is located in the northwestern part of Wisconsin and is bordered by Barron, Burnett, St. Croix, and Washburn counties. The county covers an area of 845 square miles and is home to a variety of landscapes, including rolling hills, forests, and wetlands. The county is home to several lakes, including Big Butternut Lake, Big Round Lake, and Big Sand Lake. The county is also home to the St. Croix National Scenic Riverway, which is a federally protected riverway that runs through the county.
Economy
The economy of Polk County is largely based on agriculture and tourism. The county is home to several large farms, and the county produces a variety of crops, including corn, soybeans, and hay. The county is also home to several small businesses, including restaurants, retail stores, and manufacturing companies. Tourism is also an important part of the county’s economy, and the county is home to several popular attractions, including the St. Croix National Scenic Riverway, the Polk County Historical Museum, and the Polk County Fairgrounds.
Demographics
As of the 2010 census, Polk County had a population of 44,205 people. The population was spread out with a median age of 41.7 years. The racial makeup of the county was 94.2% White, 0.7% African American, 0.4% Native American, 0.7% Asian, 0.1% Pacific Islander, 2.3% from other races, and 1.6% from two or more races. Hispanic or Latino of any race were 4.2% of the population.
The median income for a household in the county was $48,945, and the median income for a family was $56,945. The per capita income for the county was $22,945. About 8.2% of families and 11.2% of the population were below the poverty line, including 15.2% of those under age 18 and 8.2% of those age 65 or over.
Overall, Polk County is a diverse and vibrant county with a rich history and a strong economy. The county is home to a variety of landscapes, businesses, and attractions, and is a great place to live and work.
Common Questions
What is the Total Population of Polk County?
Total Population of Polk County is 45,128.
What is the Total Male Population of Polk County?
Total Male Population of Polk County is 23,028.
What is the Total Female Population of Polk County?
Total Female Population of Polk County is 22,100.
What is the Ratio of Males per 100 Females in Polk County?
There are 104.20 Males per 100 Females in Polk County.
What is the Ratio of Females per 100 Males in Polk County?
There are 95.97 Females per 100 Males in Polk County.
What is the Median Population Age in Polk County?
Median Population Age in Polk County is 46.5 Years.
What is the Average Family Size in Polk County
Average Family Size in Polk County is 2.9 People.
What is the Average Household Size in Polk County
Average Household Size in Polk County is 2.4 People.
What is Per Capita Income in Polk County?
Per Capita income in Polk County is $37,674.
What is the Median Family Income in Polk County?
Median Family Income in Polk County is $86,676.
What is the Median Household income in Polk County?
Median Household Income in Polk County is $74,142.
What is Income or Wage Gap in Polk County?
Income or Wage Gap in Polk County is 30.9%.
Women in Polk County earn 69.1 cents for every dollar earned by a man.
What is Family Income Deficit in Polk County?
Family Income Deficit in Polk County is $8,893.
Families that are below poverty line in Polk County earn $8,893 less on average than the poverty threshold level.
What is Inequality or Gini Index in Polk County?
Inequality or Gini Index in Polk County is 0.40.
How Large is the Labor Force in Polk County?
There are 23,260 People in the Labor Forcein in Polk County.
What is the Percentage of People in the Labor Force in Polk County?
62.5% of People are in the Labor Force in Polk County.
What is the Unemployment Rate in Polk County?
Unemployment Rate in Polk County is 4.2%.